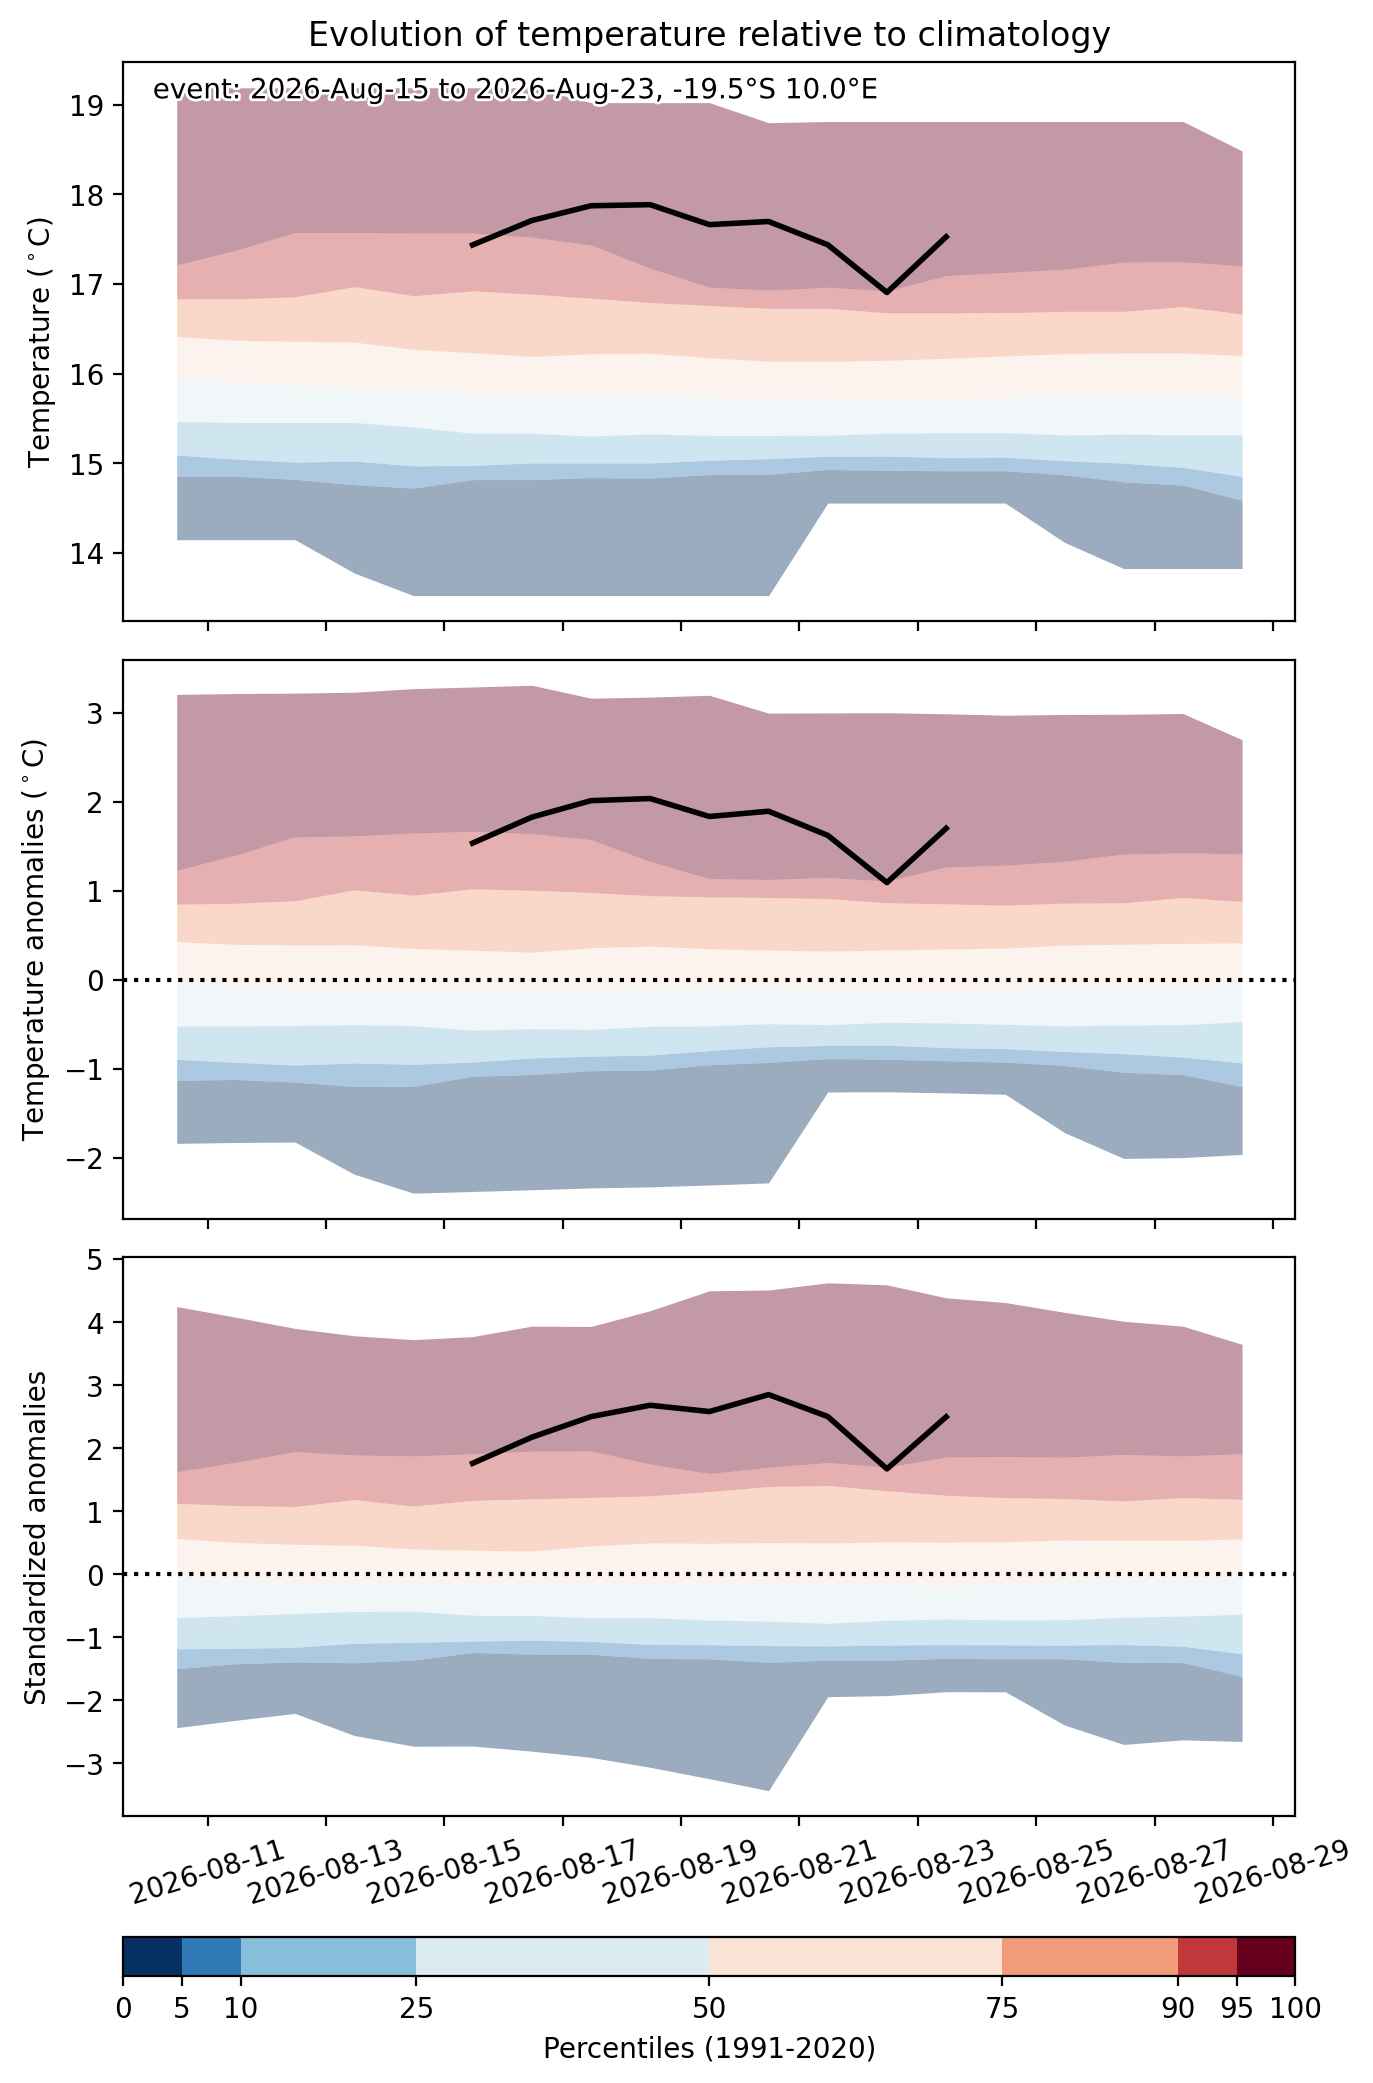
(ongoing) Heat wave occuring from April 30 2026 to May 03 2026 at 0.5°N 358.0°E

Download data: JSON

Event type: Heat wave

Countries affected (identified with ArcGIS Online; provided only for geographical reference):

    Duration: 4 days

    Time span: April 30 2026 to May 03 2026

    Statistics over entire affected area:

    • Mean temperature anomaly: 0.9 °C
    • Mean temperature: 28.0 °C
    • Maximum temperature anomaly: 1.4 °C
    • Maximum temperature: 28.5 °C

    Event center: 0.5°N 2.0°W

    Area affected: 414008 km$^2$


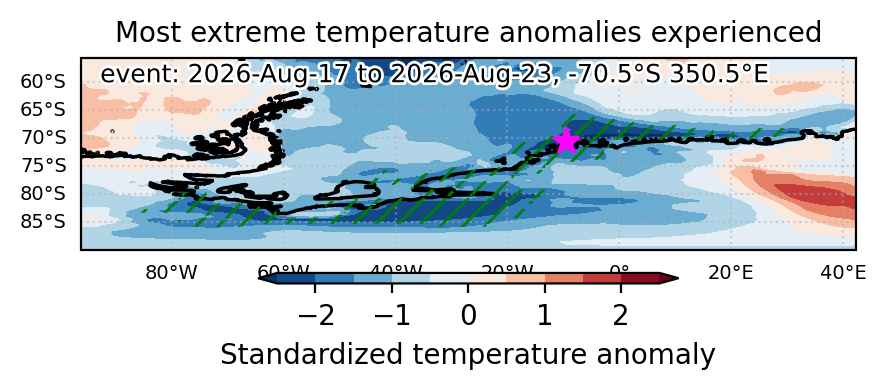
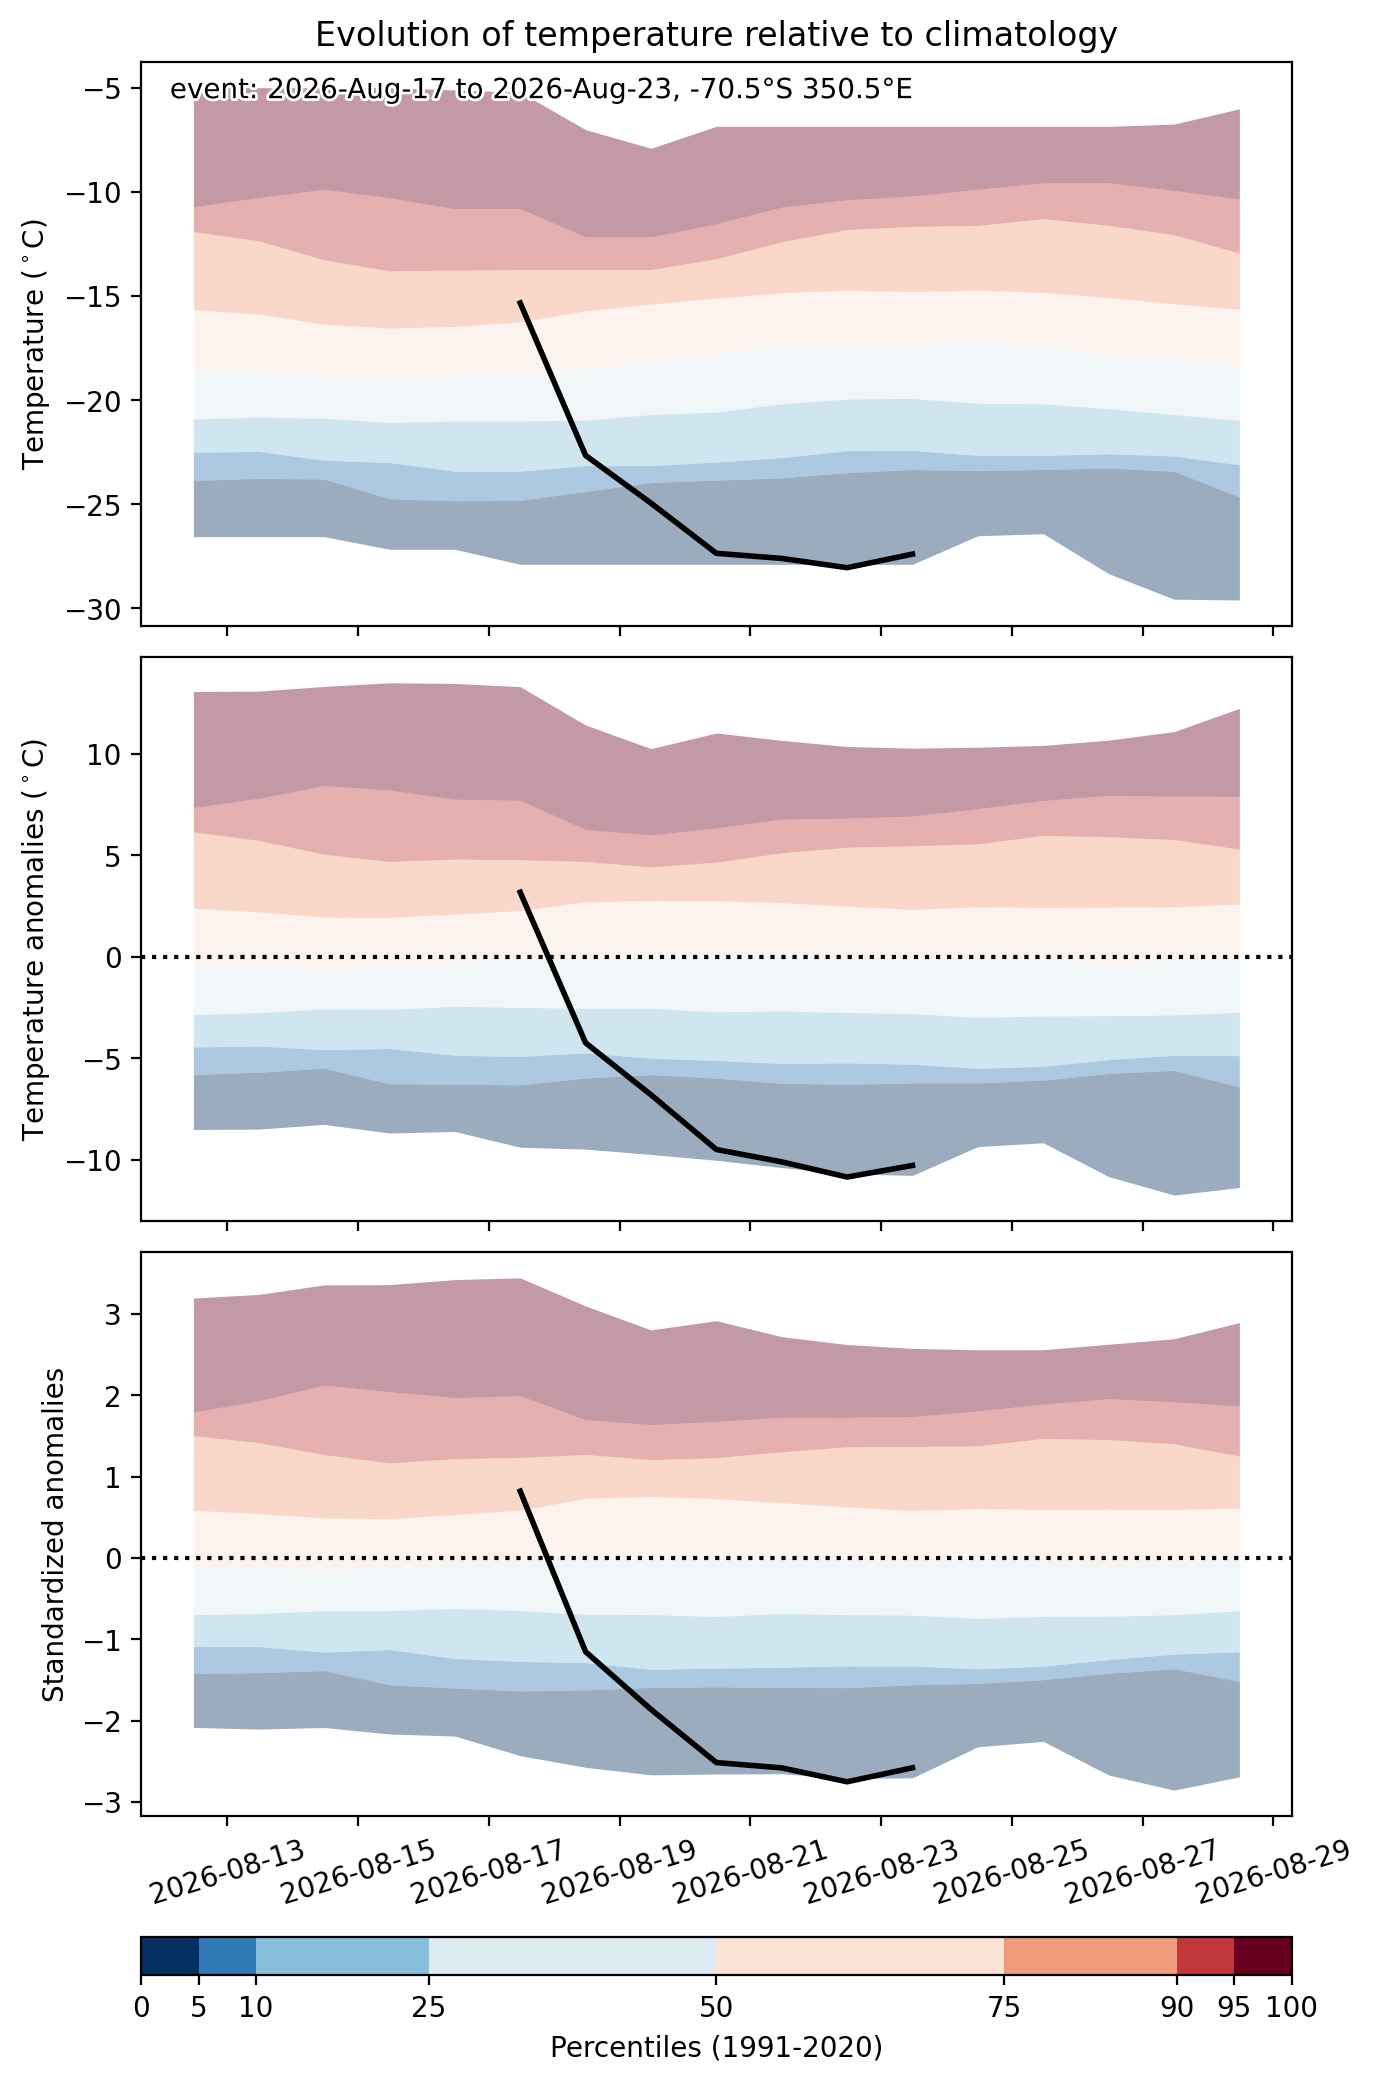
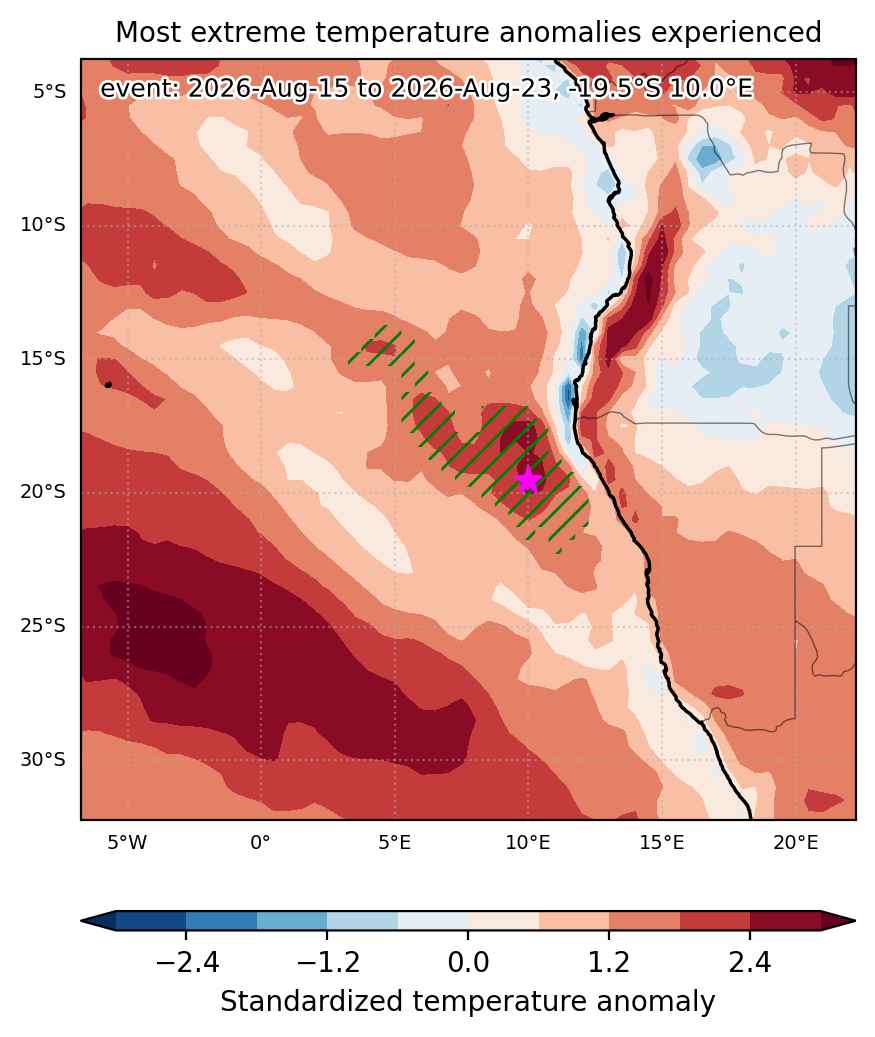
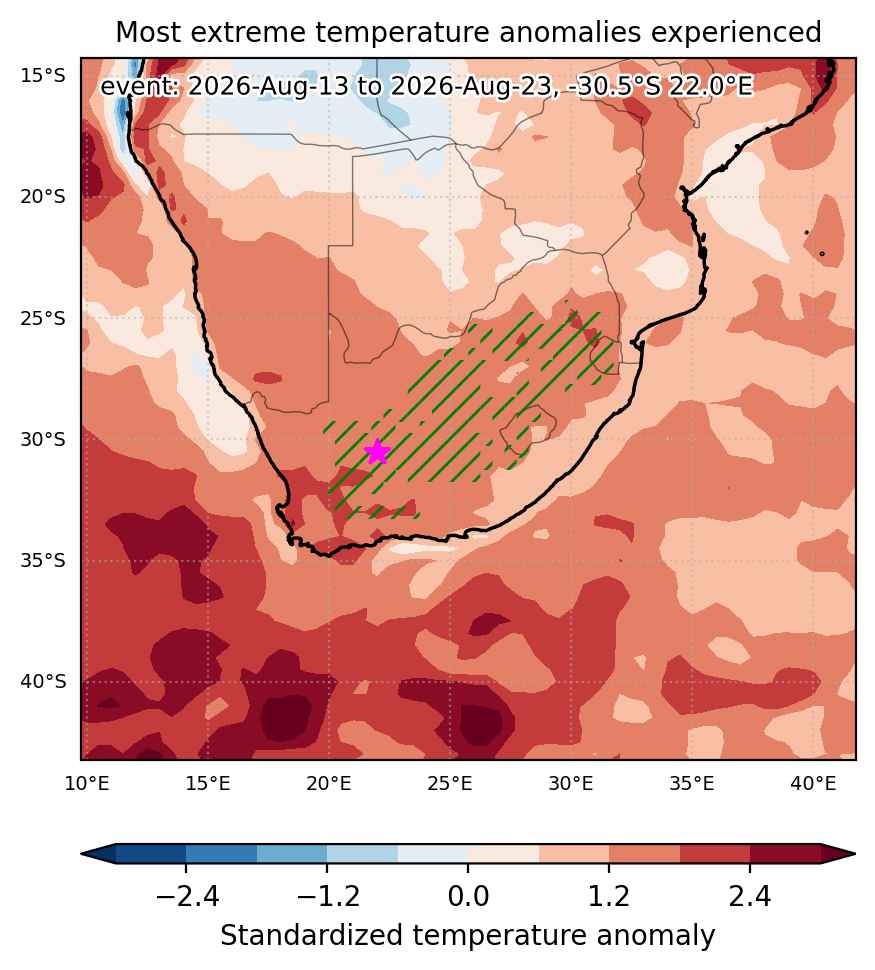
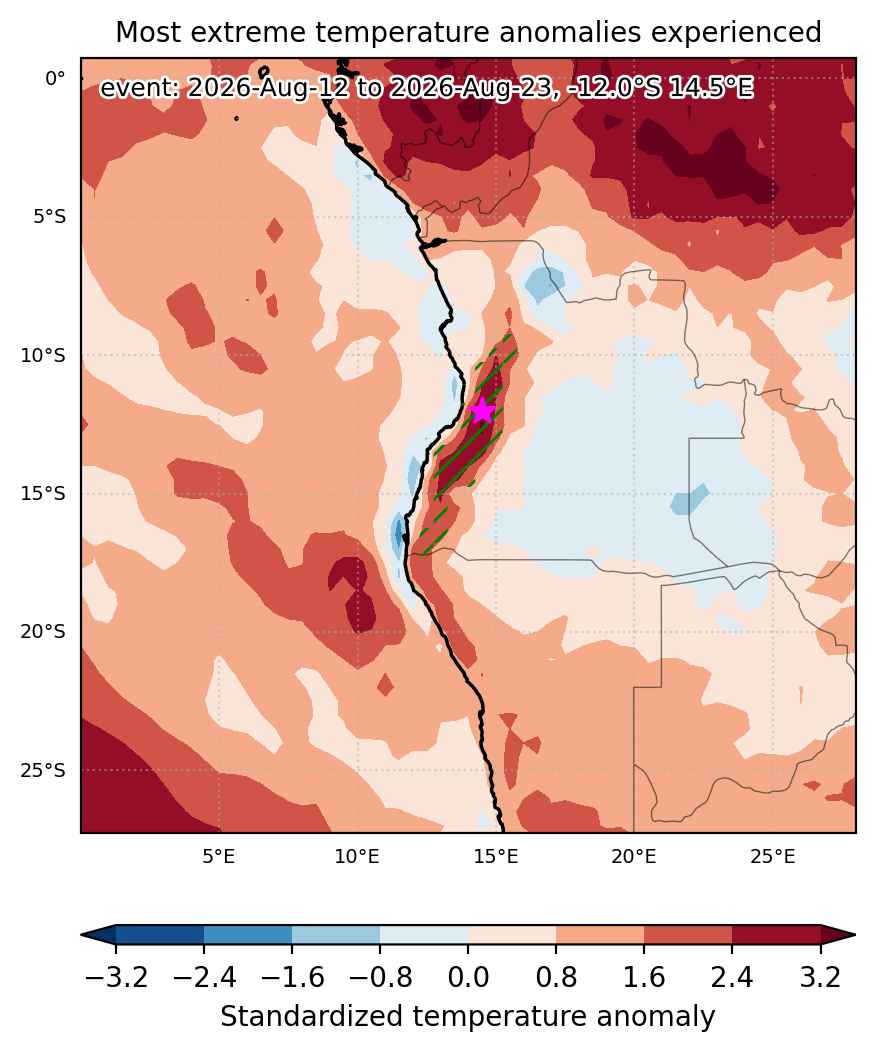
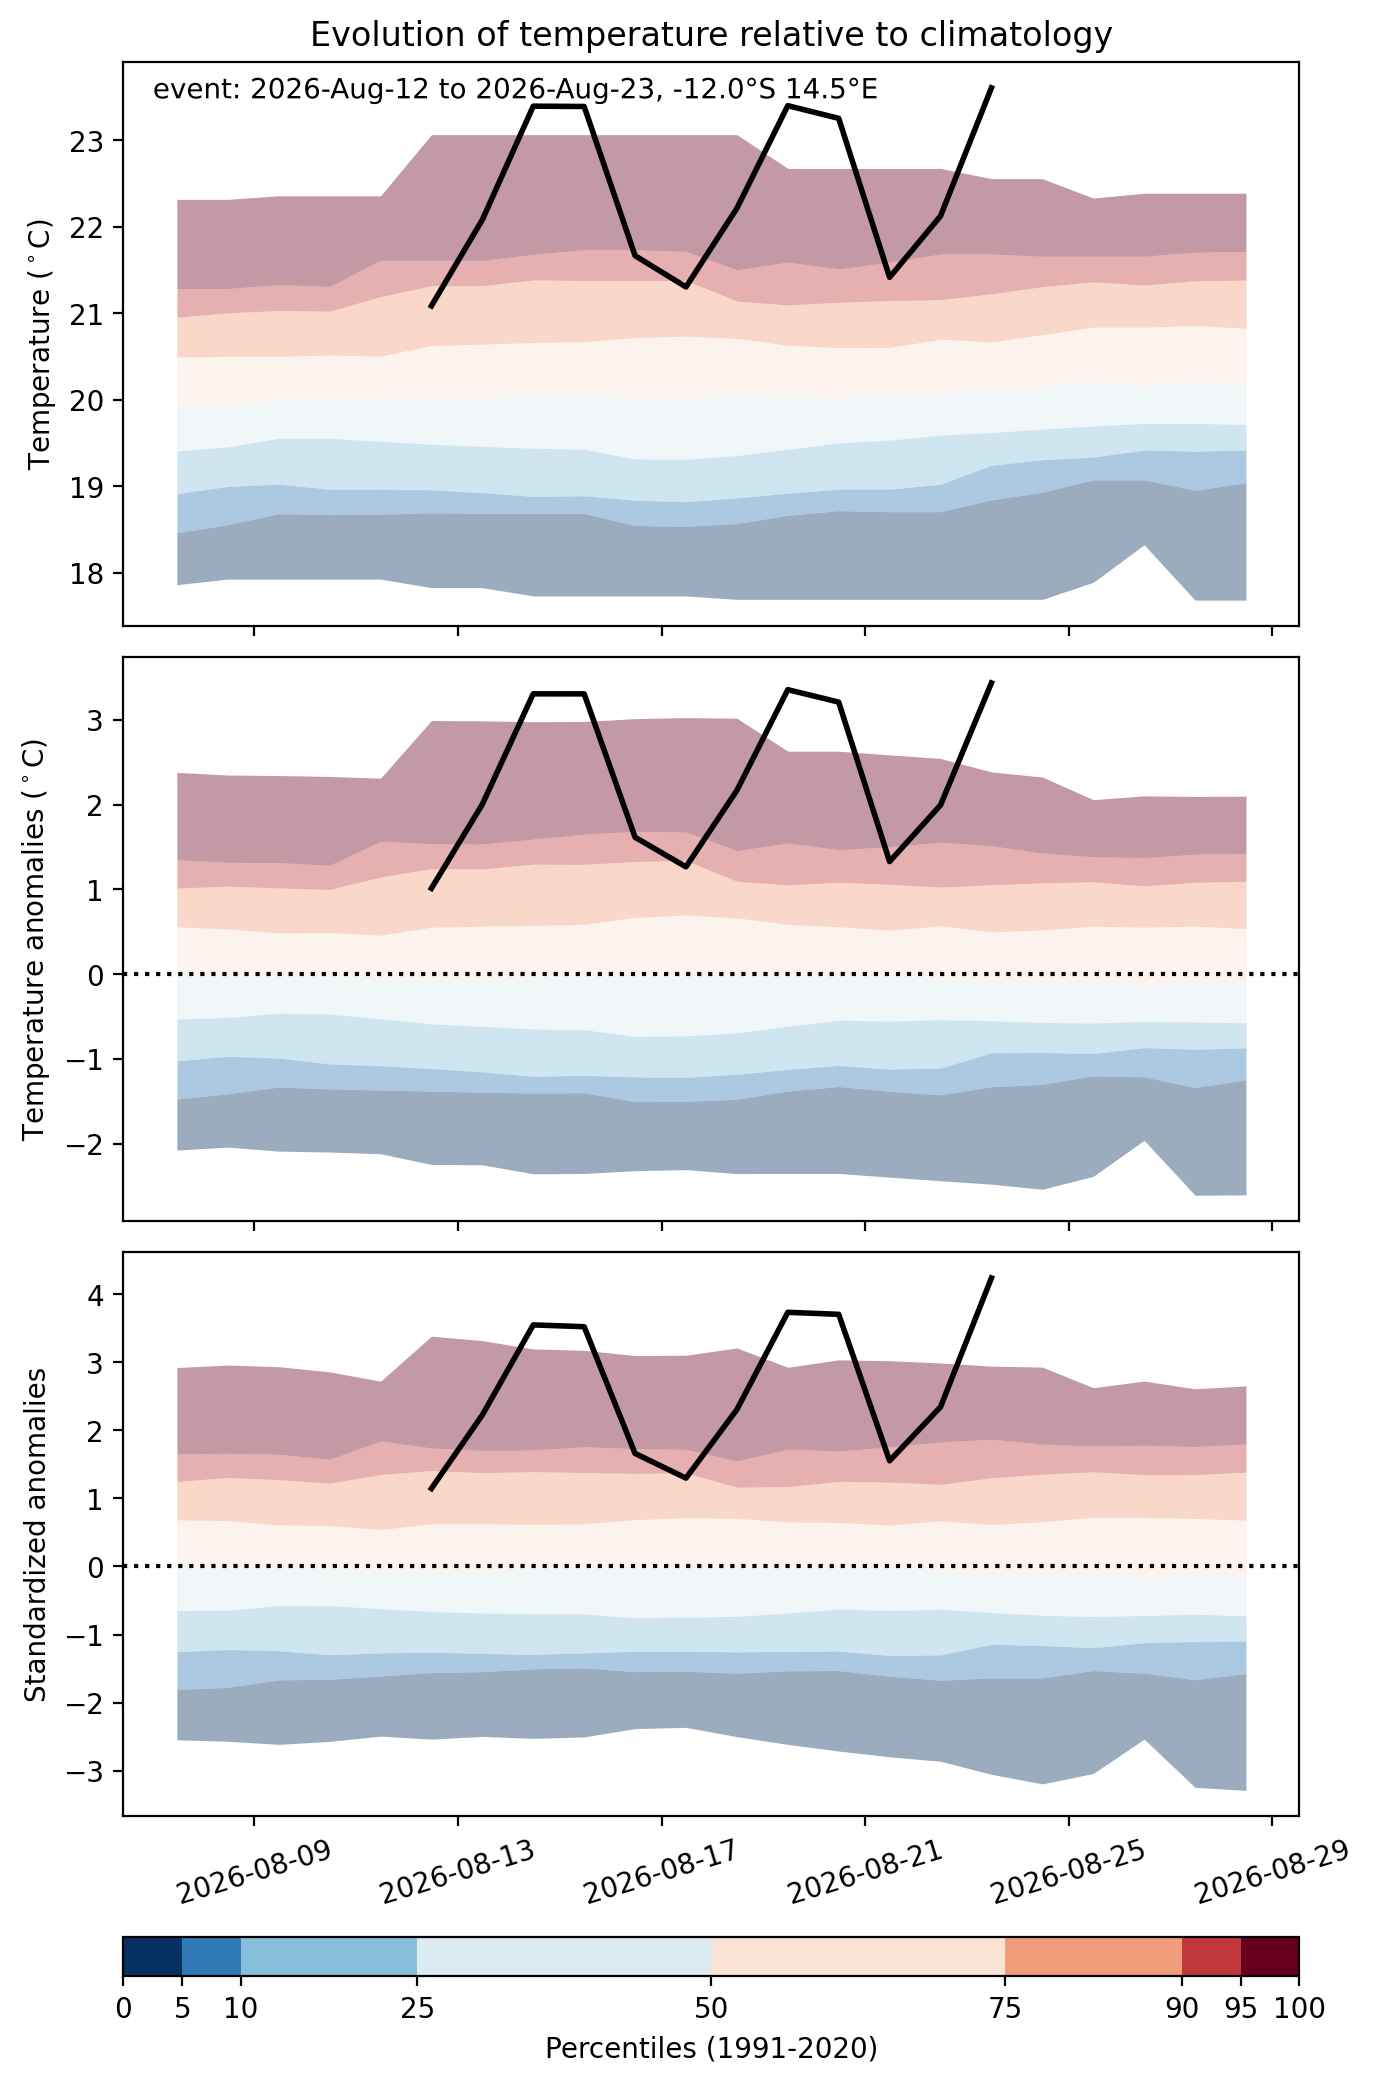
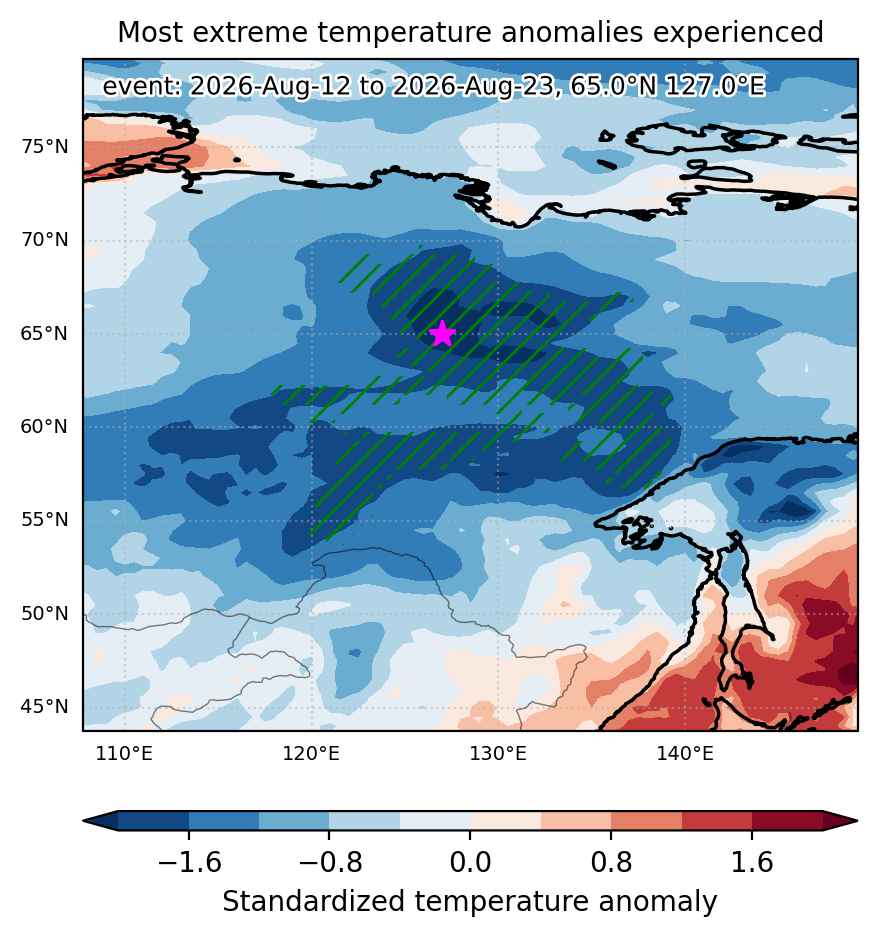
    Fig. 1: unavailable since event is ongoing.


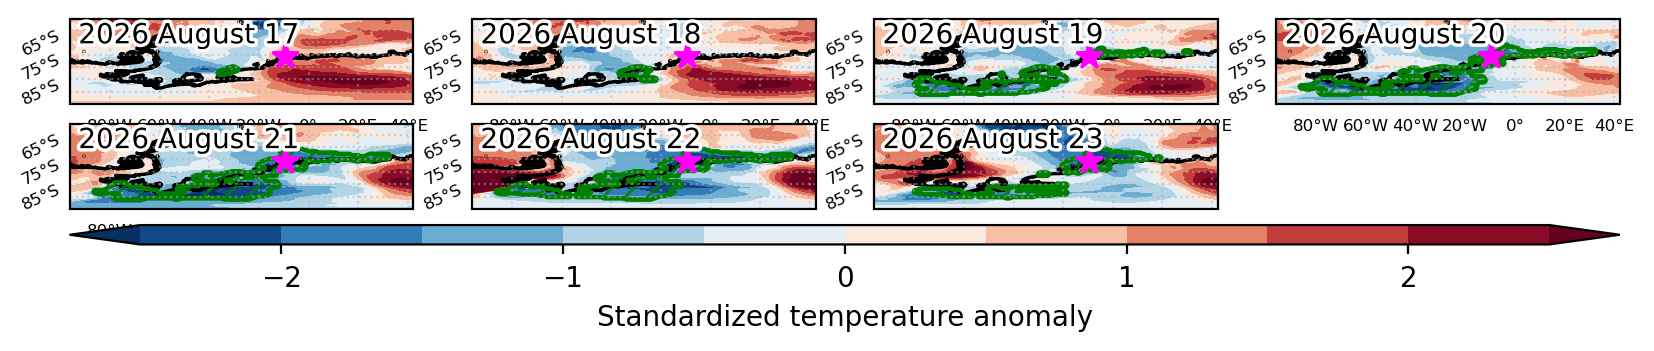
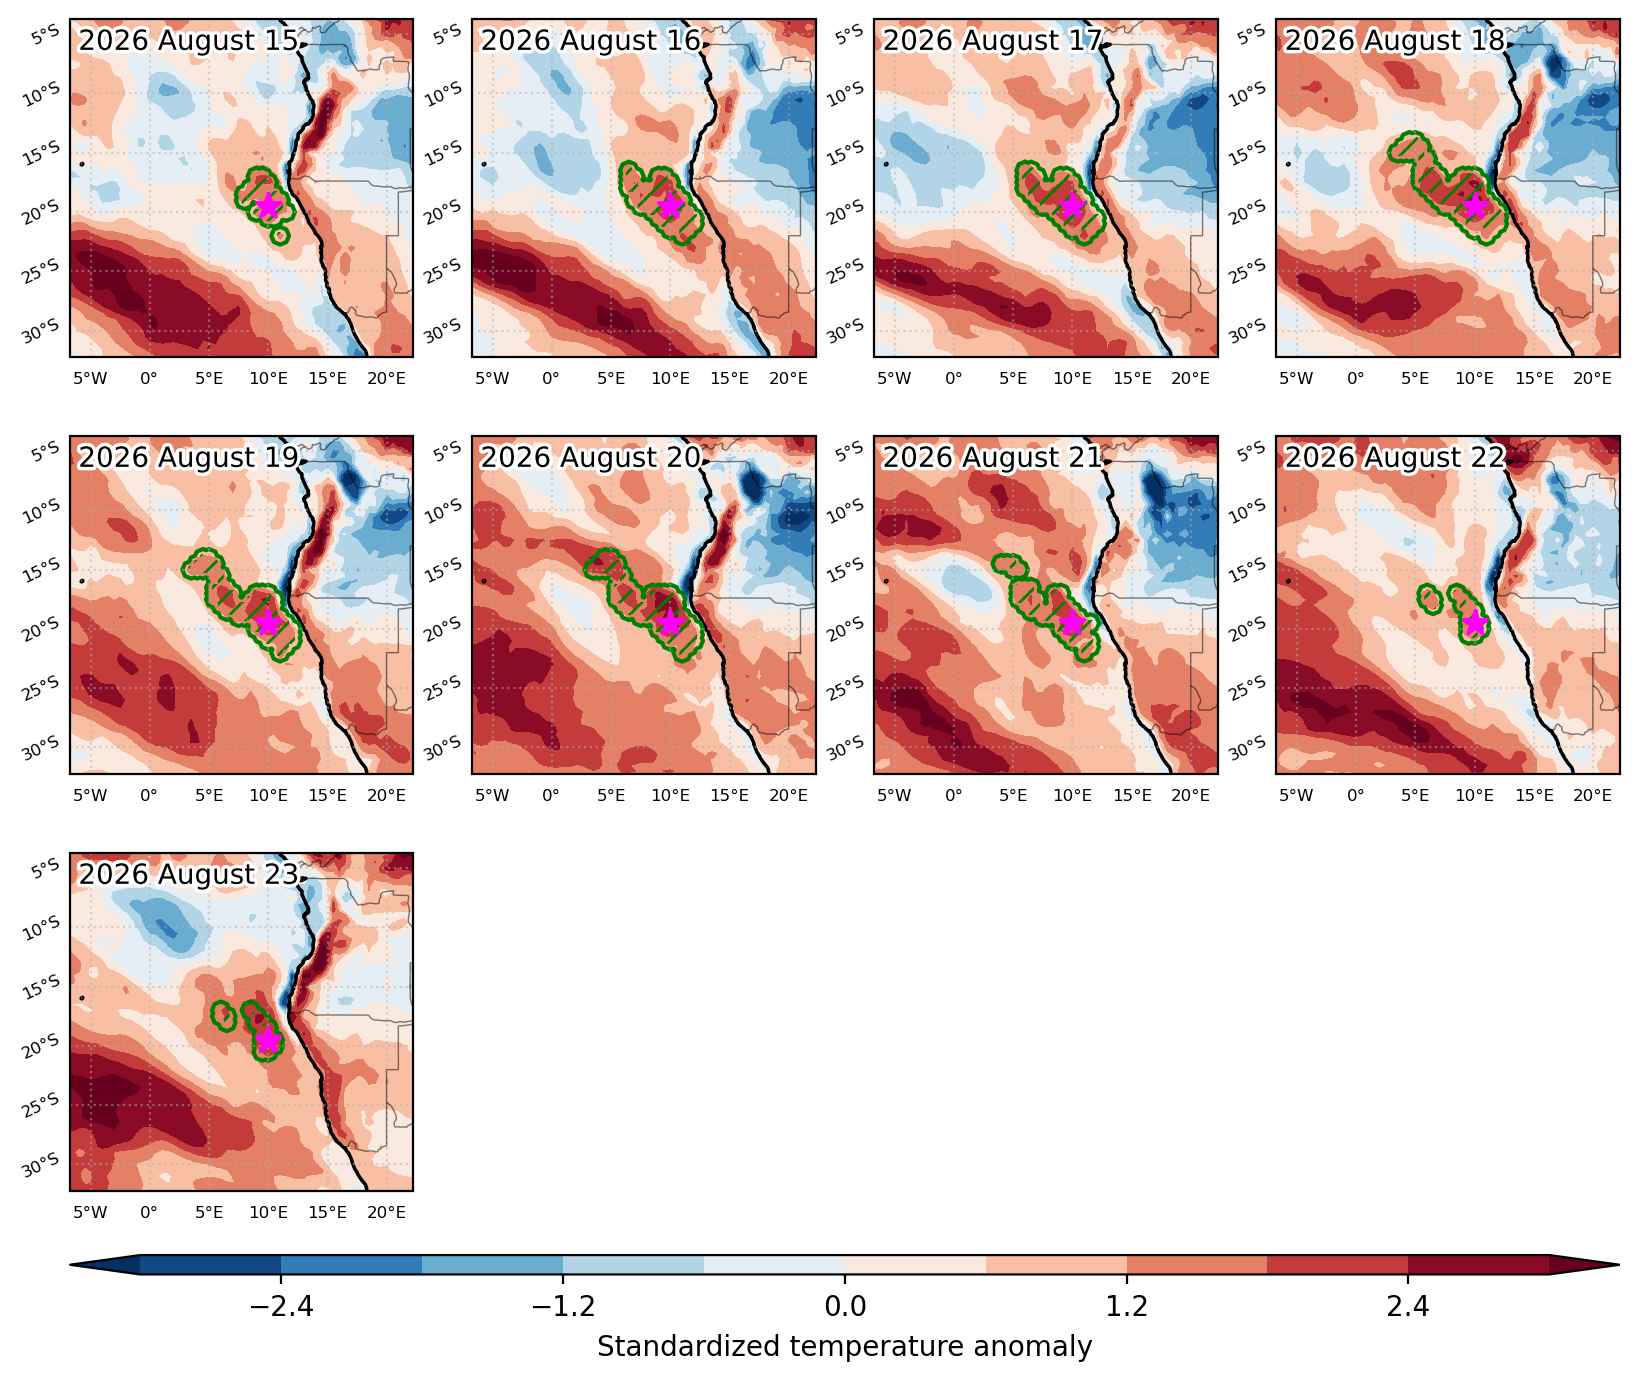
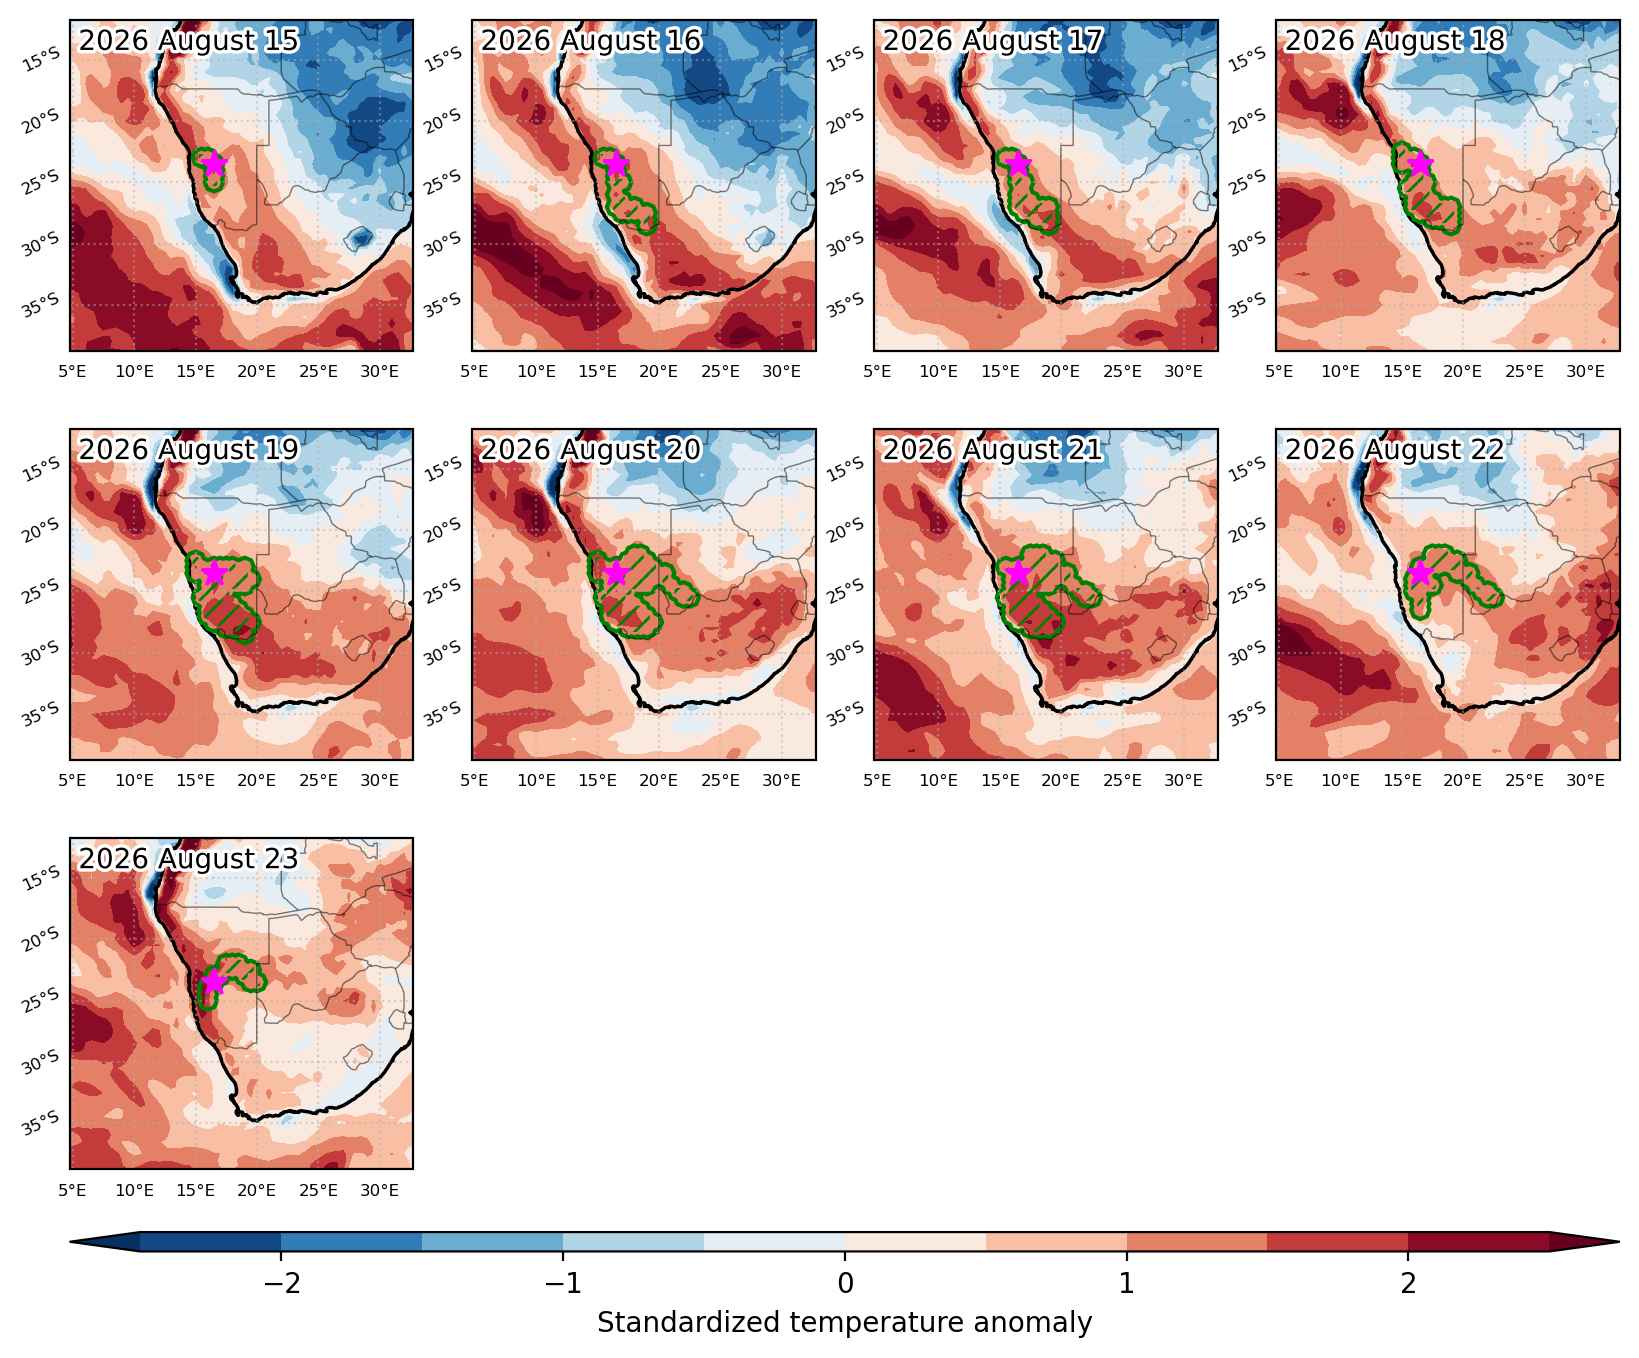
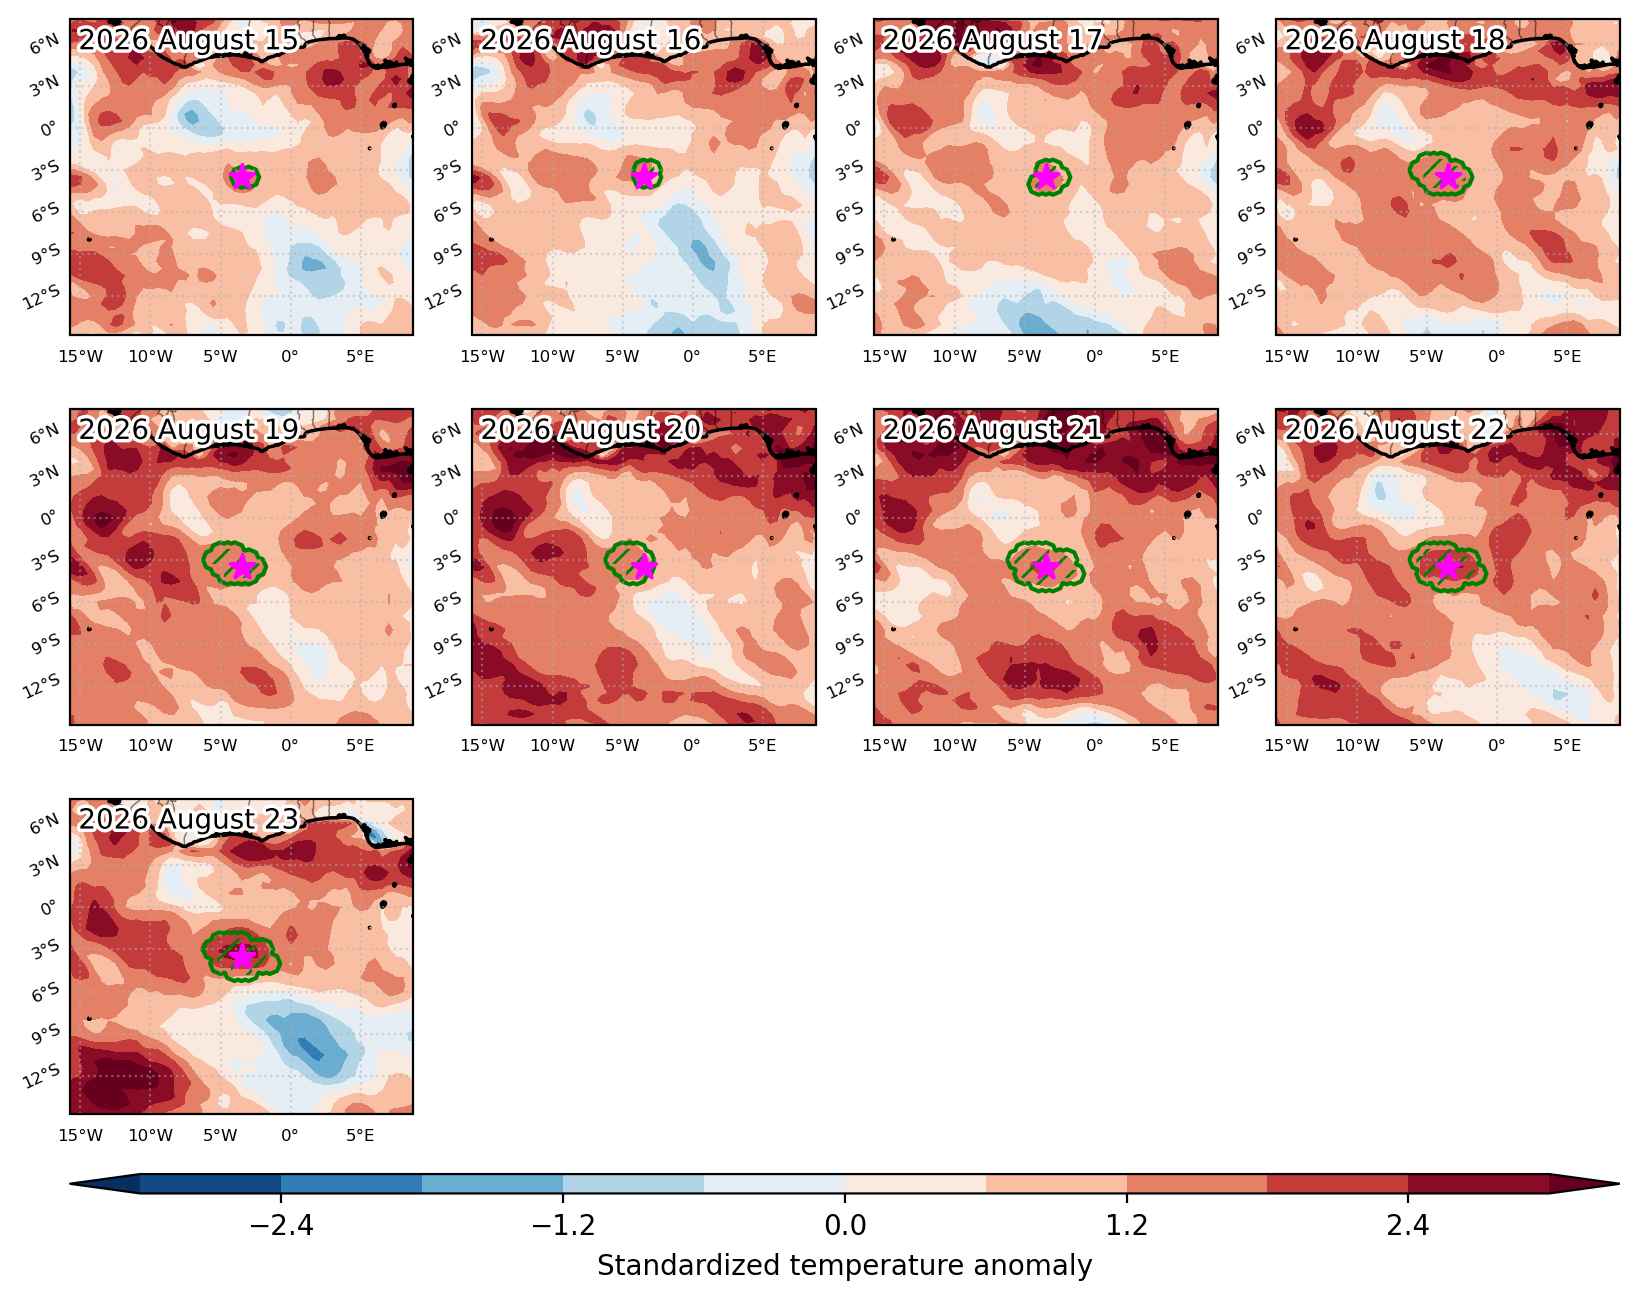
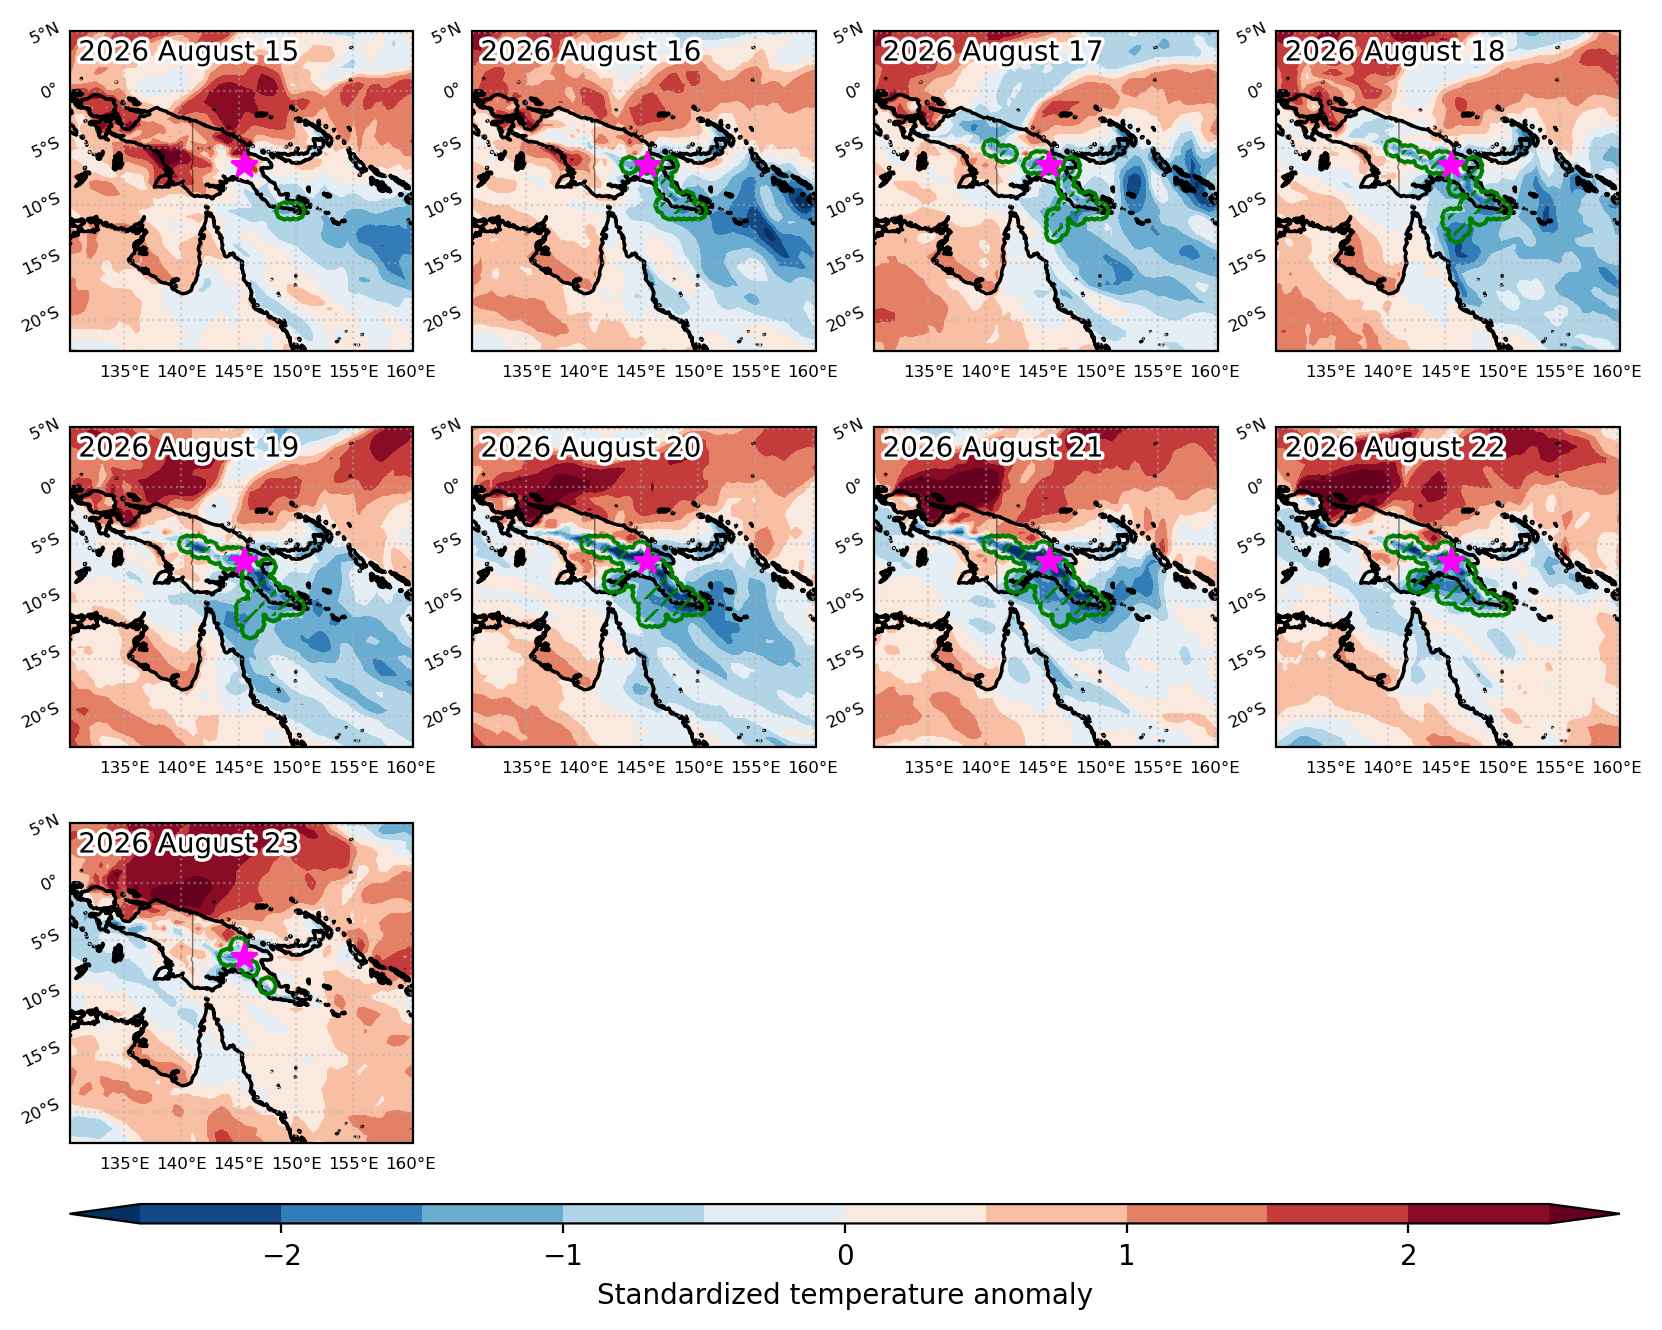
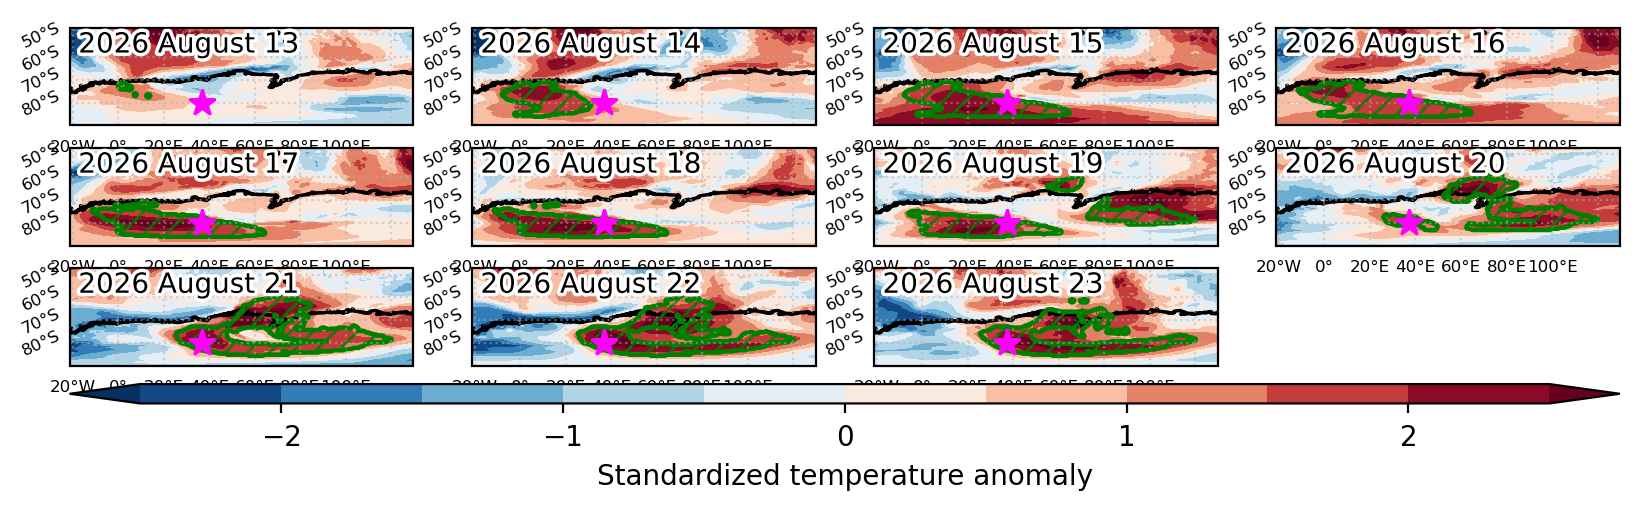
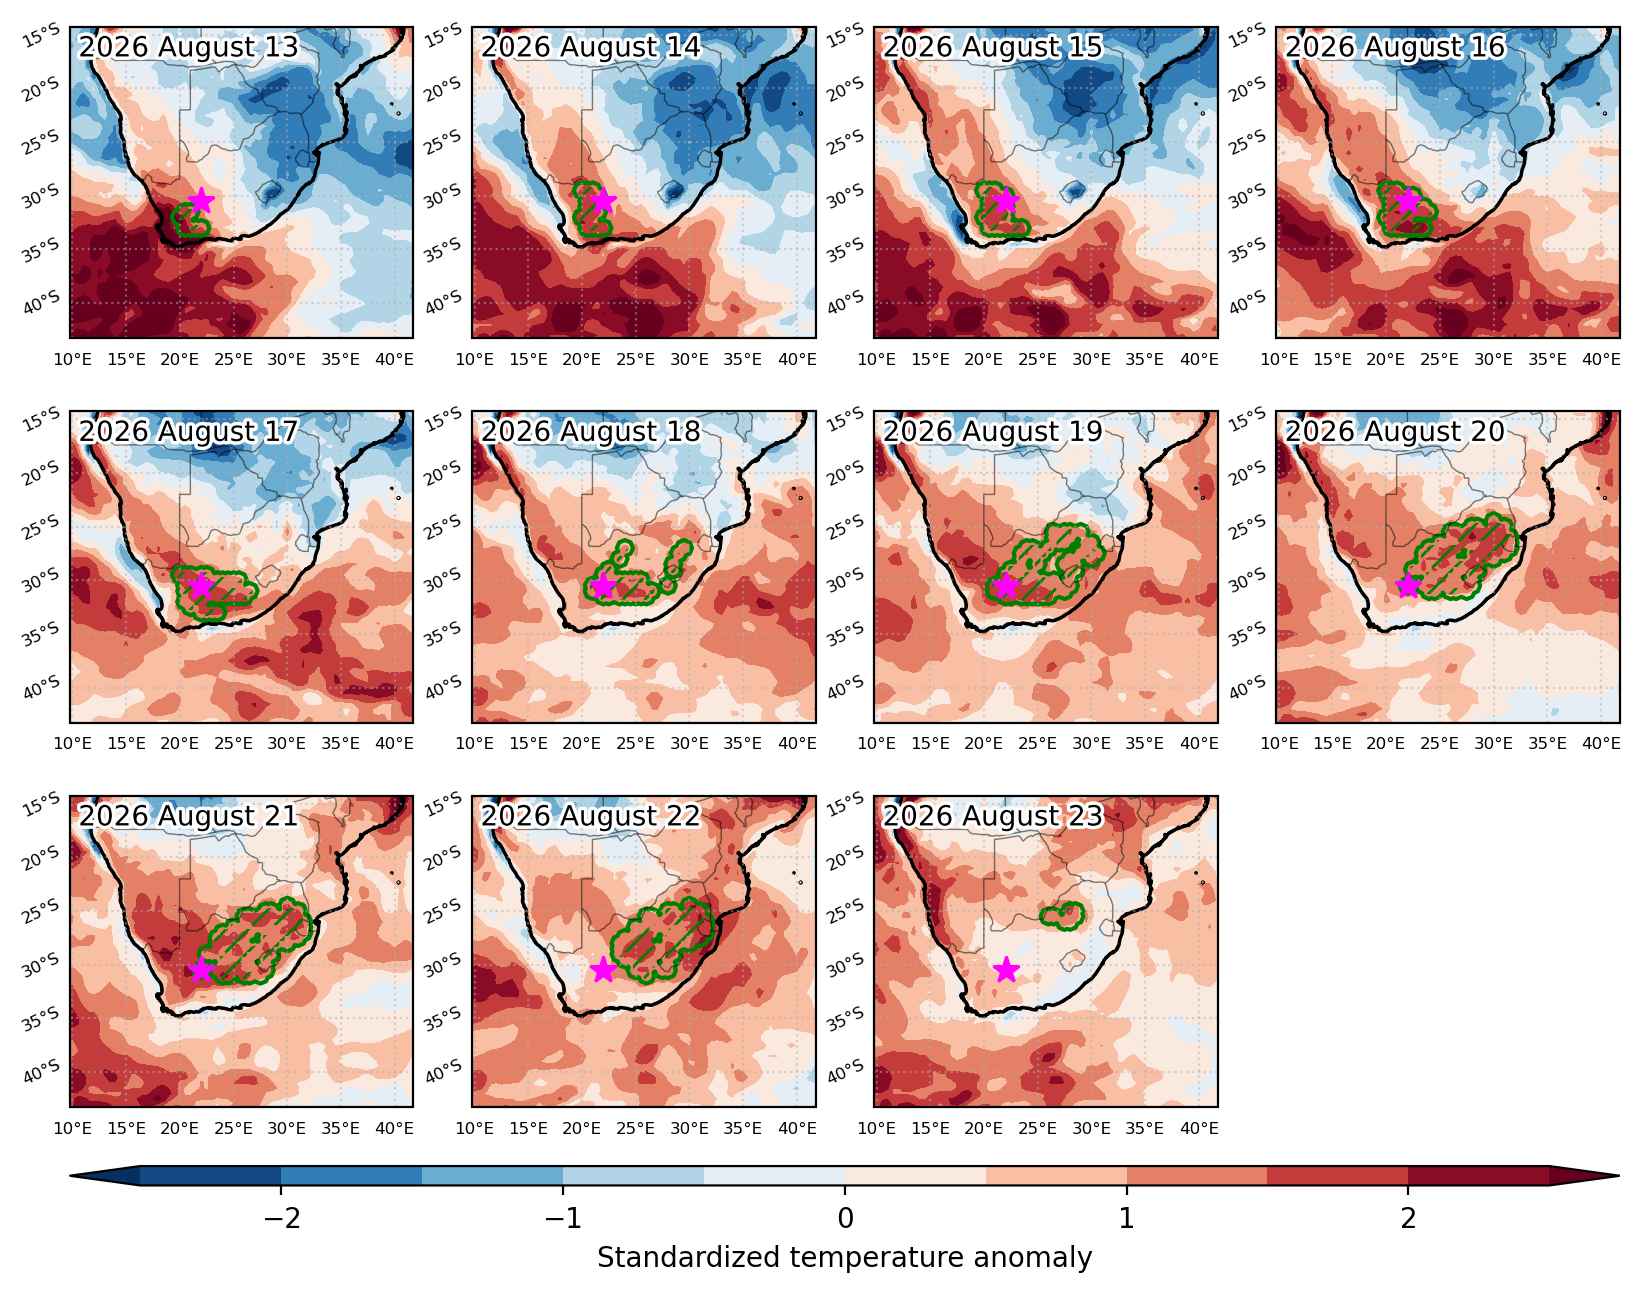
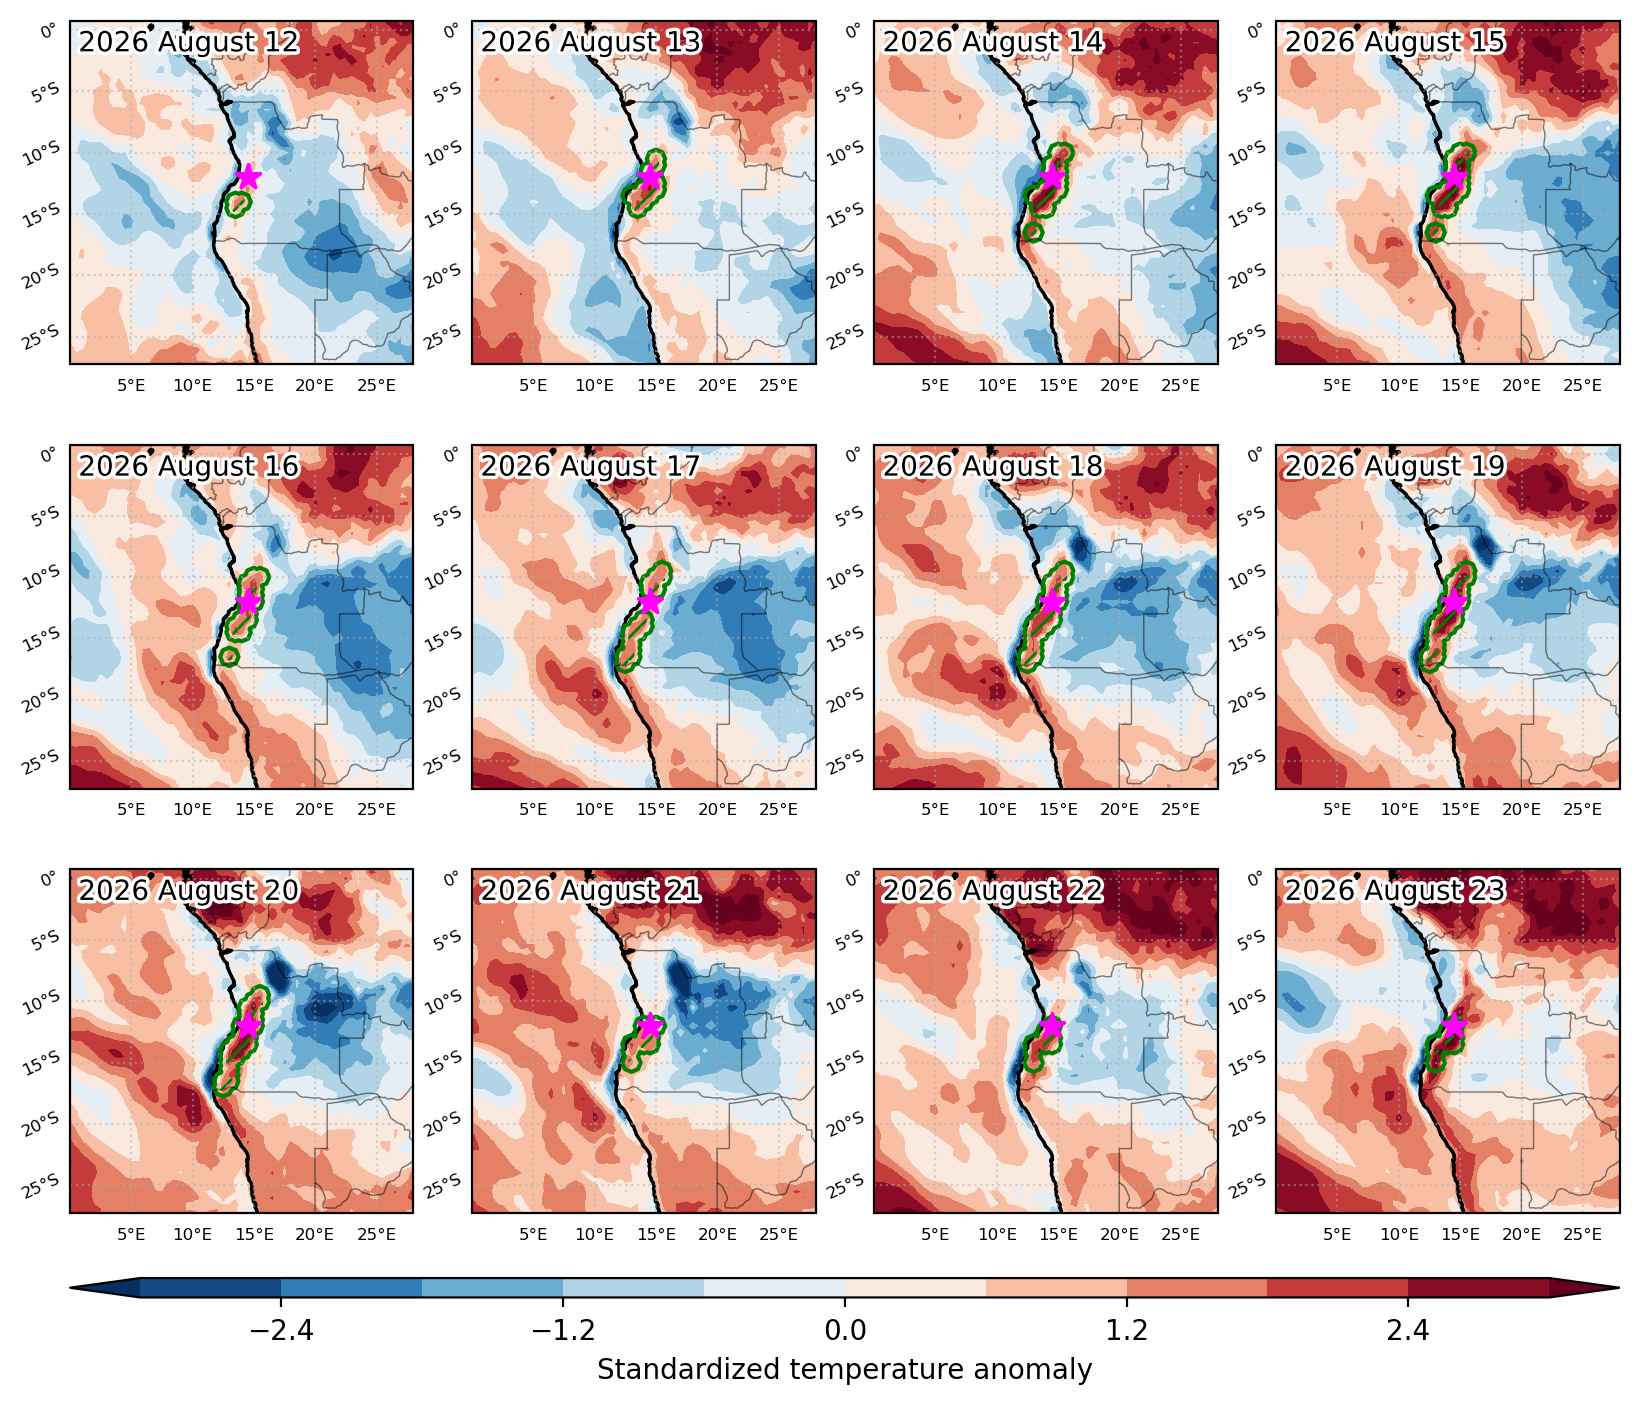
    Fig. 3: Maps illustrating the evolution of standardized temperature anomalies during the event.

    Event ID: Heat_wave_2026-Apr-30_to_2026-May-03_358.0_0.5

    (ongoing) Heat wave occuring from April 30 2026 to May 03 2026 at 25.0°N 282.0°E

    Download data: JSON

    Event type: Heat wave

    Countries affected (identified with ArcGIS Online; provided only for geographical reference):

    • Bahamas
    • United States

    Duration: 4 days

    Time span: April 30 2026 to May 03 2026

    Statistics over entire affected area:

    • Mean temperature anomaly: 1.9 °C
    • Mean temperature: 25.2 °C
    • Maximum temperature anomaly: 4.2 °C
    • Maximum temperature: 29.0 °C

    Event center: 25.0°N 282.0°E

    Area affected: 401786 km$^2$


    Fig. 1: unavailable since event is ongoing.


    Fig. 3: Maps illustrating the evolution of standardized temperature anomalies during the event.

    Event ID: Heat_wave_2026-Apr-30_to_2026-May-03_282.0_25.0

    (ongoing) Heat wave occuring from April 29 2026 to May 03 2026 at -41.5°S 69.0°E

    Download data: JSON

    Event type: Heat wave

    Countries affected (identified with ArcGIS Online; provided only for geographical reference):

      Duration: 5 days

      Time span: April 29 2026 to May 03 2026

      Statistics over entire affected area:

      • Mean temperature anomaly: 2.6 °C
      • Mean temperature: 16.9 °C
      • Maximum temperature anomaly: 3.5 °C
      • Maximum temperature: 18.0 °C

      Event center: -41.5°S 69.0°E

      Area affected: 164039 km$^2$


      Fig. 1: unavailable since event is ongoing.


      Fig. 3: Maps illustrating the evolution of standardized temperature anomalies during the event.

      Event ID: Heat_wave_2026-Apr-29_to_2026-May-03_69.0_-41.5

      (ongoing) Heat wave occuring from April 29 2026 to May 03 2026 at 8.0°N 30.5°E

      Download data: JSON

      Event type: Heat wave

      Countries affected (identified with ArcGIS Online; provided only for geographical reference):

      • Ethiopia
      • South Sudan
      • Sudan

      Duration: 5 days

      Time span: April 29 2026 to May 03 2026

      Statistics over entire affected area:

      • Mean temperature anomaly: 3.0 °C
      • Mean temperature: 32.8 °C
      • Maximum temperature anomaly: 3.6 °C
      • Maximum temperature: 34.4 °C

      Event center: 8.0°N 30.5°E

      Area affected: 51923 km$^2$


      Fig. 1: unavailable since event is ongoing.


      Fig. 3: Maps illustrating the evolution of standardized temperature anomalies during the event.

      Event ID: Heat_wave_2026-Apr-29_to_2026-May-03_30.5_8.0

      (ongoing) Heat wave occuring from April 29 2026 to May 03 2026 at -34.5°S 77.5°E

      Download data: JSON

      Event type: Heat wave

      Countries affected (identified with ArcGIS Online; provided only for geographical reference):

        Duration: 5 days

        Time span: April 29 2026 to May 03 2026

        Statistics over entire affected area:

        • Mean temperature anomaly: 2.5 °C
        • Mean temperature: 19.1 °C
        • Maximum temperature anomaly: 3.6 °C
        • Maximum temperature: 22.3 °C

        Event center: -34.5°S 77.5°E

        Area affected: 1285836 km$^2$


        Fig. 1: unavailable since event is ongoing.


        Fig. 3: Maps illustrating the evolution of standardized temperature anomalies during the event.

        Event ID: Heat_wave_2026-Apr-29_to_2026-May-03_77.5_-34.5

        (ongoing) Heat wave occuring from April 29 2026 to May 03 2026 at 12.0°N 81.5°E

        Download data: JSON

        Event type: Heat wave

        Countries affected (identified with ArcGIS Online; provided only for geographical reference):

          Duration: 5 days

          Time span: April 29 2026 to May 03 2026

          Statistics over entire affected area:

          • Mean temperature anomaly: 0.9 °C
          • Mean temperature: 30.2 °C
          • Maximum temperature anomaly: 1.2 °C
          • Maximum temperature: 30.6 °C

          Event center: 12.0°N 81.5°E

          Area affected: 78802 km$^2$


          Fig. 1: unavailable since event is ongoing.


          Fig. 3: Maps illustrating the evolution of standardized temperature anomalies during the event.

          Event ID: Heat_wave_2026-Apr-29_to_2026-May-03_81.5_12.0

          (ongoing) Heat wave occuring from April 29 2026 to May 03 2026 at 23.5°N 135.5°E

          Download data: JSON

          Event type: Heat wave

          Countries affected (identified with ArcGIS Online; provided only for geographical reference):

            Duration: 5 days

            Time span: April 29 2026 to May 03 2026

            Statistics over entire affected area:

            • Mean temperature anomaly: 1.6 °C
            • Mean temperature: 26.2 °C
            • Maximum temperature anomaly: 2.4 °C
            • Maximum temperature: 27.0 °C

            Event center: 23.5°N 135.5°E

            Area affected: 96178 km$^2$


            Fig. 1: unavailable since event is ongoing.


            Fig. 3: Maps illustrating the evolution of standardized temperature anomalies during the event.

            Event ID: Heat_wave_2026-Apr-29_to_2026-May-03_135.5_23.5

            (ongoing) Cold spell occuring from April 29 2026 to May 03 2026 at -81.0°S 342.0°E

            Download data: JSON

            Event type: Cold spell

            Countries affected (identified with ArcGIS Online; provided only for geographical reference):

            • Antarctica

            Duration: 5 days

            Time span: April 29 2026 to May 03 2026

            Statistics over entire affected area:

            • Mean temperature anomaly: -9.9 °C
            • Mean temperature: -43.3 °C
            • Minimum temperature anomaly: -16.3 °C
            • Minimum temperature: -52.3 °C

            Event center: -81.0°S 342.0°E

            Area affected: 84081 km$^2$


            Fig. 1: unavailable since event is ongoing.


            Fig. 3: Maps illustrating the evolution of standardized temperature anomalies during the event.

            Event ID: Cold_spell_2026-Apr-29_to_2026-May-03_342.0_-81.0

            (ongoing) Heat wave occuring from April 29 2026 to May 03 2026 at -31.5°S 148.5°E

            Download data: JSON

            Event type: Heat wave

            Countries affected (identified with ArcGIS Online; provided only for geographical reference):

            • Australia

            Duration: 5 days

            Time span: April 29 2026 to May 03 2026

            Statistics over entire affected area:

            • Mean temperature anomaly: 4.7 °C
            • Mean temperature: 19.5 °C
            • Maximum temperature anomaly: 6.7 °C
            • Maximum temperature: 22.9 °C

            Event center: -31.5°S 148.5°E

            Area affected: 91992 km$^2$


            Fig. 1: unavailable since event is ongoing.


            Fig. 3: Maps illustrating the evolution of standardized temperature anomalies during the event.

            Event ID: Heat_wave_2026-Apr-29_to_2026-May-03_148.5_-31.5

            (ongoing) Heat wave occuring from April 29 2026 to May 03 2026 at 1.5°N 350.0°E

            Download data: JSON

            Event type: Heat wave

            Countries affected (identified with ArcGIS Online; provided only for geographical reference):

            • Benin
            • Burkina Faso
            • Cameroon
            • Central African Republic
            • Chad
            • Côte d’Ivoire
            • Equatorial Guinea
            • Gabon
            • Ghana
            • Mali
            • Niger
            • Nigeria
            • Togo

            Duration: 5 days

            Time span: April 29 2026 to May 03 2026

            Statistics over entire affected area:

            • Mean temperature anomaly: 1.6 °C
            • Mean temperature: 28.9 °C
            • Maximum temperature anomaly: 4.2 °C
            • Maximum temperature: 38.2 °C

            Event center: 1.5°N 350.0°E

            Area affected: 2130456 km$^2$


            Fig. 1: unavailable since event is ongoing.


            Fig. 3: Maps illustrating the evolution of standardized temperature anomalies during the event.

            Event ID: Heat_wave_2026-Apr-29_to_2026-May-03_350.0_1.5