Cold spell occuring from April 26 2018 to May 03 2018 at 14.0°N 99.5°E

Download data: JSON

Event type: Cold spell

Countries affected (identified with ArcGIS Online; provided only for geographical reference):

  • Cambodia
  • Myanmar
  • Thailand

Duration: 8 days

Time span: April 26 2018 to May 03 2018

Statistics over entire affected area:

  • Mean temperature anomaly: -2.5 °C
  • Mean temperature: 26.3 °C
  • Minimum temperature anomaly: -6.6 °C
  • Minimum temperature: 20.8 °C

Event center: 14.0°N 99.5°E

Area affected: 535050 km$^2$
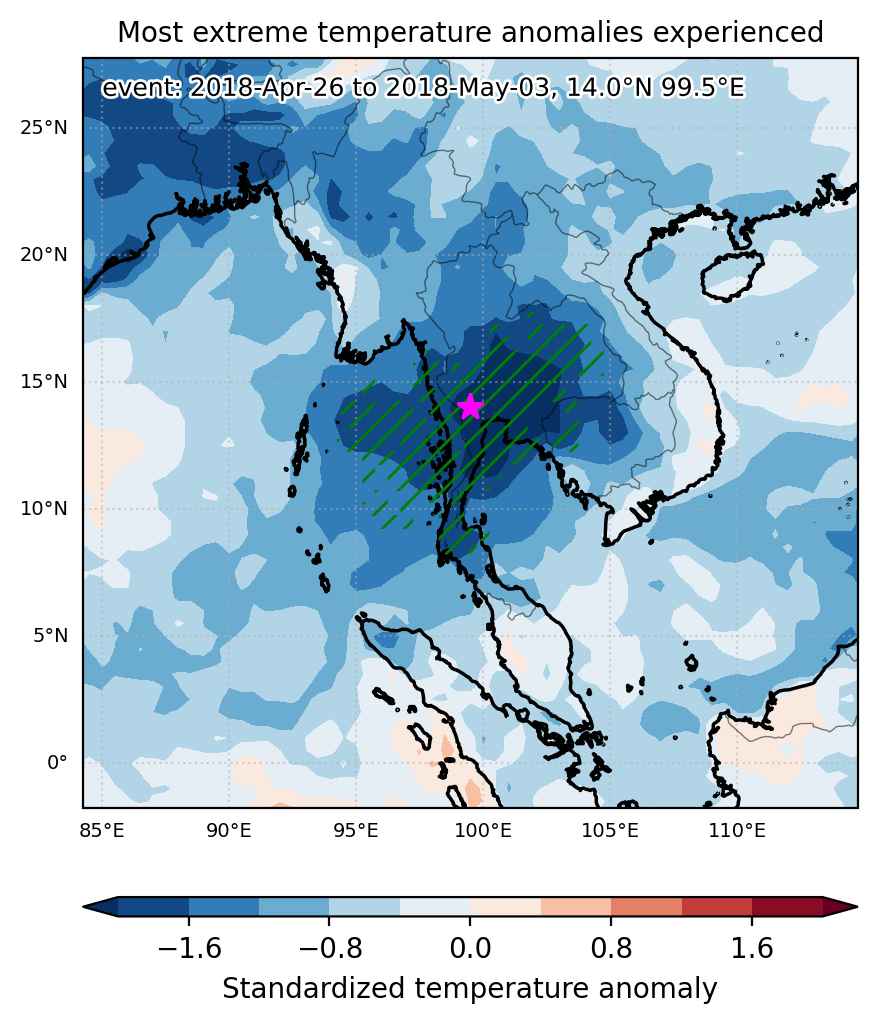

Fig. 1: Map of most extreme temperature anomalies (standardized) experienced during the event. The purple star indicates the center of the extreme event. Green hatching illustrates all areas under the effect of extremes at some time during the event.
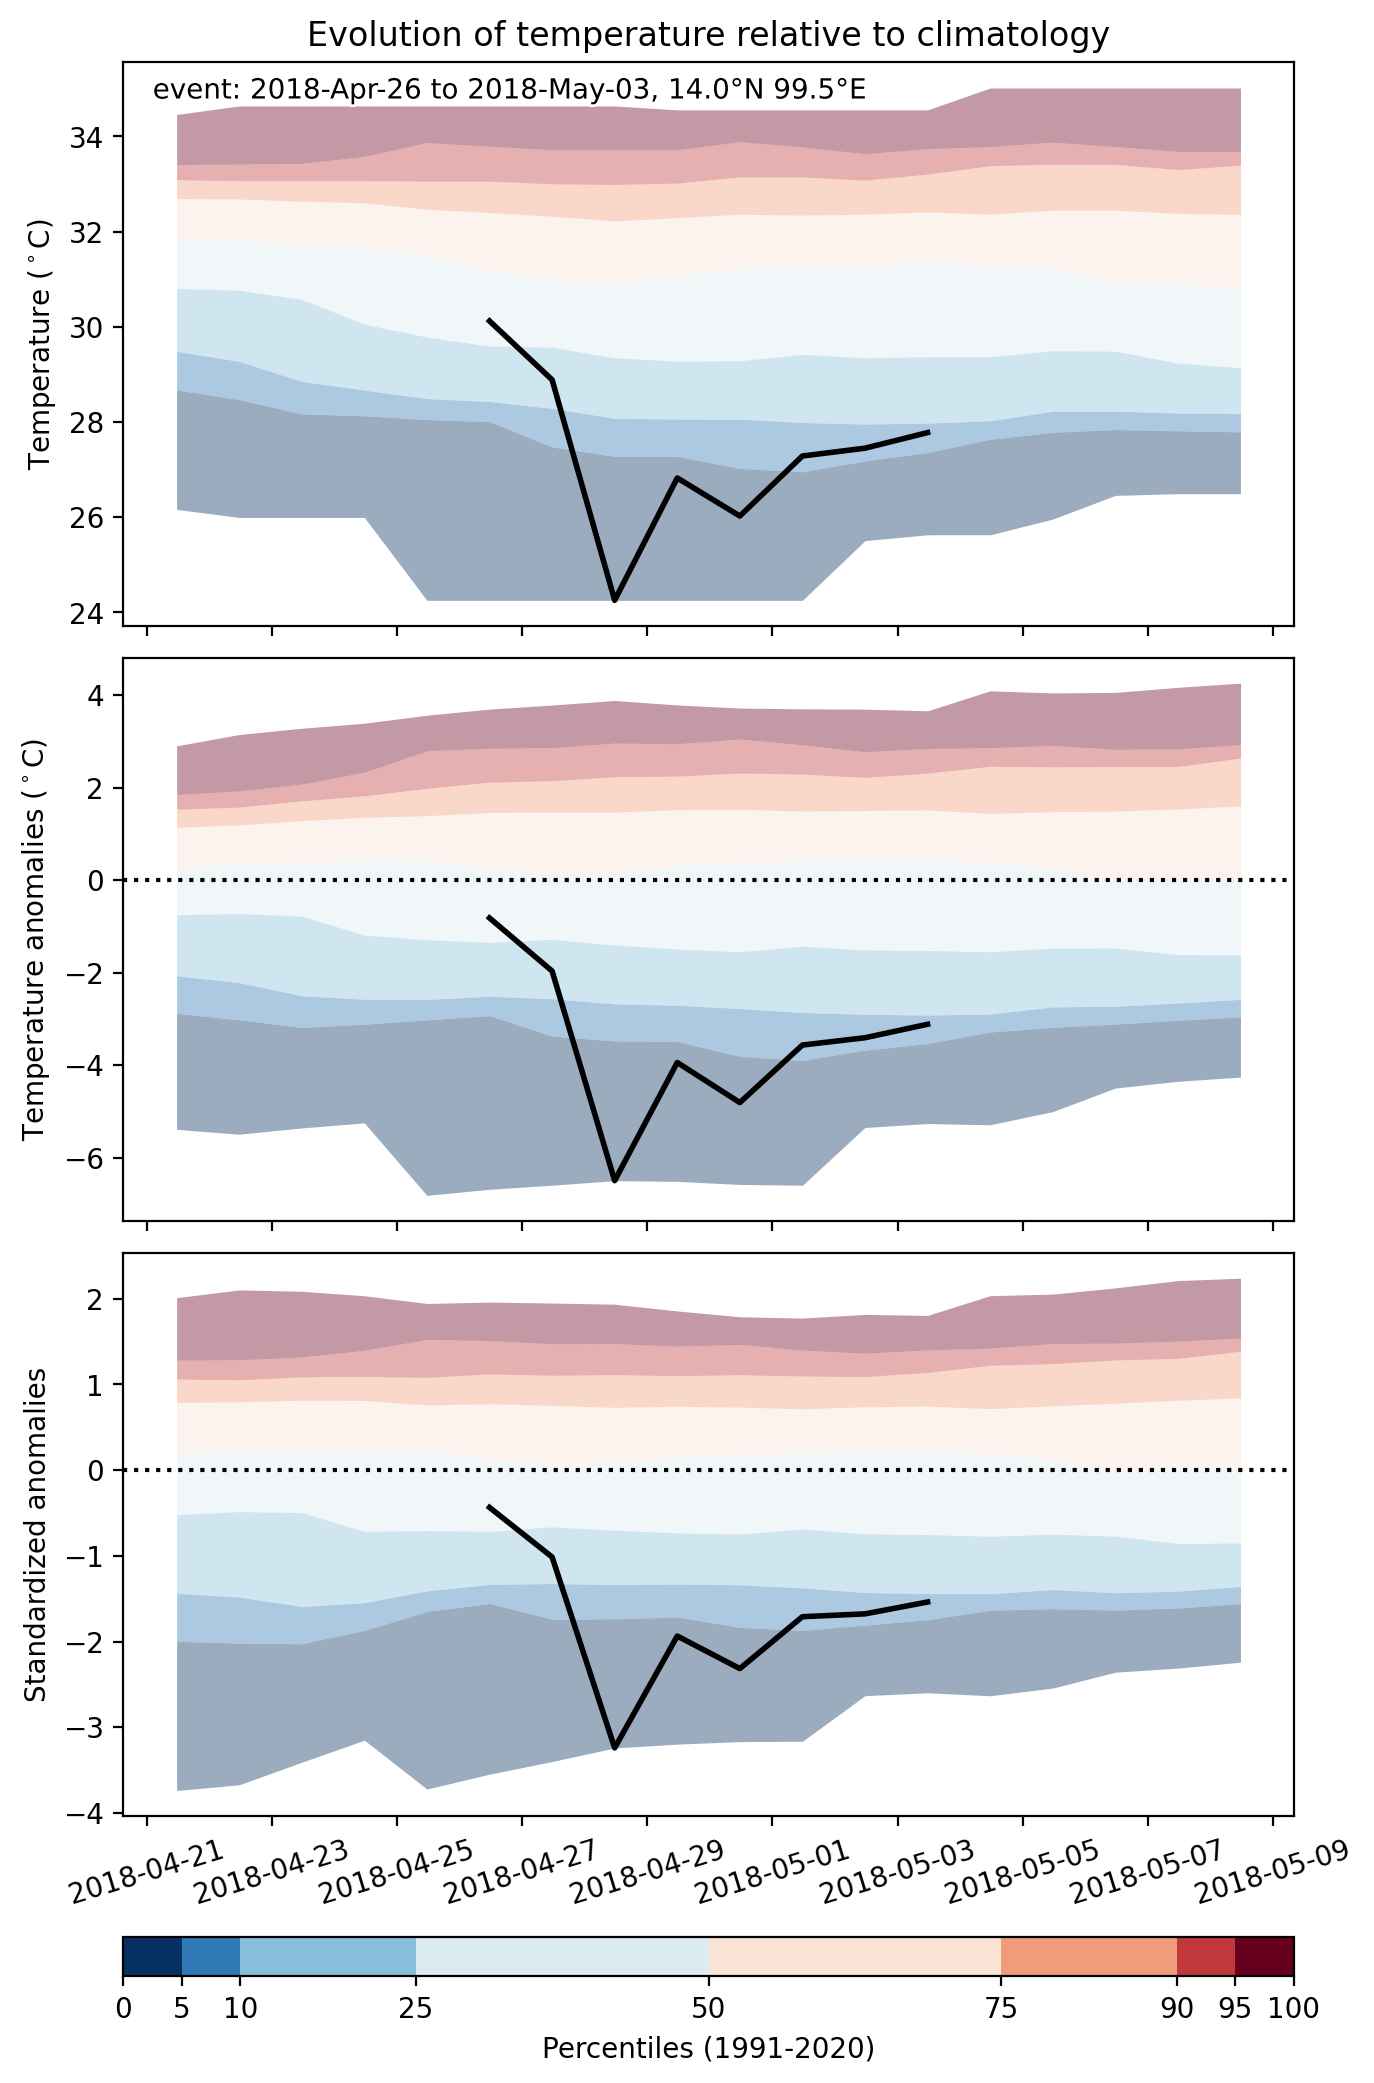


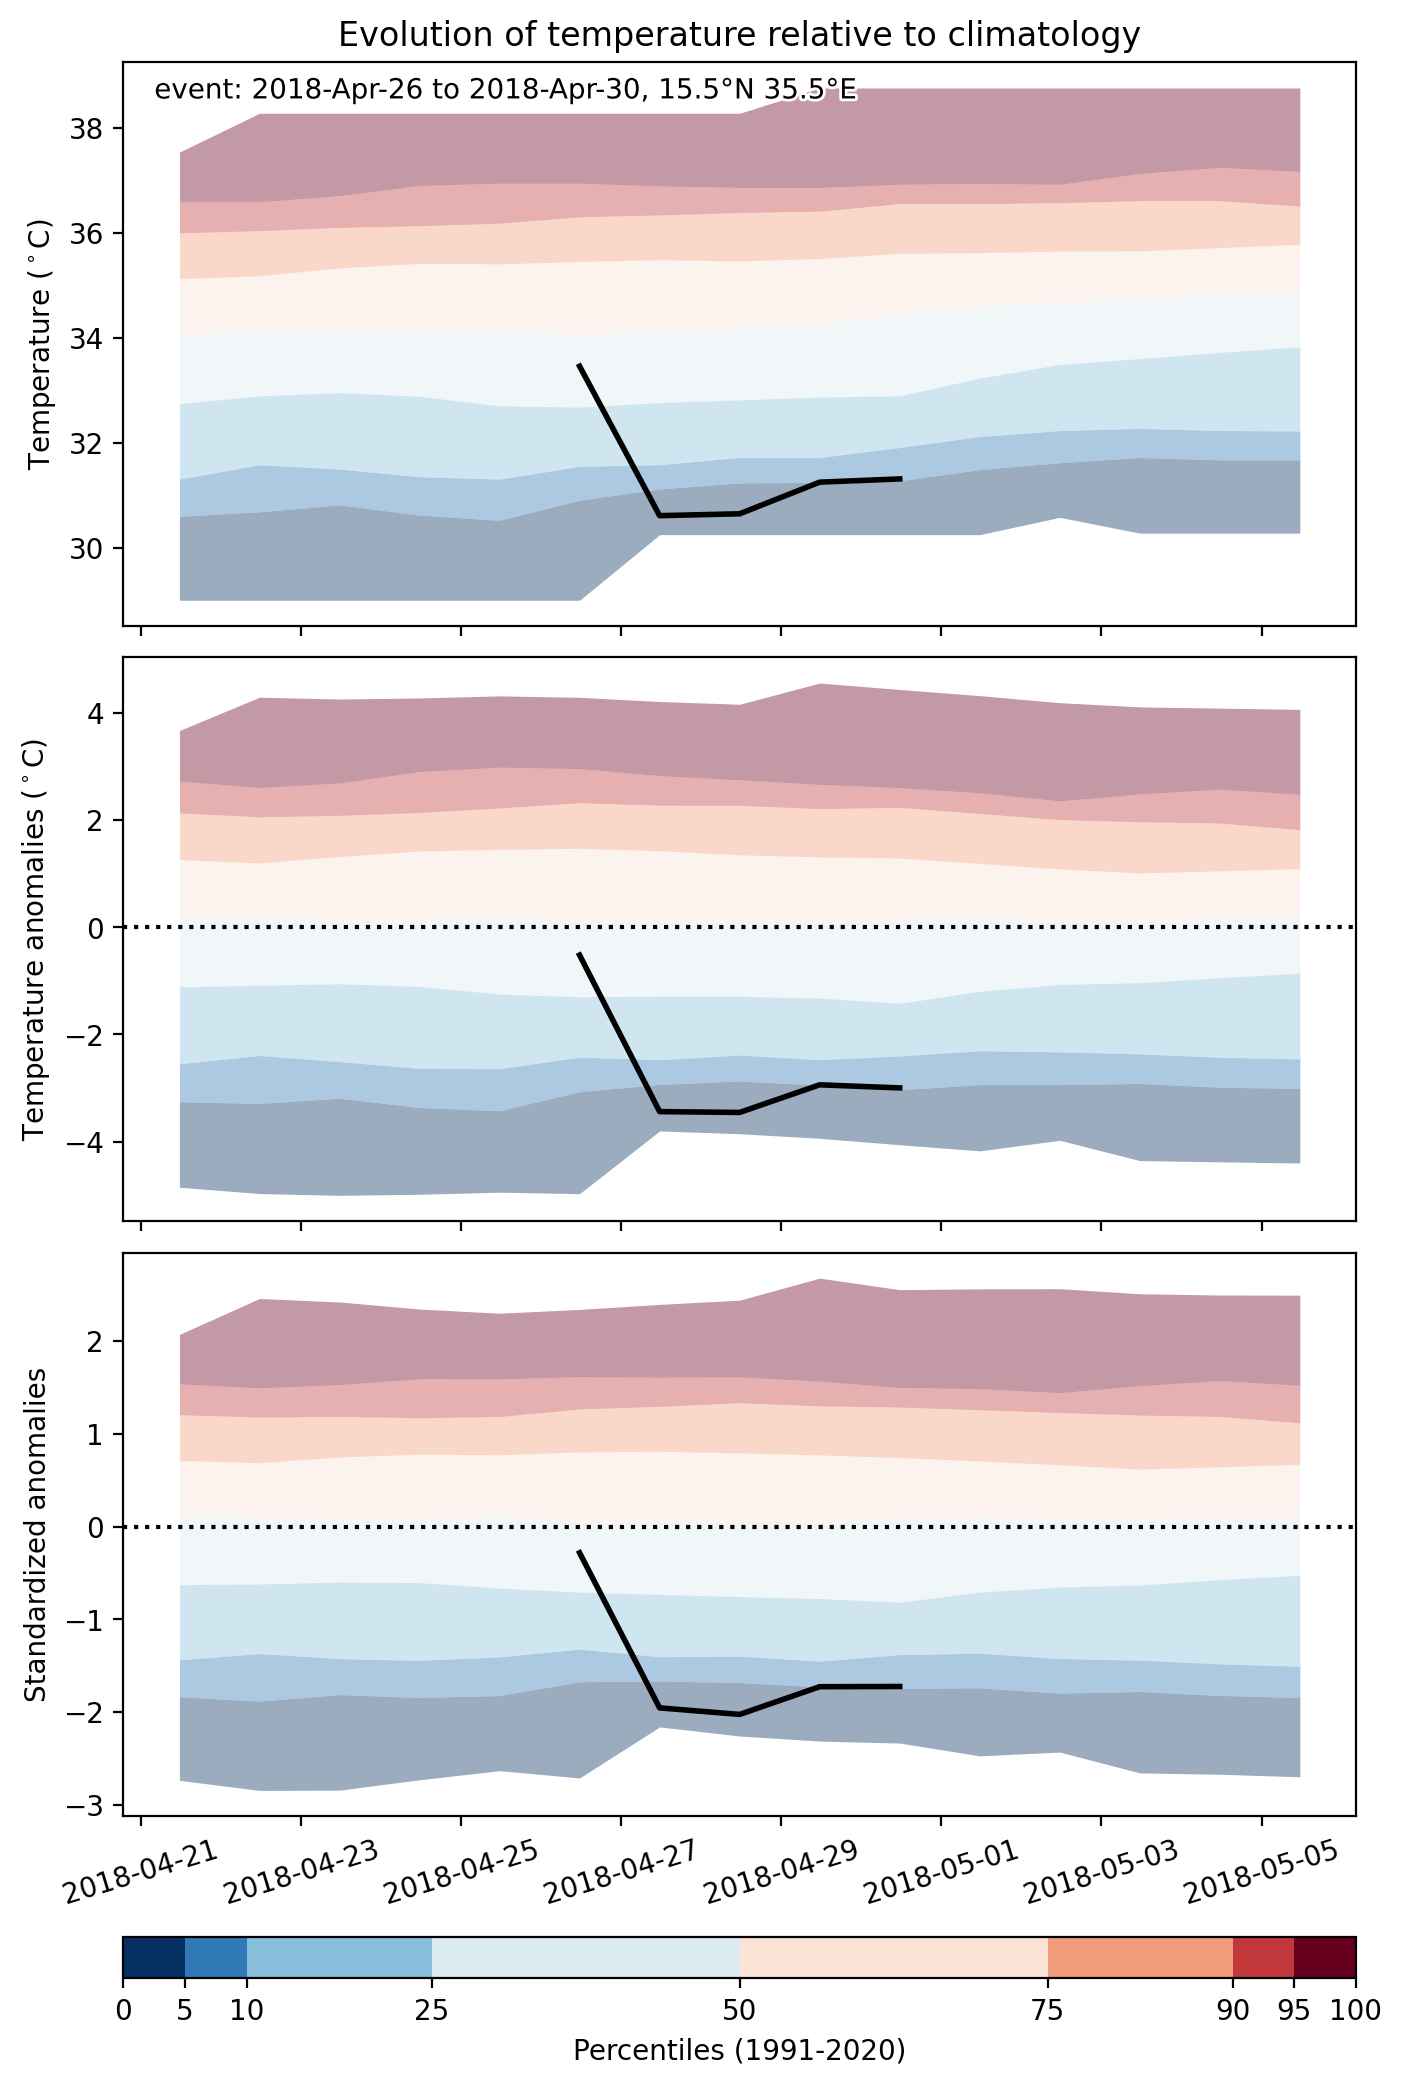
Fig. 2: Evolution of temperature at the center of the event. The climatological percentile distribution is illustrated with color shadings.
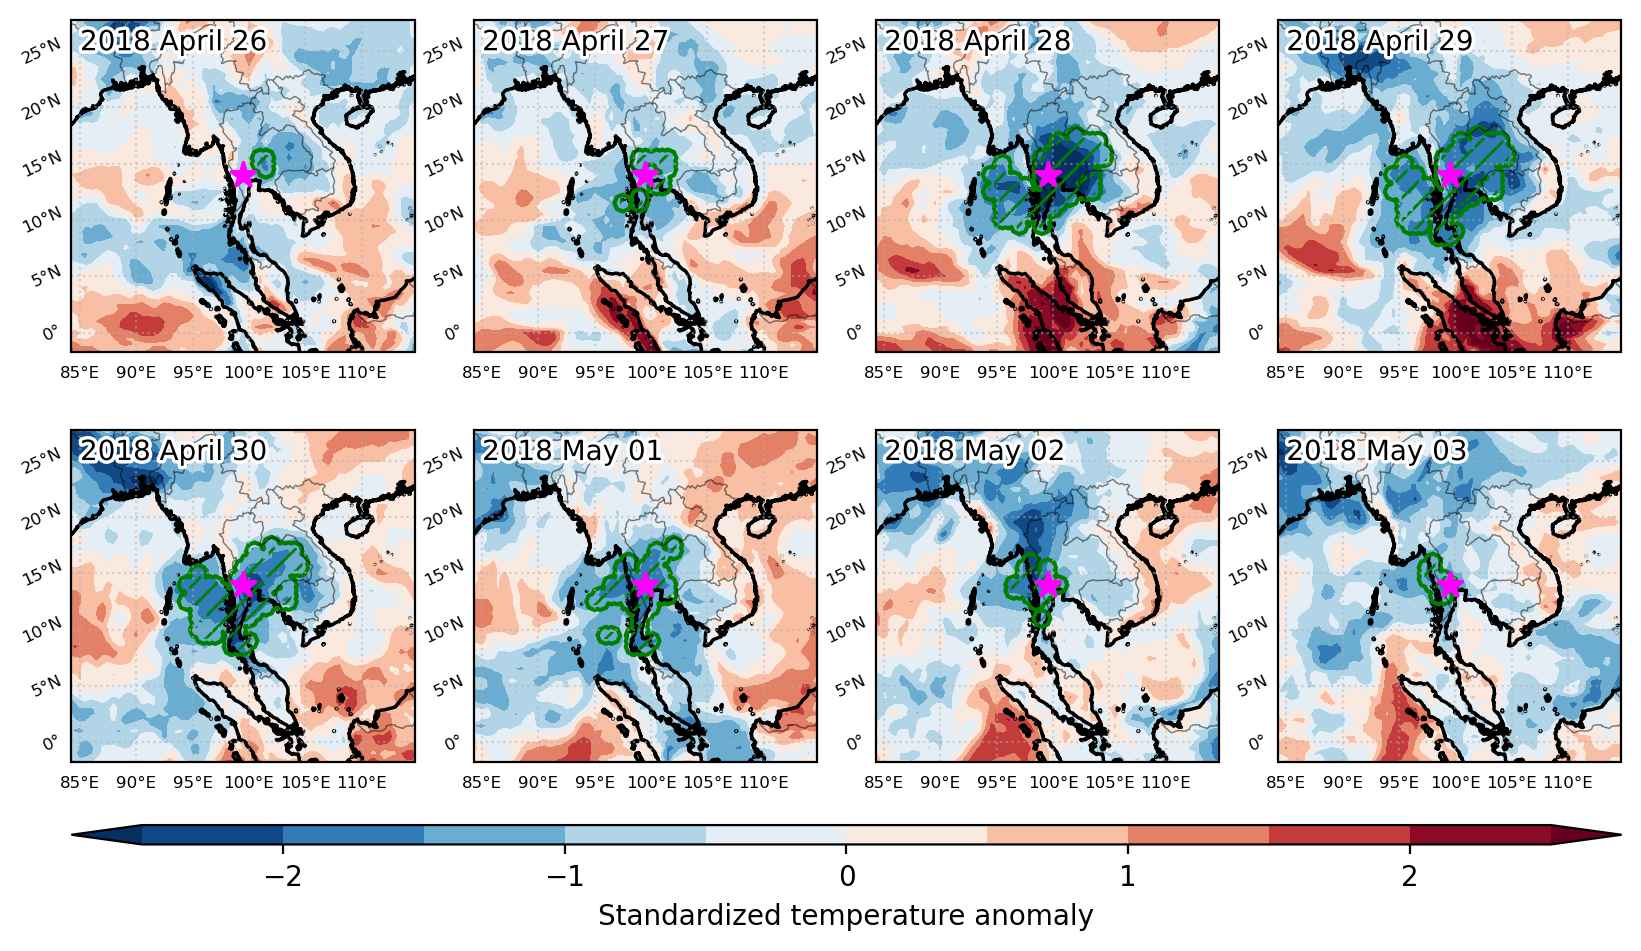


Fig. 3: Maps illustrating the evolution of standardized temperature anomalies during the event.

Event ID: Cold_spell_2018-Apr-26_to_2018-May-03_99.5_14.0
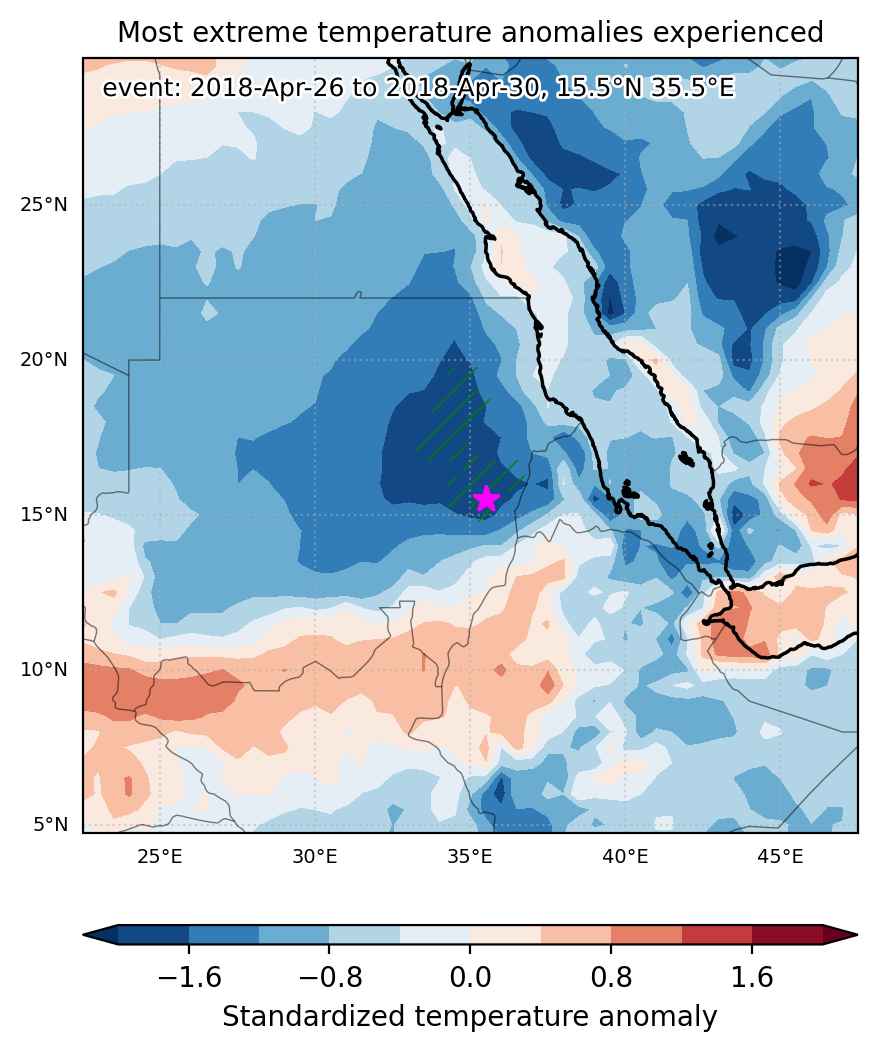
Cold spell occuring from April 26 2018 to April 30 2018 at 15.5°N 35.5°E

Download data: JSON

Event type: Cold spell

Countries affected (identified with ArcGIS Online; provided only for geographical reference):

  • Sudan

Duration: 5 days

Time span: April 26 2018 to April 30 2018

Statistics over entire affected area:

  • Mean temperature anomaly: -3.5 °C
  • Mean temperature: 29.7 °C
  • Minimum temperature anomaly: -5.4 °C
  • Minimum temperature: 27.1 °C

Event center: 15.5°N 35.5°E

Area affected: 91519 km$^2$


Fig. 1: Map of most extreme temperature anomalies (standardized) experienced during the event. The purple star indicates the center of the extreme event. Green hatching illustrates all areas under the effect of extremes at some time during the event.


Fig. 2: Evolution of temperature at the center of the event. The climatological percentile distribution is illustrated with color shadings.


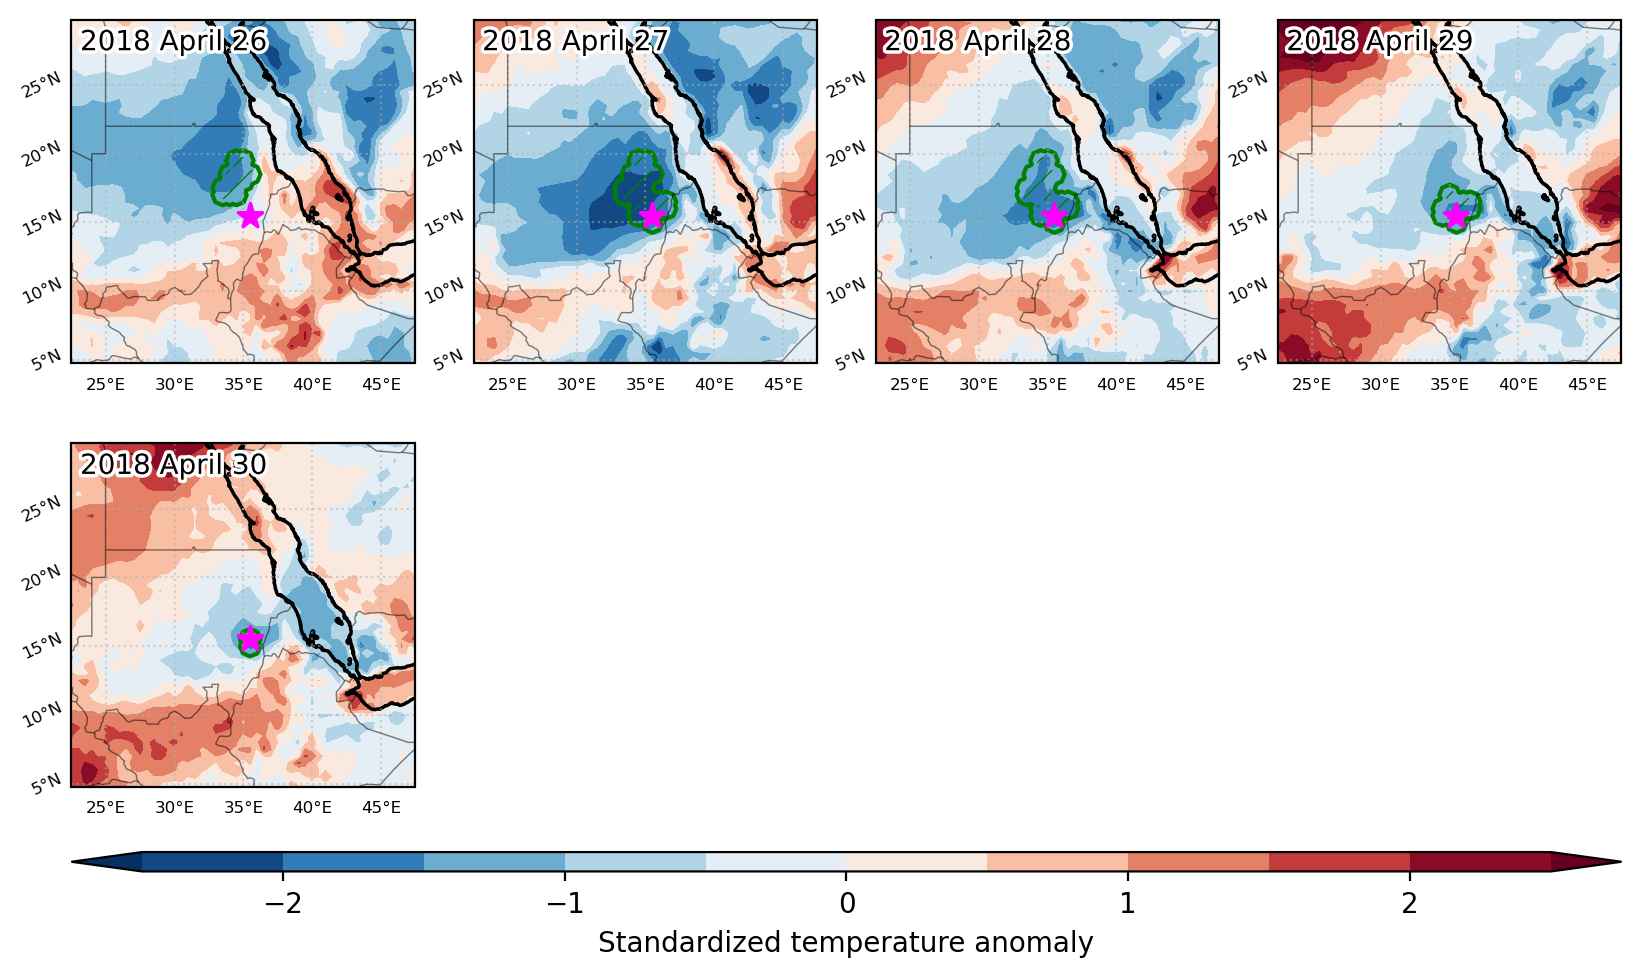
Fig. 3: Maps illustrating the evolution of standardized temperature anomalies during the event.

Event ID: Cold_spell_2018-Apr-26_to_2018-Apr-30_35.5_15.5

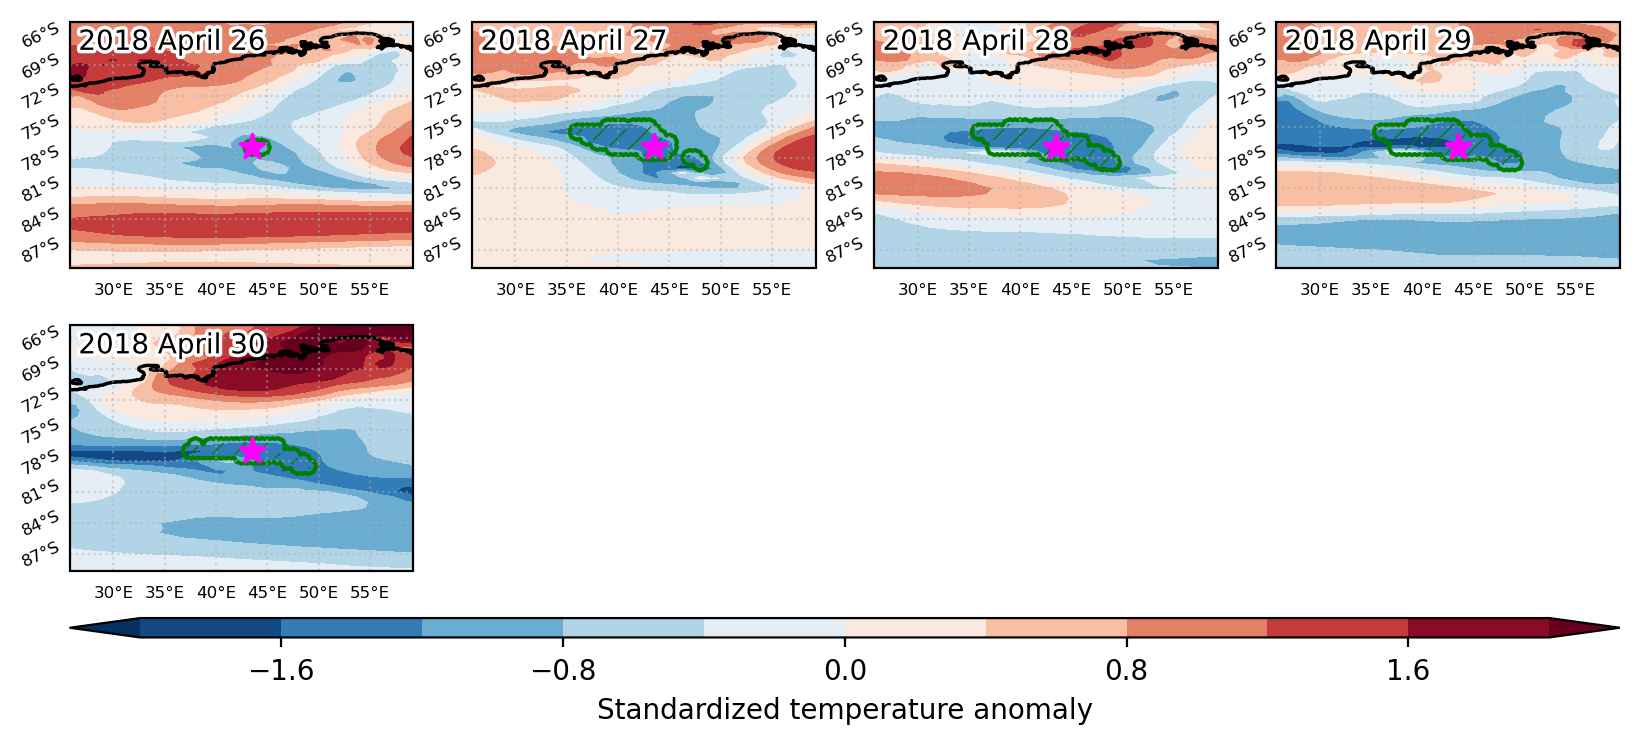
Cold spell occuring from April 26 2018 to April 30 2018 at -77.0°S 43.5°E

Download data: JSON

Event type: Cold spell

Countries affected (identified with ArcGIS Online; provided only for geographical reference):

  • Antarctica

Duration: 5 days

Time span: April 26 2018 to April 30 2018

Statistics over entire affected area:

  • Mean temperature anomaly: -6.7 °C
  • Mean temperature: -64.1 °C
  • Minimum temperature anomaly: -9.3 °C
  • Minimum temperature: -68.6 °C

Event center: -77.0°S 43.5°E

Area affected: 65893 km$^2$


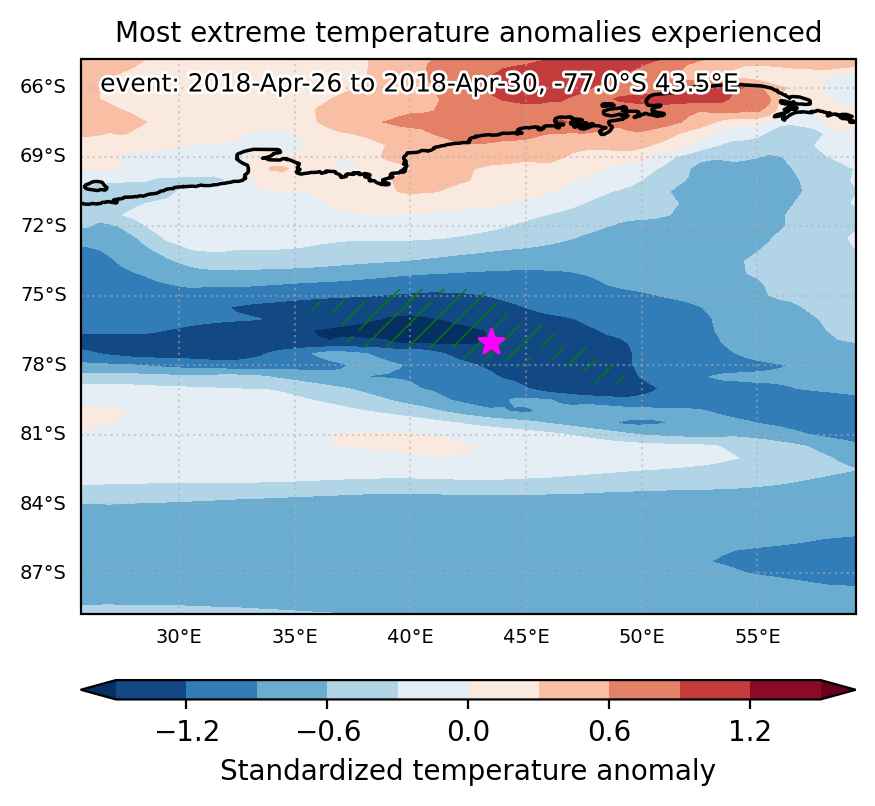
Fig. 1: Map of most extreme temperature anomalies (standardized) experienced during the event. The purple star indicates the center of the extreme event. Green hatching illustrates all areas under the effect of extremes at some time during the event.


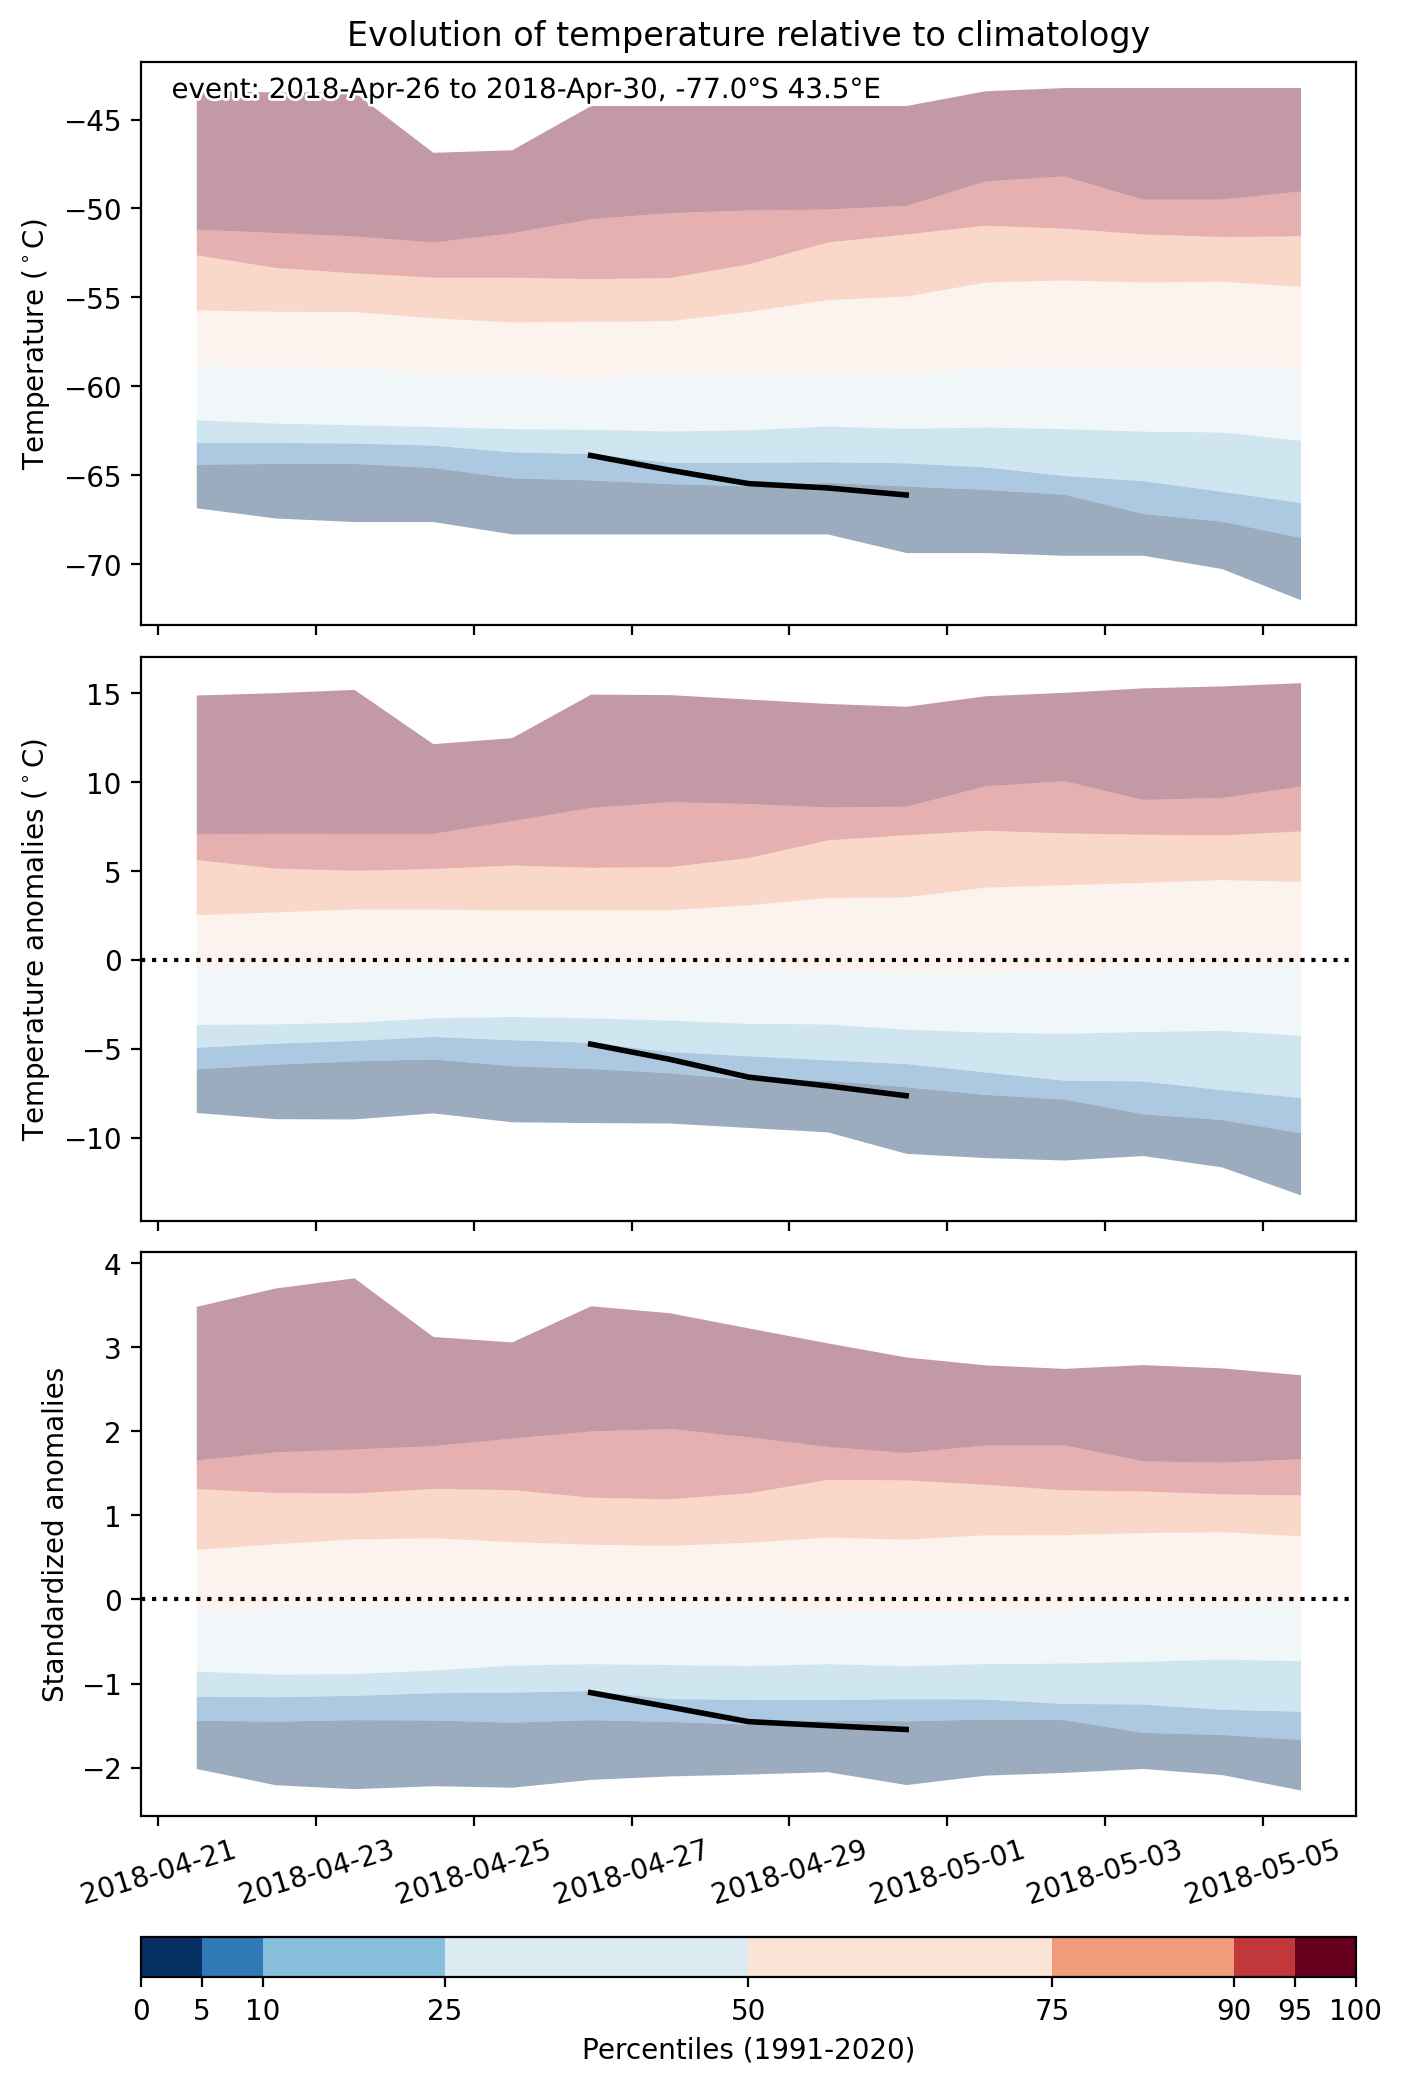
Fig. 2: Evolution of temperature at the center of the event. The climatological percentile distribution is illustrated with color shadings.


Fig. 3: Maps illustrating the evolution of standardized temperature anomalies during the event.

Event ID: Cold_spell_2018-Apr-26_to_2018-Apr-30_43.5_-77.0

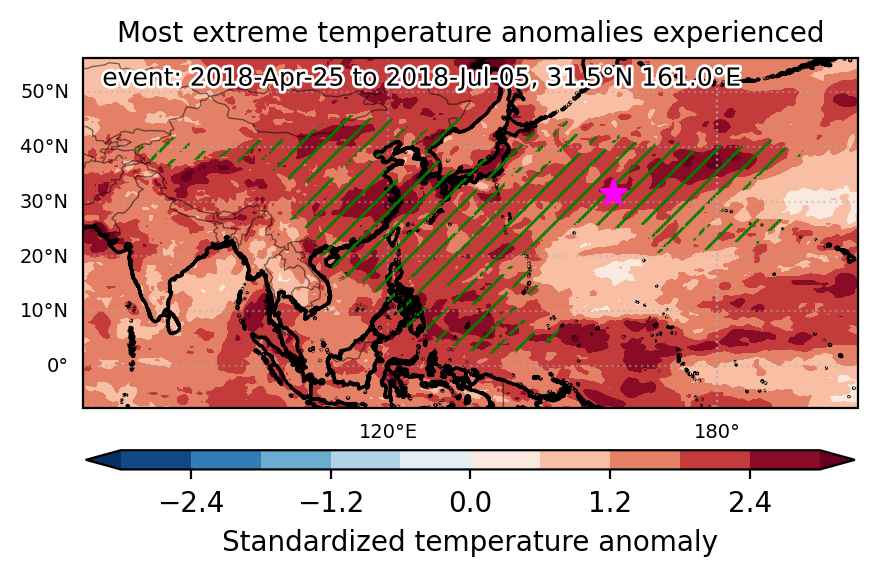
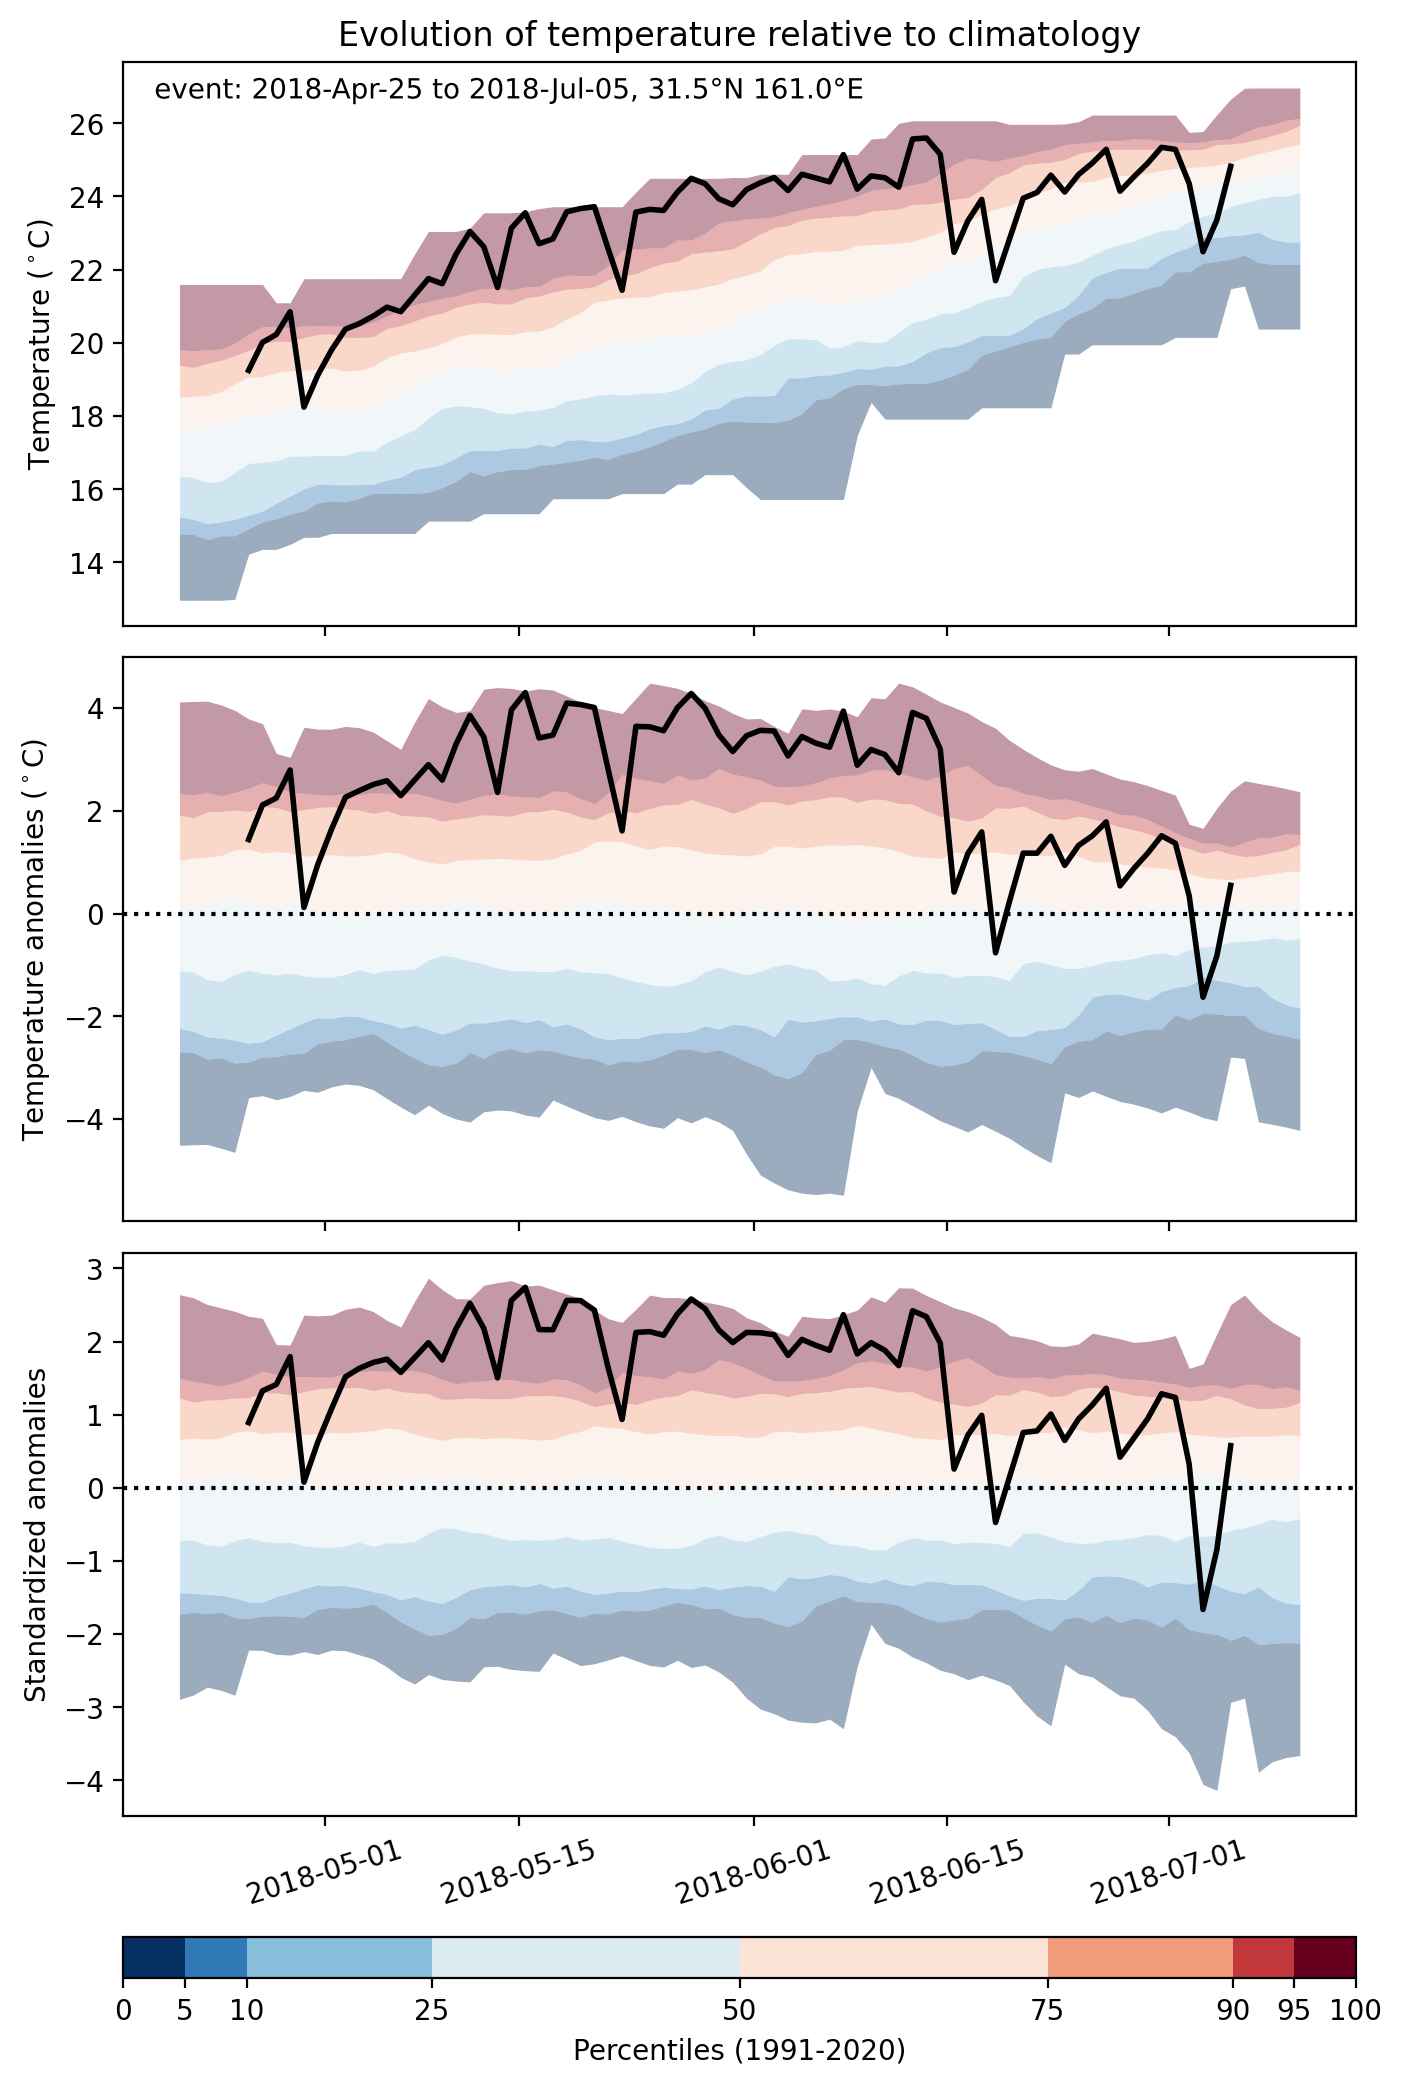
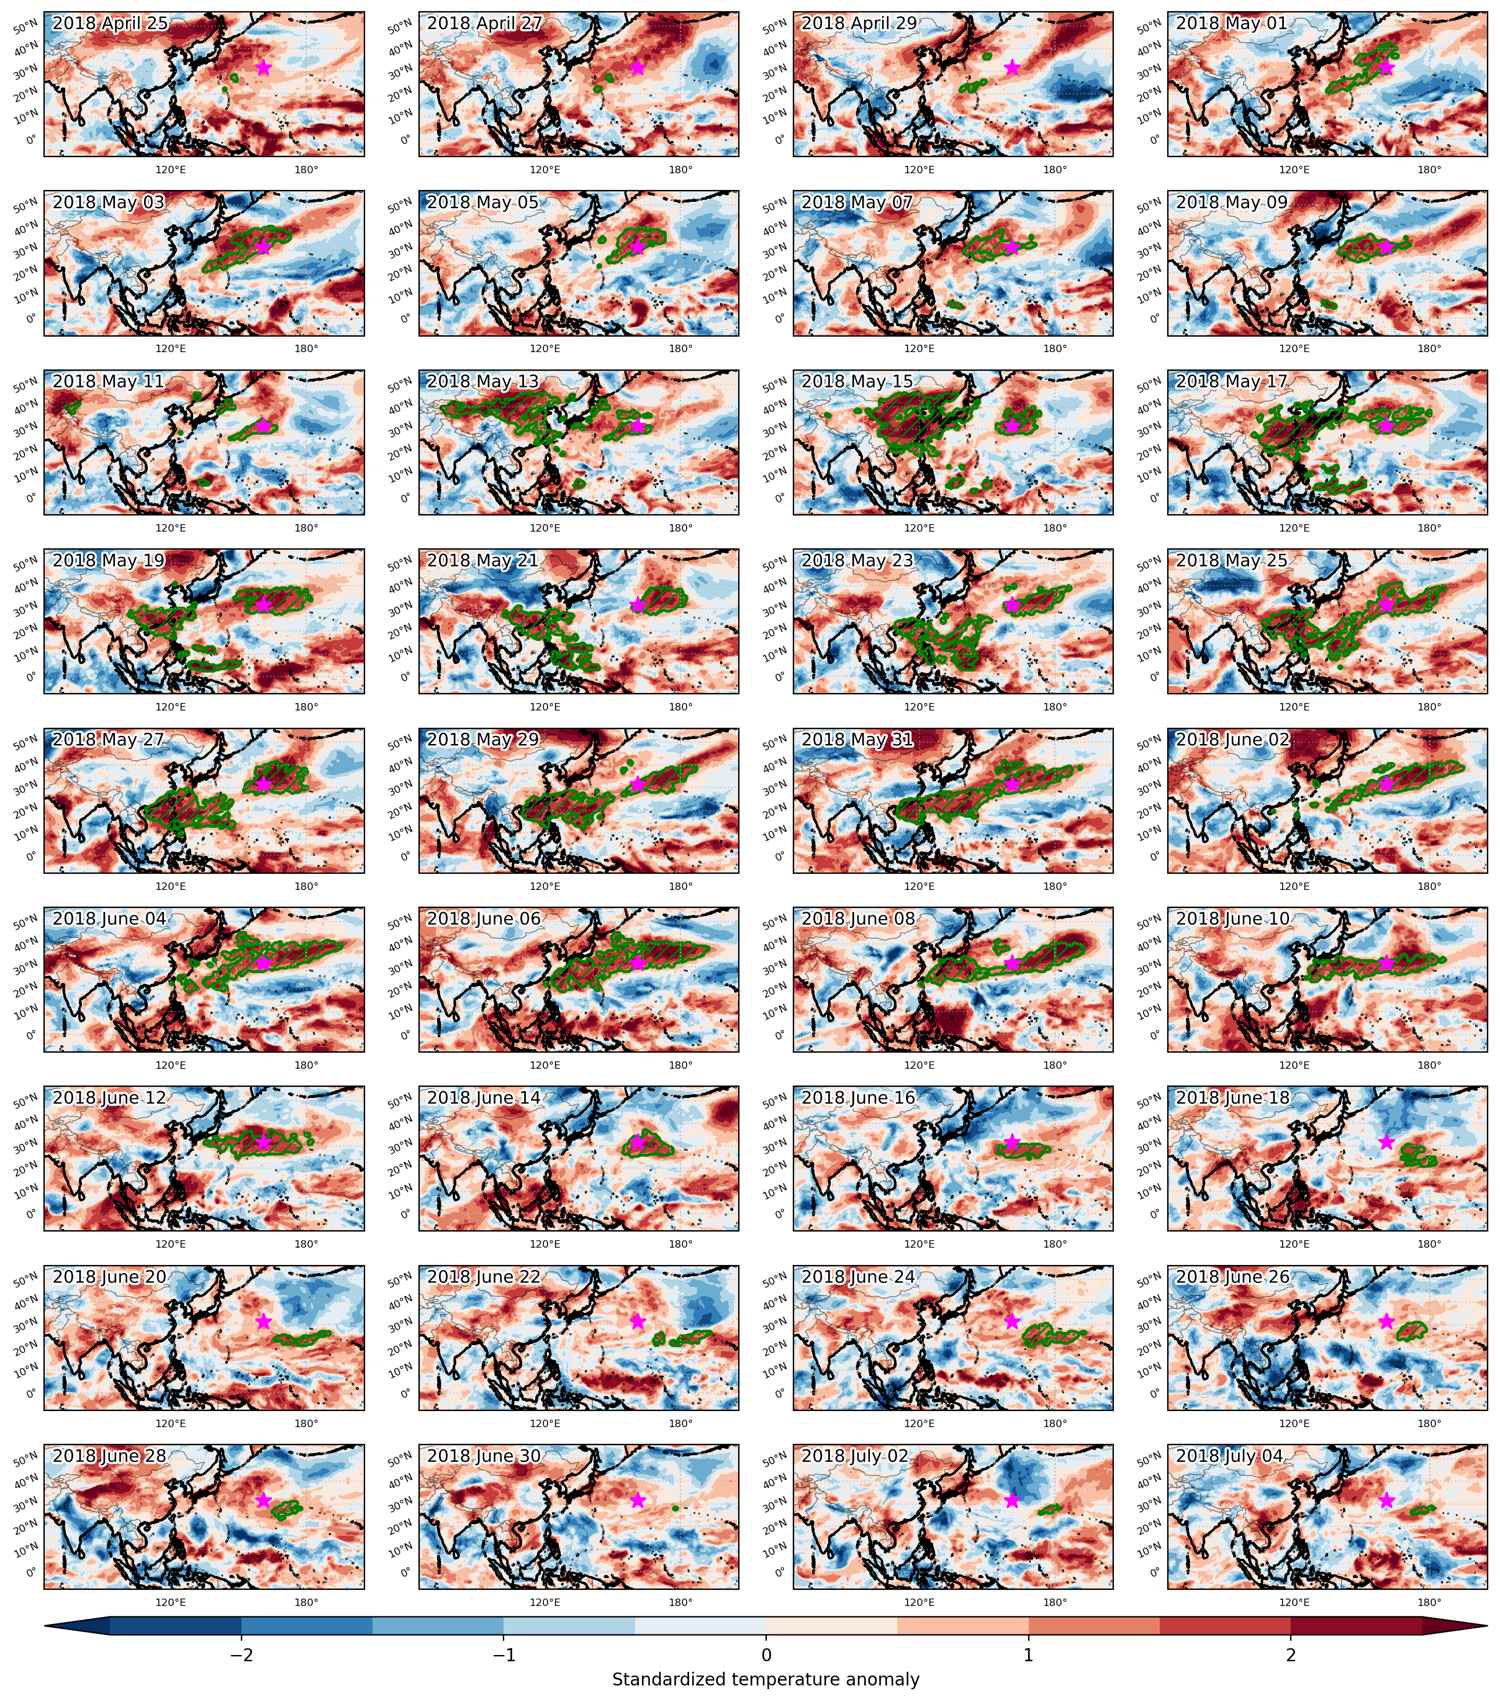
Heat wave occuring from April 25 2018 to July 05 2018 at 31.5°N 161.0°E

Download data: JSON

Event type: Heat wave

Countries affected (identified with ArcGIS Online; provided only for geographical reference):

  • China
  • Japan
  • Mongolia
  • North Korea
  • Philippines
  • Russian Federation
  • South Korea
  • Vietnam

Duration: 72 days

Time span: April 25 2018 to July 05 2018

Statistics over entire affected area:

  • Mean temperature anomaly: 2.9 °C
  • Mean temperature: 24.3 °C
  • Maximum temperature anomaly: 16.1 °C
  • Maximum temperature: 33.6 °C

Event center: 31.5°N 161.0°E

Area affected: 20452458 km$^2$


Fig. 1: Map of most extreme temperature anomalies (standardized) experienced during the event. The purple star indicates the center of the extreme event. Green hatching illustrates all areas under the effect of extremes at some time during the event.


Fig. 2: Evolution of temperature at the center of the event. The climatological percentile distribution is illustrated with color shadings.


Fig. 3: Maps illustrating the evolution of standardized temperature anomalies during the event.

Event ID: Heat_wave_2018-Apr-25_to_2018-Jul-05_161.0_31.5

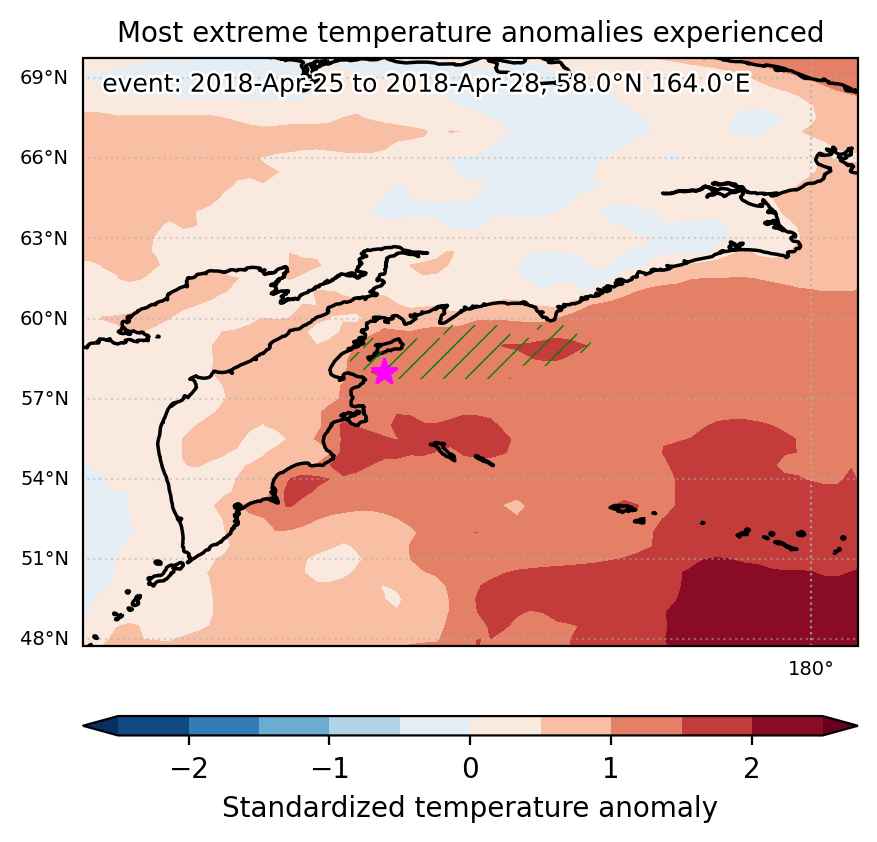
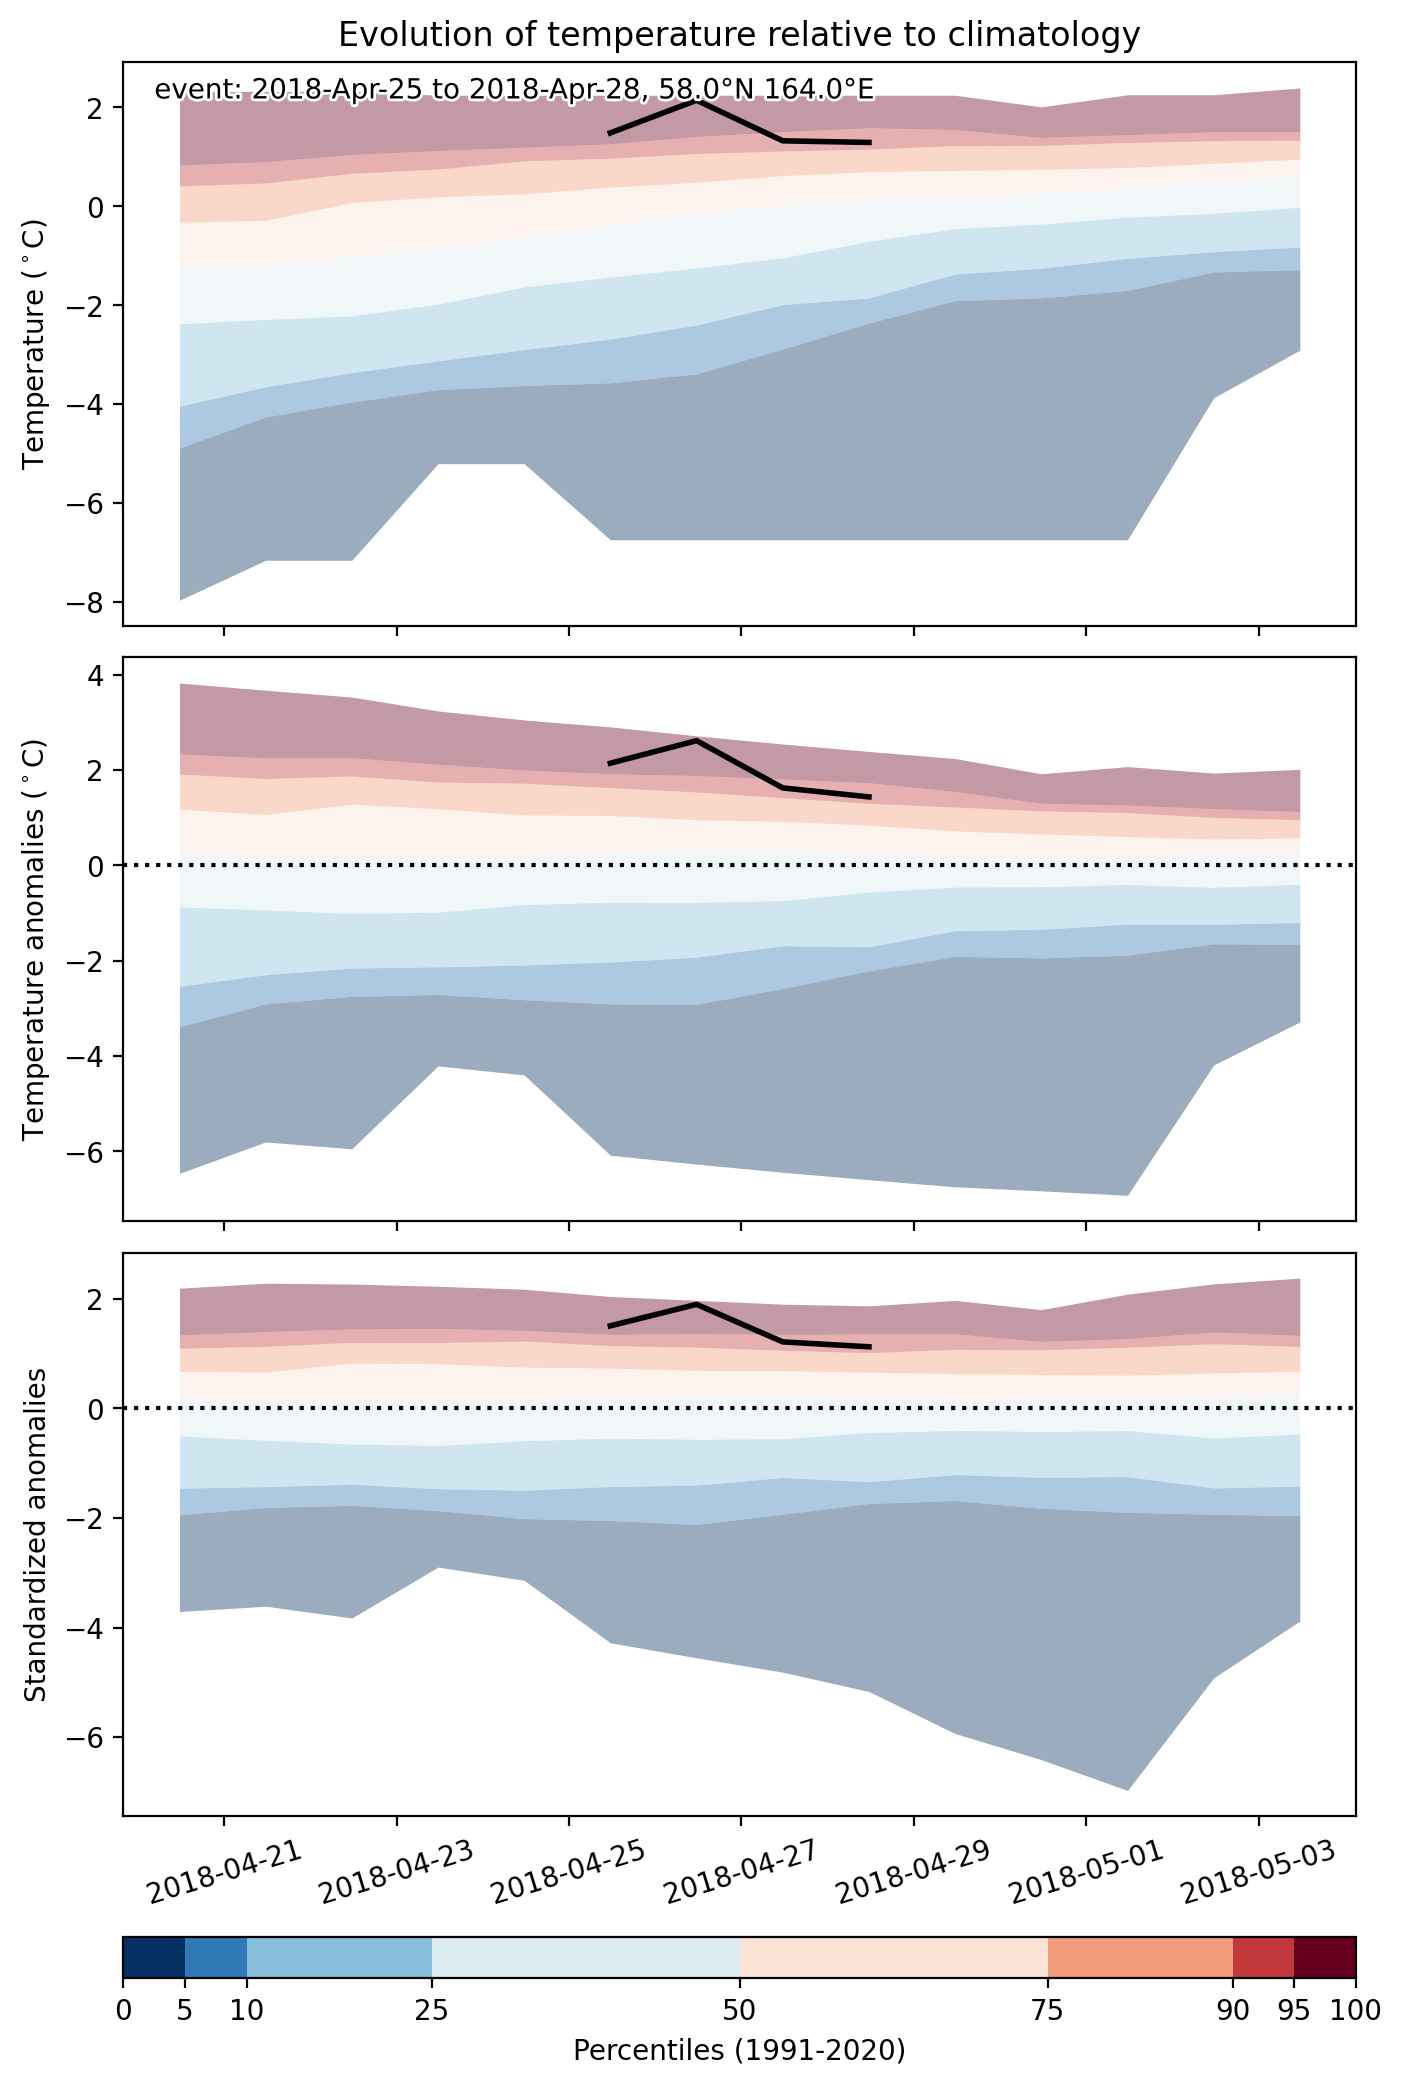
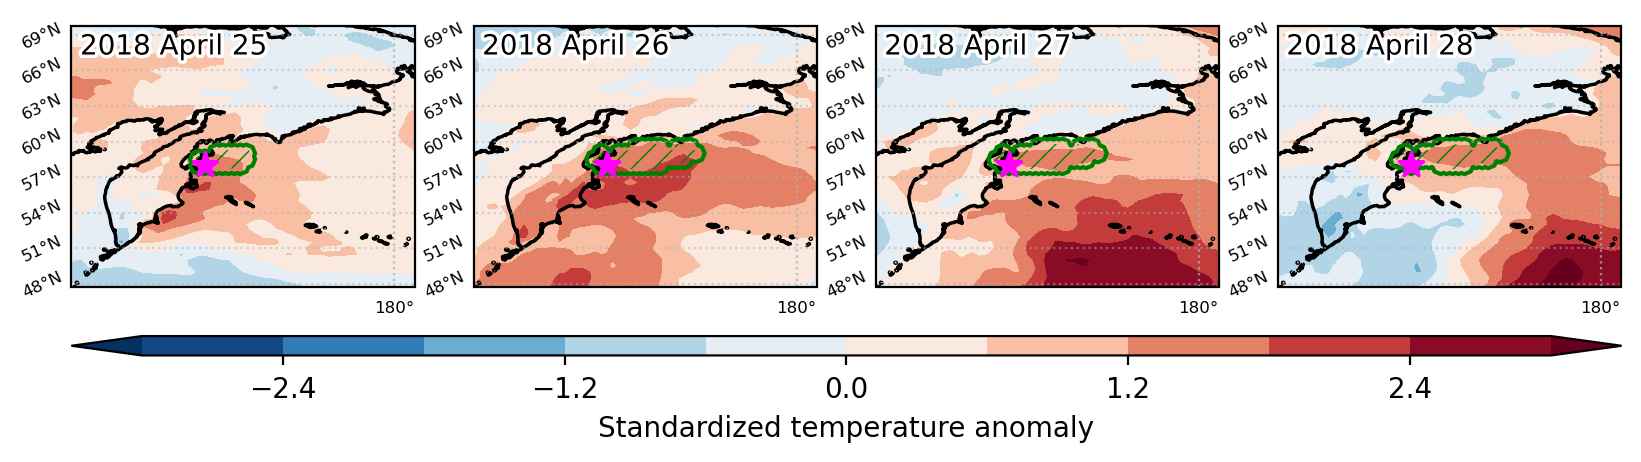
Heat wave occuring from April 25 2018 to April 28 2018 at 58.0°N 164.0°E

Download data: JSON

Event type: Heat wave

Countries affected (identified with ArcGIS Online; provided only for geographical reference):

  • Russian Federation

Duration: 4 days

Time span: April 25 2018 to April 28 2018

Statistics over entire affected area:

  • Mean temperature anomaly: 2.0 °C
  • Mean temperature: 1.6 °C
  • Maximum temperature anomaly: 2.6 °C
  • Maximum temperature: 2.5 °C

Event center: 58.0°N 164.0°E

Area affected: 80290 km$^2$


Fig. 1: Map of most extreme temperature anomalies (standardized) experienced during the event. The purple star indicates the center of the extreme event. Green hatching illustrates all areas under the effect of extremes at some time during the event.


Fig. 2: Evolution of temperature at the center of the event. The climatological percentile distribution is illustrated with color shadings.


Fig. 3: Maps illustrating the evolution of standardized temperature anomalies during the event.

Event ID: Heat_wave_2018-Apr-25_to_2018-Apr-28_164.0_58.0

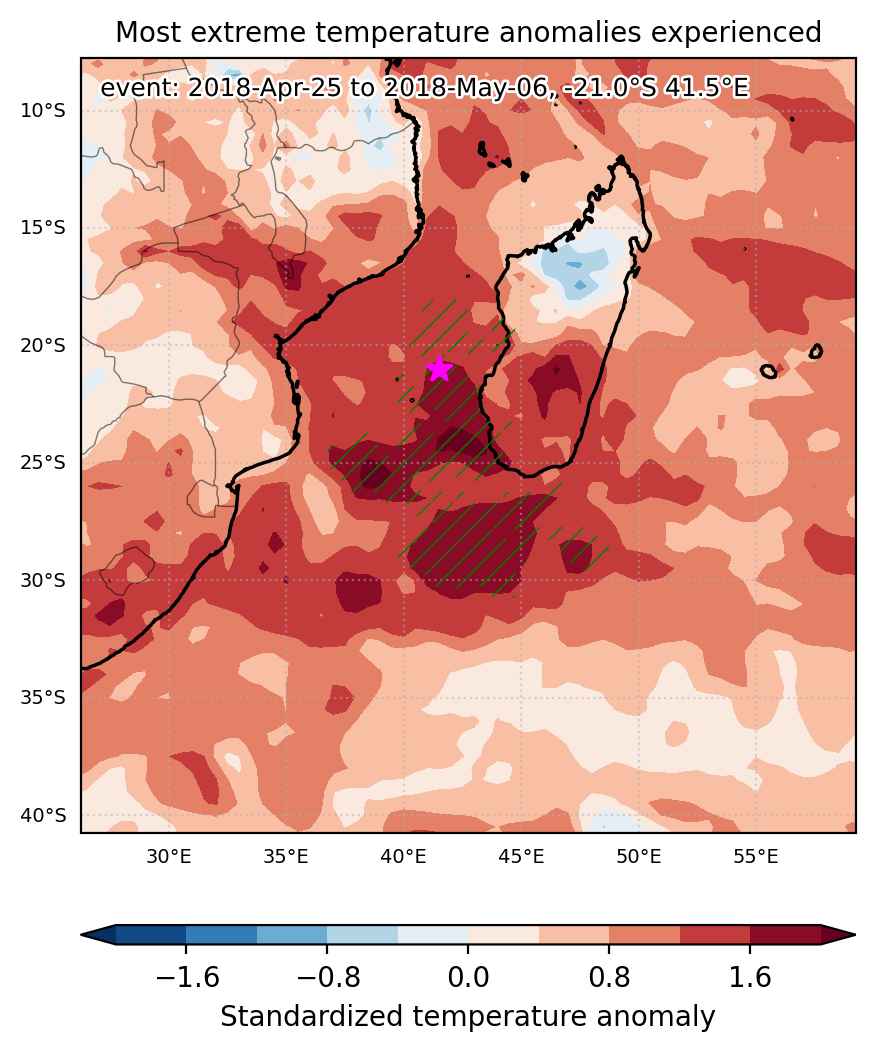
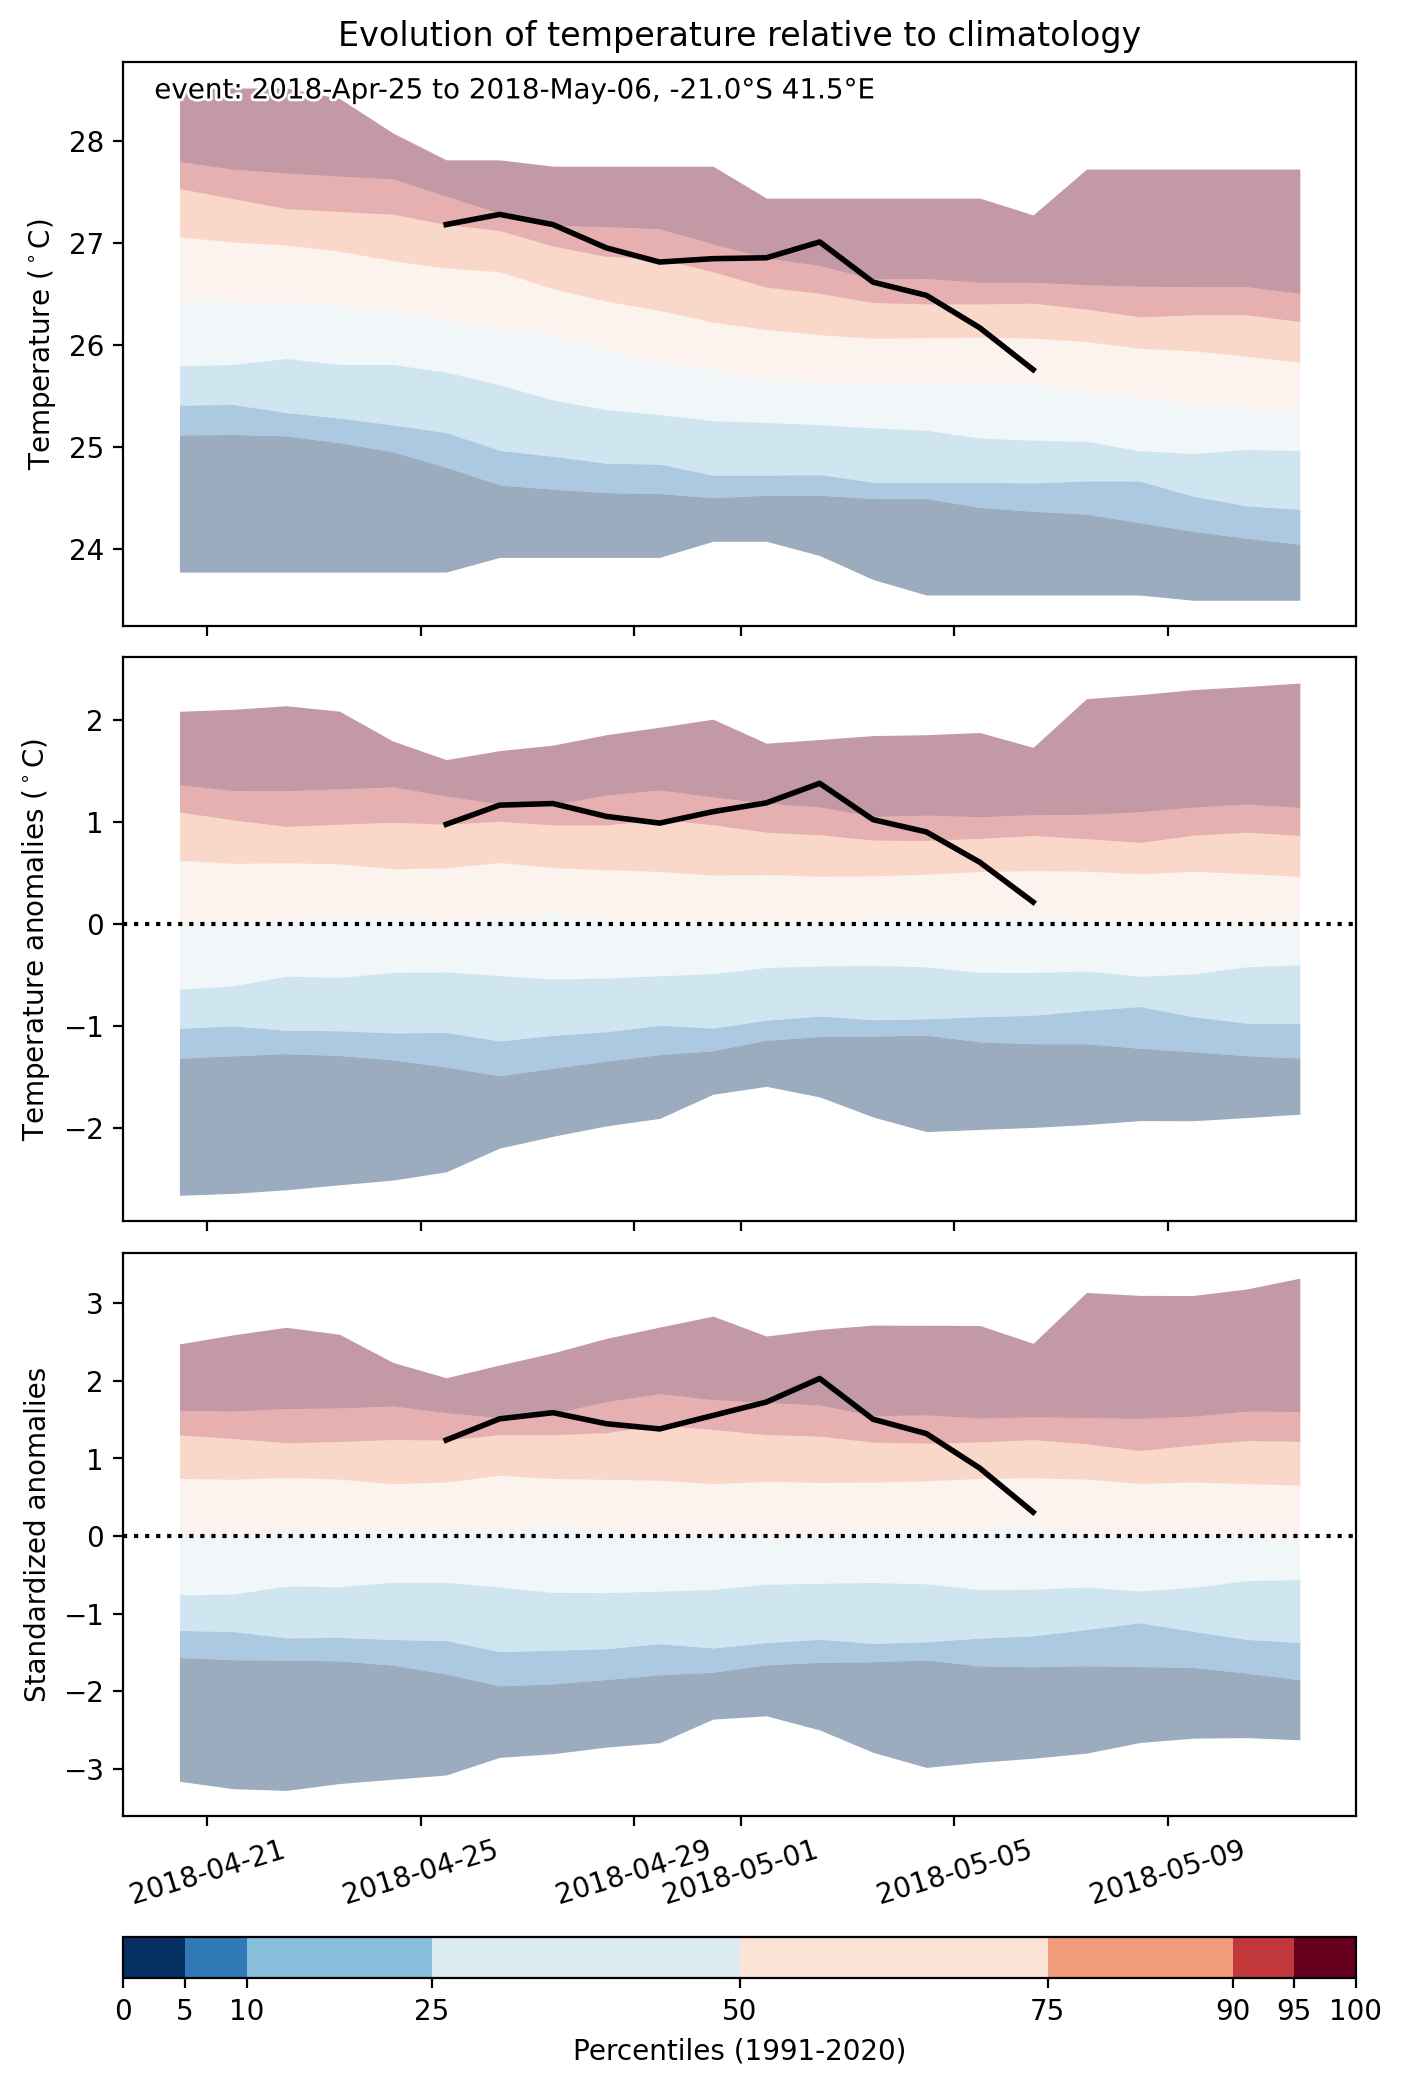
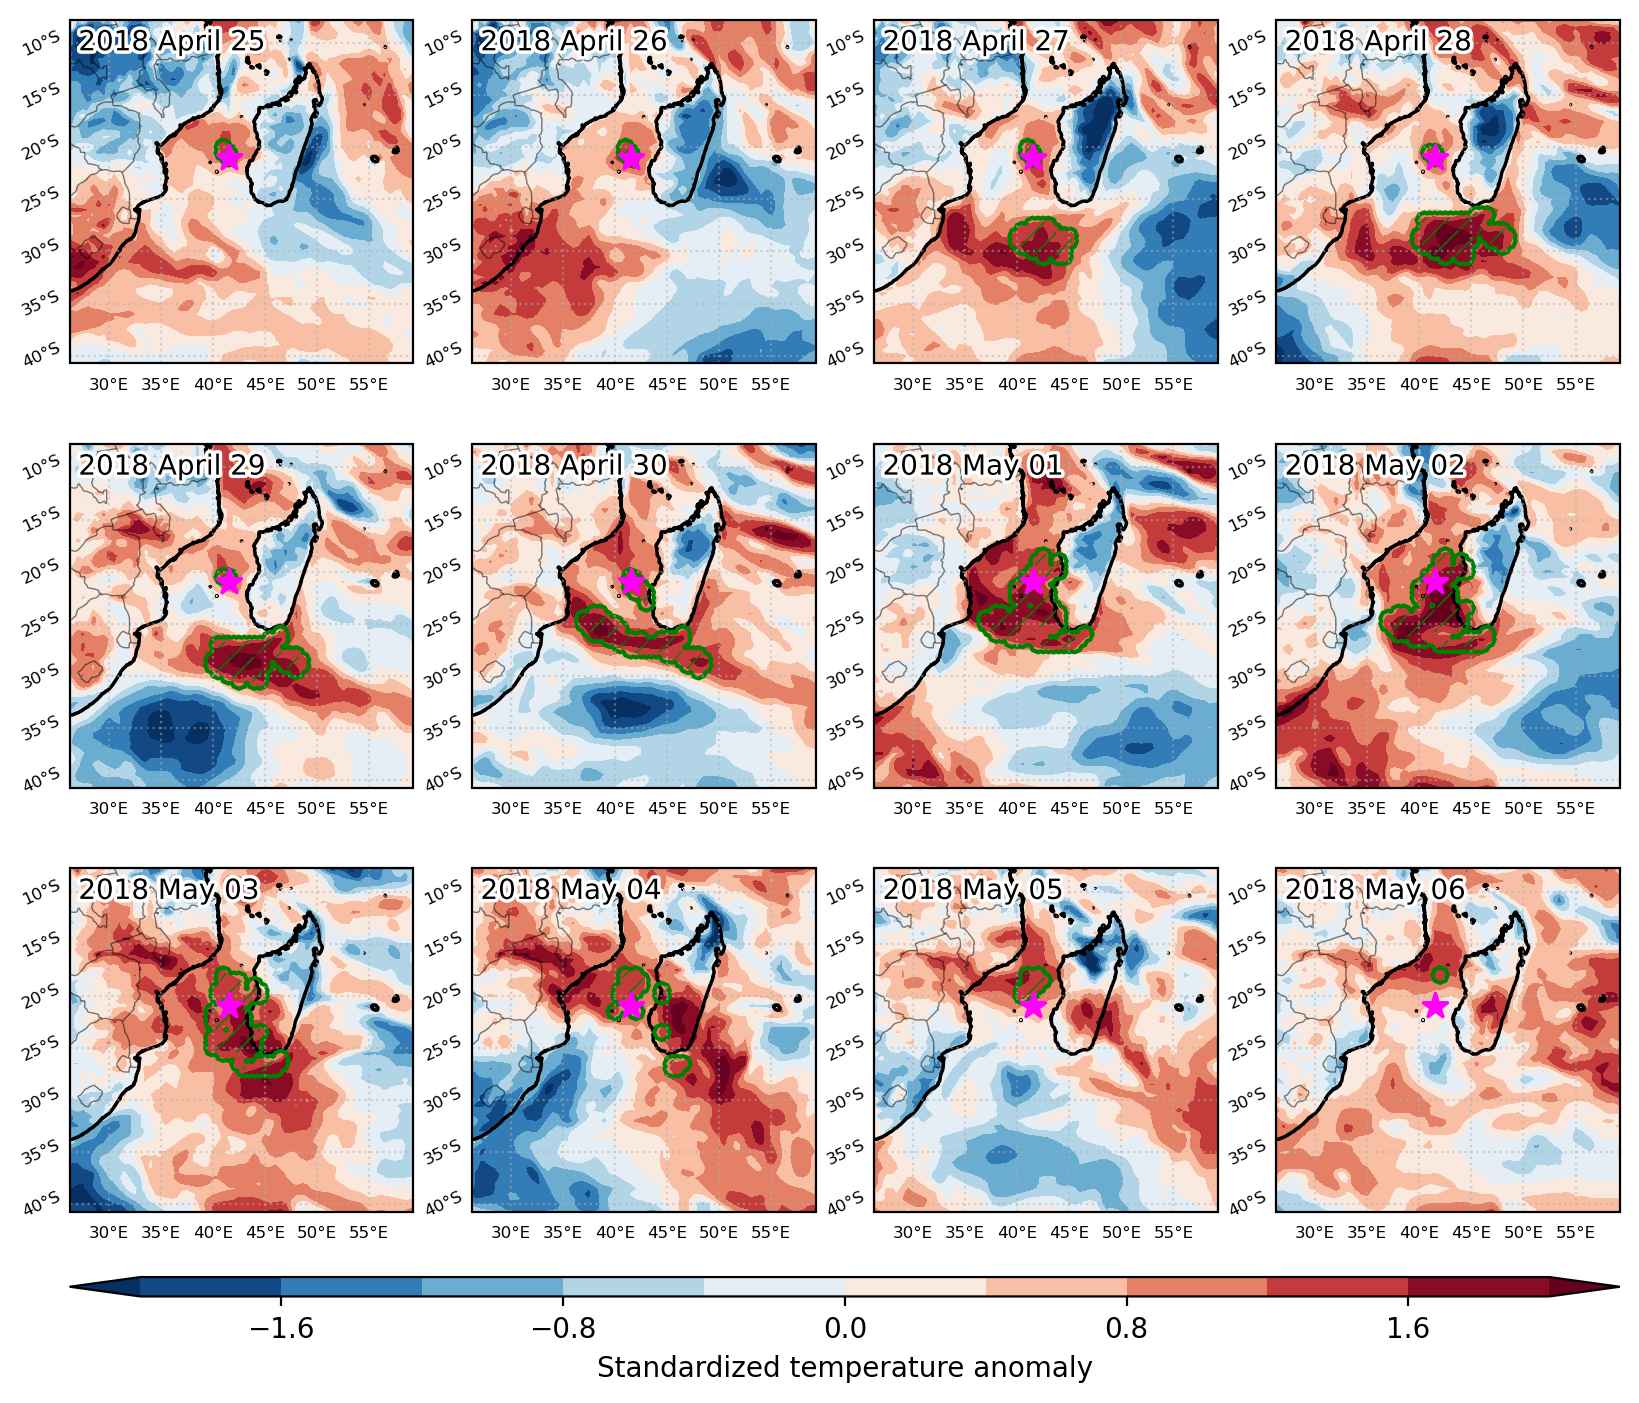
Heat wave occuring from April 25 2018 to May 06 2018 at -21.0°S 41.5°E

Download data: JSON

Event type: Heat wave

Countries affected (identified with ArcGIS Online; provided only for geographical reference):

  • Madagascar

Duration: 12 days

Time span: April 25 2018 to May 06 2018

Statistics over entire affected area:

  • Mean temperature anomaly: 1.6 °C
  • Mean temperature: 25.5 °C
  • Maximum temperature anomaly: 2.7 °C
  • Maximum temperature: 28.4 °C

Event center: -21.0°S 41.5°E

Area affected: 602684 km$^2$


Fig. 1: Map of most extreme temperature anomalies (standardized) experienced during the event. The purple star indicates the center of the extreme event. Green hatching illustrates all areas under the effect of extremes at some time during the event.


Fig. 2: Evolution of temperature at the center of the event. The climatological percentile distribution is illustrated with color shadings.


Fig. 3: Maps illustrating the evolution of standardized temperature anomalies during the event.

Event ID: Heat_wave_2018-Apr-25_to_2018-May-06_41.5_-21.0

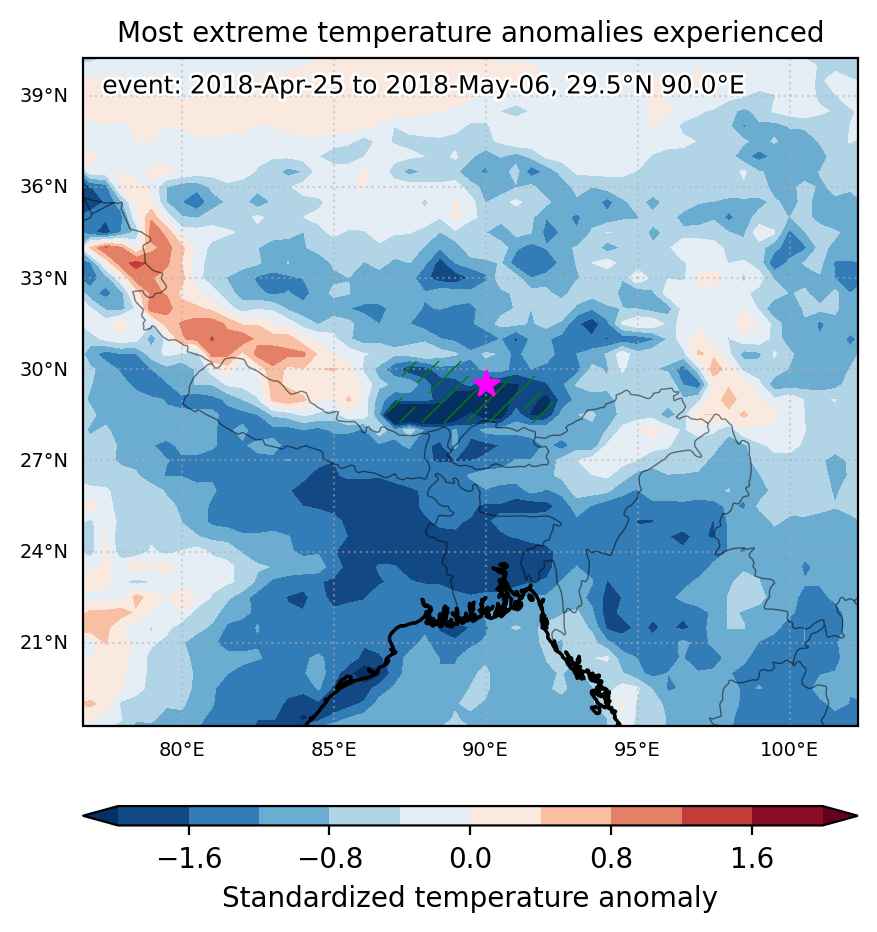
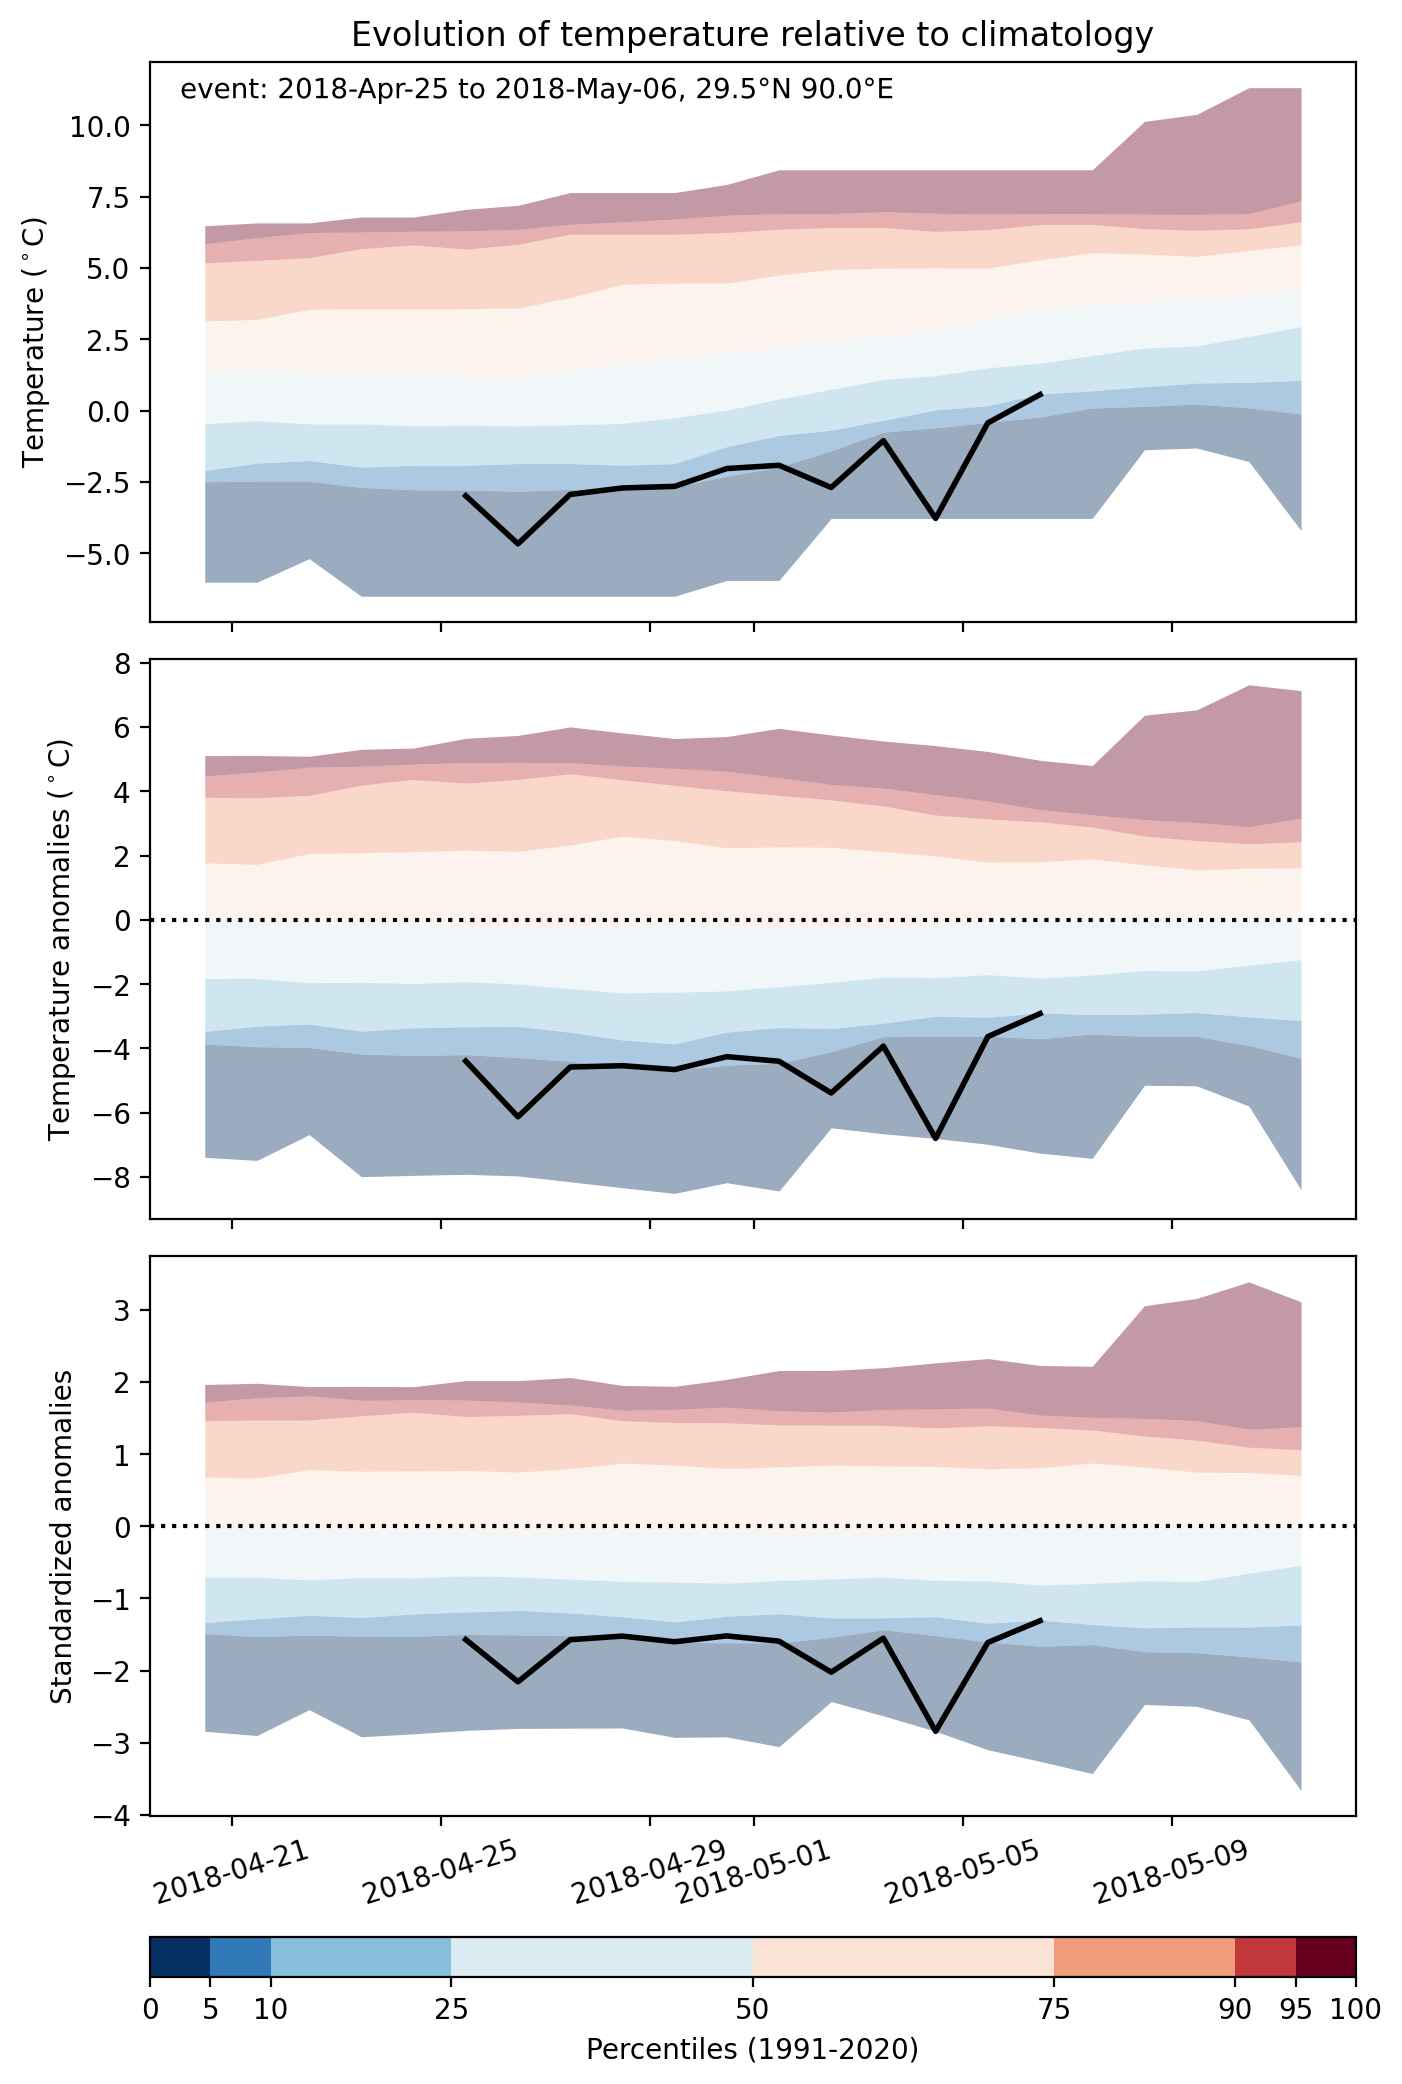
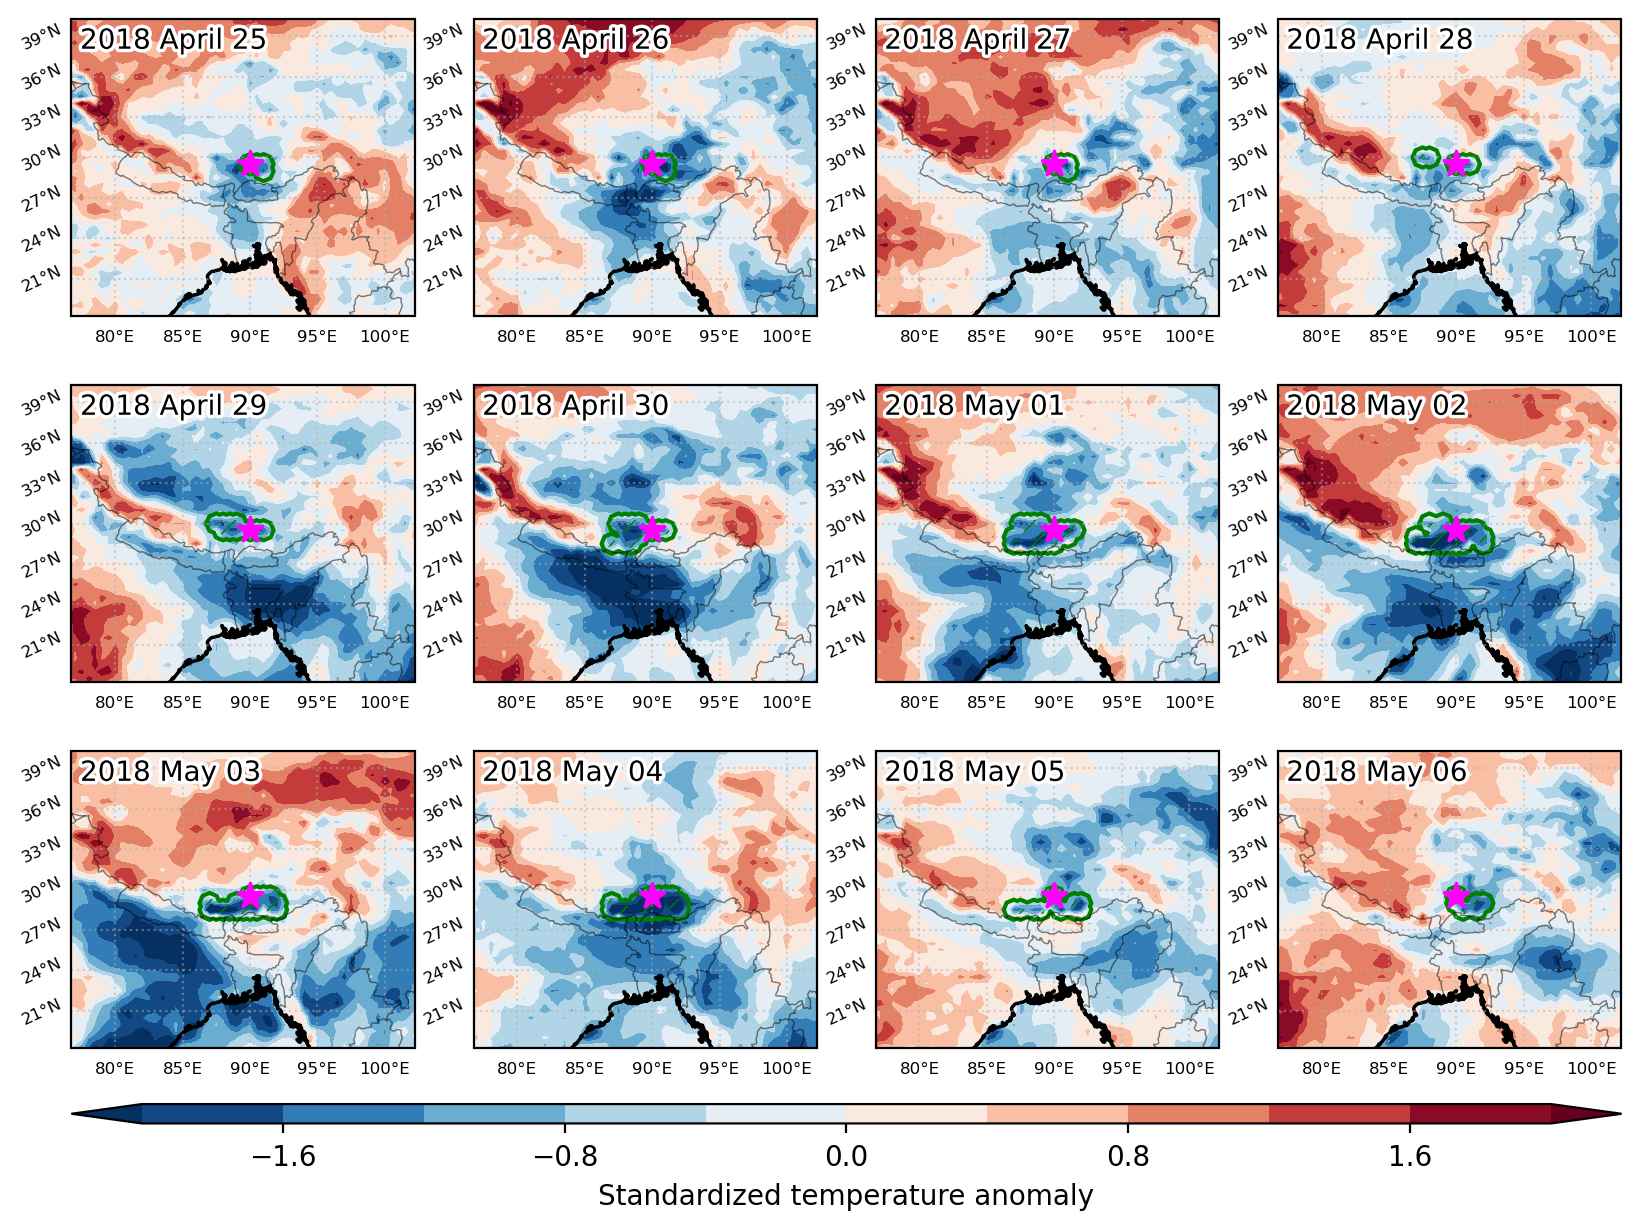
Cold spell occuring from April 25 2018 to May 06 2018 at 29.5°N 90.0°E

Download data: JSON

Event type: Cold spell

Countries affected (identified with ArcGIS Online; provided only for geographical reference):

  • China

Duration: 12 days

Time span: April 25 2018 to May 06 2018

Statistics over entire affected area:

  • Mean temperature anomaly: -4.7 °C
  • Mean temperature: -2.3 °C
  • Minimum temperature anomaly: -9.6 °C
  • Minimum temperature: -7.3 °C

Event center: 29.5°N 90.0°E

Area affected: 83727 km$^2$


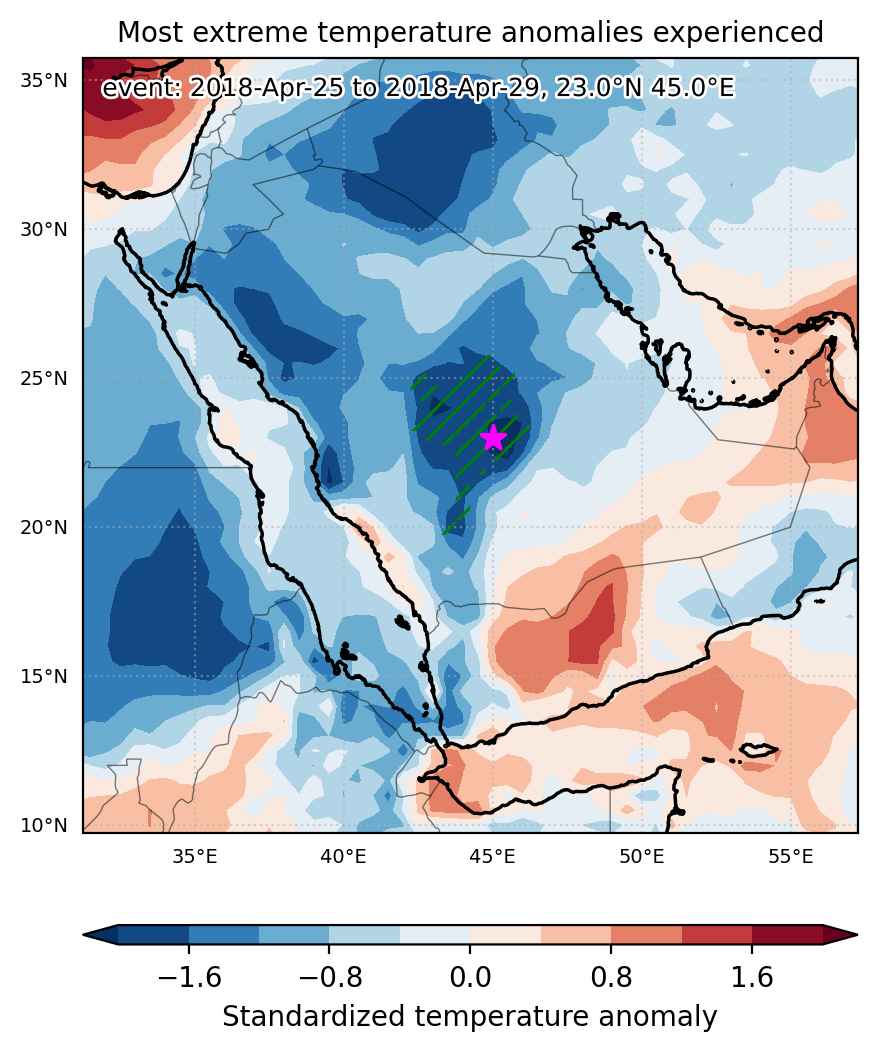
Fig. 1: Map of most extreme temperature anomalies (standardized) experienced during the event. The purple star indicates the center of the extreme event. Green hatching illustrates all areas under the effect of extremes at some time during the event.


Fig. 2: Evolution of temperature at the center of the event. The climatological percentile distribution is illustrated with color shadings.


Fig. 3: Maps illustrating the evolution of standardized temperature anomalies during the event.

Event ID: Cold_spell_2018-Apr-25_to_2018-May-06_90.0_29.5

Cold spell occuring from April 25 2018 to April 29 2018 at 23.0°N 45.0°E

Download data: JSON

Event type: Cold spell

Countries affected (identified with ArcGIS Online; provided only for geographical reference):

  • Saudi Arabia

Duration: 5 days

Time span: April 25 2018 to April 29 2018

Statistics over entire affected area:

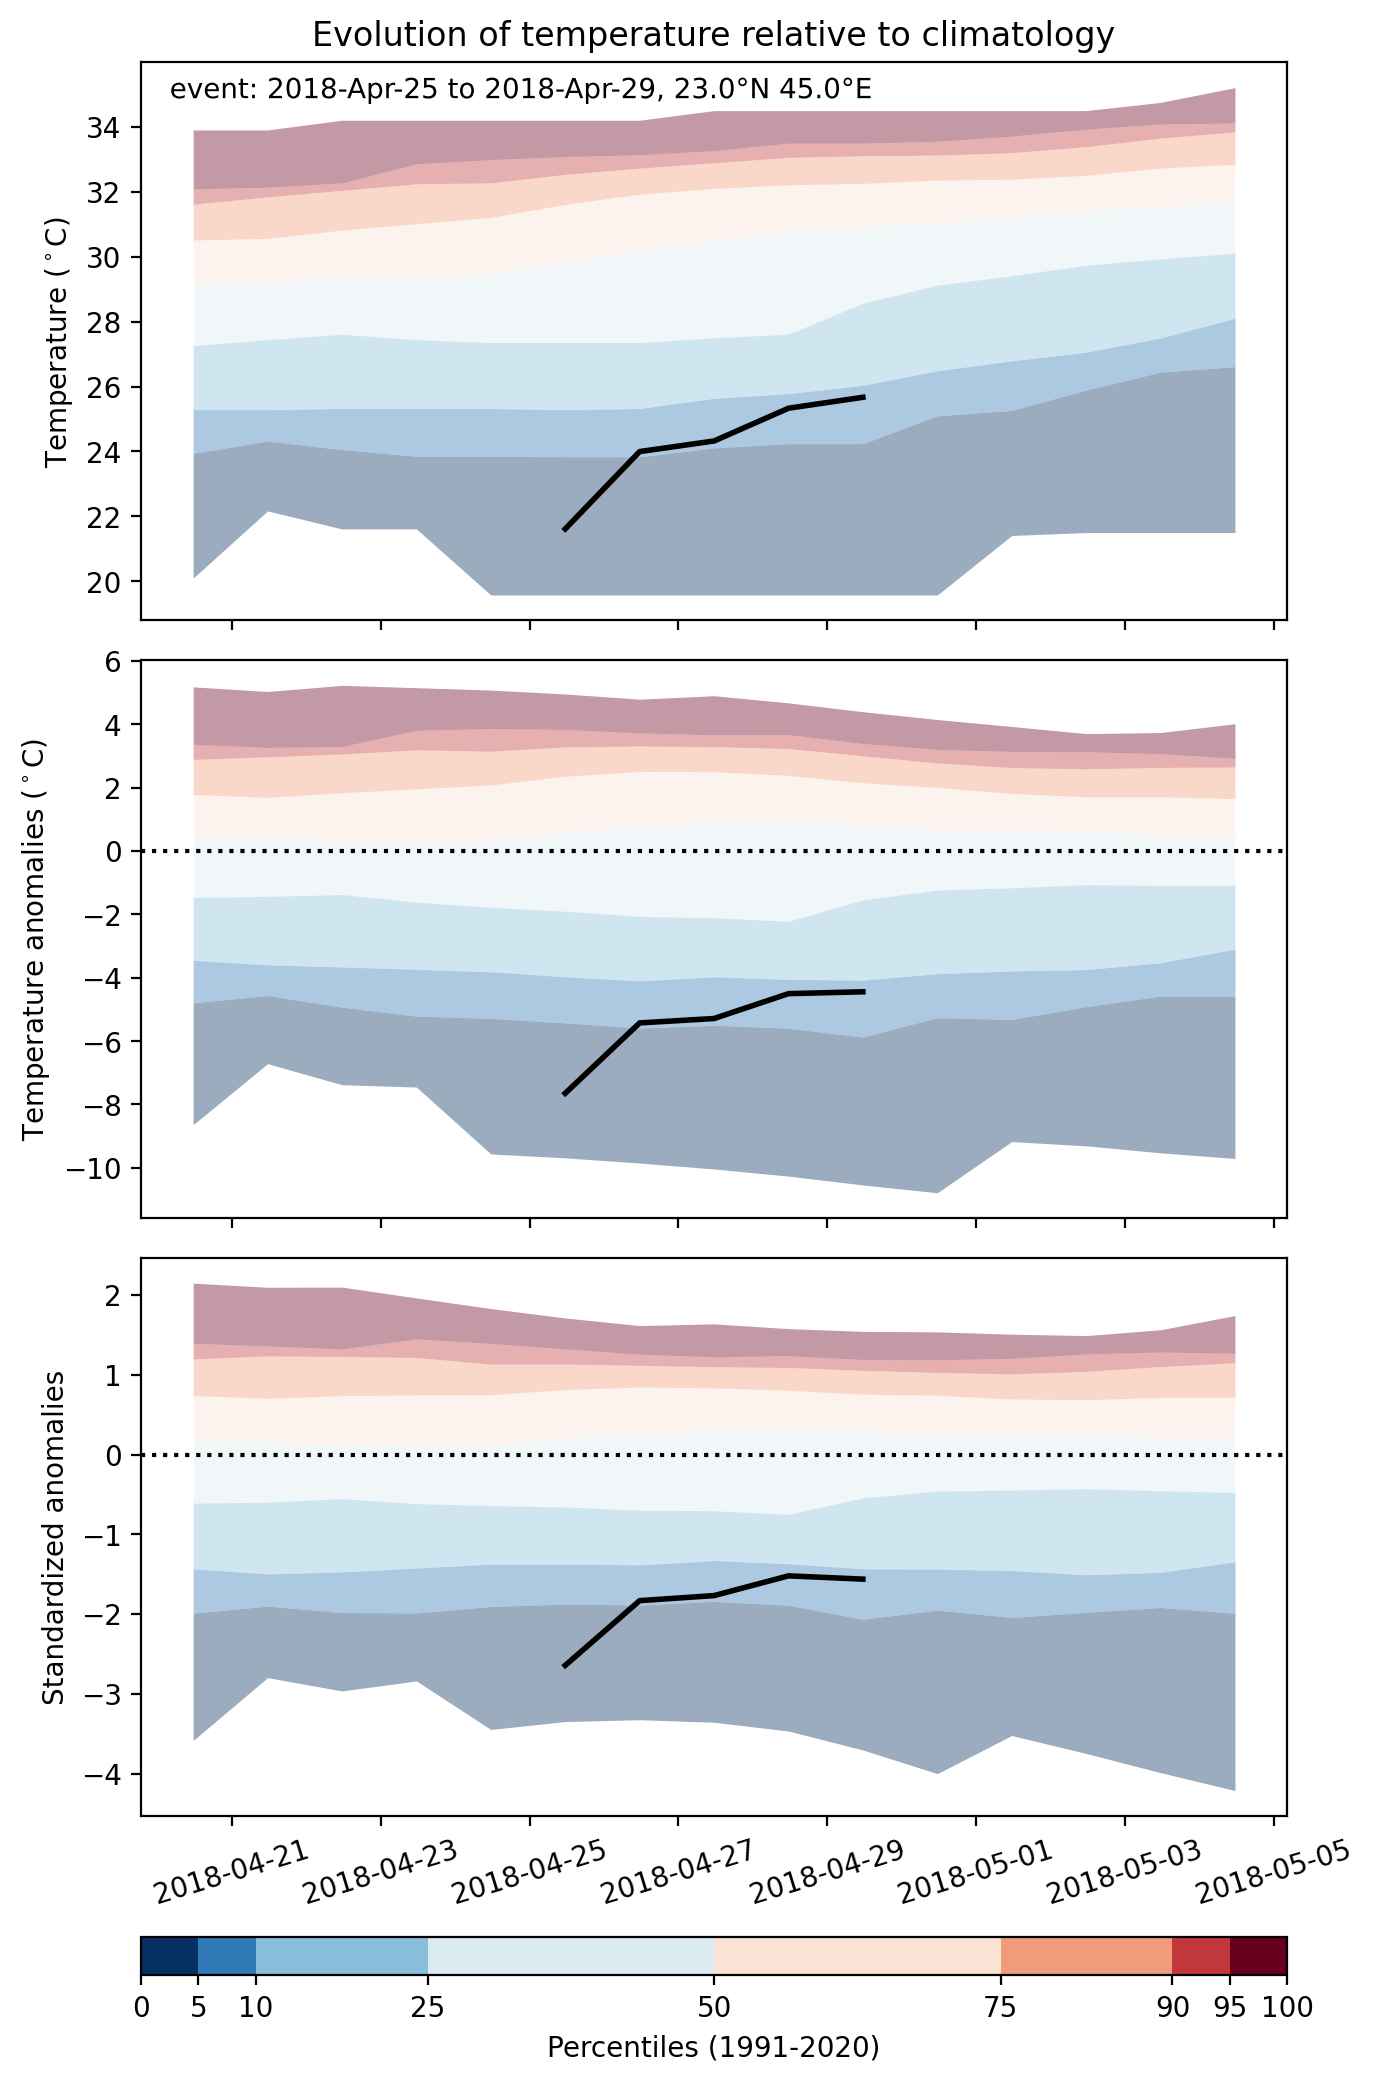
  • Mean temperature anomaly: -5.3 °C
  • Mean temperature: 23.1 °C
  • Minimum temperature anomaly: -8.0 °C
  • Minimum temperature: 20.7 °C

Event center: 23.0°N 45.0°E

Area affected: 121895 km$^2$


Fig. 1: Map of most extreme temperature anomalies (standardized) experienced during the event. The purple star indicates the center of the extreme event. Green hatching illustrates all areas under the effect of extremes at some time during the event.


Fig. 2: Evolution of temperature at the center of the event. The climatological percentile distribution is illustrated with color shadings.


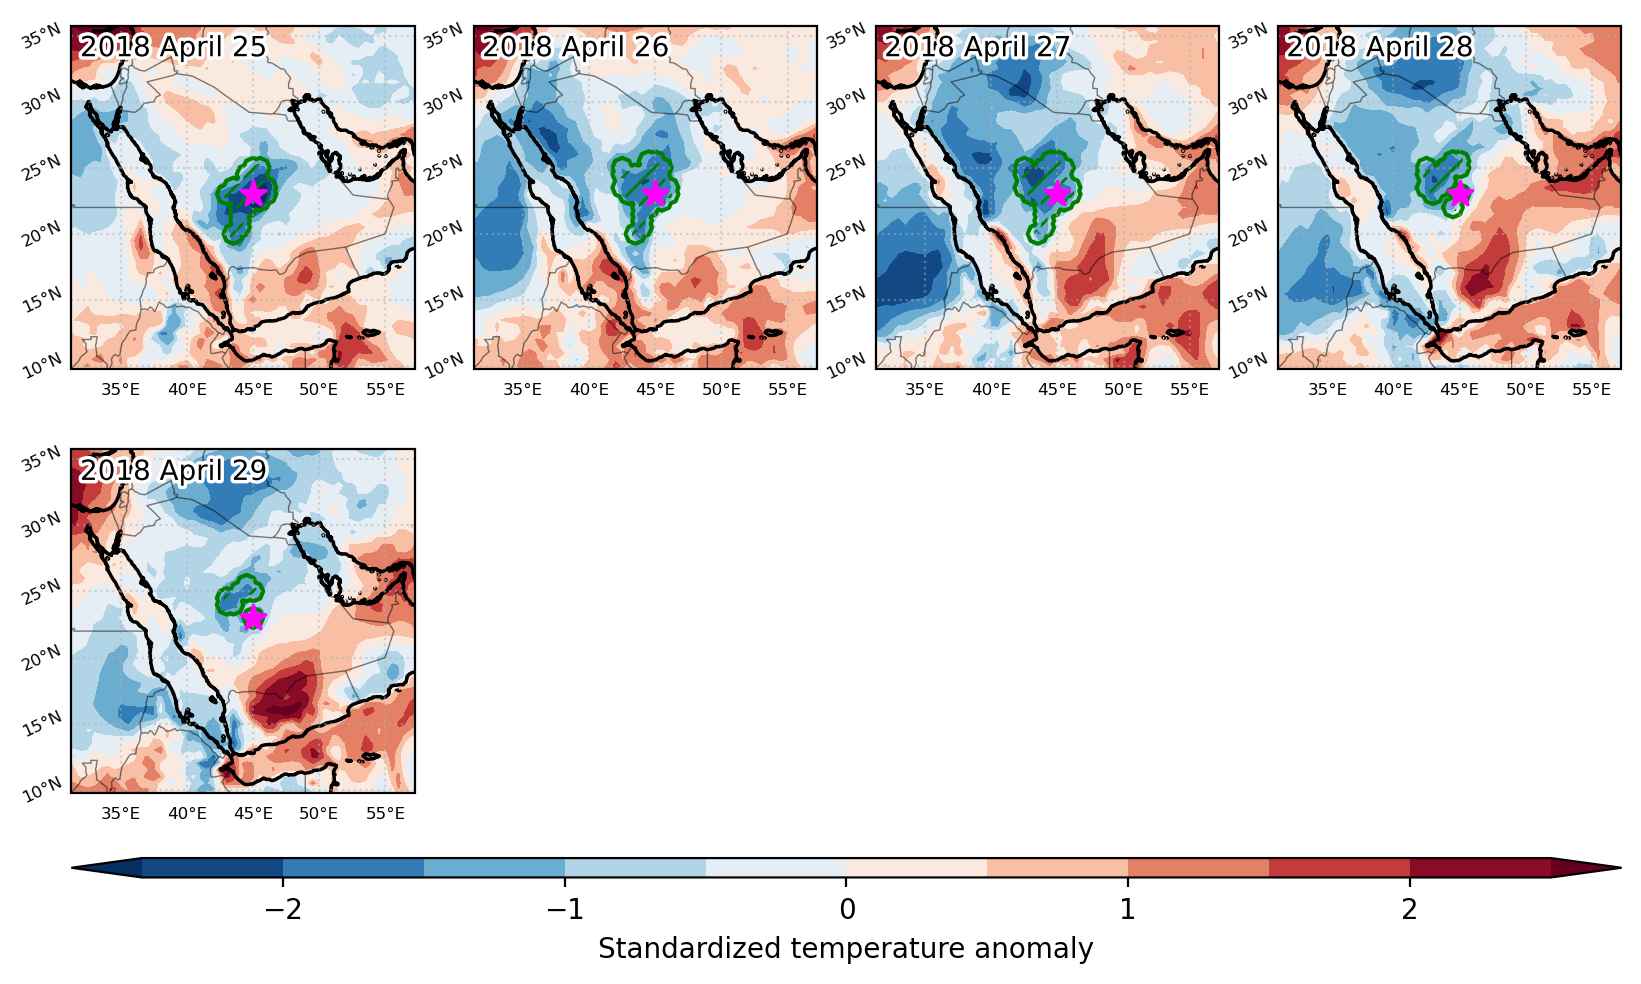
Fig. 3: Maps illustrating the evolution of standardized temperature anomalies during the event.

Event ID: Cold_spell_2018-Apr-25_to_2018-Apr-29_45.0_23.0

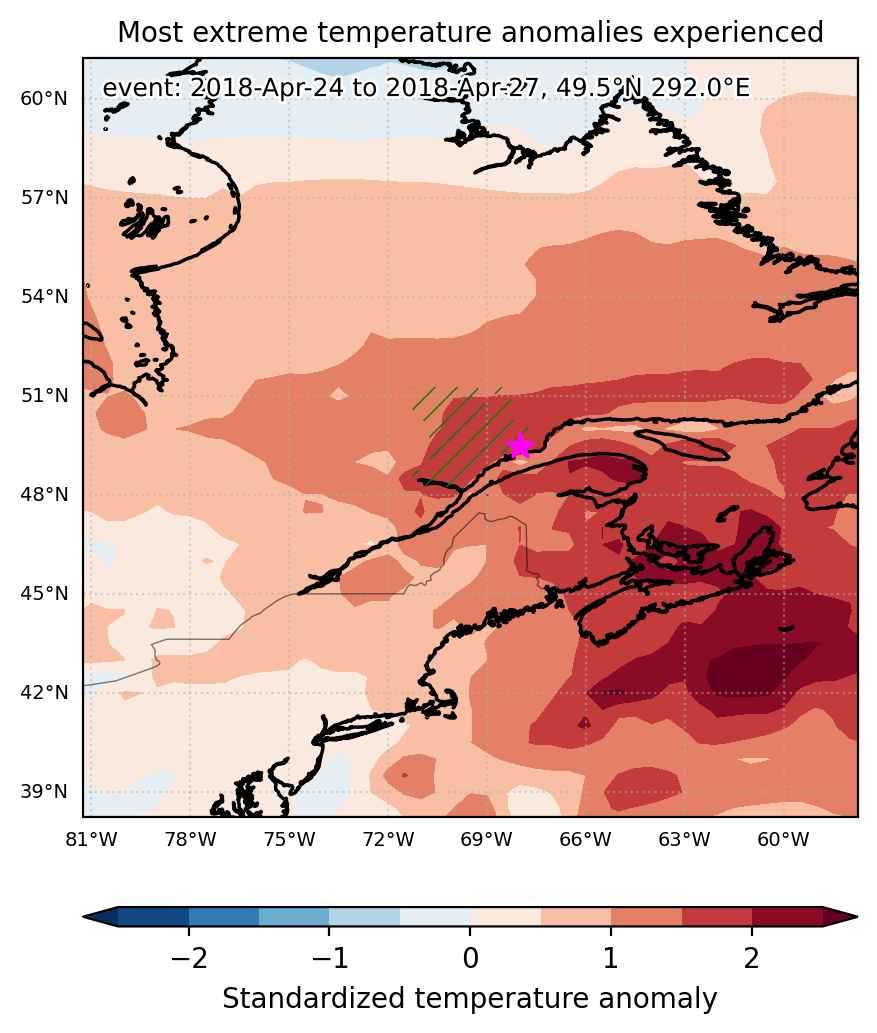
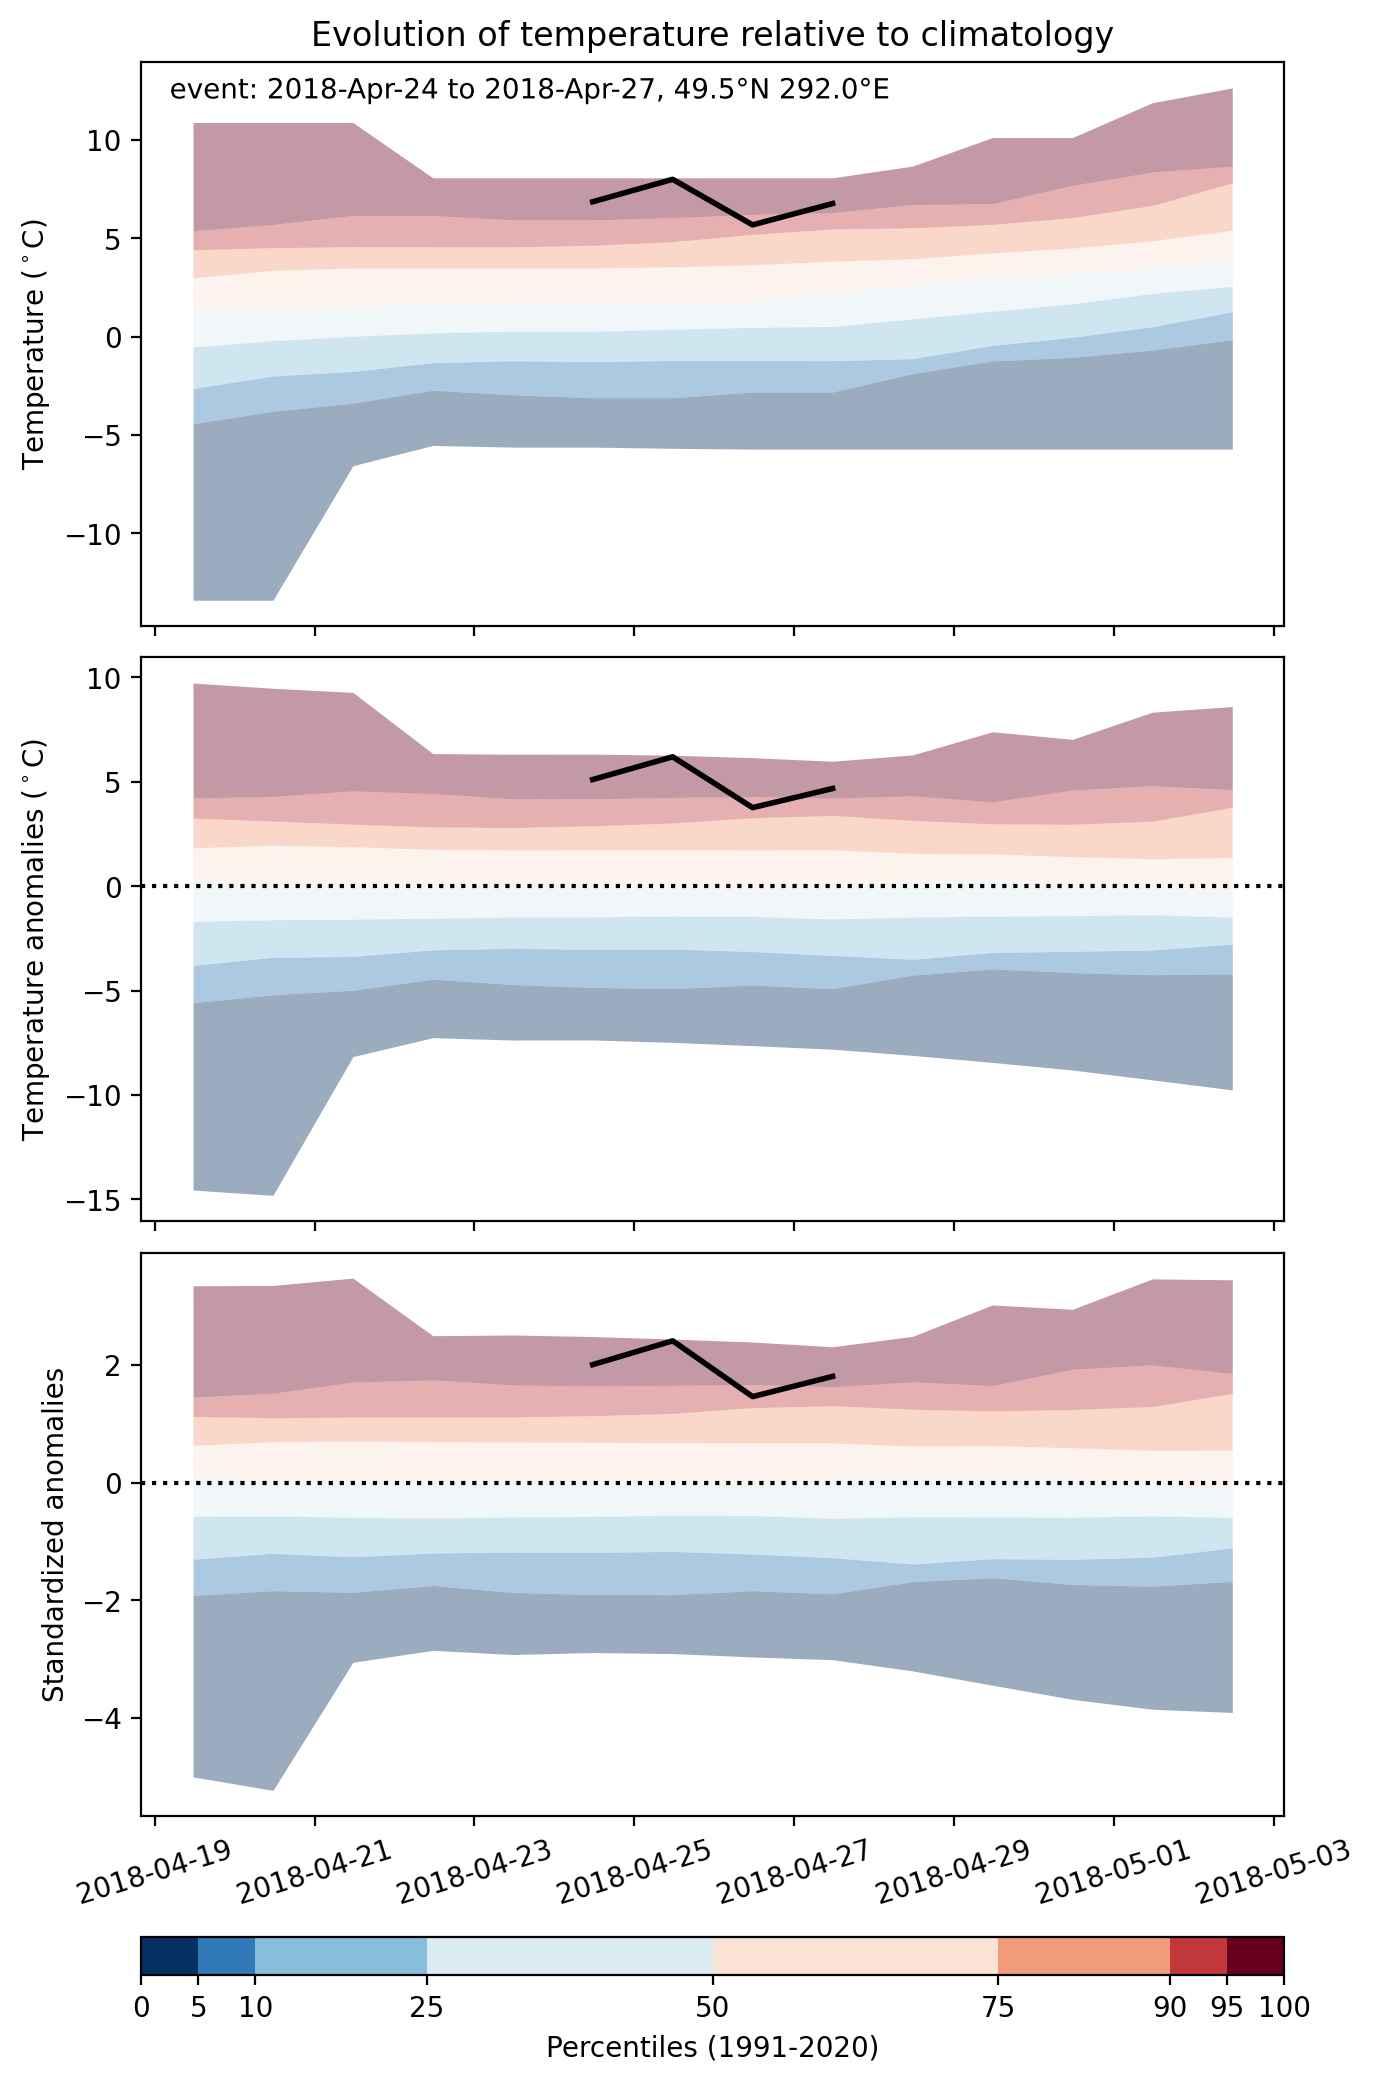
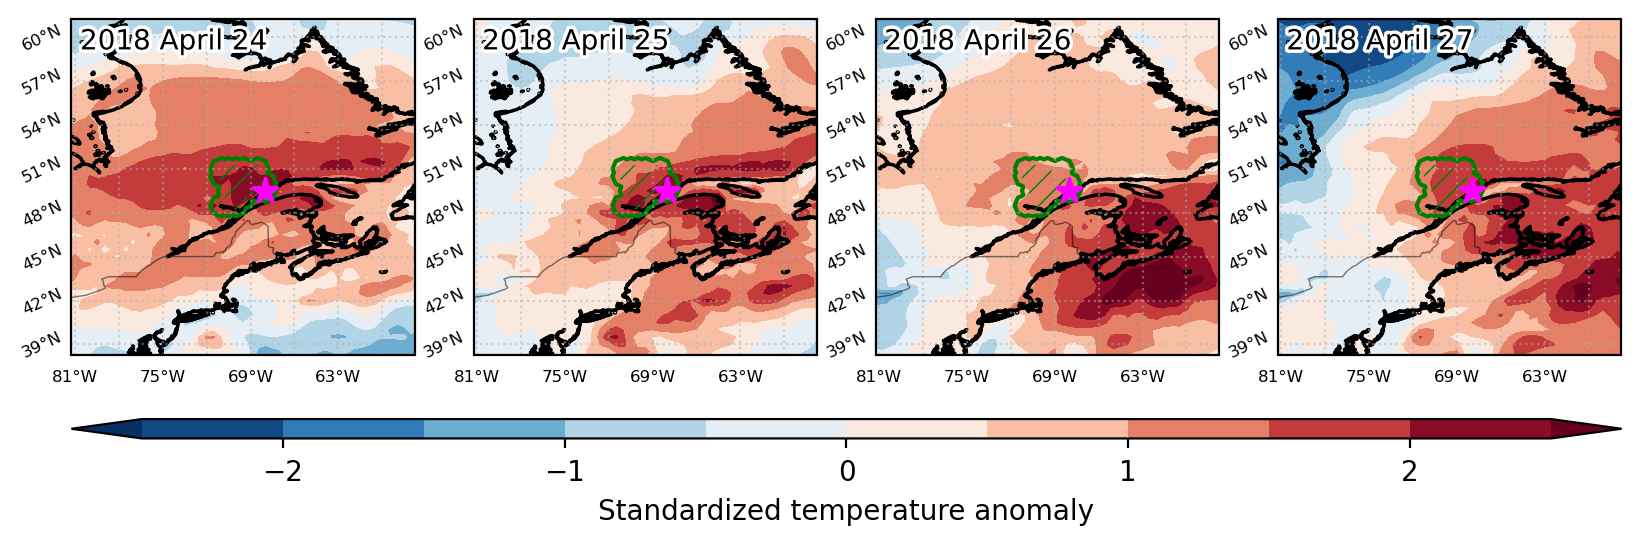
Heat wave occuring from April 24 2018 to April 27 2018 at 49.5°N 292.0°E

Download data: JSON

Event type: Heat wave

Countries affected (identified with ArcGIS Online; provided only for geographical reference):

  • Canada

Duration: 4 days

Time span: April 24 2018 to April 27 2018

Statistics over entire affected area:

  • Mean temperature anomaly: 5.2 °C
  • Mean temperature: 6.3 °C
  • Maximum temperature anomaly: 7.3 °C
  • Maximum temperature: 10.1 °C

Event center: 49.5°N 292.0°E

Area affected: 57718 km$^2$


Fig. 1: Map of most extreme temperature anomalies (standardized) experienced during the event. The purple star indicates the center of the extreme event. Green hatching illustrates all areas under the effect of extremes at some time during the event.


Fig. 2: Evolution of temperature at the center of the event. The climatological percentile distribution is illustrated with color shadings.


Fig. 3: Maps illustrating the evolution of standardized temperature anomalies during the event.

Event ID: Heat_wave_2018-Apr-24_to_2018-Apr-27_292.0_49.5

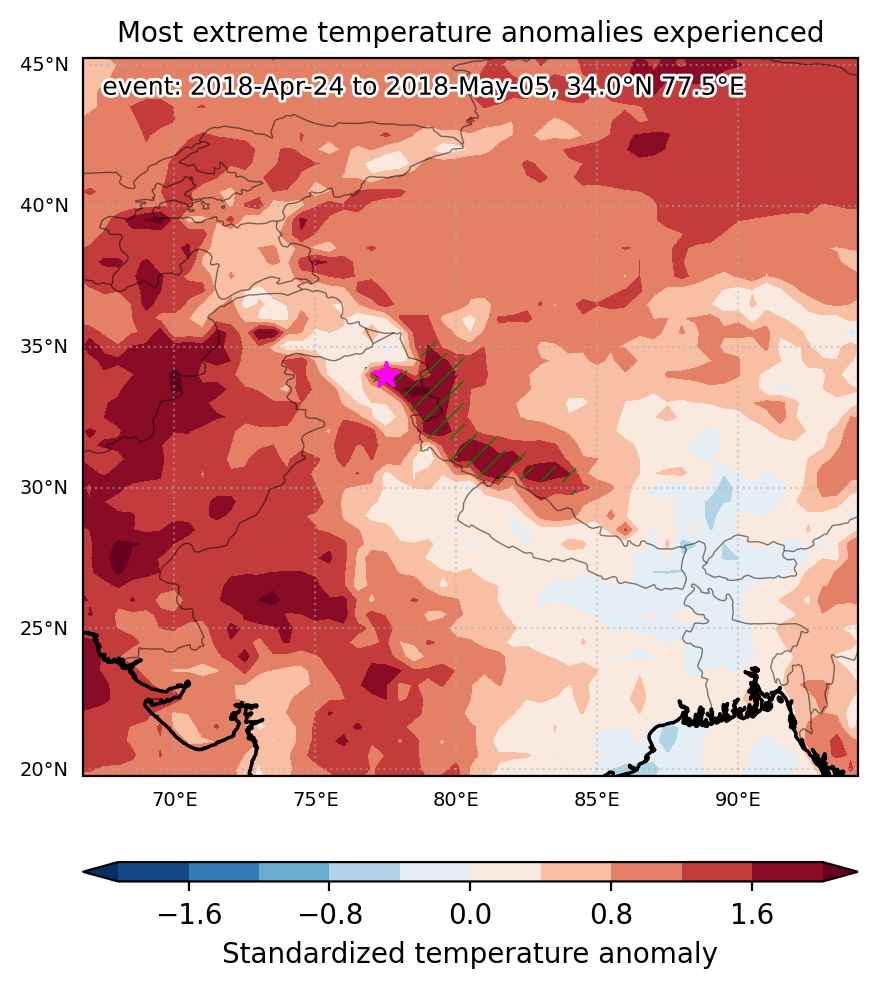
Heat wave occuring from April 24 2018 to May 05 2018 at 34.0°N 77.5°E

Download data: JSON

Event type: Heat wave

Countries affected (identified with ArcGIS Online; provided only for geographical reference):

  • China
  • India

Duration: 12 days

Time span: April 24 2018 to May 05 2018

Statistics over entire affected area:

  • Mean temperature anomaly: 4.4 °C
  • Mean temperature: -2.7 °C
  • Maximum temperature anomaly: 7.5 °C
  • Maximum temperature: 3.3 °C

Event center: 34.0°N 77.5°E

Area affected: 112211 km$^2$


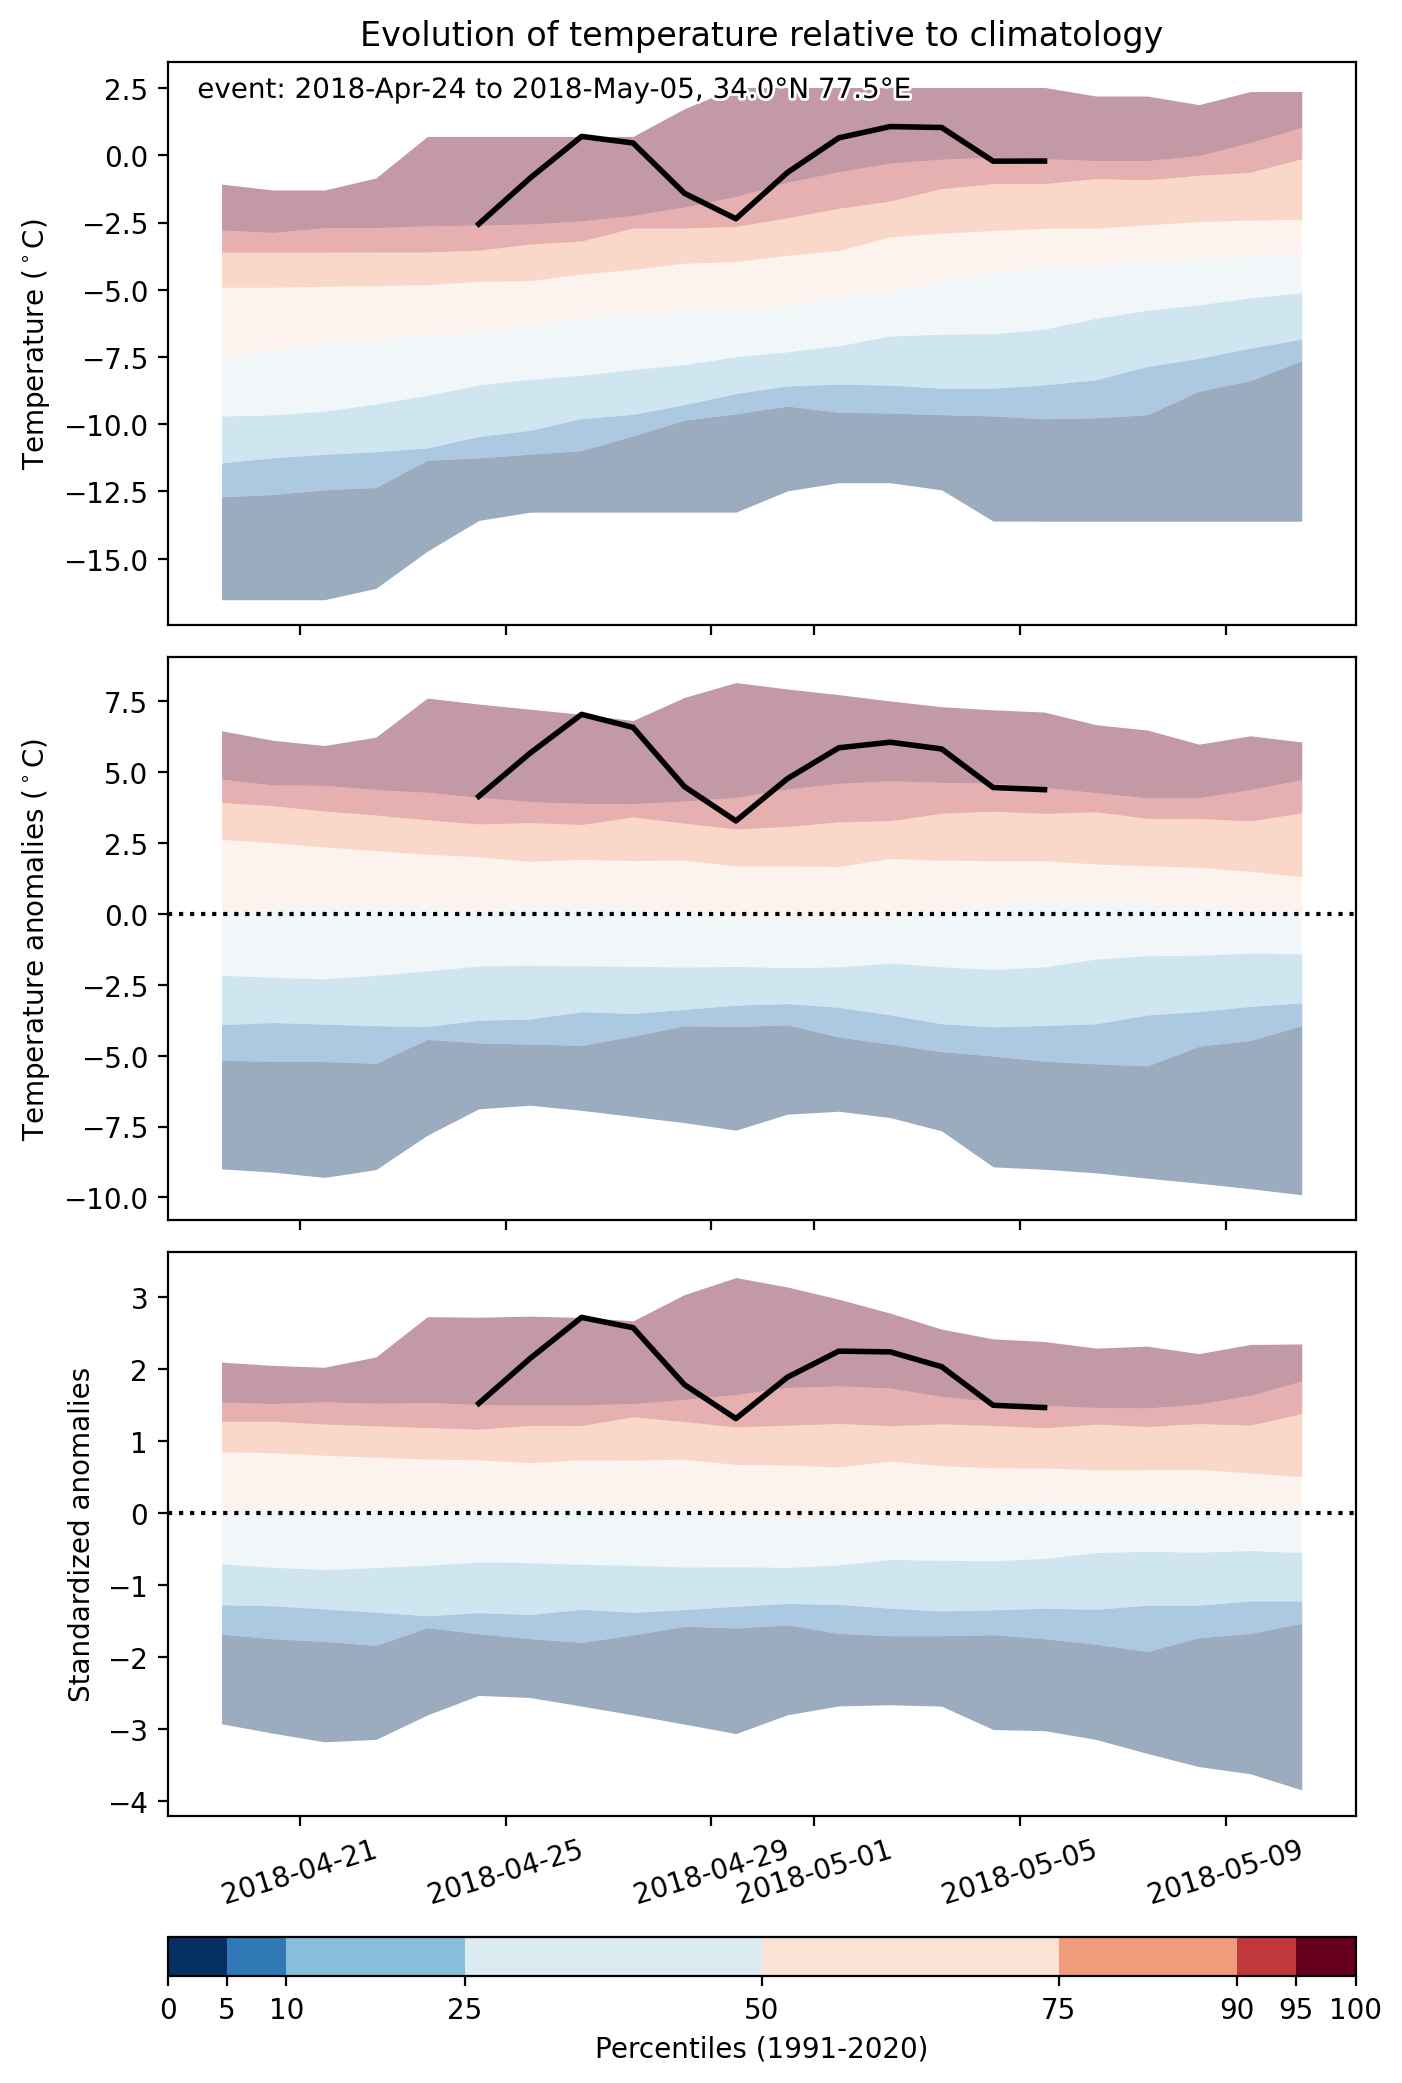
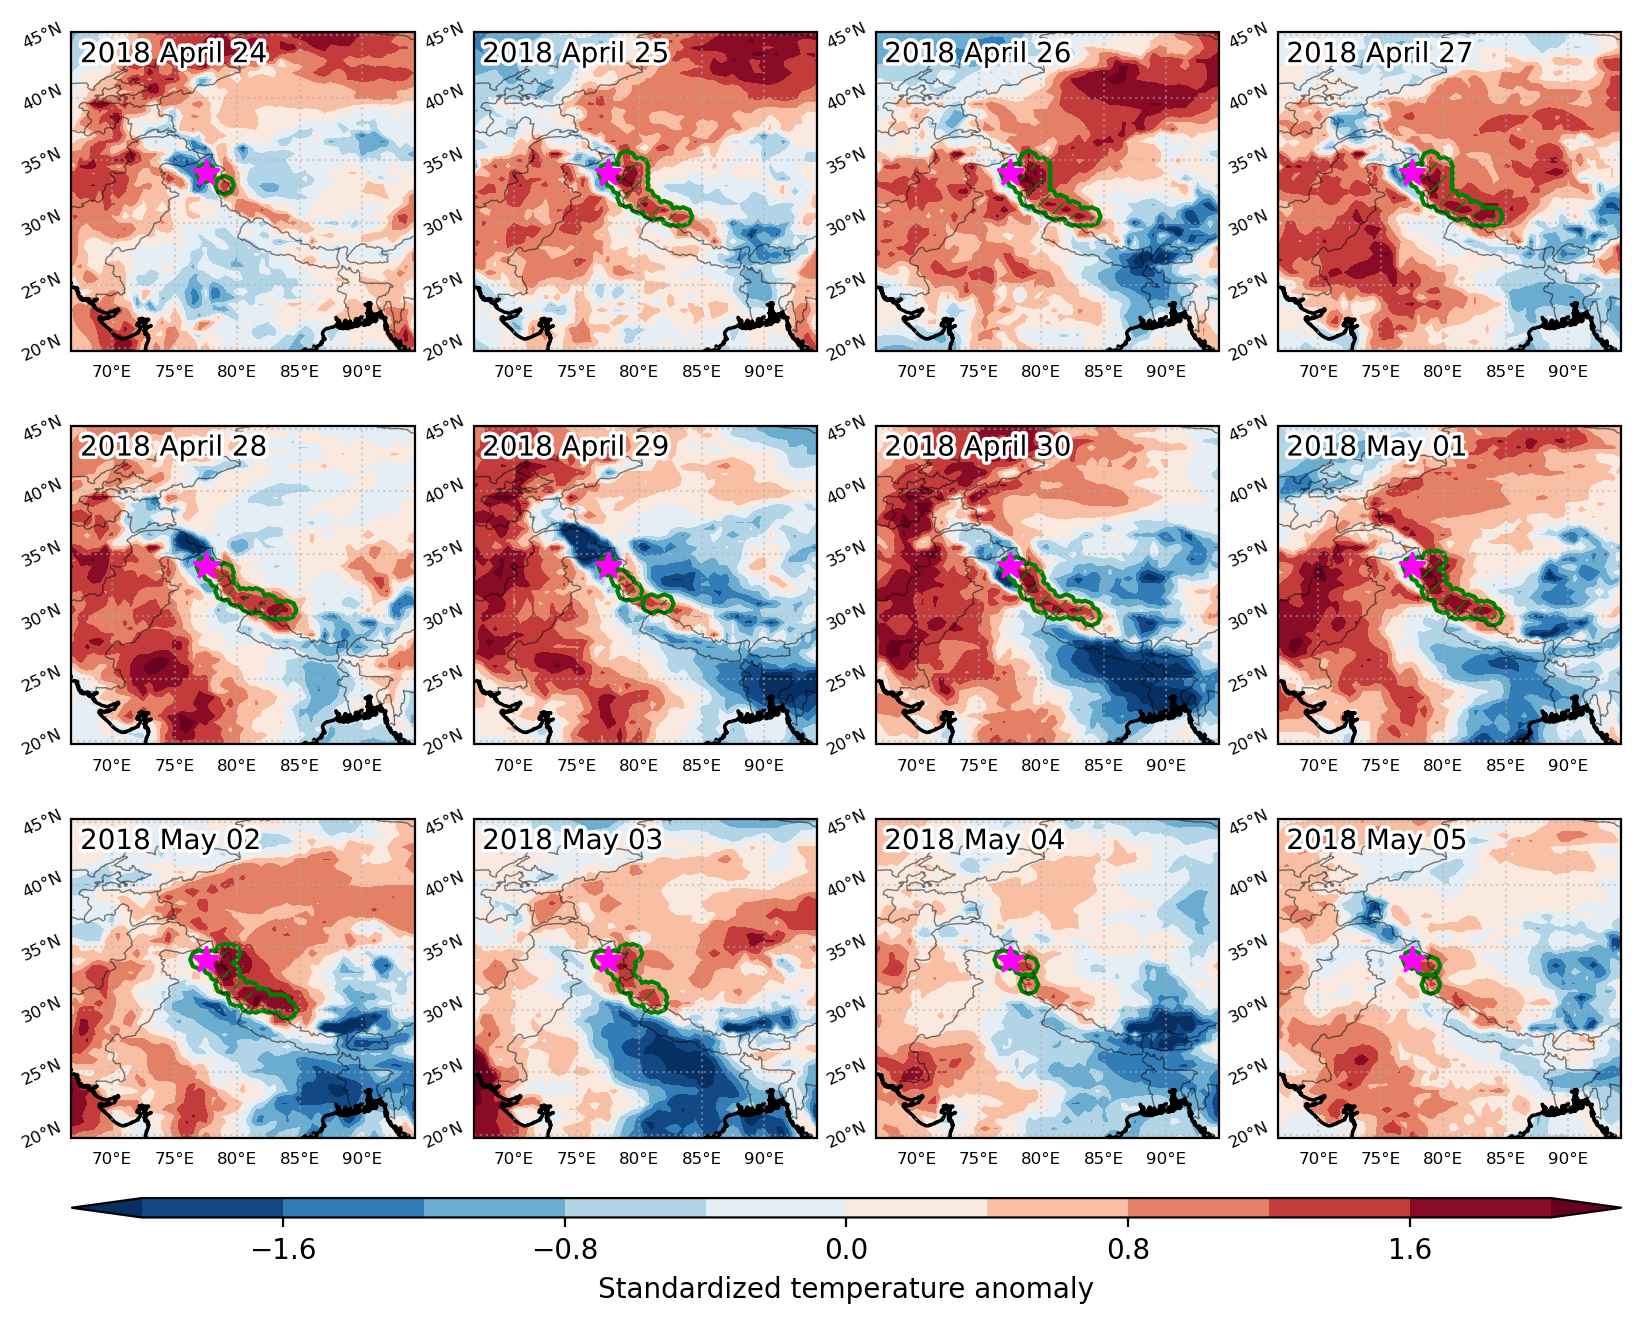
Fig. 1: Map of most extreme temperature anomalies (standardized) experienced during the event. The purple star indicates the center of the extreme event. Green hatching illustrates all areas under the effect of extremes at some time during the event.


Fig. 2: Evolution of temperature at the center of the event. The climatological percentile distribution is illustrated with color shadings.


Fig. 3: Maps illustrating the evolution of standardized temperature anomalies during the event.

Event ID: Heat_wave_2018-Apr-24_to_2018-May-05_77.5_34.0