Cold spell occuring from April 13 2018 to April 15 2018 at 28.5°N 359.0°E

Download data: JSON

Event type: Cold spell

Countries affected (identified with ArcGIS Online; provided only for geographical reference):

  • Algeria

Duration: 3 days

Time span: April 13 2018 to April 15 2018

Statistics over entire affected area:

  • Mean temperature anomaly: -5.1 °C
  • Mean temperature: 18.5 °C
  • Minimum temperature anomaly: -7.3 °C
  • Minimum temperature: 15.6 °C

Event center: 28.5°N 359.0°E

Area affected: 51192 km$^2$
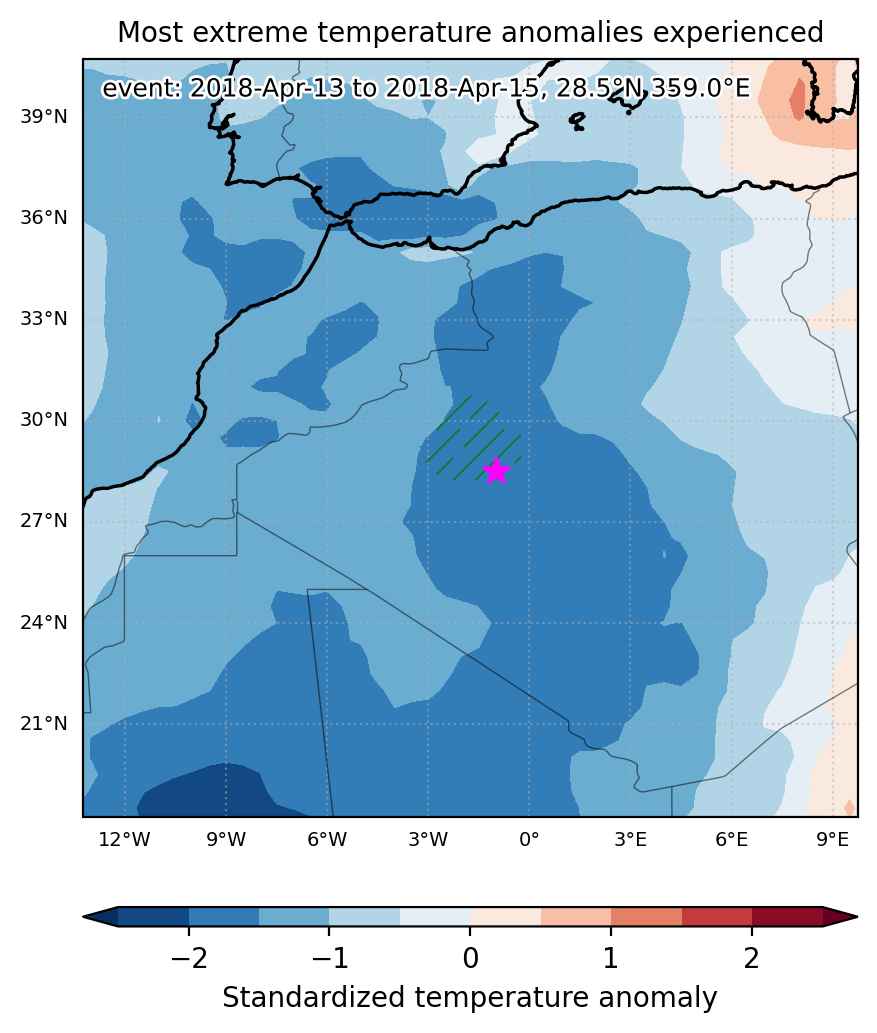

Fig. 1: Map of most extreme temperature anomalies (standardized) experienced during the event. The purple star indicates the center of the extreme event. Green hatching illustrates all areas under the effect of extremes at some time during the event.
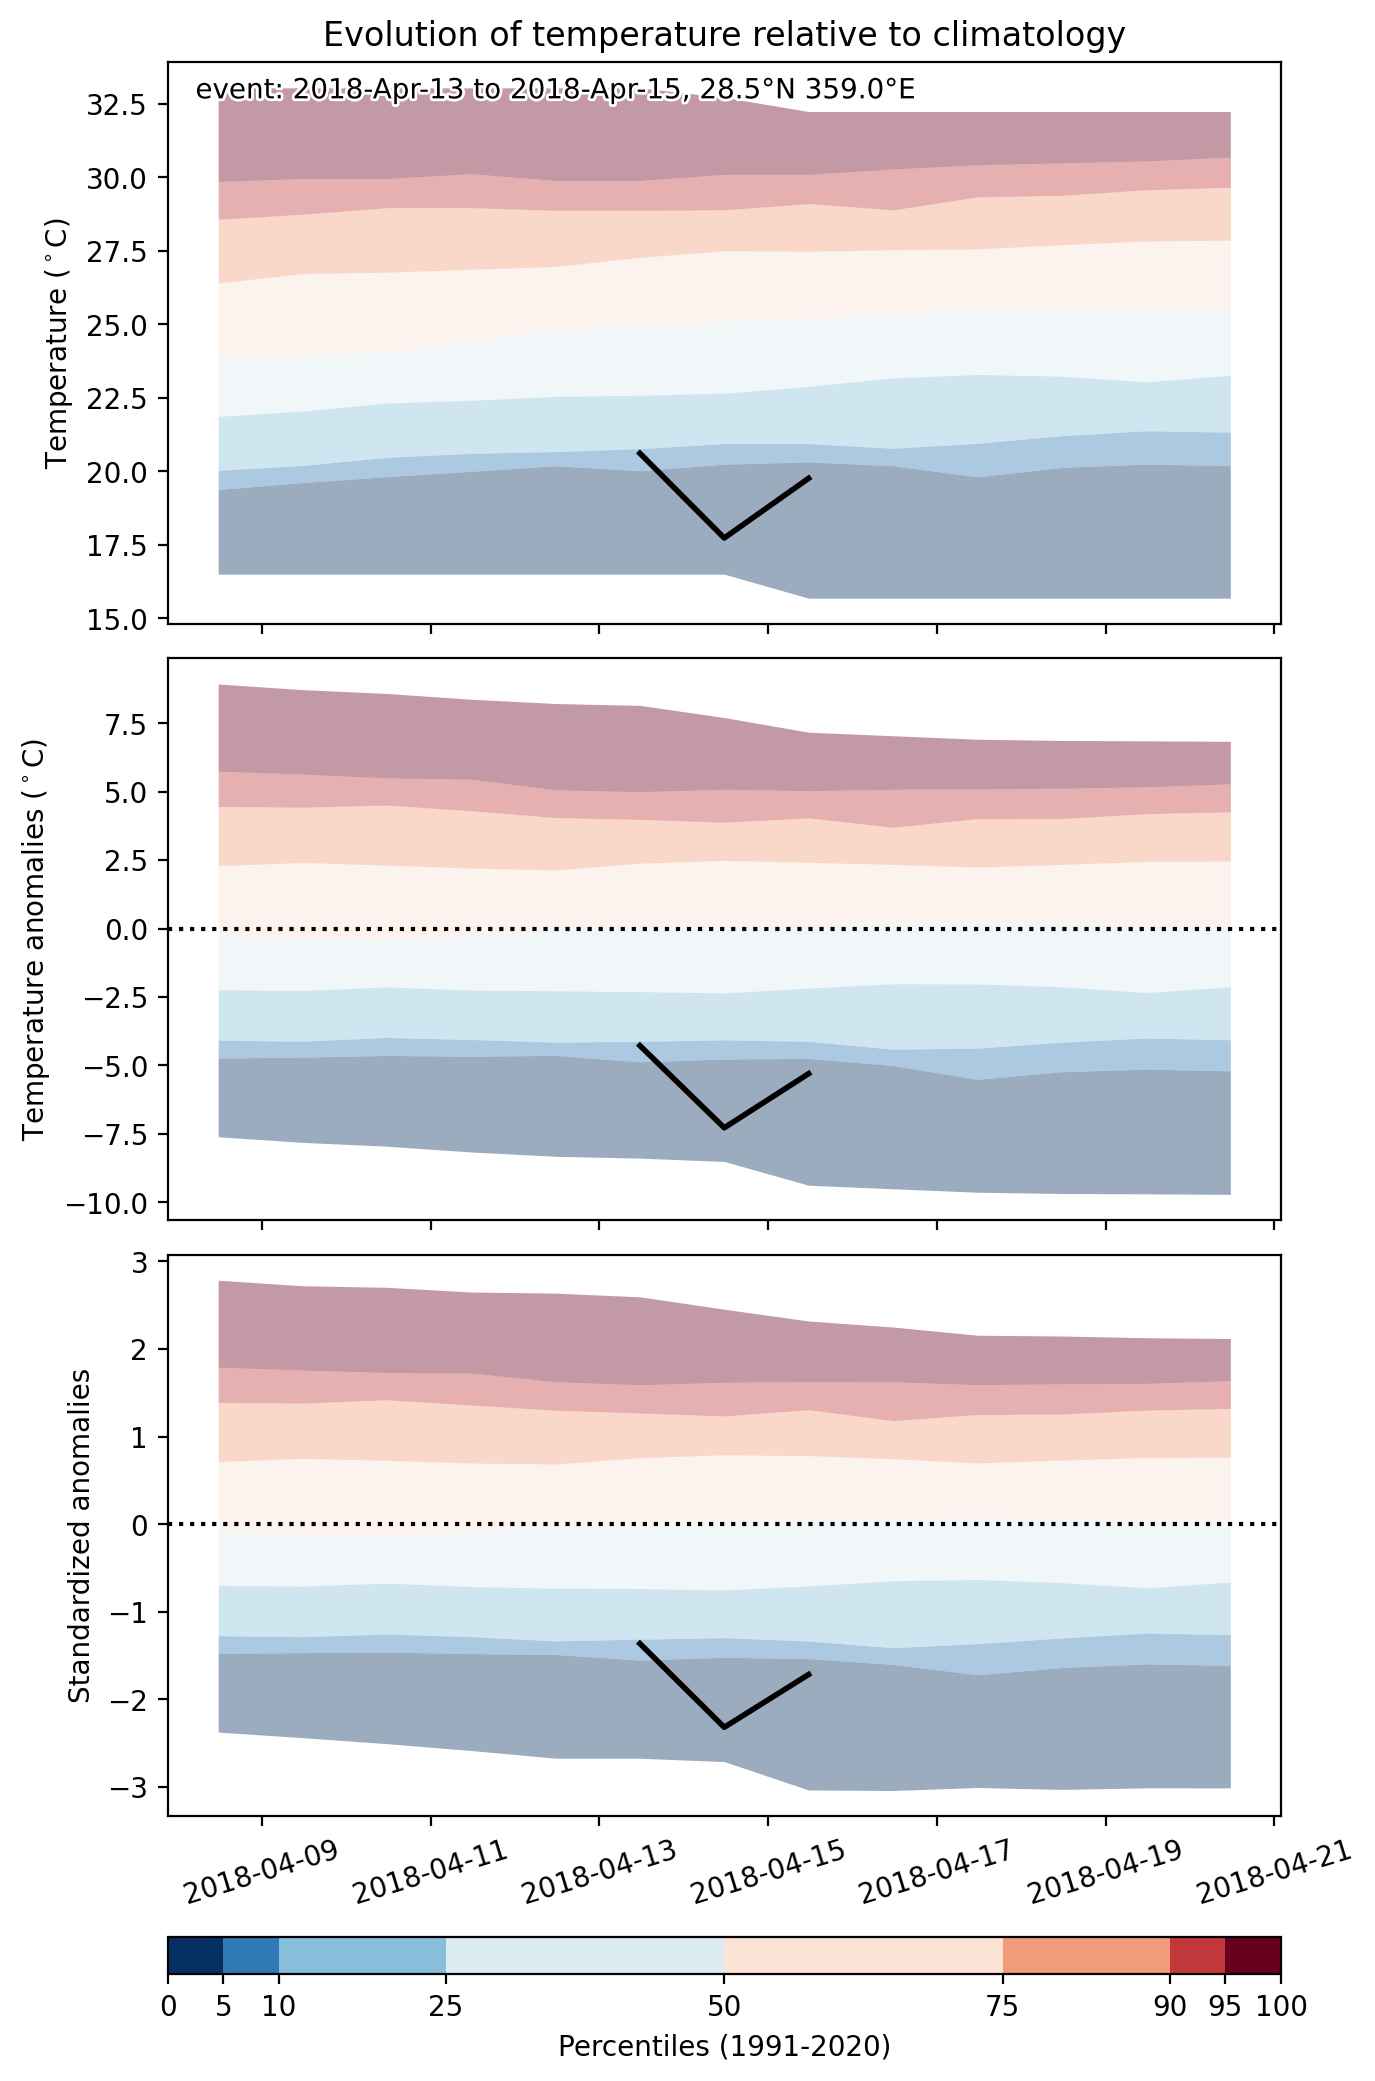


Fig. 2: Evolution of temperature at the center of the event. The climatological percentile distribution is illustrated with color shadings.
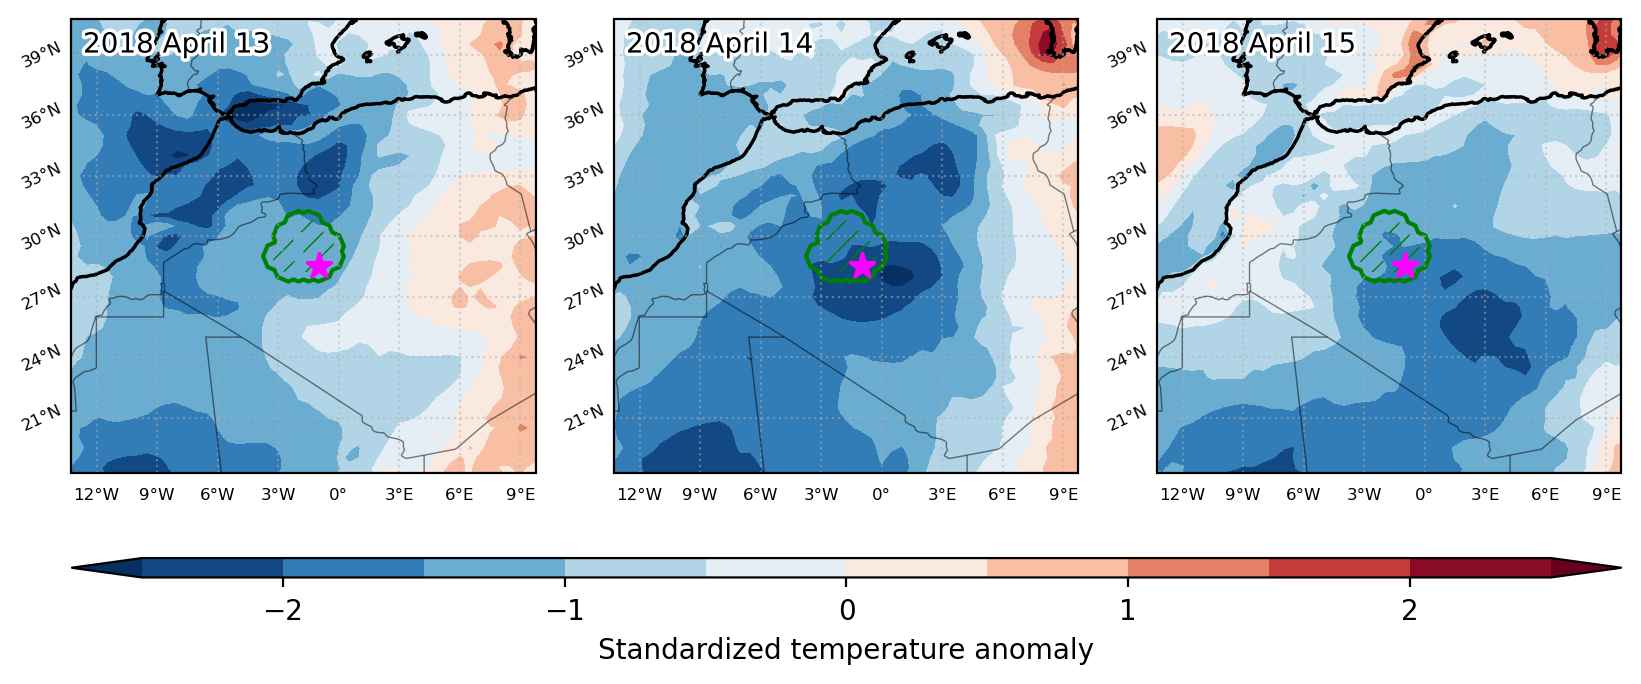


Fig. 3: Maps illustrating the evolution of standardized temperature anomalies during the event.

Event ID: Cold_spell_2018-Apr-13_to_2018-Apr-15_359.0_28.5
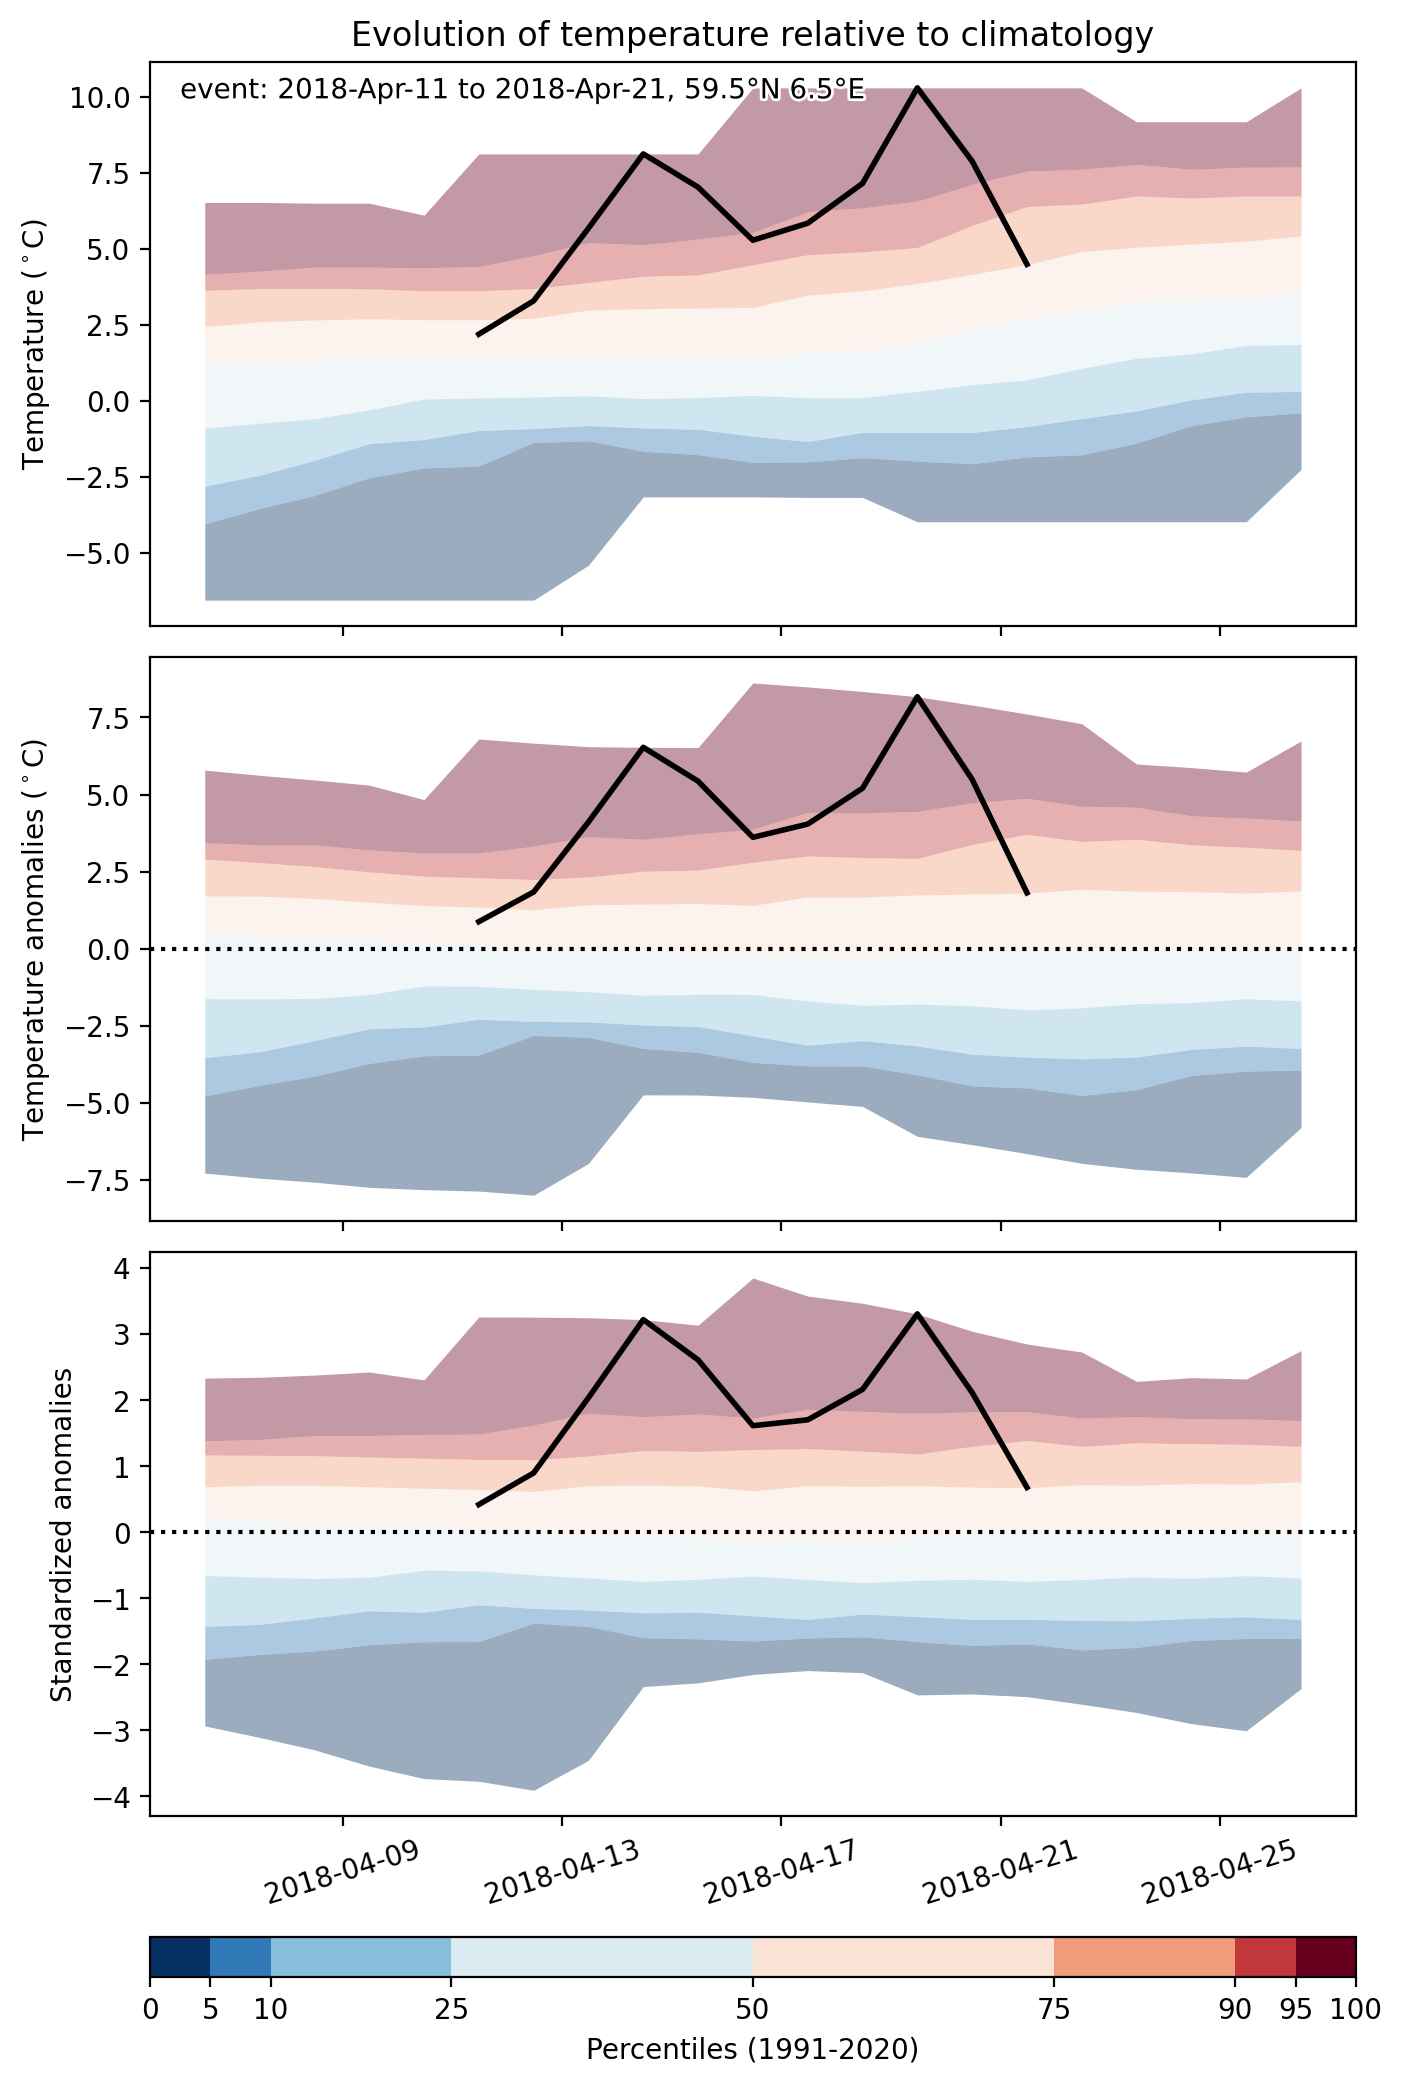
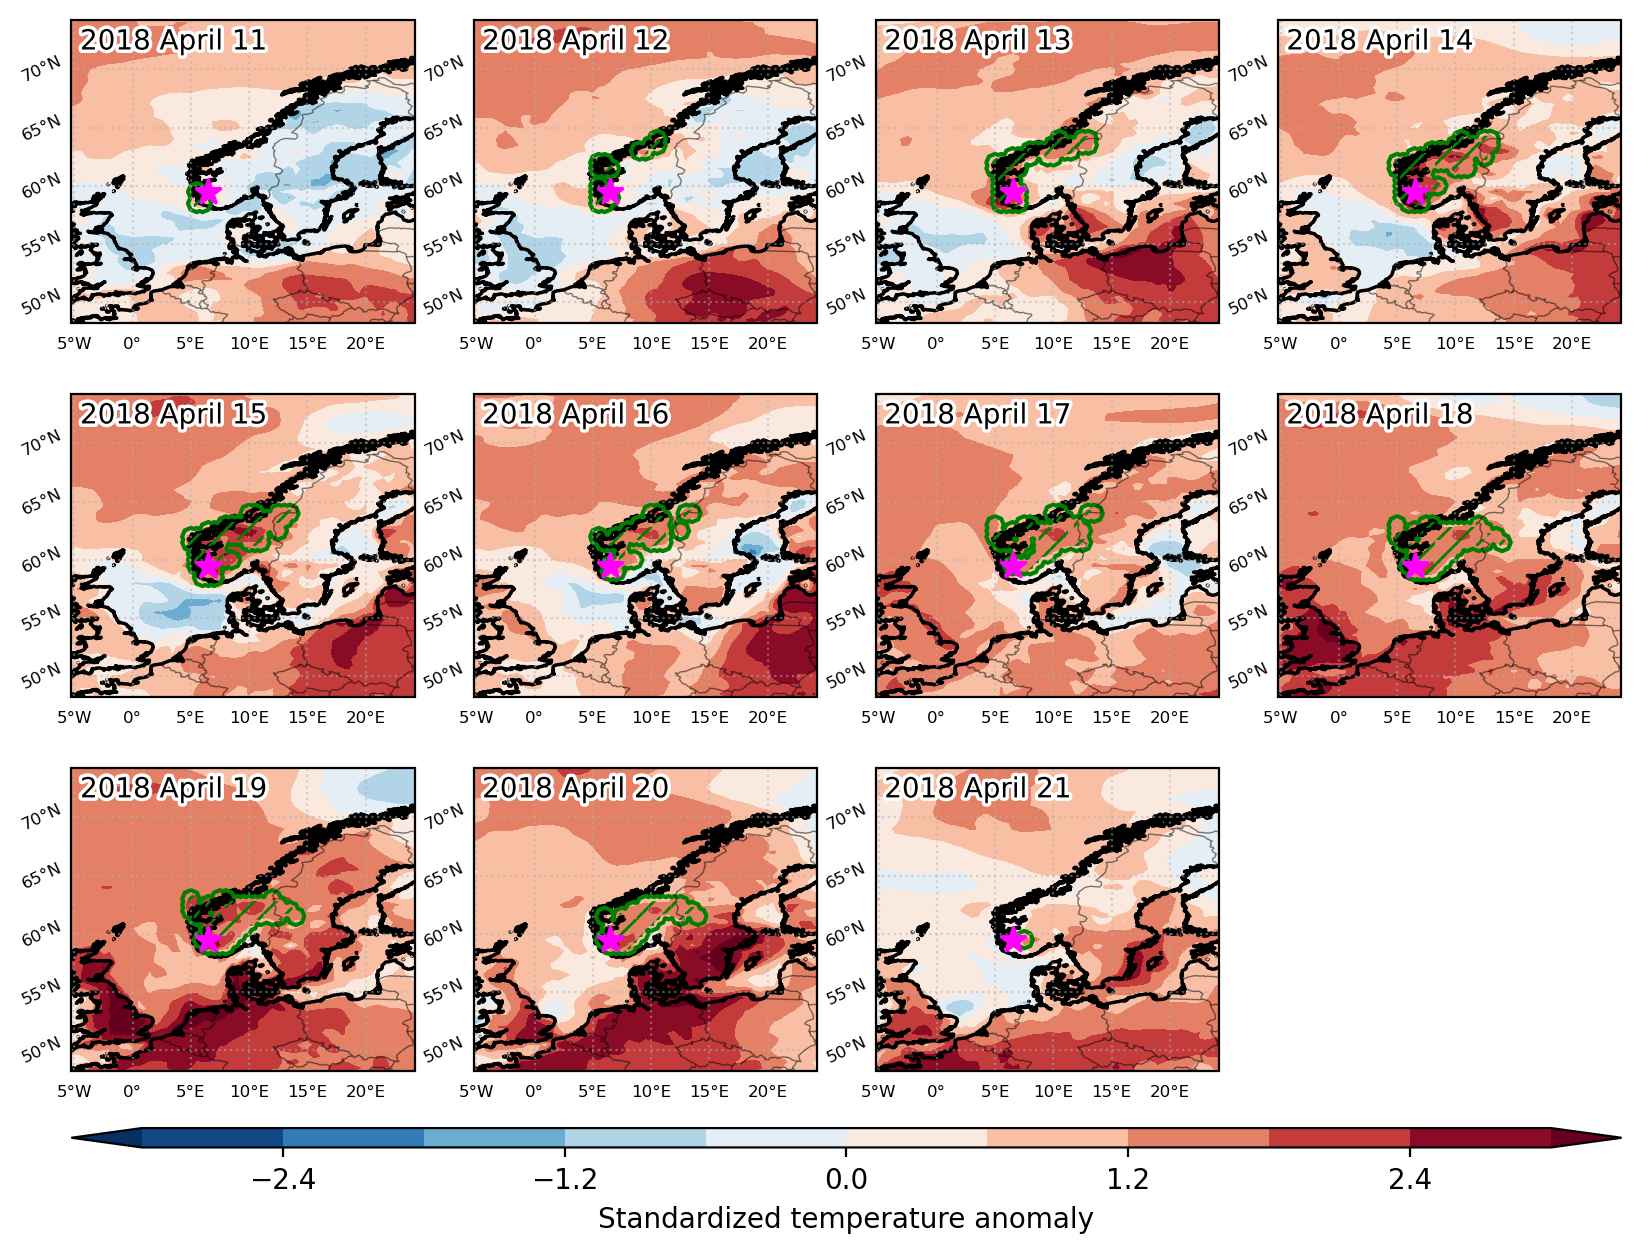
Heat wave occuring from April 11 2018 to April 21 2018 at 59.5°N 6.5°E

Download data: JSON

Event type: Heat wave

Countries affected (identified with ArcGIS Online; provided only for geographical reference):

  • Norway
  • Sweden

Duration: 11 days

Time span: April 11 2018 to April 21 2018

Statistics over entire affected area:

  • Mean temperature anomaly: 4.8 °C
  • Mean temperature: 6.1 °C
  • Maximum temperature anomaly: 9.7 °C
  • Maximum temperature: 13.2 °C

Event center: 59.5°N 6.5°E

Area affected: 163736 km$^2$


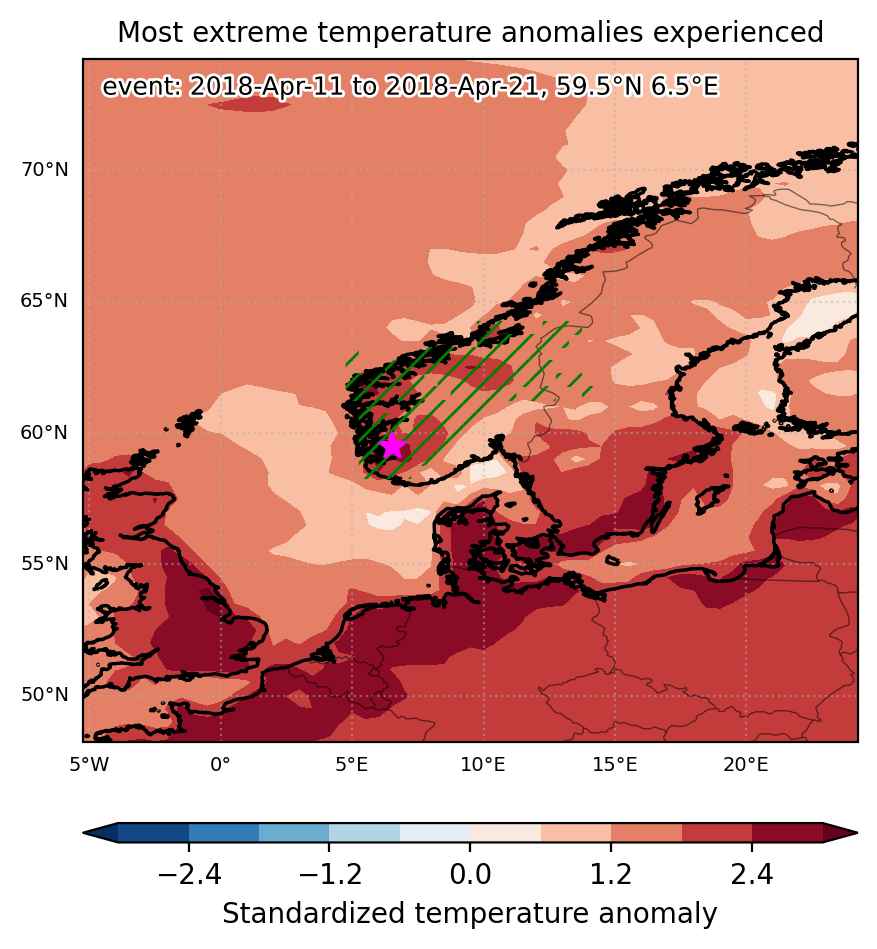
Fig. 1: Map of most extreme temperature anomalies (standardized) experienced during the event. The purple star indicates the center of the extreme event. Green hatching illustrates all areas under the effect of extremes at some time during the event.


Fig. 2: Evolution of temperature at the center of the event. The climatological percentile distribution is illustrated with color shadings.


Fig. 3: Maps illustrating the evolution of standardized temperature anomalies during the event.

Event ID: Heat_wave_2018-Apr-11_to_2018-Apr-21_6.5_59.5

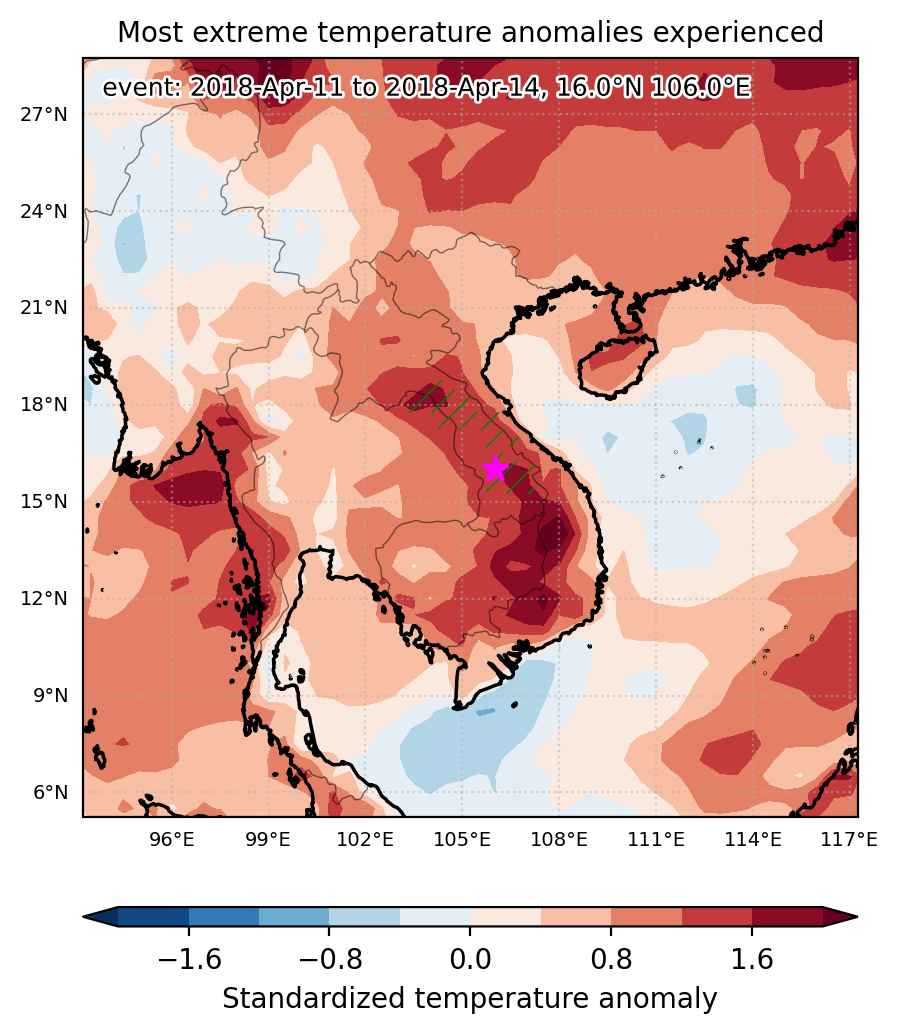
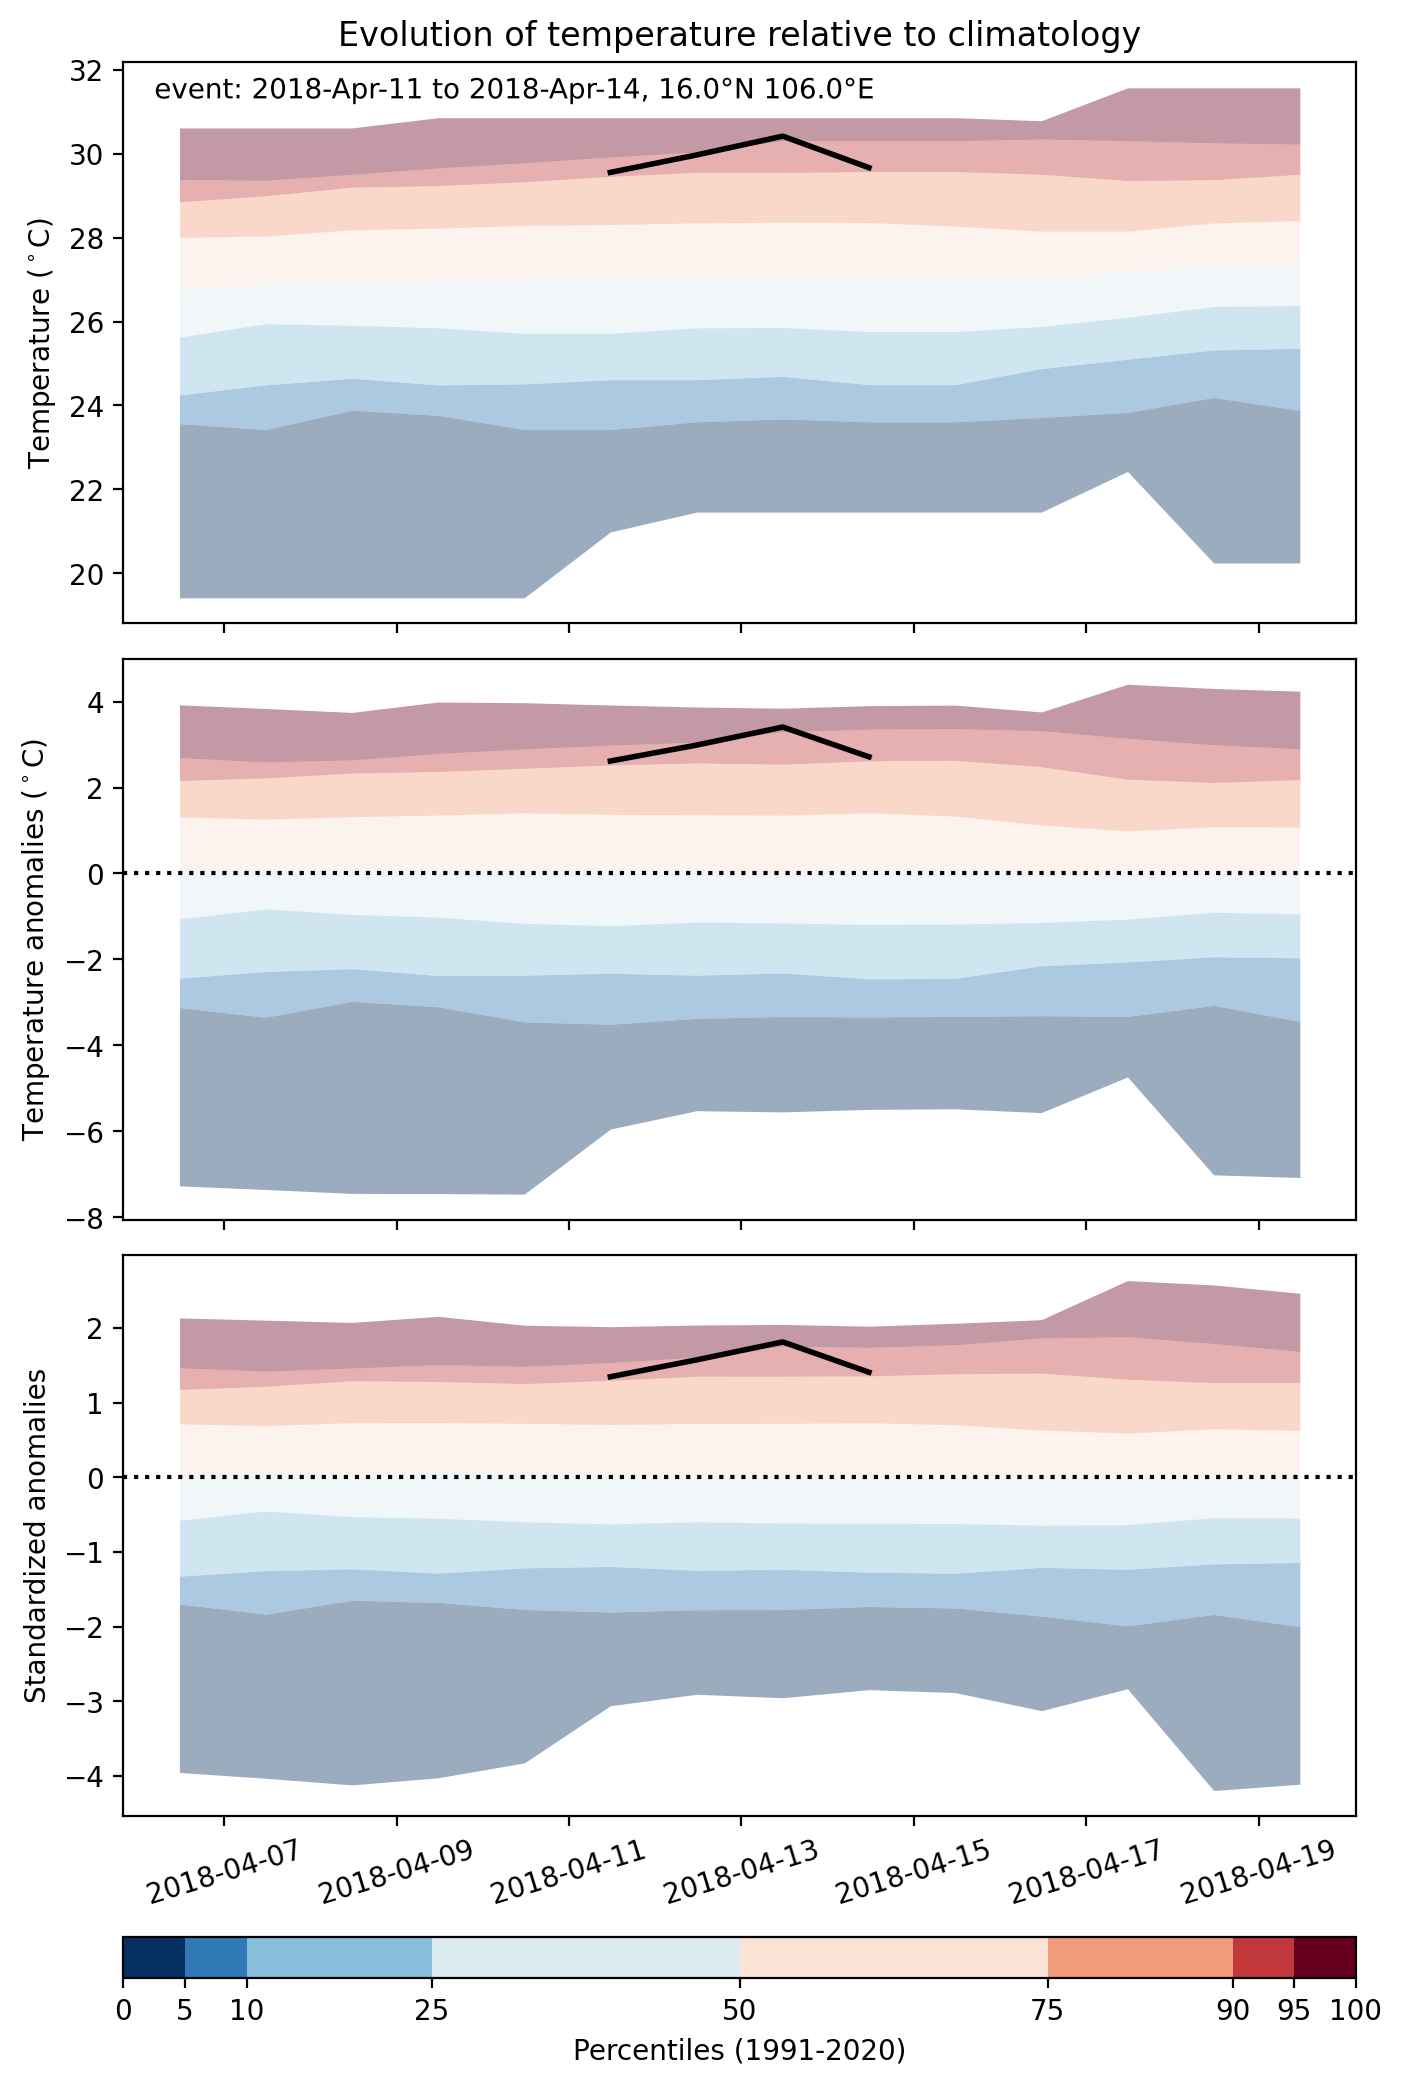
Heat wave occuring from April 11 2018 to April 14 2018 at 16.0°N 106.0°E

Download data: JSON

Event type: Heat wave

Countries affected (identified with ArcGIS Online; provided only for geographical reference):

  • Laos
  • Thailand
  • Vietnam

Duration: 4 days

Time span: April 11 2018 to April 14 2018

Statistics over entire affected area:

  • Mean temperature anomaly: 3.4 °C
  • Mean temperature: 29.2 °C
  • Maximum temperature anomaly: 4.9 °C
  • Maximum temperature: 33.3 °C

Event center: 16.0°N 106.0°E

Area affected: 56139 km$^2$


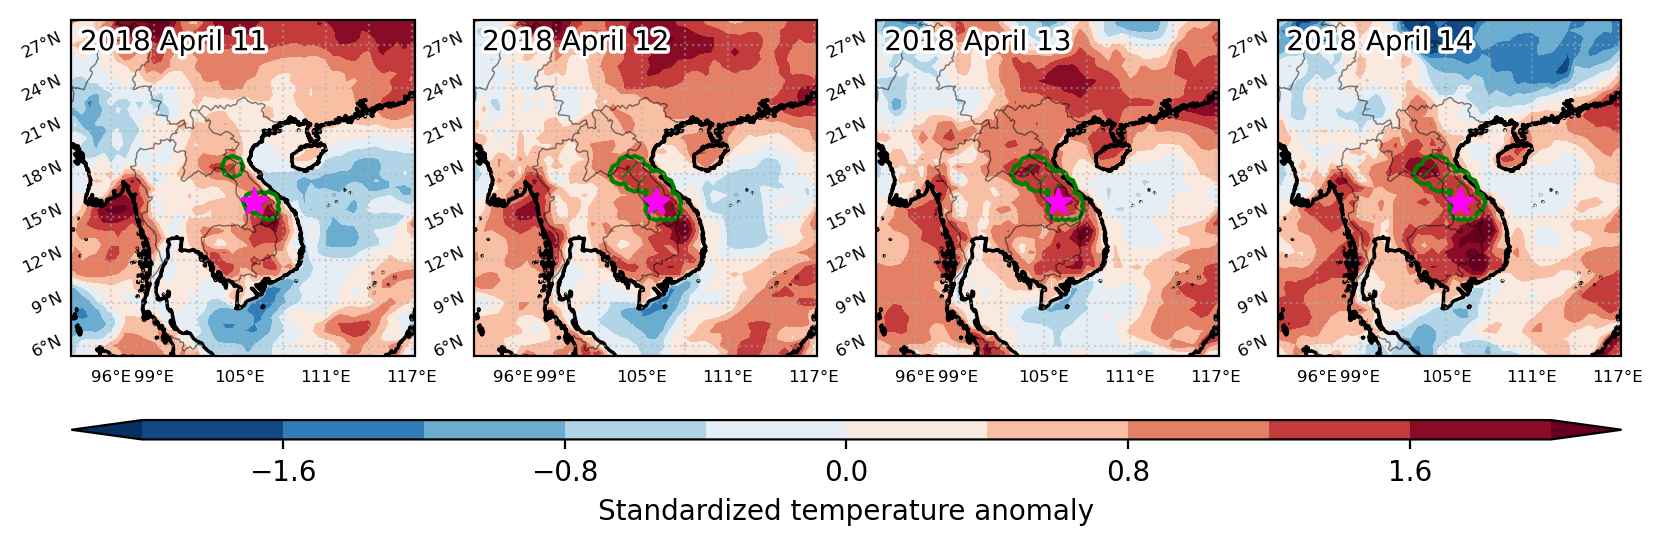
Fig. 1: Map of most extreme temperature anomalies (standardized) experienced during the event. The purple star indicates the center of the extreme event. Green hatching illustrates all areas under the effect of extremes at some time during the event.


Fig. 2: Evolution of temperature at the center of the event. The climatological percentile distribution is illustrated with color shadings.


Fig. 3: Maps illustrating the evolution of standardized temperature anomalies during the event.

Event ID: Heat_wave_2018-Apr-11_to_2018-Apr-14_106.0_16.0

Cold spell occuring from April 11 2018 to April 22 2018 at 44.0°N 265.5°E

Download data: JSON

Event type: Cold spell

Countries affected (identified with ArcGIS Online; provided only for geographical reference):

  • Canada
  • United States

Duration: 12 days

Time span: April 11 2018 to April 22 2018

Statistics over entire affected area:

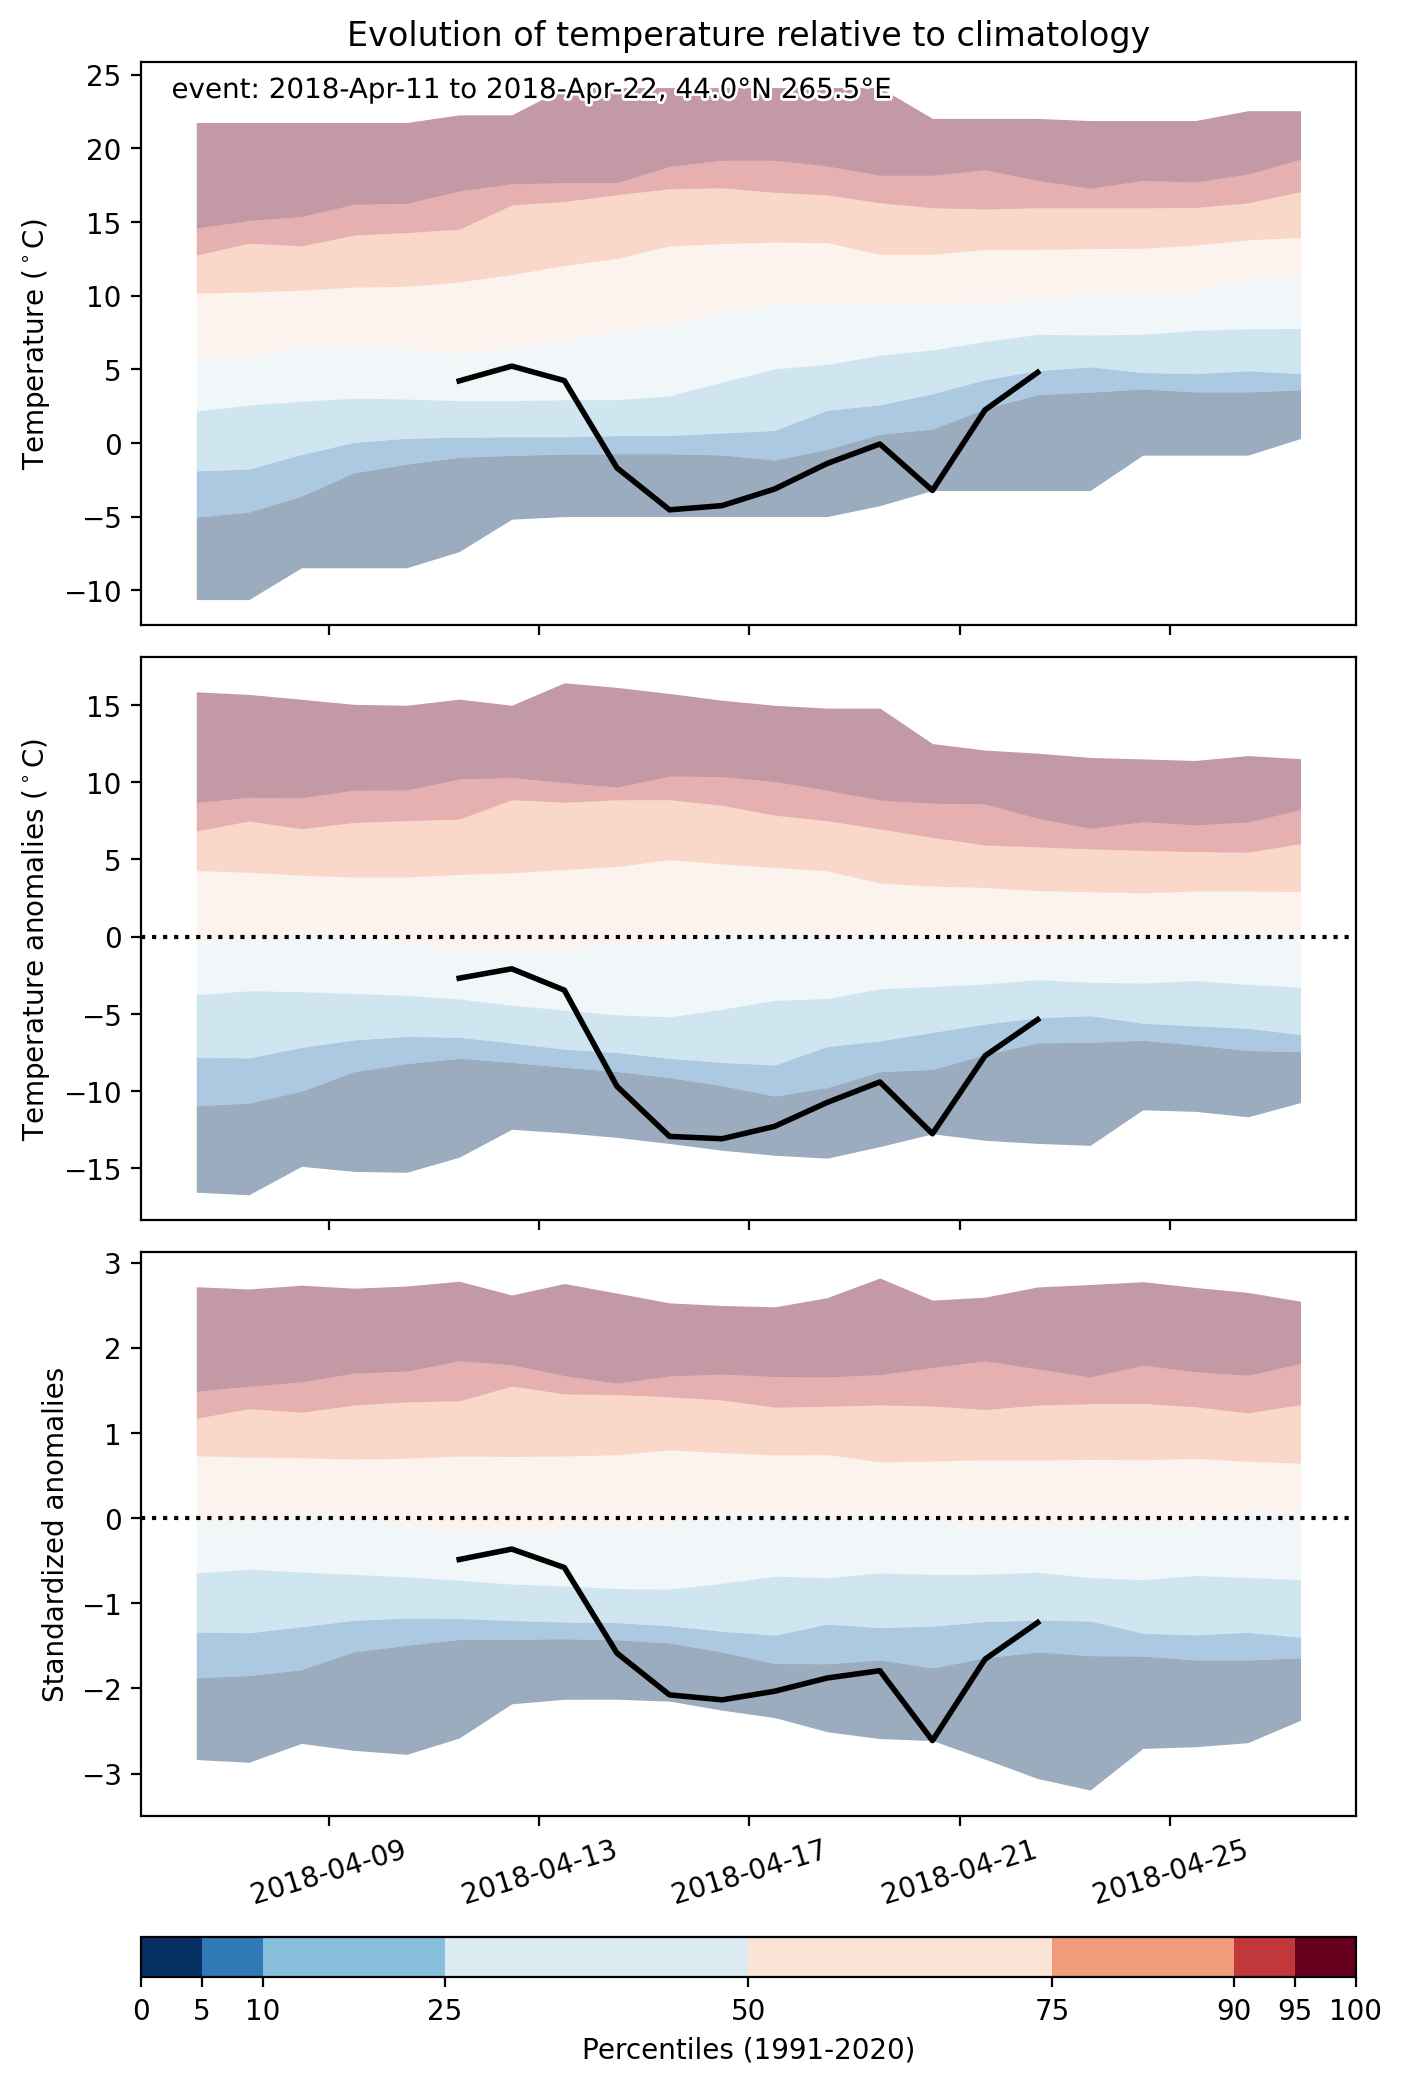
  • Mean temperature anomaly: -9.1 °C
  • Mean temperature: -6.3 °C
  • Minimum temperature anomaly: -16.8 °C
  • Minimum temperature: -23.5 °C

Event center: 44.0°N 265.5°E

Area affected: 3625606 km$^2$


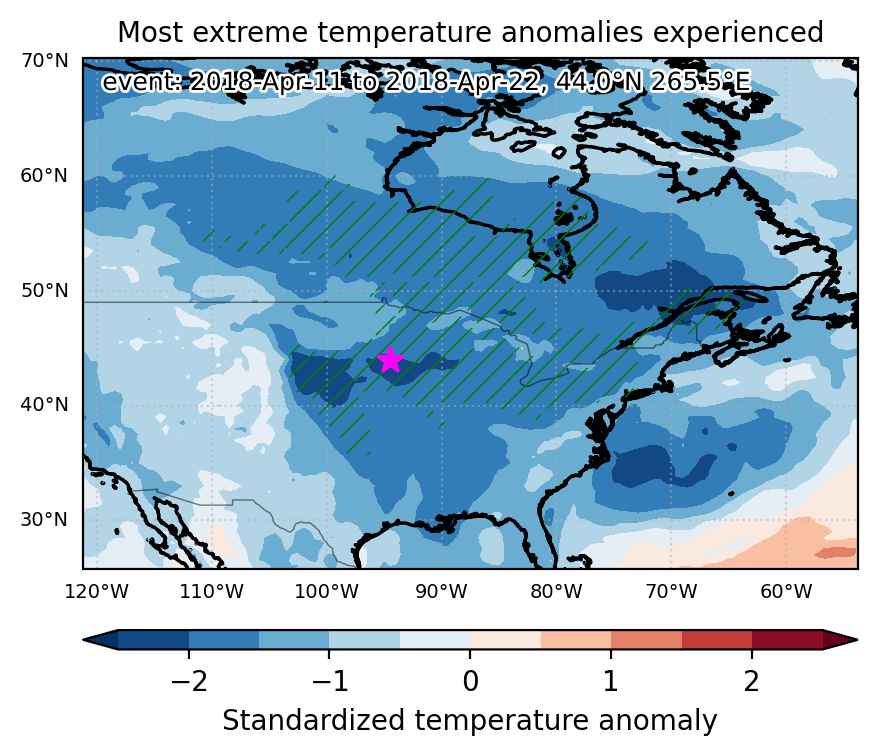
Fig. 1: Map of most extreme temperature anomalies (standardized) experienced during the event. The purple star indicates the center of the extreme event. Green hatching illustrates all areas under the effect of extremes at some time during the event.


Fig. 2: Evolution of temperature at the center of the event. The climatological percentile distribution is illustrated with color shadings.


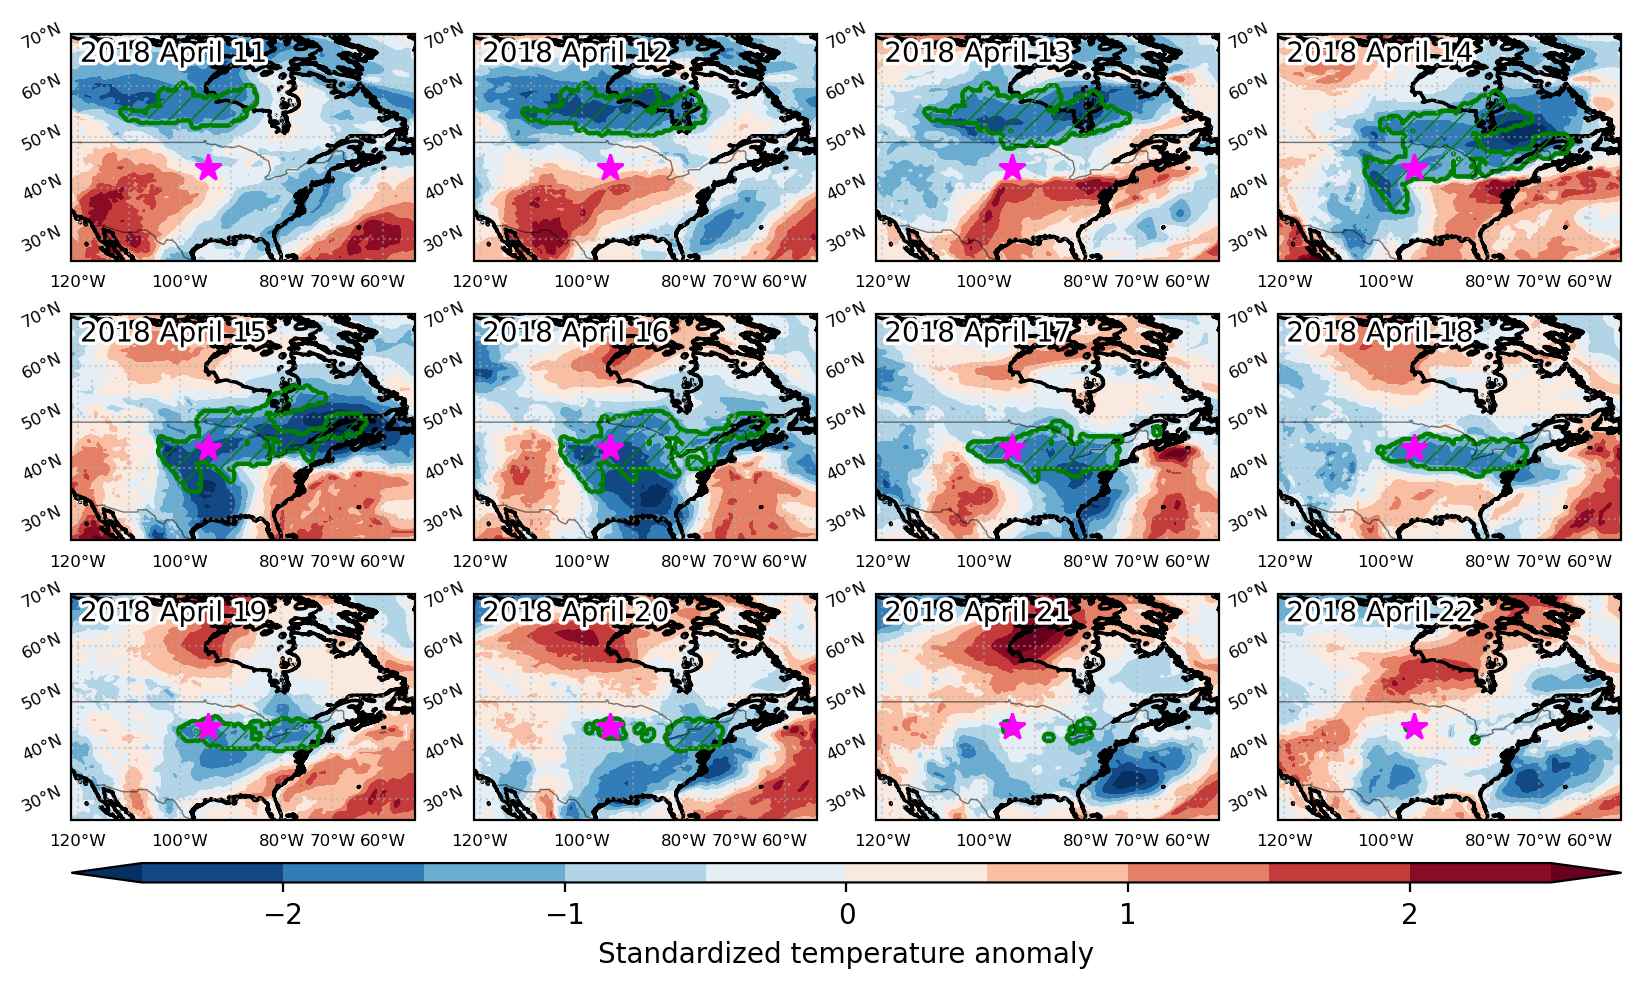
Fig. 3: Maps illustrating the evolution of standardized temperature anomalies during the event.

Event ID: Cold_spell_2018-Apr-11_to_2018-Apr-22_265.5_44.0

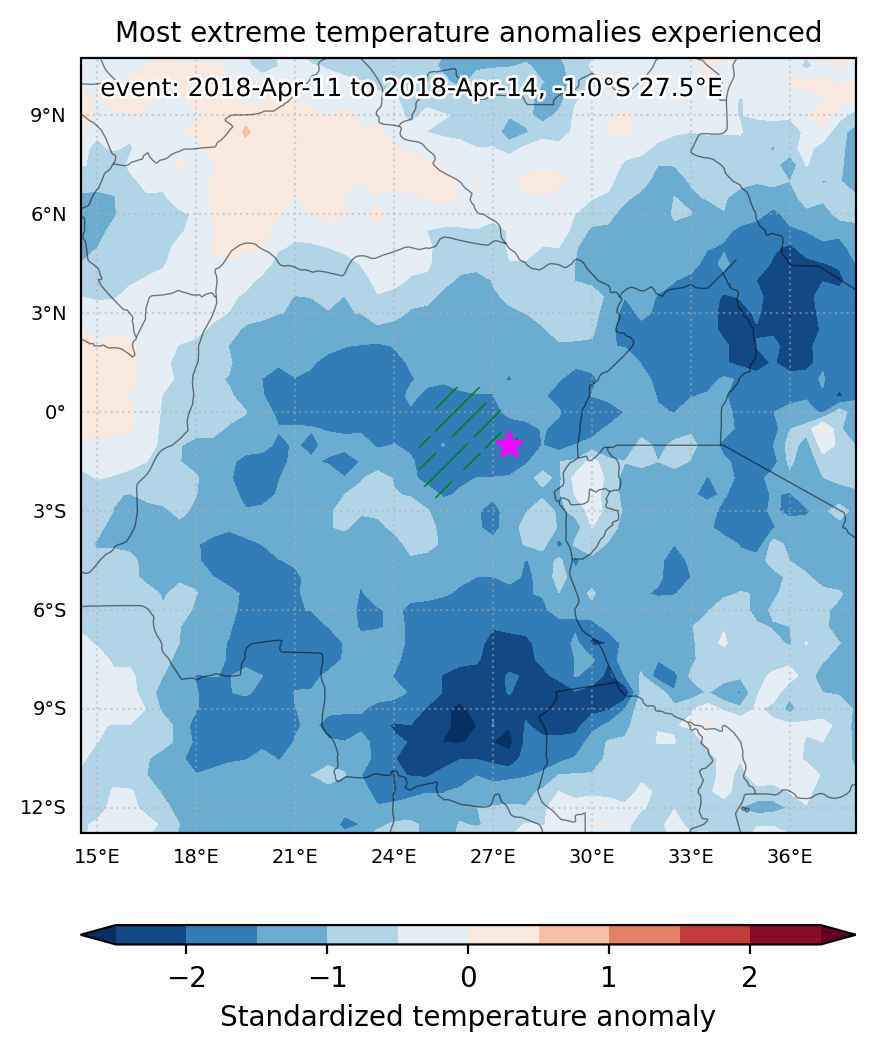
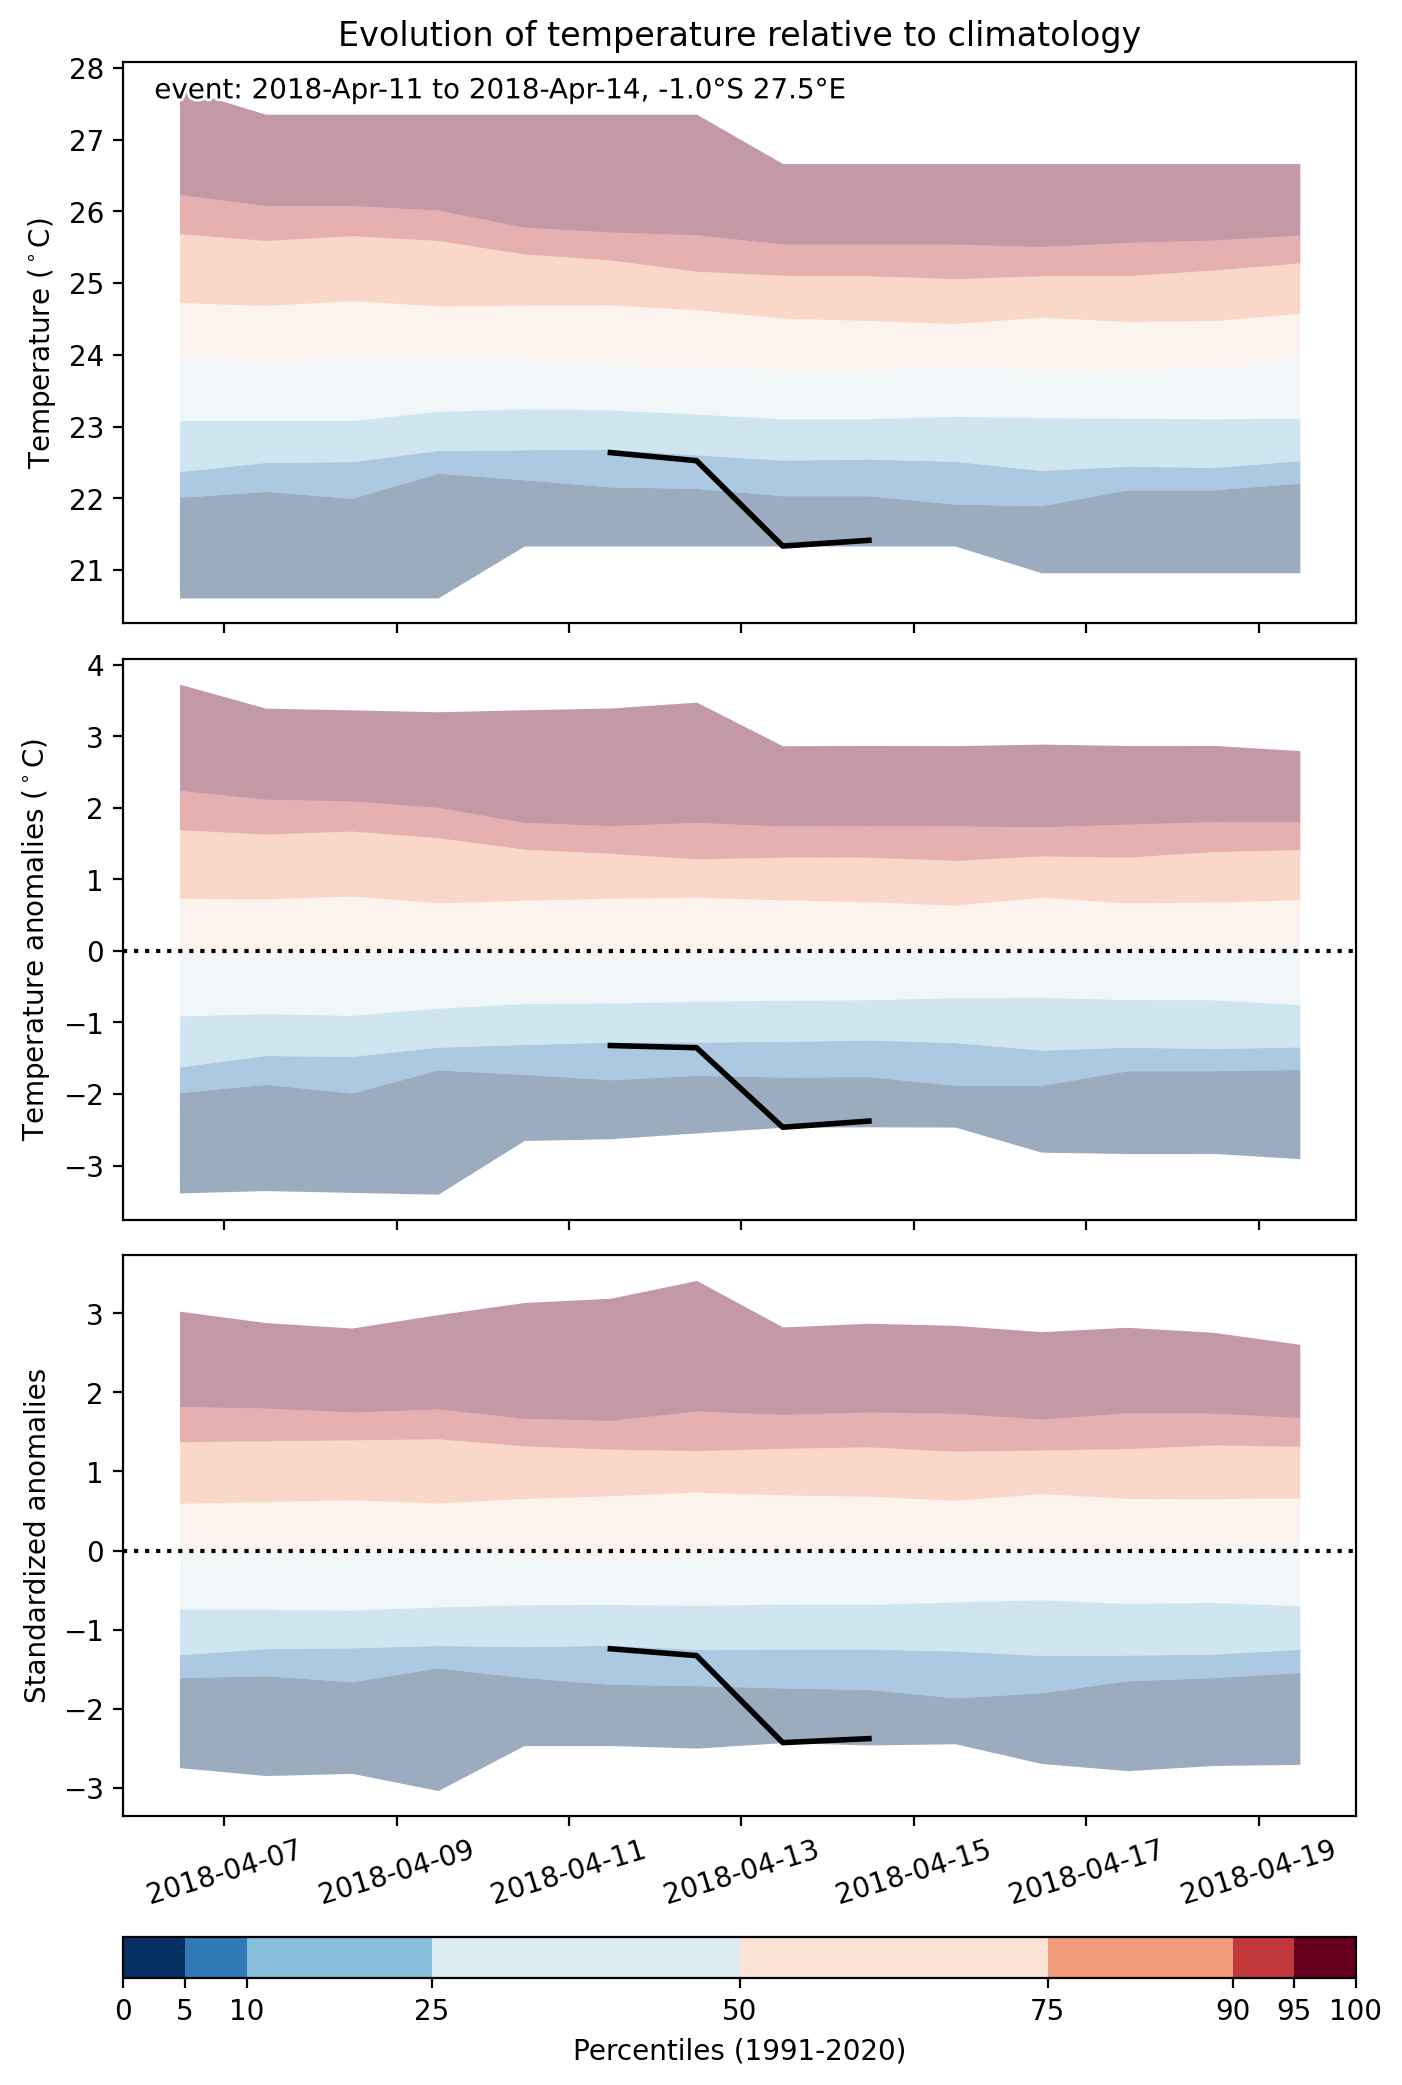
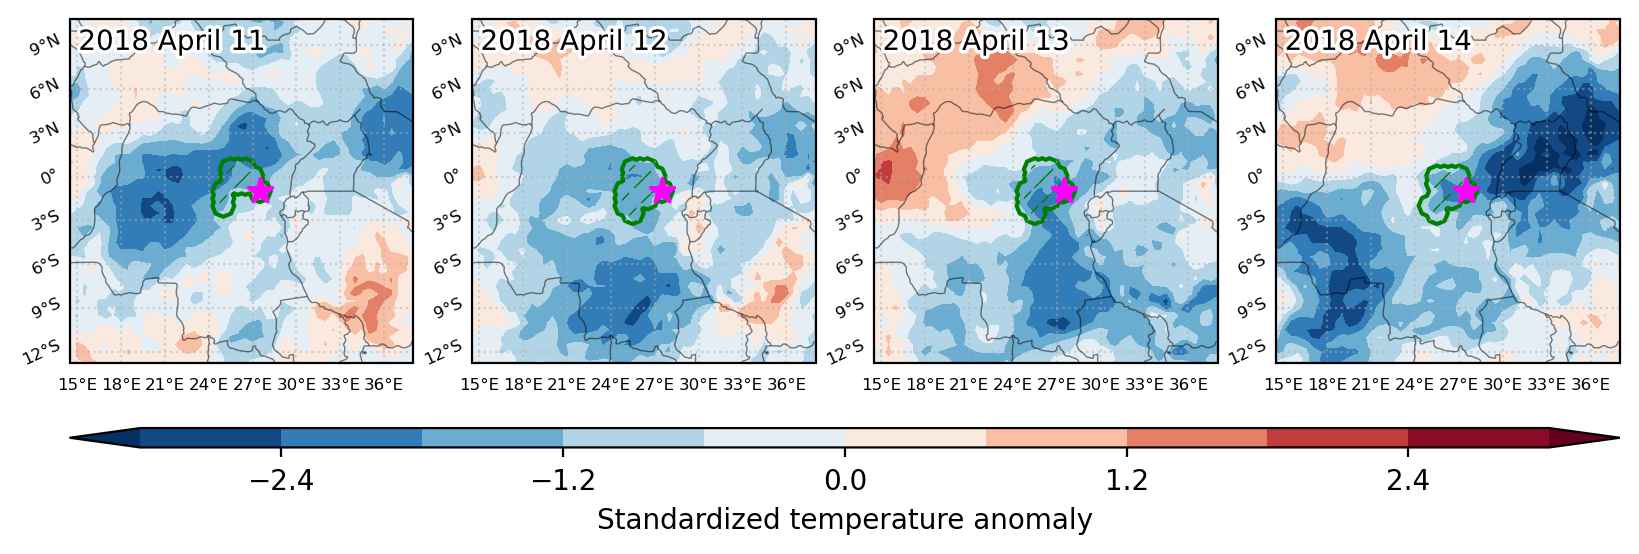
Cold spell occuring from April 11 2018 to April 14 2018 at -1.0°S 27.5°E

Download data: JSON

Event type: Cold spell

Countries affected (identified with ArcGIS Online; provided only for geographical reference):

  • Congo DRC

Duration: 4 days

Time span: April 11 2018 to April 14 2018

Statistics over entire affected area:

  • Mean temperature anomaly: -1.6 °C
  • Mean temperature: 22.9 °C
  • Minimum temperature anomaly: -2.5 °C
  • Minimum temperature: 21.3 °C

Event center: -1.0°S 27.5°E

Area affected: 67990 km$^2$


Fig. 1: Map of most extreme temperature anomalies (standardized) experienced during the event. The purple star indicates the center of the extreme event. Green hatching illustrates all areas under the effect of extremes at some time during the event.


Fig. 2: Evolution of temperature at the center of the event. The climatological percentile distribution is illustrated with color shadings.


Fig. 3: Maps illustrating the evolution of standardized temperature anomalies during the event.

Event ID: Cold_spell_2018-Apr-11_to_2018-Apr-14_27.5_-1.0

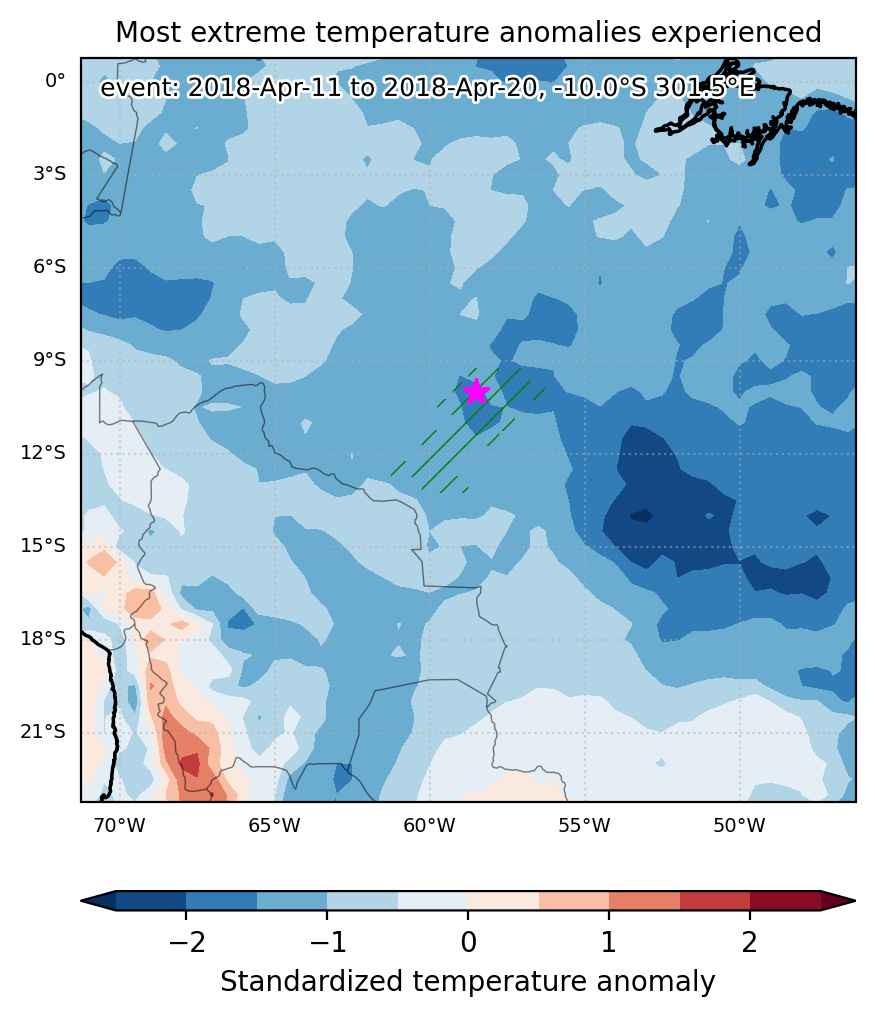
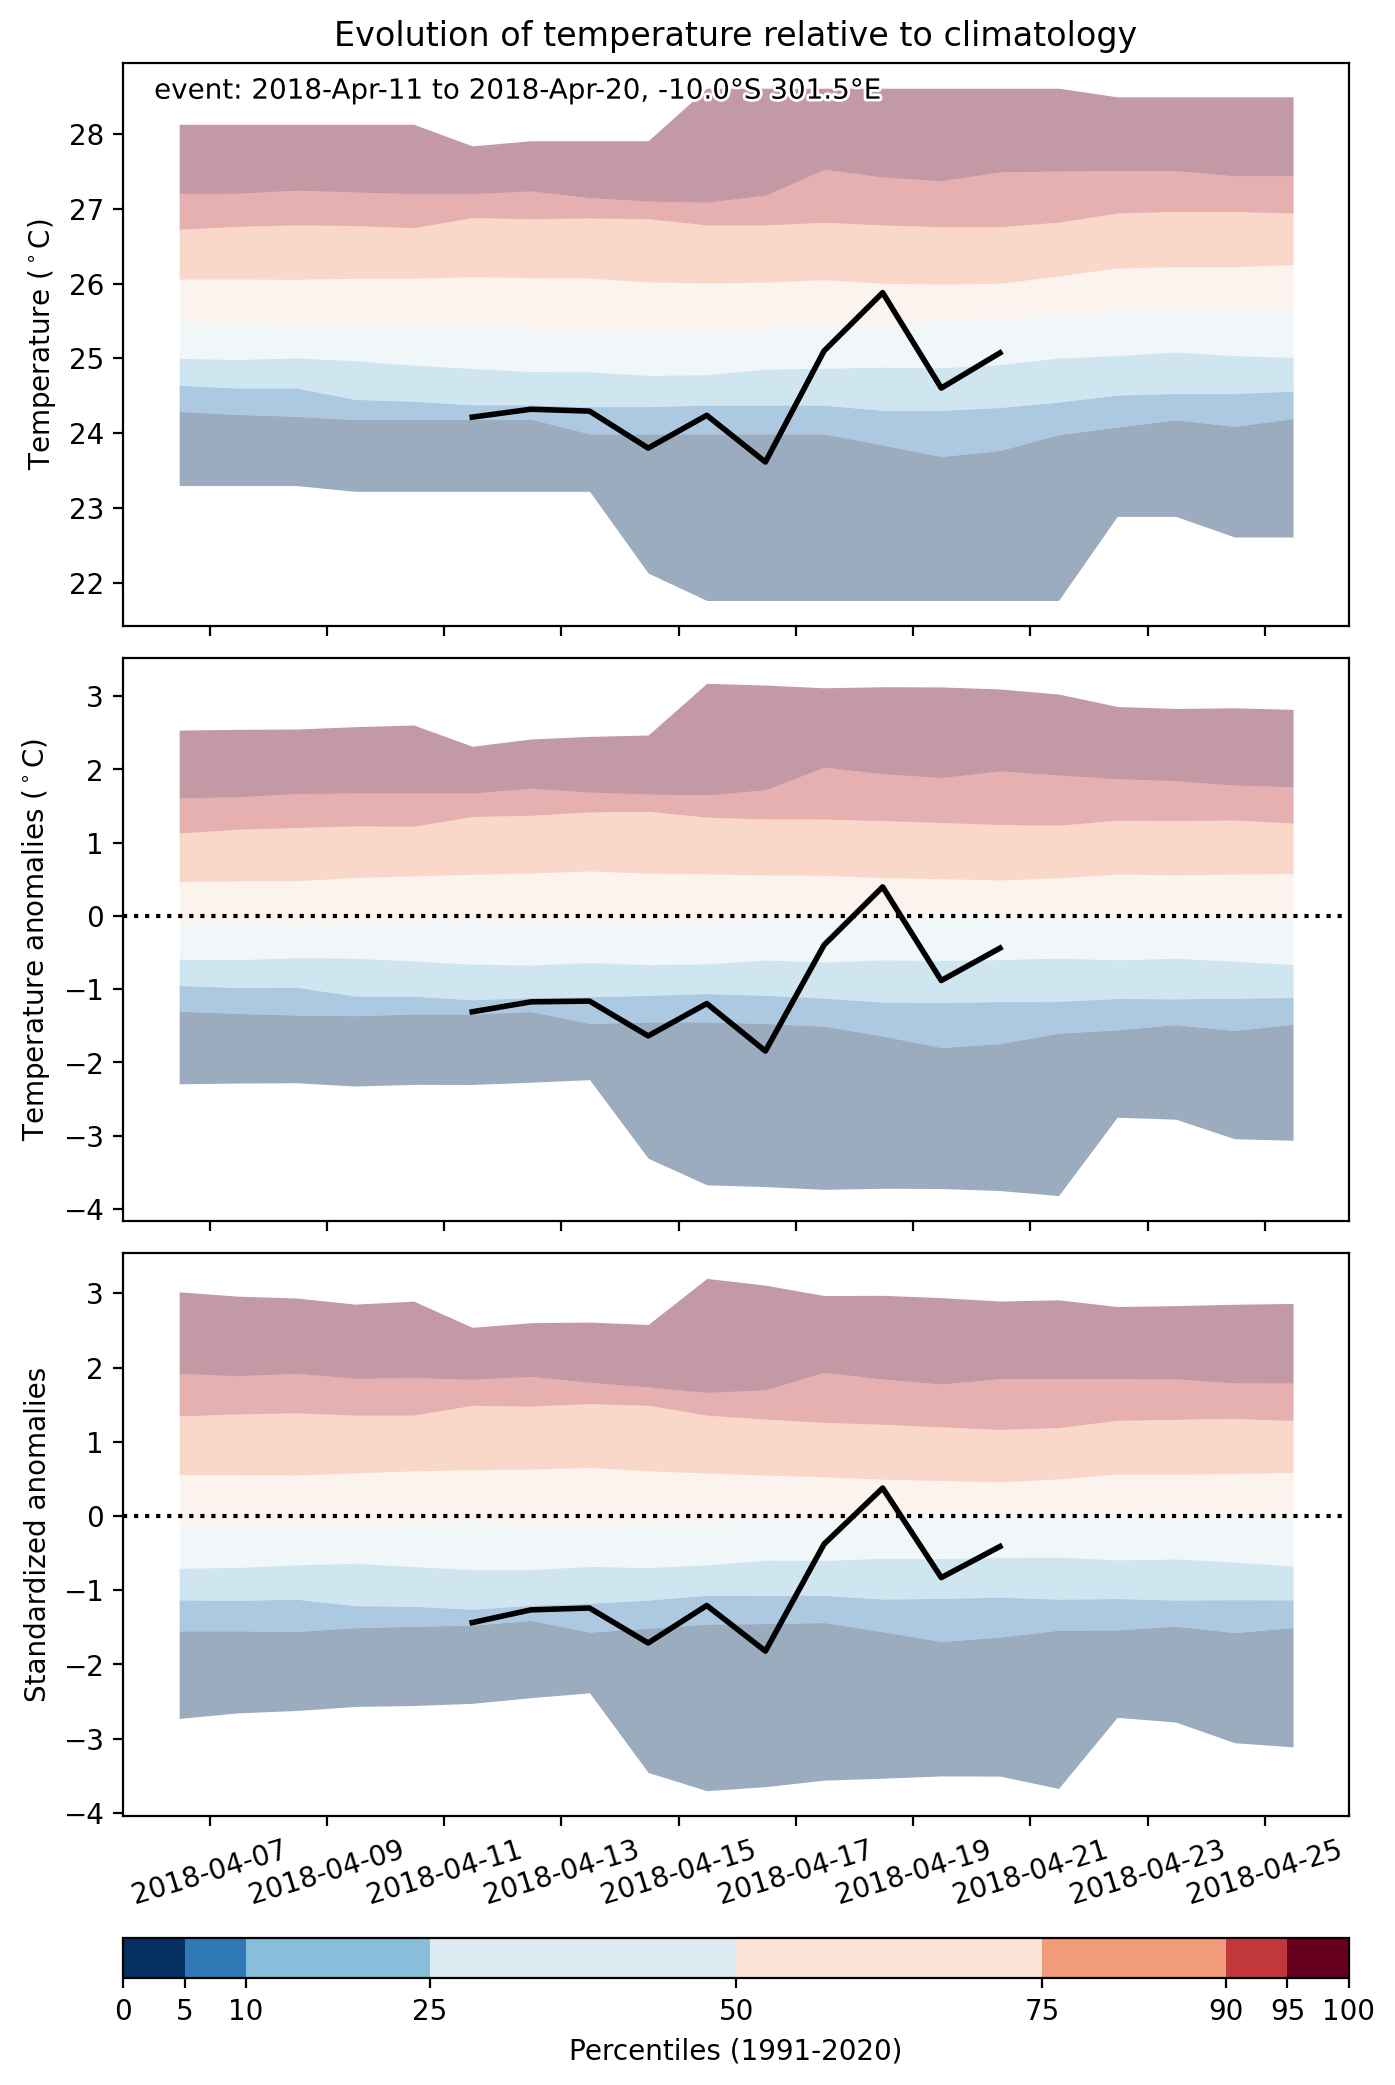
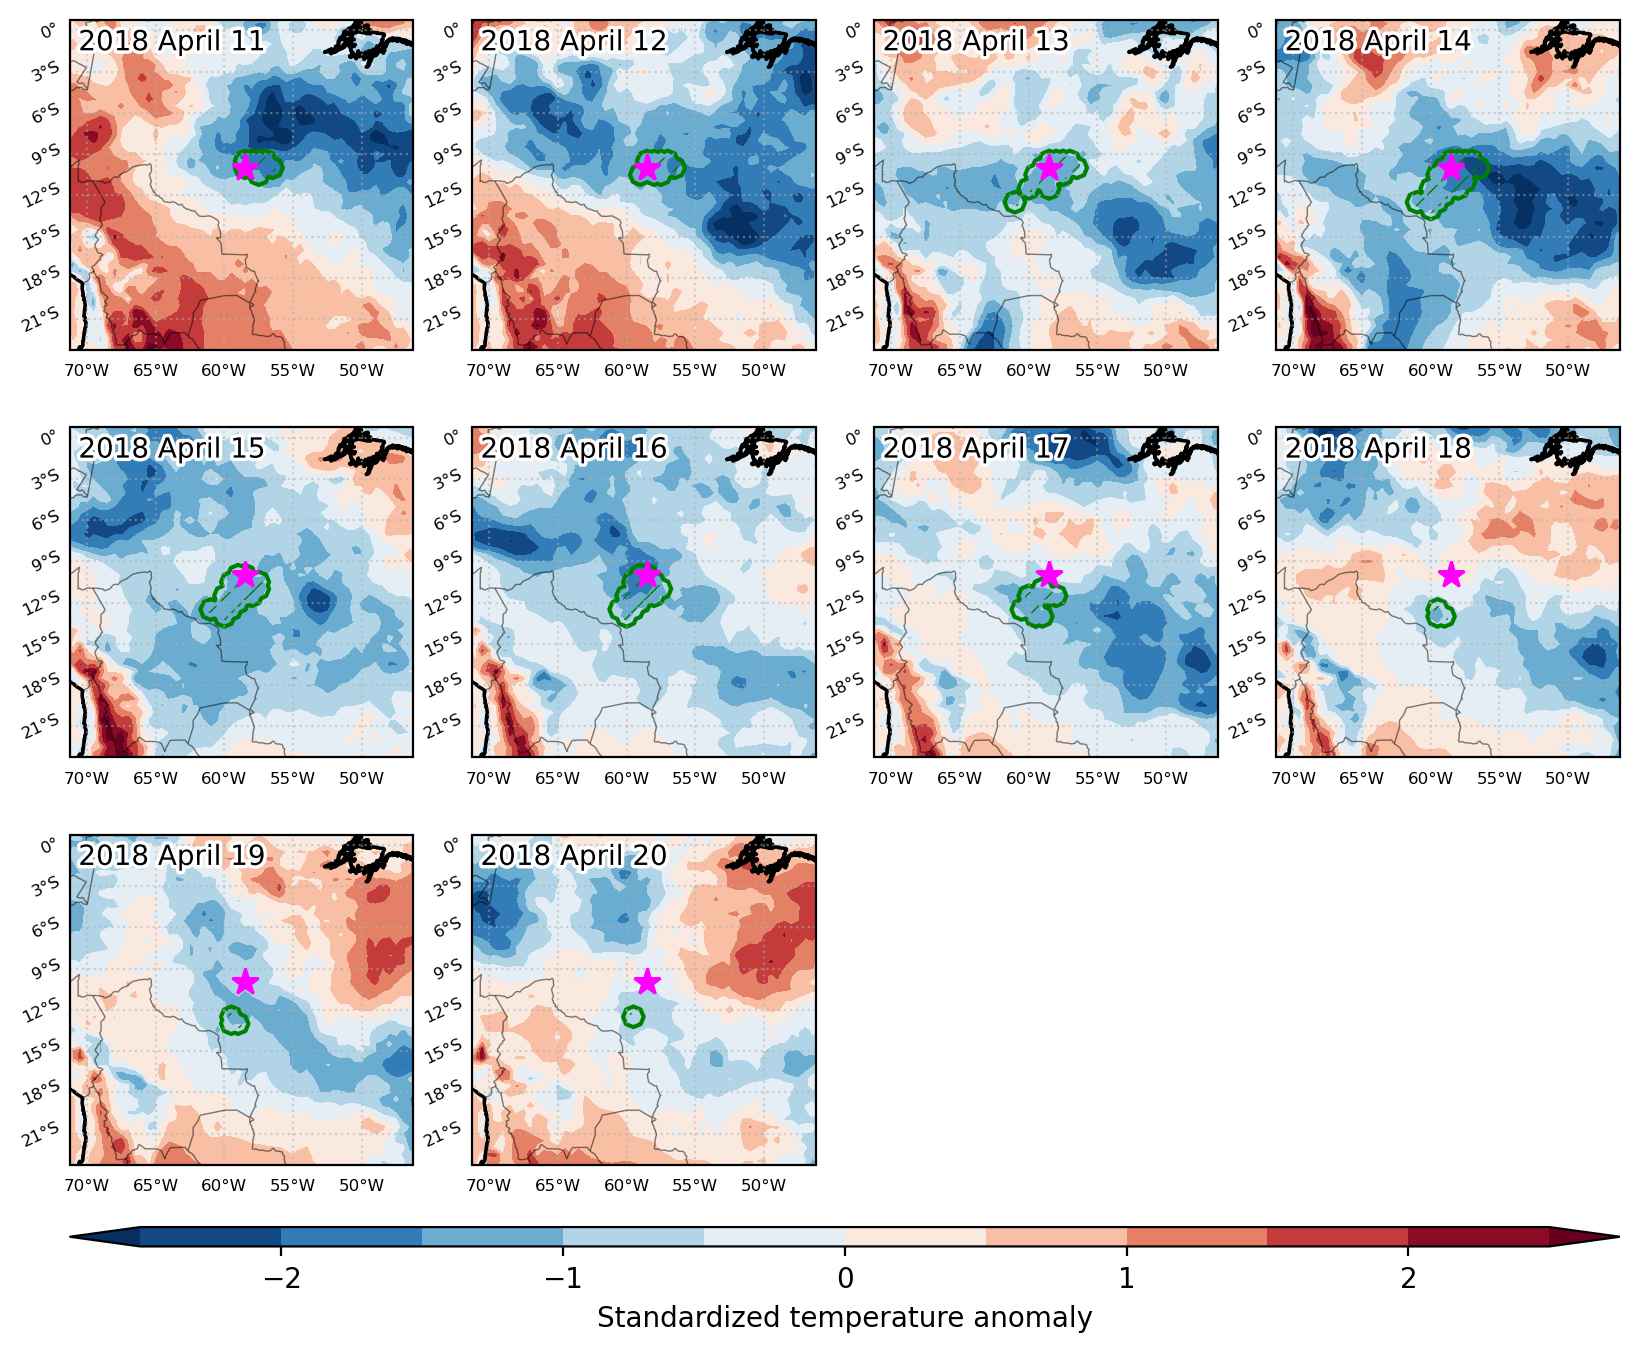
Cold spell occuring from April 11 2018 to April 20 2018 at -10.0°S 301.5°E

Download data: JSON

Event type: Cold spell

Countries affected (identified with ArcGIS Online; provided only for geographical reference):

  • Brazil

Duration: 10 days

Time span: April 11 2018 to April 20 2018

Statistics over entire affected area:

  • Mean temperature anomaly: -1.4 °C
  • Mean temperature: 23.4 °C
  • Minimum temperature anomaly: -2.6 °C
  • Minimum temperature: 22.2 °C

Event center: -10.0°S 301.5°E

Area affected: 103115 km$^2$


Fig. 1: Map of most extreme temperature anomalies (standardized) experienced during the event. The purple star indicates the center of the extreme event. Green hatching illustrates all areas under the effect of extremes at some time during the event.


Fig. 2: Evolution of temperature at the center of the event. The climatological percentile distribution is illustrated with color shadings.


Fig. 3: Maps illustrating the evolution of standardized temperature anomalies during the event.

Event ID: Cold_spell_2018-Apr-11_to_2018-Apr-20_301.5_-10.0

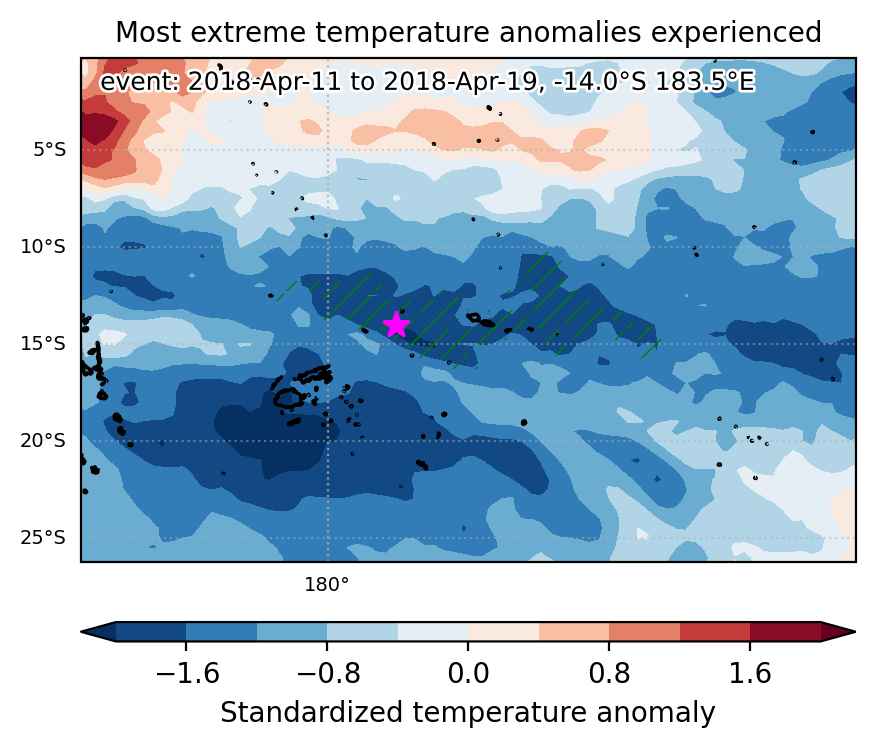
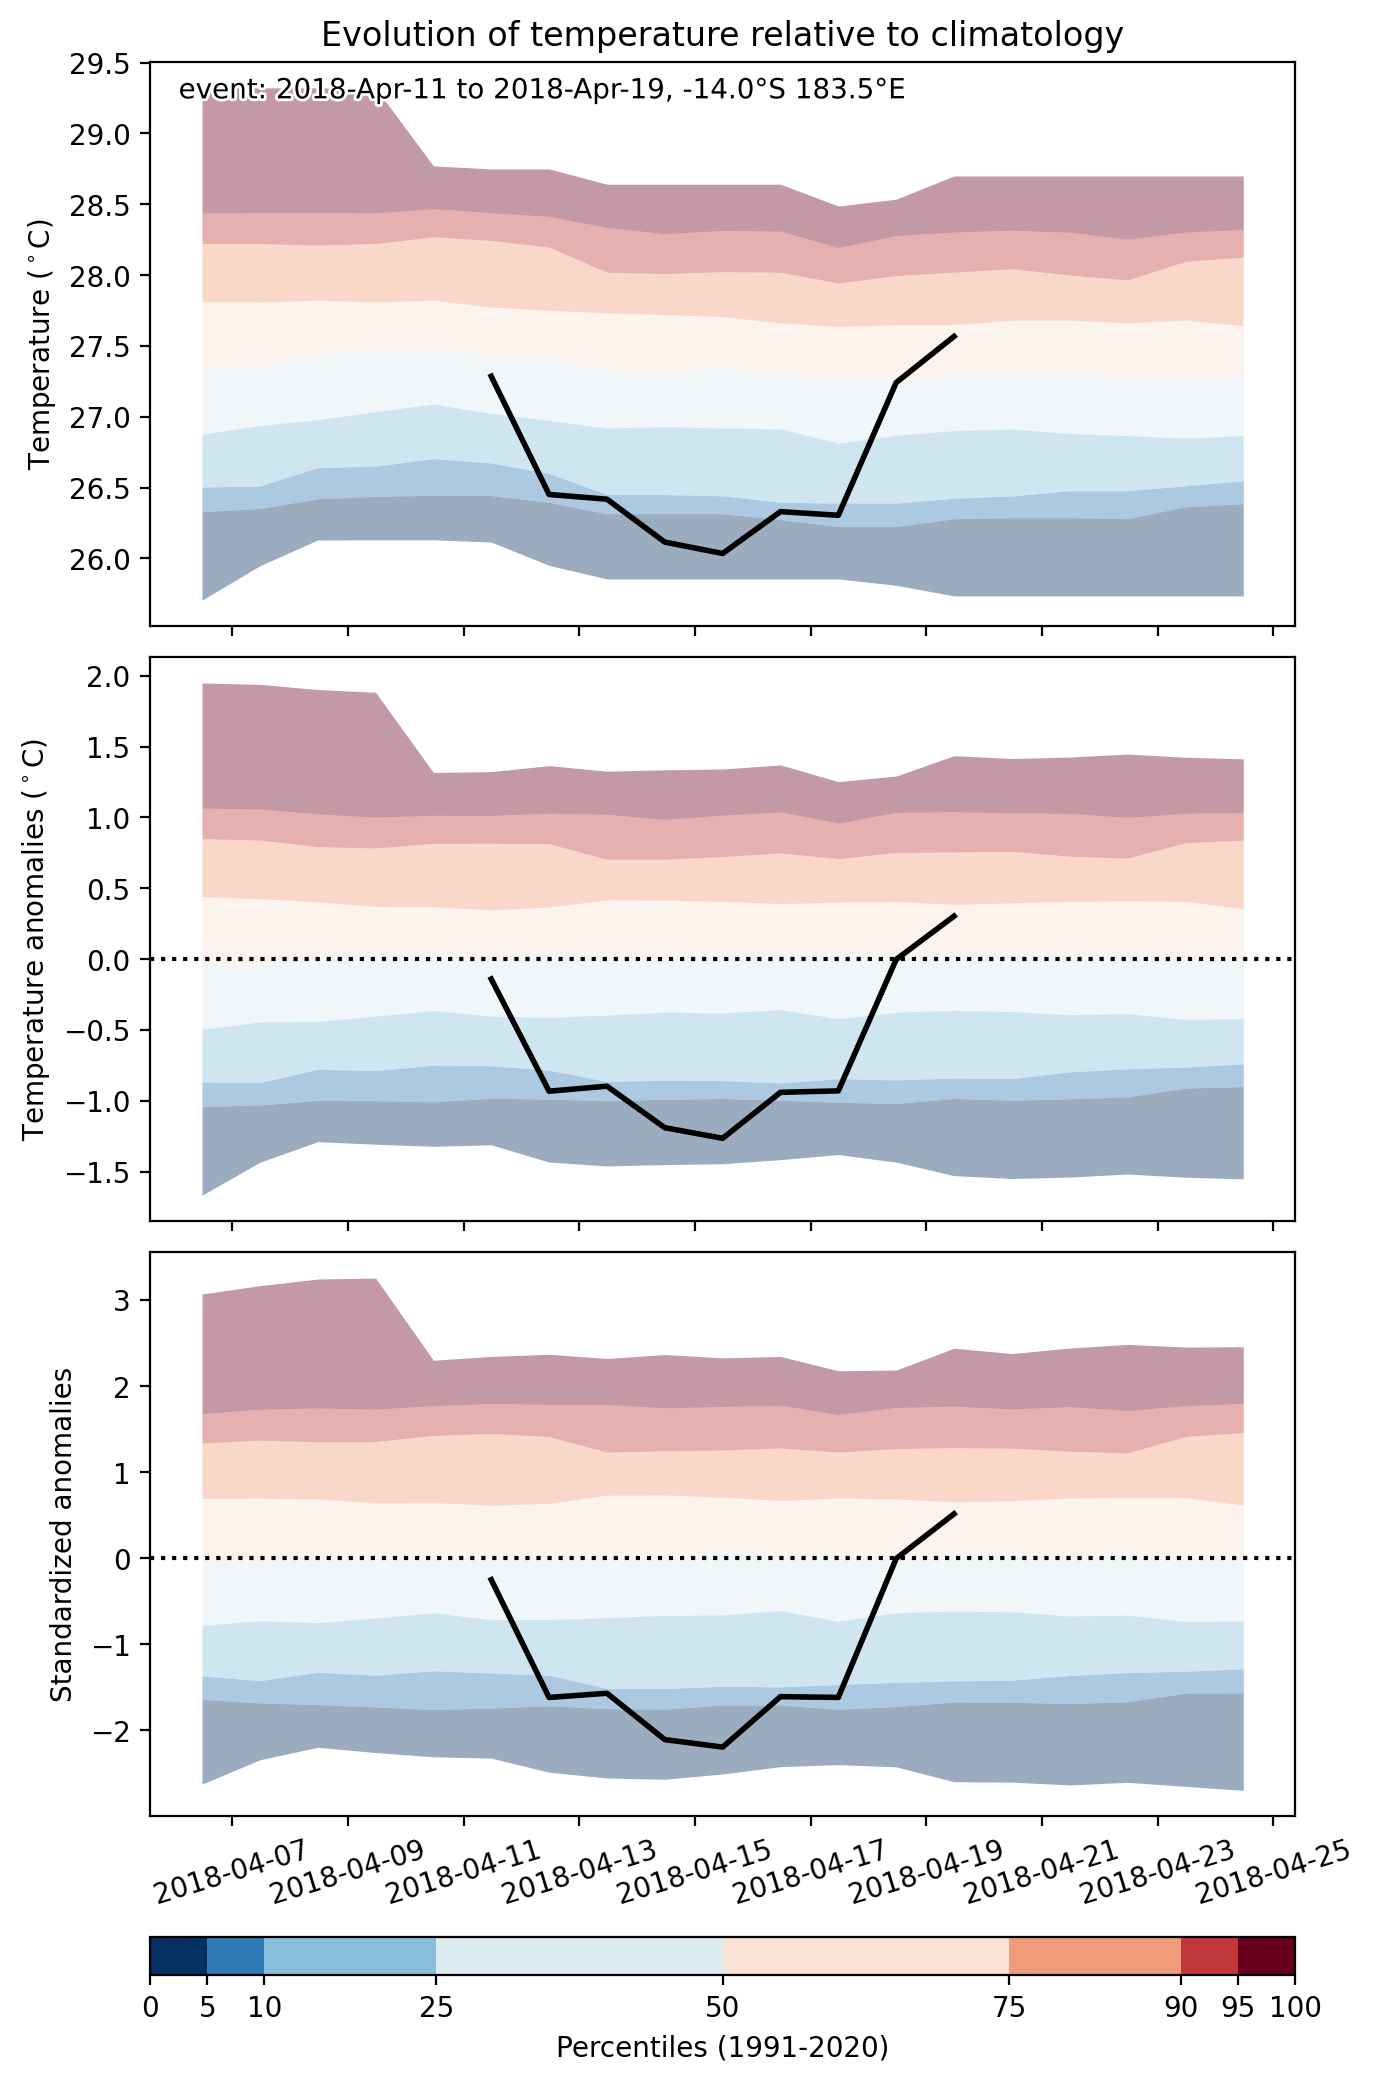
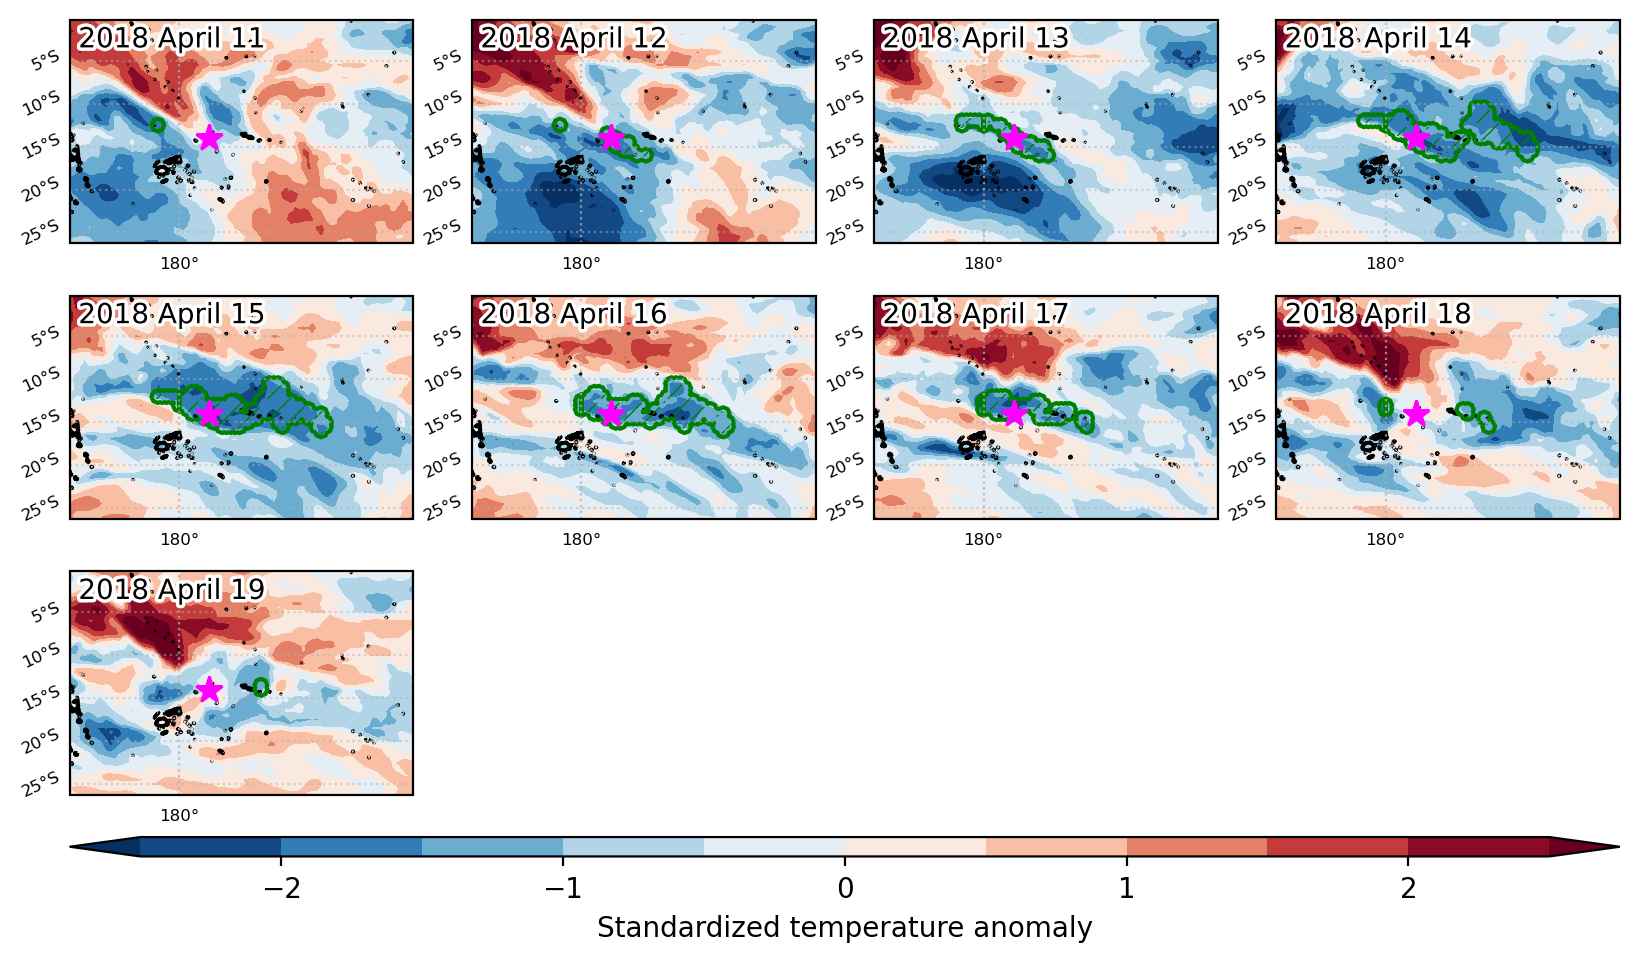
Cold spell occuring from April 11 2018 to April 19 2018 at -14.0°S 183.5°E

Download data: JSON

Event type: Cold spell

Countries affected (identified with ArcGIS Online; provided only for geographical reference):

  • Samoa

Duration: 9 days

Time span: April 11 2018 to April 19 2018

Statistics over entire affected area:

  • Mean temperature anomaly: -1.0 °C
  • Mean temperature: 26.3 °C
  • Minimum temperature anomaly: -1.5 °C
  • Minimum temperature: 25.4 °C

Event center: -14.0°S 183.5°E

Area affected: 468826 km$^2$


Fig. 1: Map of most extreme temperature anomalies (standardized) experienced during the event. The purple star indicates the center of the extreme event. Green hatching illustrates all areas under the effect of extremes at some time during the event.


Fig. 2: Evolution of temperature at the center of the event. The climatological percentile distribution is illustrated with color shadings.


Fig. 3: Maps illustrating the evolution of standardized temperature anomalies during the event.

Event ID: Cold_spell_2018-Apr-11_to_2018-Apr-19_183.5_-14.0

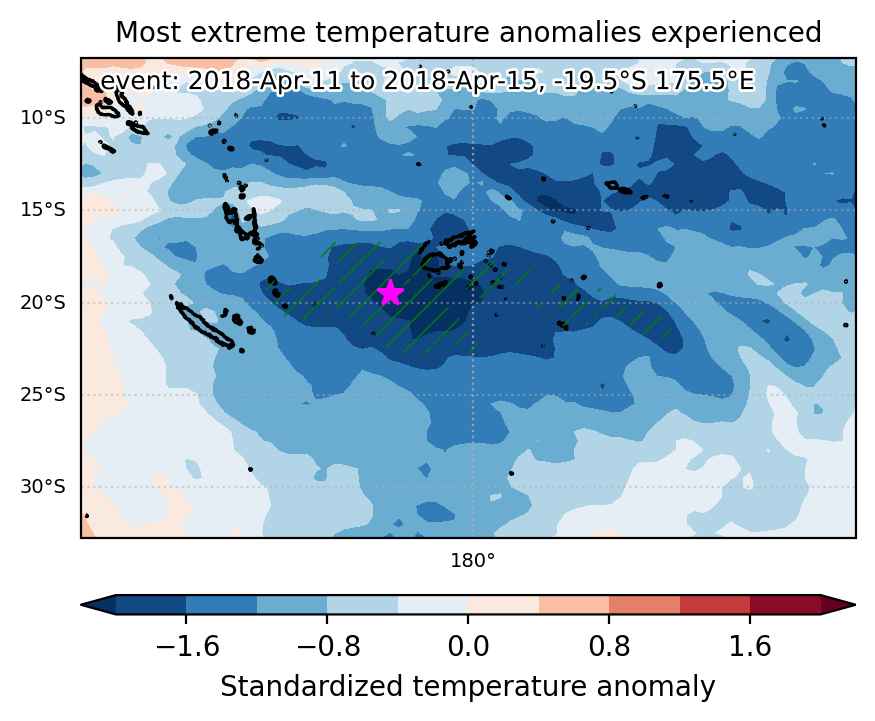
Cold spell occuring from April 11 2018 to April 15 2018 at -19.5°S 175.5°E

Download data: JSON

Event type: Cold spell

Countries affected (identified with ArcGIS Online; provided only for geographical reference):

  • Fiji

Duration: 5 days

Time span: April 11 2018 to April 15 2018

Statistics over entire affected area:

  • Mean temperature anomaly: -1.3 °C
  • Mean temperature: 24.8 °C
  • Minimum temperature anomaly: -2.4 °C
  • Minimum temperature: 20.9 °C

Event center: -19.5°S 175.5°E

Area affected: 587585 km$^2$


Fig. 1: Map of most extreme temperature anomalies (standardized) experienced during the event. The purple star indicates the center of the extreme event. Green hatching illustrates all areas under the effect of extremes at some time during the event.


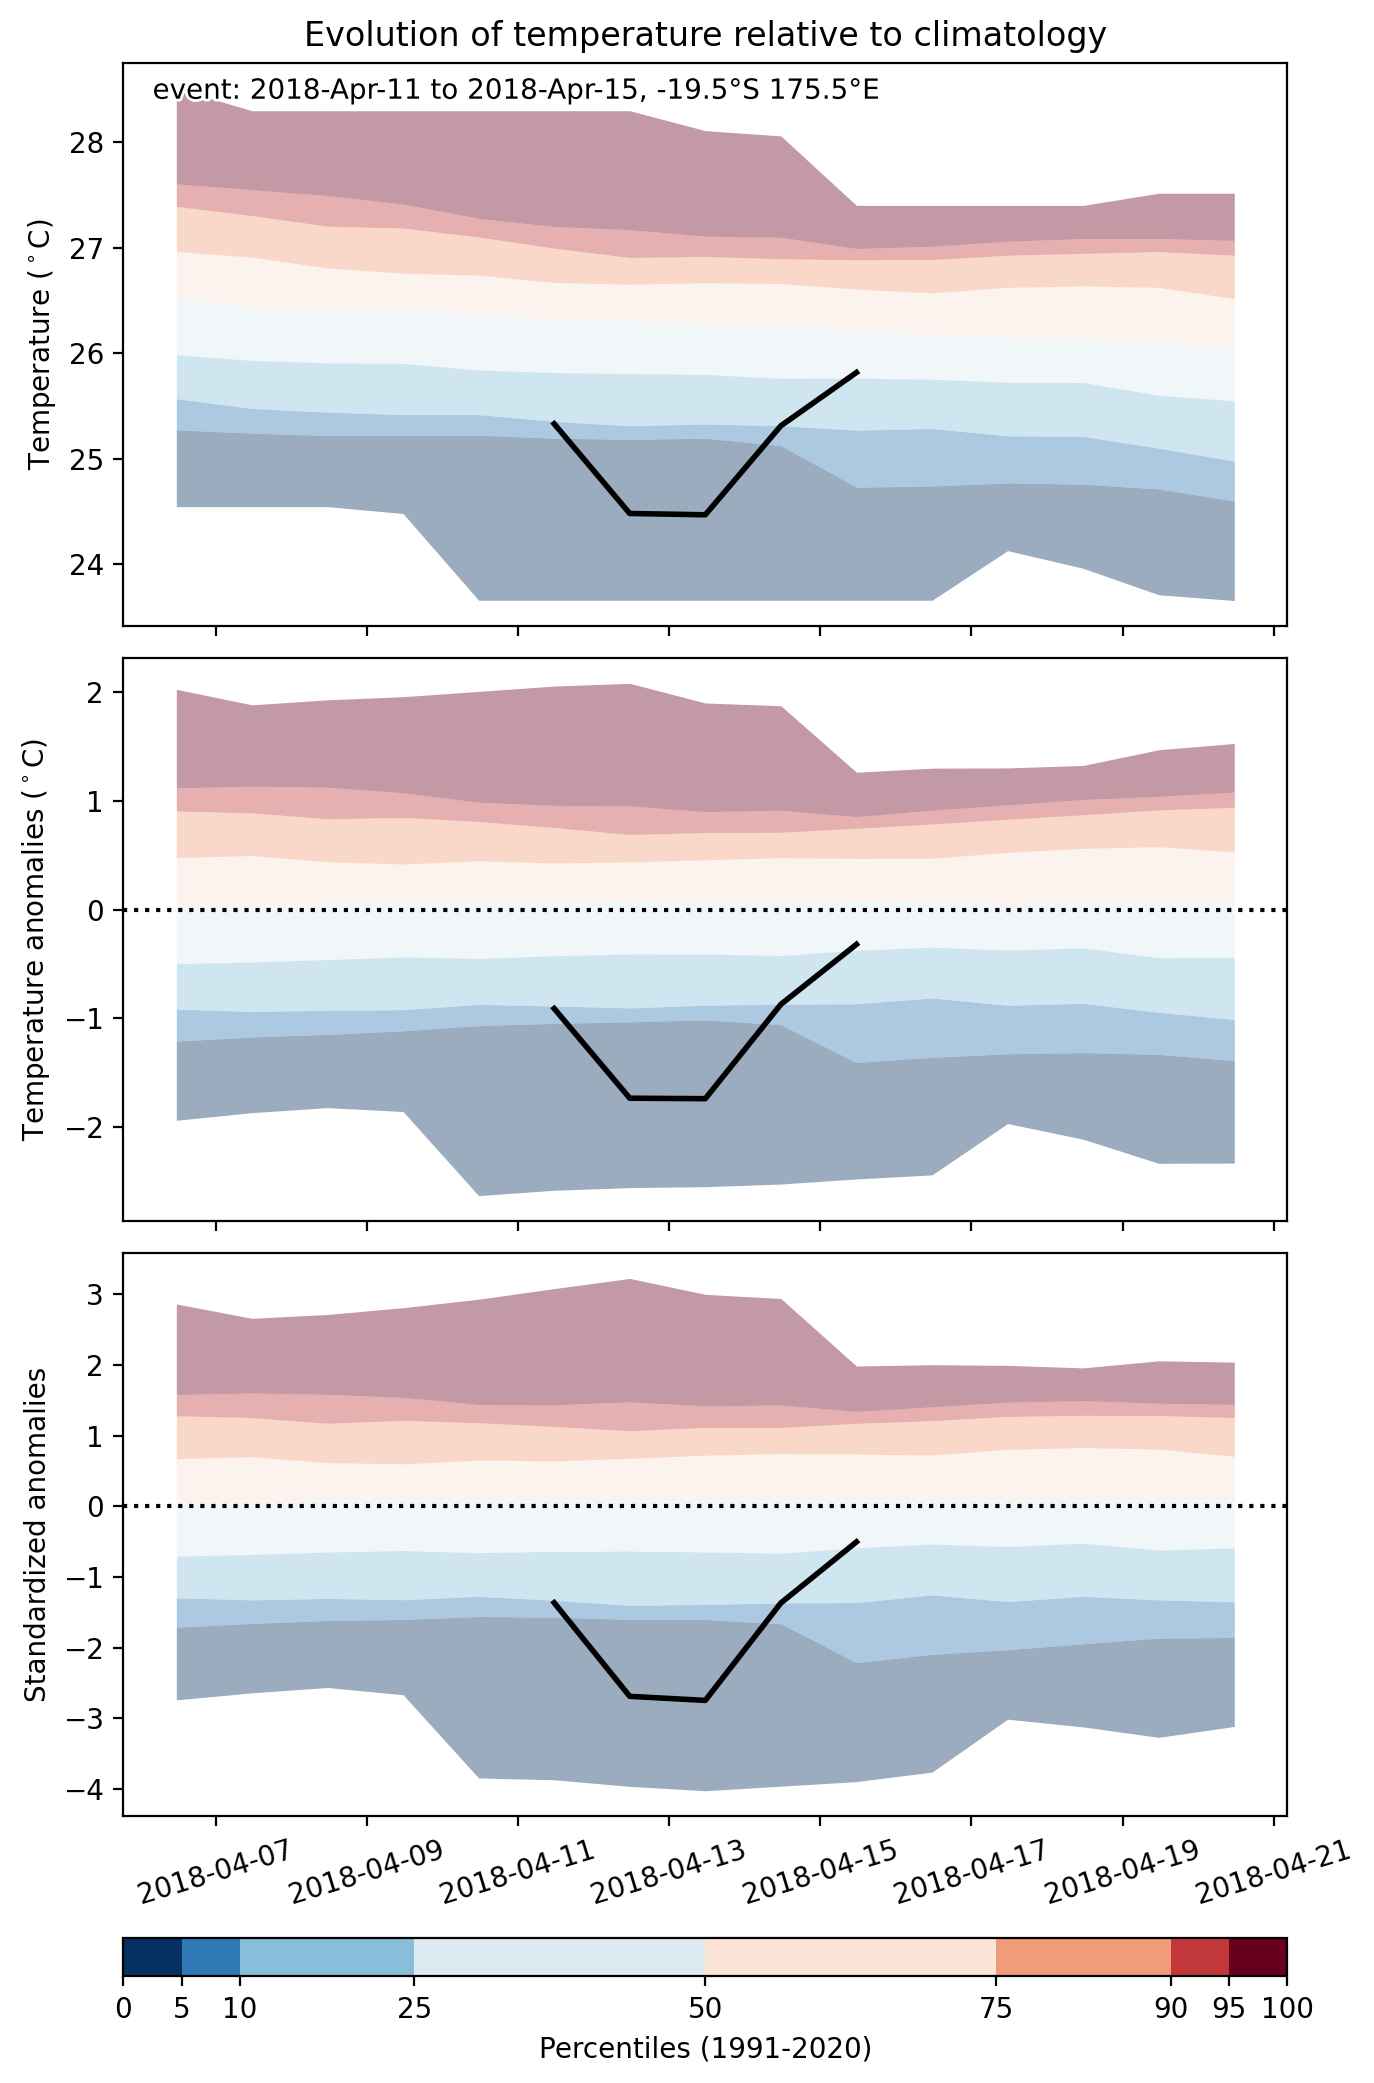
Fig. 2: Evolution of temperature at the center of the event. The climatological percentile distribution is illustrated with color shadings.


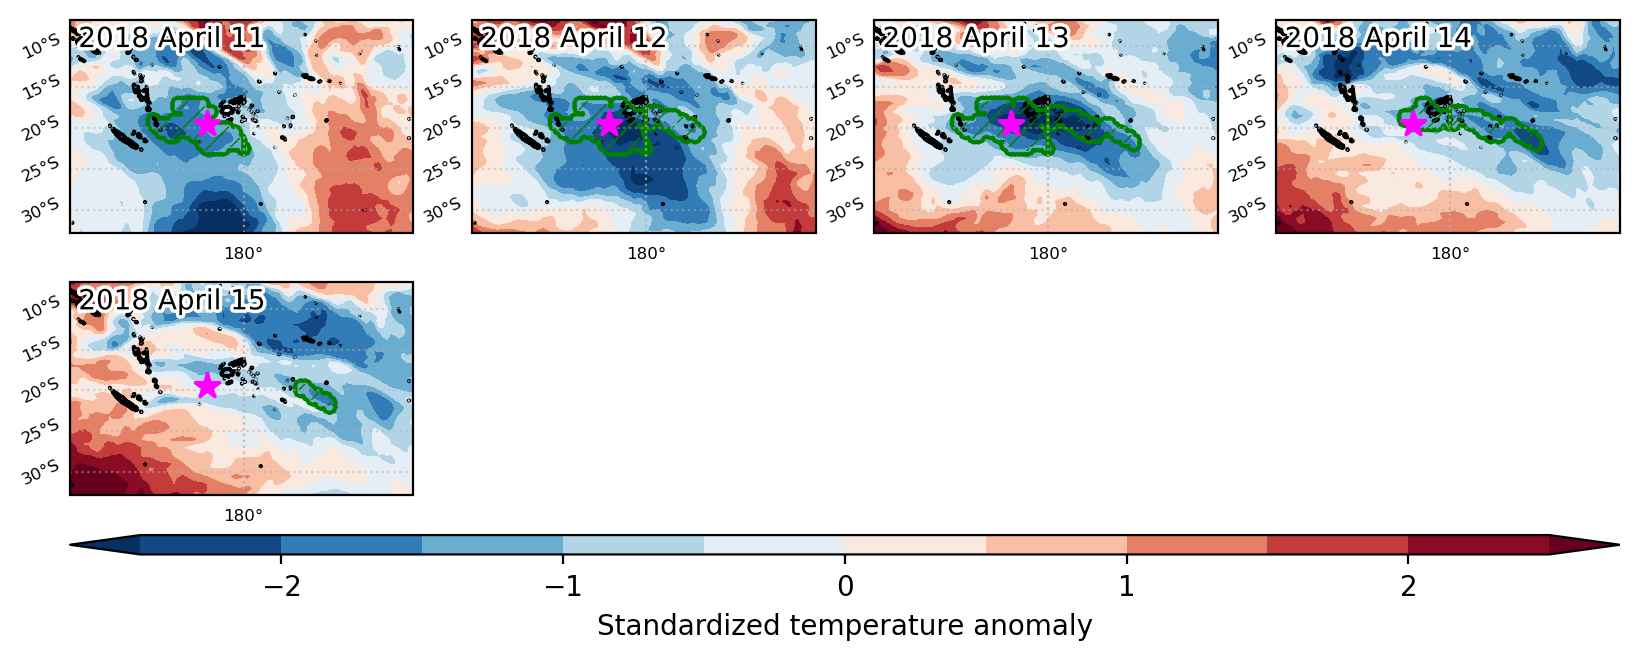
Fig. 3: Maps illustrating the evolution of standardized temperature anomalies during the event.

Event ID: Cold_spell_2018-Apr-11_to_2018-Apr-15_175.5_-19.5

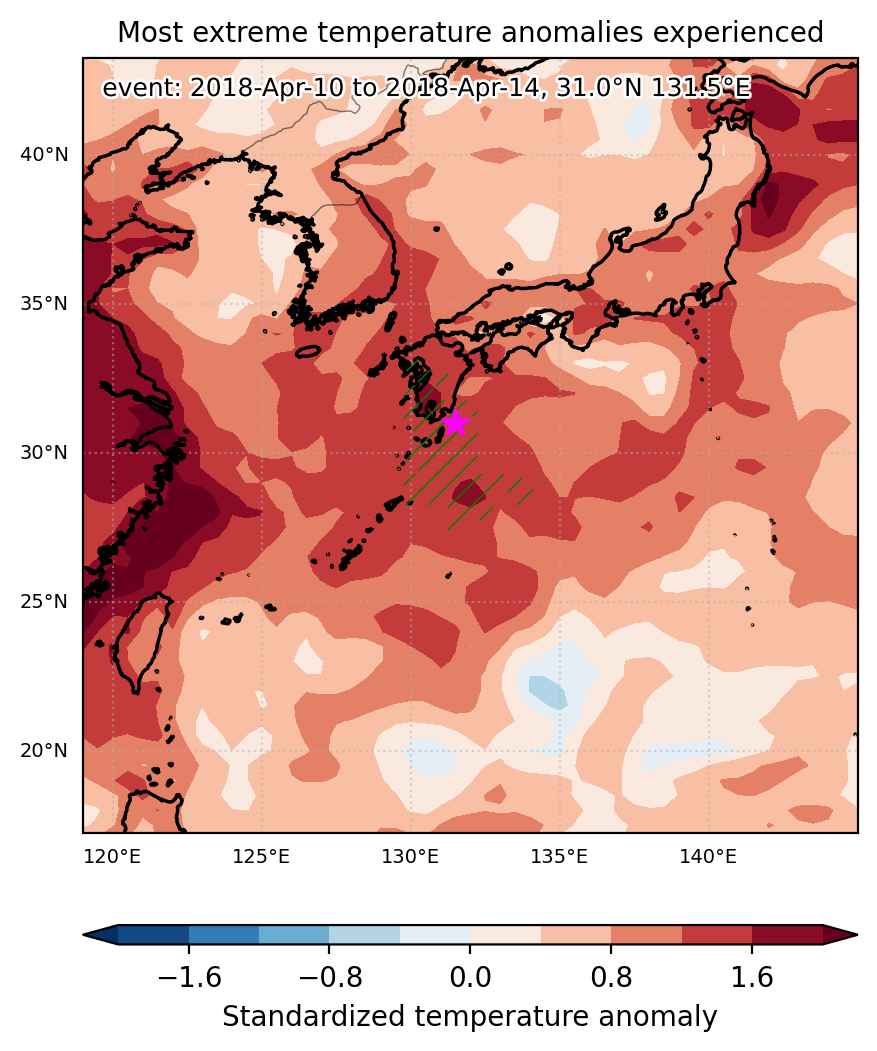
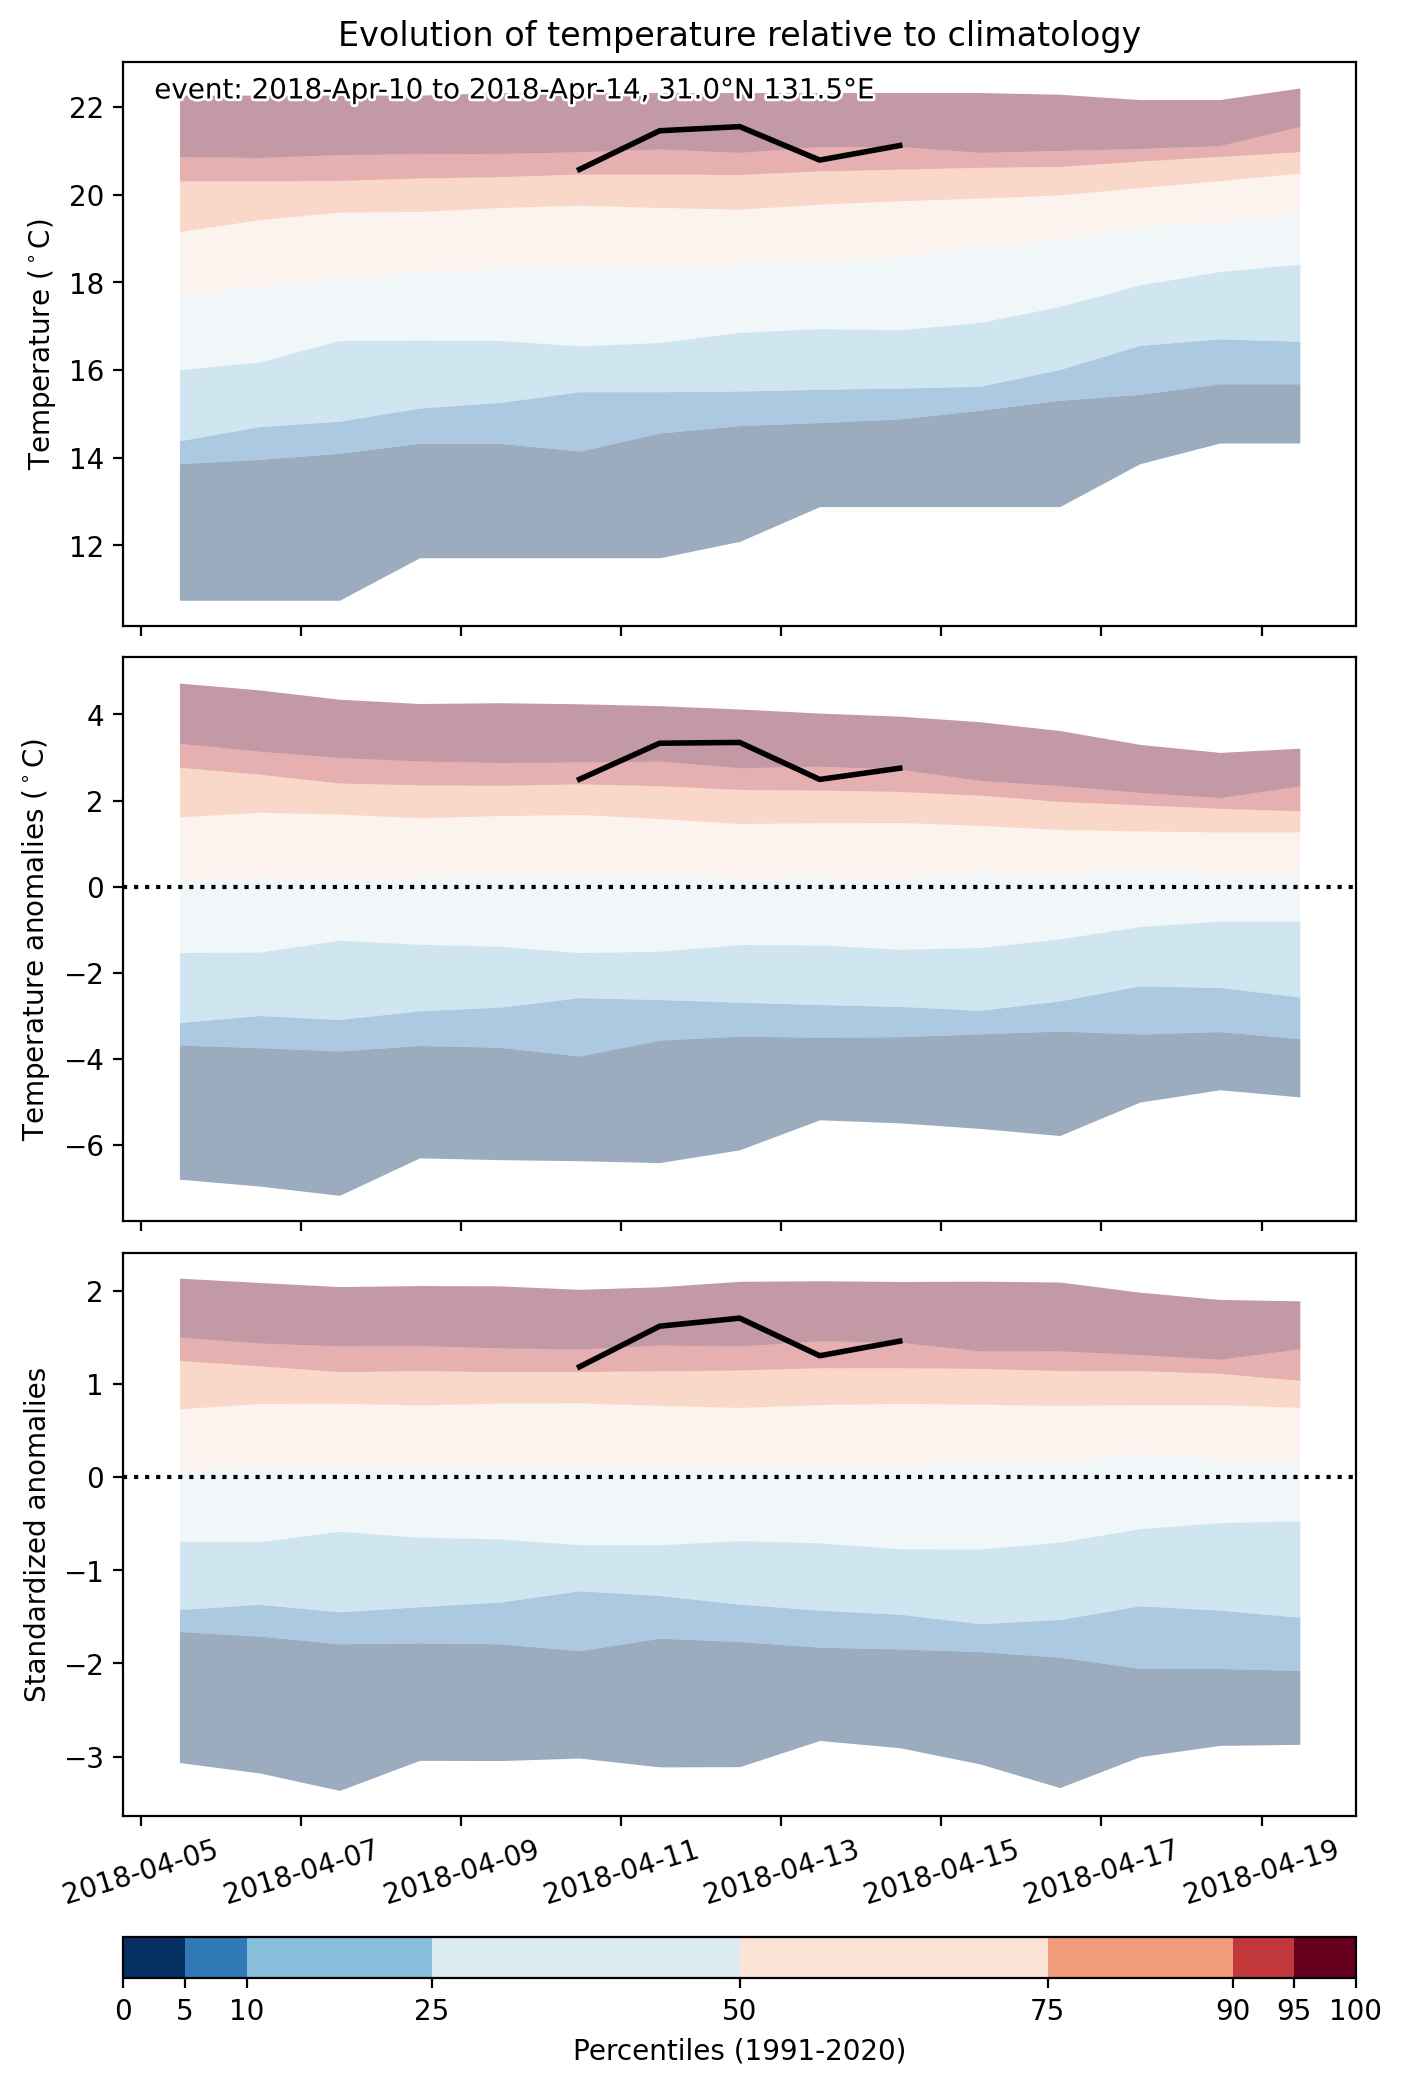
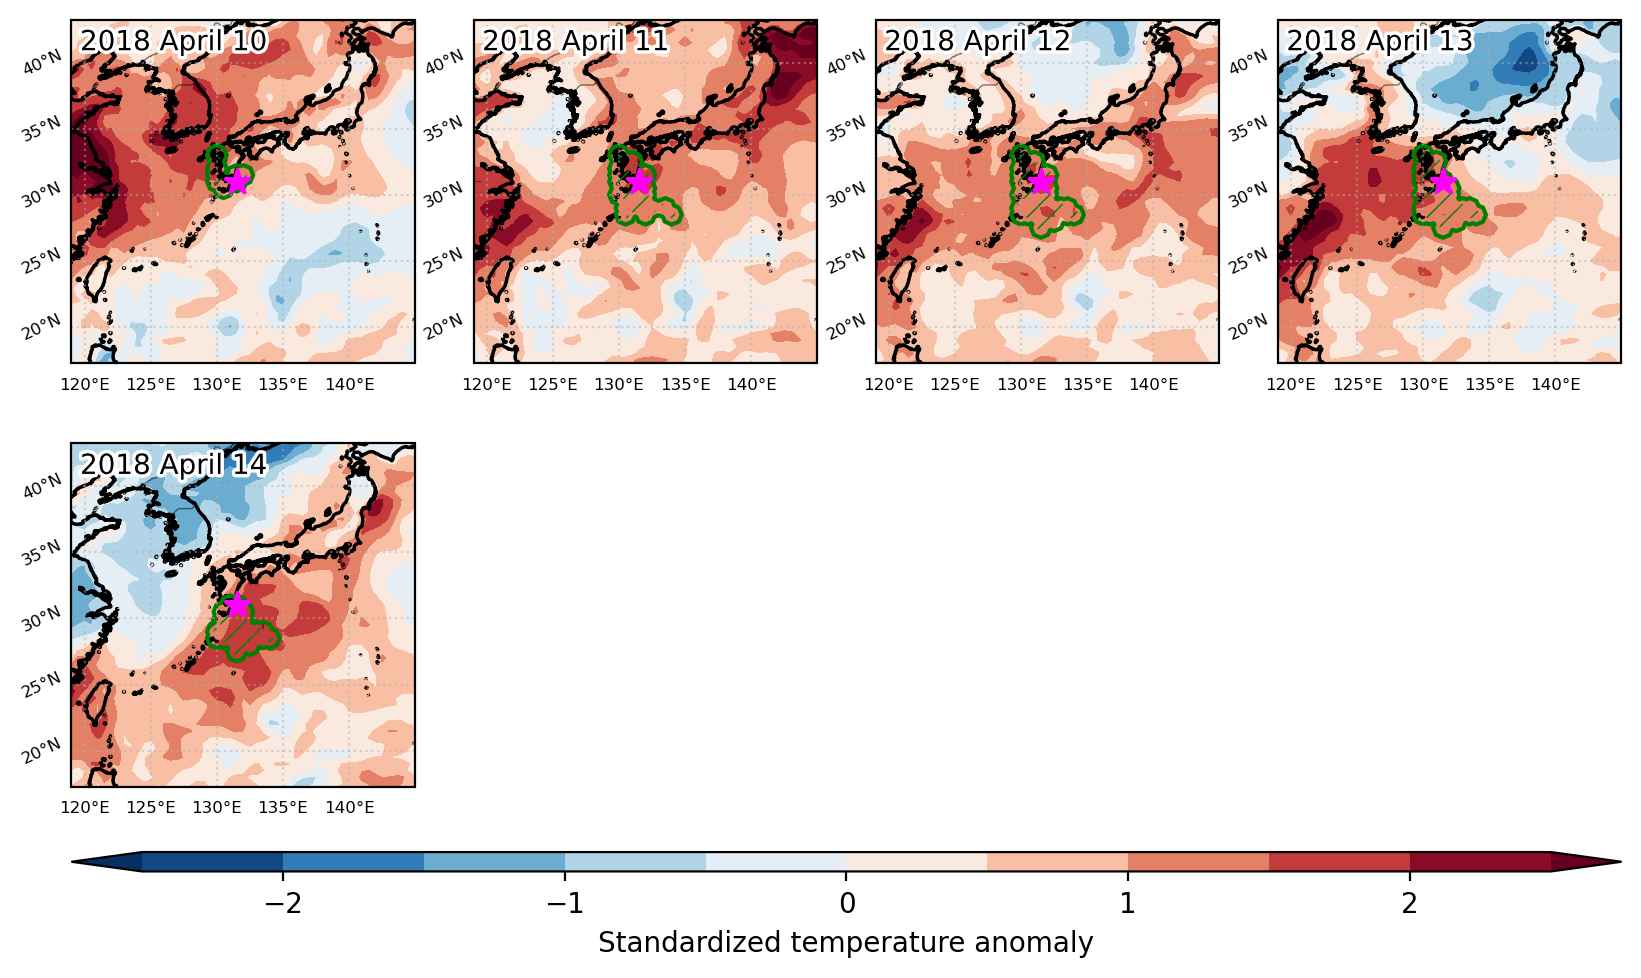
Heat wave occuring from April 10 2018 to April 14 2018 at 31.0°N 131.5°E

Download data: JSON

Event type: Heat wave

Countries affected (identified with ArcGIS Online; provided only for geographical reference):

  • Japan

Duration: 5 days

Time span: April 10 2018 to April 14 2018

Statistics over entire affected area:

  • Mean temperature anomaly: 2.8 °C
  • Mean temperature: 21.2 °C
  • Maximum temperature anomaly: 5.5 °C
  • Maximum temperature: 22.8 °C

Event center: 31.0°N 131.5°E

Area affected: 125914 km$^2$


Fig. 1: Map of most extreme temperature anomalies (standardized) experienced during the event. The purple star indicates the center of the extreme event. Green hatching illustrates all areas under the effect of extremes at some time during the event.


Fig. 2: Evolution of temperature at the center of the event. The climatological percentile distribution is illustrated with color shadings.


Fig. 3: Maps illustrating the evolution of standardized temperature anomalies during the event.

Event ID: Heat_wave_2018-Apr-10_to_2018-Apr-14_131.5_31.0

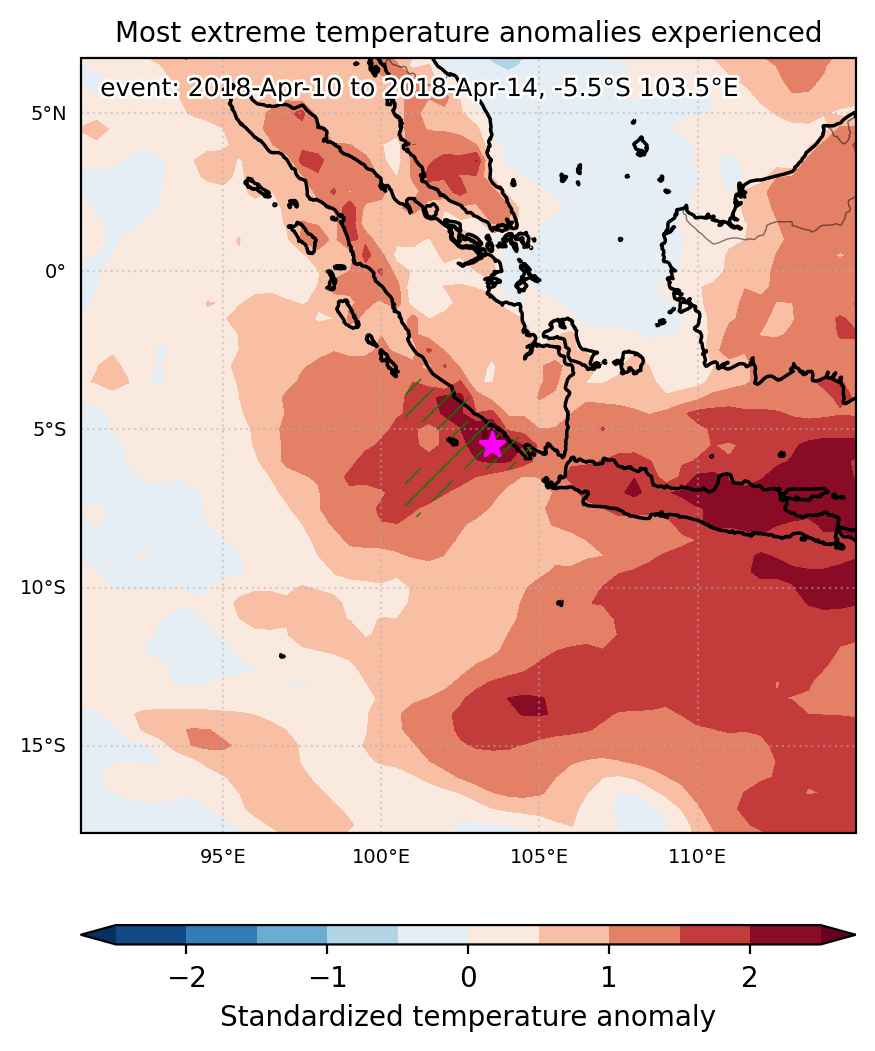
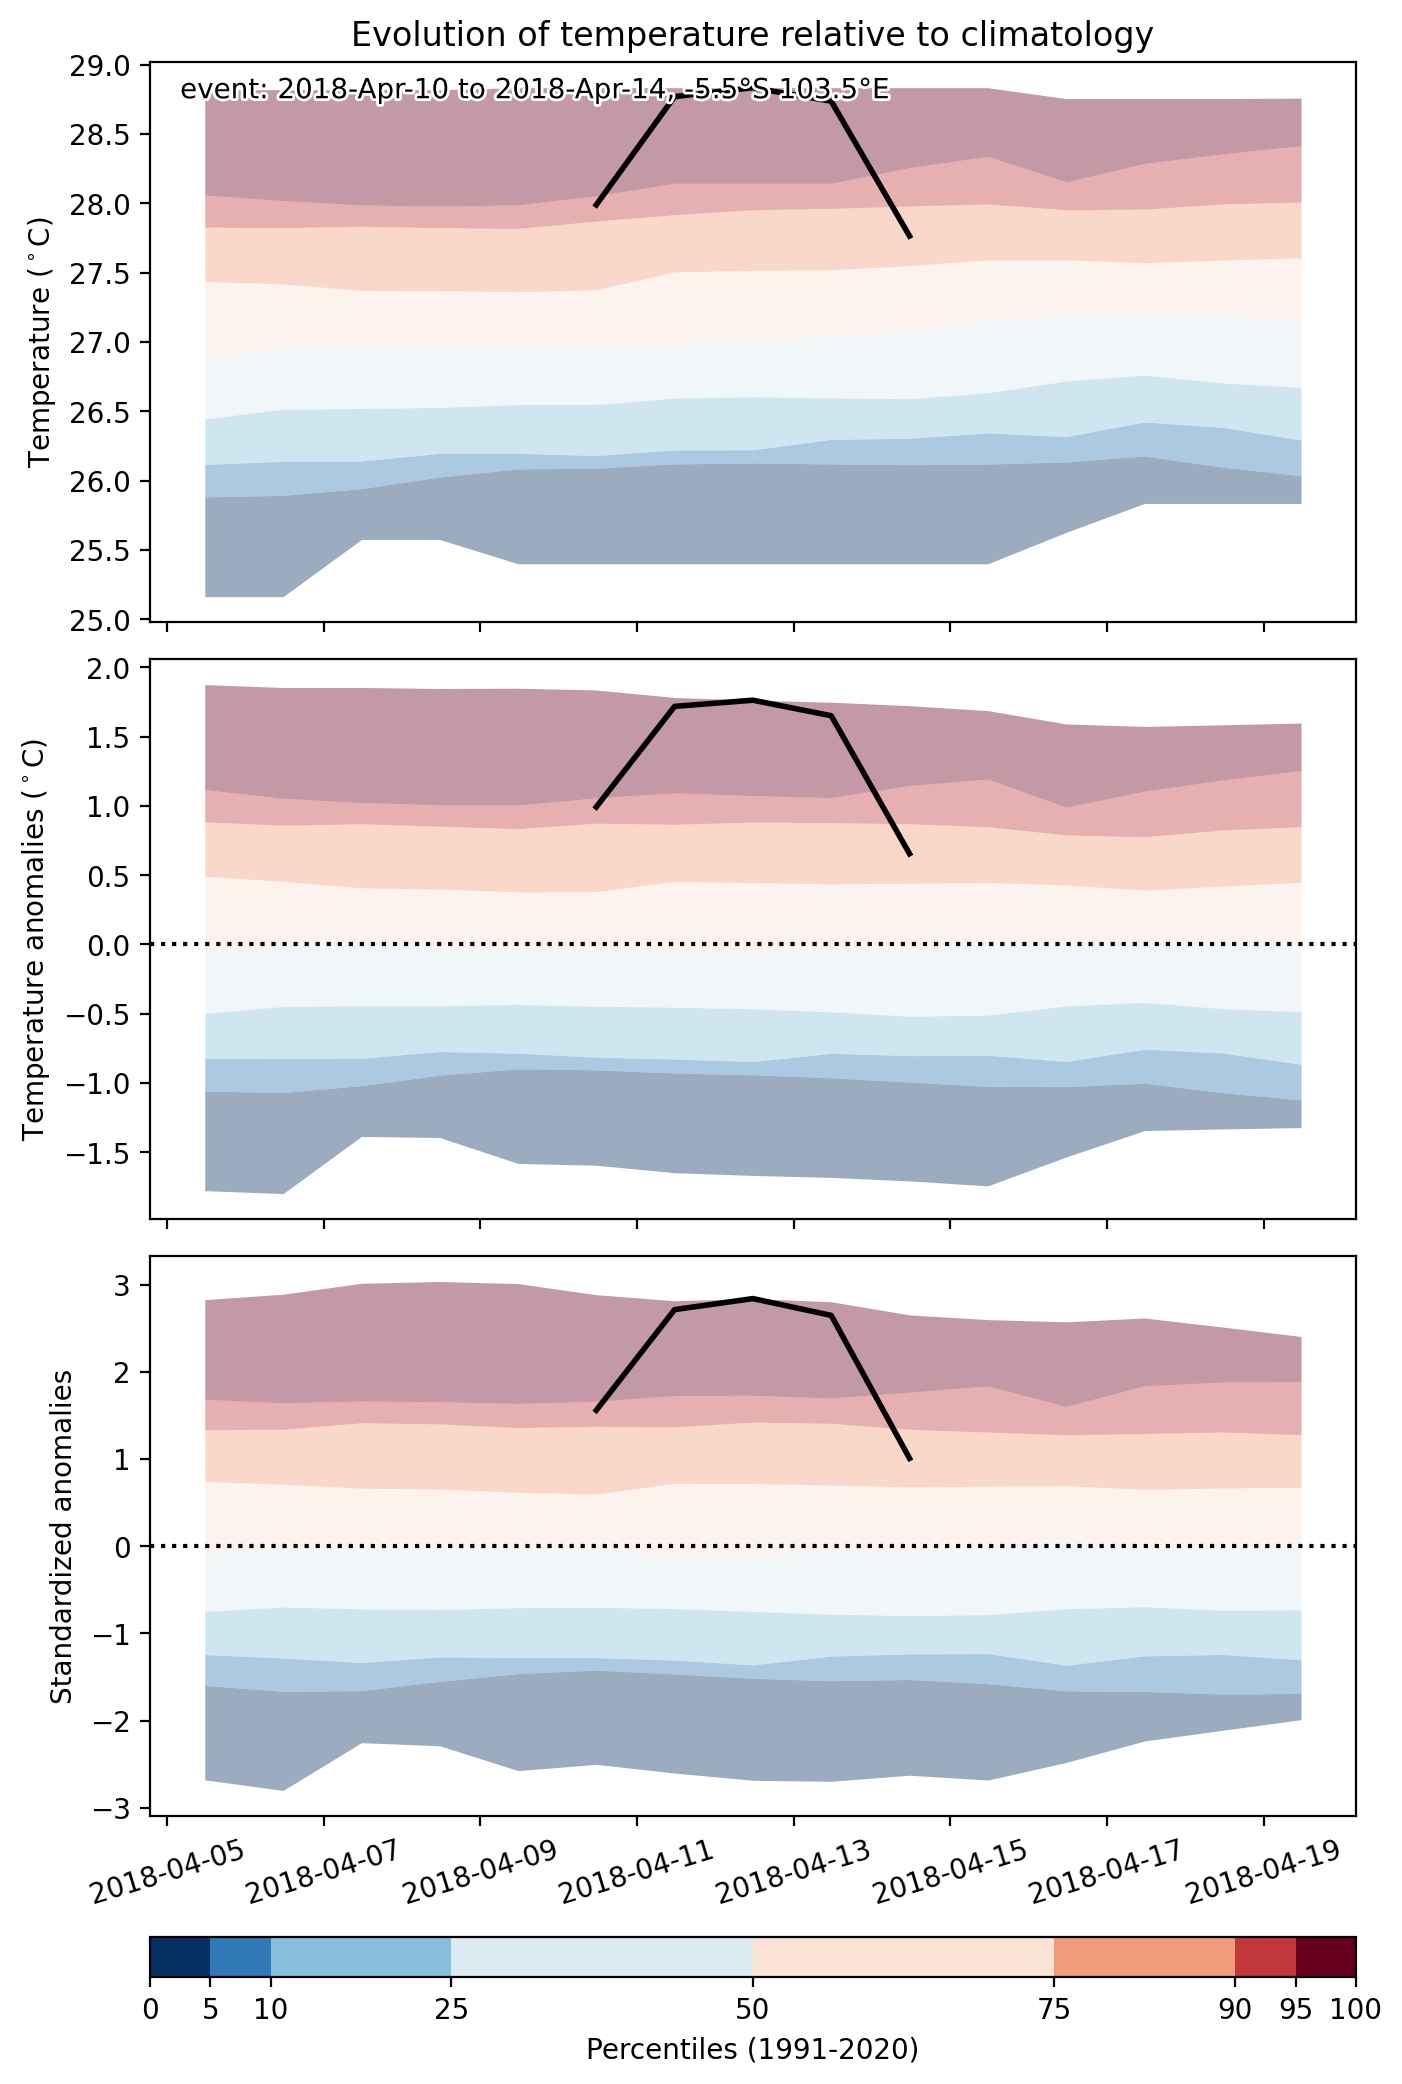
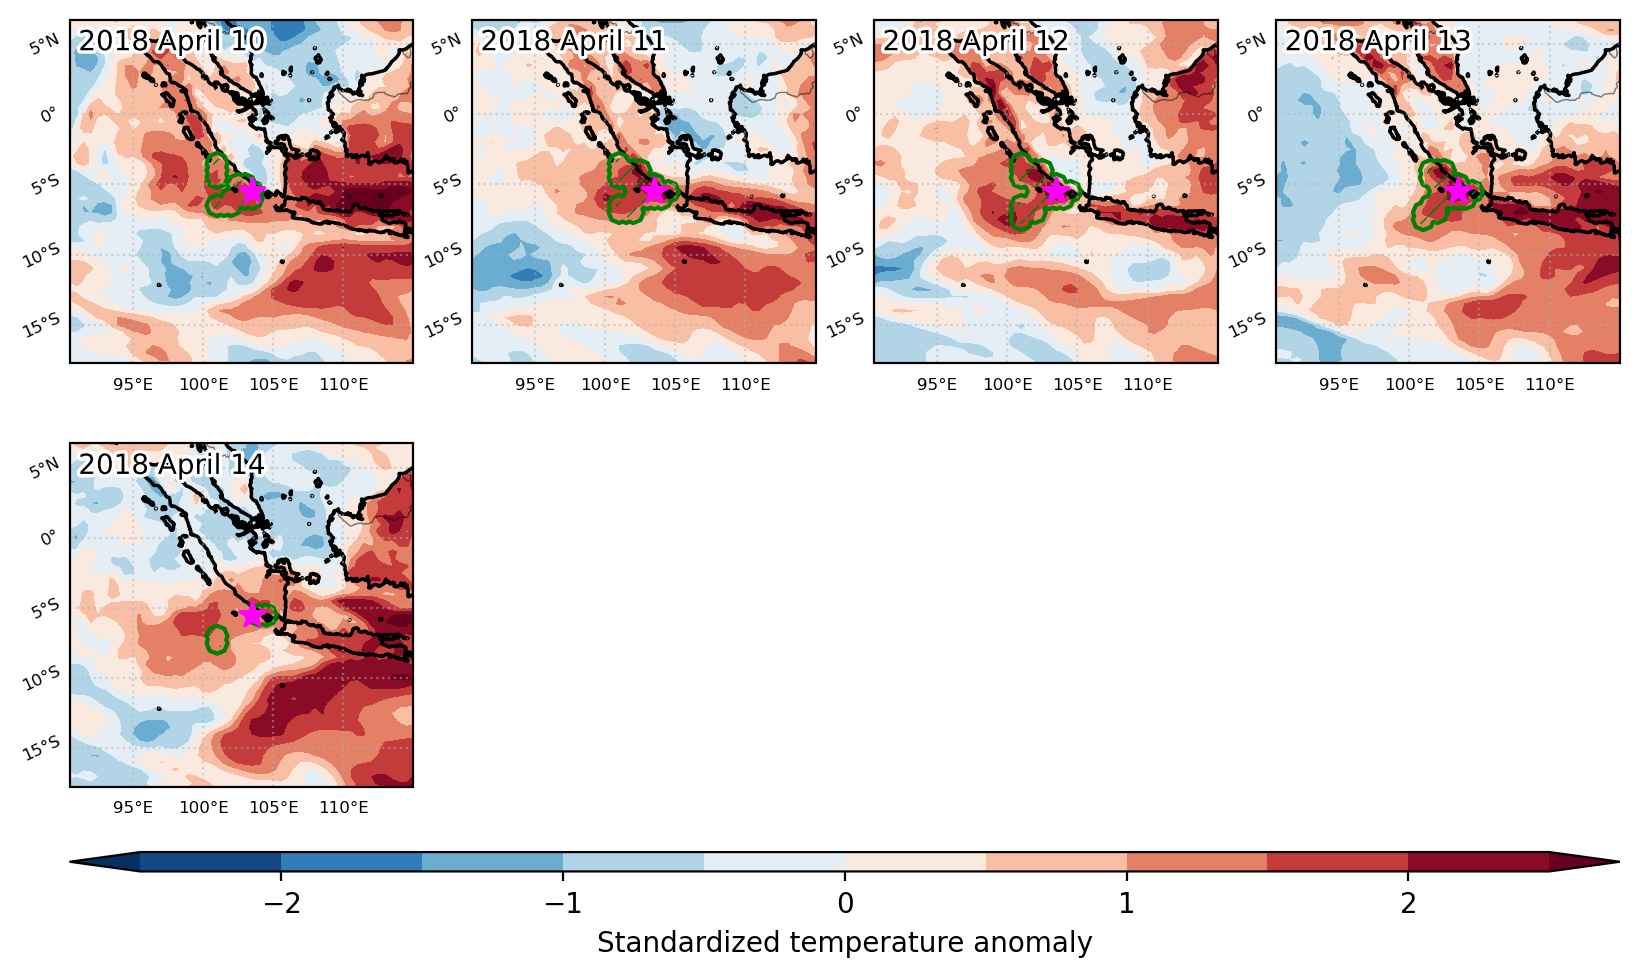
Heat wave occuring from April 10 2018 to April 14 2018 at -5.5°S 103.5°E

Download data: JSON

Event type: Heat wave

Countries affected (identified with ArcGIS Online; provided only for geographical reference):

  • Indonesia

Duration: 5 days

Time span: April 10 2018 to April 14 2018

Statistics over entire affected area:

  • Mean temperature anomaly: 1.2 °C
  • Mean temperature: 28.2 °C
  • Maximum temperature anomaly: 1.8 °C
  • Maximum temperature: 28.8 °C

Event center: -5.5°S 103.5°E

Area affected: 92300 km$^2$


Fig. 1: Map of most extreme temperature anomalies (standardized) experienced during the event. The purple star indicates the center of the extreme event. Green hatching illustrates all areas under the effect of extremes at some time during the event.


Fig. 2: Evolution of temperature at the center of the event. The climatological percentile distribution is illustrated with color shadings.


Fig. 3: Maps illustrating the evolution of standardized temperature anomalies during the event.

Event ID: Heat_wave_2018-Apr-10_to_2018-Apr-14_103.5_-5.5