Heat wave occuring from March 10 2018 to March 14 2018 at 47.0°N 24.0°E

Download data: JSON

Event type: Heat wave

Countries affected (identified with ArcGIS Online; provided only for geographical reference):

  • Czech Republic
  • Hungary
  • Poland
  • Romania
  • Slovakia
  • Ukraine

Duration: 5 days

Time span: March 10 2018 to March 14 2018

Statistics over entire affected area:

  • Mean temperature anomaly: 6.0 °C
  • Mean temperature: 9.1 °C
  • Maximum temperature anomaly: 9.0 °C
  • Maximum temperature: 14.0 °C

Event center: 47.0°N 24.0°E

Area affected: 327553 km$^2$
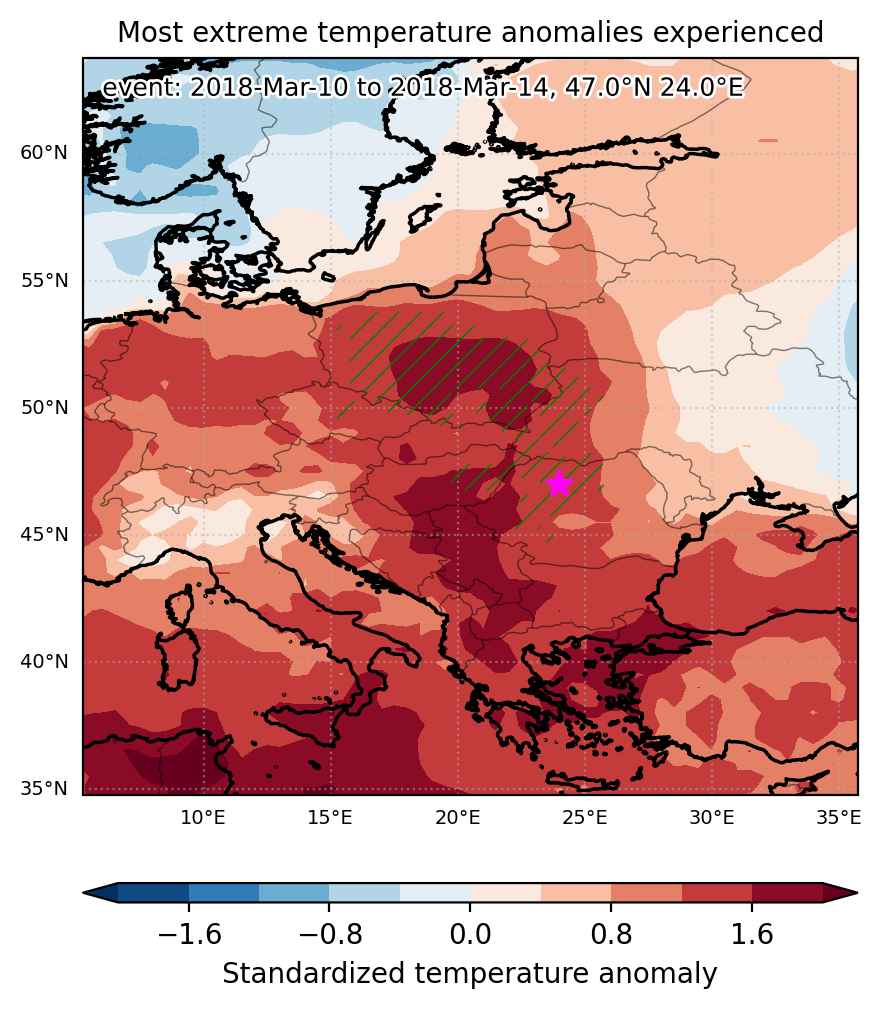

Fig. 1: Map of most extreme temperature anomalies (standardized) experienced during the event. The purple star indicates the center of the extreme event. Green hatching illustrates all areas under the effect of extremes at some time during the event.
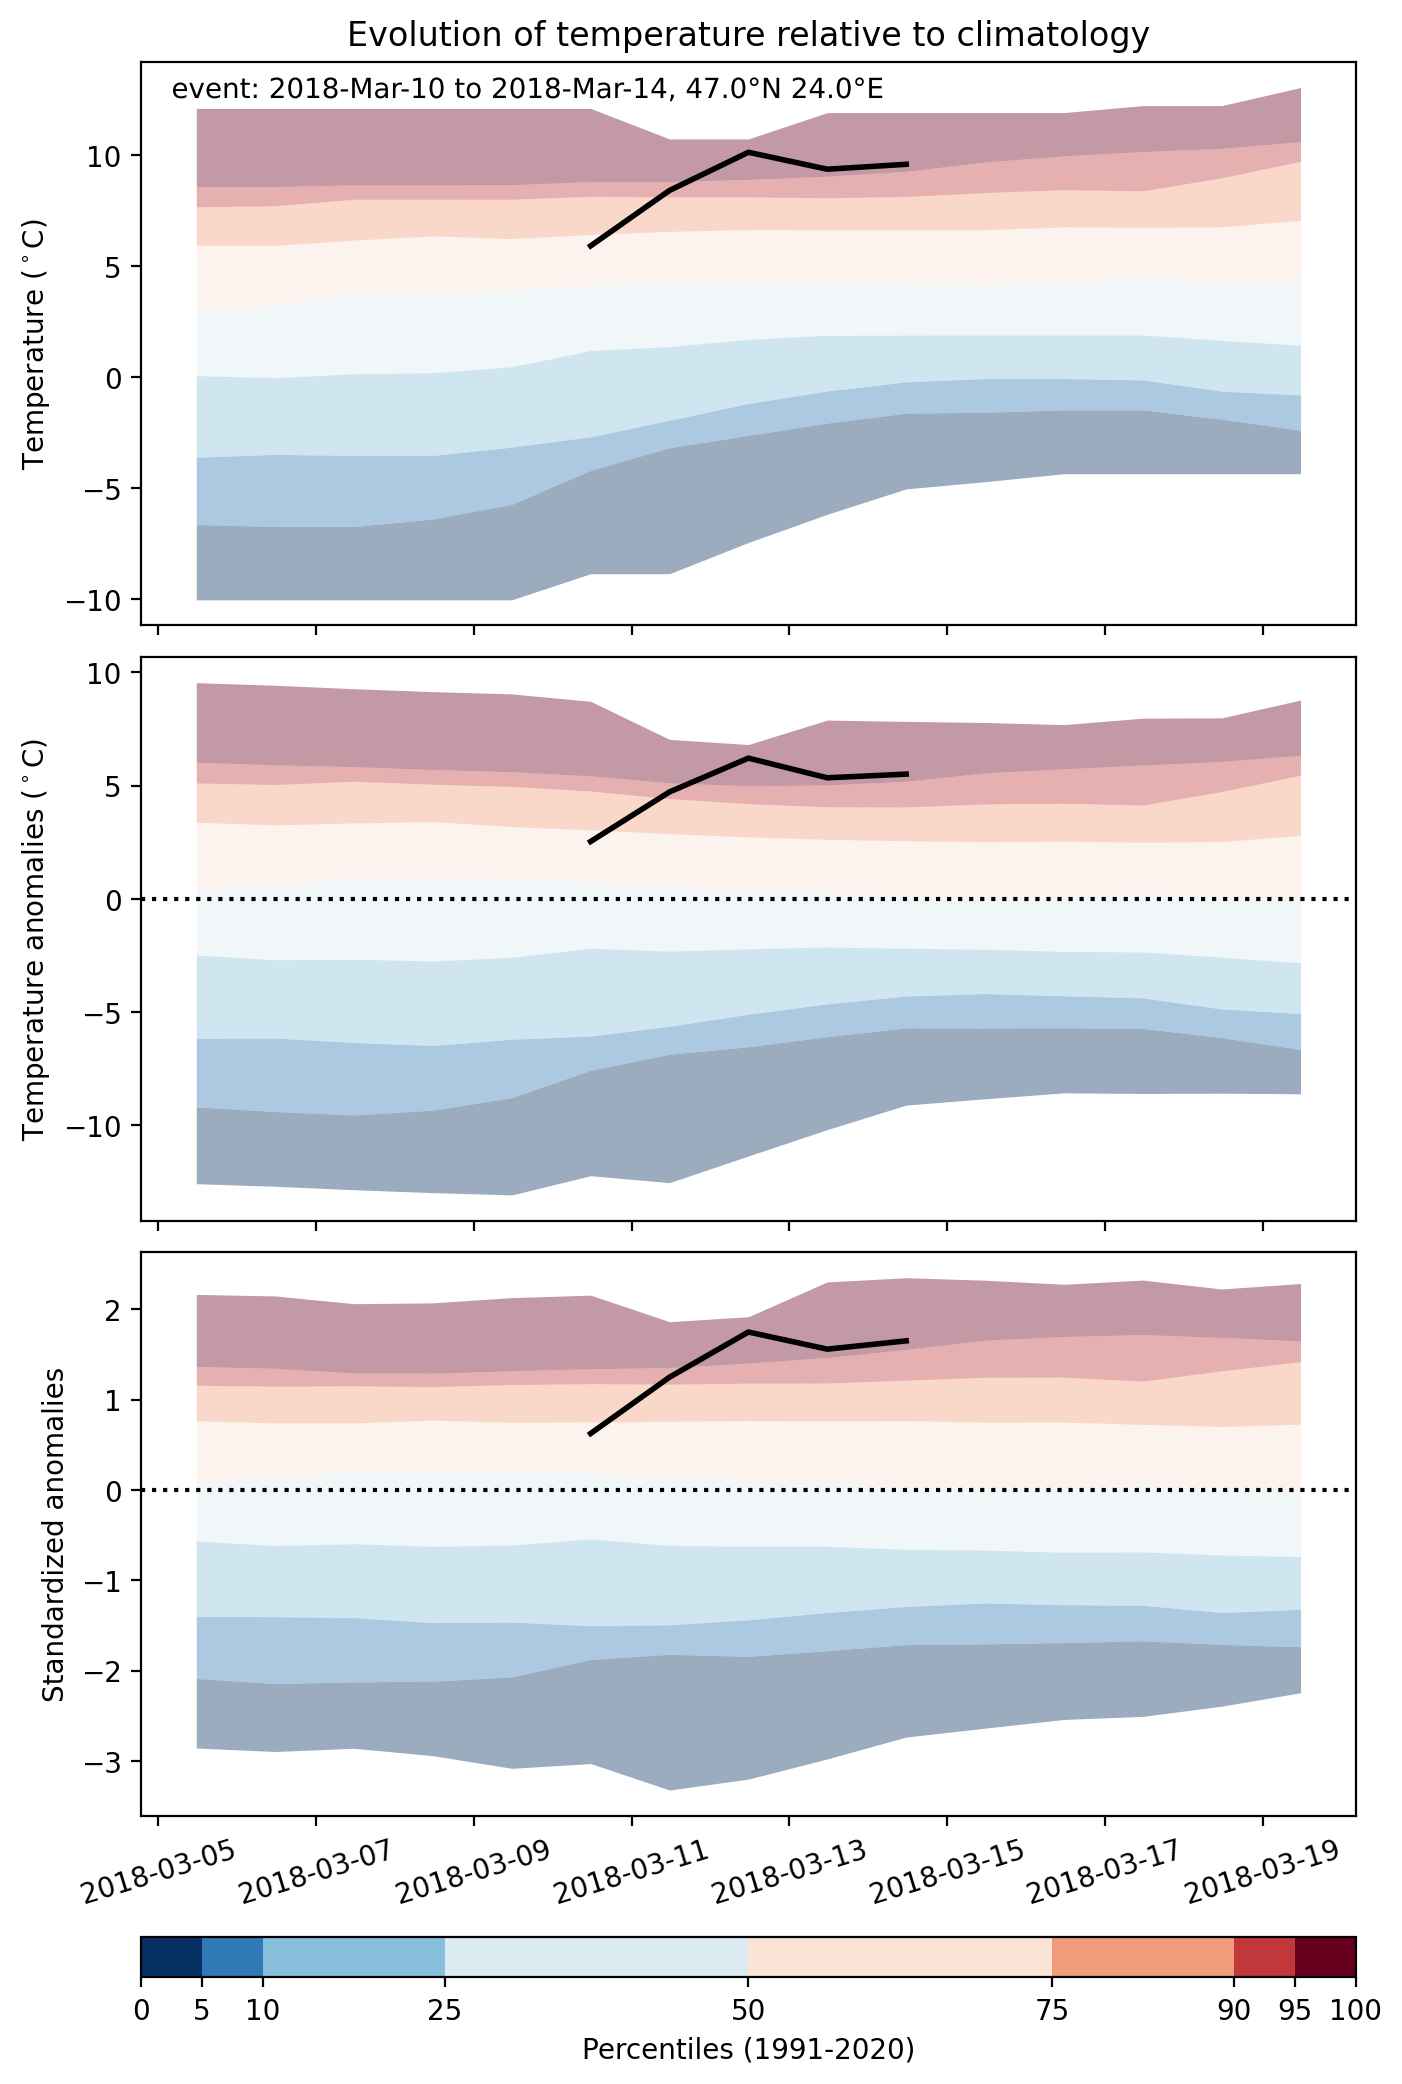


Fig. 2: Evolution of temperature at the center of the event. The climatological percentile distribution is illustrated with color shadings.
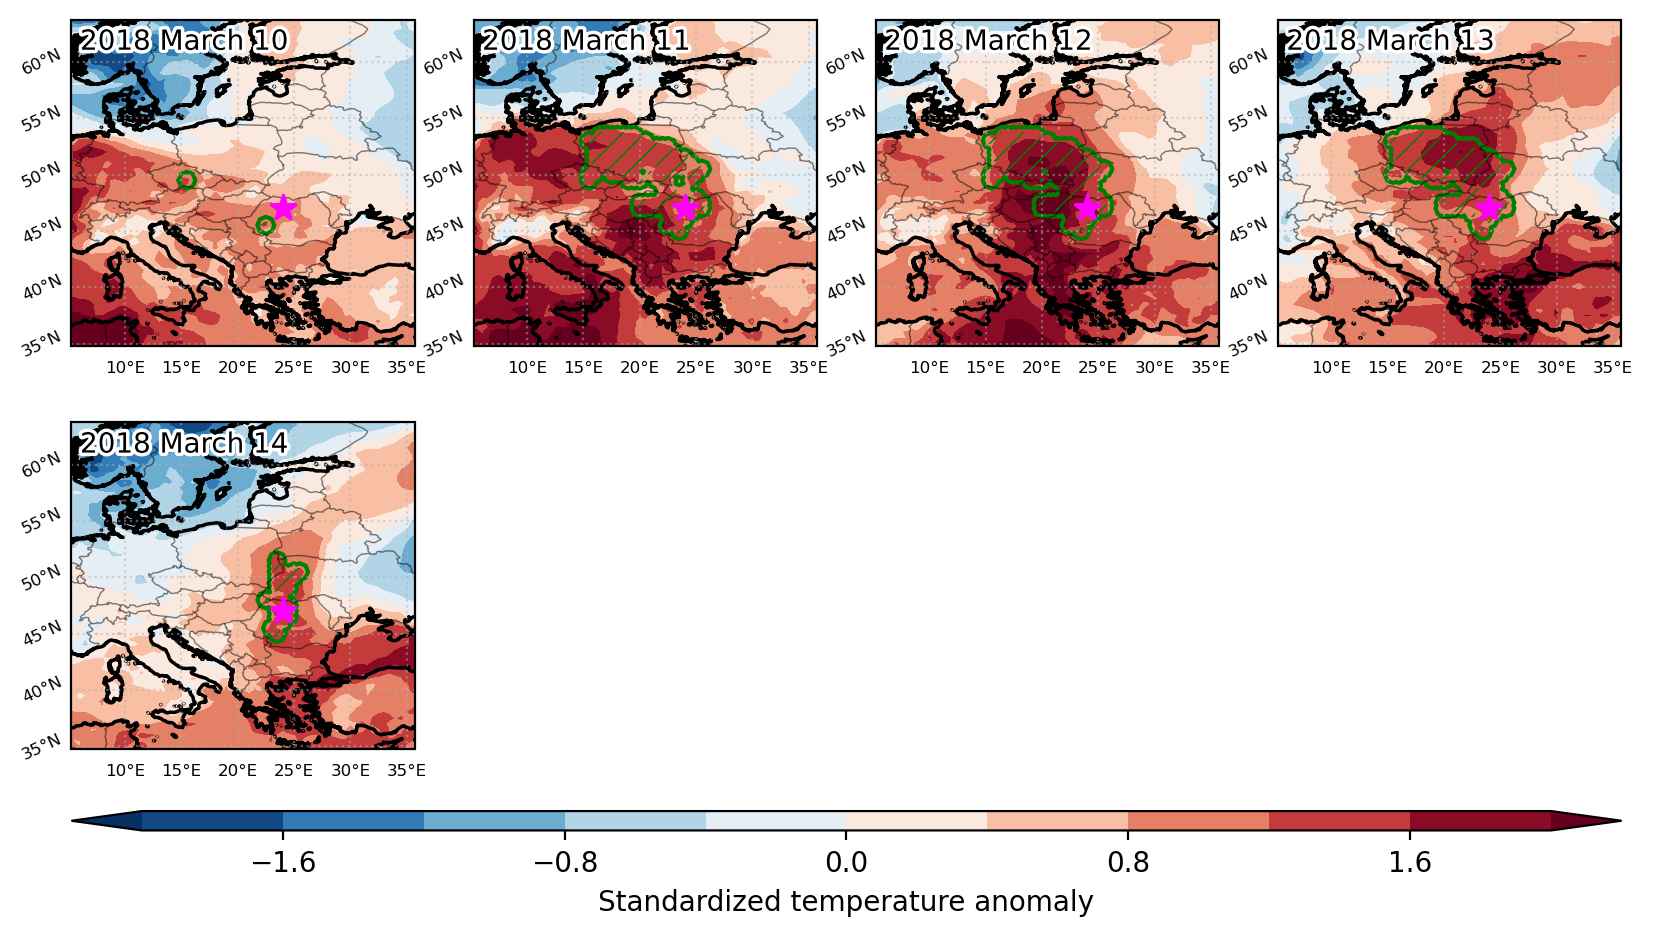


Fig. 3: Maps illustrating the evolution of standardized temperature anomalies during the event.

Event ID: Heat_wave_2018-Mar-10_to_2018-Mar-14_24.0_47.0
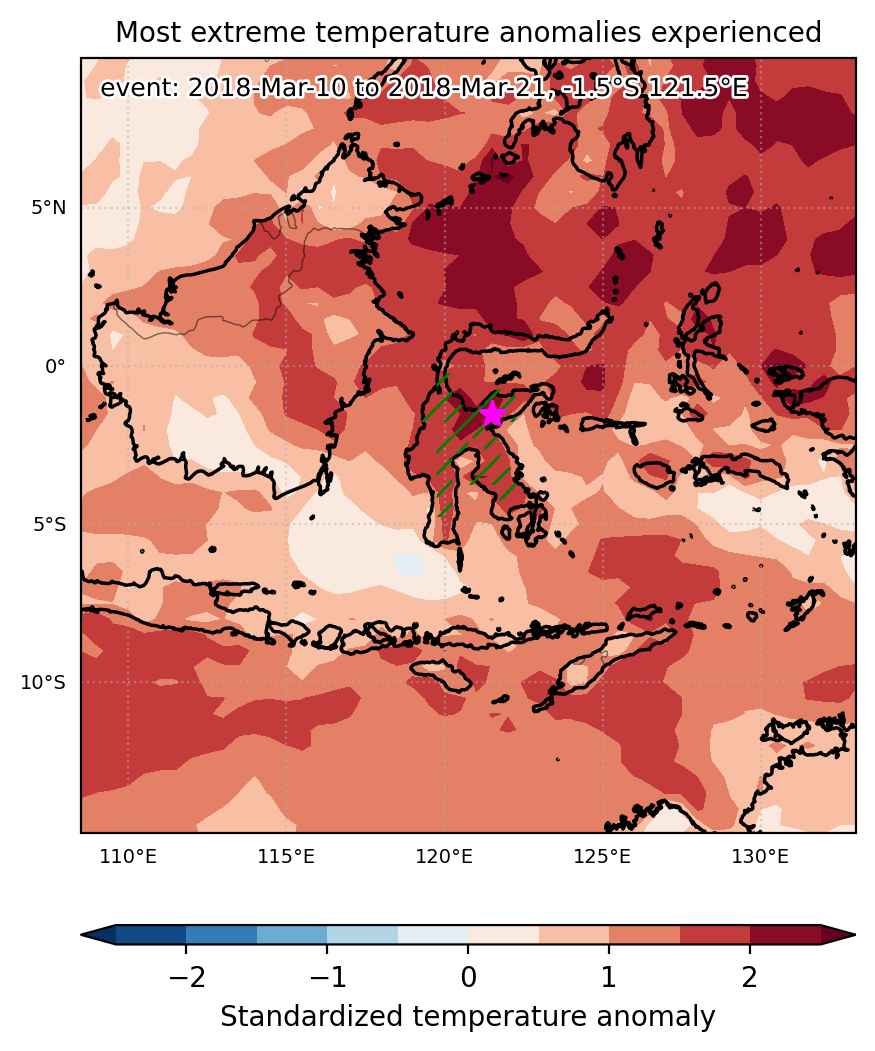
Heat wave occuring from March 10 2018 to March 21 2018 at -1.5°S 121.5°E

Download data: JSON

Event type: Heat wave

Countries affected (identified with ArcGIS Online; provided only for geographical reference):

  • Indonesia

Duration: 12 days

Time span: March 10 2018 to March 21 2018

Statistics over entire affected area:

  • Mean temperature anomaly: 1.4 °C
  • Mean temperature: 25.0 °C
  • Maximum temperature anomaly: 2.4 °C
  • Maximum temperature: 30.2 °C

Event center: -1.5°S 121.5°E

Area affected: 74109 km$^2$


Fig. 1: Map of most extreme temperature anomalies (standardized) experienced during the event. The purple star indicates the center of the extreme event. Green hatching illustrates all areas under the effect of extremes at some time during the event.


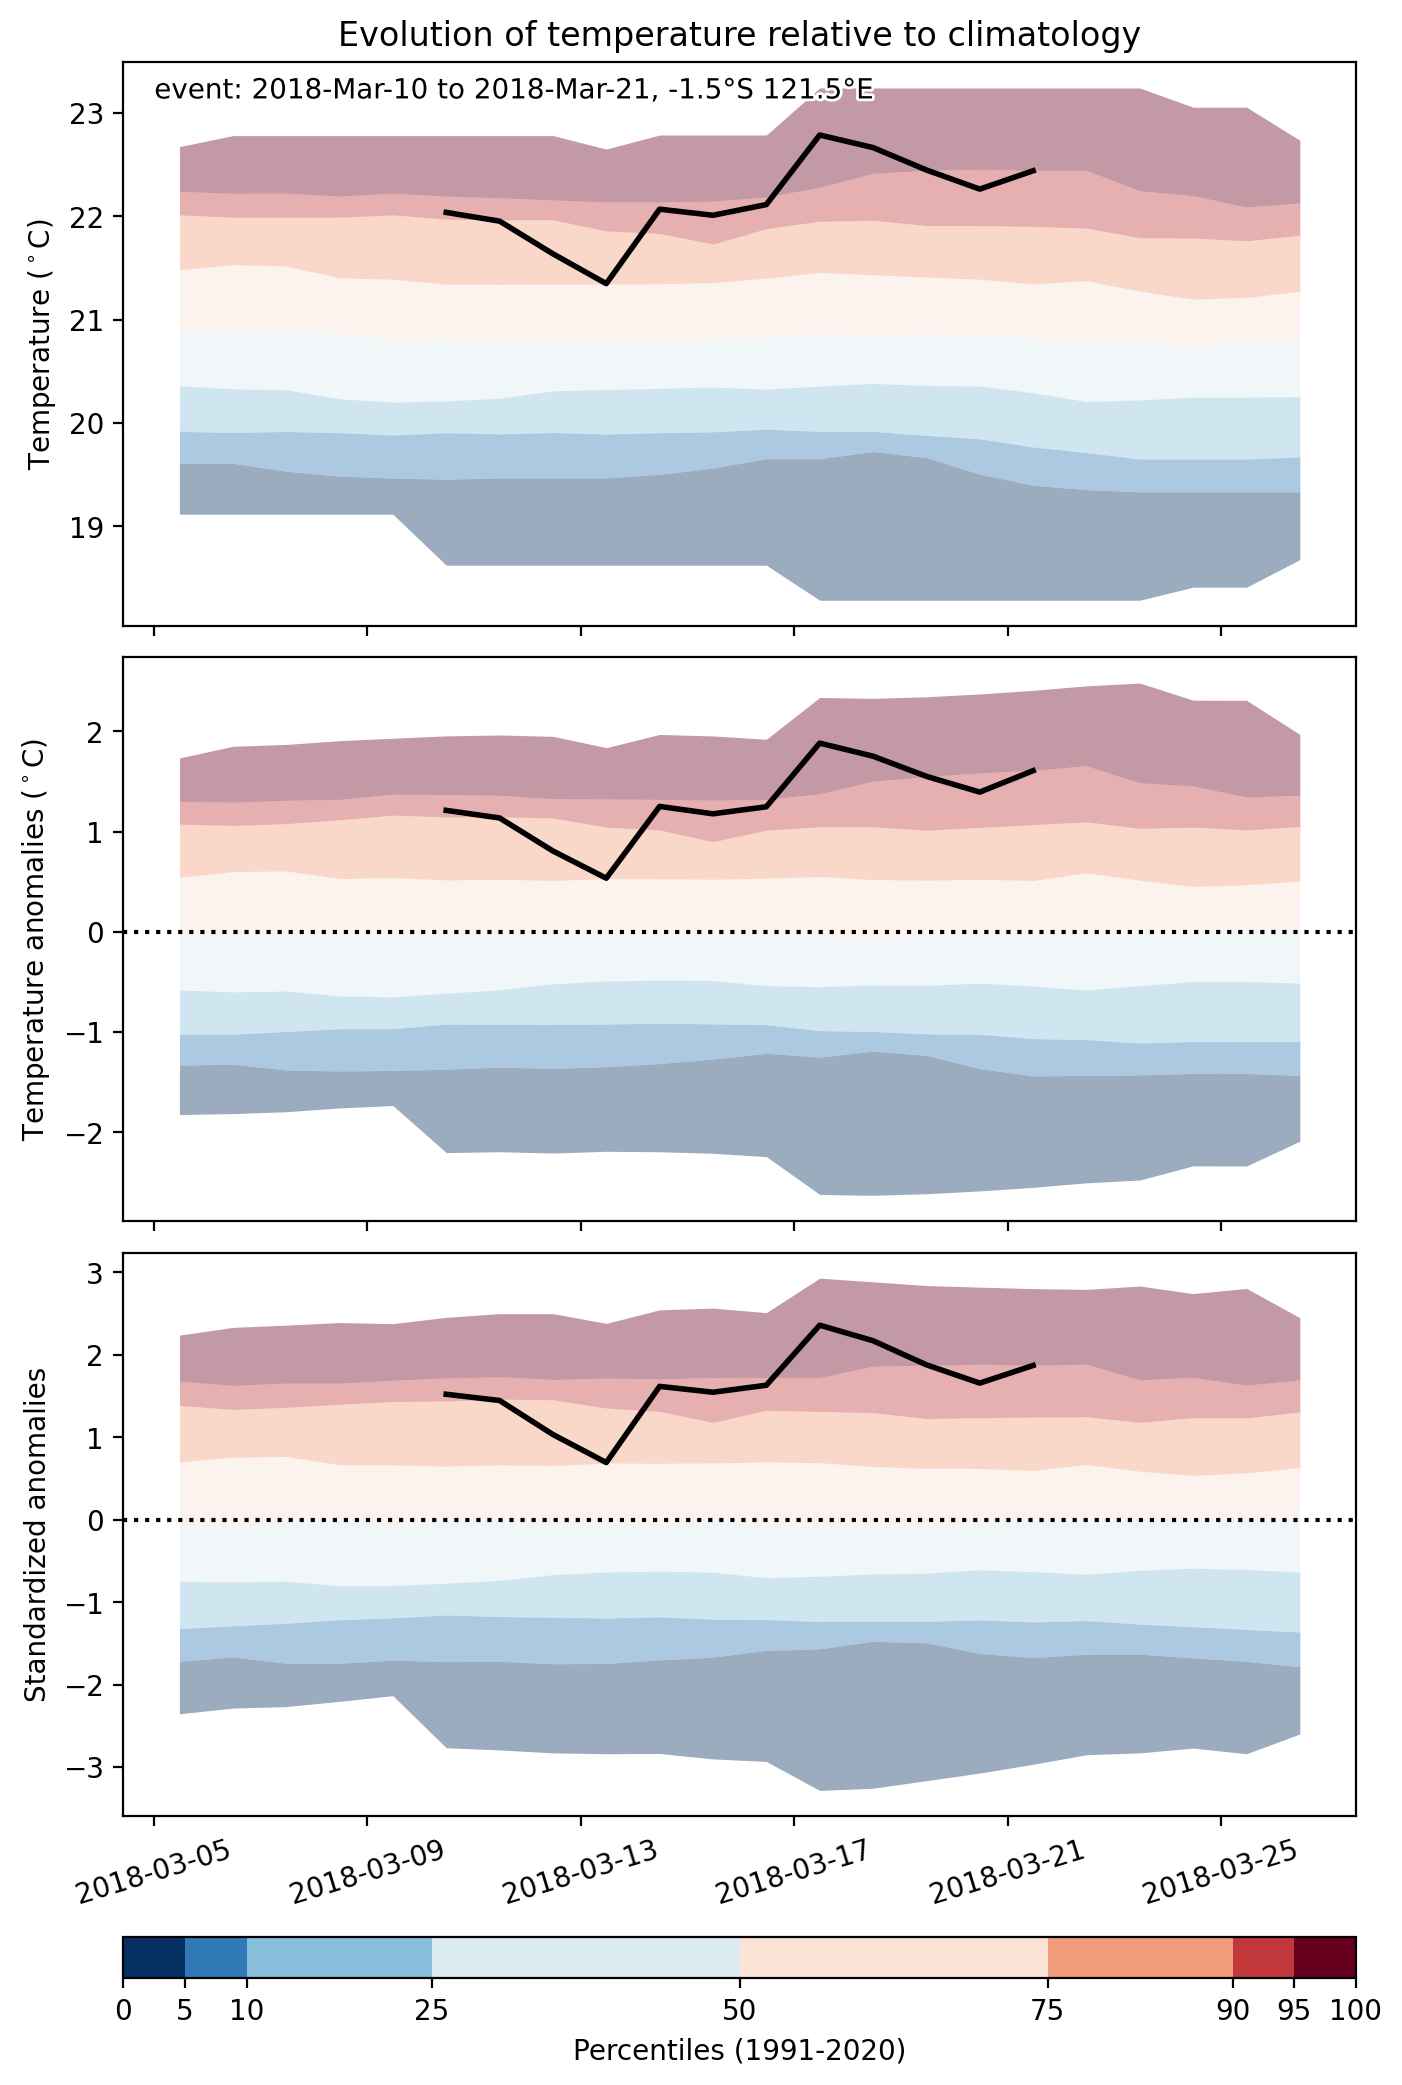
Fig. 2: Evolution of temperature at the center of the event. The climatological percentile distribution is illustrated with color shadings.


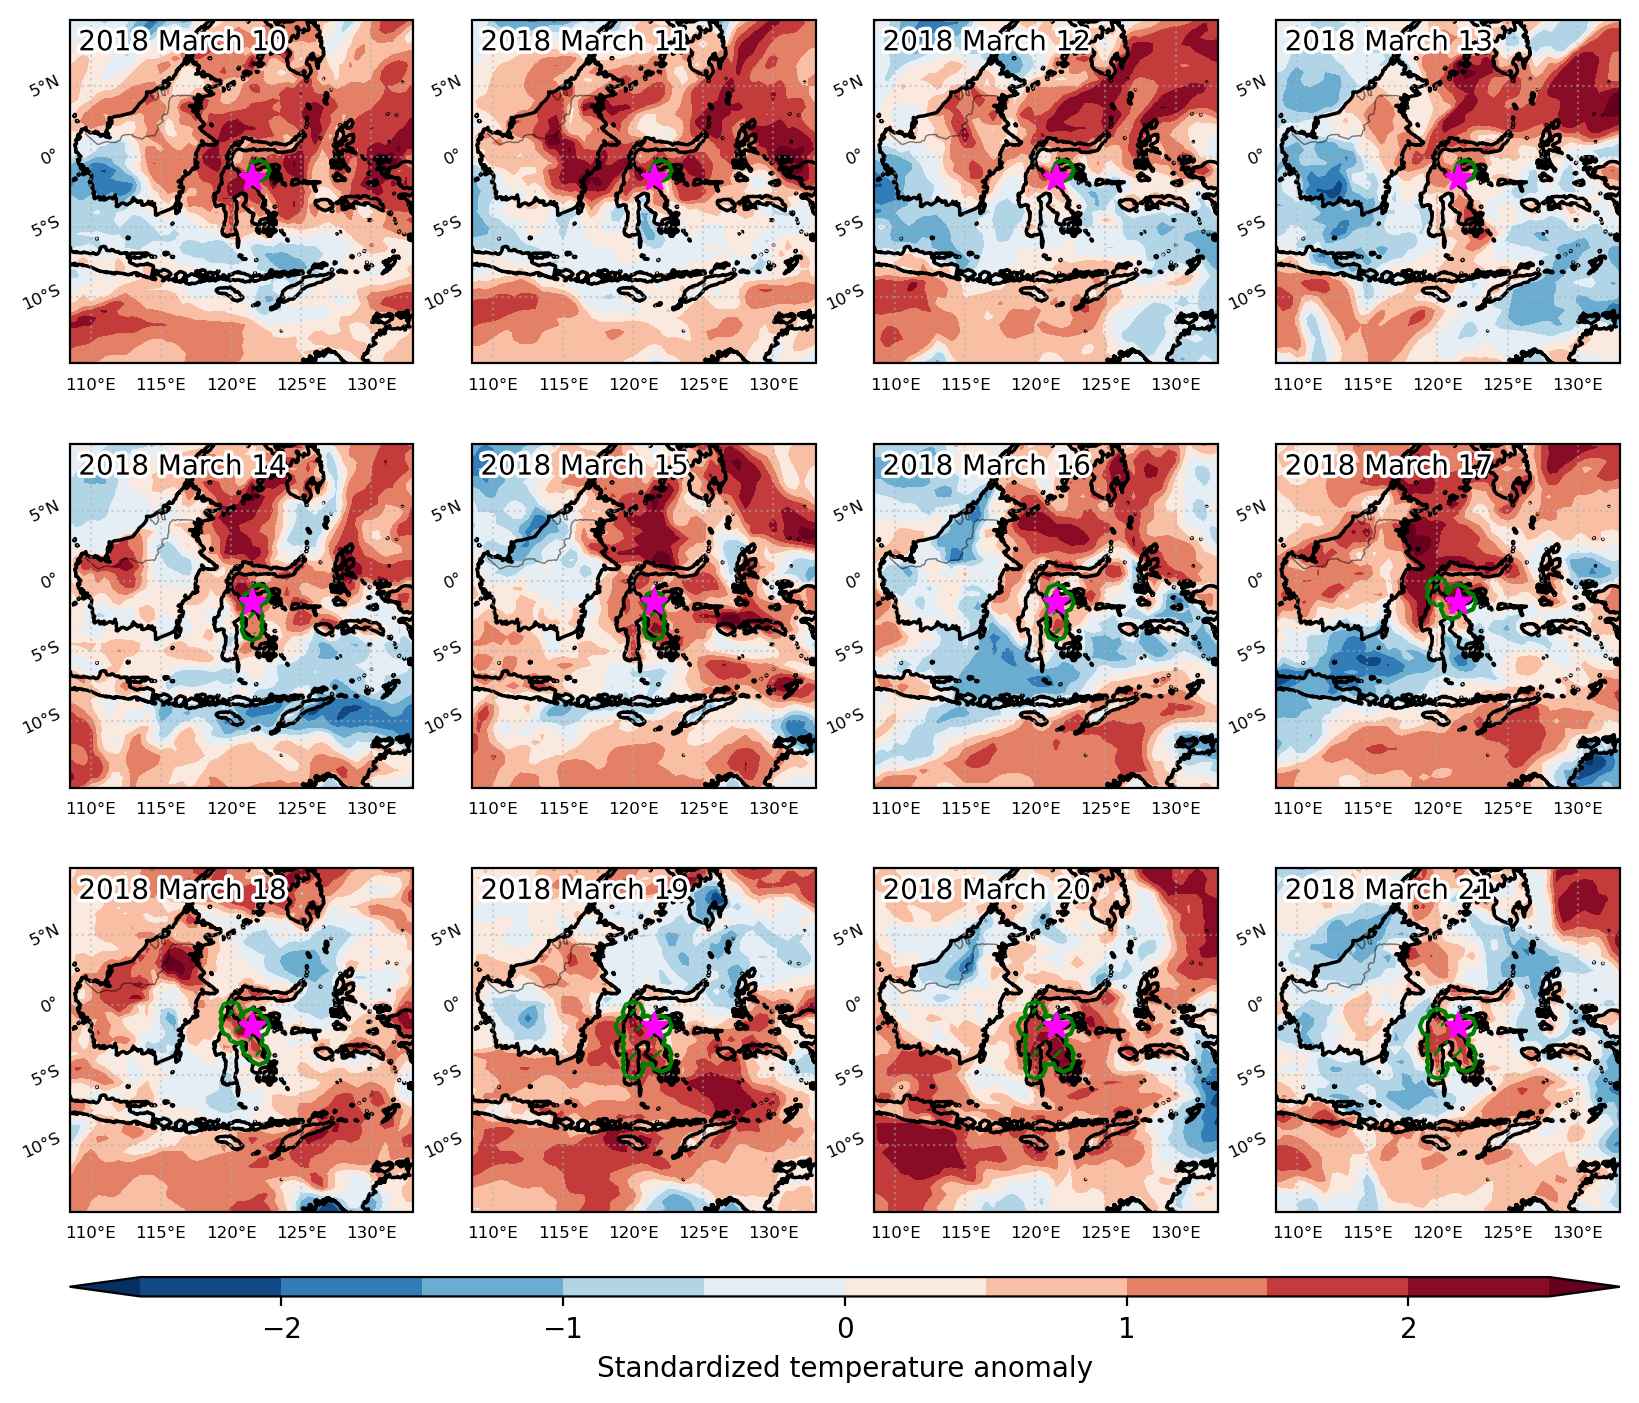
Fig. 3: Maps illustrating the evolution of standardized temperature anomalies during the event.

Event ID: Heat_wave_2018-Mar-10_to_2018-Mar-21_121.5_-1.5

Cold spell occuring from March 10 2018 to April 04 2018 at -27.5°S 288.5°E

Download data: JSON

Event type: Cold spell

Countries affected (identified with ArcGIS Online; provided only for geographical reference):

  • Argentina
  • Chile

Duration: 26 days

Time span: March 10 2018 to April 04 2018

Statistics over entire affected area:

  • Mean temperature anomaly: -2.3 °C
  • Mean temperature: 15.1 °C
  • Minimum temperature anomaly: -9.7 °C
  • Minimum temperature: -2.0 °C

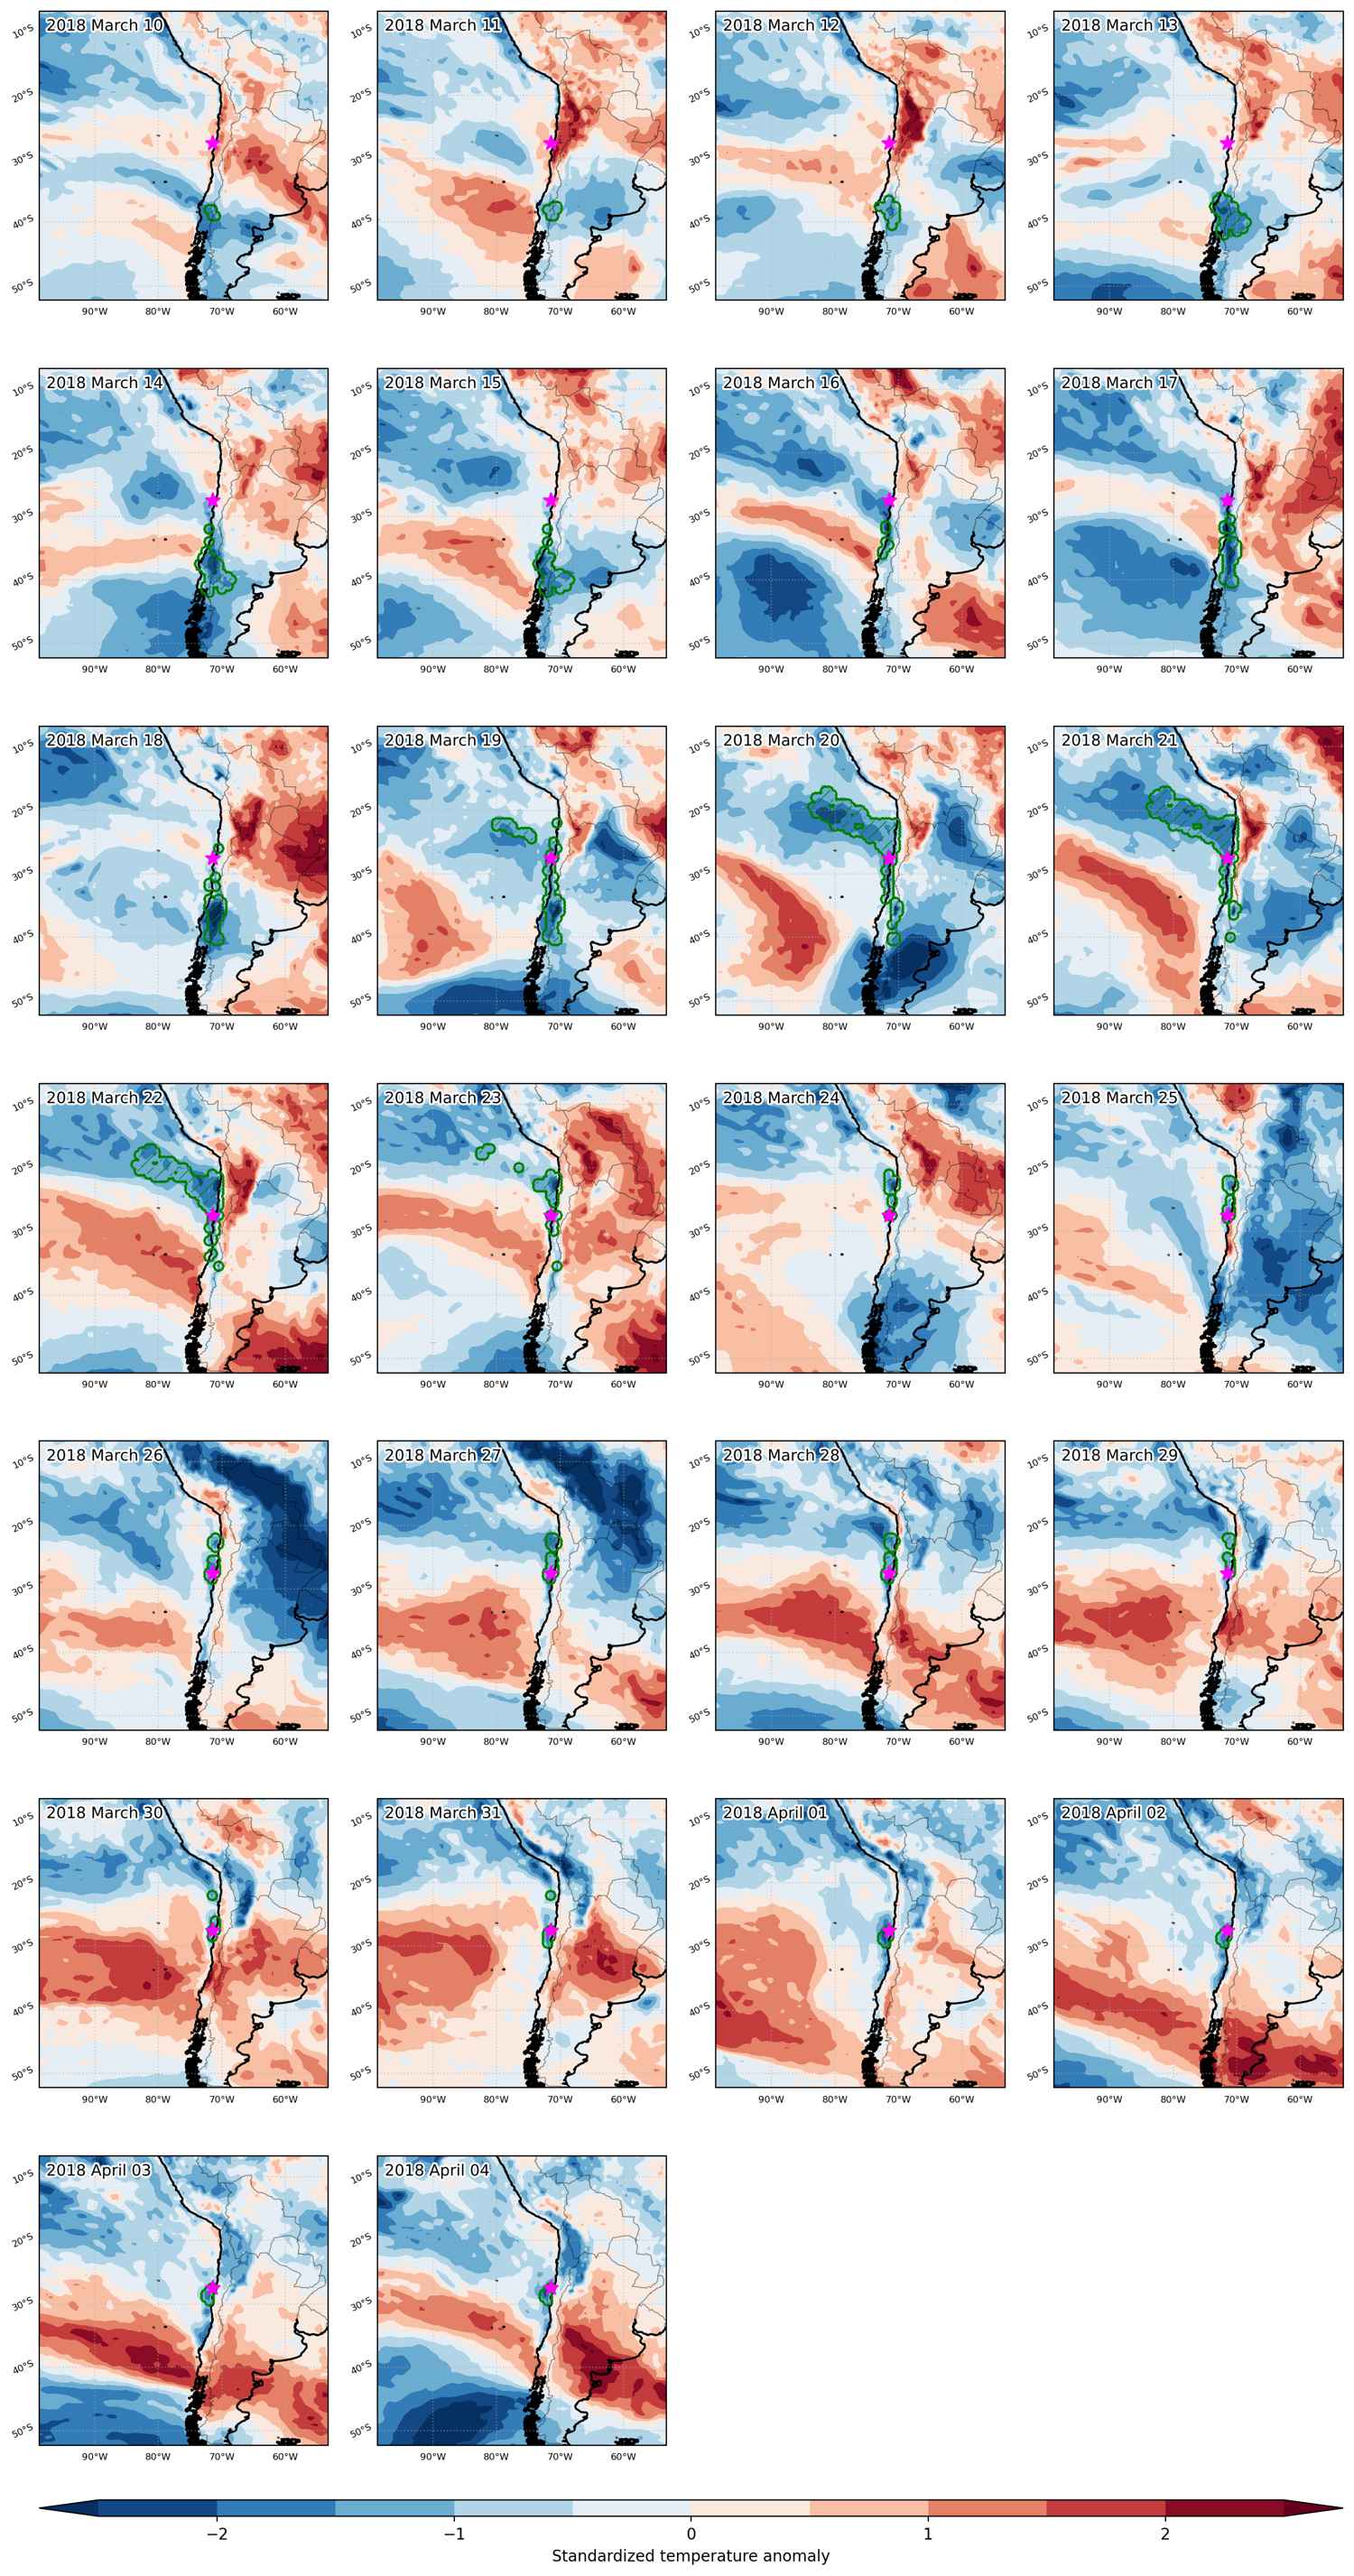
Event center: -27.5°S 288.5°E

Area affected: 775004 km$^2$


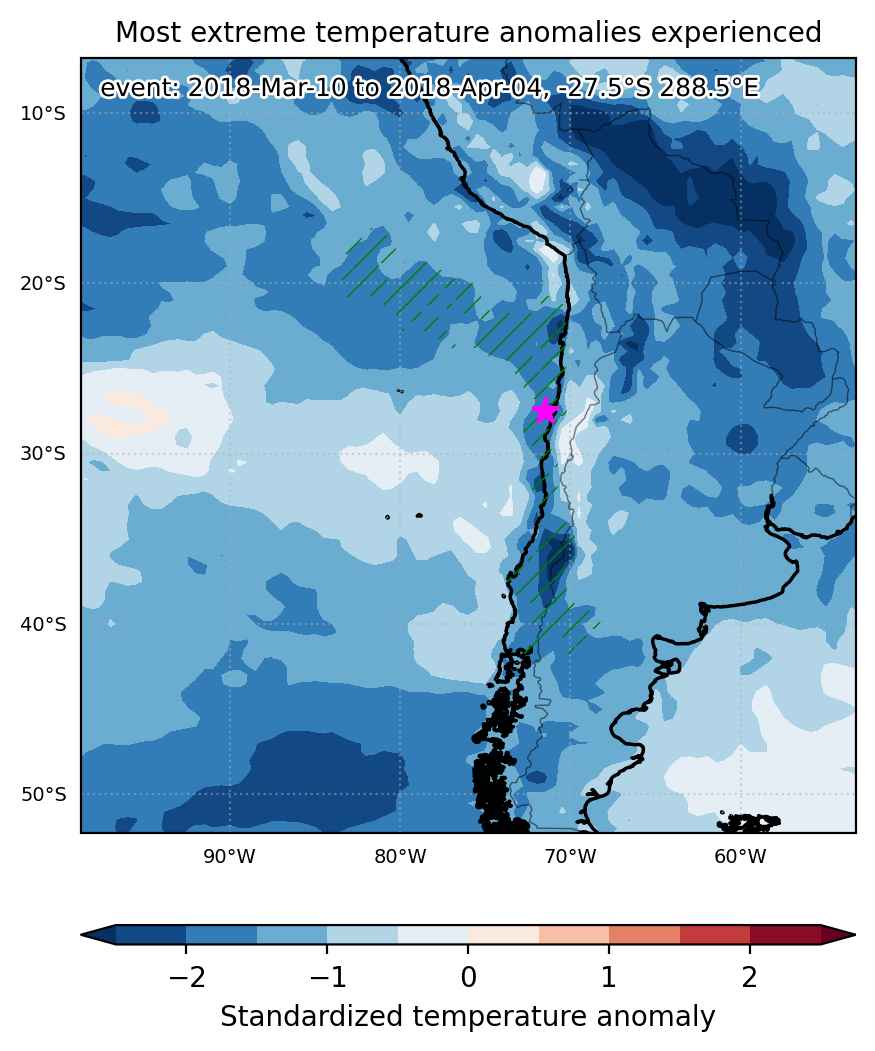
Fig. 1: Map of most extreme temperature anomalies (standardized) experienced during the event. The purple star indicates the center of the extreme event. Green hatching illustrates all areas under the effect of extremes at some time during the event.


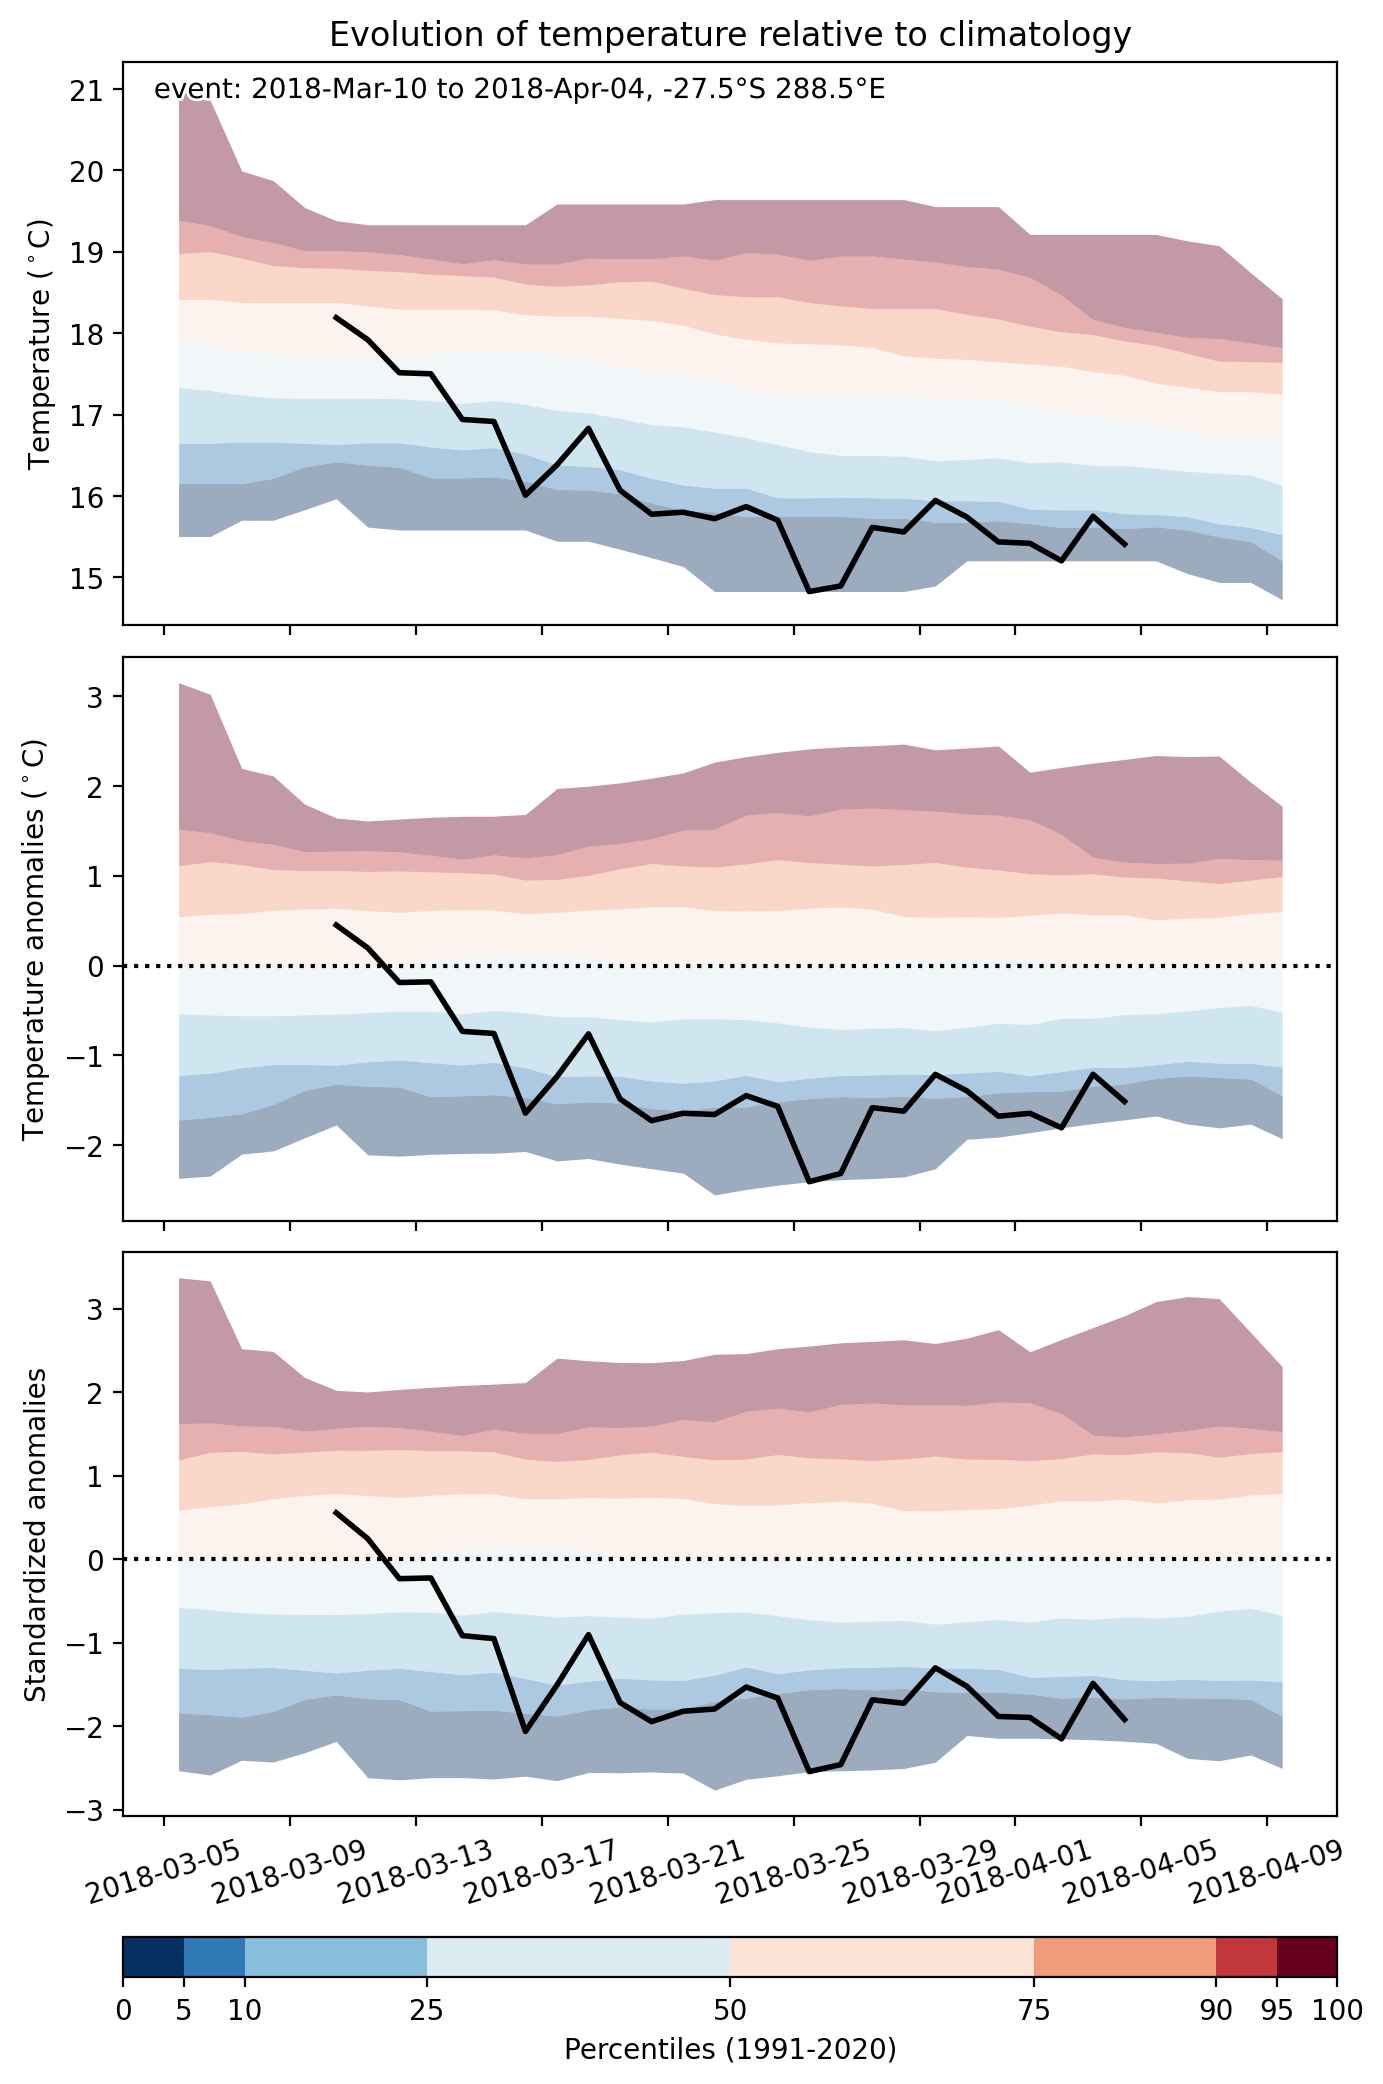
Fig. 2: Evolution of temperature at the center of the event. The climatological percentile distribution is illustrated with color shadings.


Fig. 3: Maps illustrating the evolution of standardized temperature anomalies during the event.

Event ID: Cold_spell_2018-Mar-10_to_2018-Apr-04_288.5_-27.5

Cold spell occuring from March 10 2018 to March 15 2018 at 76.0°N 99.0°E

Download data: JSON

Event type: Cold spell

Countries affected (identified with ArcGIS Online; provided only for geographical reference):

  • Russian Federation

Duration: 6 days

Time span: March 10 2018 to March 15 2018

Statistics over entire affected area:

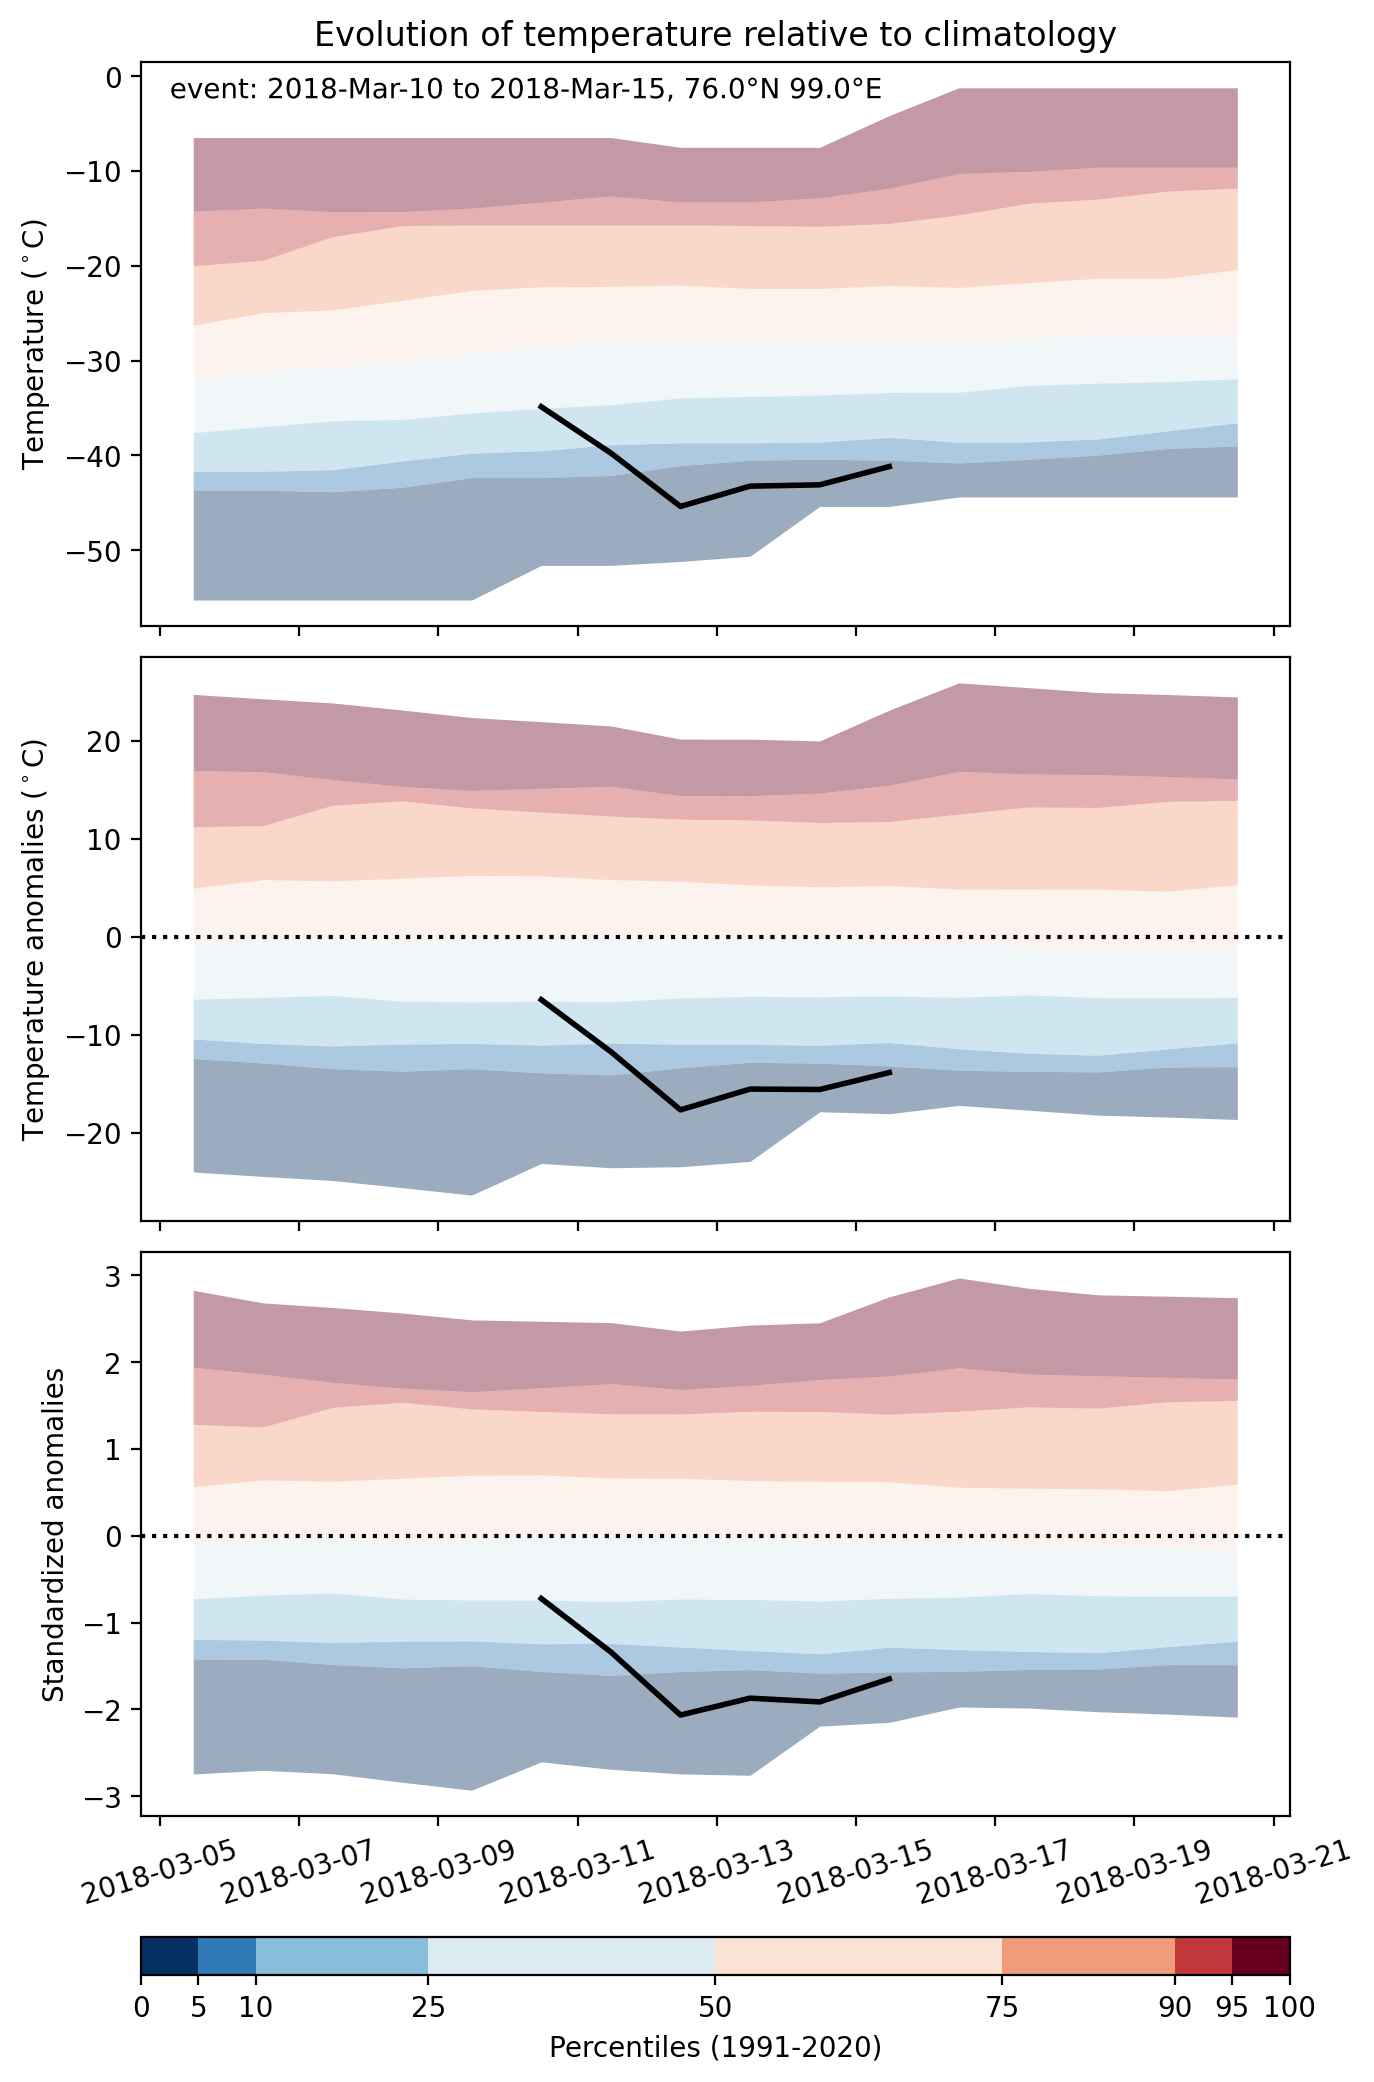
  • Mean temperature anomaly: -12.4 °C
  • Mean temperature: -38.7 °C
  • Minimum temperature anomaly: -17.8 °C
  • Minimum temperature: -45.9 °C

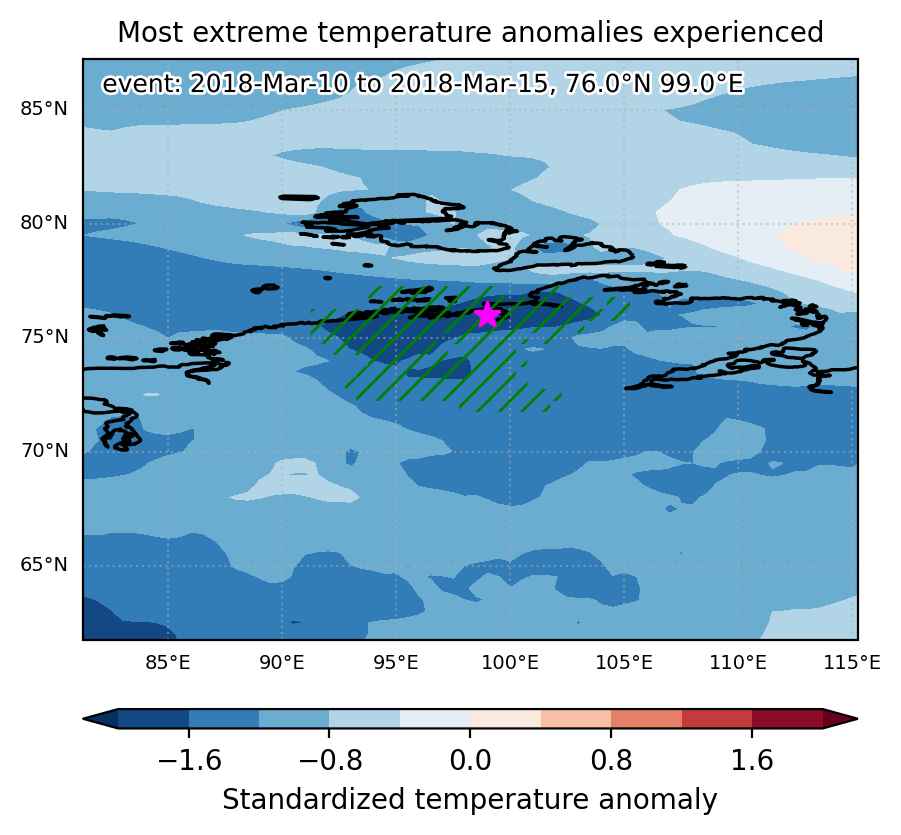
Event center: 76.0°N 99.0°E

Area affected: 155149 km$^2$


Fig. 1: Map of most extreme temperature anomalies (standardized) experienced during the event. The purple star indicates the center of the extreme event. Green hatching illustrates all areas under the effect of extremes at some time during the event.


Fig. 2: Evolution of temperature at the center of the event. The climatological percentile distribution is illustrated with color shadings.


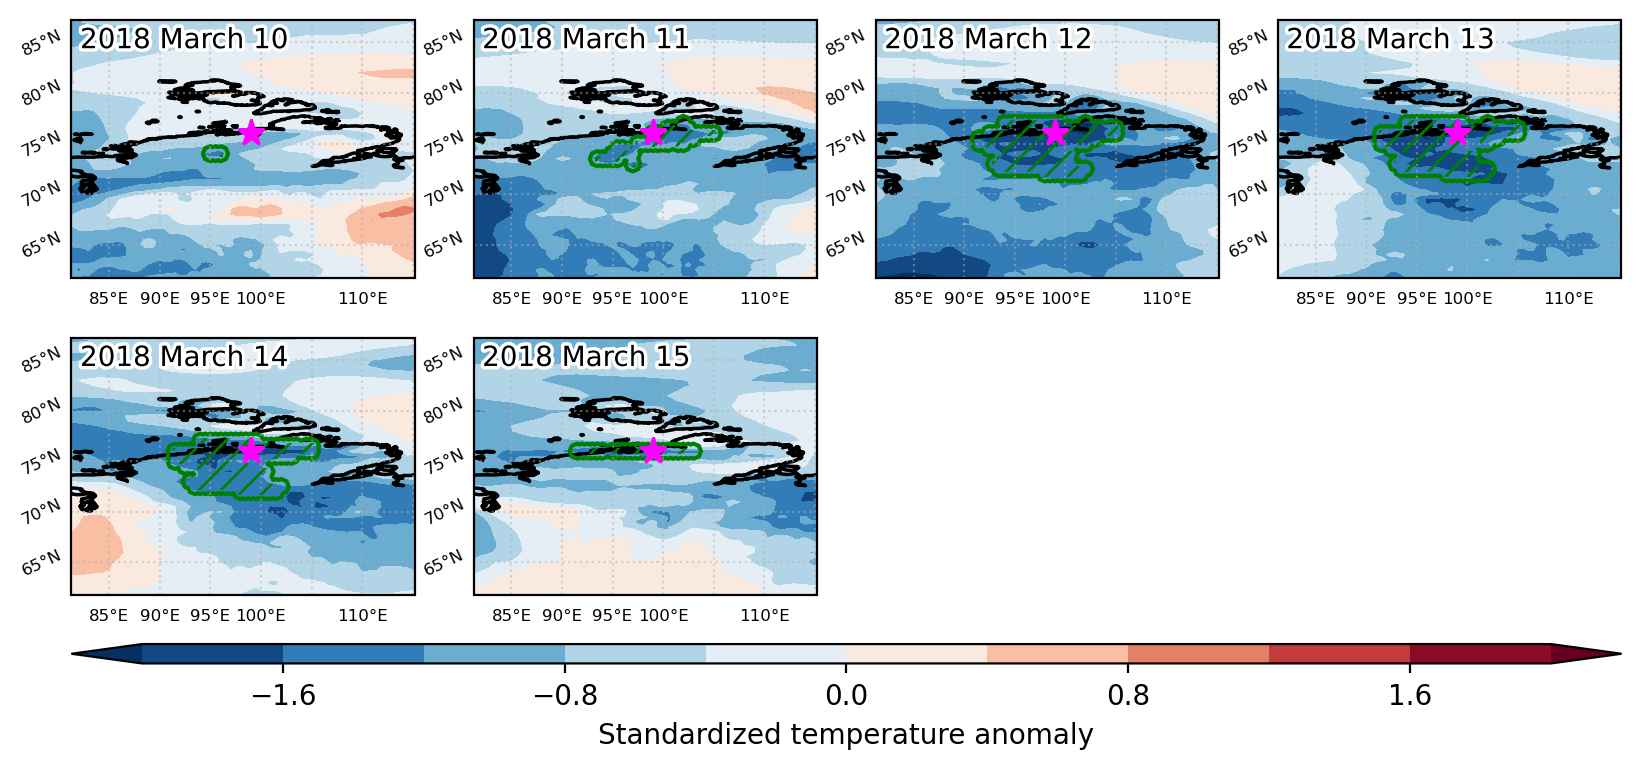
Fig. 3: Maps illustrating the evolution of standardized temperature anomalies during the event.

Event ID: Cold_spell_2018-Mar-10_to_2018-Mar-15_99.0_76.0

Cold spell occuring from March 10 2018 to March 14 2018 at 60.0°N 81.0°E

Download data: JSON

Event type: Cold spell

Countries affected (identified with ArcGIS Online; provided only for geographical reference):

  • Russian Federation

Duration: 5 days

Time span: March 10 2018 to March 14 2018

Statistics over entire affected area:

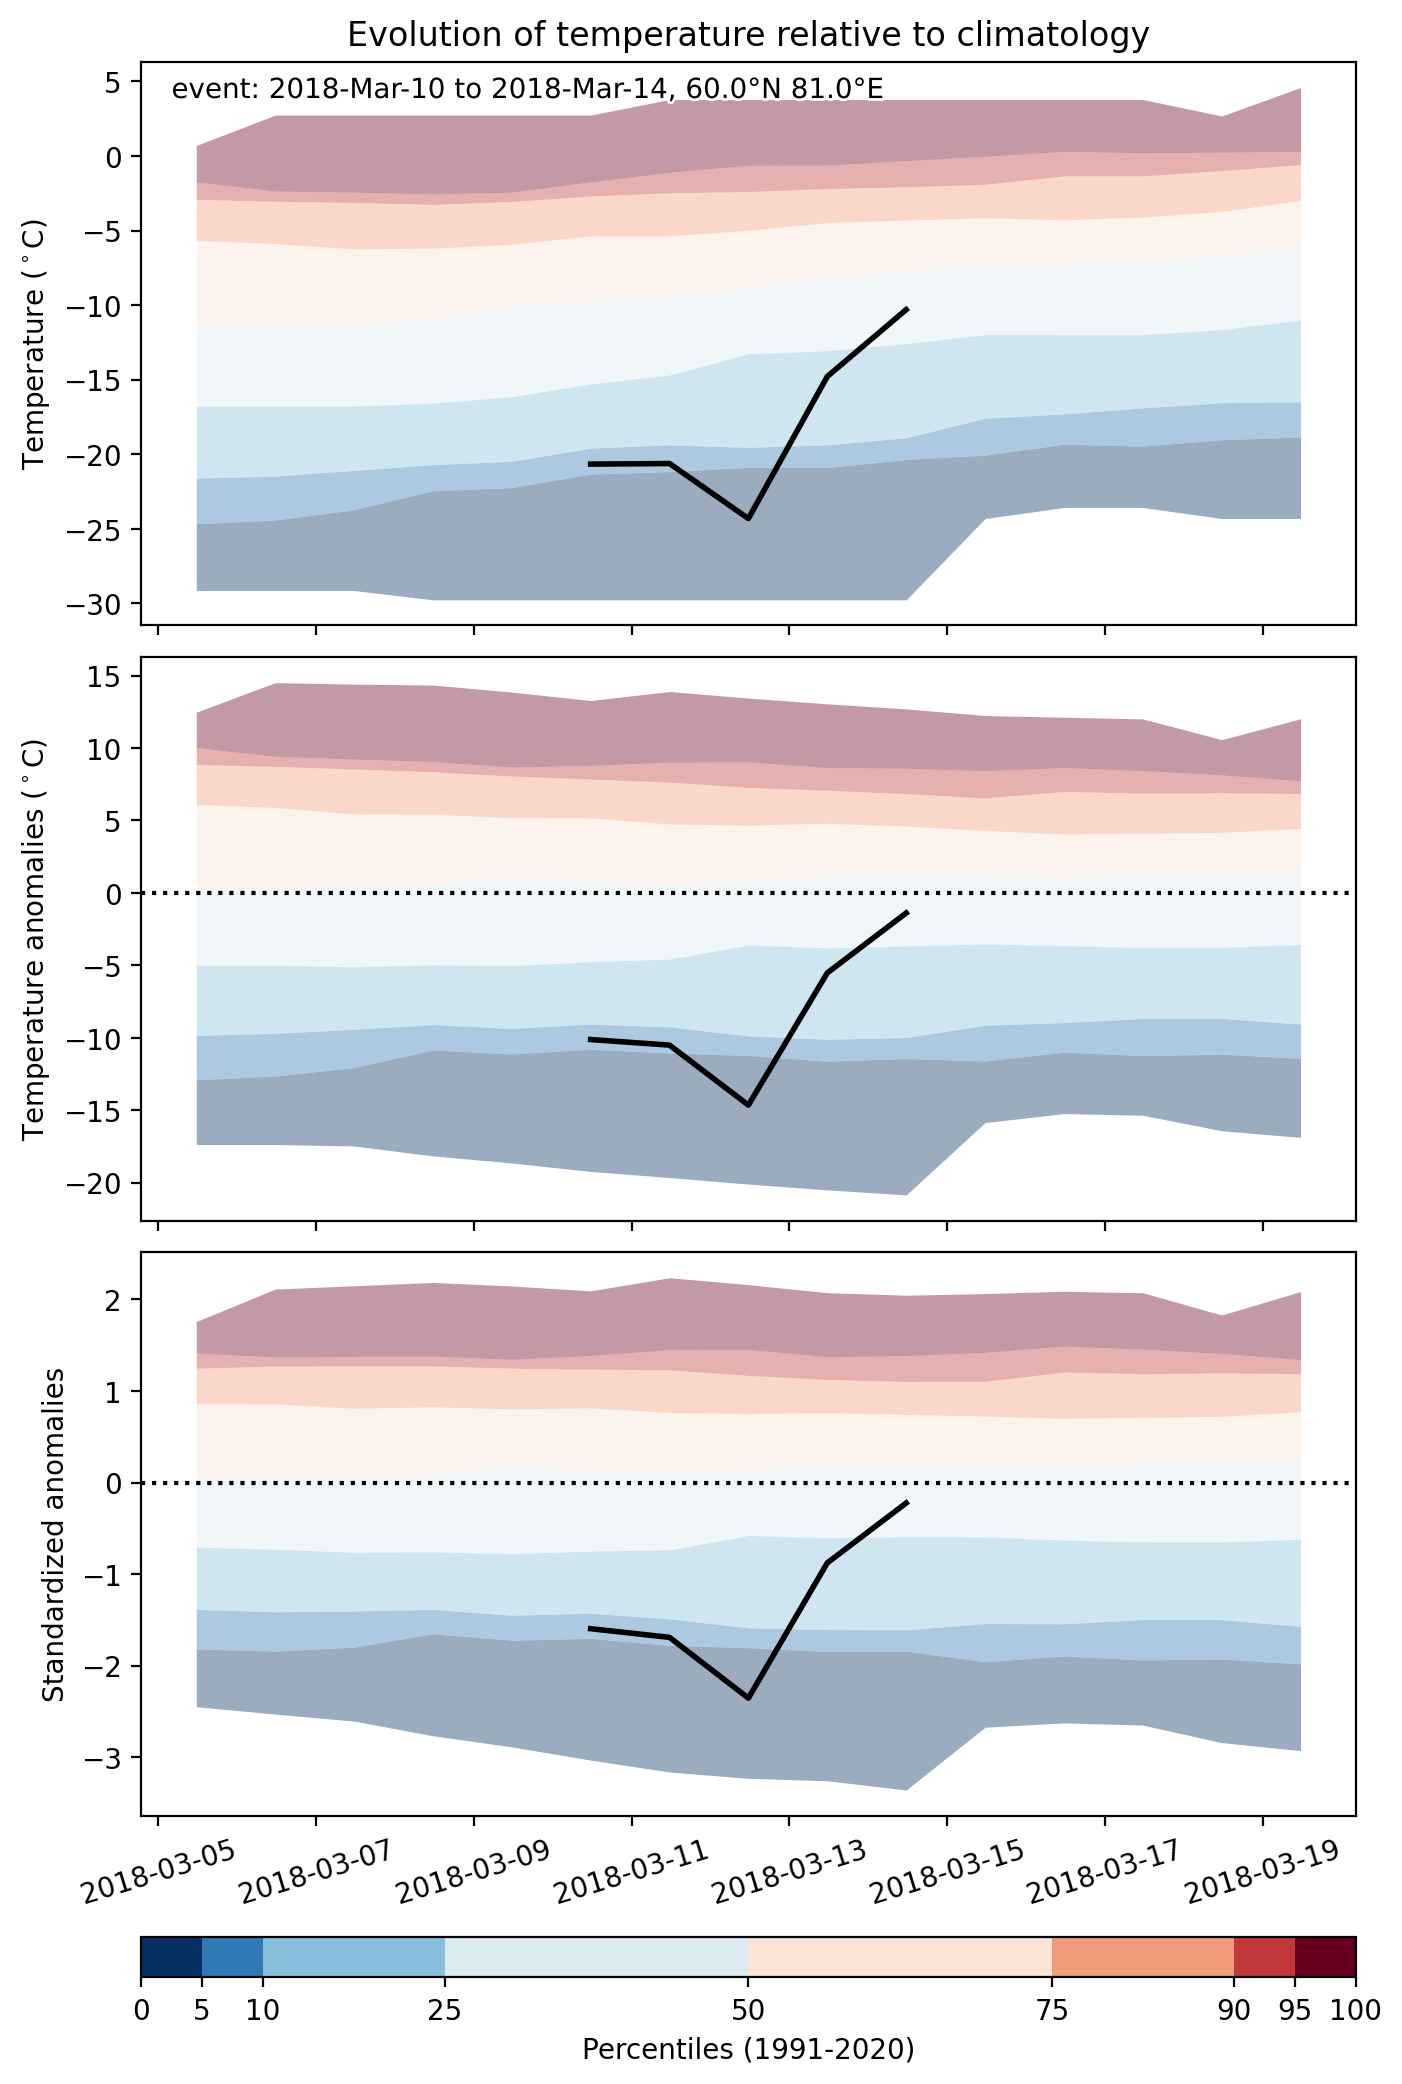
  • Mean temperature anomaly: -10.4 °C
  • Mean temperature: -19.3 °C
  • Minimum temperature anomaly: -15.0 °C
  • Minimum temperature: -24.9 °C

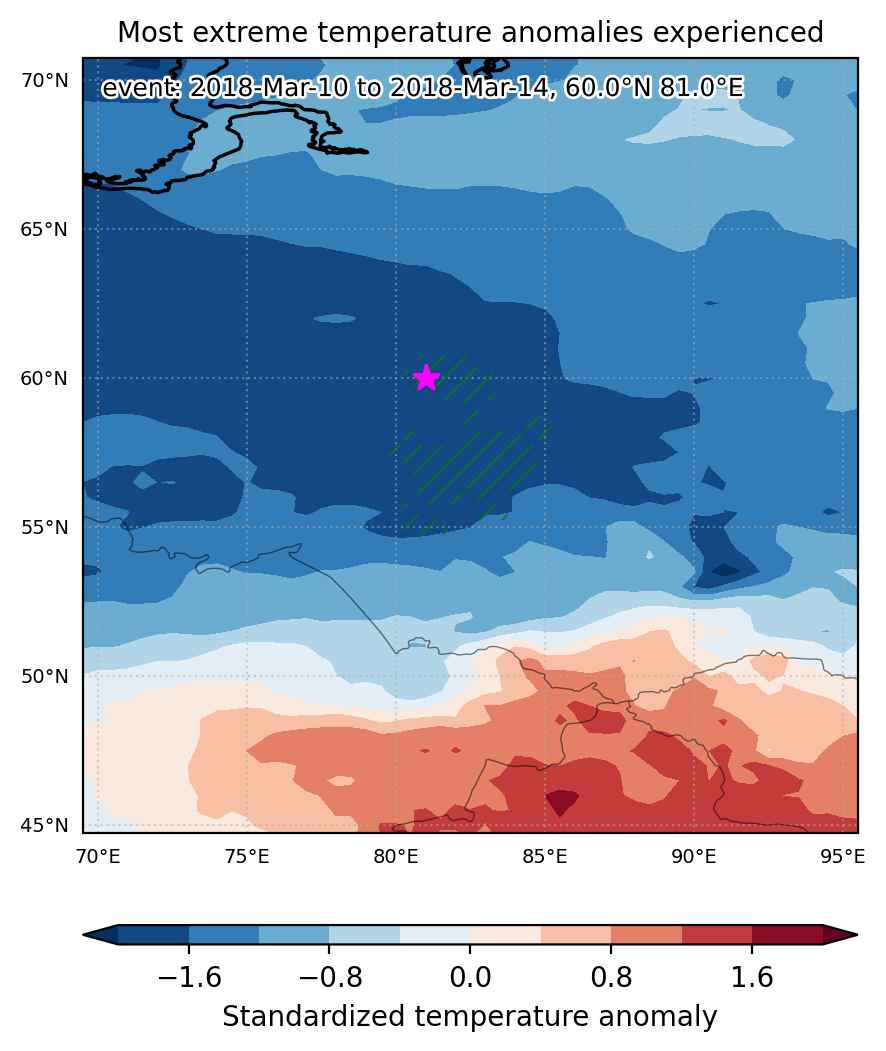
Event center: 60.0°N 81.0°E

Area affected: 99090 km$^2$


Fig. 1: Map of most extreme temperature anomalies (standardized) experienced during the event. The purple star indicates the center of the extreme event. Green hatching illustrates all areas under the effect of extremes at some time during the event.


Fig. 2: Evolution of temperature at the center of the event. The climatological percentile distribution is illustrated with color shadings.


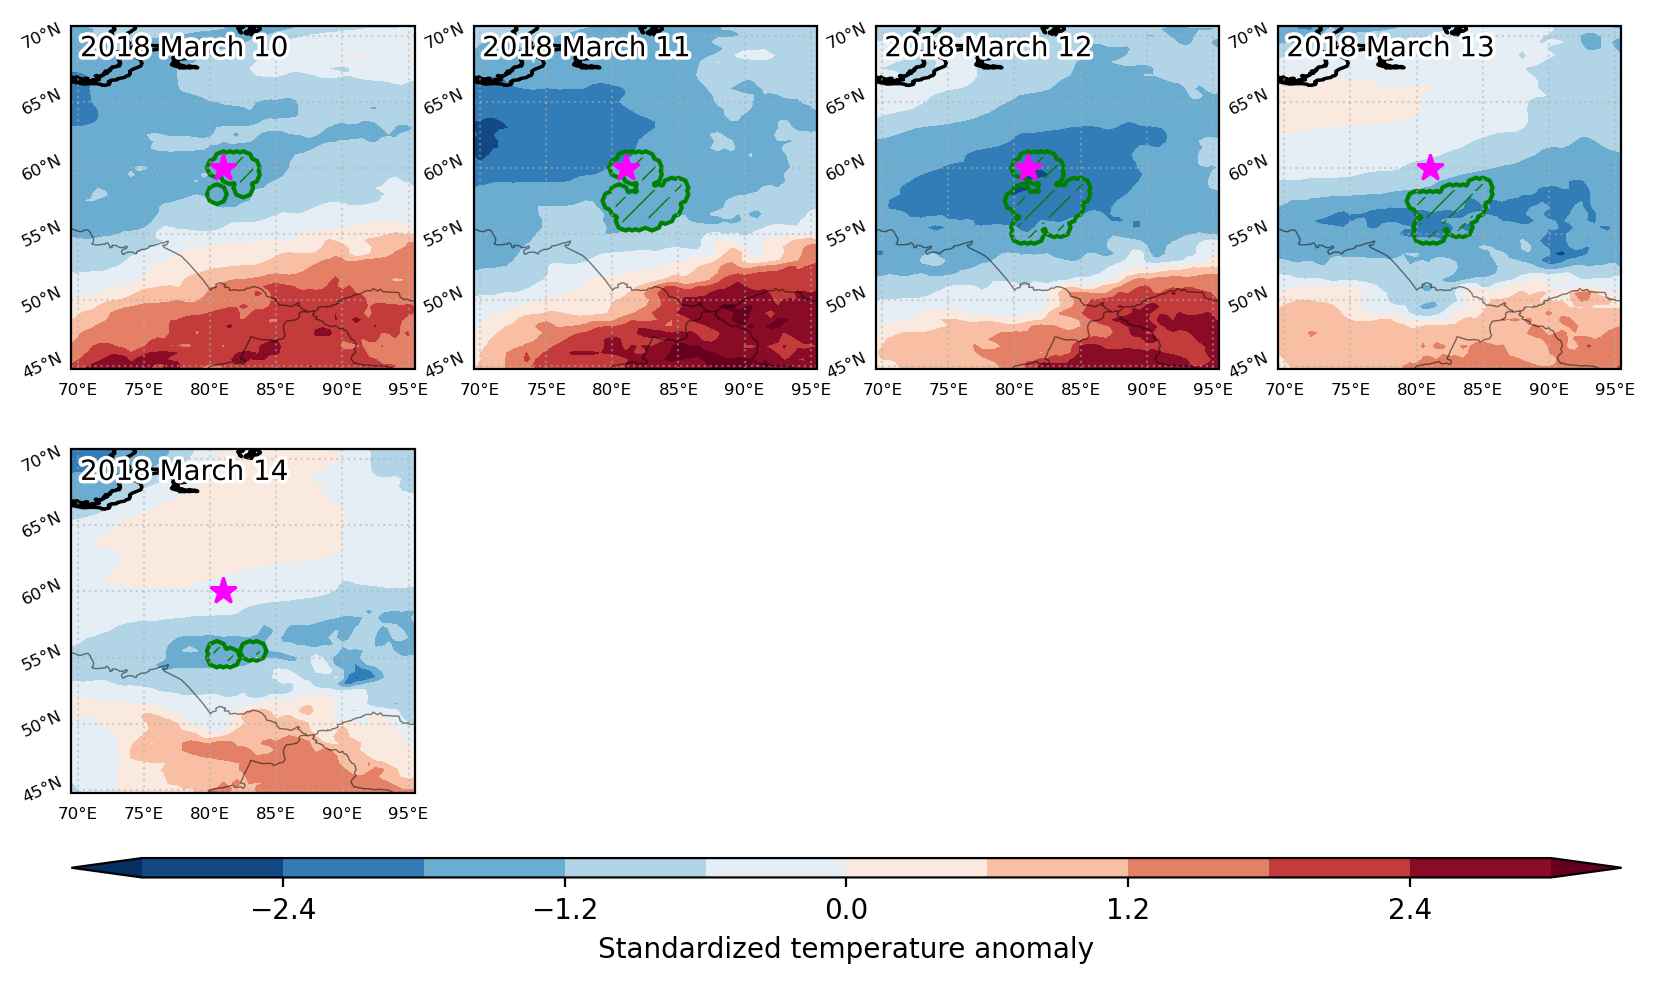
Fig. 3: Maps illustrating the evolution of standardized temperature anomalies during the event.

Event ID: Cold_spell_2018-Mar-10_to_2018-Mar-14_81.0_60.0

Cold spell occuring from March 10 2018 to March 13 2018 at -3.0°S 106.0°E

Download data: JSON

Event type: Cold spell

Countries affected (identified with ArcGIS Online; provided only for geographical reference):

  • Indonesia

Duration: 4 days

Time span: March 10 2018 to March 13 2018

Statistics over entire affected area:

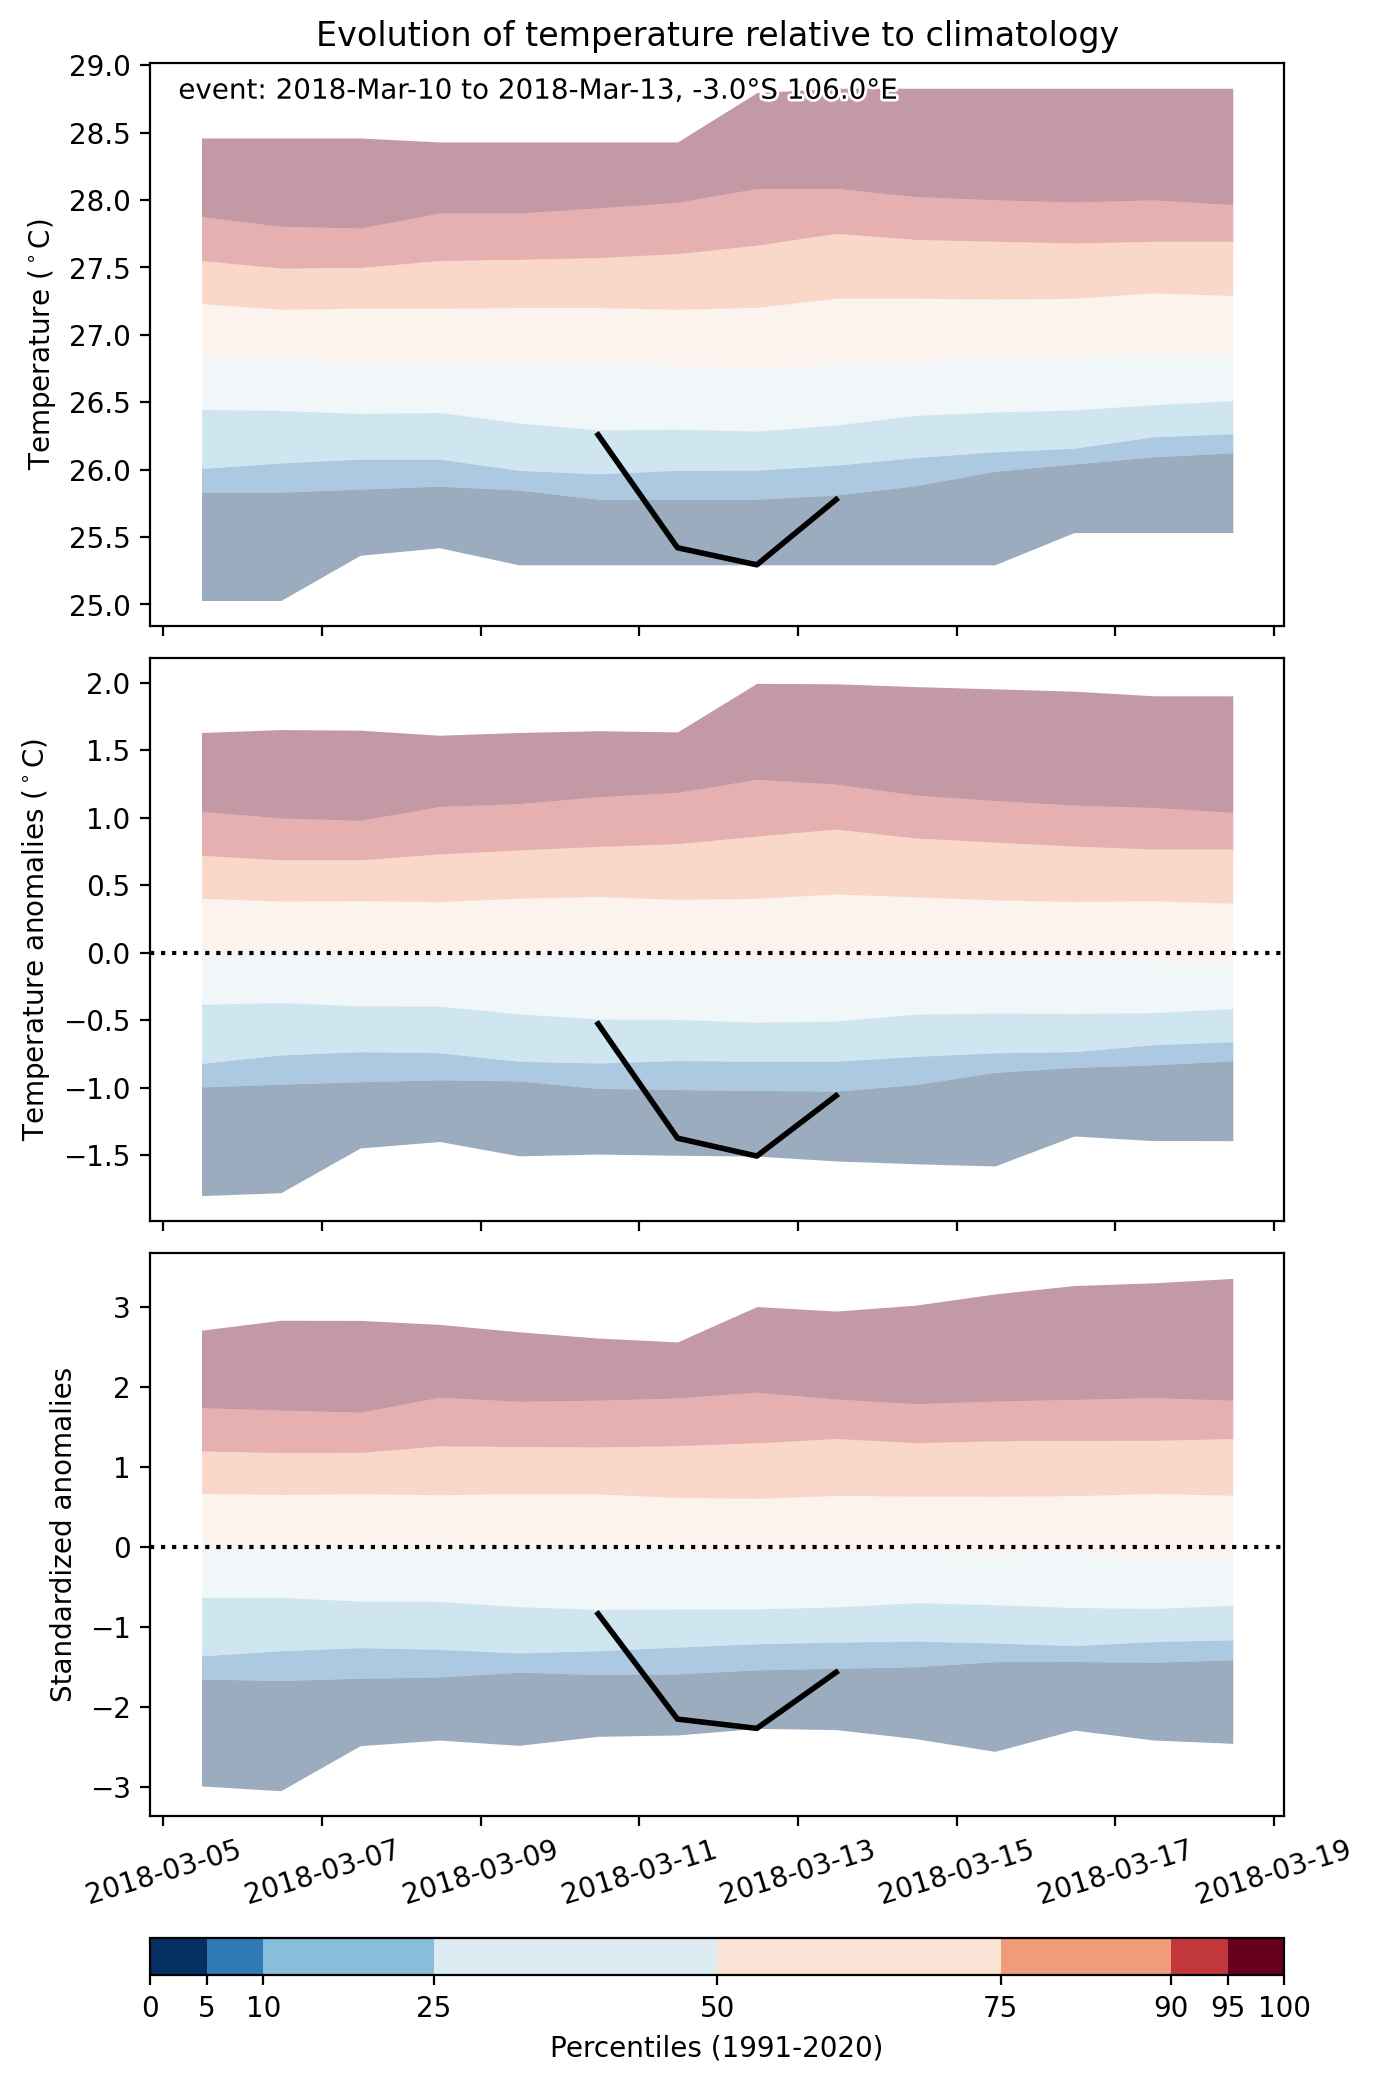
  • Mean temperature anomaly: -1.2 °C
  • Mean temperature: 25.5 °C
  • Minimum temperature anomaly: -1.8 °C
  • Minimum temperature: 24.5 °C

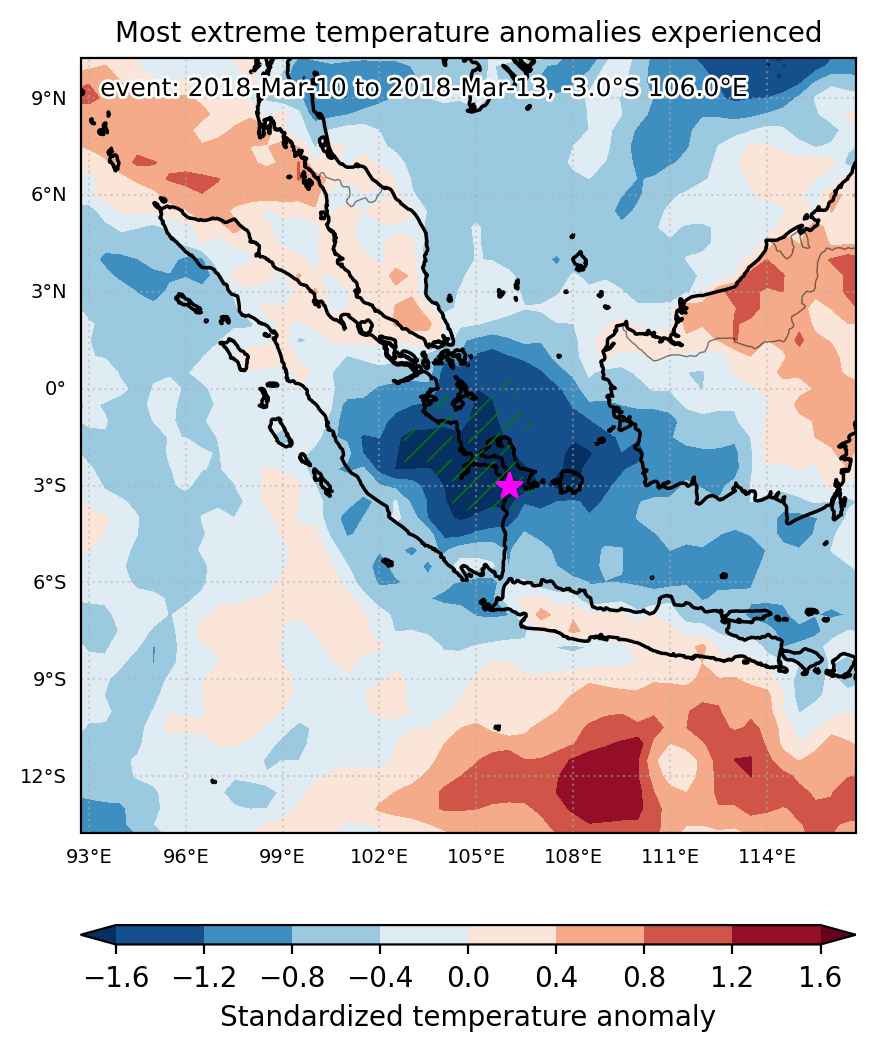
Event center: -3.0°S 106.0°E

Area affected: 101929 km$^2$


Fig. 1: Map of most extreme temperature anomalies (standardized) experienced during the event. The purple star indicates the center of the extreme event. Green hatching illustrates all areas under the effect of extremes at some time during the event.


Fig. 2: Evolution of temperature at the center of the event. The climatological percentile distribution is illustrated with color shadings.


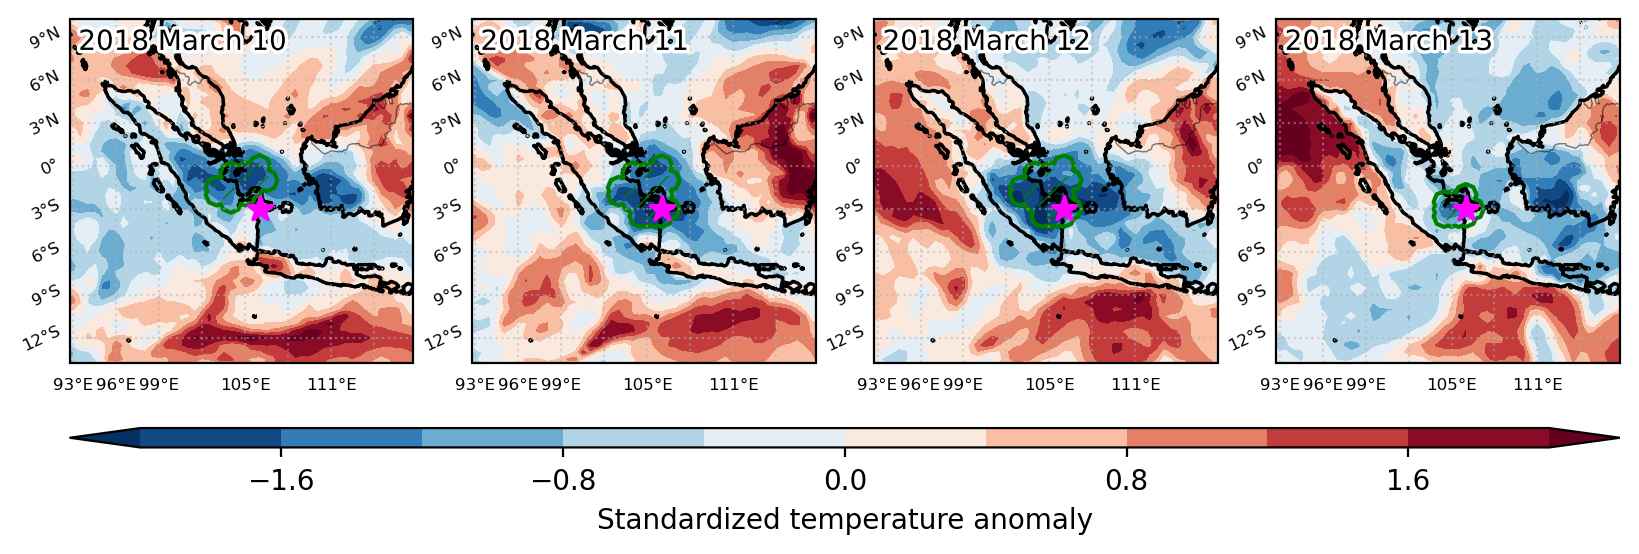
Fig. 3: Maps illustrating the evolution of standardized temperature anomalies during the event.

Event ID: Cold_spell_2018-Mar-10_to_2018-Mar-13_106.0_-3.0

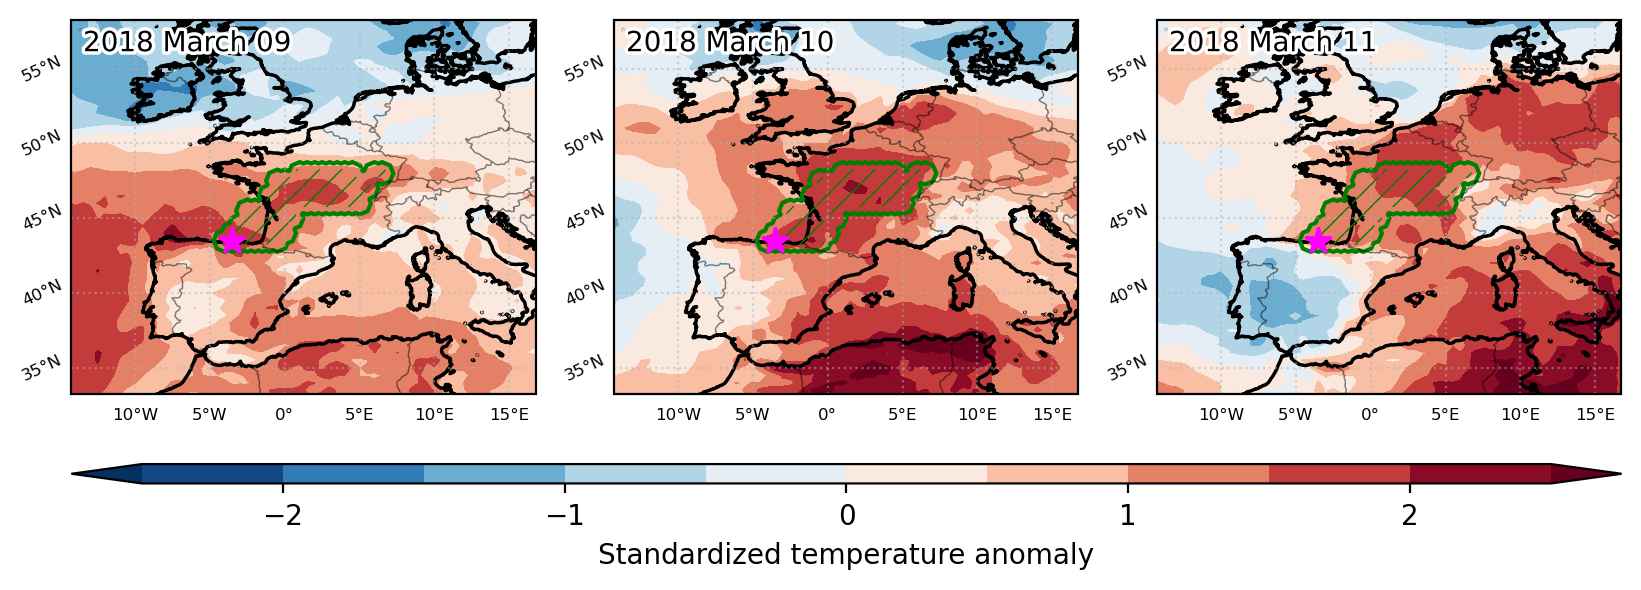
Heat wave occuring from March 09 2018 to March 11 2018 at 43.5°N 356.5°E

Download data: JSON

Event type: Heat wave

Countries affected (identified with ArcGIS Online; provided only for geographical reference):

  • France

Duration: 3 days

Time span: March 09 2018 to March 11 2018

Statistics over entire affected area:

  • Mean temperature anomaly: 4.7 °C
  • Mean temperature: 13.3 °C
  • Maximum temperature anomaly: 7.2 °C
  • Maximum temperature: 16.8 °C

Event center: 43.5°N 3.5°W

Area affected: 210250 km$^2$


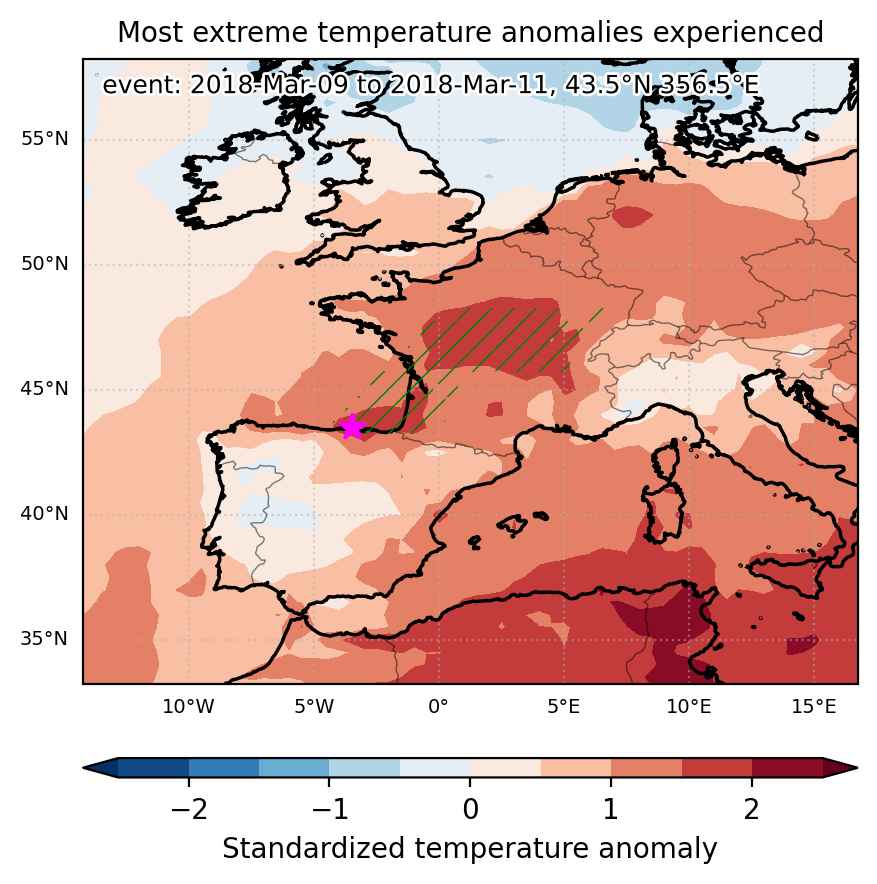
Fig. 1: Map of most extreme temperature anomalies (standardized) experienced during the event. The purple star indicates the center of the extreme event. Green hatching illustrates all areas under the effect of extremes at some time during the event.


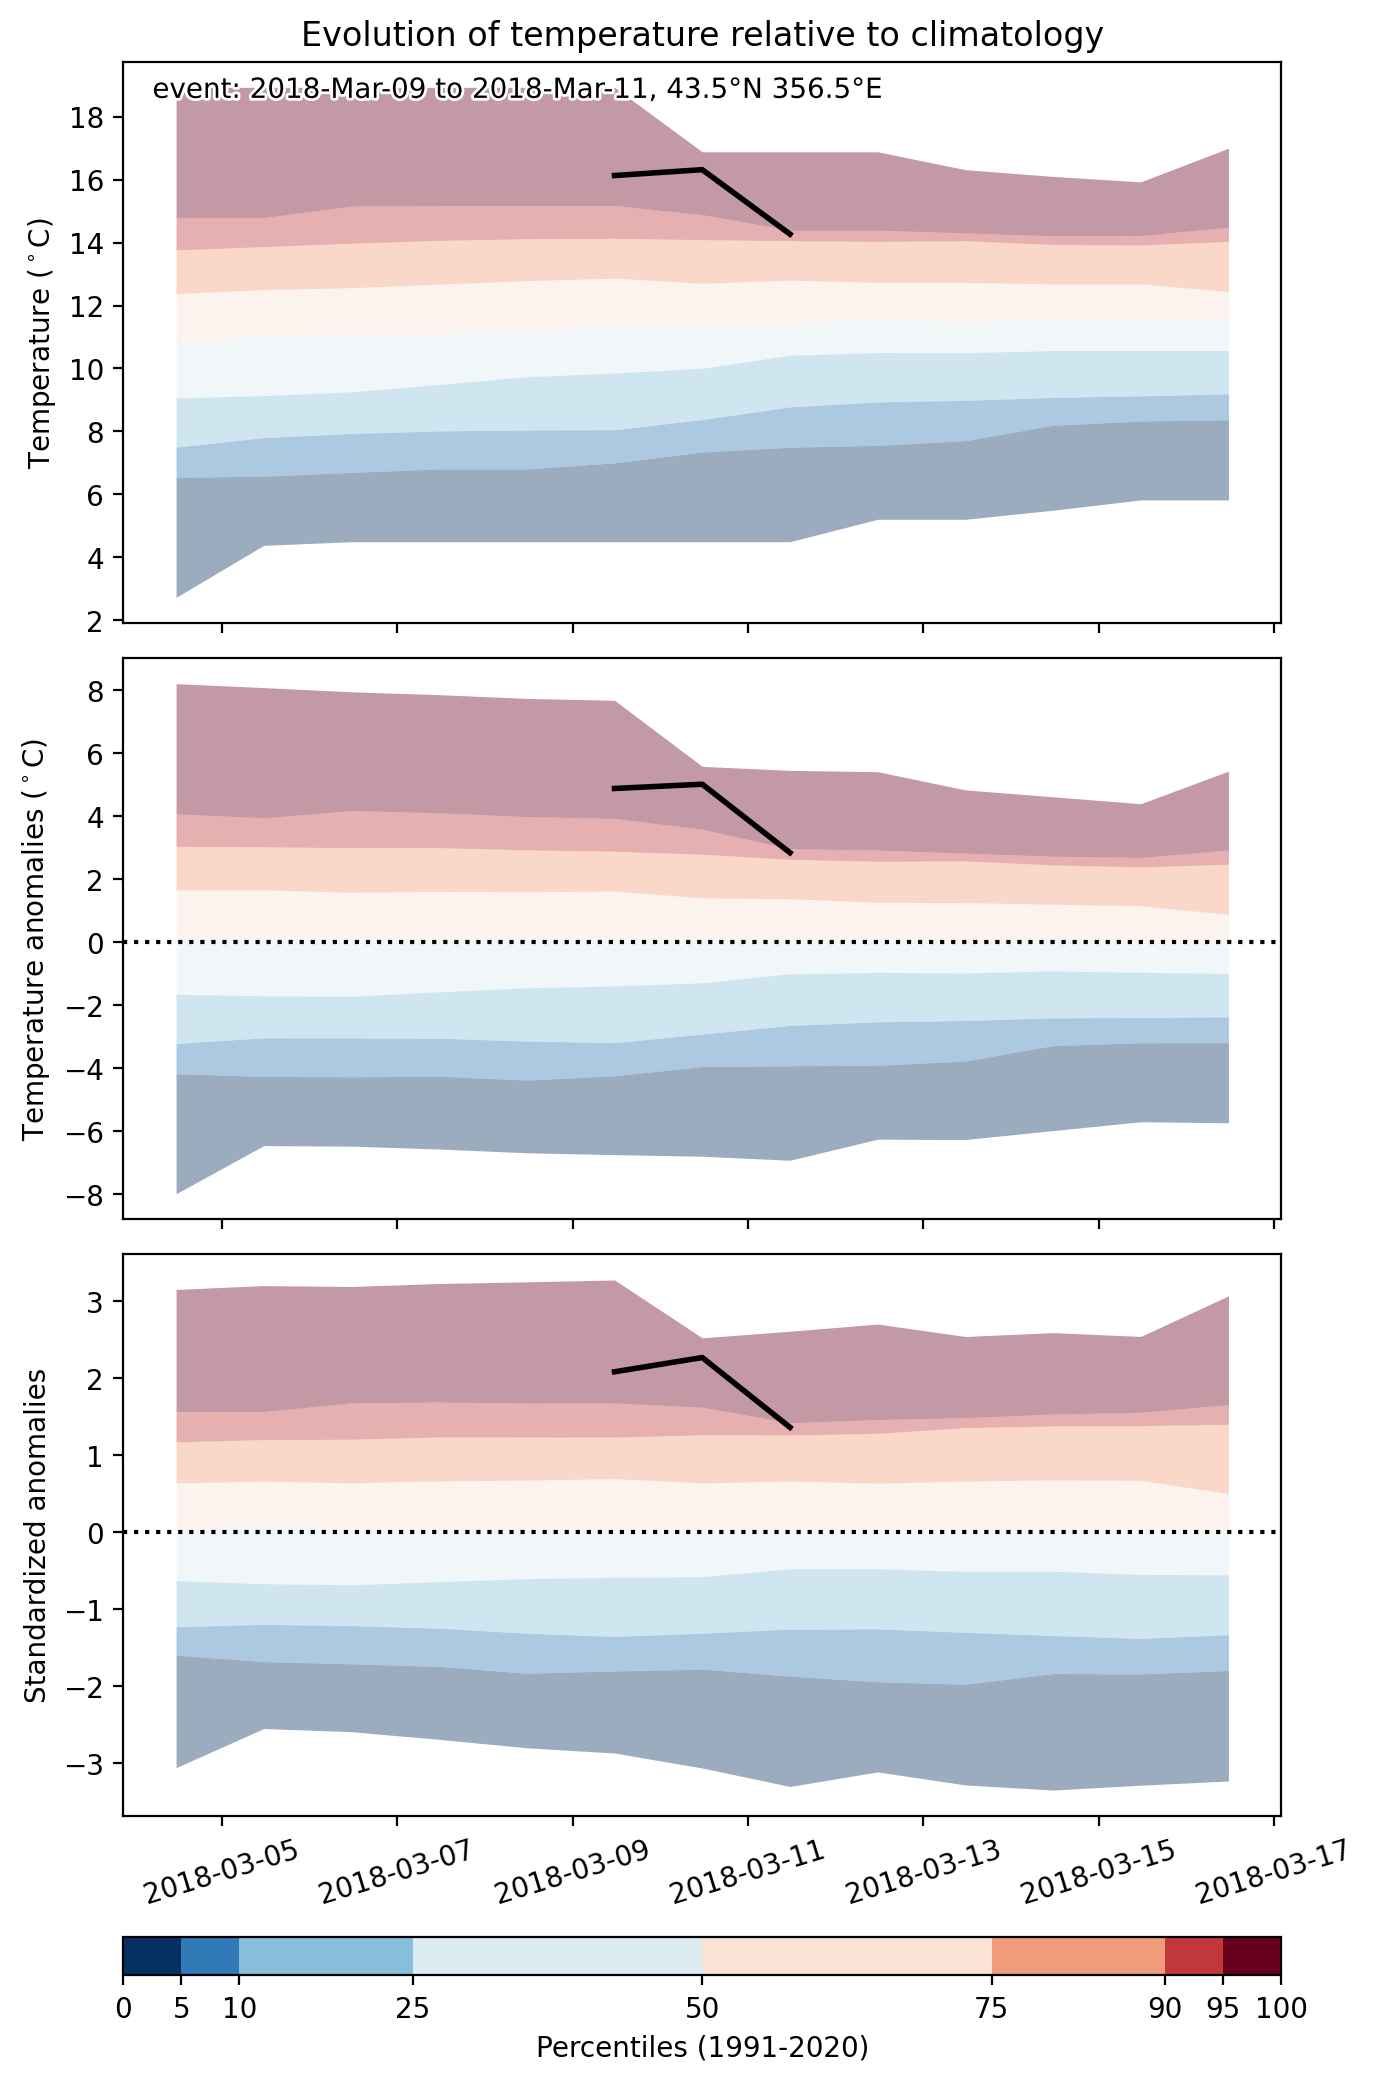
Fig. 2: Evolution of temperature at the center of the event. The climatological percentile distribution is illustrated with color shadings.


Fig. 3: Maps illustrating the evolution of standardized temperature anomalies during the event.

Event ID: Heat_wave_2018-Mar-09_to_2018-Mar-11_356.5_43.5

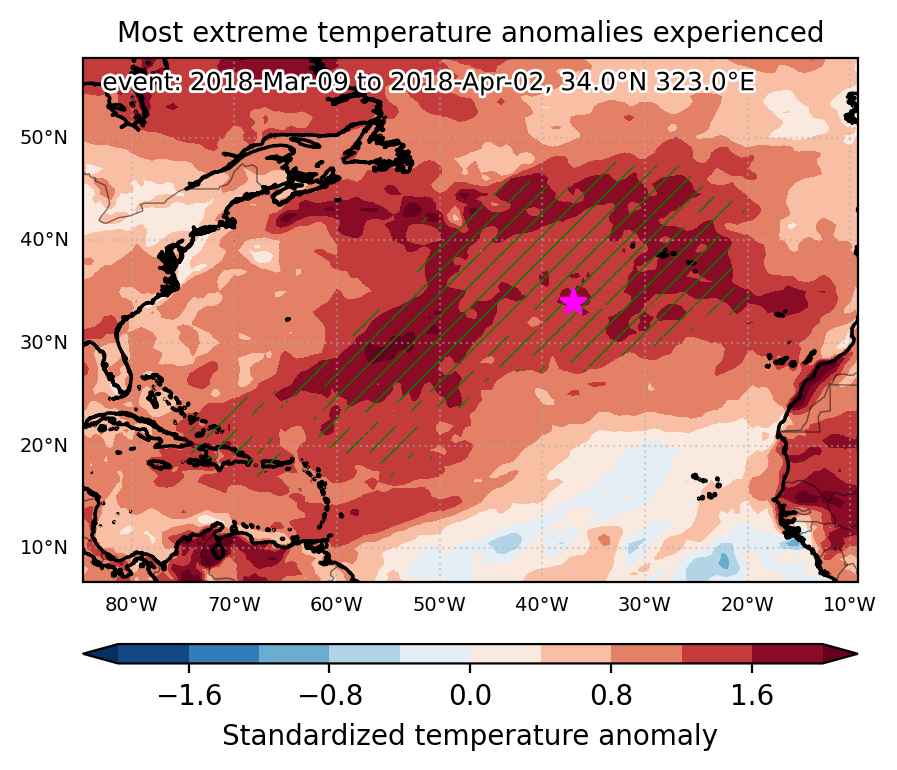
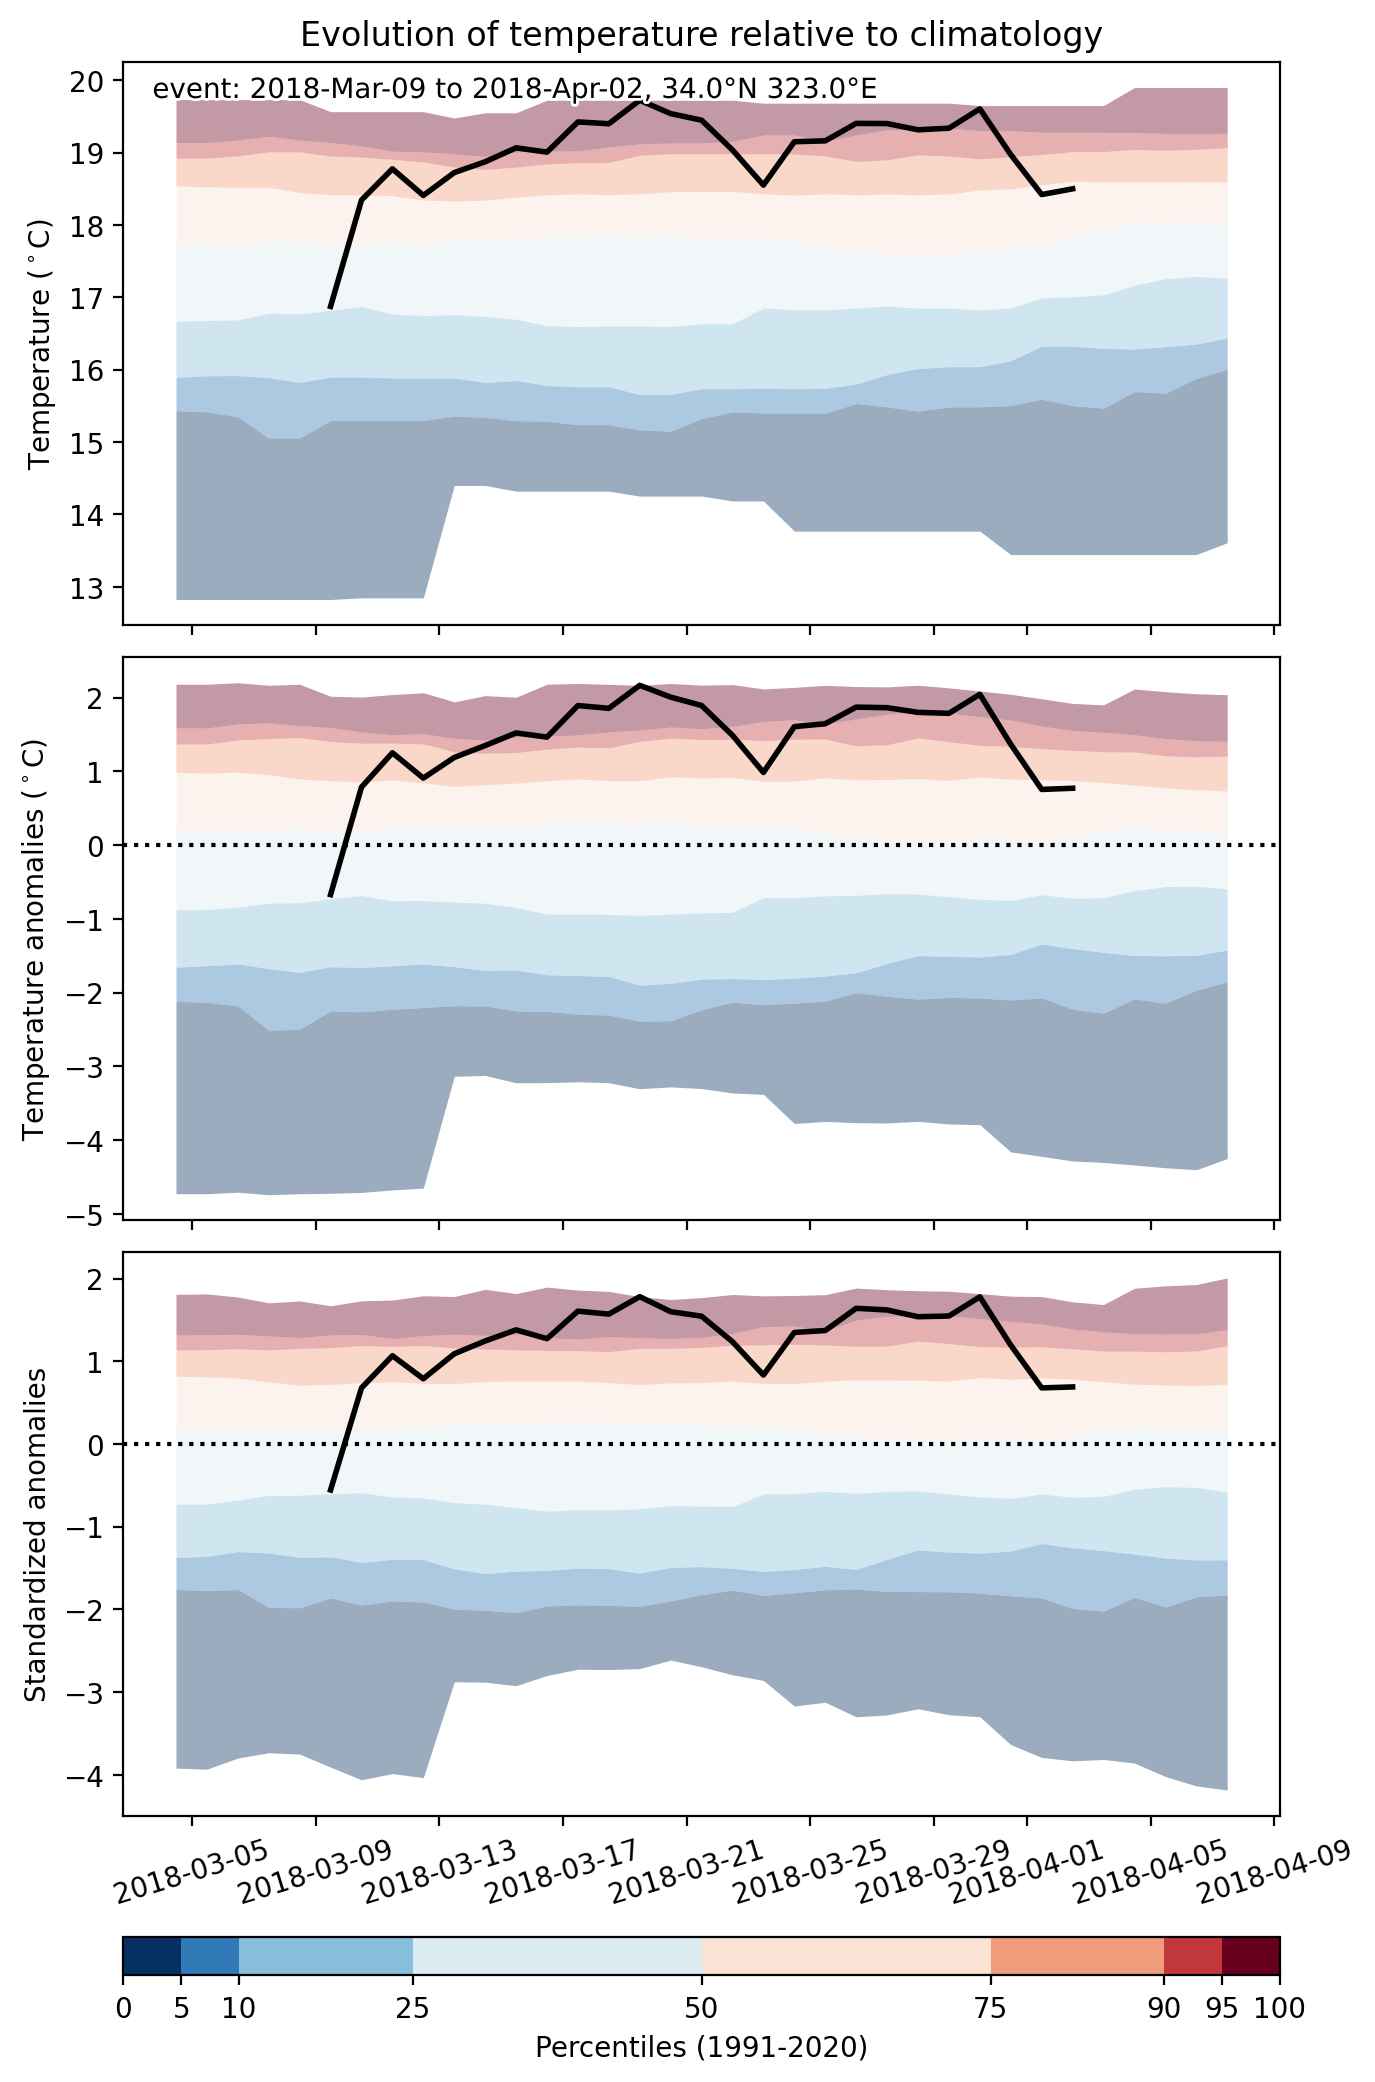
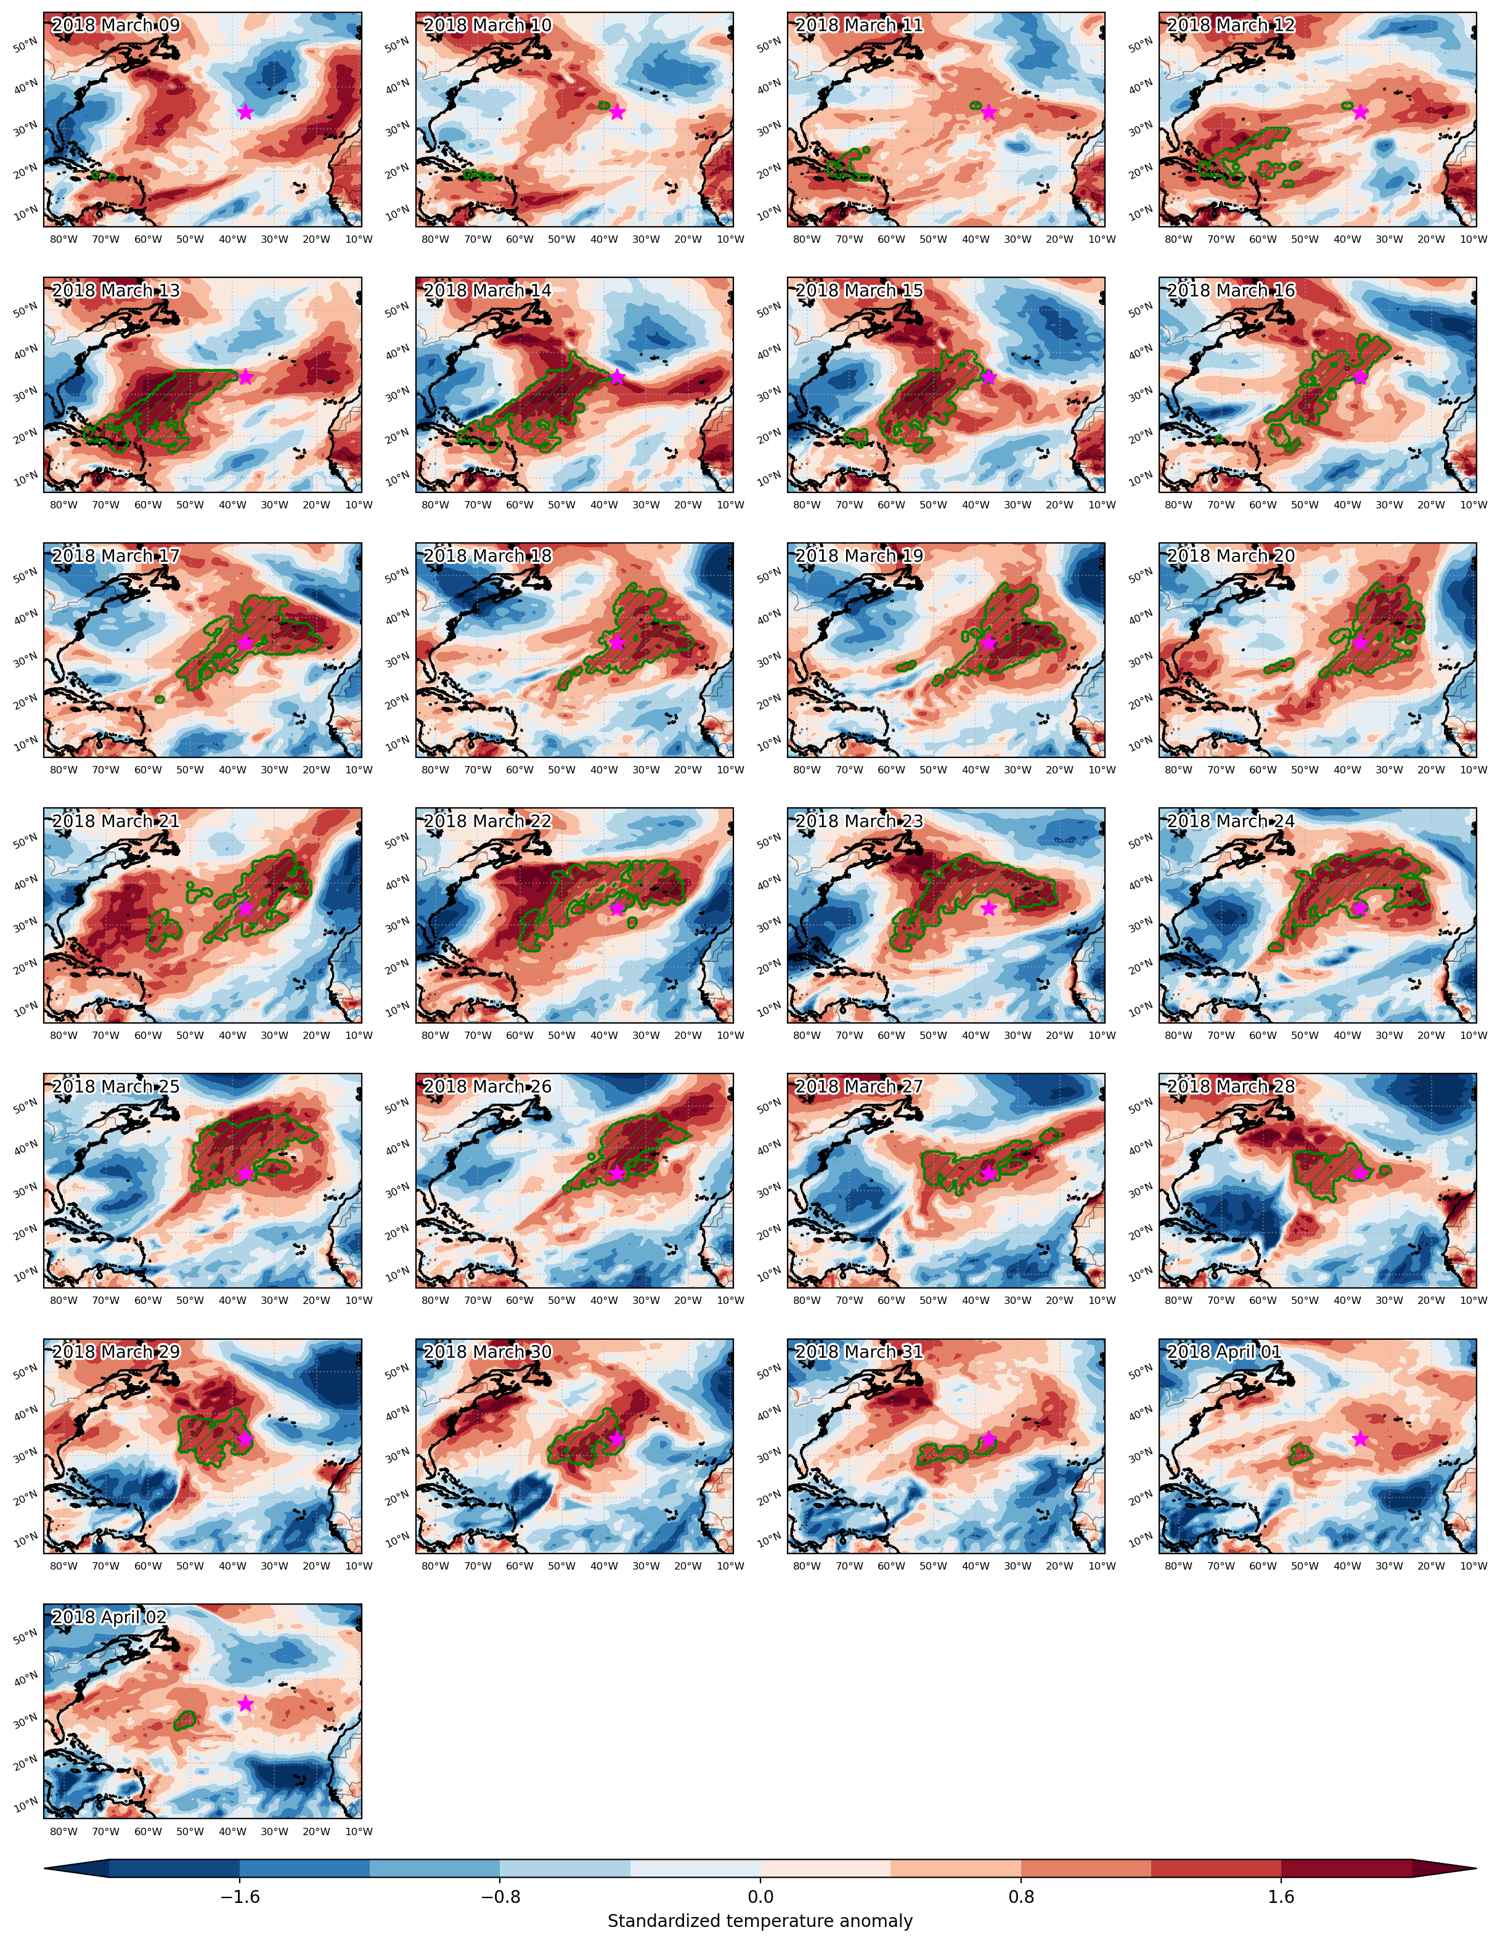
Heat wave occuring from March 09 2018 to April 02 2018 at 34.0°N 323.0°E

Download data: JSON

Event type: Heat wave

Countries affected (identified with ArcGIS Online; provided only for geographical reference):

  • Azores
  • Dominican Republic
  • Haiti
  • Puerto Rico
  • Turks and Caicos Islands

Duration: 25 days

Time span: March 09 2018 to April 02 2018

Statistics over entire affected area:

  • Mean temperature anomaly: 2.1 °C
  • Mean temperature: 19.1 °C
  • Maximum temperature anomaly: 9.7 °C
  • Maximum temperature: 26.7 °C

Event center: 34.0°N 323.0°E

Area affected: 6458207 km$^2$


Fig. 1: Map of most extreme temperature anomalies (standardized) experienced during the event. The purple star indicates the center of the extreme event. Green hatching illustrates all areas under the effect of extremes at some time during the event.


Fig. 2: Evolution of temperature at the center of the event. The climatological percentile distribution is illustrated with color shadings.


Fig. 3: Maps illustrating the evolution of standardized temperature anomalies during the event.

Event ID: Heat_wave_2018-Mar-09_to_2018-Apr-02_323.0_34.0

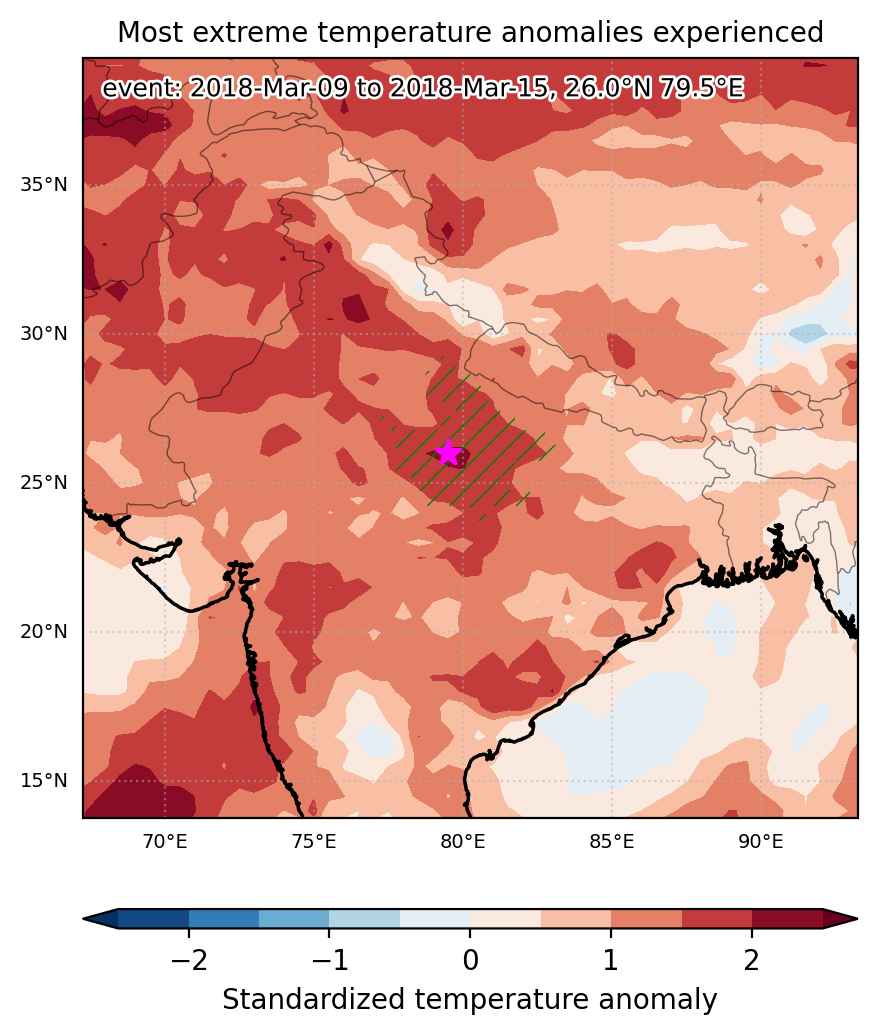
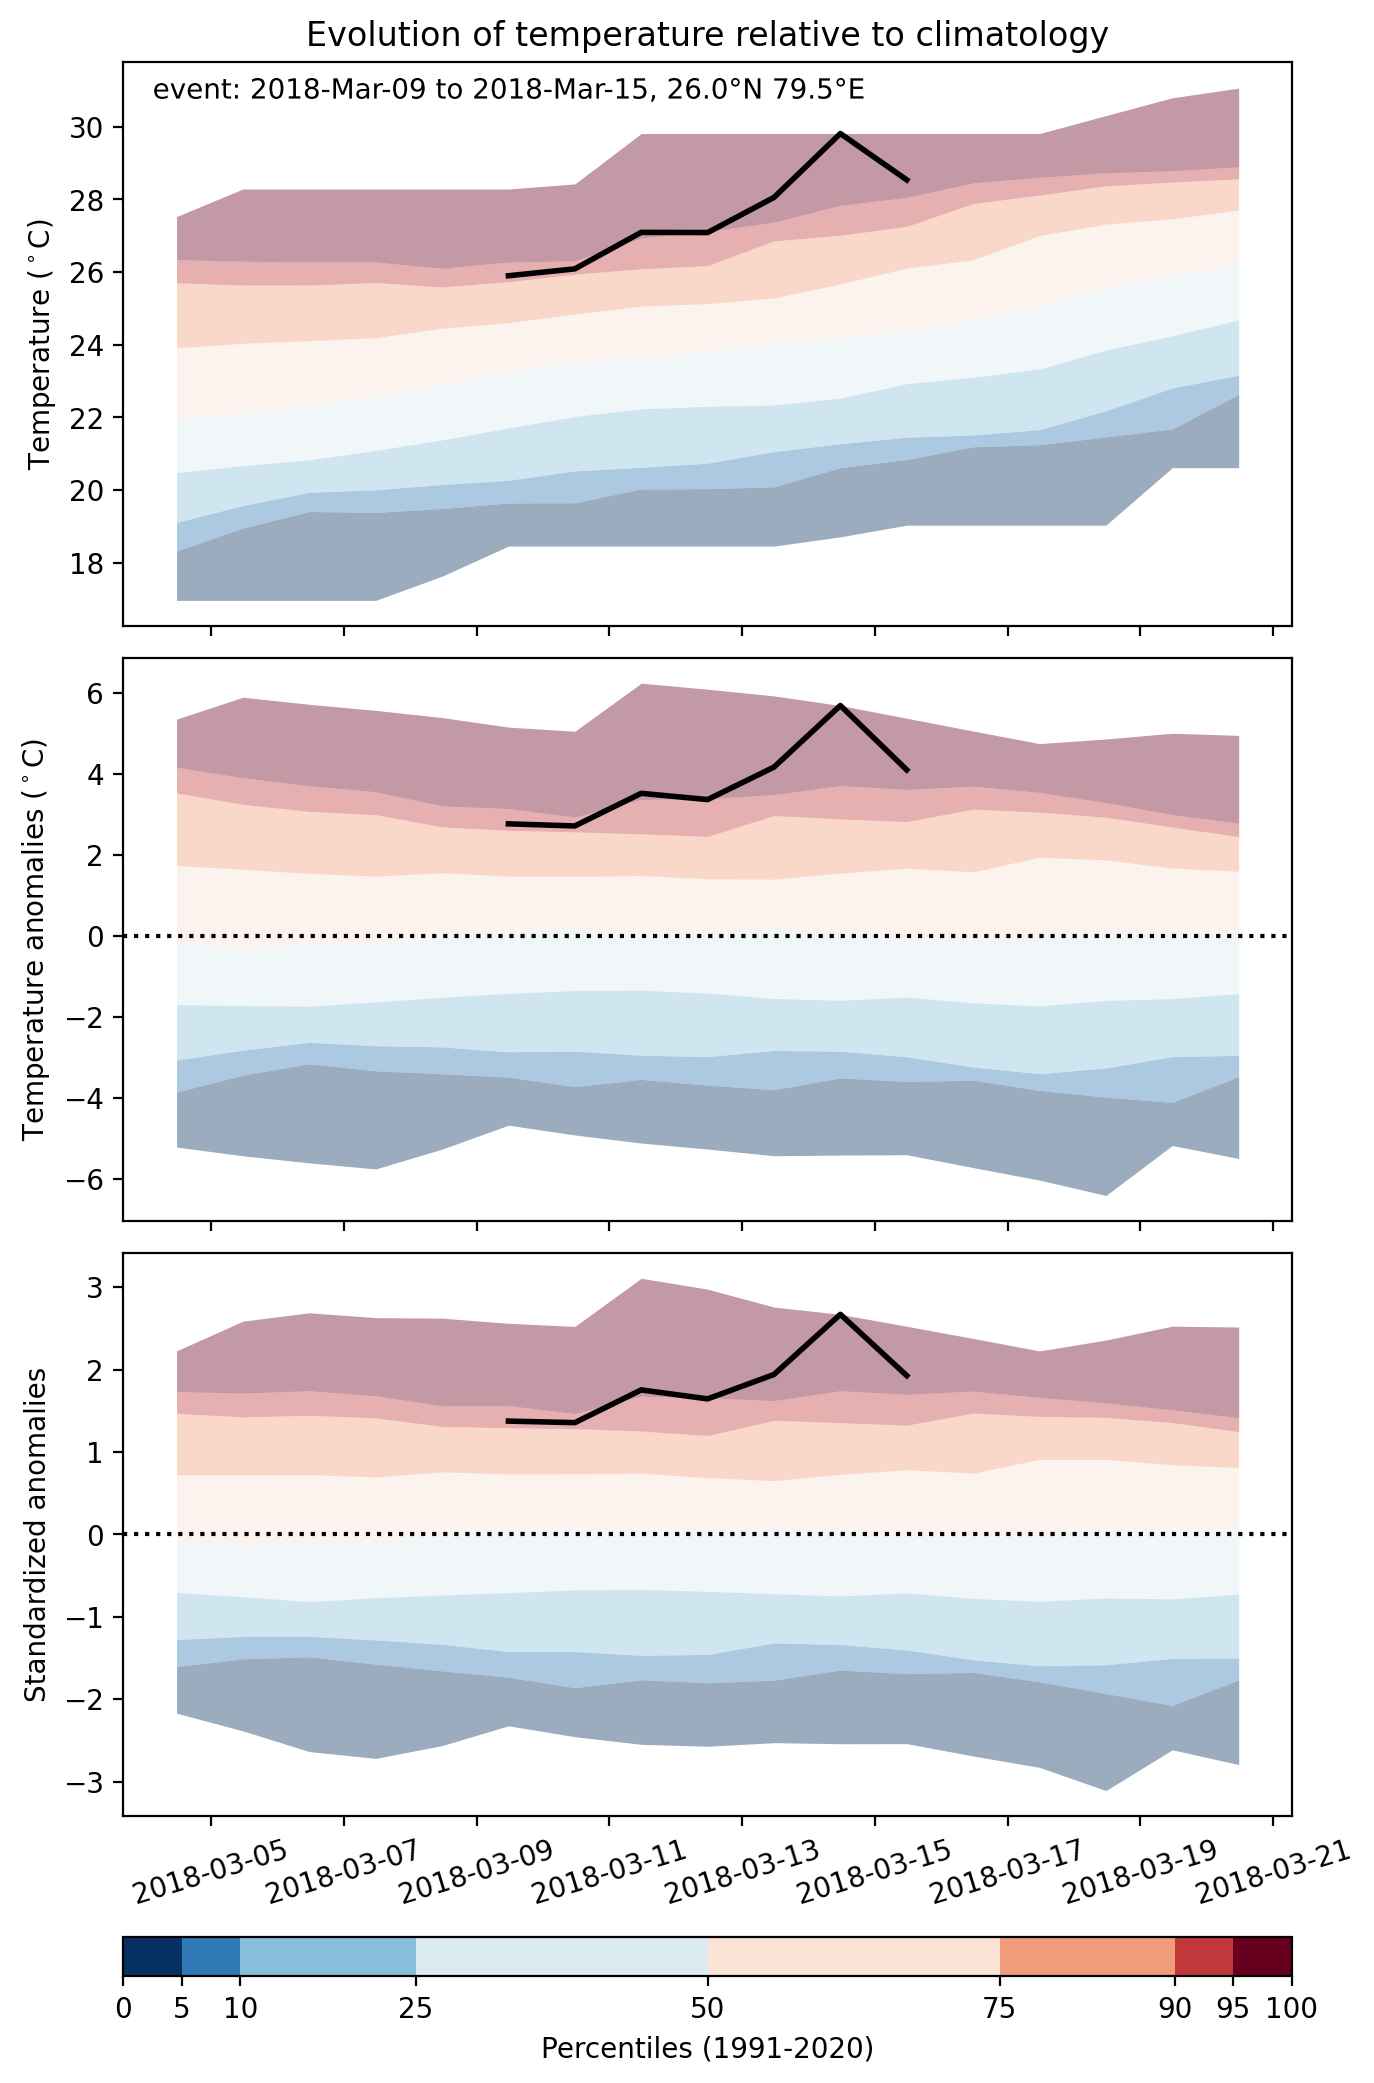
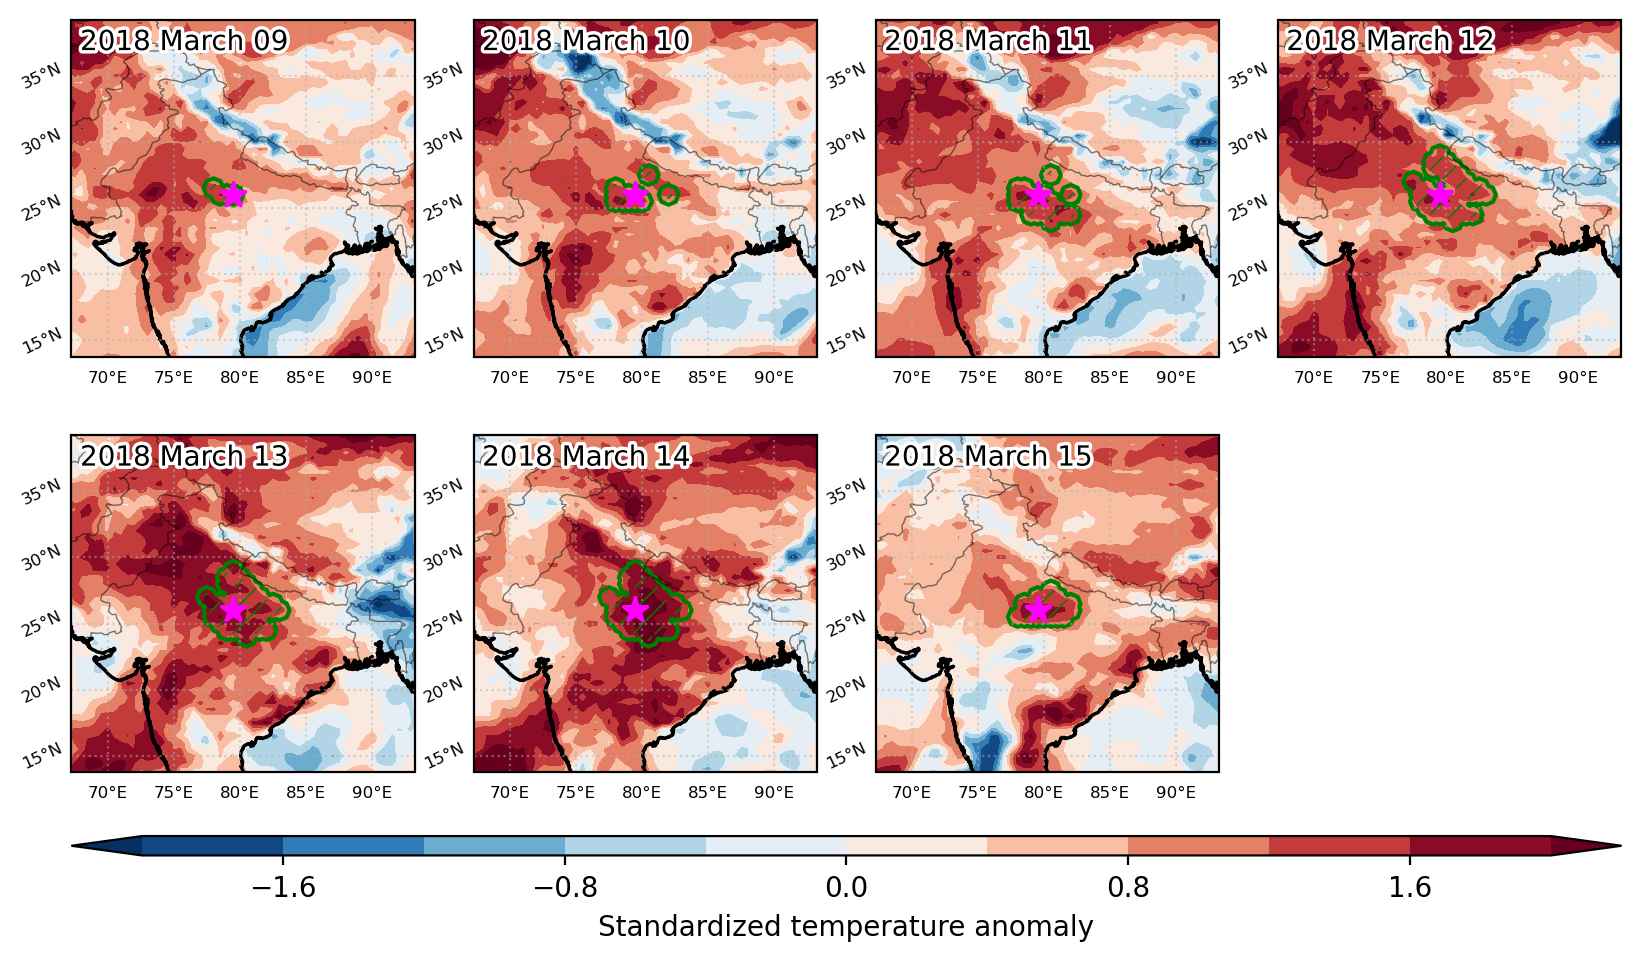
Heat wave occuring from March 09 2018 to March 15 2018 at 26.0°N 79.5°E

Download data: JSON

Event type: Heat wave

Countries affected (identified with ArcGIS Online; provided only for geographical reference):

  • India

Duration: 7 days

Time span: March 09 2018 to March 15 2018

Statistics over entire affected area:

  • Mean temperature anomaly: 3.5 °C
  • Mean temperature: 26.9 °C
  • Maximum temperature anomaly: 5.7 °C
  • Maximum temperature: 29.8 °C

Event center: 26.0°N 79.5°E

Area affected: 166385 km$^2$


Fig. 1: Map of most extreme temperature anomalies (standardized) experienced during the event. The purple star indicates the center of the extreme event. Green hatching illustrates all areas under the effect of extremes at some time during the event.


Fig. 2: Evolution of temperature at the center of the event. The climatological percentile distribution is illustrated with color shadings.


Fig. 3: Maps illustrating the evolution of standardized temperature anomalies during the event.

Event ID: Heat_wave_2018-Mar-09_to_2018-Mar-15_79.5_26.0

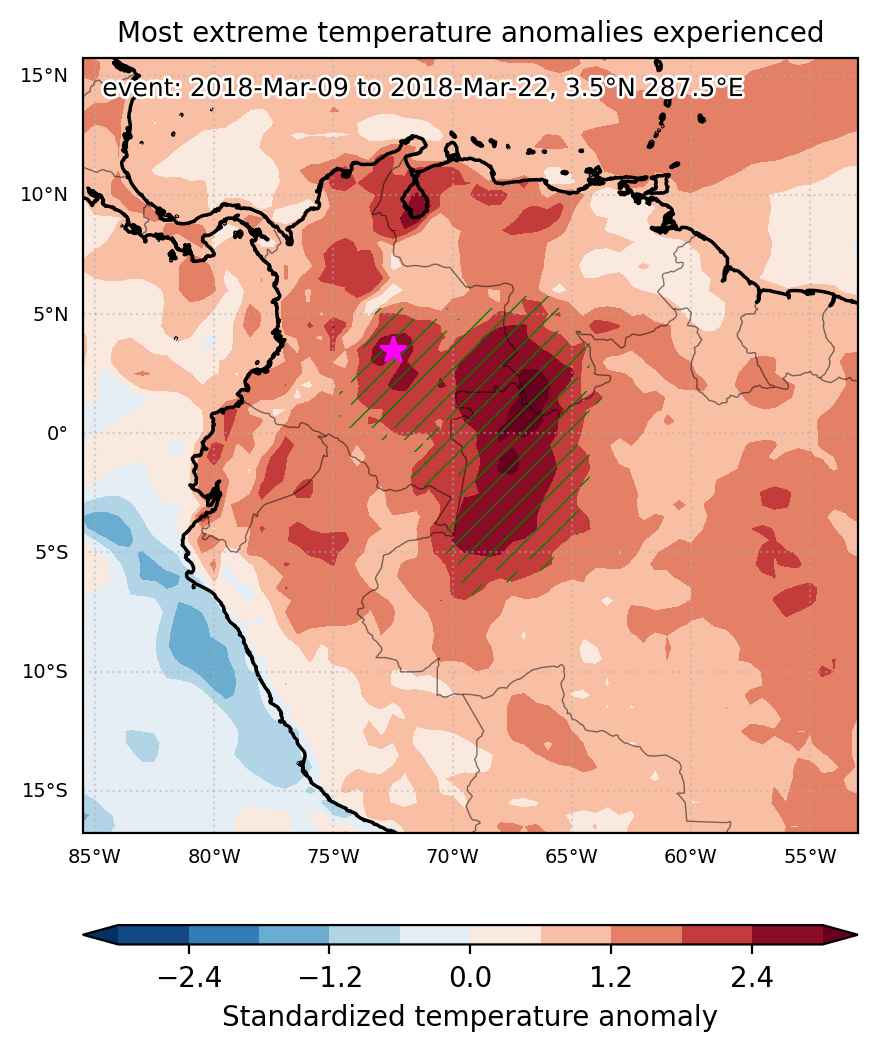
Heat wave occuring from March 09 2018 to March 22 2018 at 3.5°N 287.5°E

Download data: JSON

Event type: Heat wave

Countries affected (identified with ArcGIS Online; provided only for geographical reference):

  • Brazil
  • Colombia
  • Venezuela

Duration: 14 days

Time span: March 09 2018 to March 22 2018

Statistics over entire affected area:

  • Mean temperature anomaly: 2.1 °C
  • Mean temperature: 27.9 °C
  • Maximum temperature anomaly: 3.7 °C
  • Maximum temperature: 30.9 °C

Event center: 3.5°N 287.5°E

Area affected: 1018635 km$^2$


Fig. 1: Map of most extreme temperature anomalies (standardized) experienced during the event. The purple star indicates the center of the extreme event. Green hatching illustrates all areas under the effect of extremes at some time during the event.


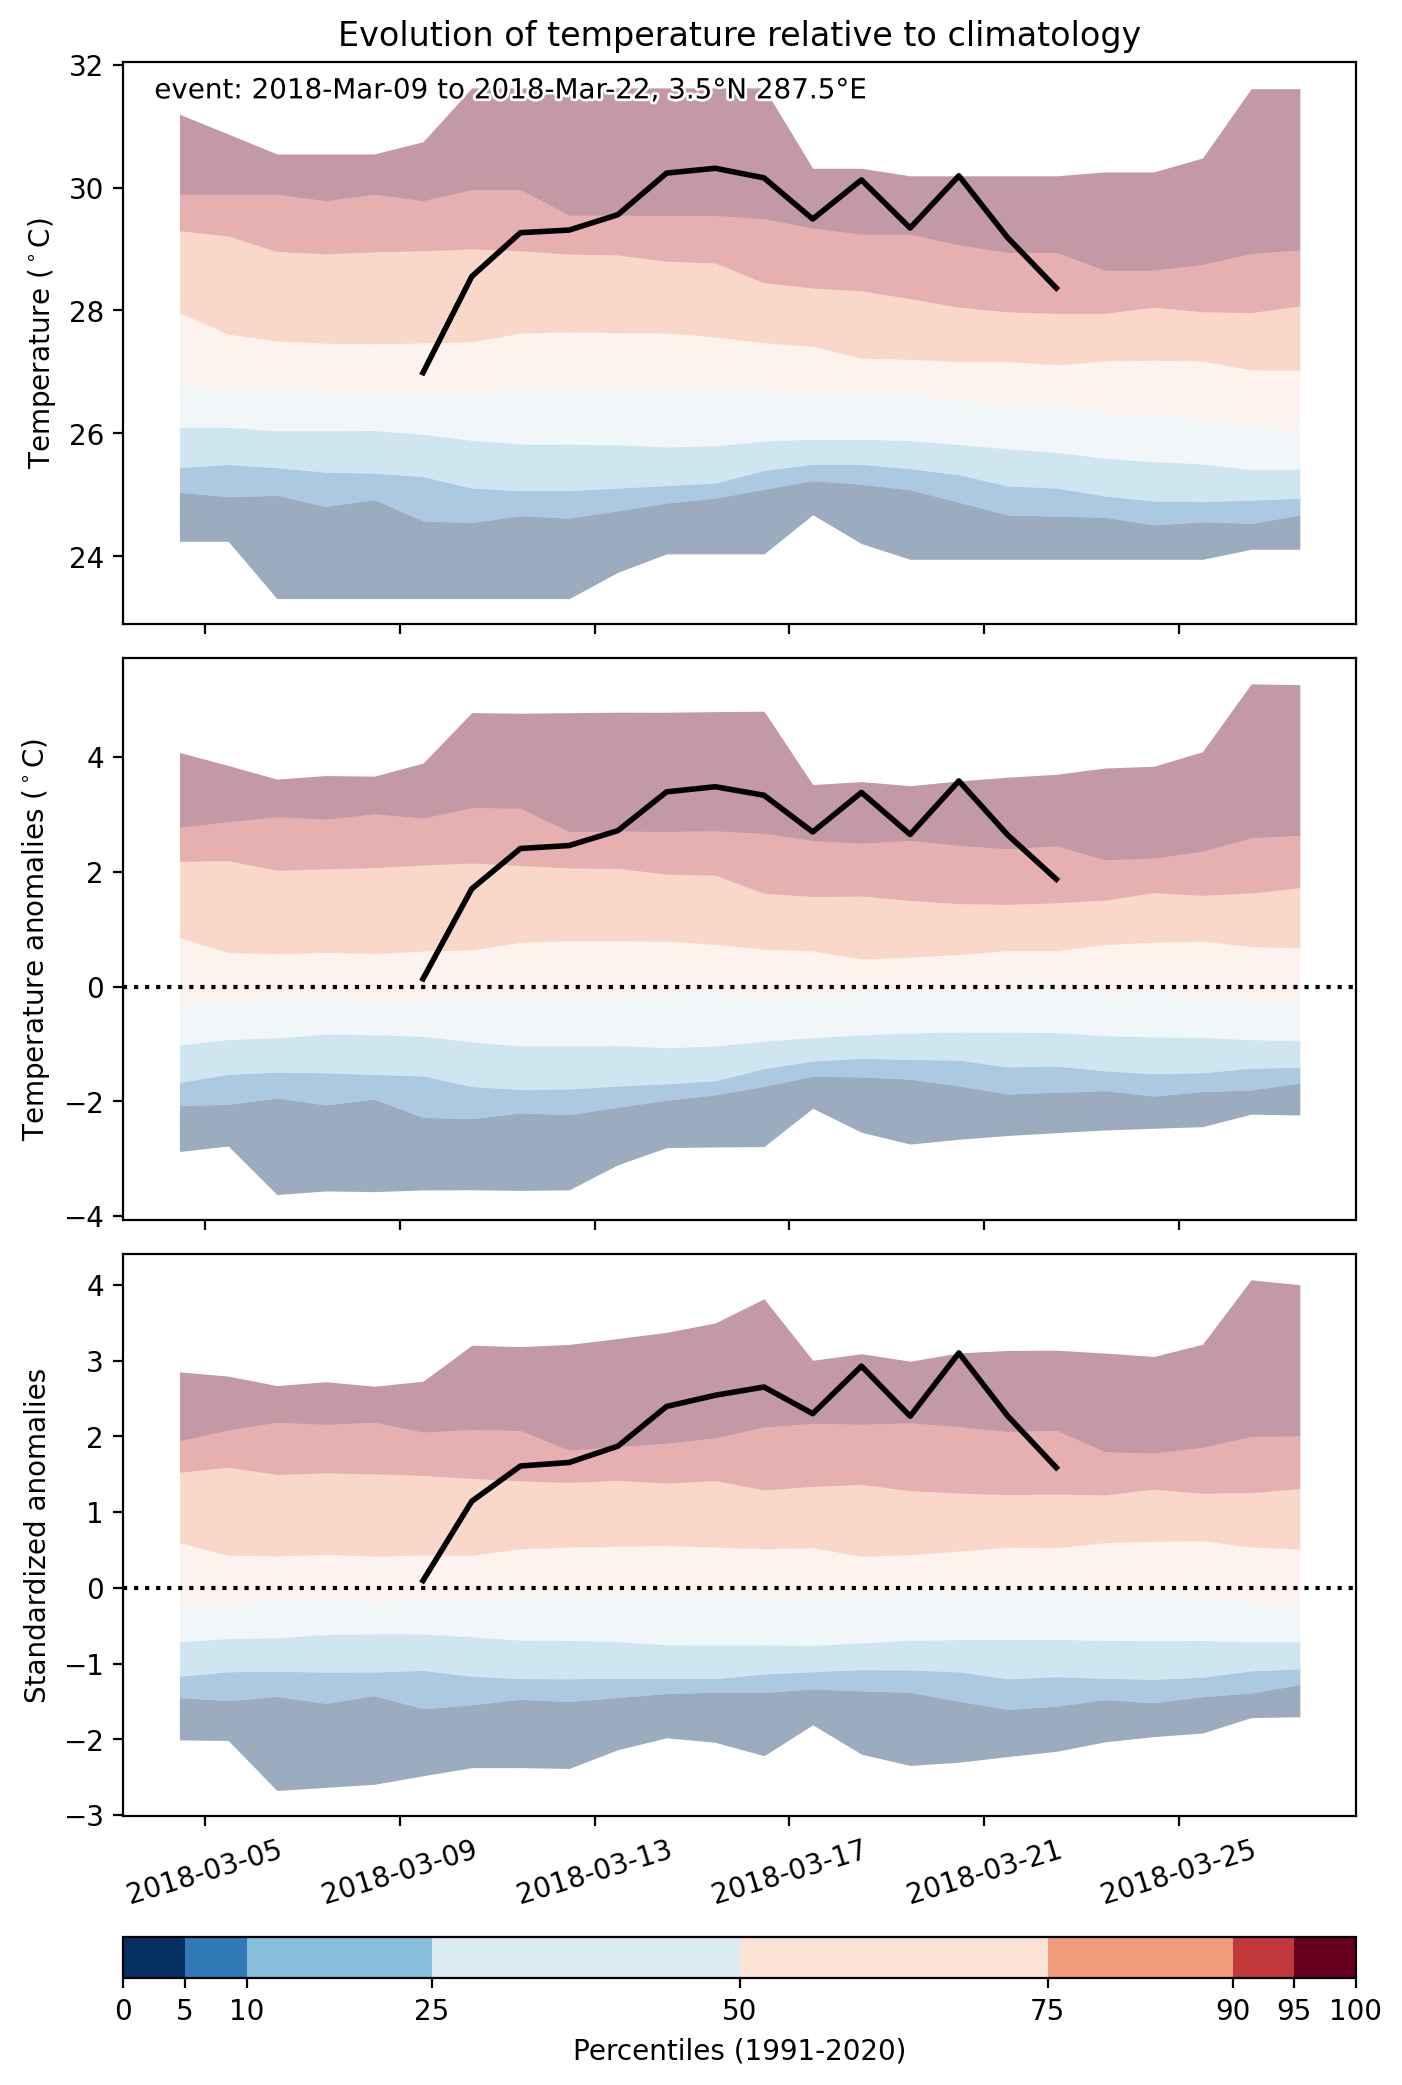
Fig. 2: Evolution of temperature at the center of the event. The climatological percentile distribution is illustrated with color shadings.


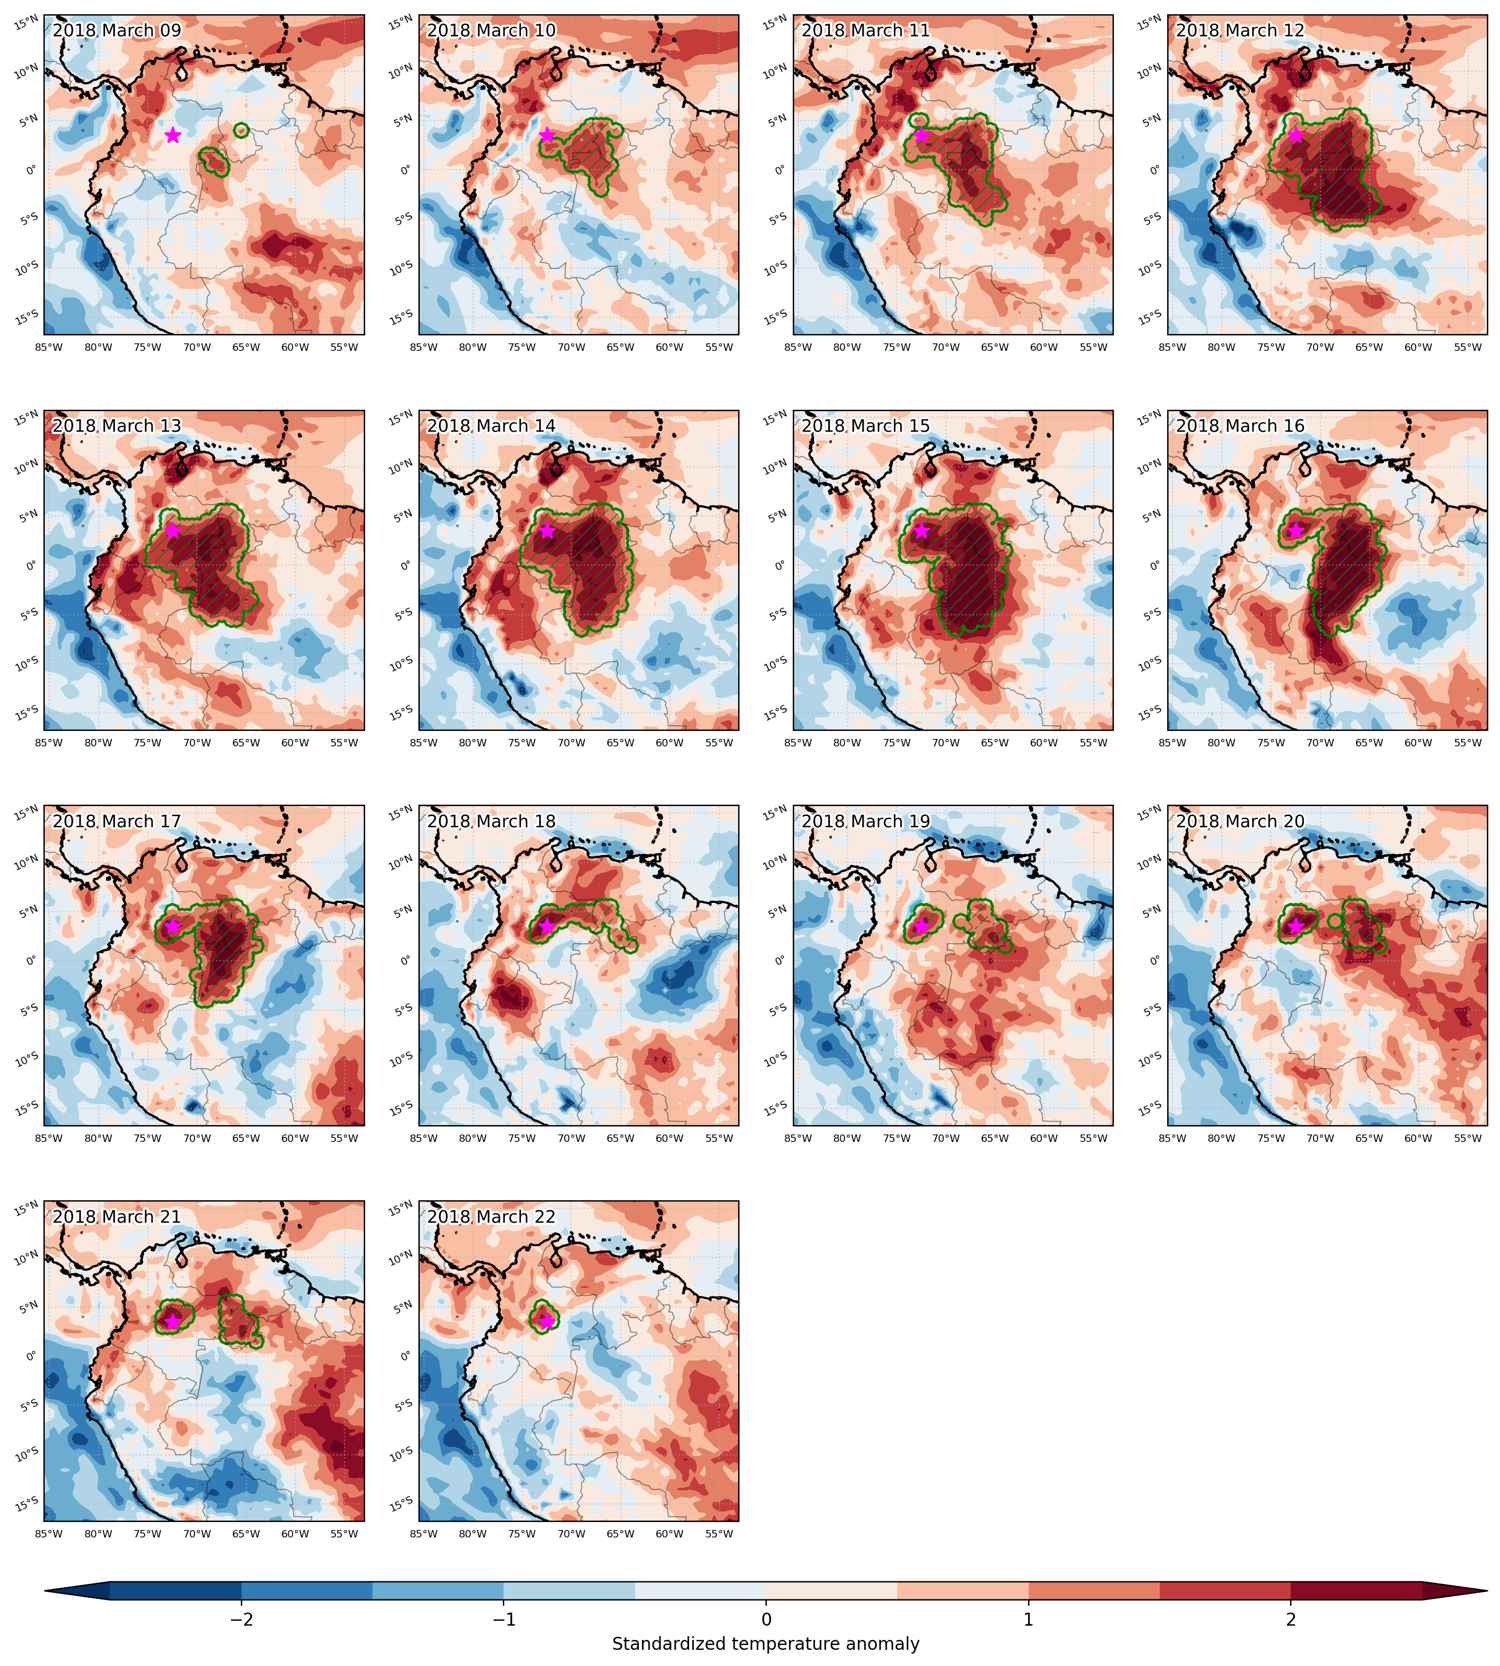
Fig. 3: Maps illustrating the evolution of standardized temperature anomalies during the event.

Event ID: Heat_wave_2018-Mar-09_to_2018-Mar-22_287.5_3.5