Cold spell occuring from August 29 2015 to September 01 2015 at -27.5°S 150.5°E

Download data: JSON

Event type: Cold spell

Countries affected (identified with ArcGIS Online; provided only for geographical reference):

  • Australia

Duration: 4 days

Time span: August 29 2015 to September 01 2015

Statistics over entire affected area:

  • Mean temperature anomaly: -5.0 °C
  • Mean temperature: 10.4 °C
  • Minimum temperature anomaly: -6.6 °C
  • Minimum temperature: 8.9 °C

Event center: -27.5°S 150.5°E

Area affected: 123874 km$^2$
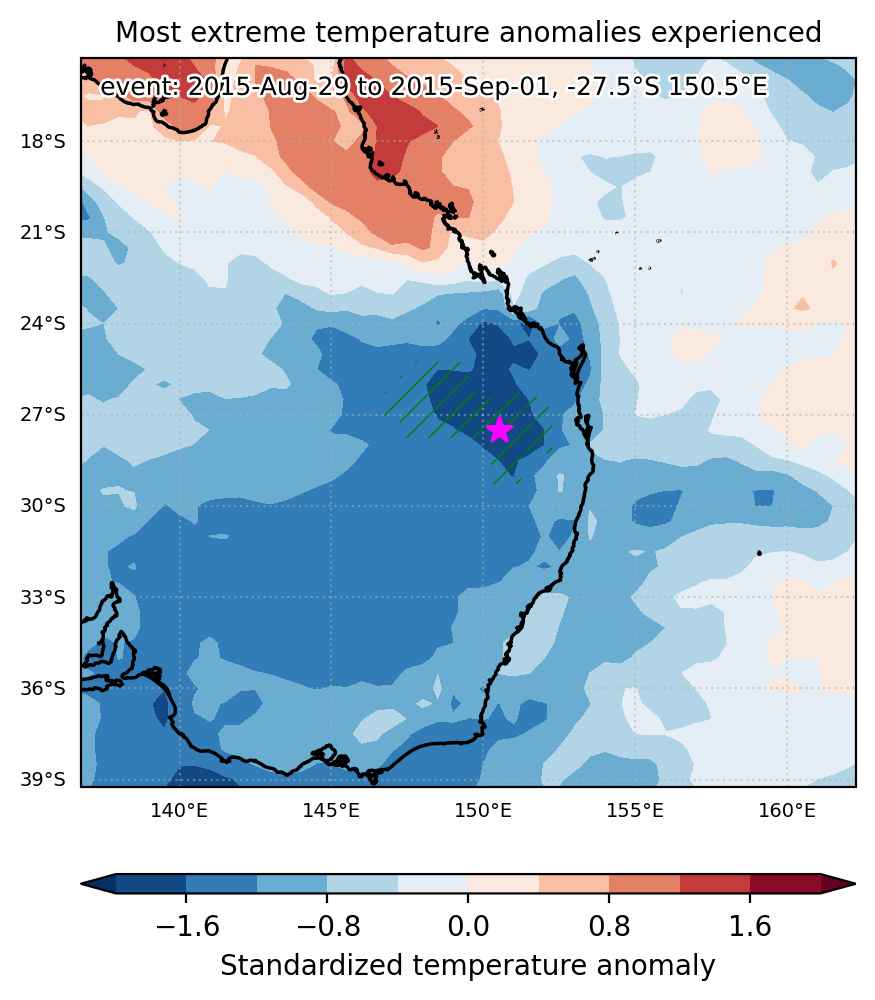

Fig. 1: Map of most extreme temperature anomalies (standardized) experienced during the event. The purple star indicates the center of the extreme event. Green hatching illustrates all areas under the effect of extremes at some time during the event.
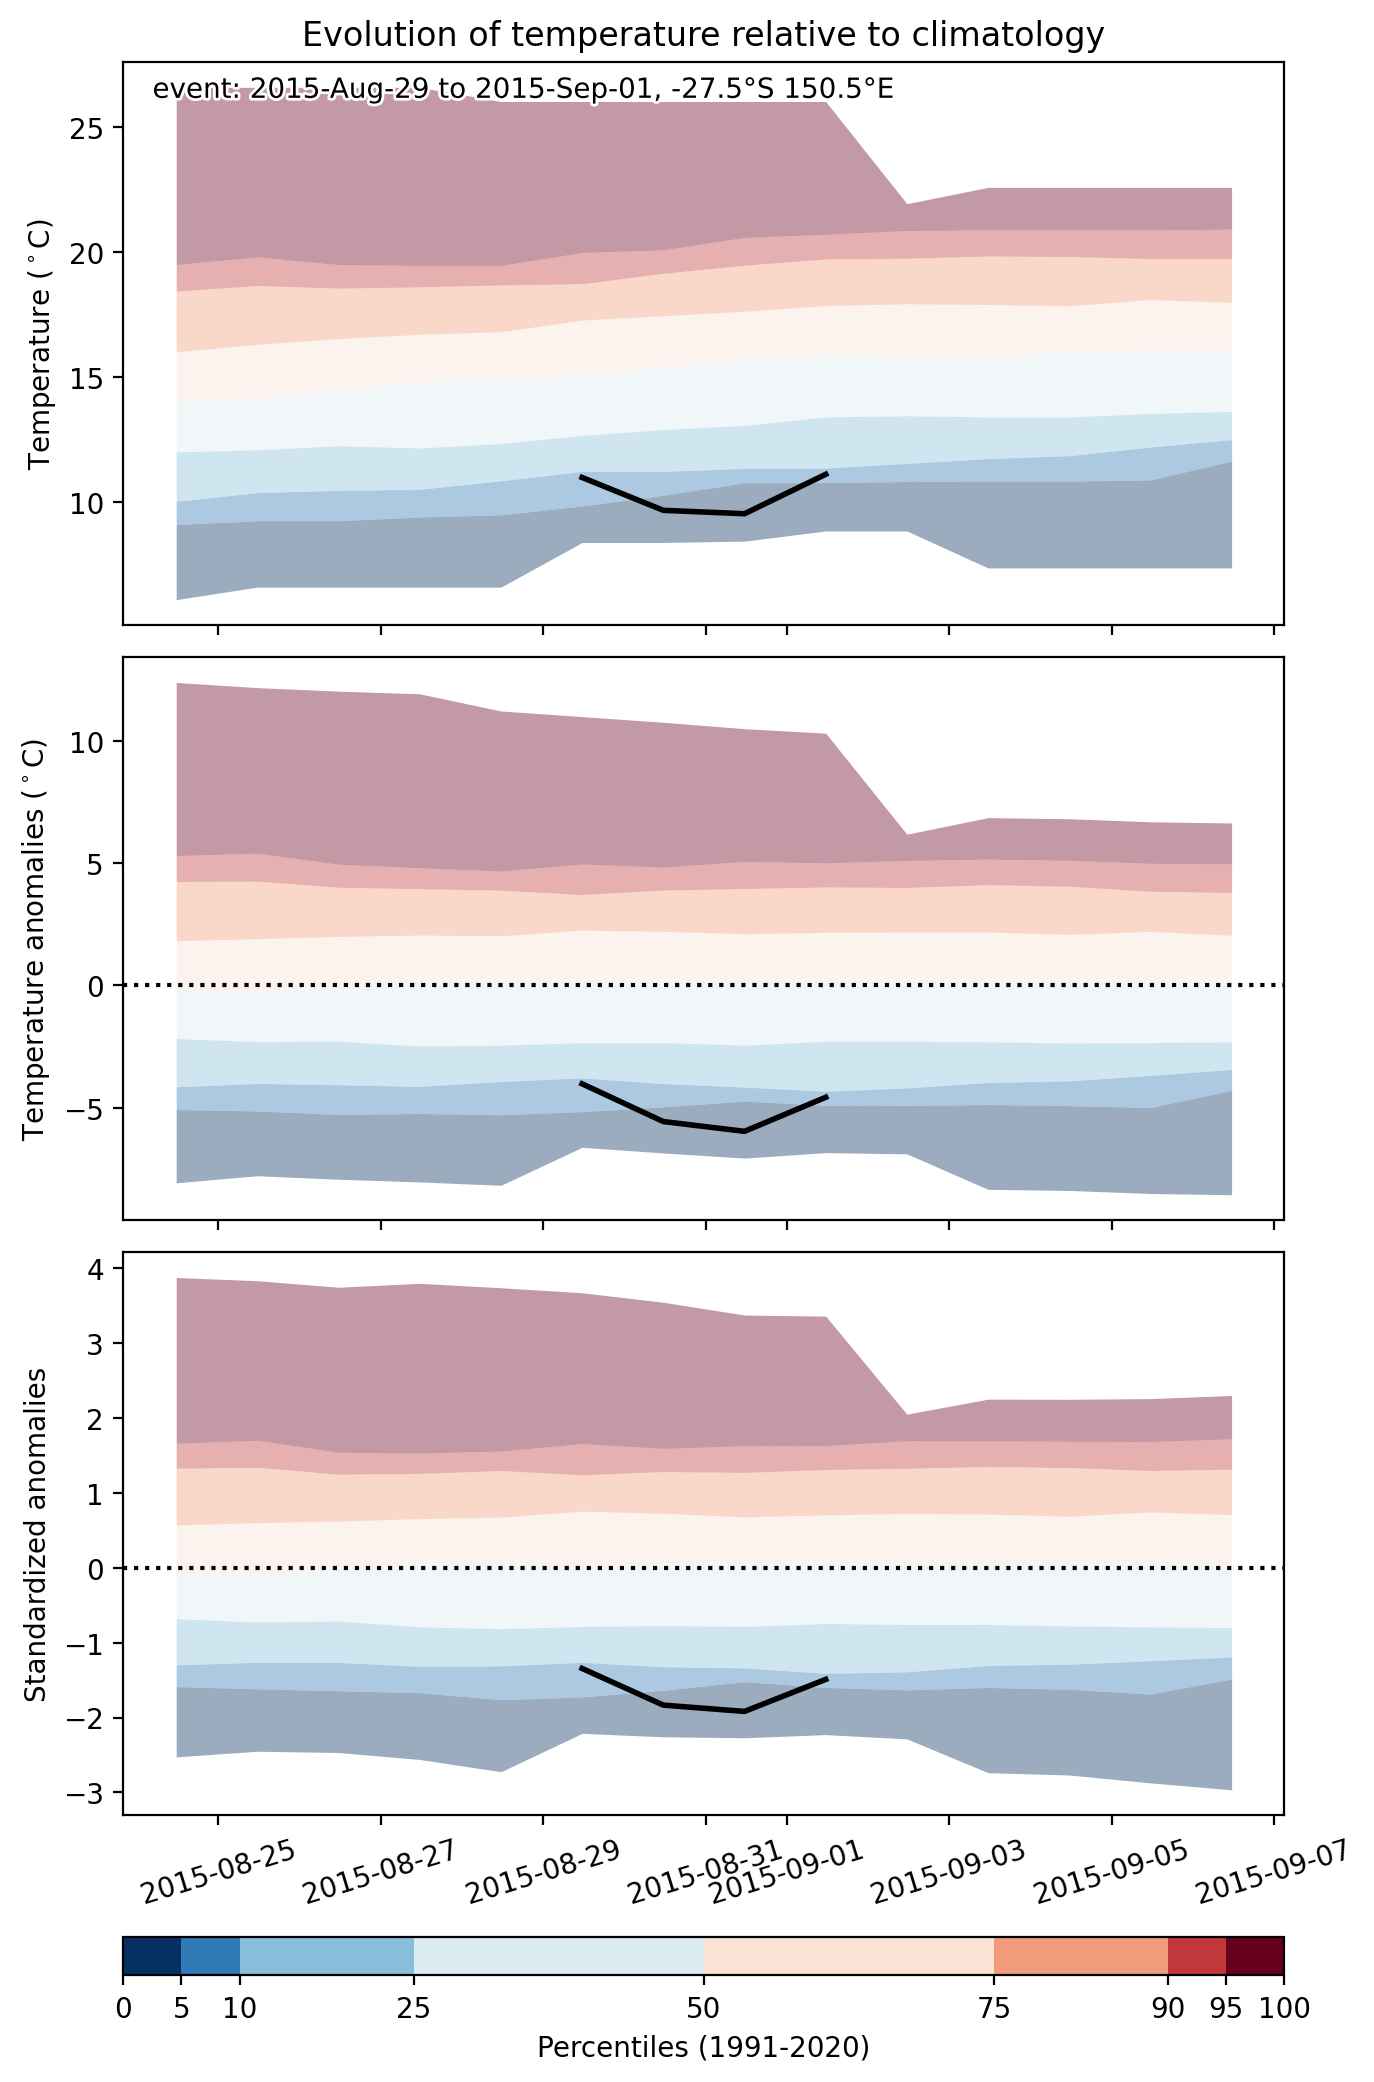


Fig. 2: Evolution of temperature at the center of the event. The climatological percentile distribution is illustrated with color shadings.
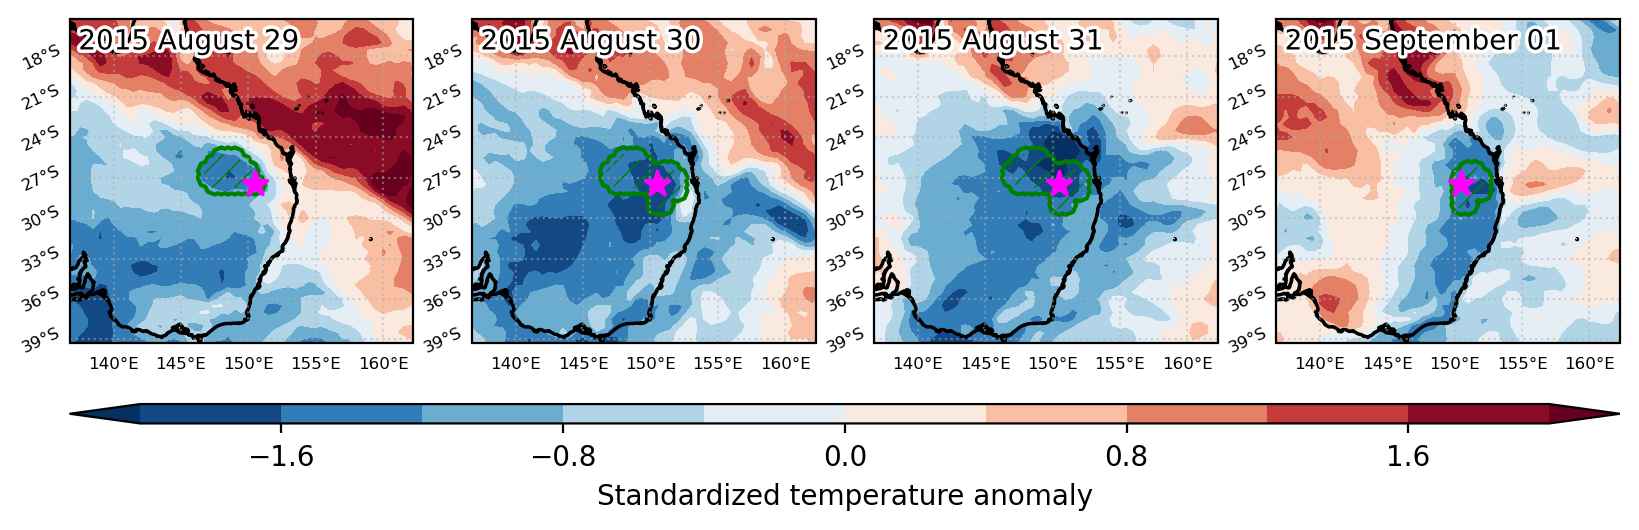


Fig. 3: Maps illustrating the evolution of standardized temperature anomalies during the event.

Event ID: Cold_spell_2015-Aug-29_to_2015-Sep-01_150.5_-27.5
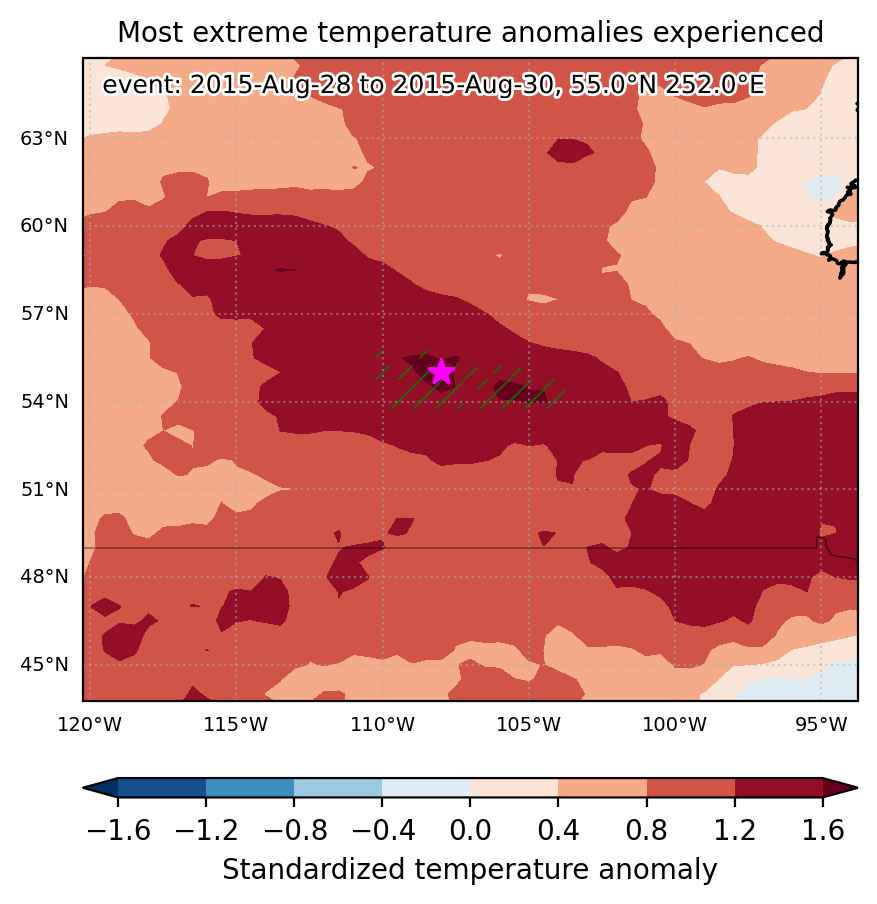
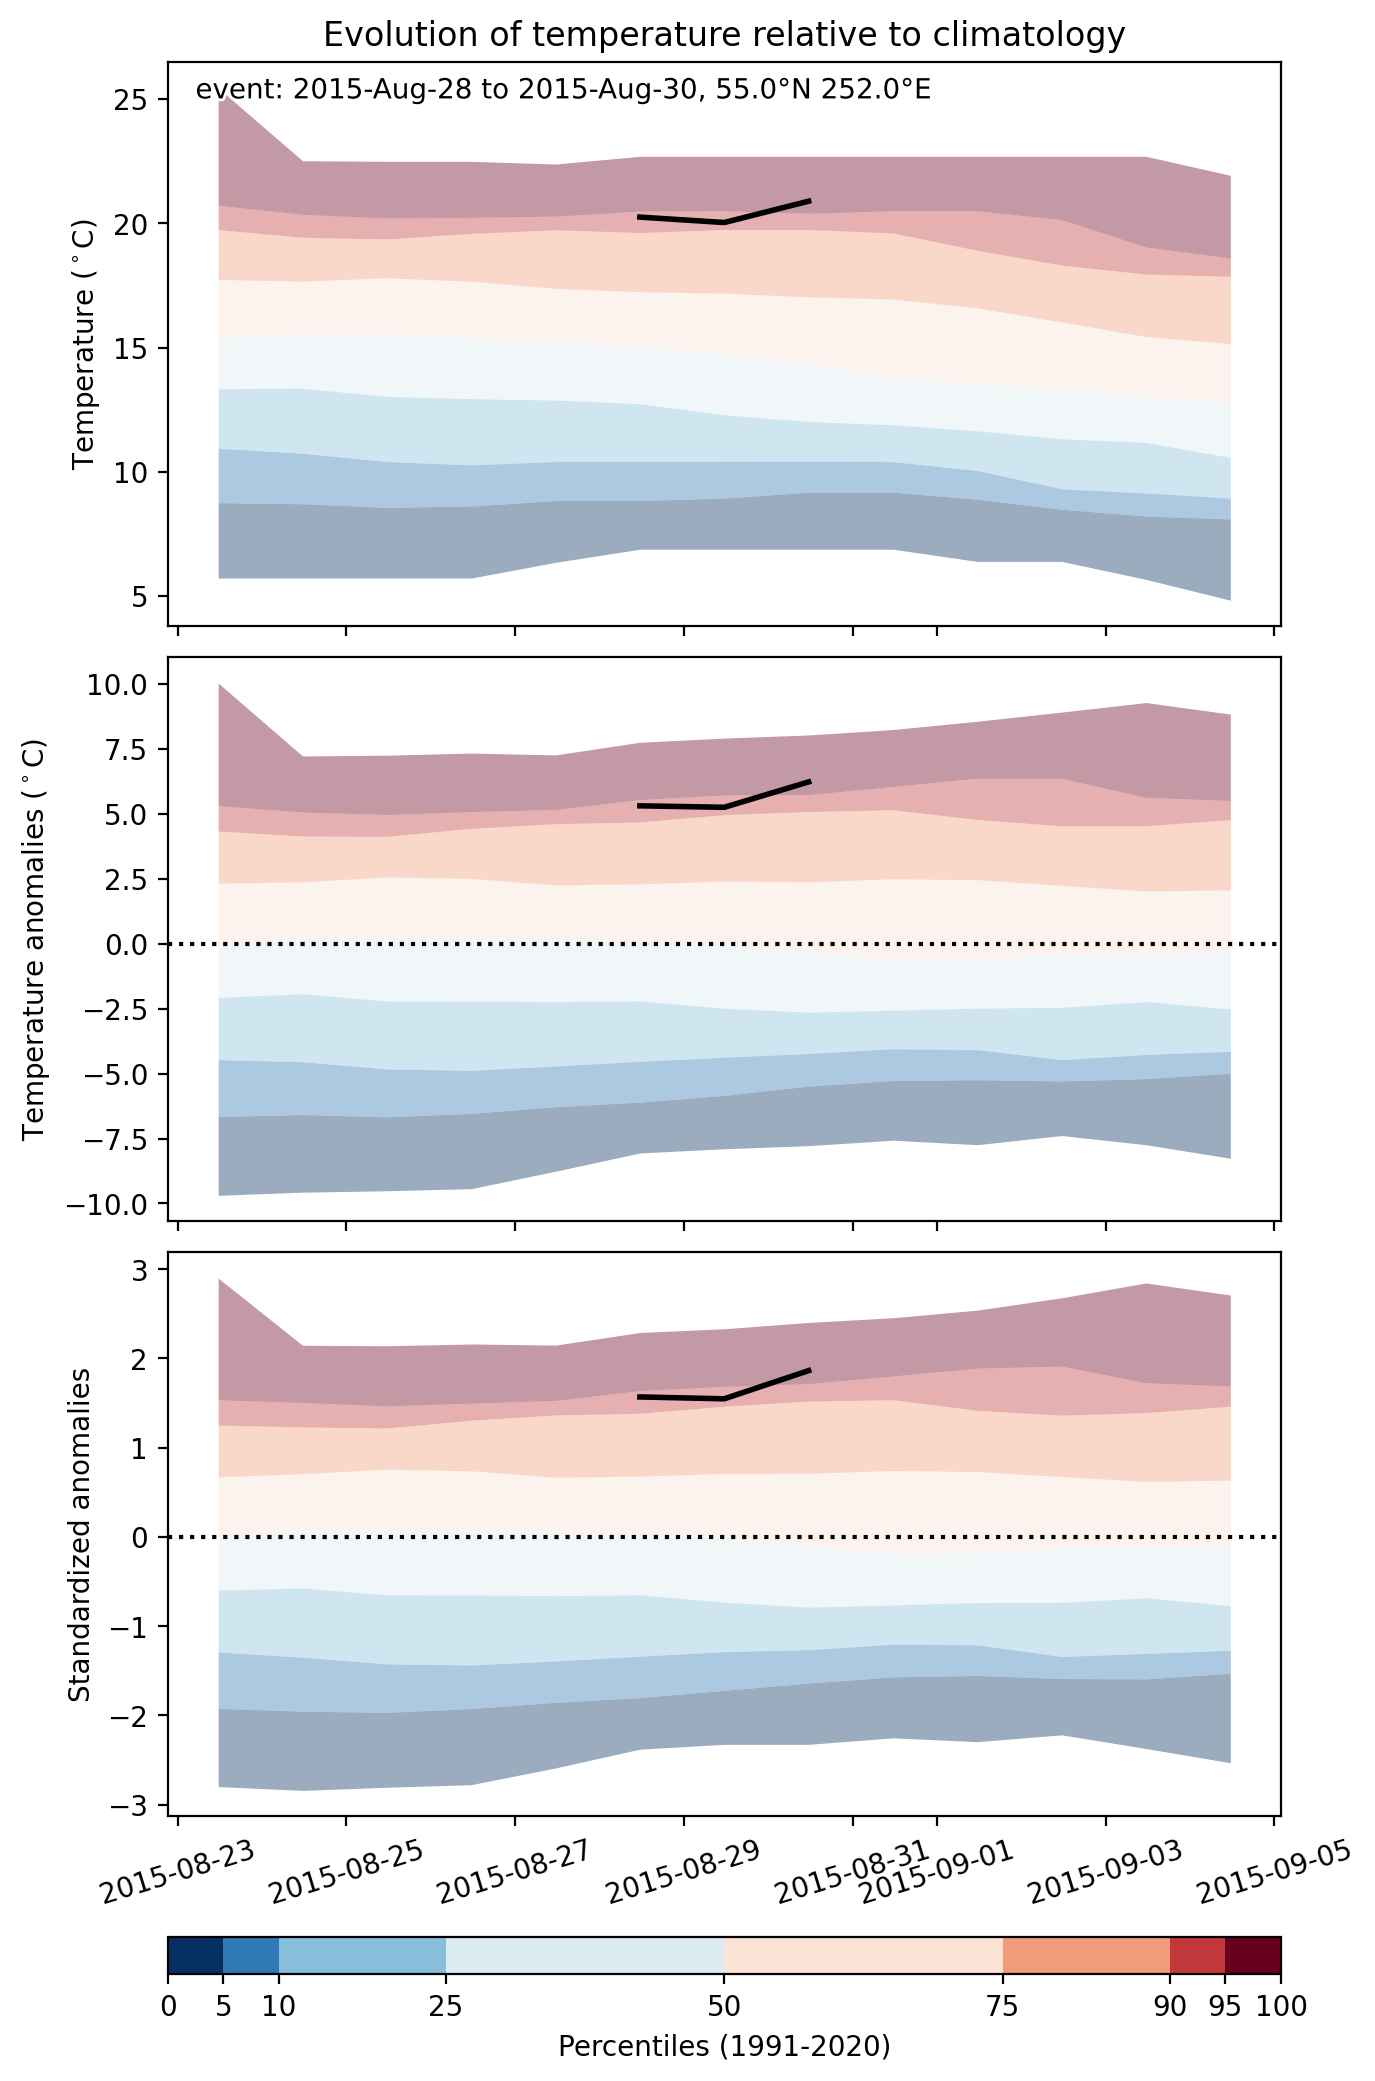
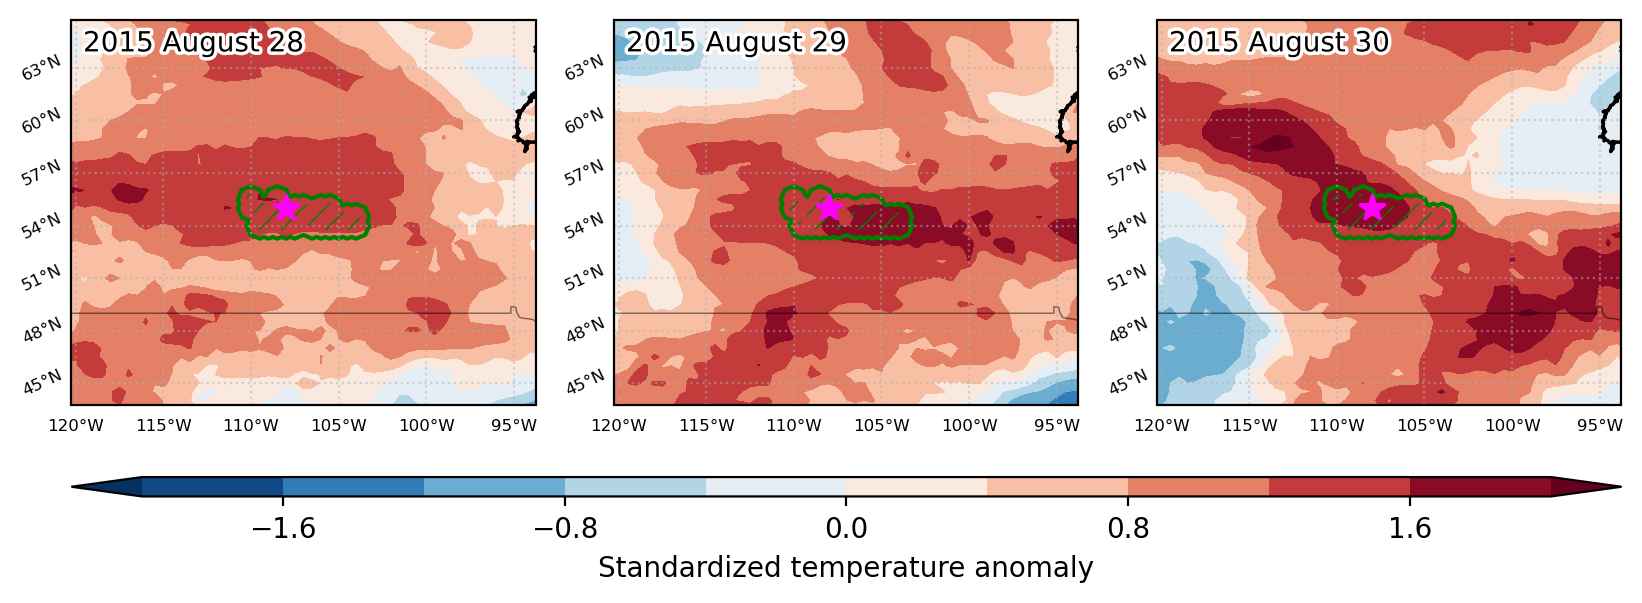
Heat wave occuring from August 28 2015 to August 30 2015 at 55.0°N 252.0°E

Download data: JSON

Event type: Heat wave

Countries affected (identified with ArcGIS Online; provided only for geographical reference):

  • Canada

Duration: 3 days

Time span: August 28 2015 to August 30 2015

Statistics over entire affected area:

  • Mean temperature anomaly: 5.3 °C
  • Mean temperature: 19.7 °C
  • Maximum temperature anomaly: 6.8 °C
  • Maximum temperature: 21.4 °C

Event center: 55.0°N 252.0°E

Area affected: 57394 km$^2$


Fig. 1: Map of most extreme temperature anomalies (standardized) experienced during the event. The purple star indicates the center of the extreme event. Green hatching illustrates all areas under the effect of extremes at some time during the event.


Fig. 2: Evolution of temperature at the center of the event. The climatological percentile distribution is illustrated with color shadings.


Fig. 3: Maps illustrating the evolution of standardized temperature anomalies during the event.

Event ID: Heat_wave_2015-Aug-28_to_2015-Aug-30_252.0_55.0

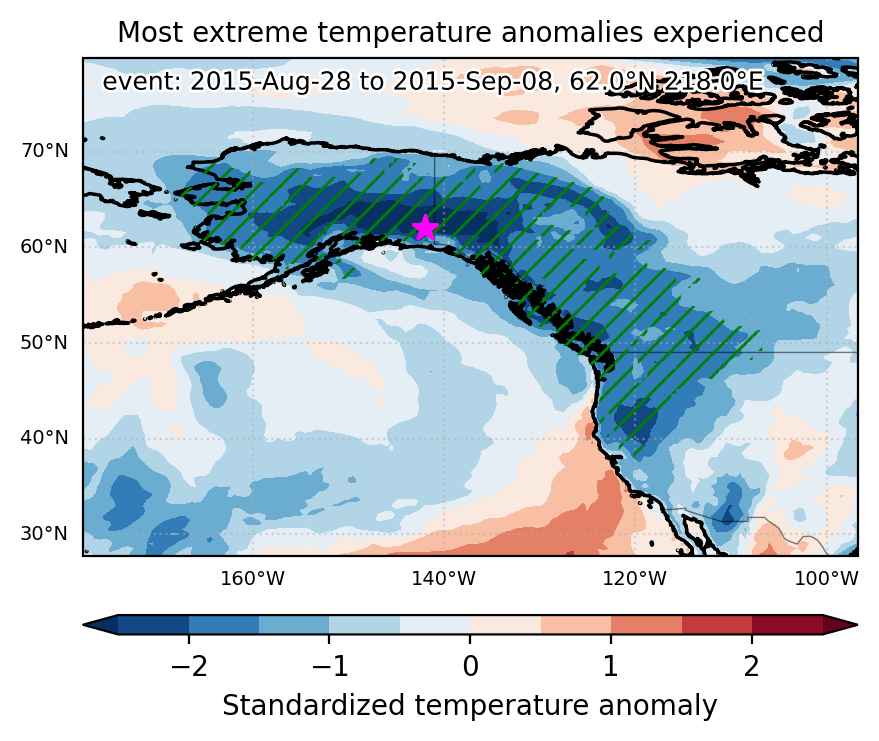
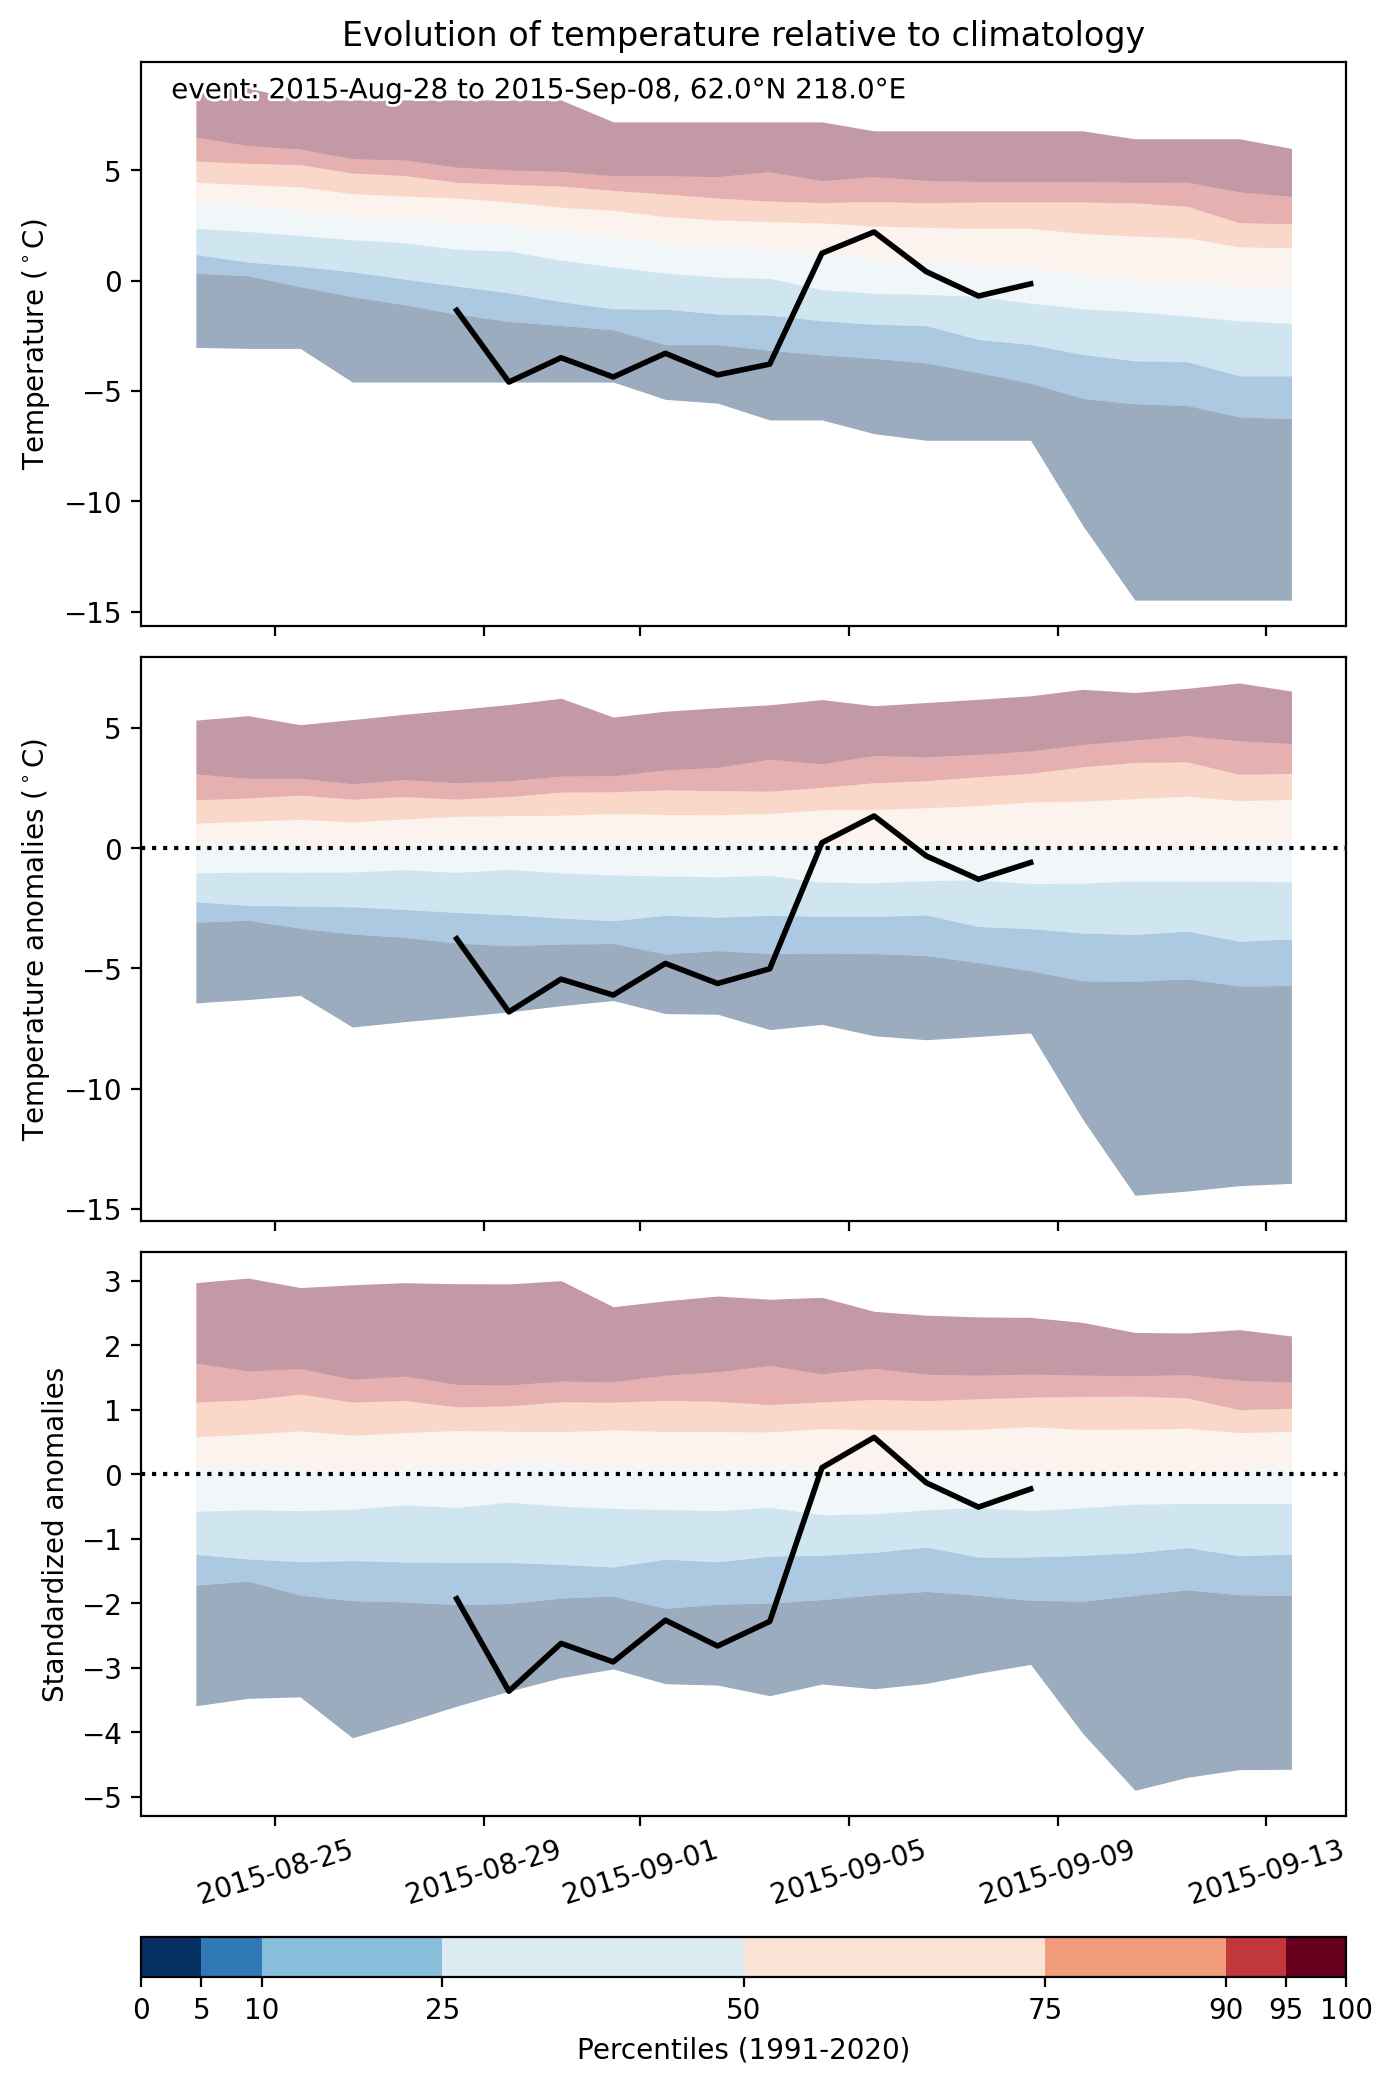
Cold spell occuring from August 28 2015 to September 08 2015 at 62.0°N 218.0°E

Download data: JSON

Event type: Cold spell

Countries affected (identified with ArcGIS Online; provided only for geographical reference):

  • Canada
  • United States

Duration: 12 days

Time span: August 28 2015 to September 08 2015

Statistics over entire affected area:

  • Mean temperature anomaly: -5.0 °C
  • Mean temperature: 4.7 °C
  • Minimum temperature anomaly: -12.9 °C
  • Minimum temperature: -10.5 °C

Event center: 62.0°N 218.0°E

Area affected: 3780367 km$^2$


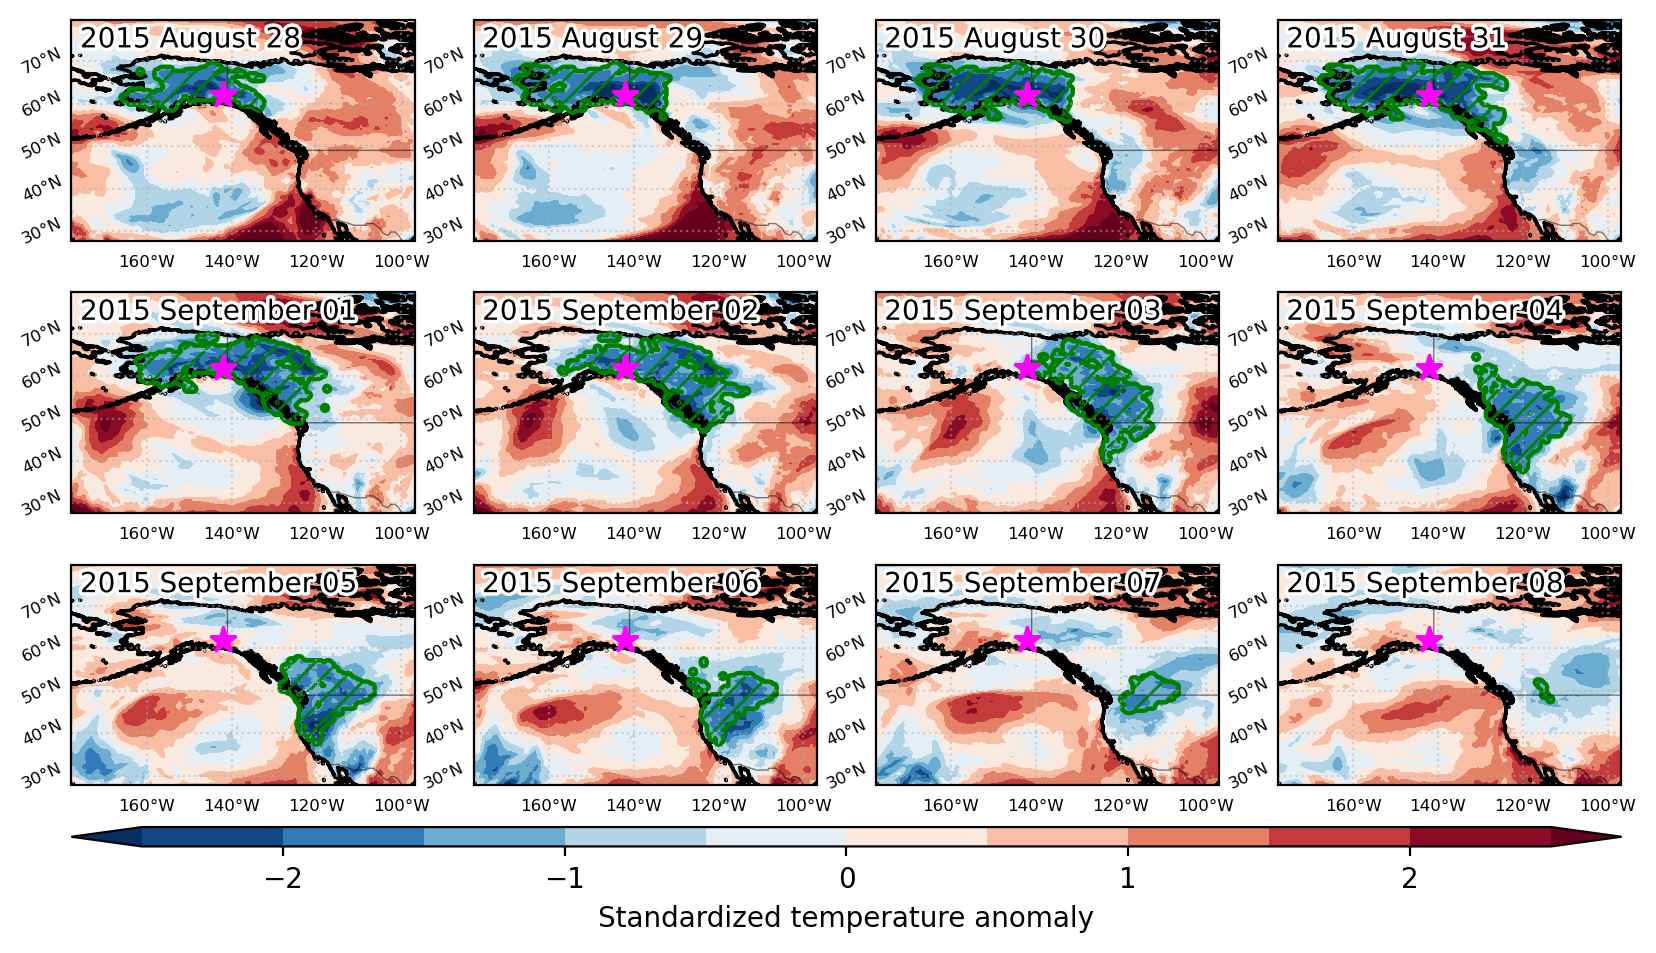
Fig. 1: Map of most extreme temperature anomalies (standardized) experienced during the event. The purple star indicates the center of the extreme event. Green hatching illustrates all areas under the effect of extremes at some time during the event.


Fig. 2: Evolution of temperature at the center of the event. The climatological percentile distribution is illustrated with color shadings.


Fig. 3: Maps illustrating the evolution of standardized temperature anomalies during the event.

Event ID: Cold_spell_2015-Aug-28_to_2015-Sep-08_218.0_62.0

Cold spell occuring from August 28 2015 to September 02 2015 at 34.0°N 66.0°E

Download data: JSON

Event type: Cold spell

Countries affected (identified with ArcGIS Online; provided only for geographical reference):

  • Afghanistan
  • Pakistan

Duration: 6 days

Time span: August 28 2015 to September 02 2015

Statistics over entire affected area:

  • Mean temperature anomaly: -3.3 °C
  • Mean temperature: 17.3 °C
  • Minimum temperature anomaly: -5.4 °C
  • Minimum temperature: 3.3 °C

Event center: 34.0°N 66.0°E

Area affected: 311316 km$^2$


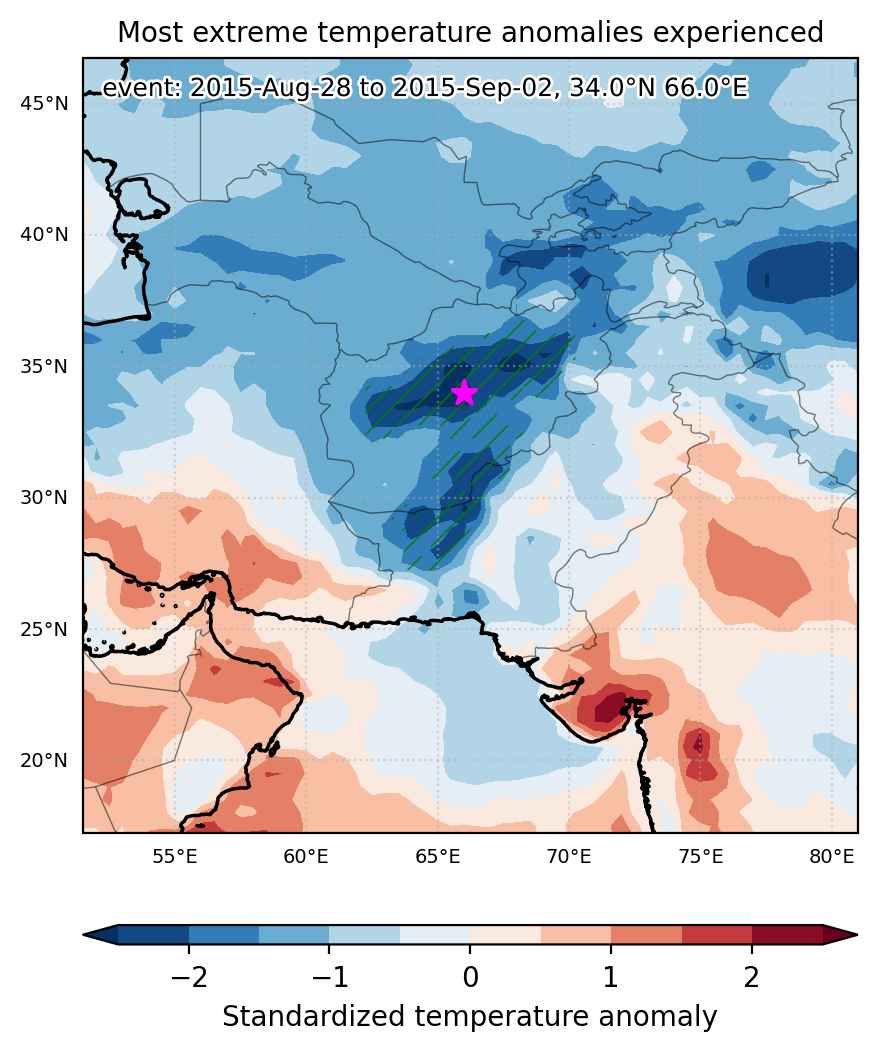
Fig. 1: Map of most extreme temperature anomalies (standardized) experienced during the event. The purple star indicates the center of the extreme event. Green hatching illustrates all areas under the effect of extremes at some time during the event.


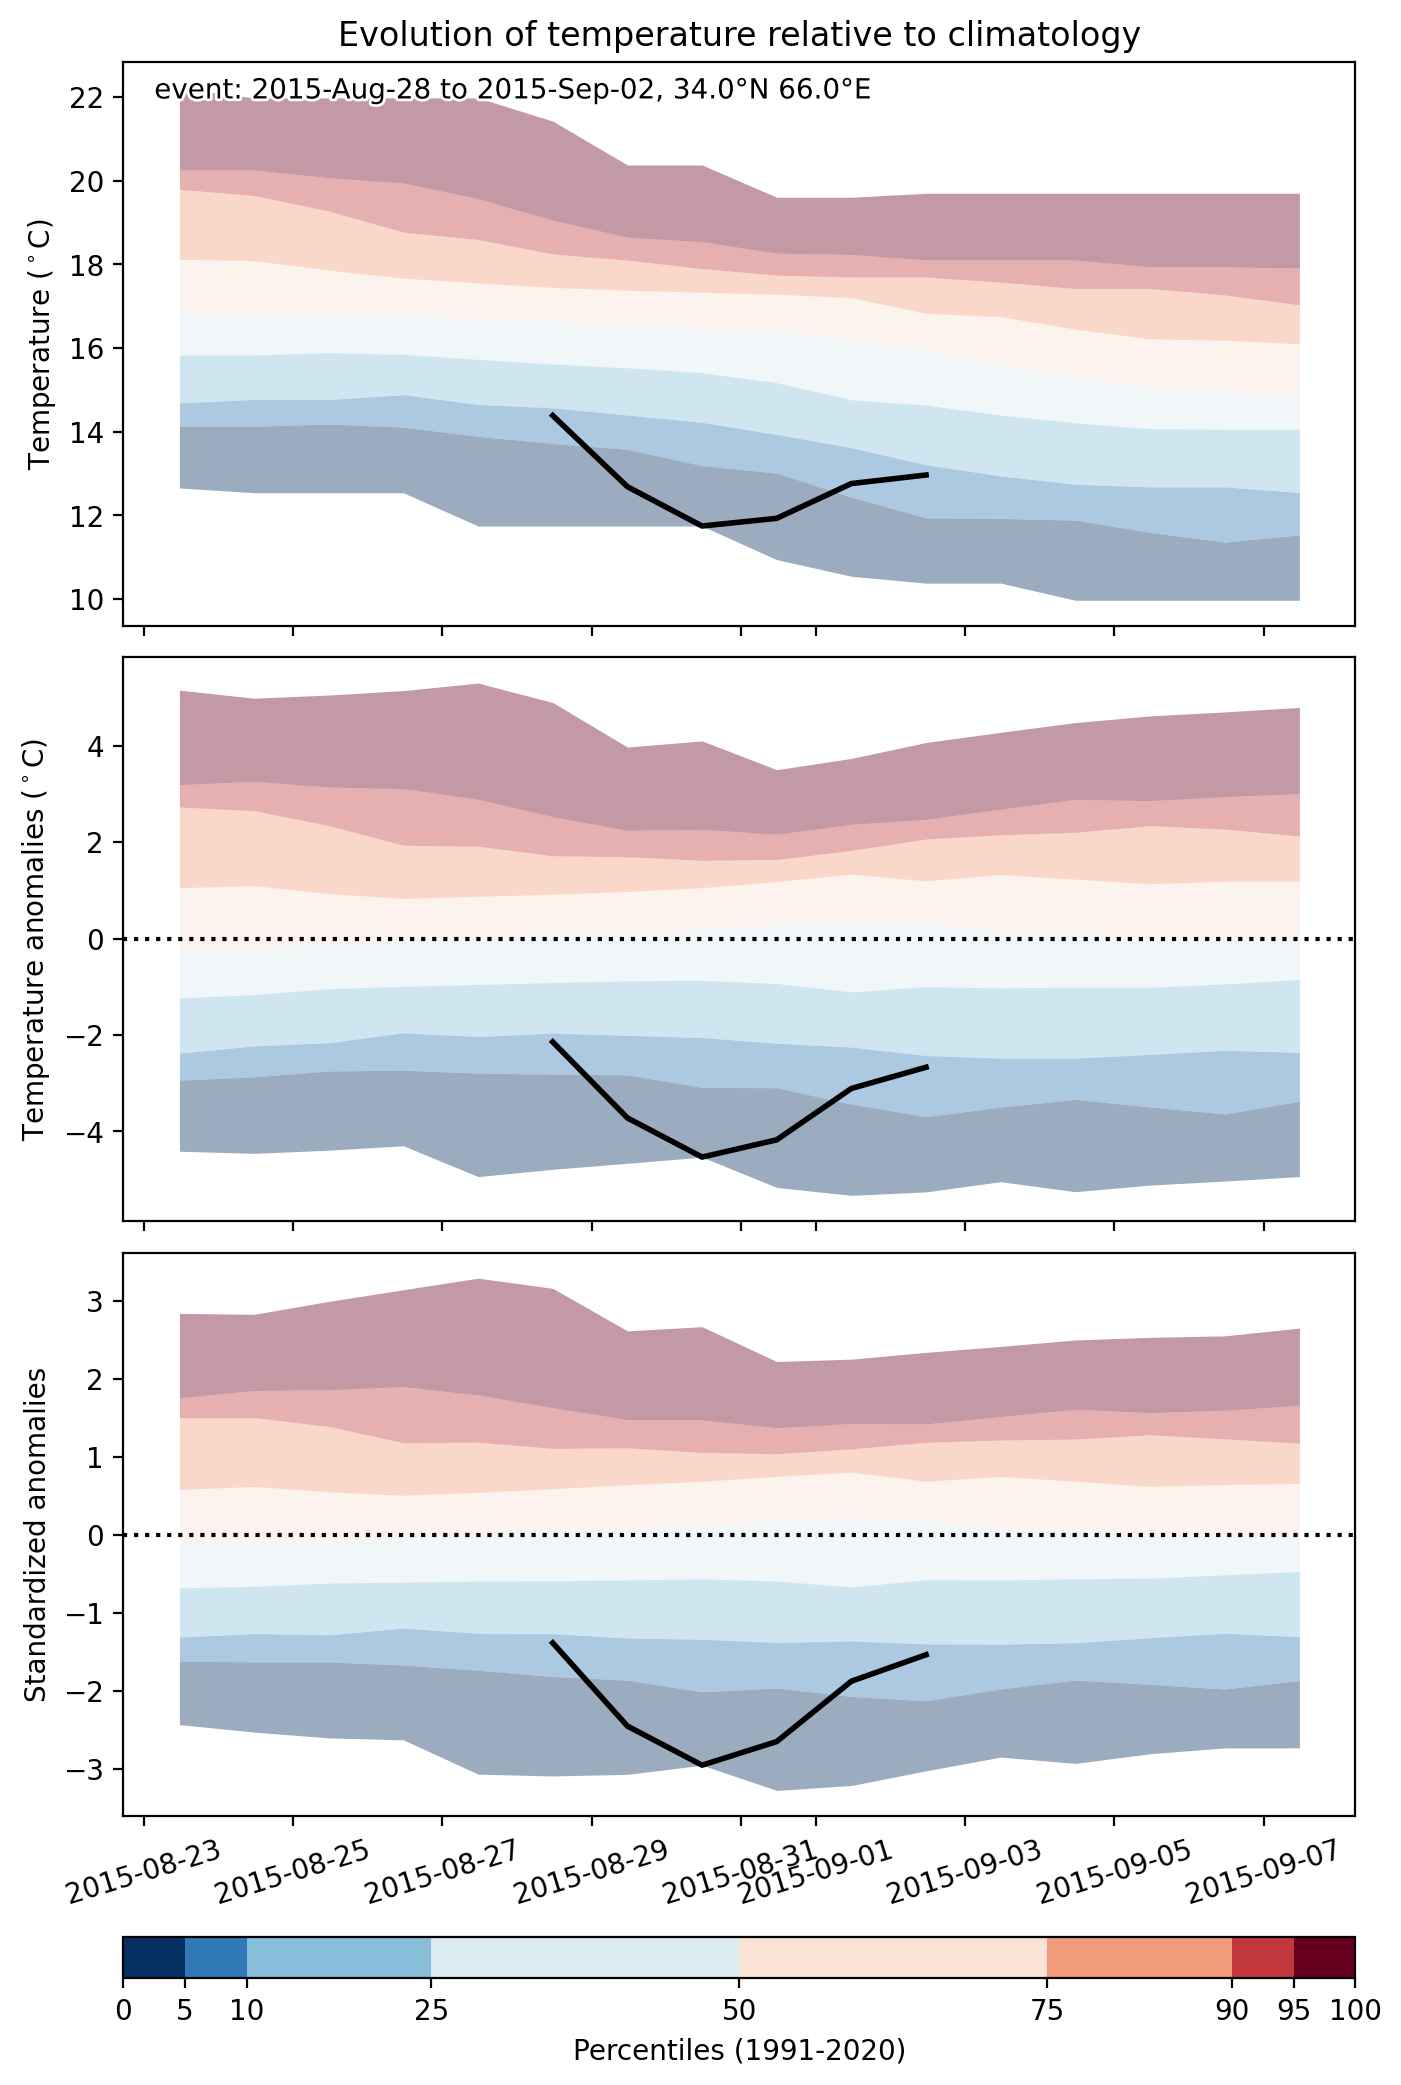
Fig. 2: Evolution of temperature at the center of the event. The climatological percentile distribution is illustrated with color shadings.


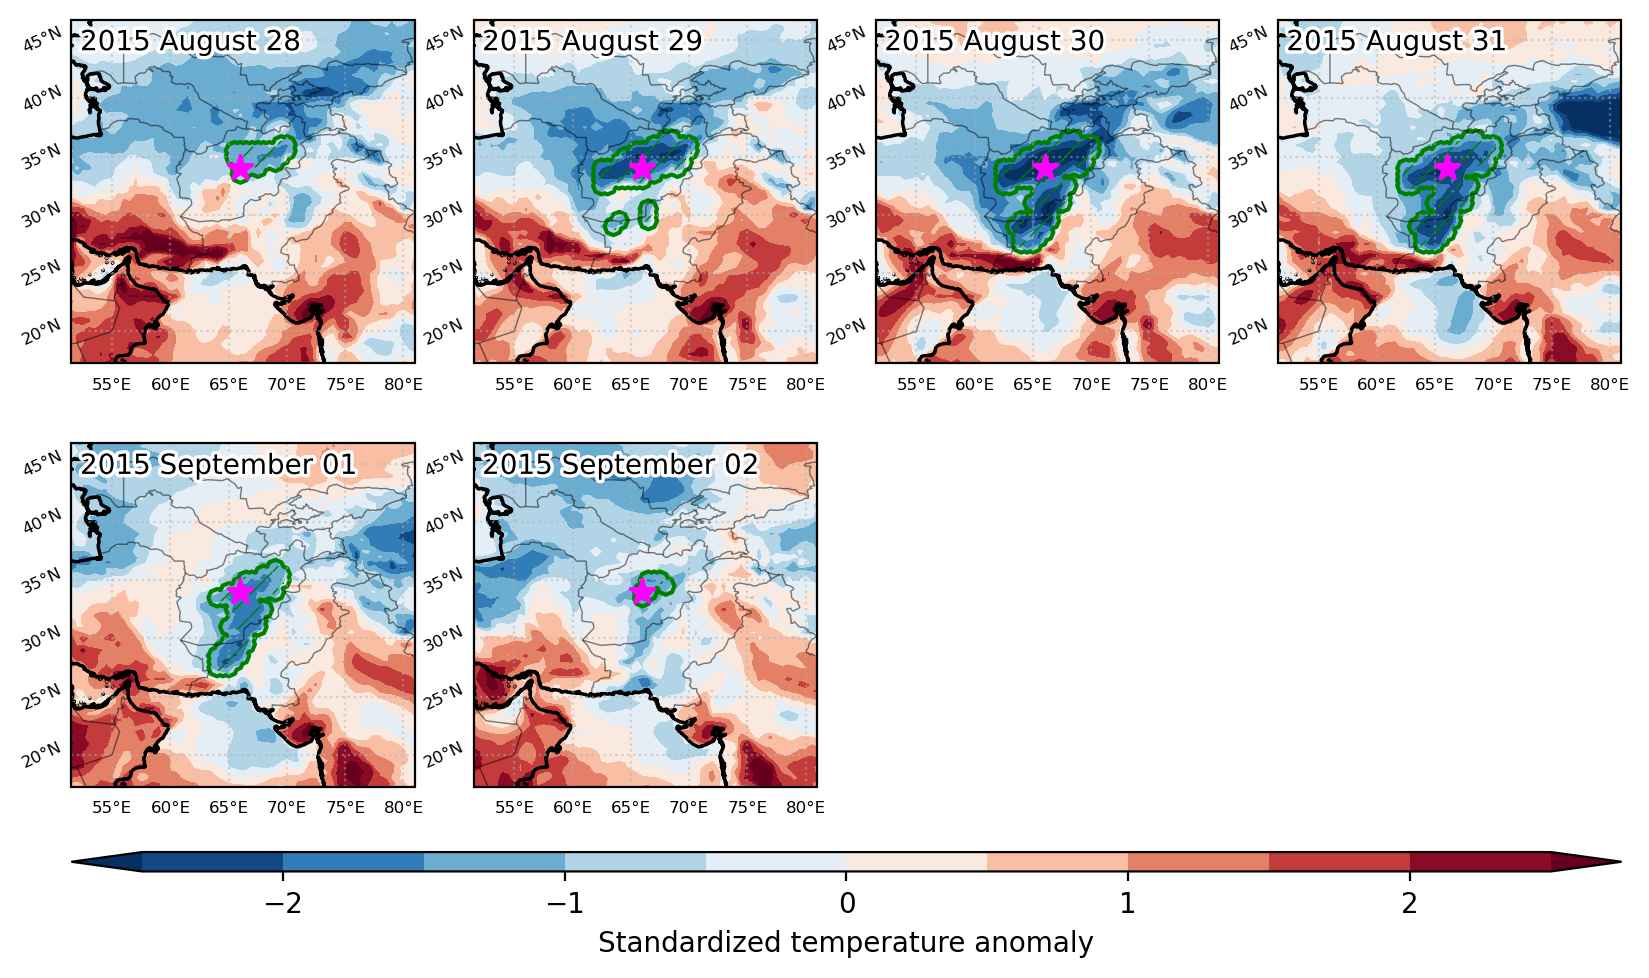
Fig. 3: Maps illustrating the evolution of standardized temperature anomalies during the event.

Event ID: Cold_spell_2015-Aug-28_to_2015-Sep-02_66.0_34.0

Cold spell occuring from August 28 2015 to September 02 2015 at 28.0°N 95.5°E

Download data: JSON

Event type: Cold spell

Countries affected (identified with ArcGIS Online; provided only for geographical reference):

  • China
  • India
  • Myanmar

Duration: 6 days

Time span: August 28 2015 to September 02 2015

Statistics over entire affected area:

  • Mean temperature anomaly: -2.3 °C
  • Mean temperature: 20.8 °C
  • Minimum temperature anomaly: -3.8 °C
  • Minimum temperature: 10.6 °C

Event center: 28.0°N 95.5°E

Area affected: 85420 km$^2$


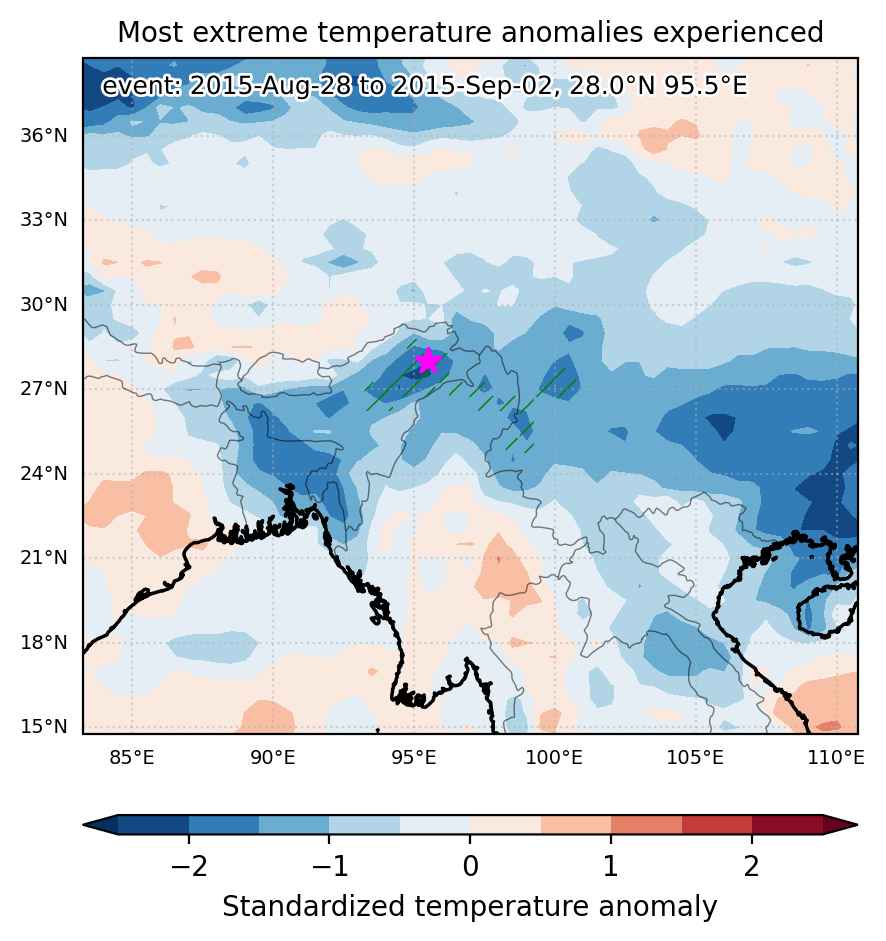
Fig. 1: Map of most extreme temperature anomalies (standardized) experienced during the event. The purple star indicates the center of the extreme event. Green hatching illustrates all areas under the effect of extremes at some time during the event.


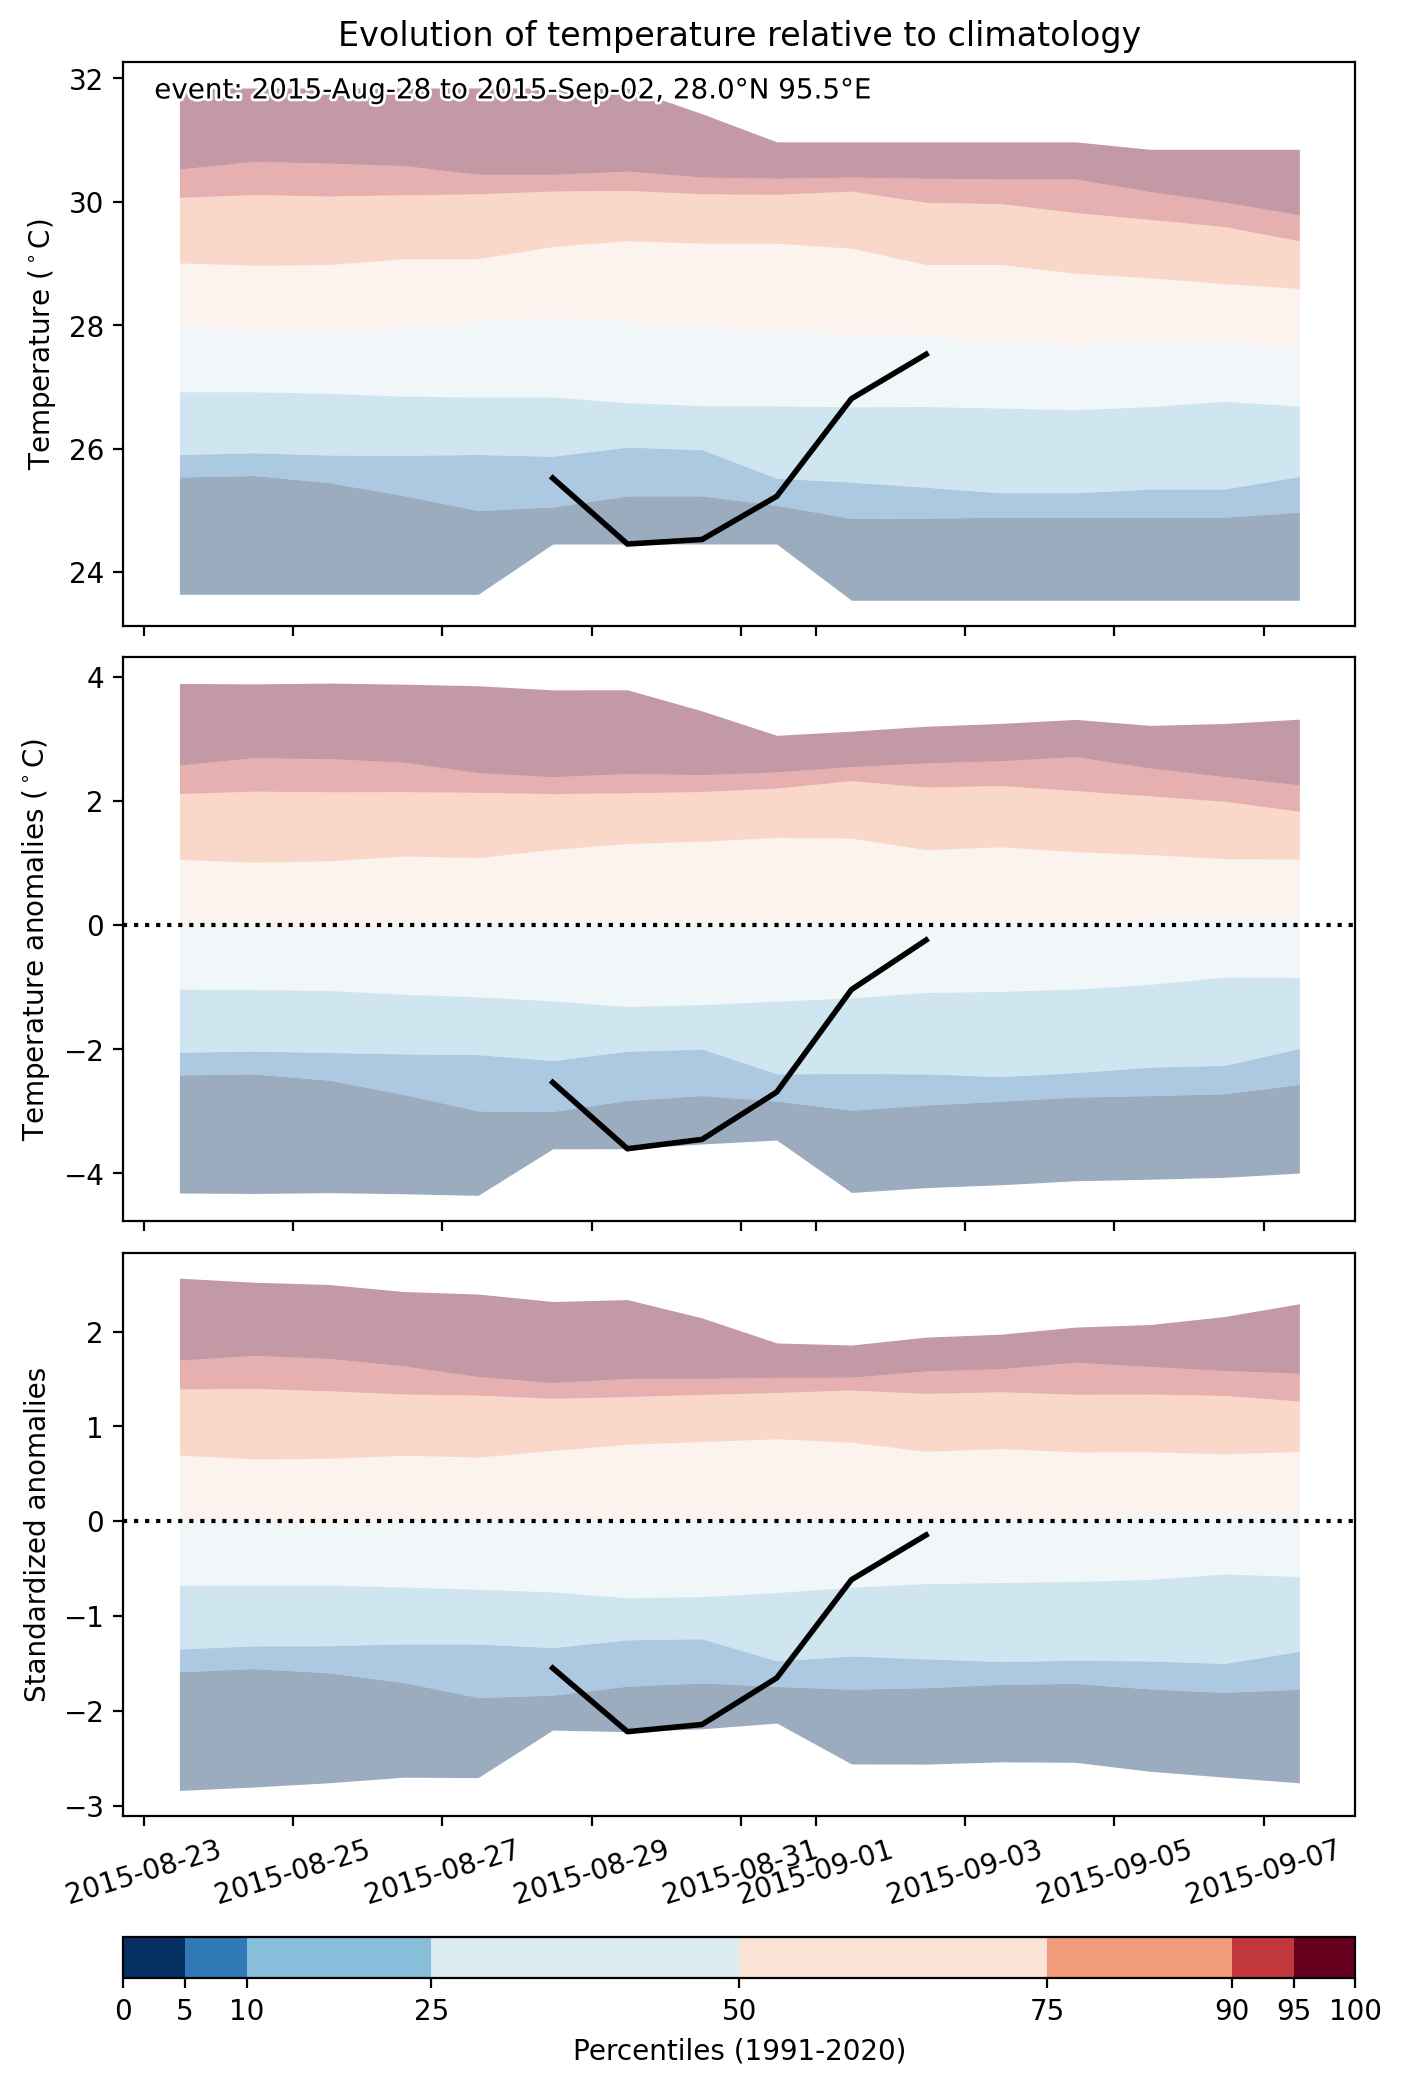
Fig. 2: Evolution of temperature at the center of the event. The climatological percentile distribution is illustrated with color shadings.


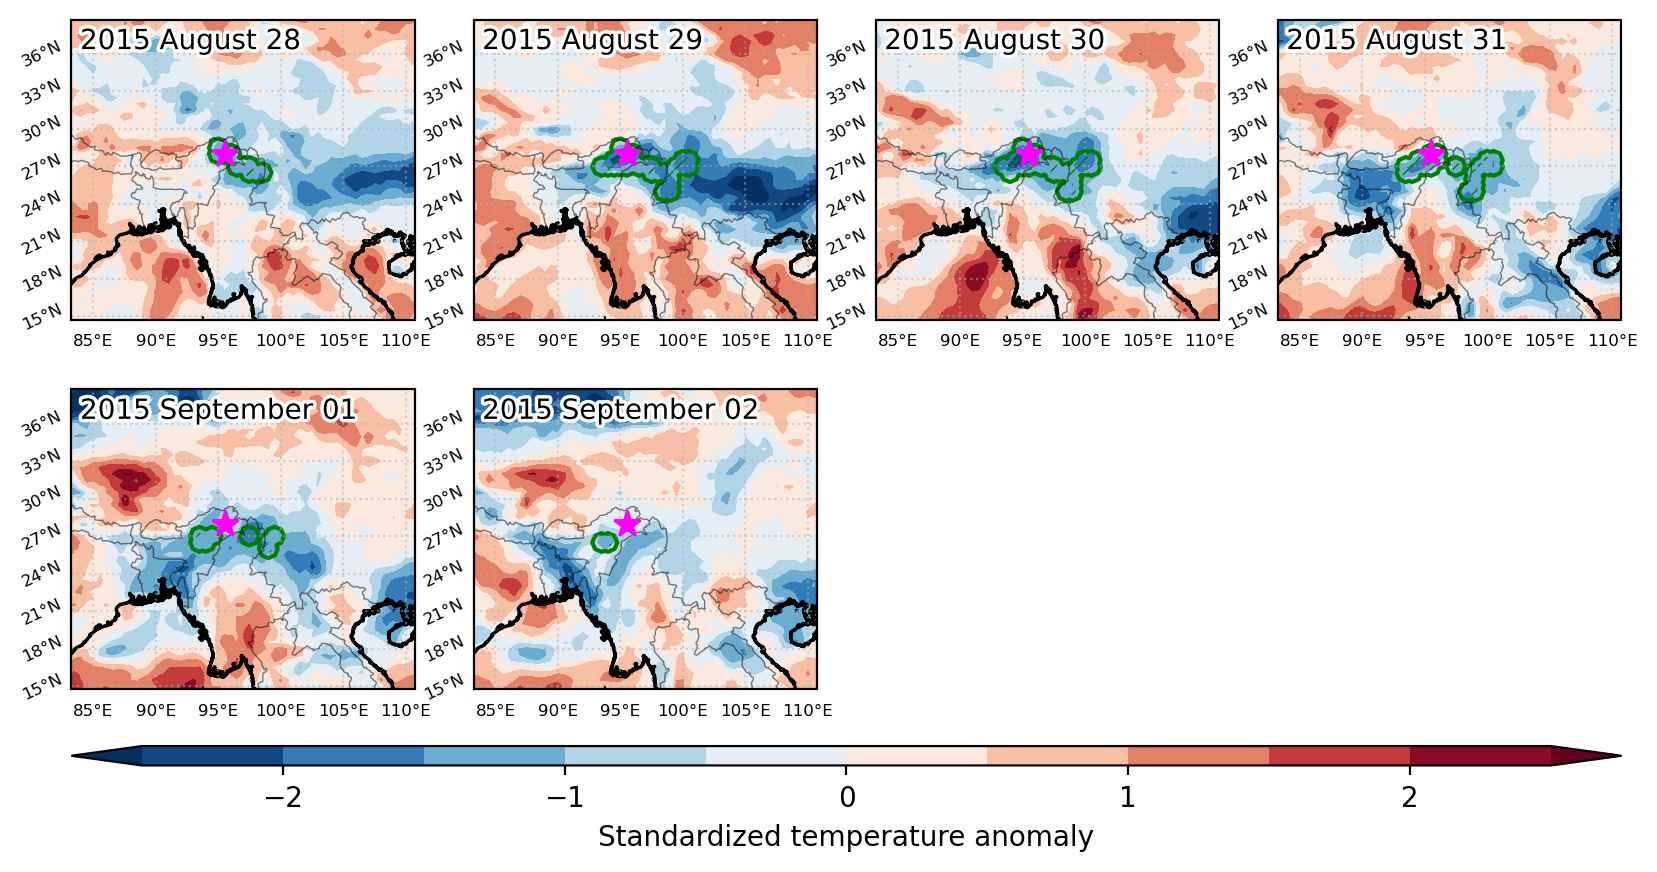
Fig. 3: Maps illustrating the evolution of standardized temperature anomalies during the event.

Event ID: Cold_spell_2015-Aug-28_to_2015-Sep-02_95.5_28.0

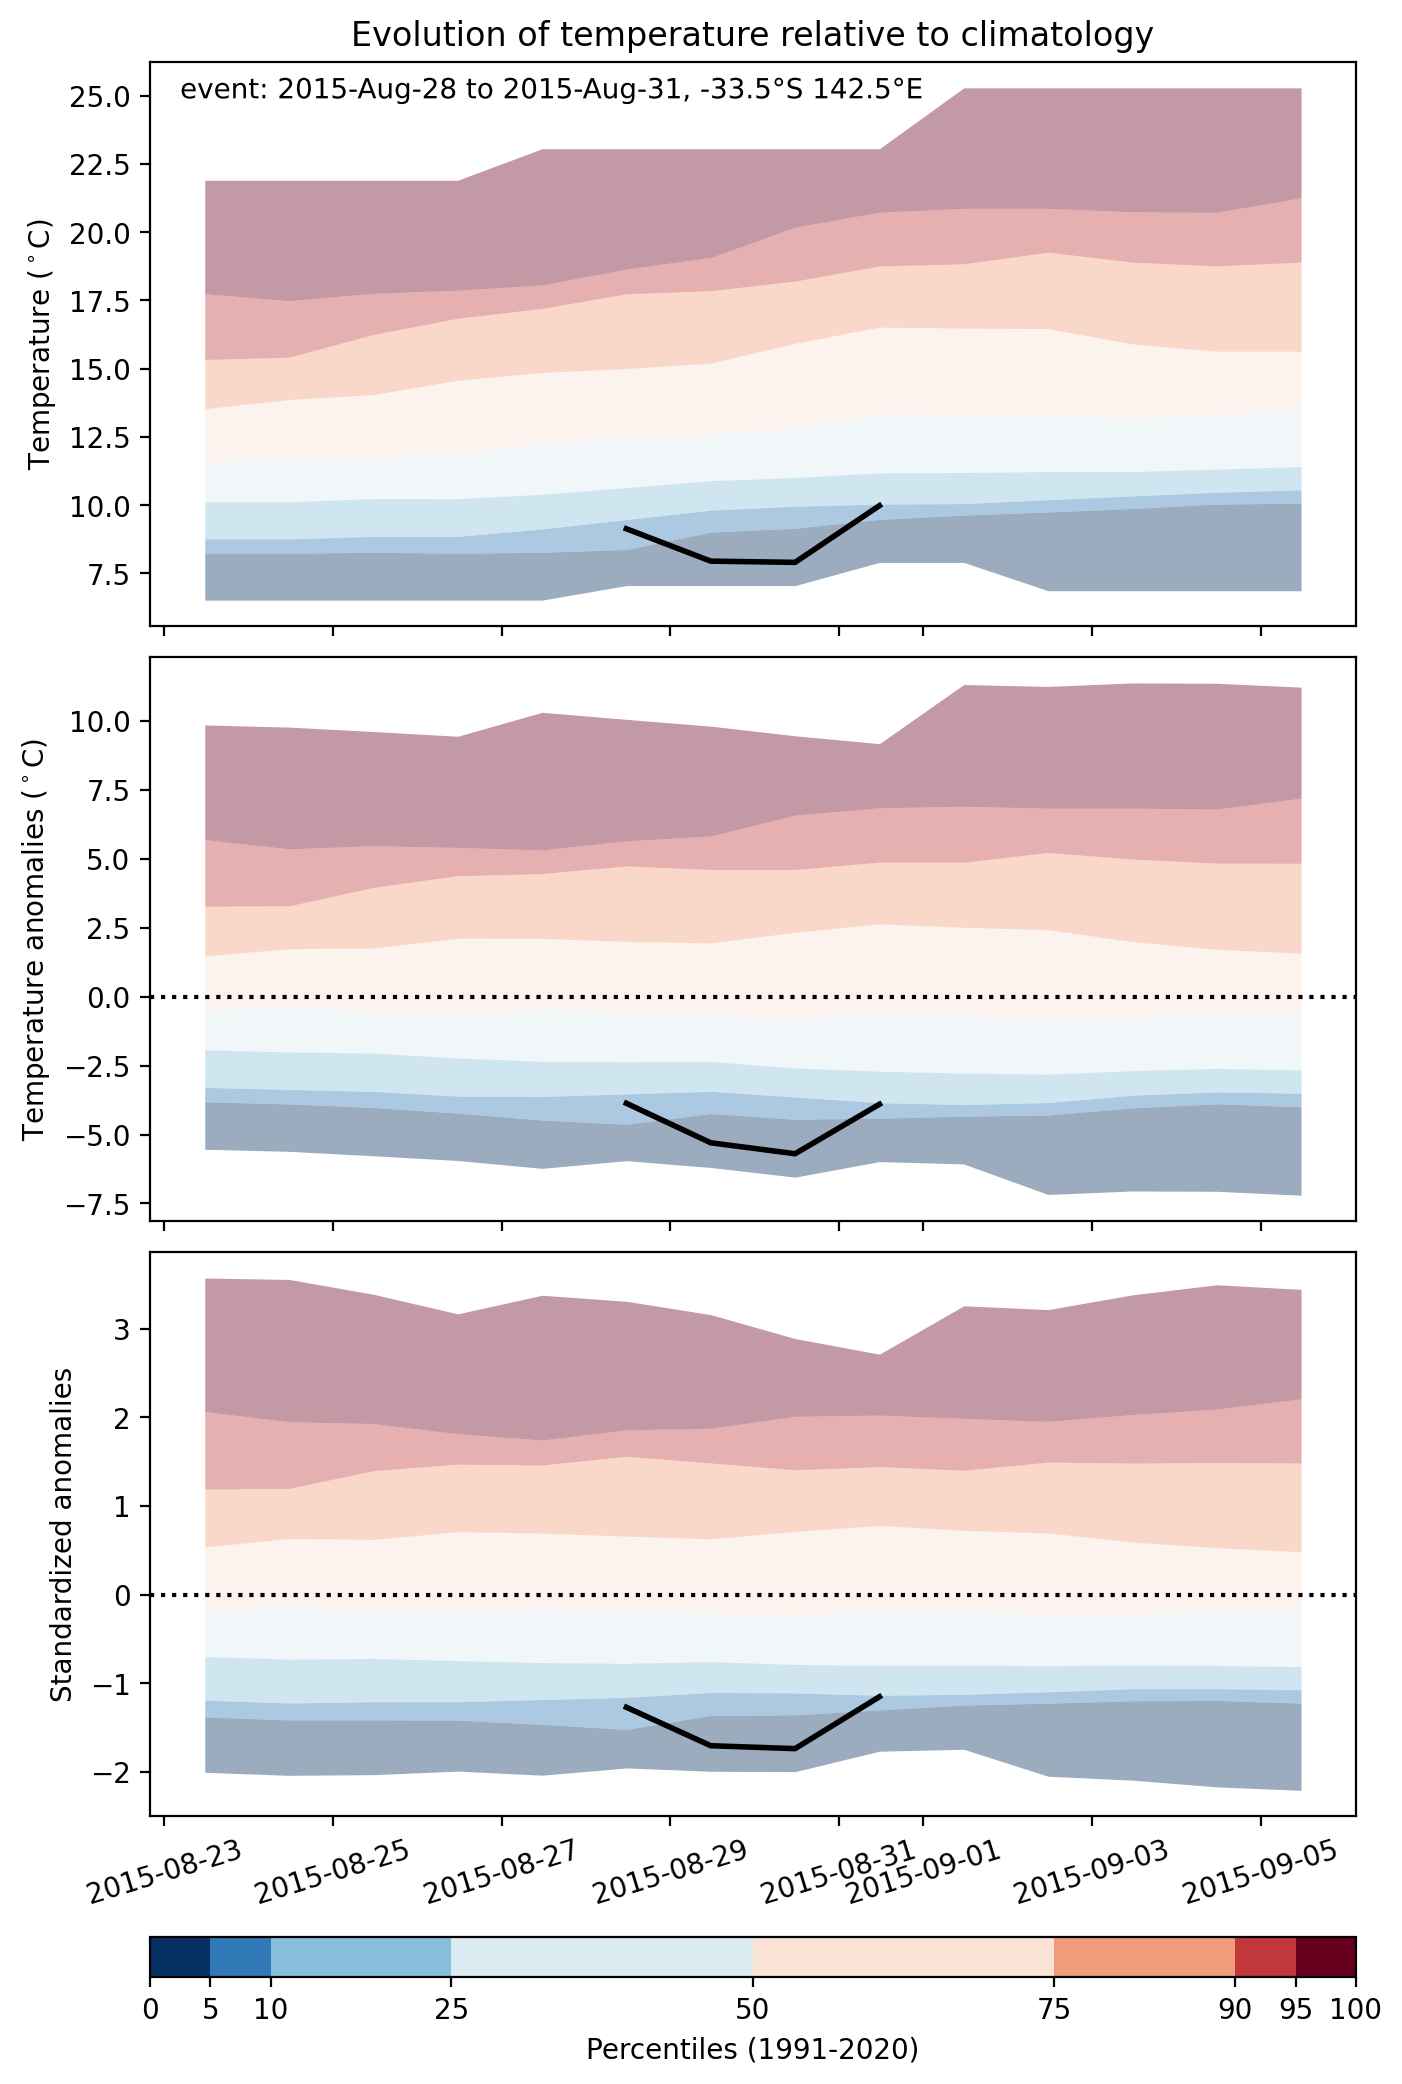
Cold spell occuring from August 28 2015 to August 31 2015 at -33.5°S 142.5°E

Download data: JSON

Event type: Cold spell

Countries affected (identified with ArcGIS Online; provided only for geographical reference):

  • Australia

Duration: 4 days

Time span: August 28 2015 to August 31 2015

Statistics over entire affected area:

  • Mean temperature anomaly: -4.3 °C
  • Mean temperature: 7.6 °C
  • Minimum temperature anomaly: -5.9 °C
  • Minimum temperature: 4.7 °C

Event center: -33.5°S 142.5°E

Area affected: 120177 km$^2$


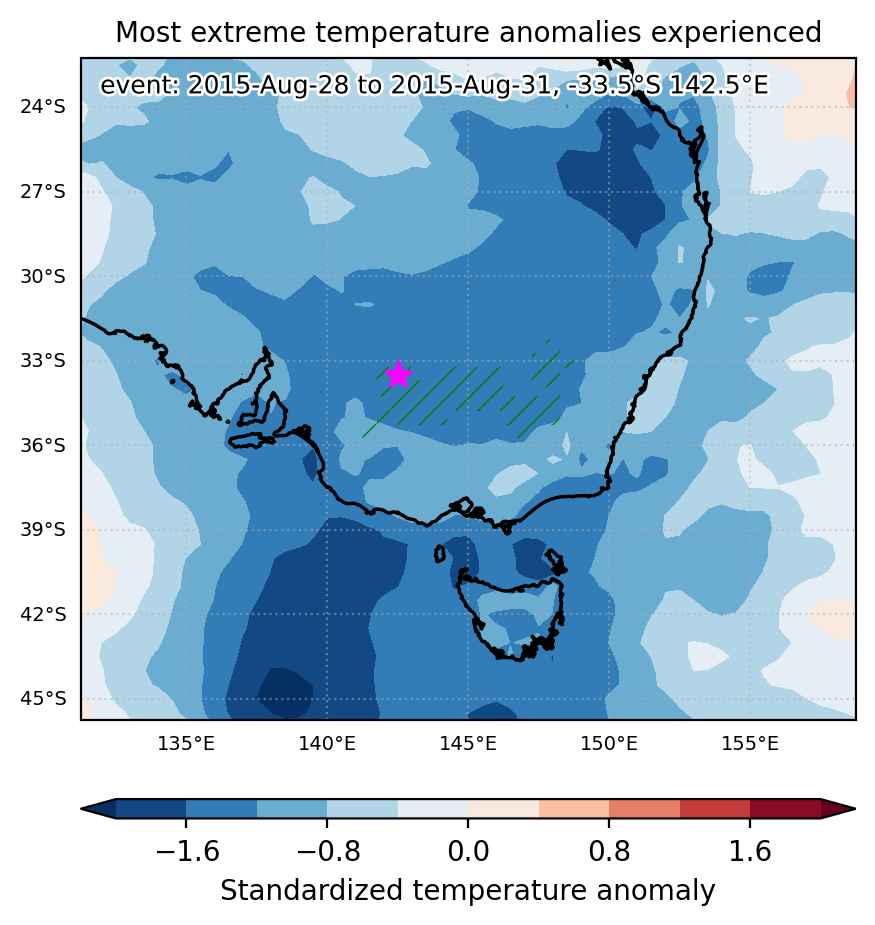
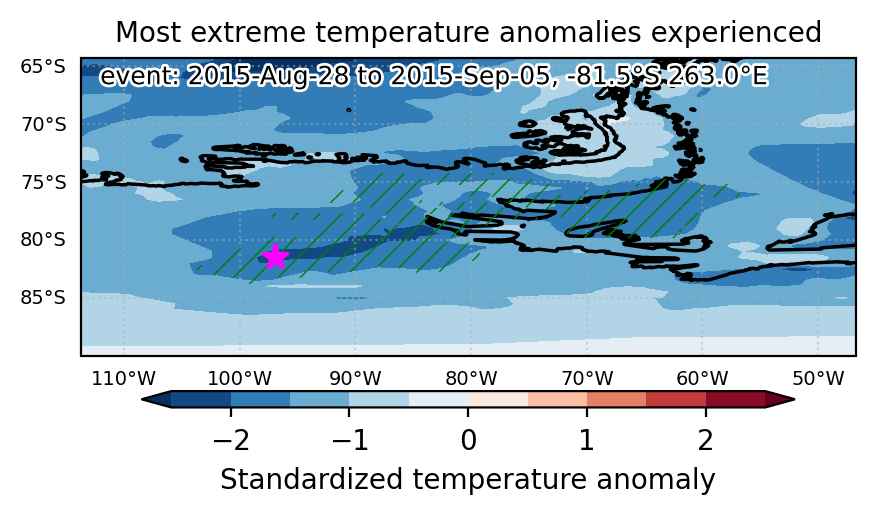
Fig. 1: Map of most extreme temperature anomalies (standardized) experienced during the event. The purple star indicates the center of the extreme event. Green hatching illustrates all areas under the effect of extremes at some time during the event.


Fig. 2: Evolution of temperature at the center of the event. The climatological percentile distribution is illustrated with color shadings.


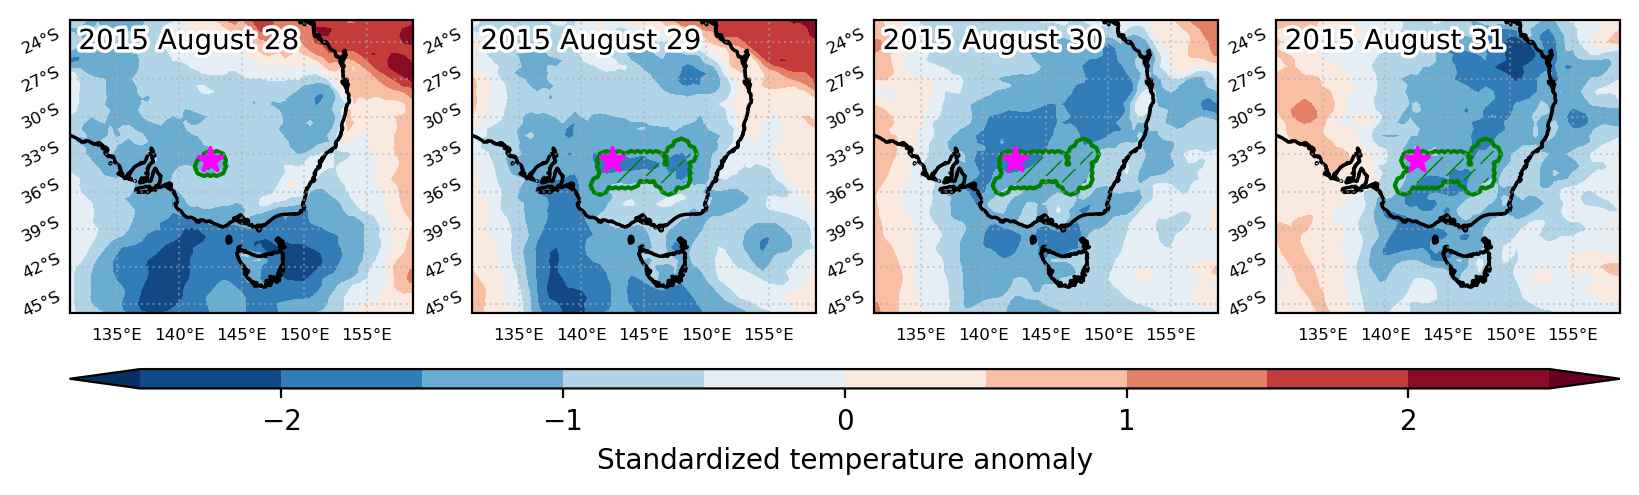
Fig. 3: Maps illustrating the evolution of standardized temperature anomalies during the event.

Event ID: Cold_spell_2015-Aug-28_to_2015-Aug-31_142.5_-33.5

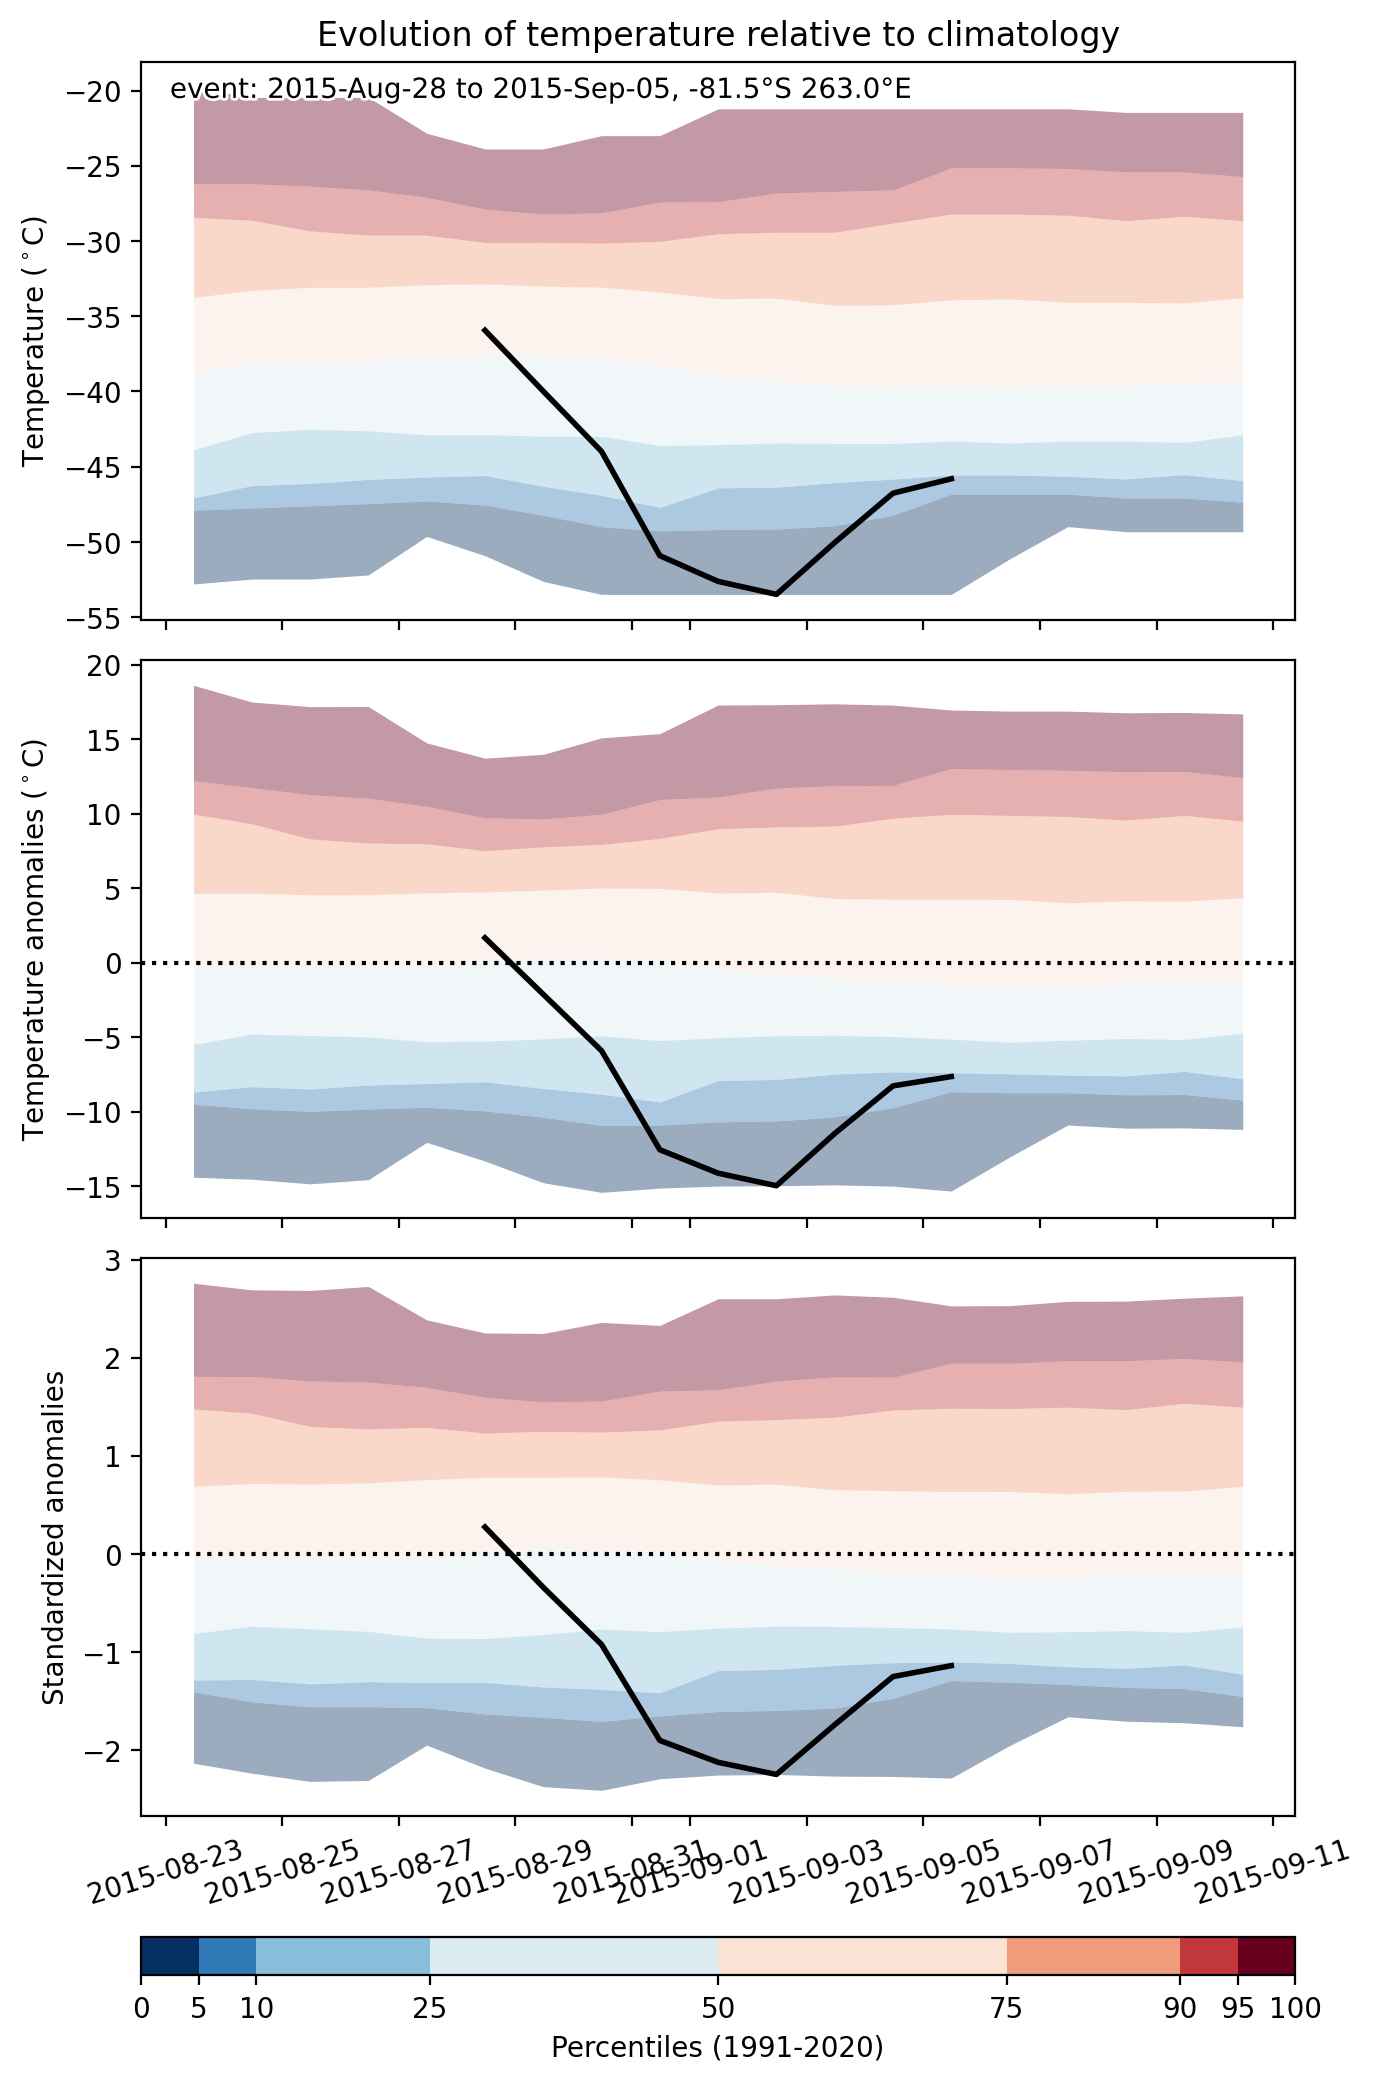
Cold spell occuring from August 28 2015 to September 05 2015 at -81.5°S 263.0°E

Download data: JSON

Event type: Cold spell

Countries affected (identified with ArcGIS Online; provided only for geographical reference):

  • Antarctica

Duration: 9 days

Time span: August 28 2015 to September 05 2015

Statistics over entire affected area:

  • Mean temperature anomaly: -10.8 °C
  • Mean temperature: -45.8 °C
  • Minimum temperature anomaly: -17.2 °C
  • Minimum temperature: -55.0 °C

Event center: -81.5°S 263.0°E

Area affected: 464045 km$^2$


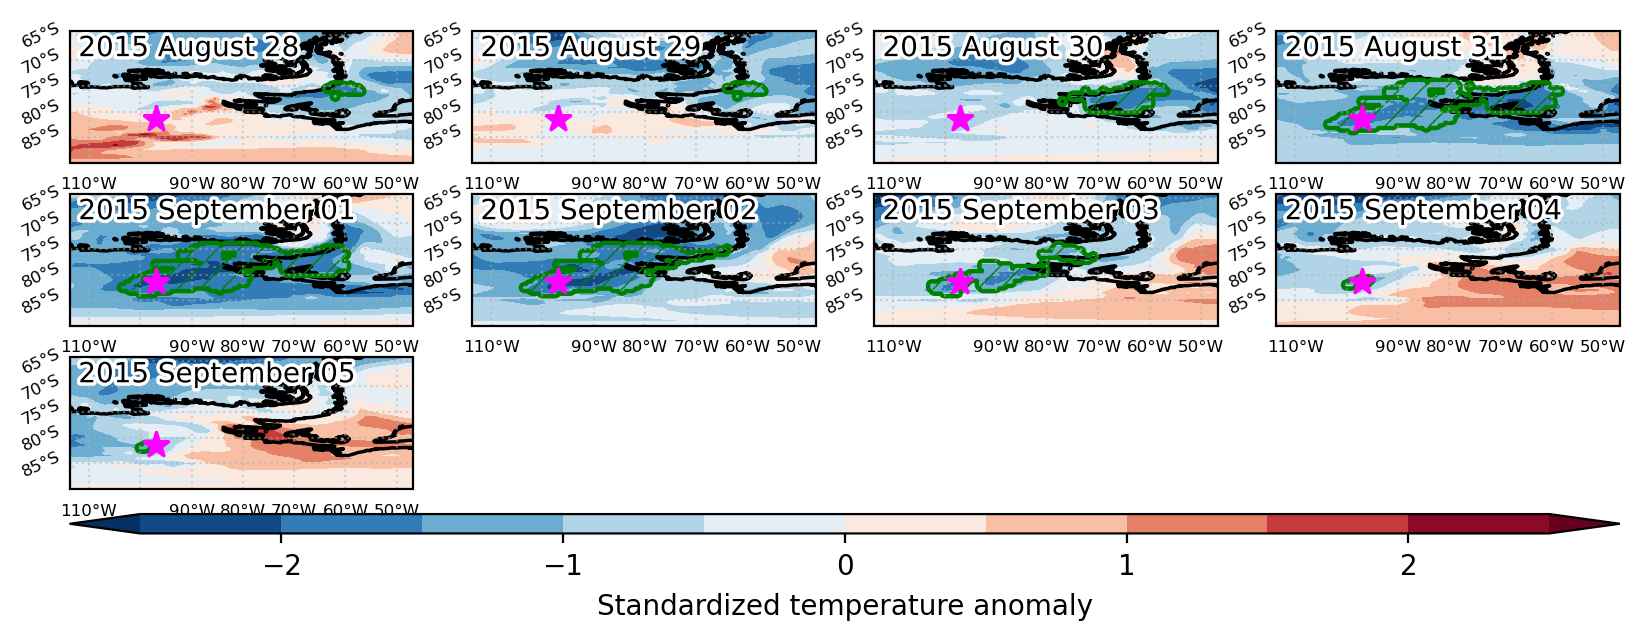
Fig. 1: Map of most extreme temperature anomalies (standardized) experienced during the event. The purple star indicates the center of the extreme event. Green hatching illustrates all areas under the effect of extremes at some time during the event.


Fig. 2: Evolution of temperature at the center of the event. The climatological percentile distribution is illustrated with color shadings.


Fig. 3: Maps illustrating the evolution of standardized temperature anomalies during the event.

Event ID: Cold_spell_2015-Aug-28_to_2015-Sep-05_263.0_-81.5

Heat wave occuring from August 27 2015 to September 07 2015 at -64.0°S 114.0°E

Download data: JSON

Event type: Heat wave

Countries affected (identified with ArcGIS Online; provided only for geographical reference):

  • Antarctica

Duration: 12 days

Time span: August 27 2015 to September 07 2015

Statistics over entire affected area:

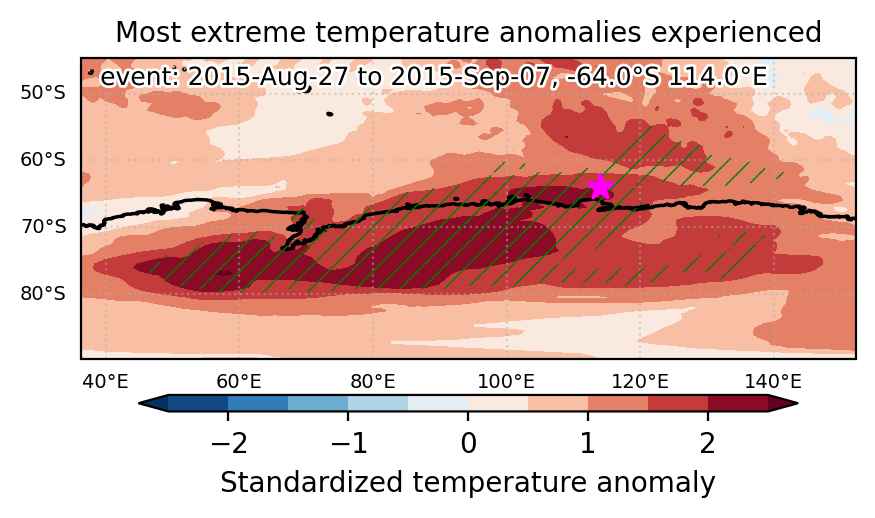
  • Mean temperature anomaly: 9.8 °C
  • Mean temperature: -26.8 °C
  • Maximum temperature anomaly: 18.0 °C
  • Maximum temperature: 3.6 °C

Event center: -64.0°S 114.0°E

Area affected: 4267502 km$^2$


Fig. 1: Map of most extreme temperature anomalies (standardized) experienced during the event. The purple star indicates the center of the extreme event. Green hatching illustrates all areas under the effect of extremes at some time during the event.


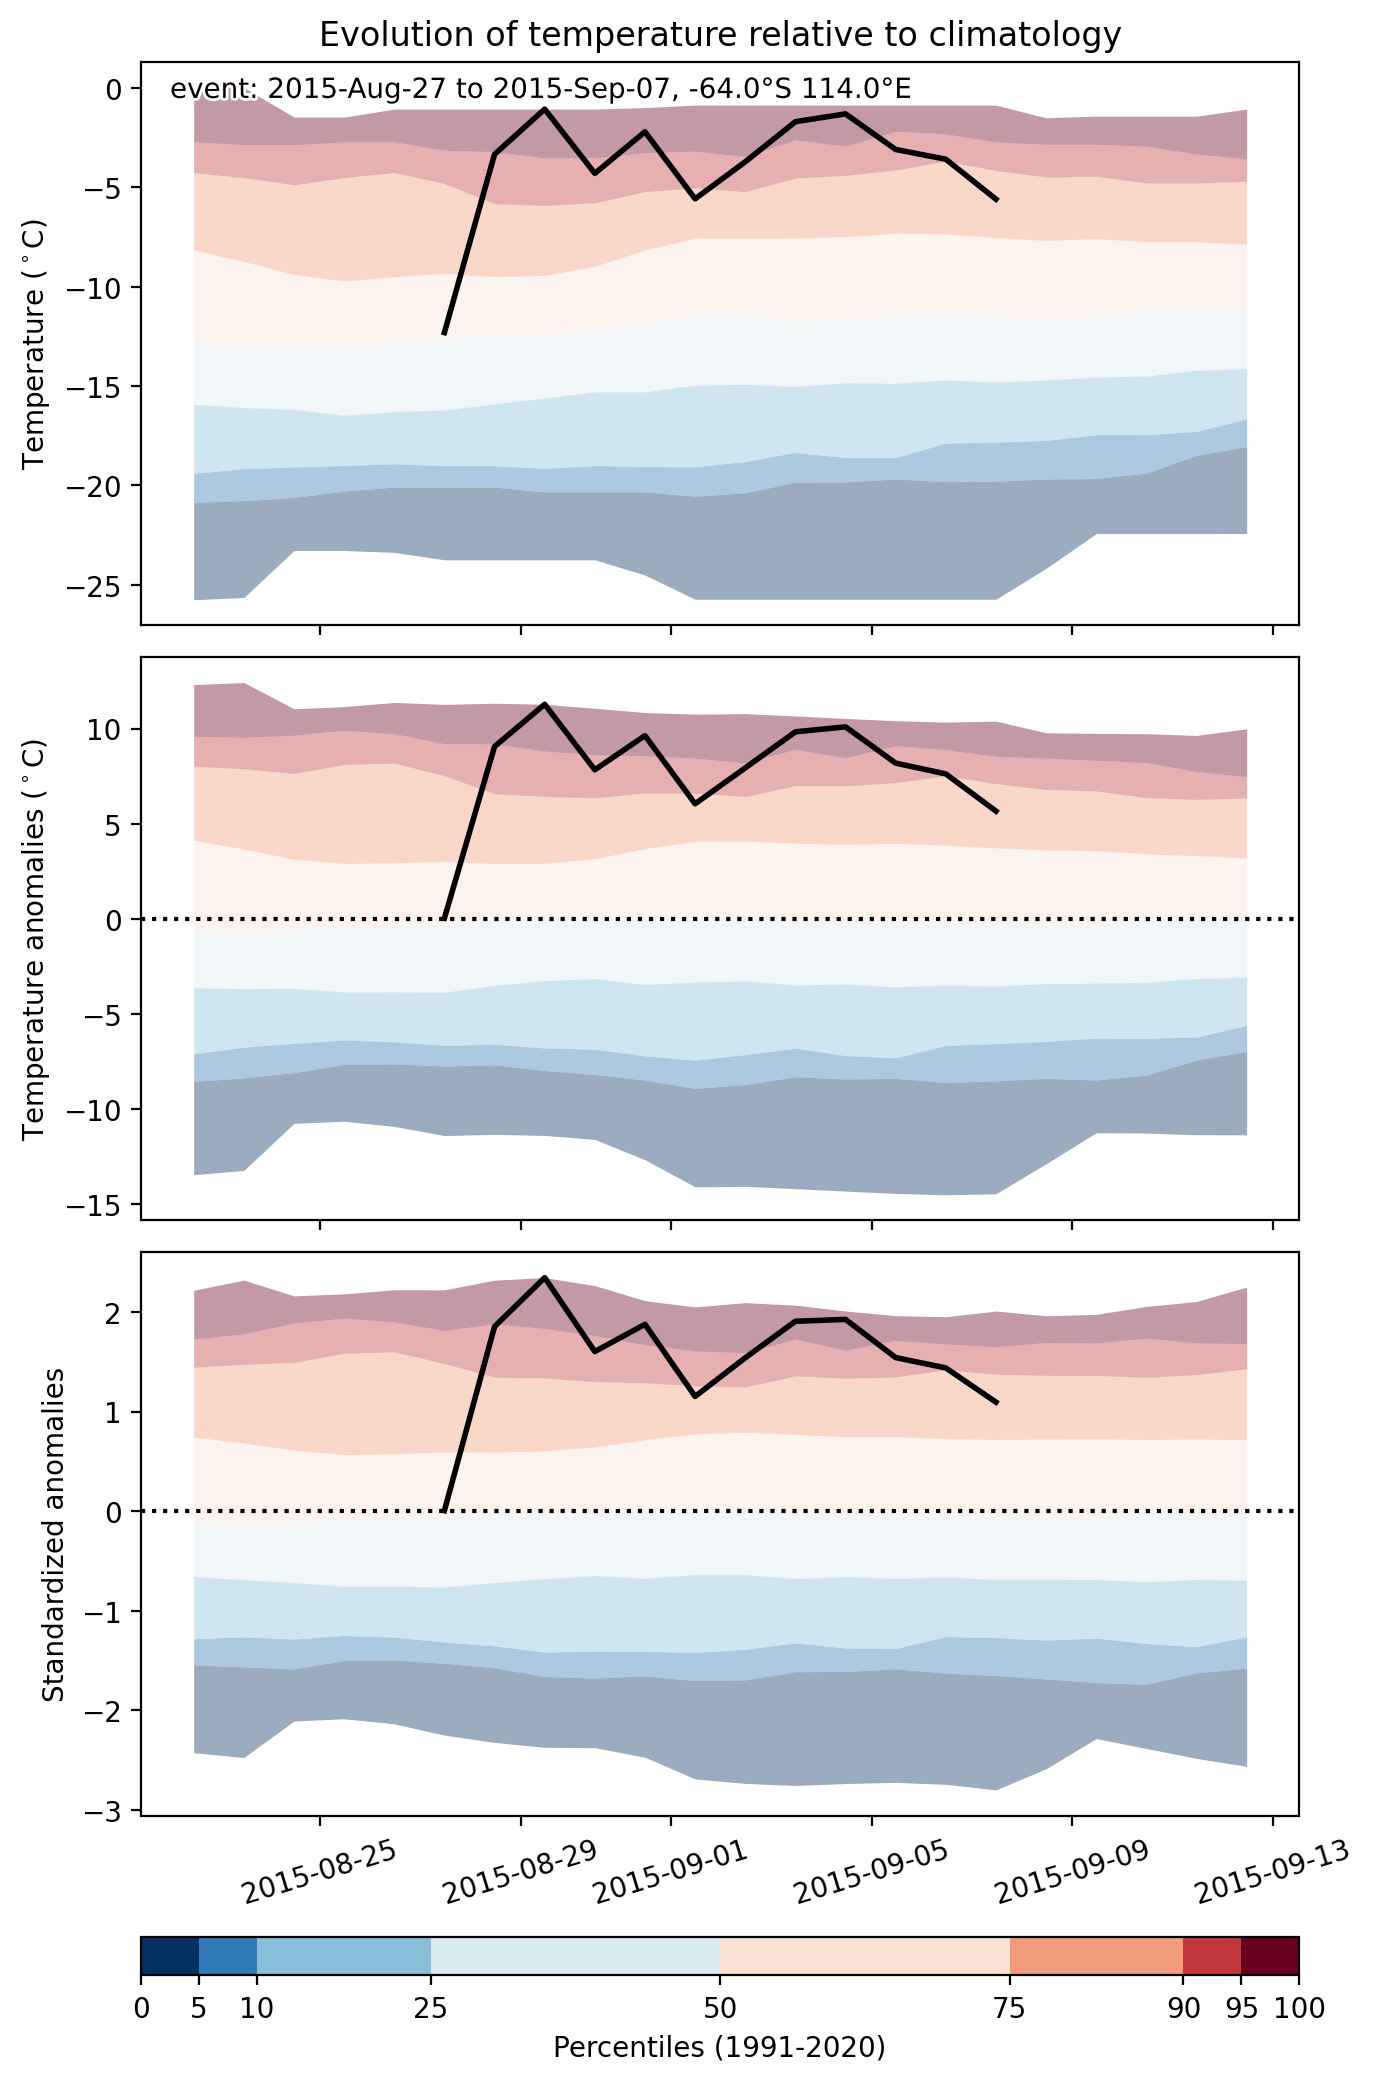
Fig. 2: Evolution of temperature at the center of the event. The climatological percentile distribution is illustrated with color shadings.


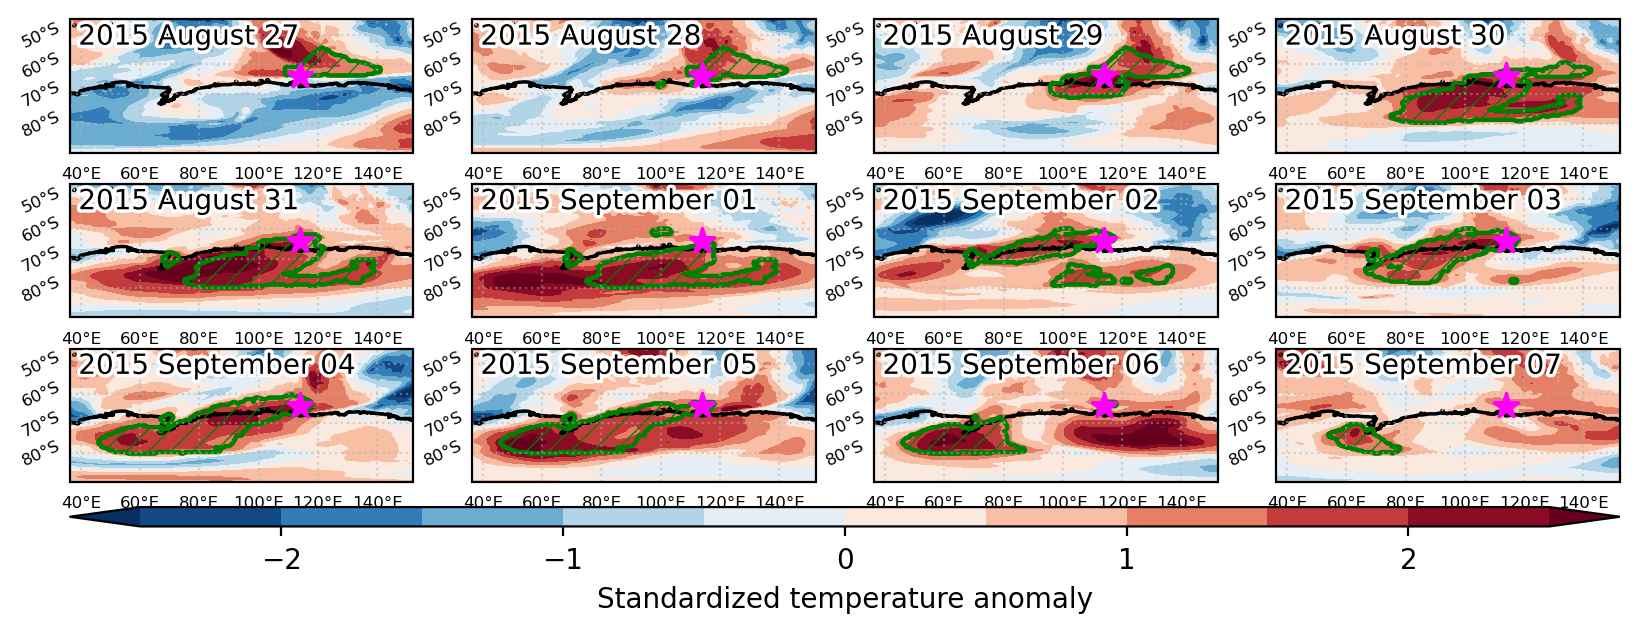
Fig. 3: Maps illustrating the evolution of standardized temperature anomalies during the event.

Event ID: Heat_wave_2015-Aug-27_to_2015-Sep-07_114.0_-64.0

Cold spell occuring from August 27 2015 to September 03 2015 at 82.0°N 330.0°E

Download data: JSON

Event type: Cold spell

Countries affected (identified with ArcGIS Online; provided only for geographical reference):

  • Greenland

Duration: 8 days

Time span: August 27 2015 to September 03 2015

Statistics over entire affected area:

  • Mean temperature anomaly: -5.1 °C
  • Mean temperature: -12.0 °C
  • Minimum temperature anomaly: -10.5 °C
  • Minimum temperature: -21.1 °C

Event center: 82.0°N 330.0°E

Area affected: 124408 km$^2$


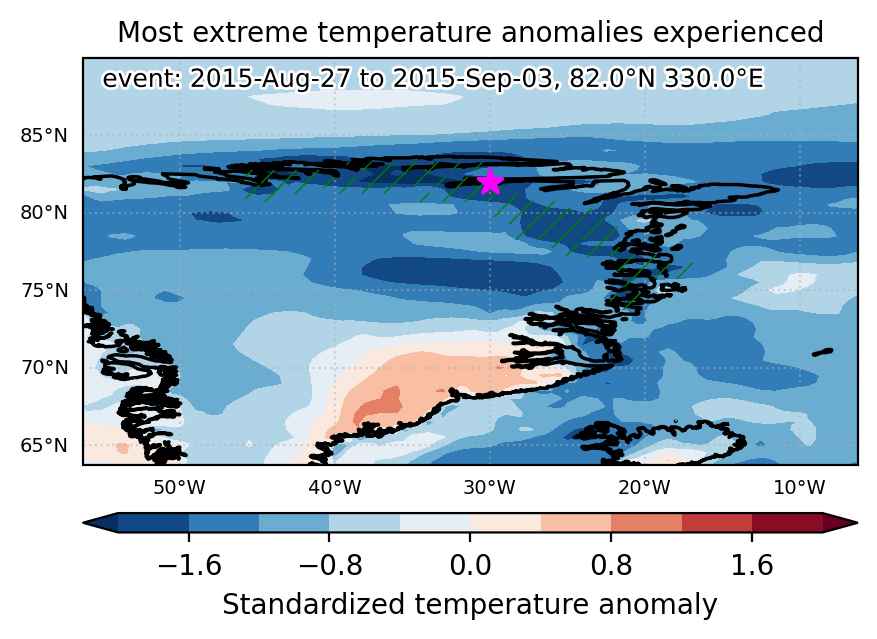
Fig. 1: Map of most extreme temperature anomalies (standardized) experienced during the event. The purple star indicates the center of the extreme event. Green hatching illustrates all areas under the effect of extremes at some time during the event.


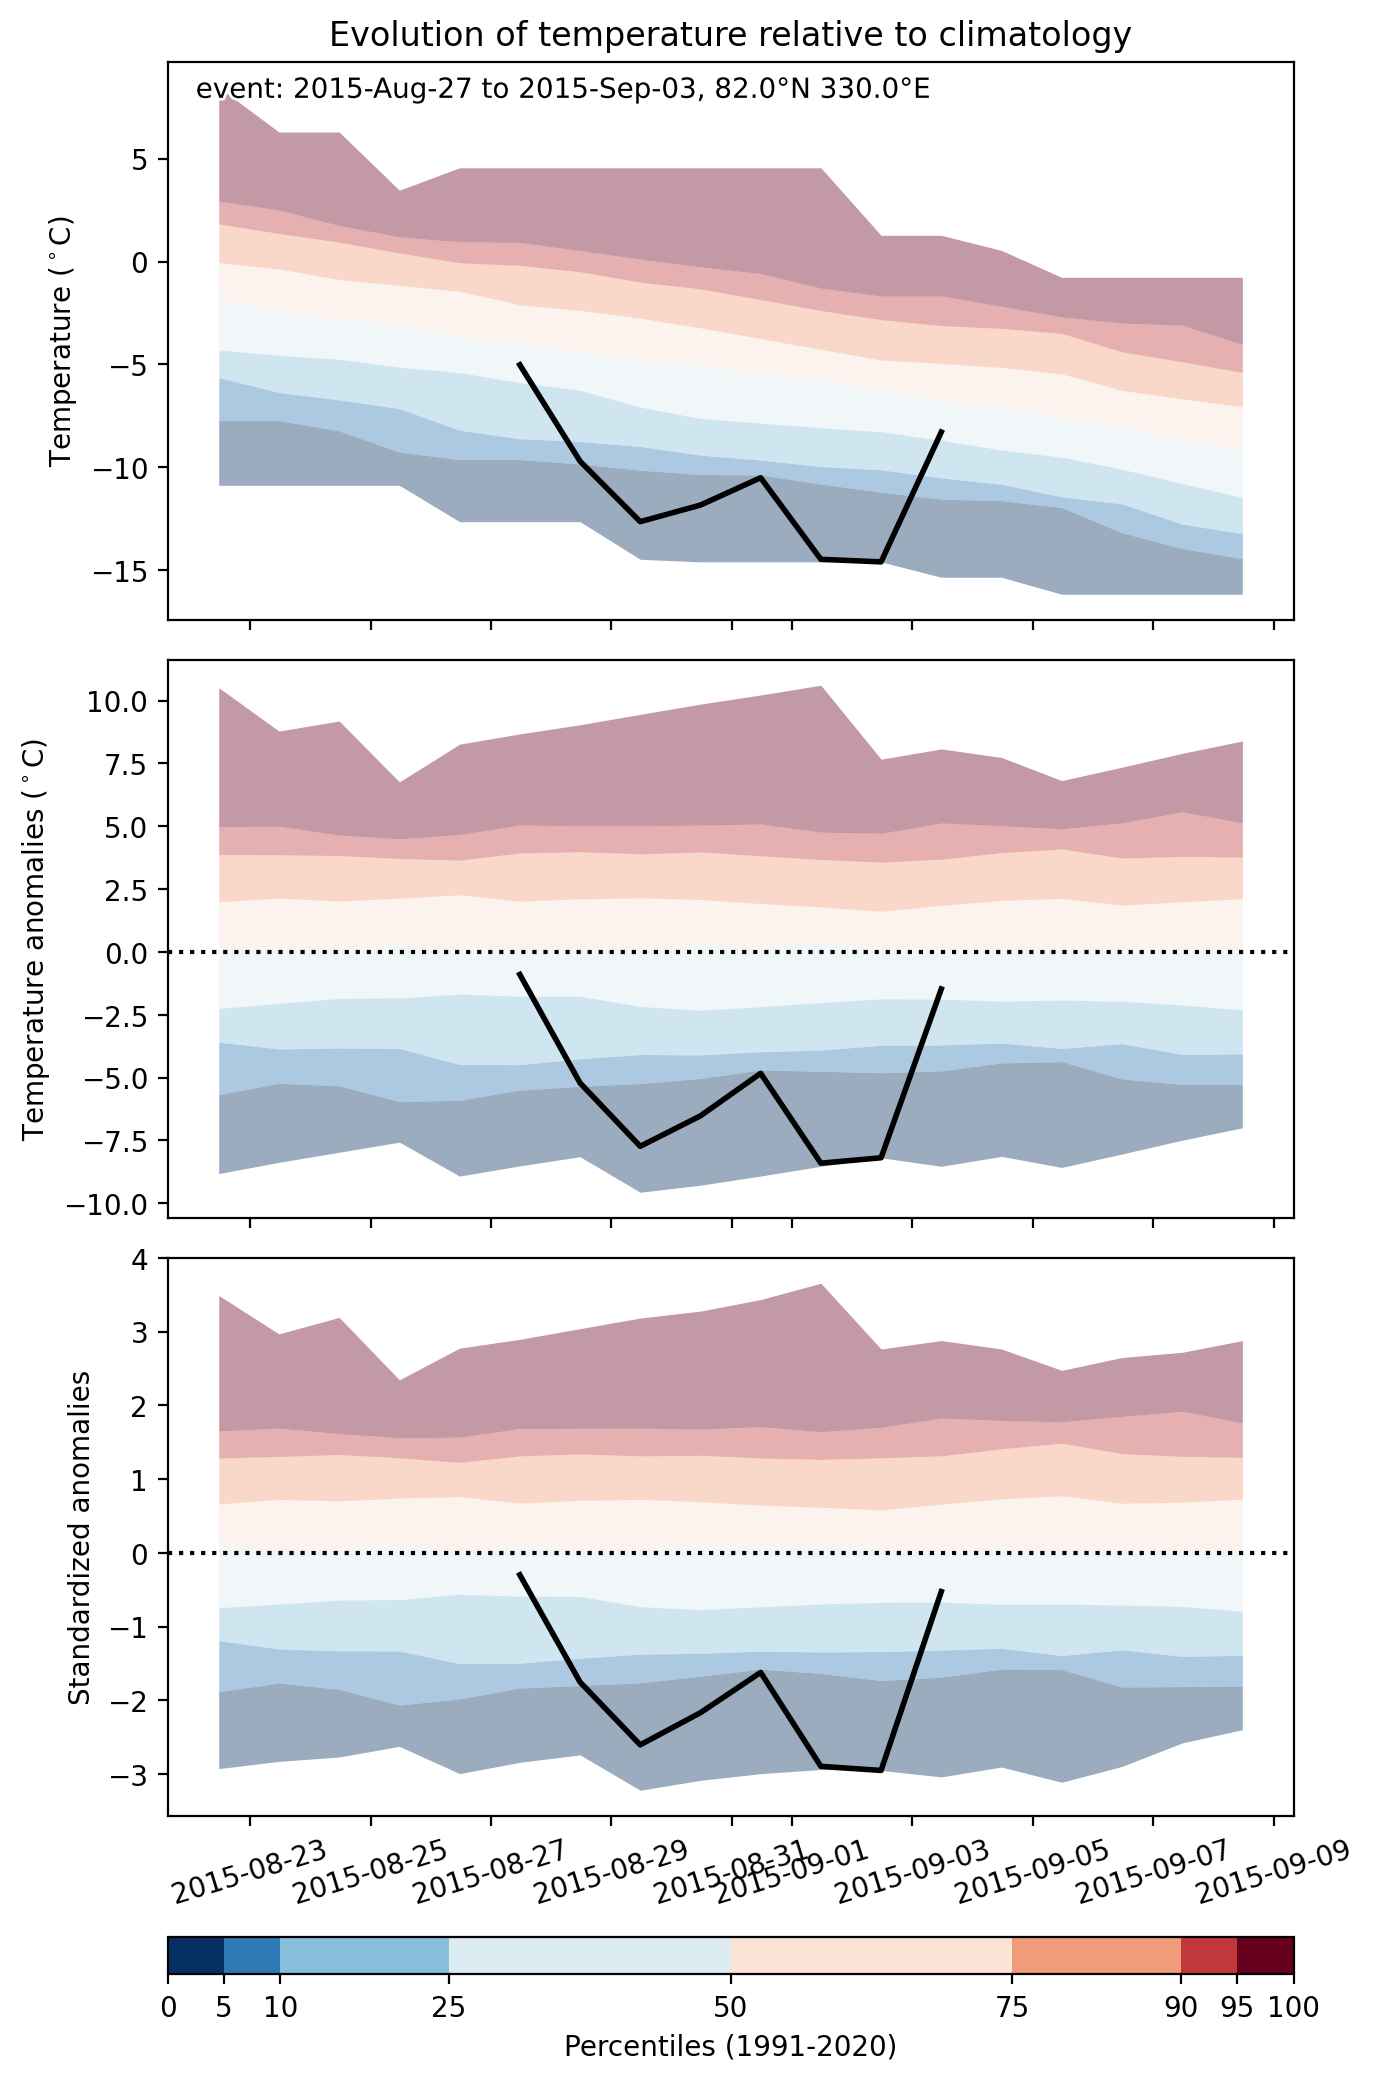
Fig. 2: Evolution of temperature at the center of the event. The climatological percentile distribution is illustrated with color shadings.


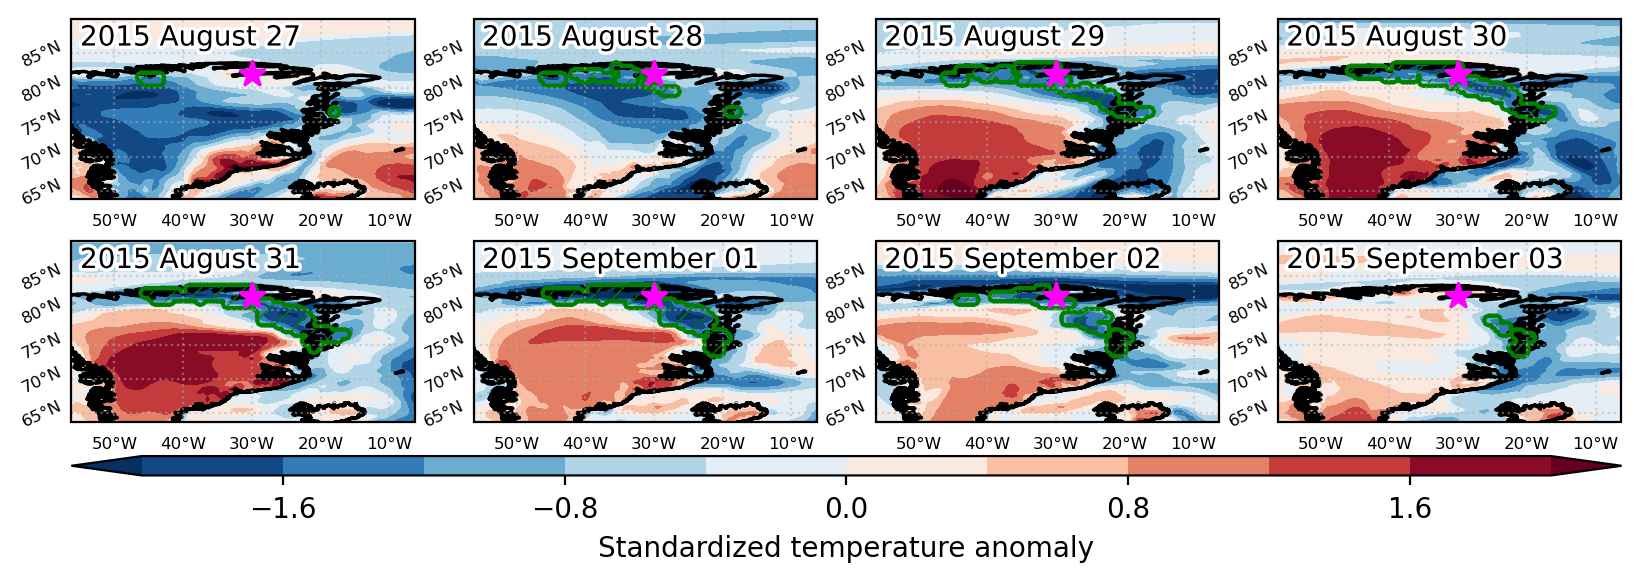
Fig. 3: Maps illustrating the evolution of standardized temperature anomalies during the event.

Event ID: Cold_spell_2015-Aug-27_to_2015-Sep-03_330.0_82.0

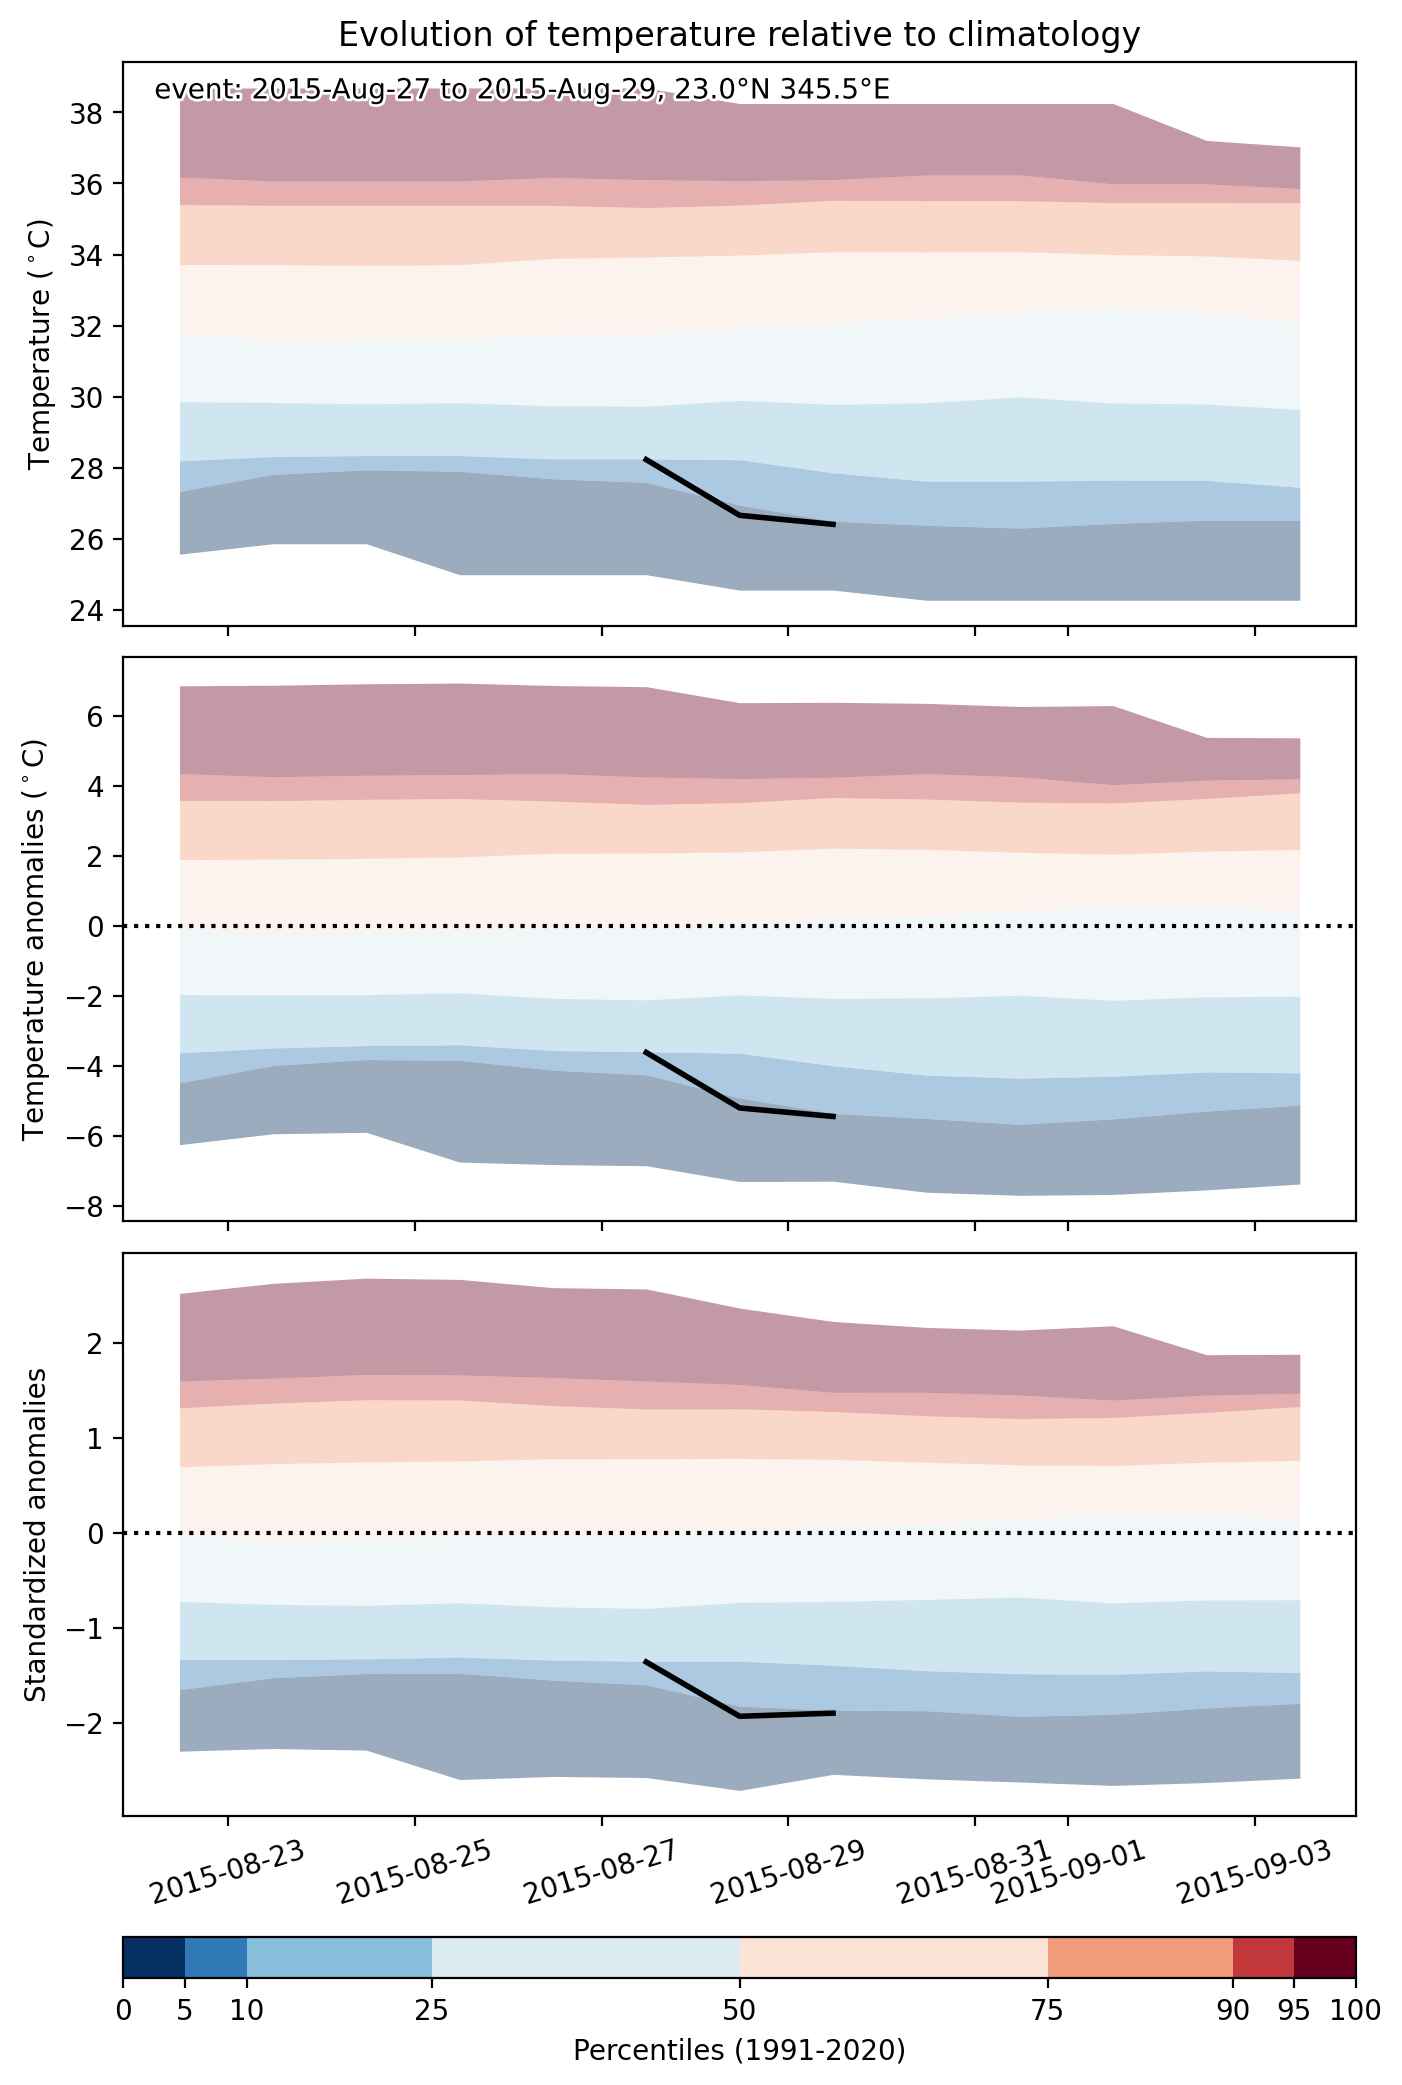
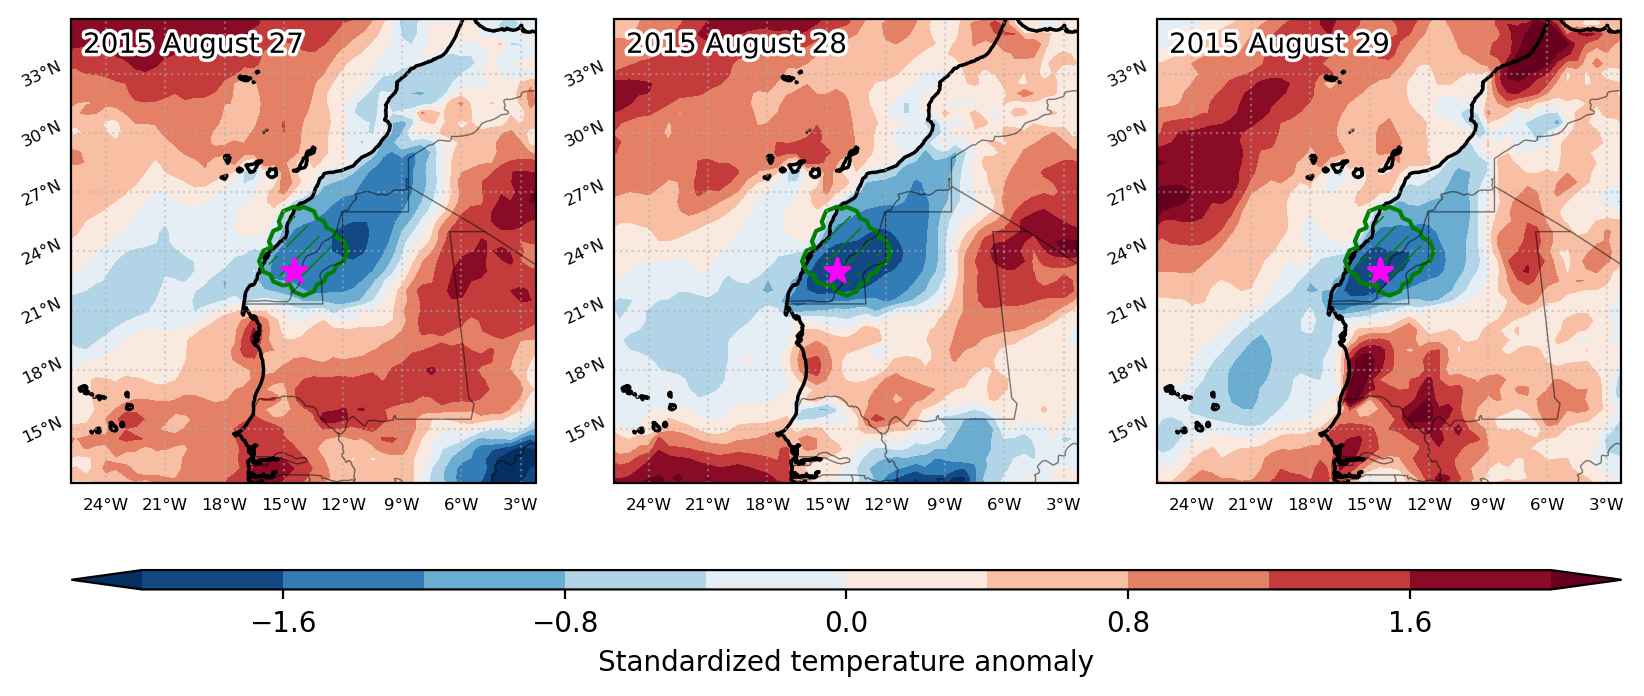
Cold spell occuring from August 27 2015 to August 29 2015 at 23.0°N 345.5°E

Download data: JSON

Event type: Cold spell

Countries affected (identified with ArcGIS Online; provided only for geographical reference):

  • Morocco

Duration: 3 days

Time span: August 27 2015 to August 29 2015

Statistics over entire affected area:

  • Mean temperature anomaly: -4.5 °C
  • Mean temperature: 25.4 °C
  • Minimum temperature anomaly: -5.7 °C
  • Minimum temperature: 22.2 °C

Event center: 23.0°N 345.5°E

Area affected: 73412 km$^2$


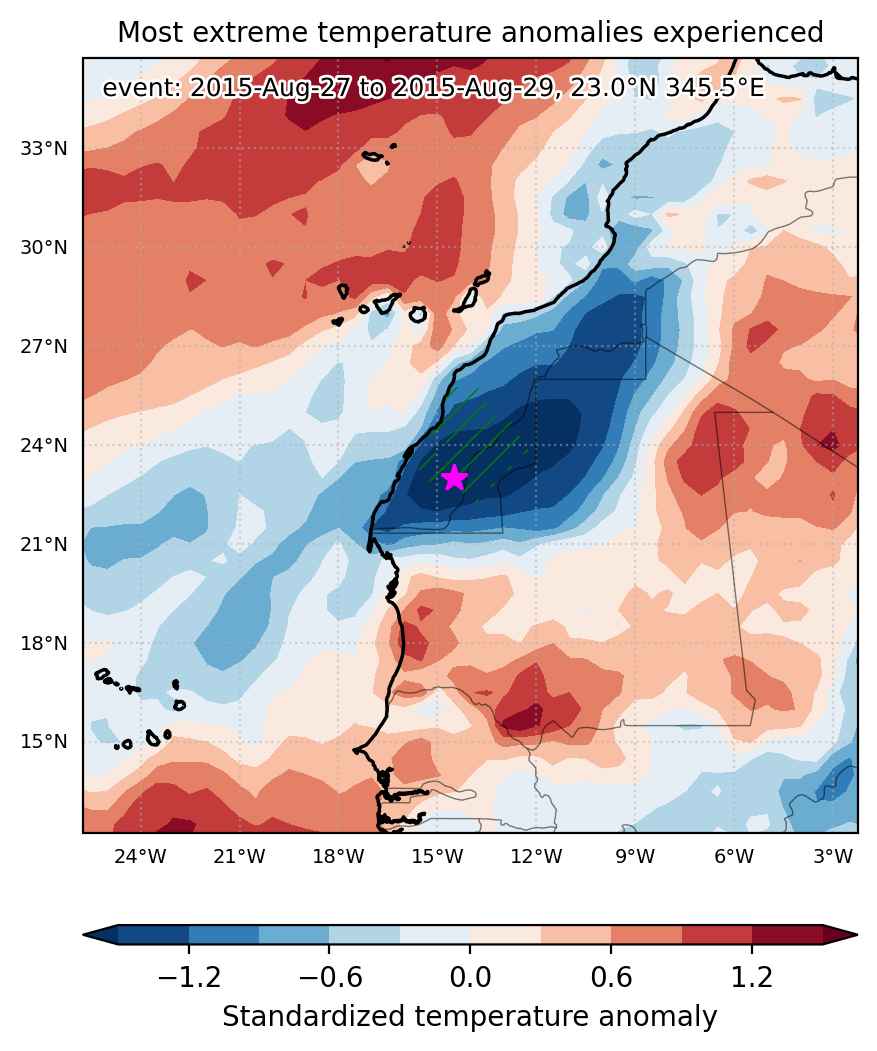
Fig. 1: Map of most extreme temperature anomalies (standardized) experienced during the event. The purple star indicates the center of the extreme event. Green hatching illustrates all areas under the effect of extremes at some time during the event.


Fig. 2: Evolution of temperature at the center of the event. The climatological percentile distribution is illustrated with color shadings.


Fig. 3: Maps illustrating the evolution of standardized temperature anomalies during the event.

Event ID: Cold_spell_2015-Aug-27_to_2015-Aug-29_345.5_23.0