Cold spell occuring from November 16 2013 to December 01 2013 at 58.5°N 244.5°E

Download data: JSON

Event type: Cold spell

Countries affected (identified with ArcGIS Online; provided only for geographical reference):

  • Canada
  • United States

Duration: 16 days

Time span: November 16 2013 to December 01 2013

Statistics over entire affected area:

  • Mean temperature anomaly: -11.5 °C
  • Mean temperature: -22.8 °C
  • Minimum temperature anomaly: -23.3 °C
  • Minimum temperature: -43.3 °C

Event center: 58.5°N 244.5°E

Area affected: 4181254 km$^2$
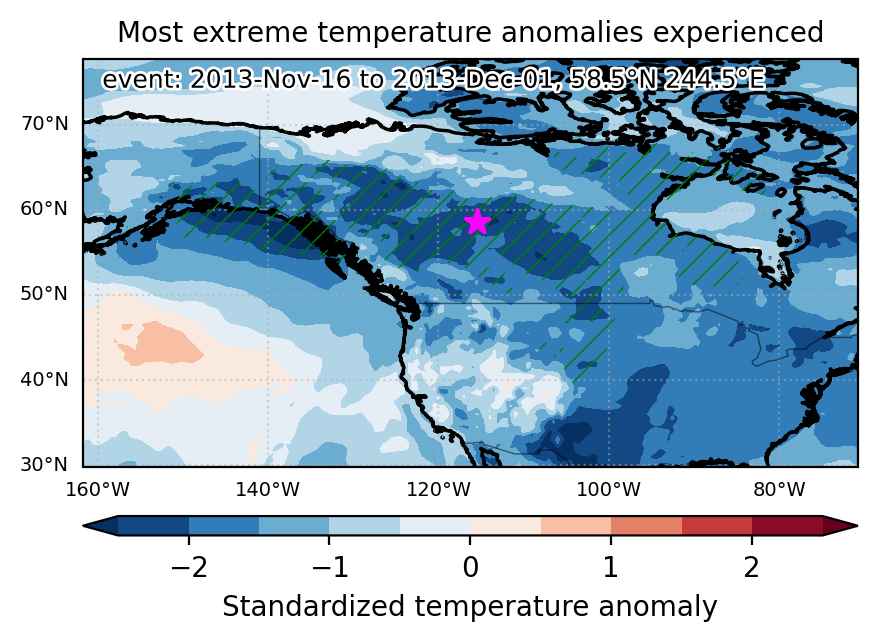

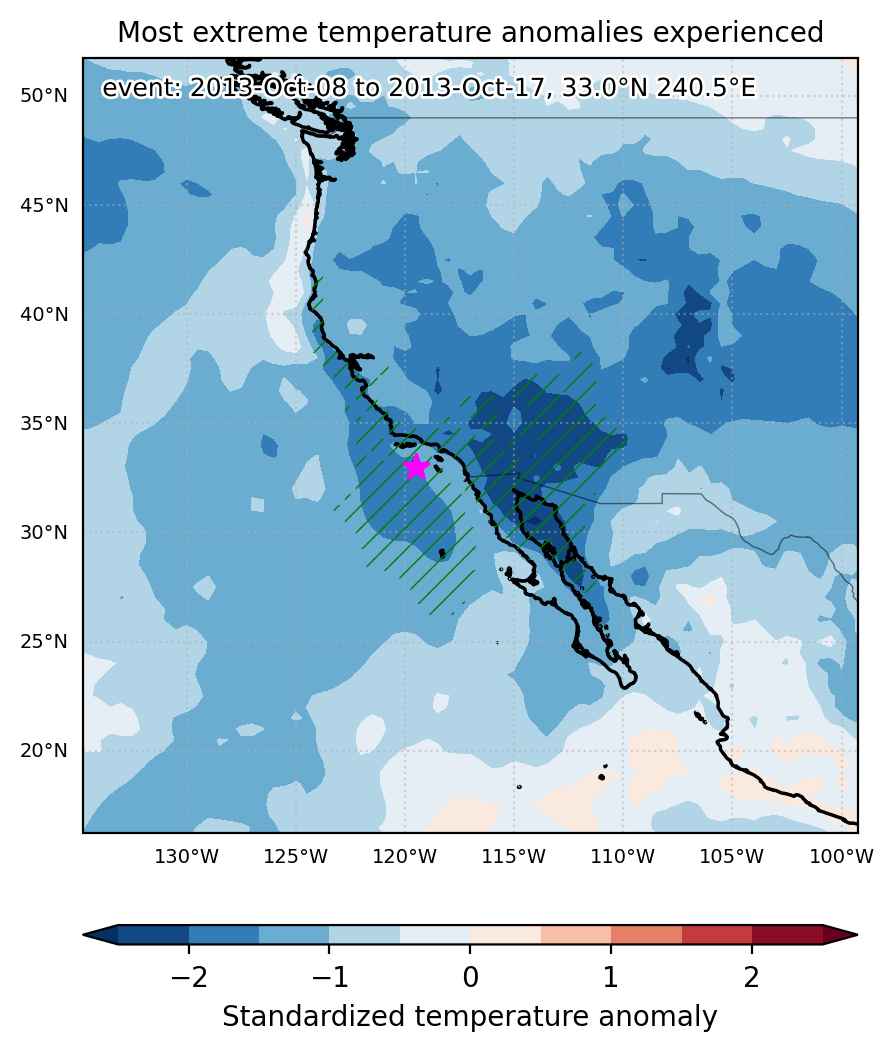
Fig. 1: Map of most extreme temperature anomalies (standardized) experienced during the event. The purple star indicates the center of the extreme event. Green hatching illustrates all areas under the effect of extremes at some time during the event.
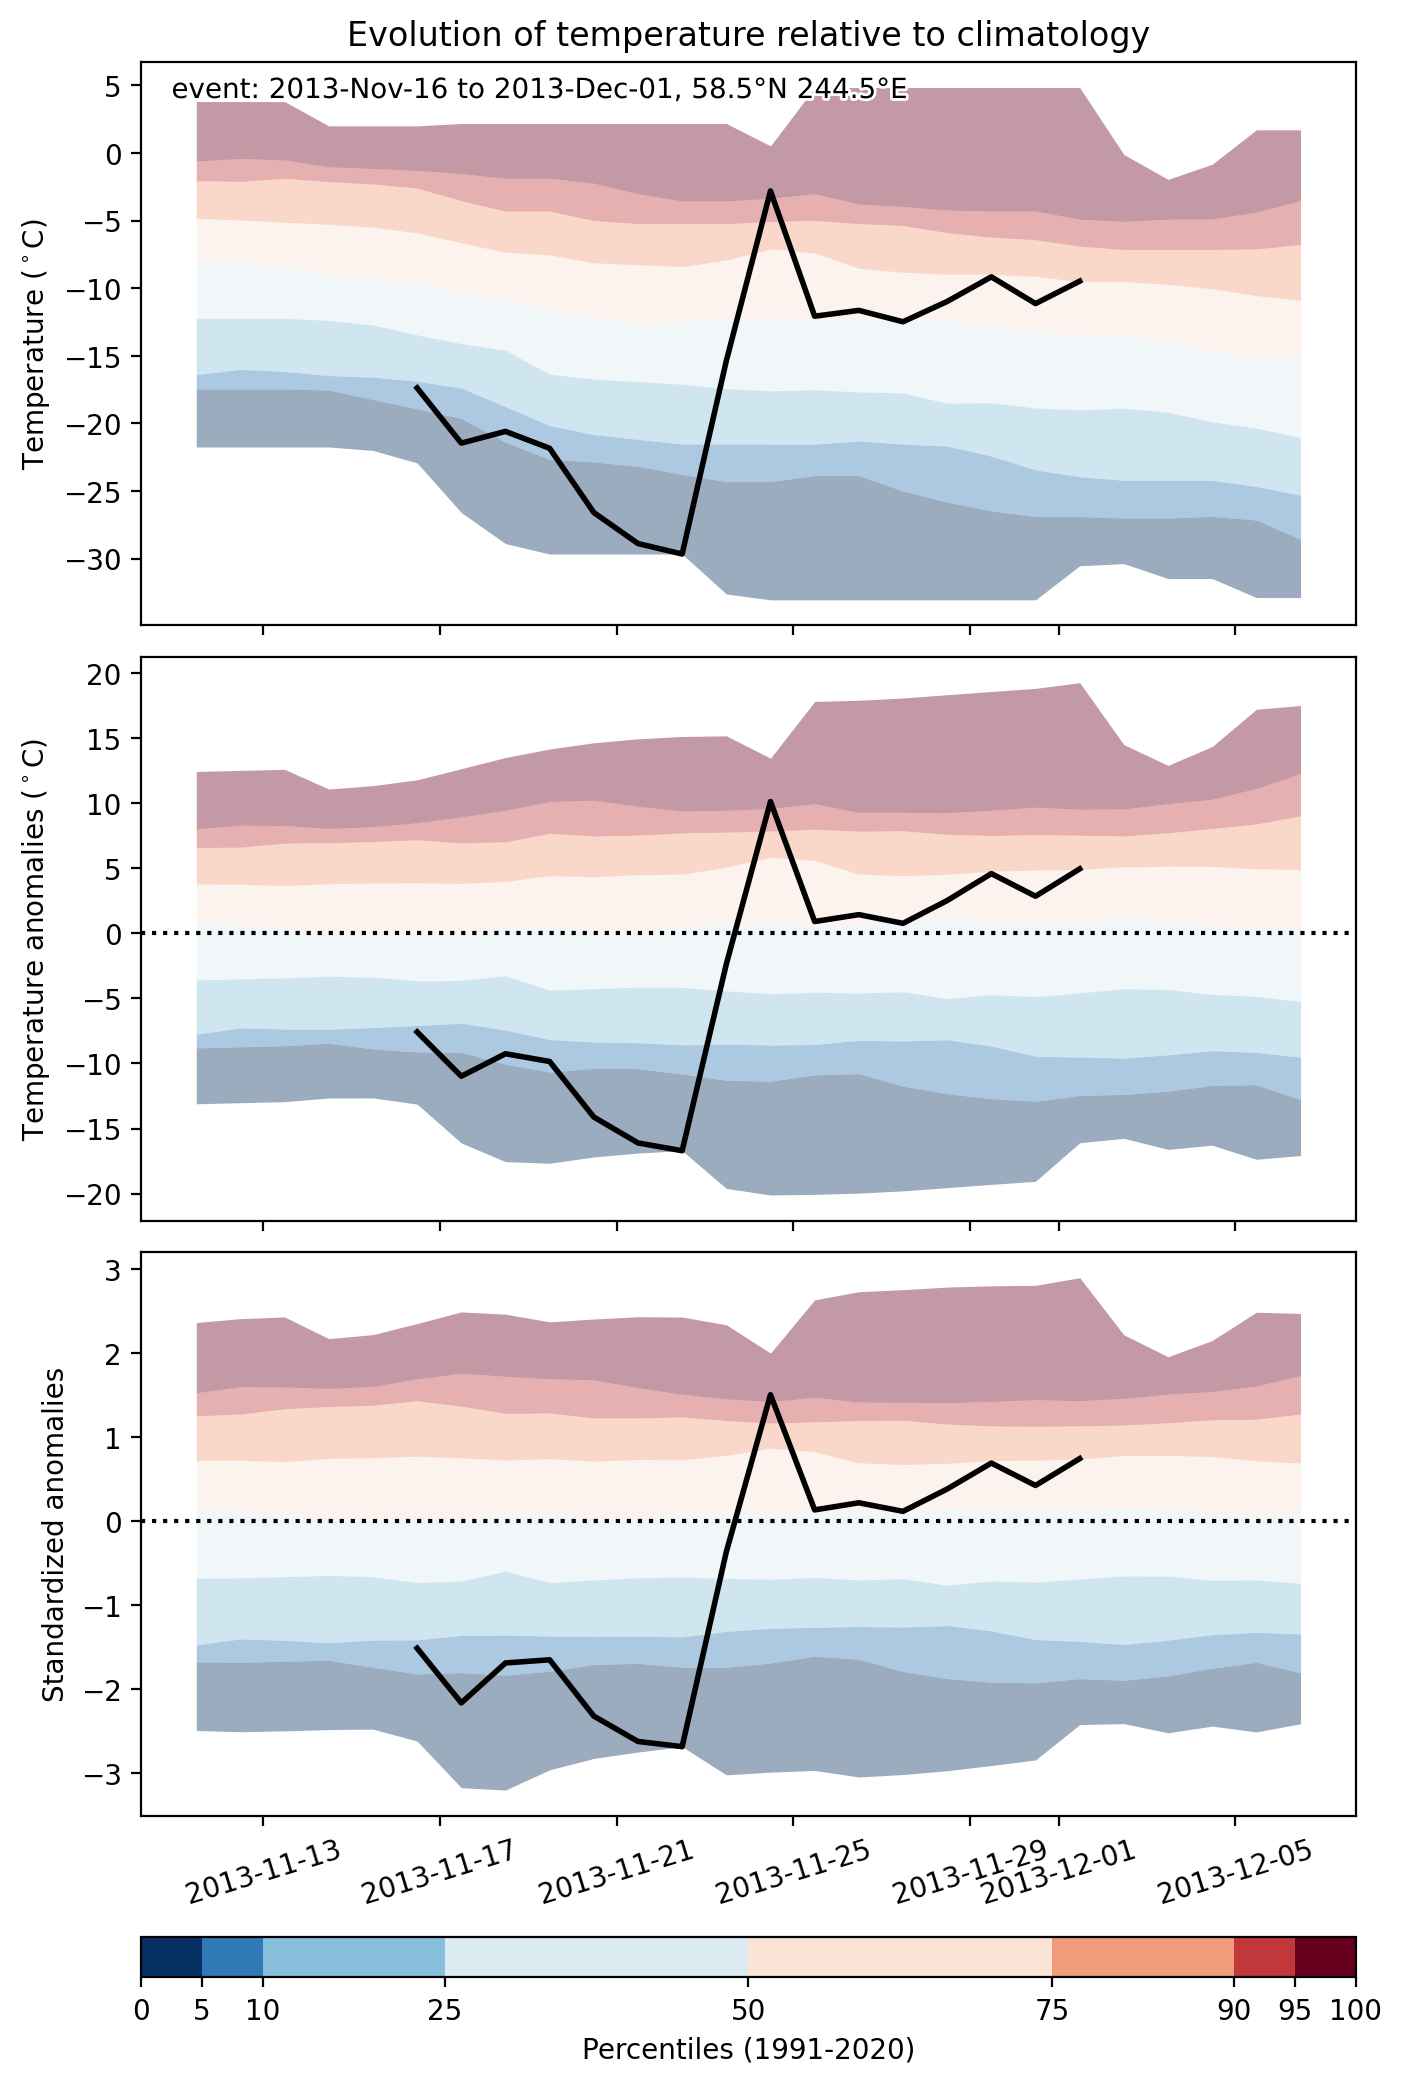


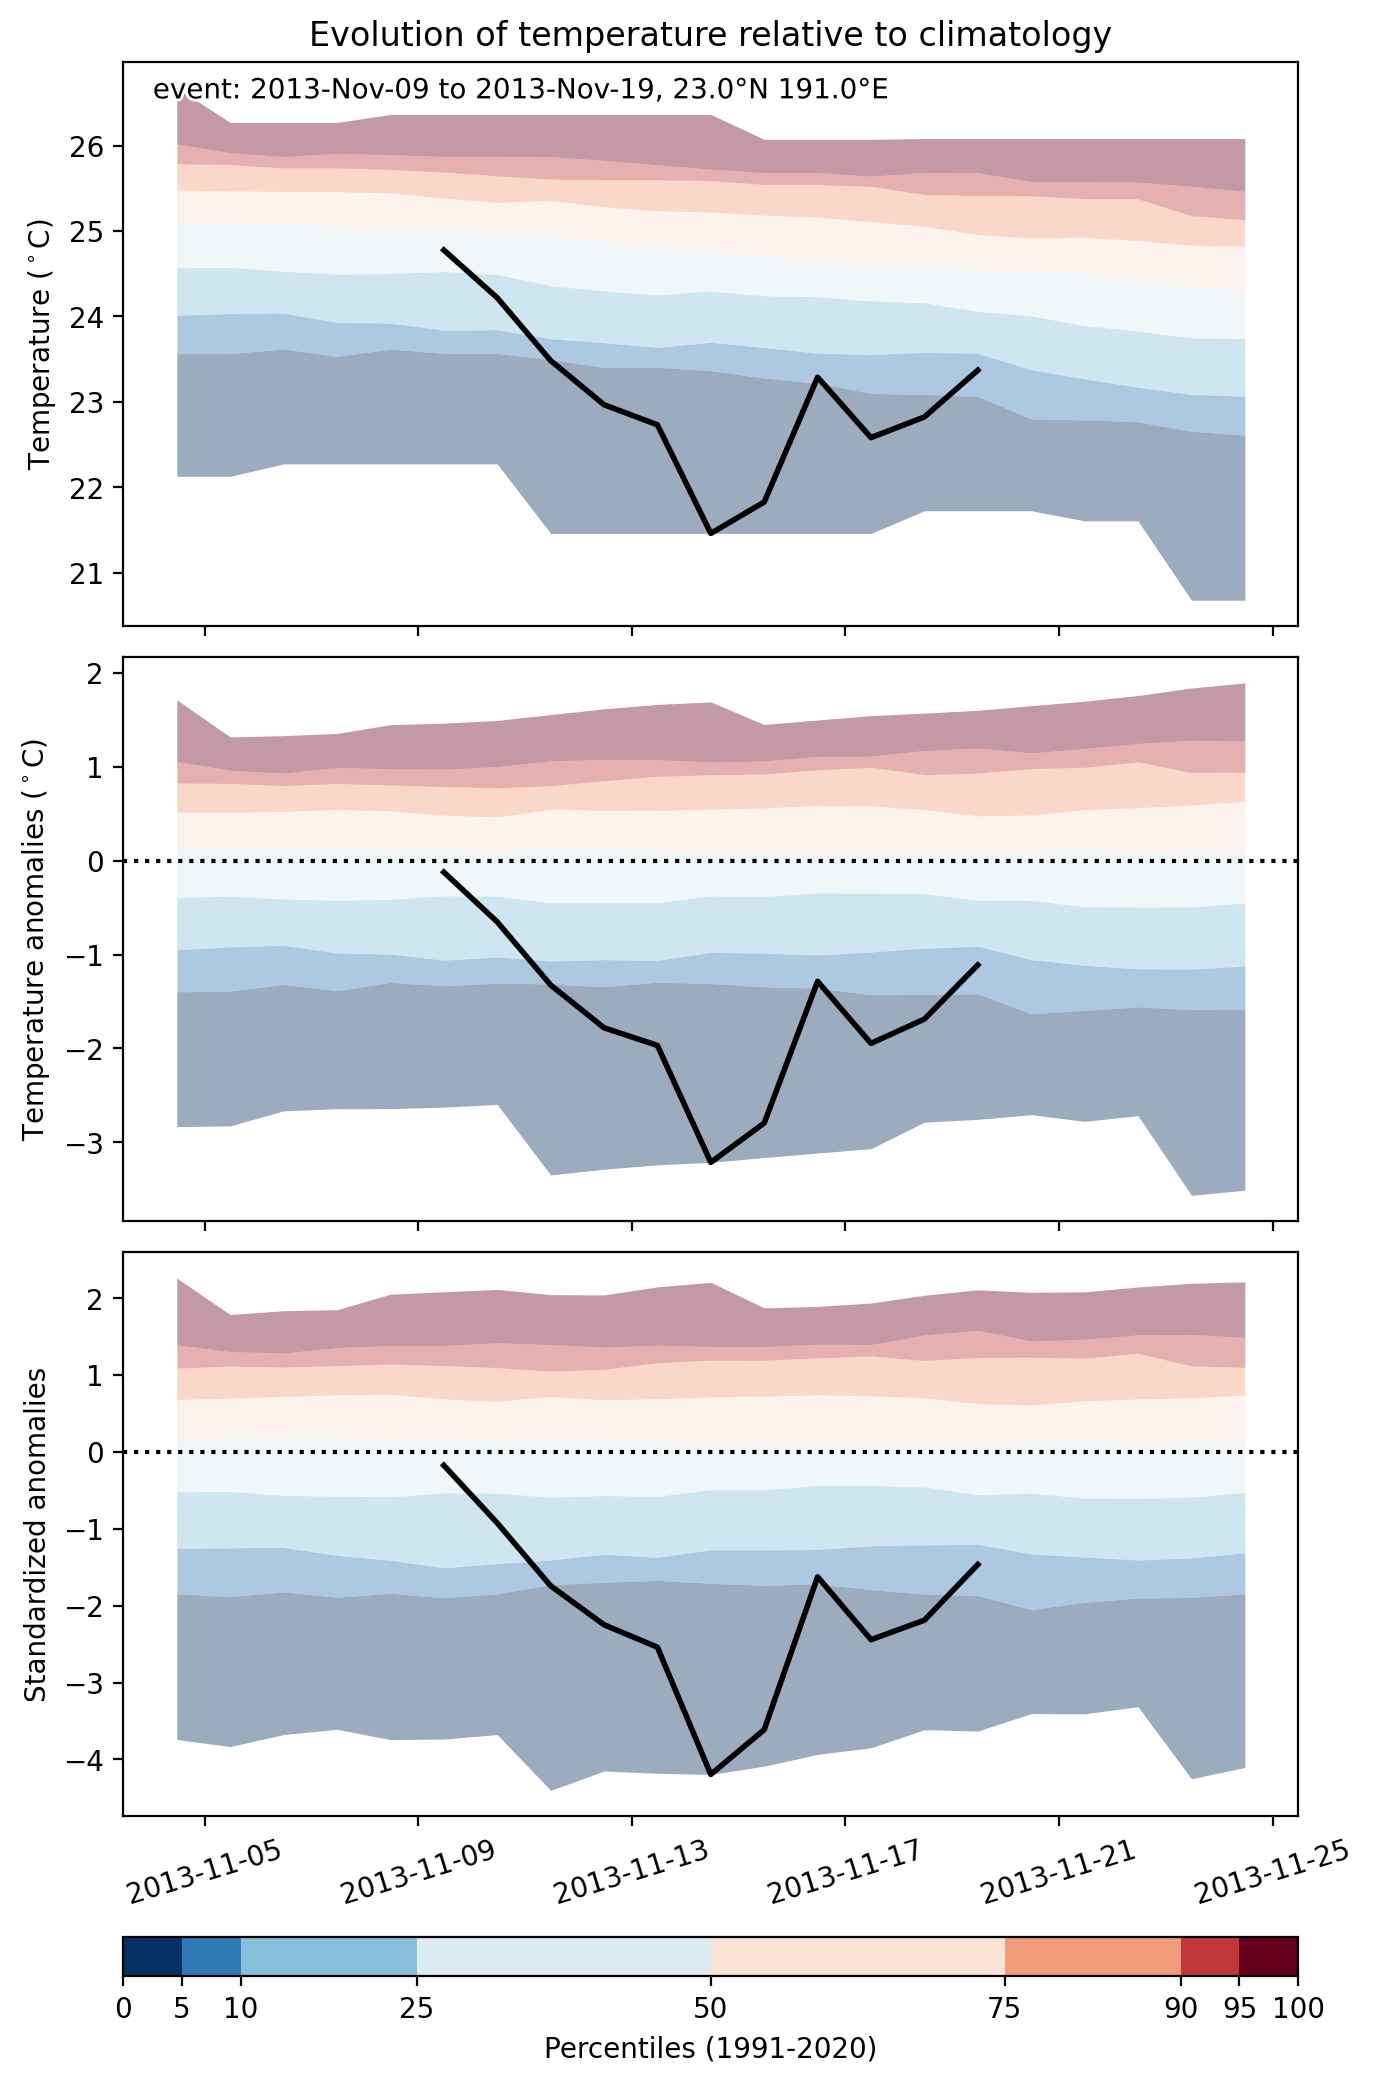
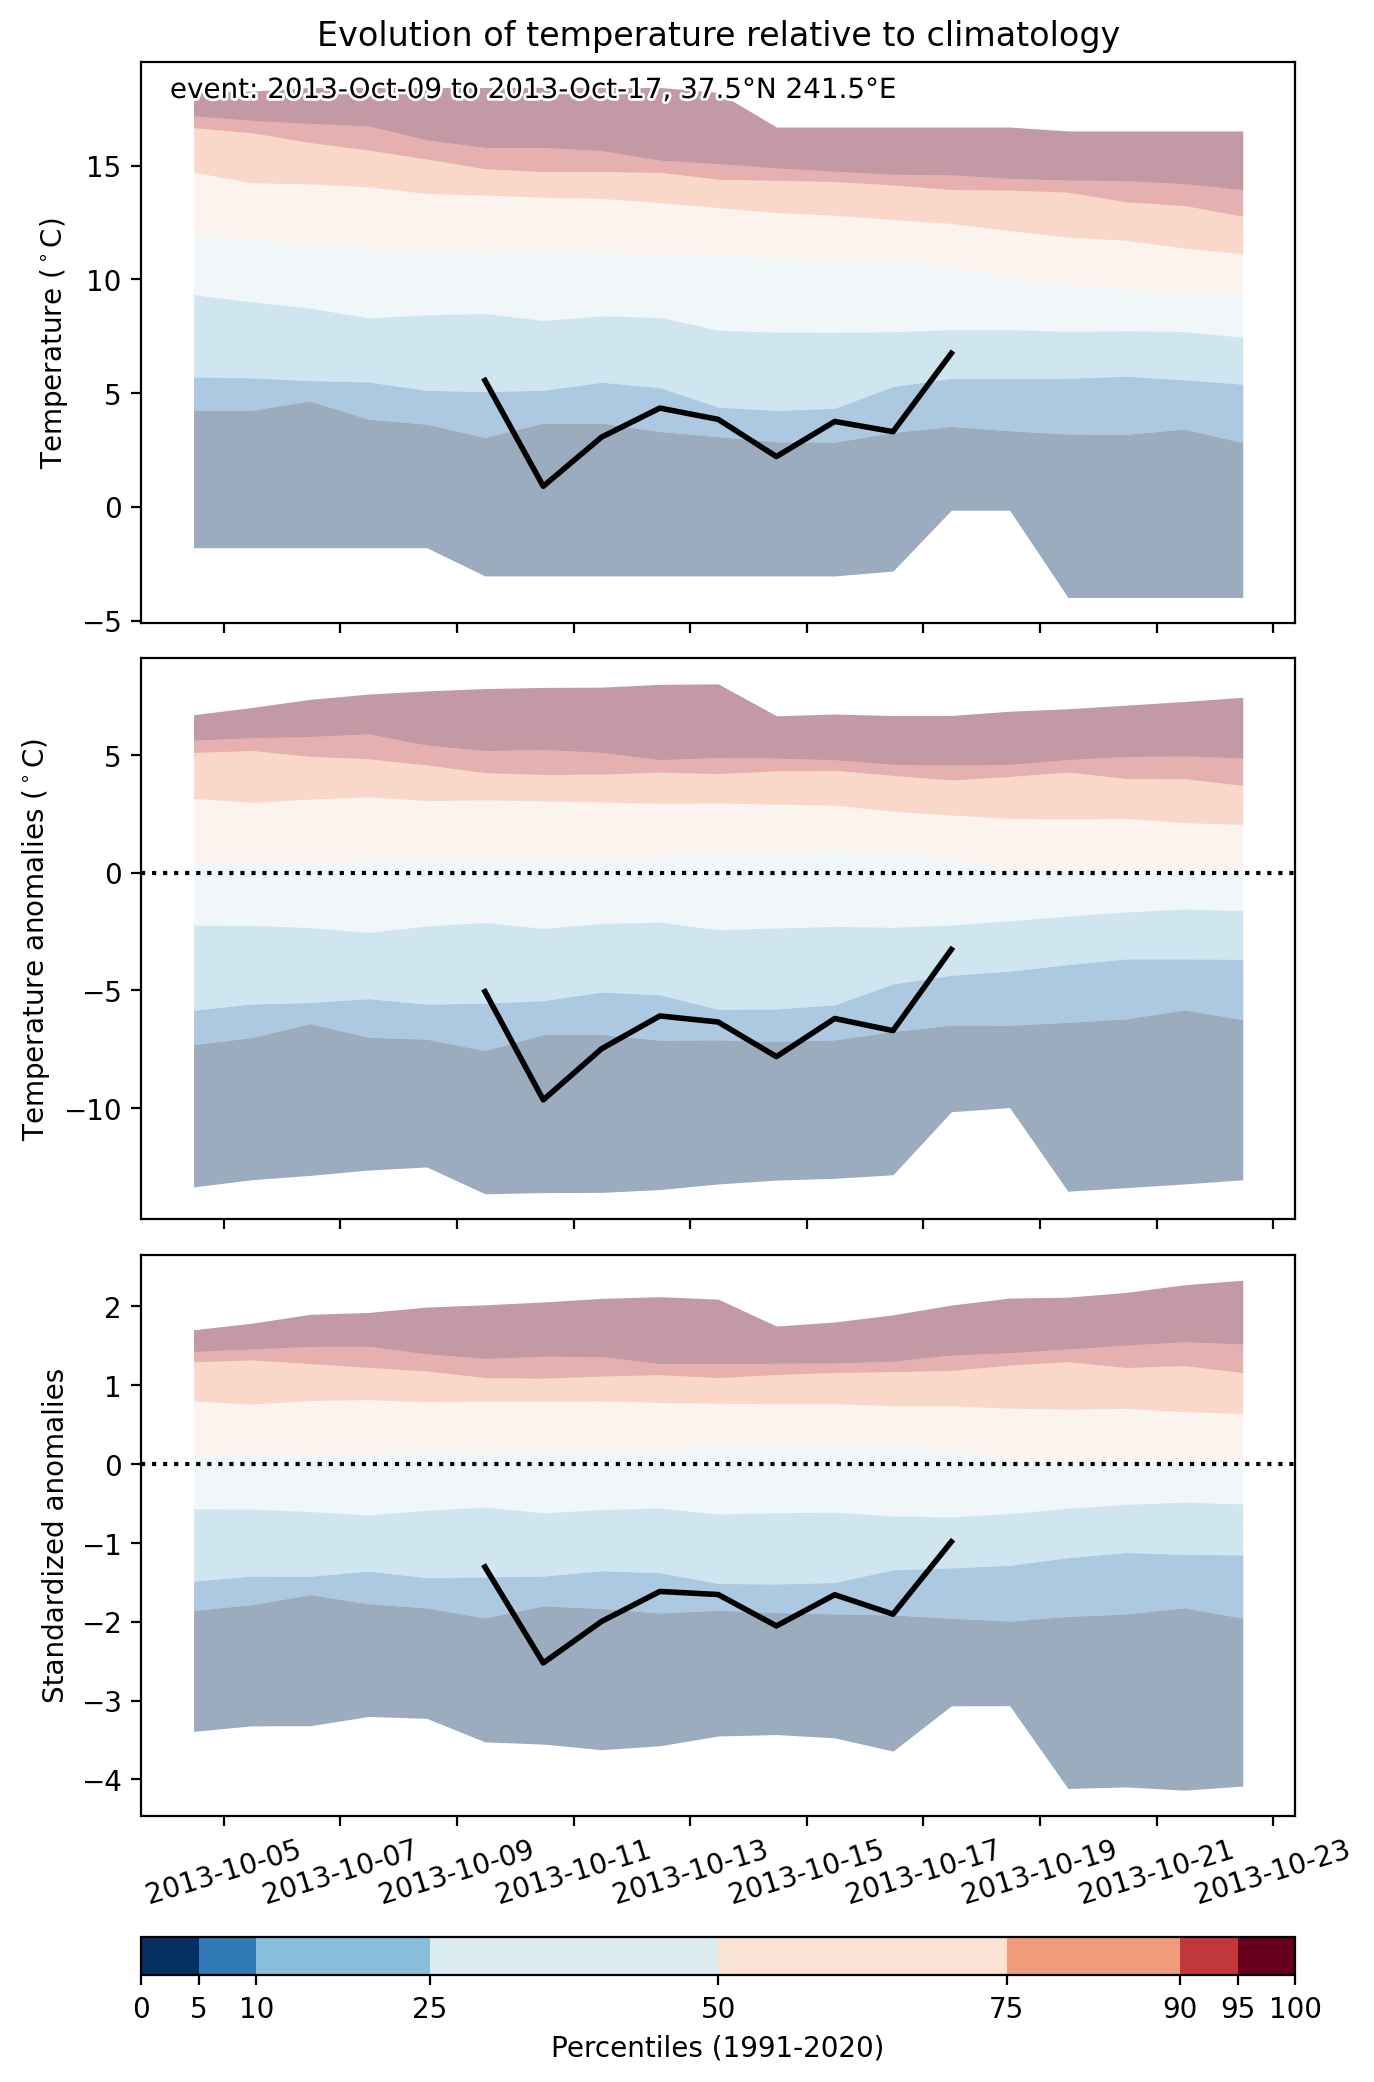
Fig. 2: Evolution of temperature at the center of the event. The climatological percentile distribution is illustrated with color shadings.
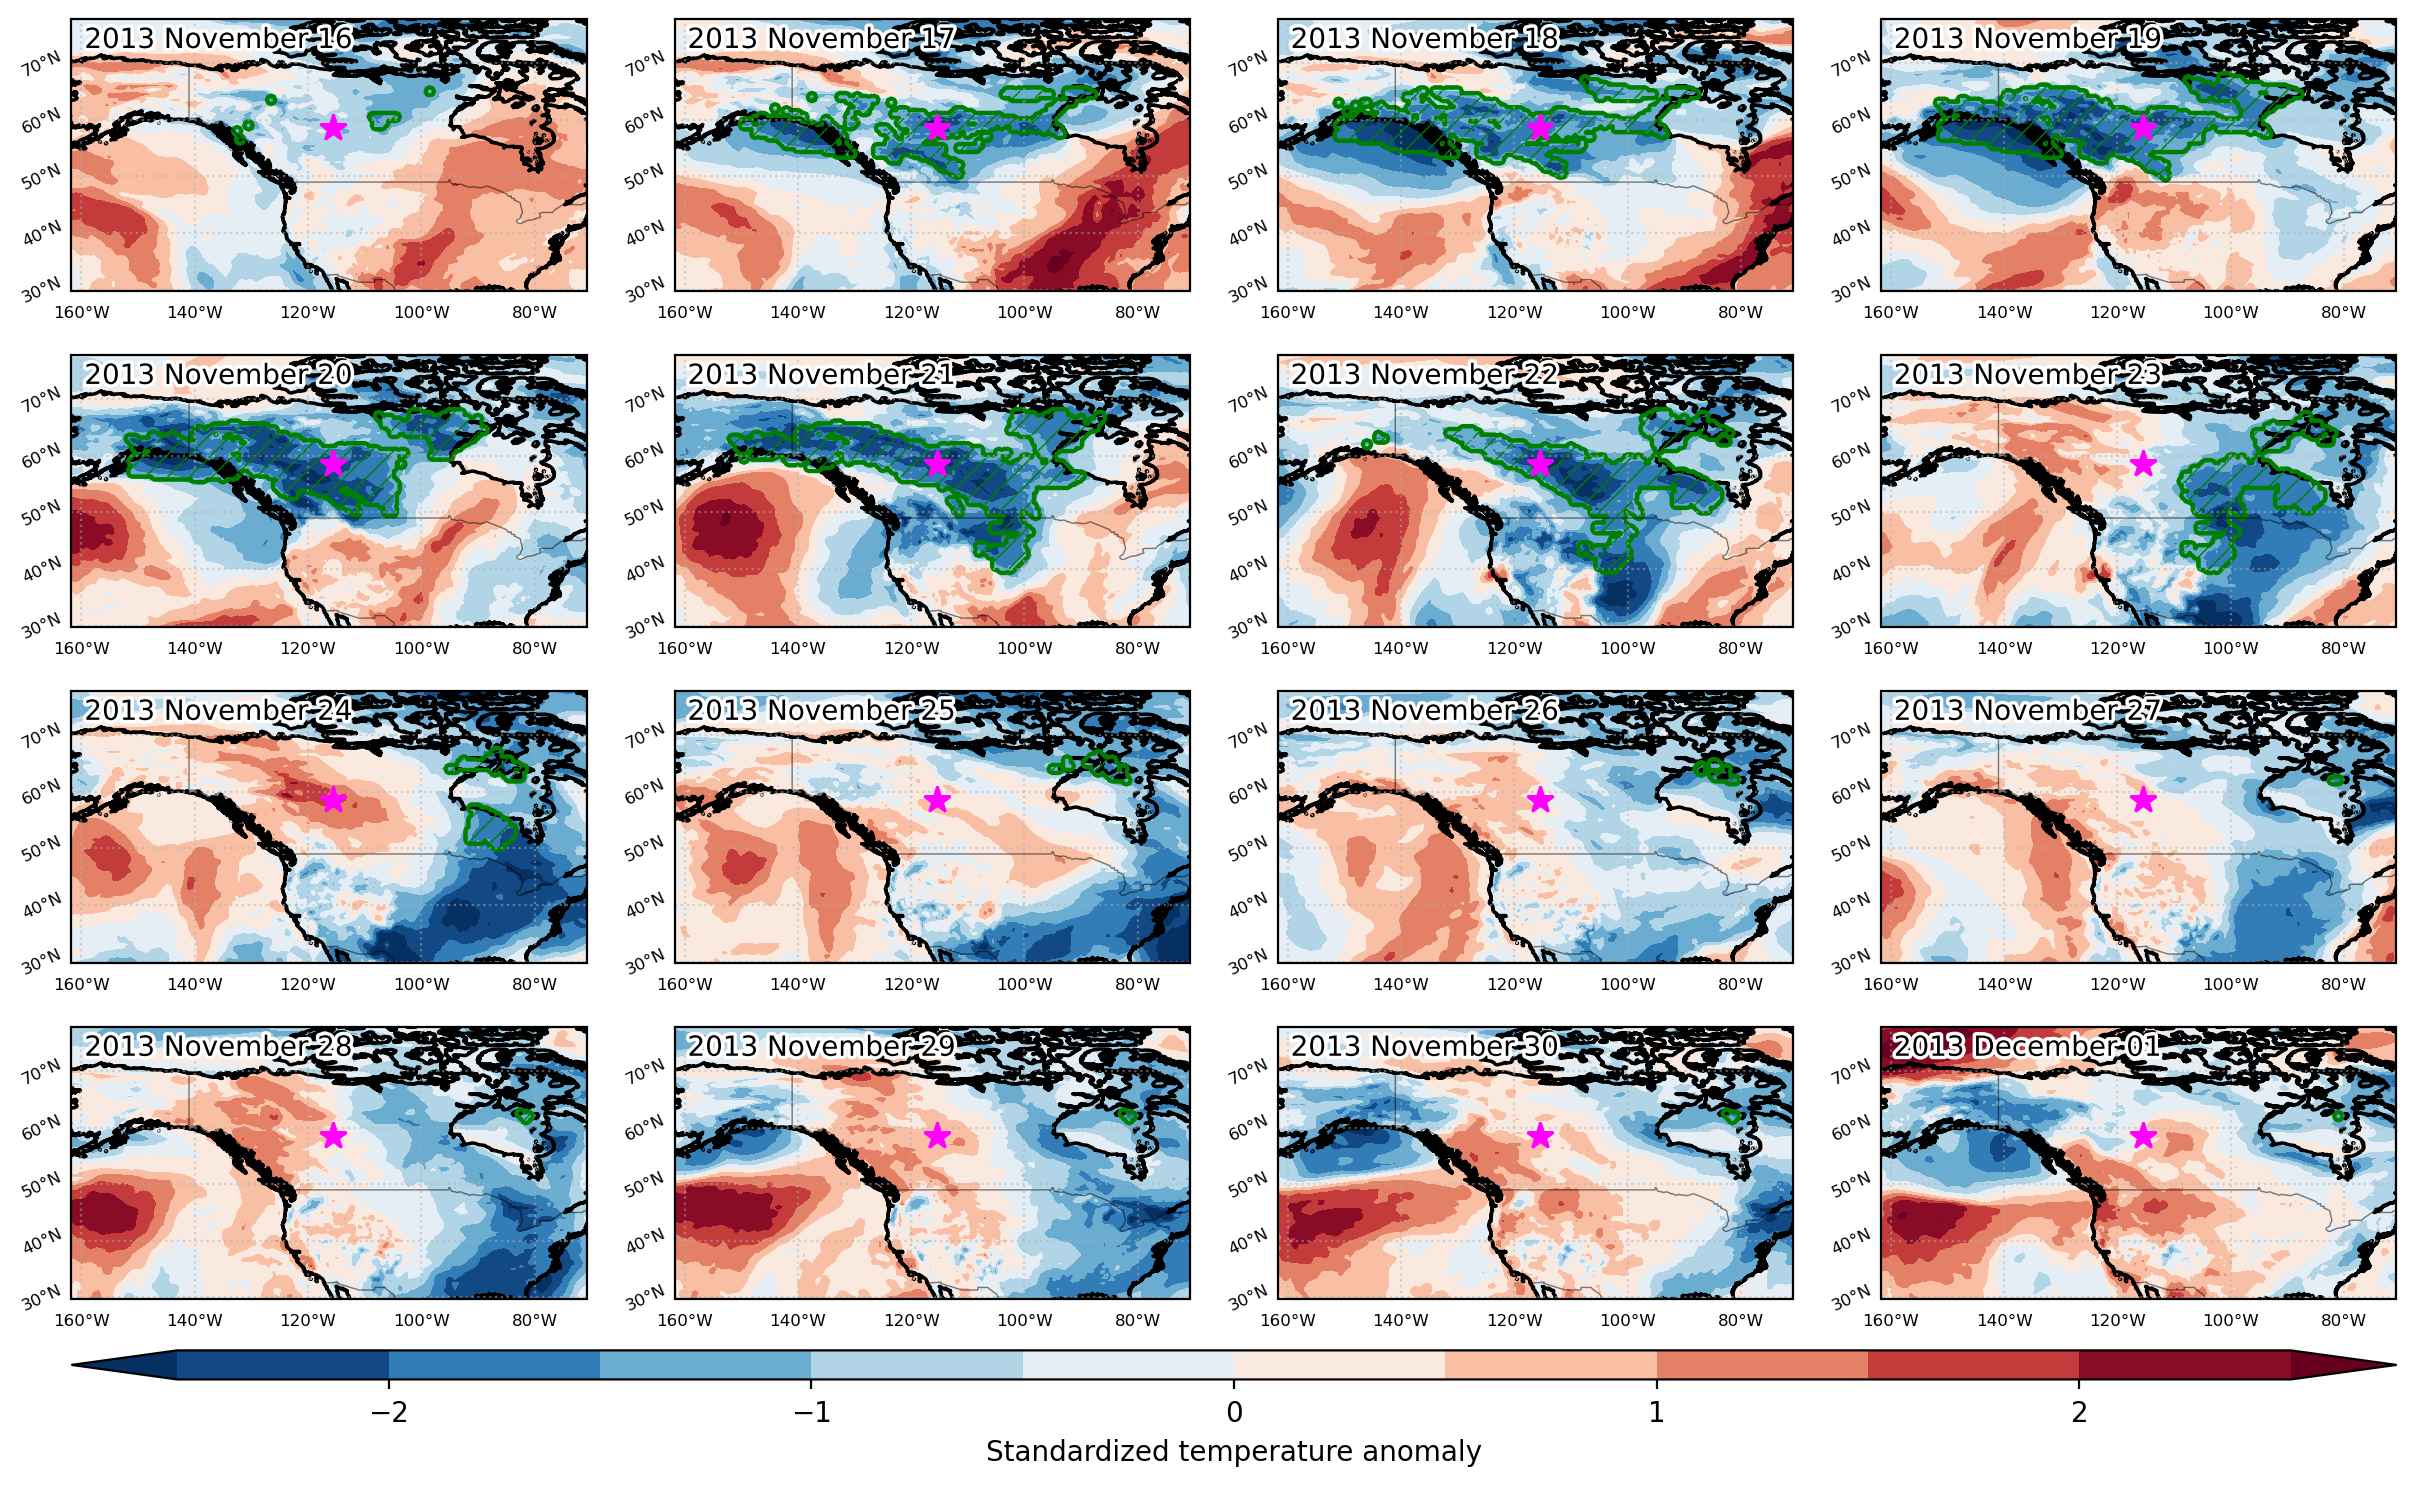


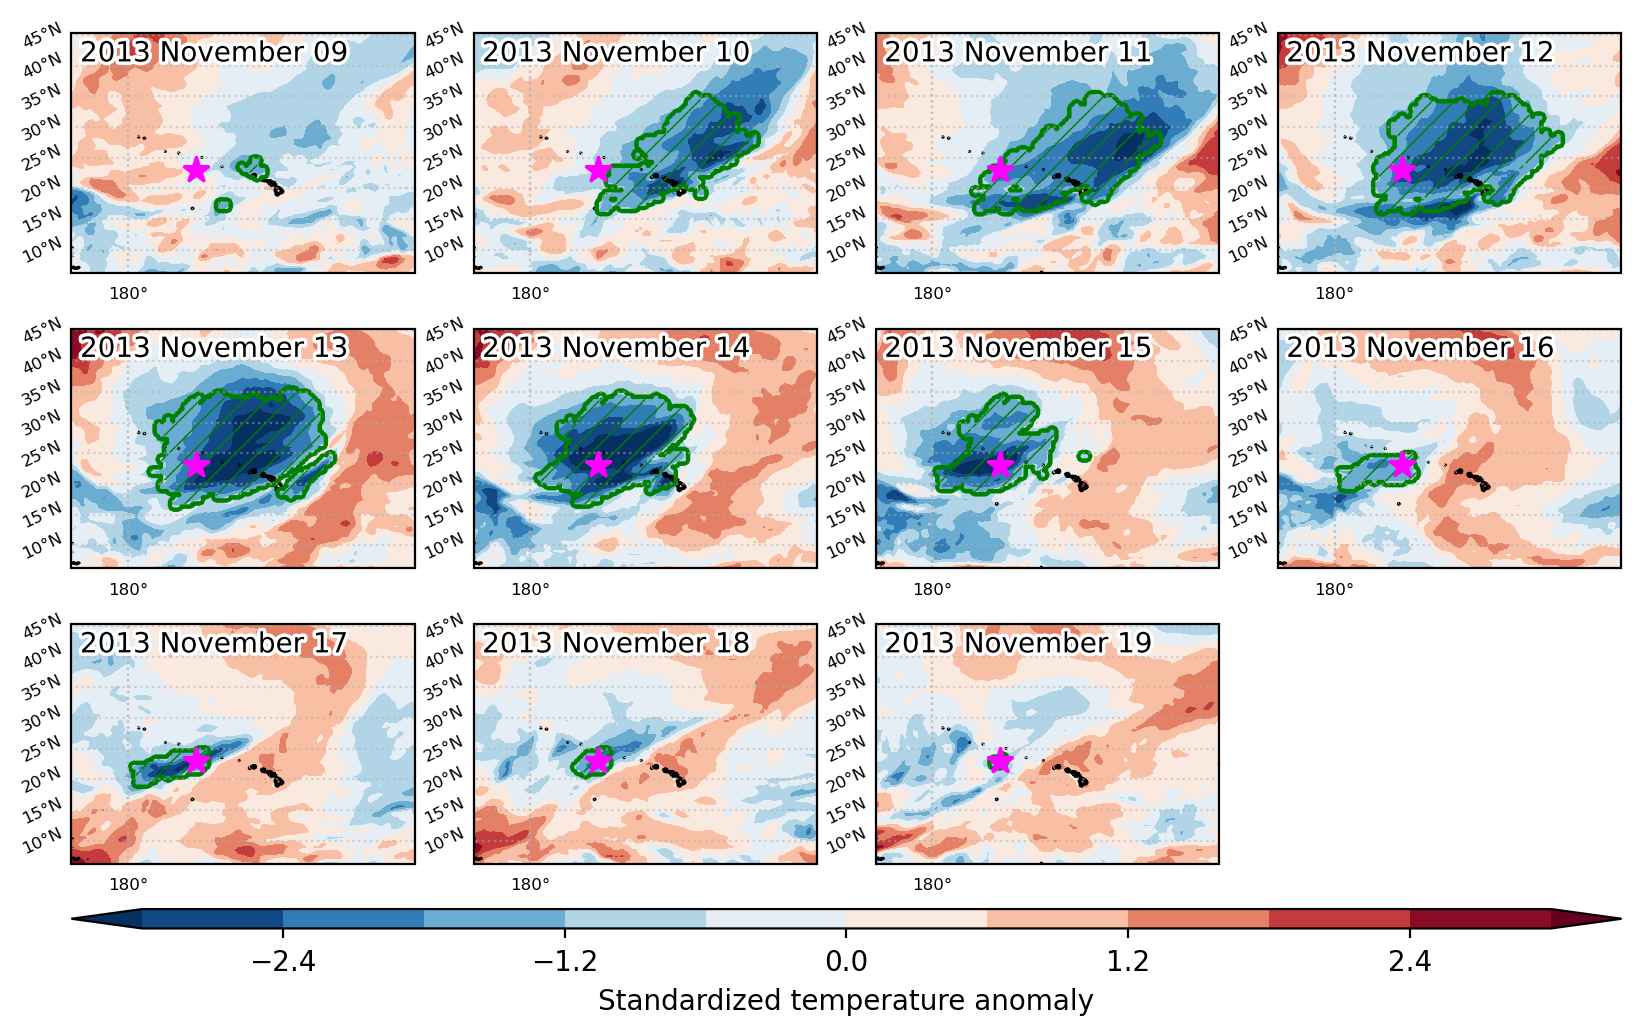
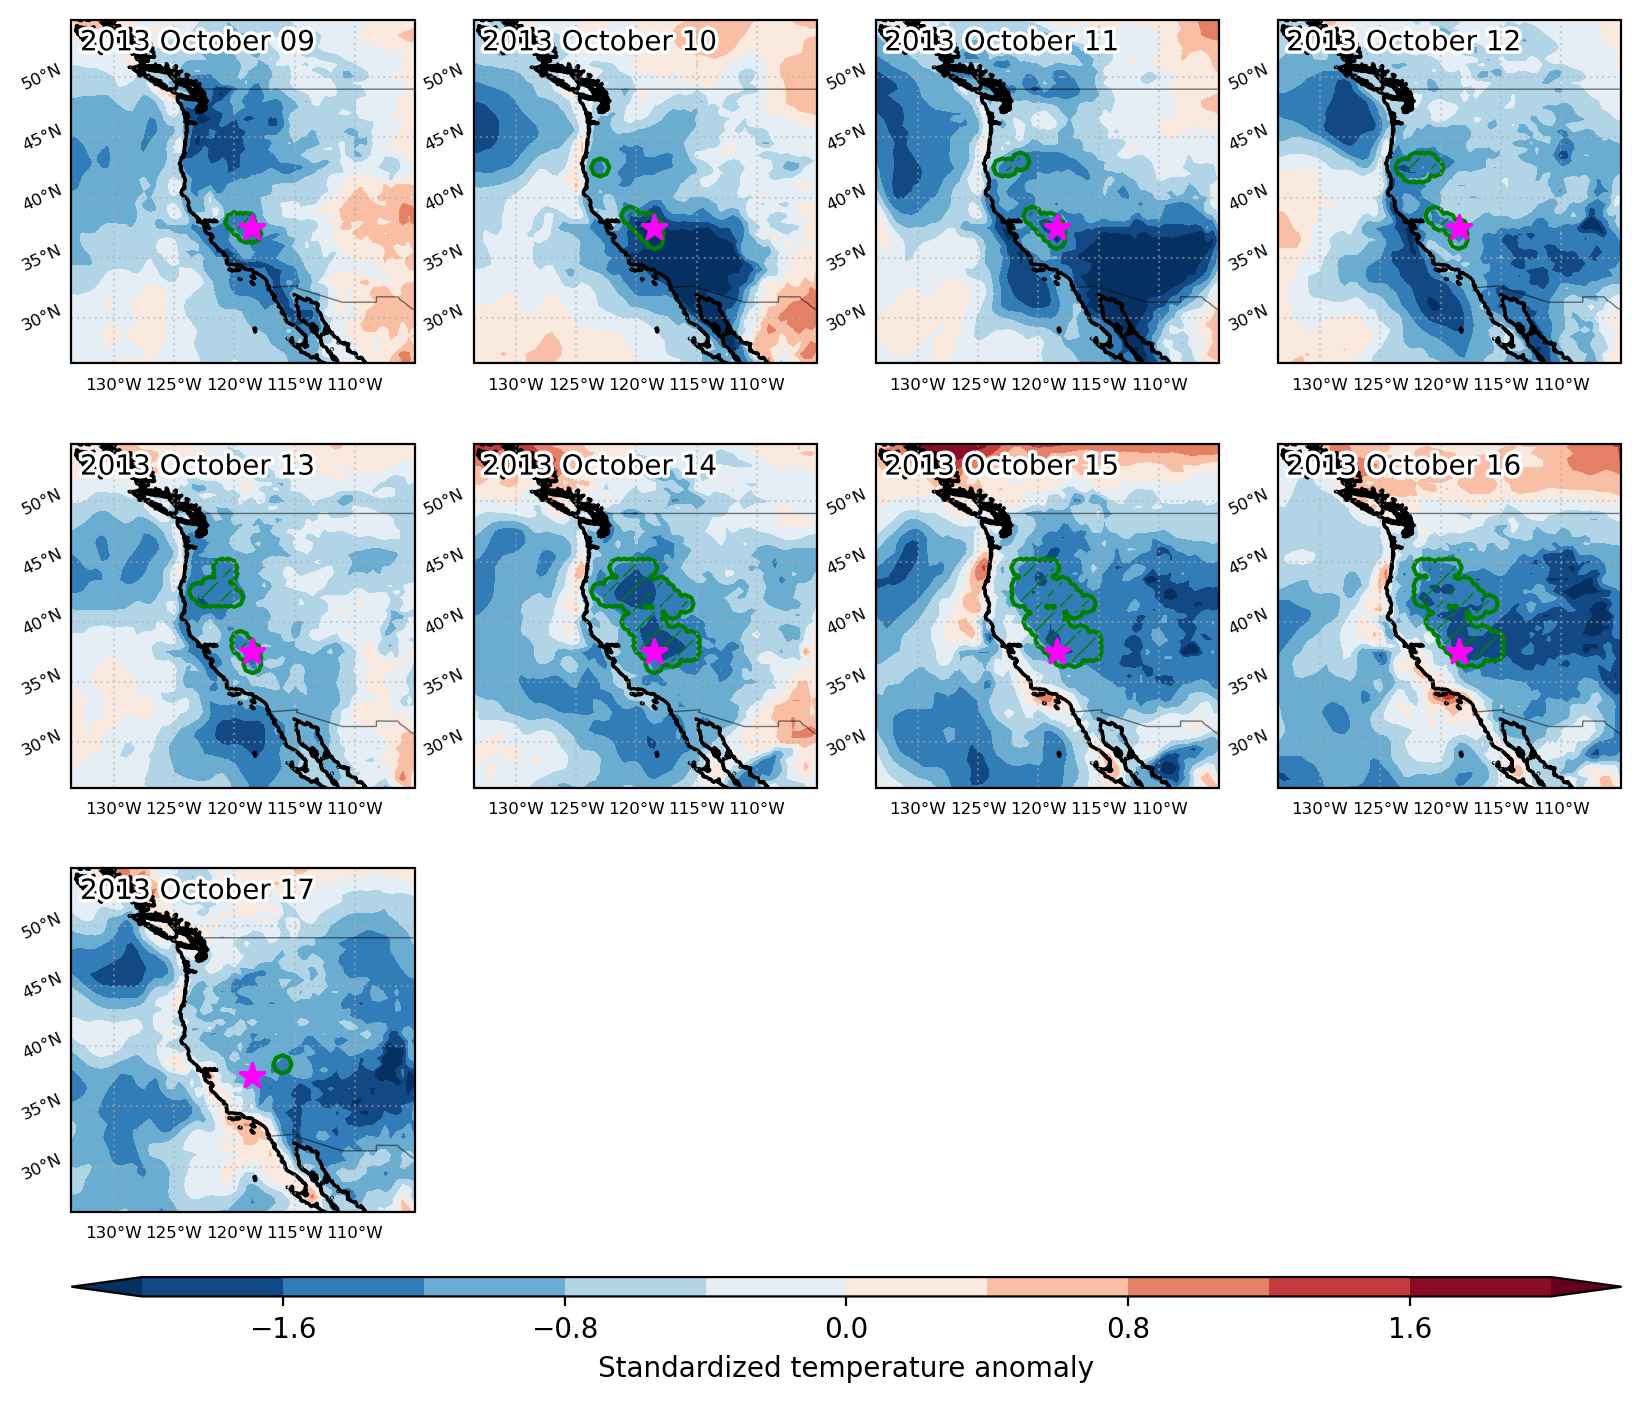
Fig. 3: Maps illustrating the evolution of standardized temperature anomalies during the event.

Event ID: Cold_spell_2013-Nov-16_to_2013-Dec-01_244.5_58.5
Cold spell occuring from November 09 2013 to November 19 2013 at 23.0°N 191.0°E

Download data: JSON

Event type: Cold spell

Countries affected (identified with ArcGIS Online; provided only for geographical reference):

  • United States

Duration: 11 days

Time span: November 09 2013 to November 19 2013

Statistics over entire affected area:

  • Mean temperature anomaly: -2.4 °C
  • Mean temperature: 20.7 °C
  • Minimum temperature anomaly: -6.0 °C
  • Minimum temperature: 12.5 °C

Event center: 23.0°N 191.0°E

Area affected: 4554095 km$^2$


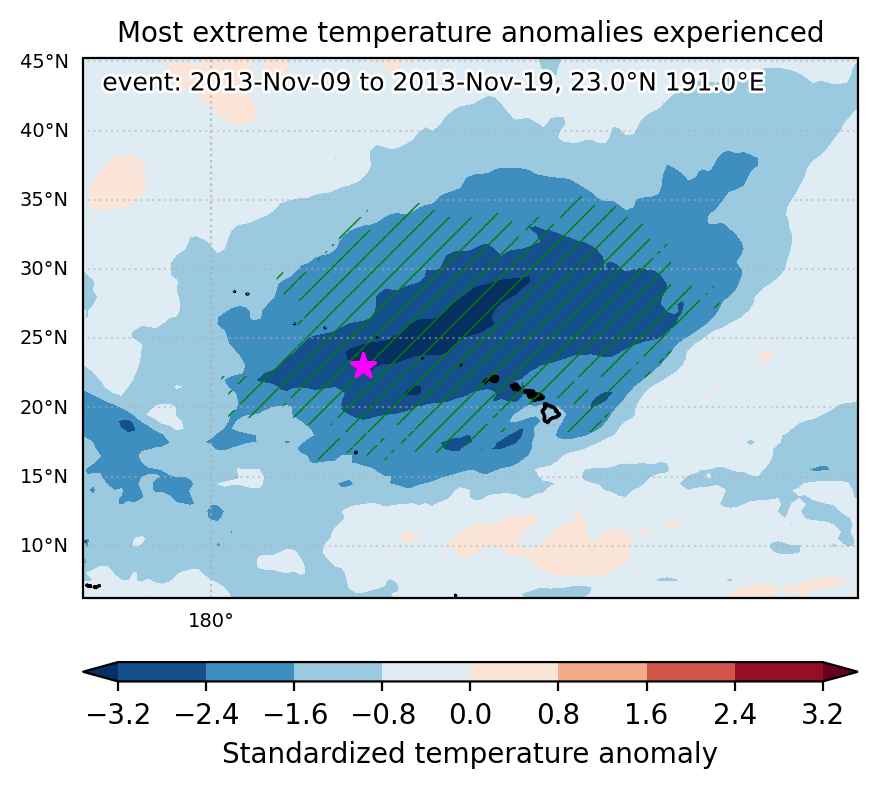
Fig. 1: Map of most extreme temperature anomalies (standardized) experienced during the event. The purple star indicates the center of the extreme event. Green hatching illustrates all areas under the effect of extremes at some time during the event.


Fig. 2: Evolution of temperature at the center of the event. The climatological percentile distribution is illustrated with color shadings.


Fig. 3: Maps illustrating the evolution of standardized temperature anomalies during the event.

Event ID: Cold_spell_2013-Nov-09_to_2013-Nov-19_191.0_23.0

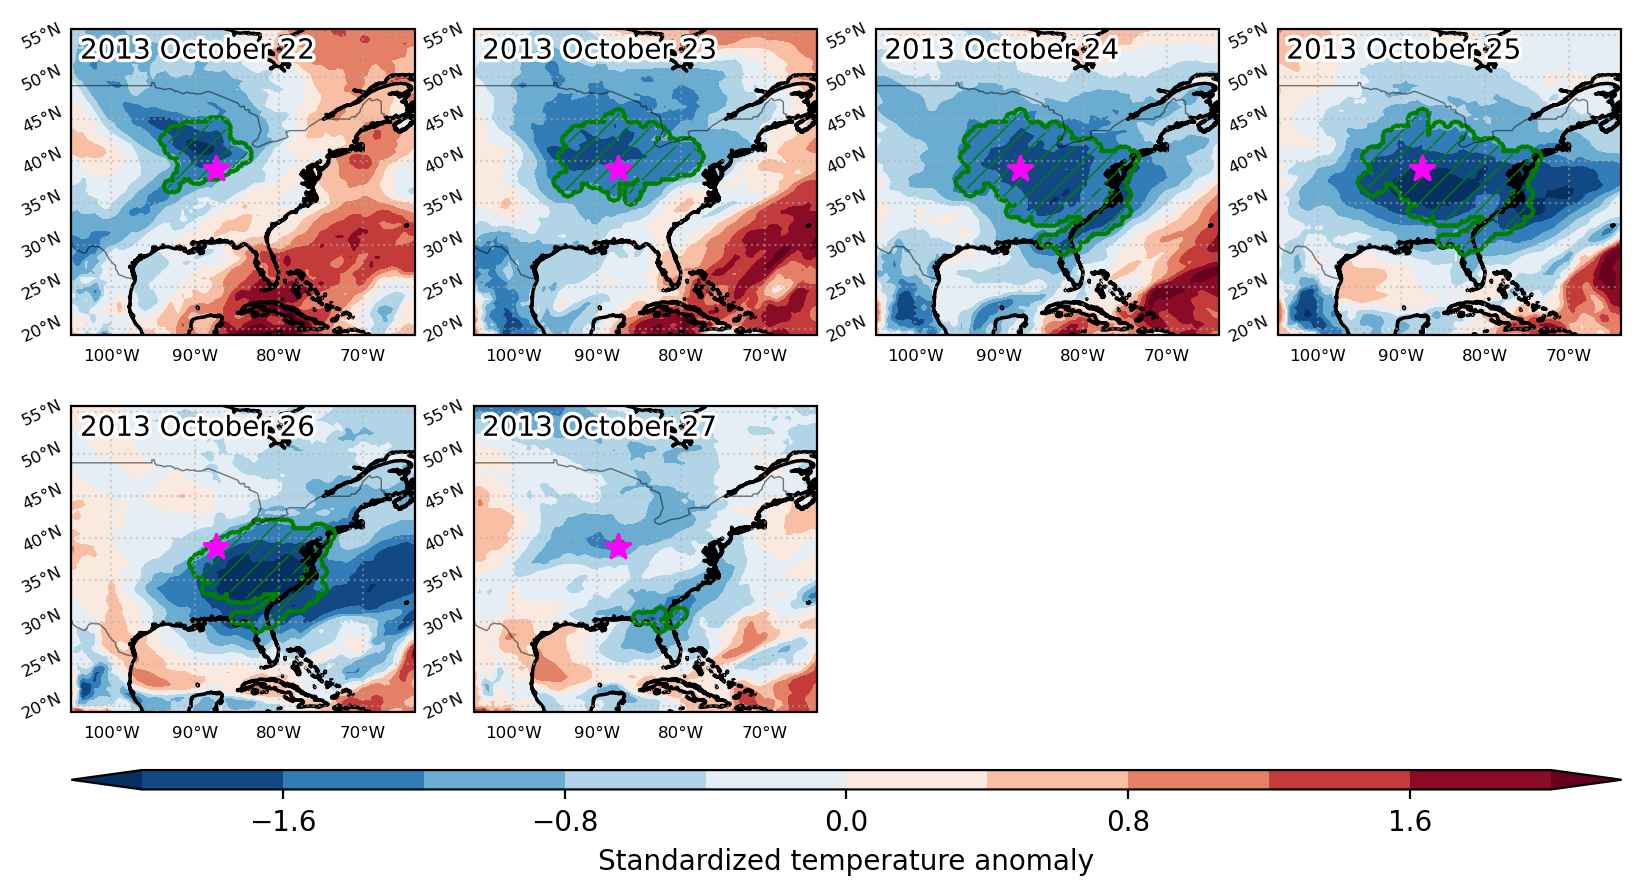
Cold spell occuring from October 22 2013 to October 27 2013 at 39.0°N 272.5°E

Download data: JSON

Event type: Cold spell

Countries affected (identified with ArcGIS Online; provided only for geographical reference):

  • Canada
  • United States

Duration: 6 days

Time span: October 22 2013 to October 27 2013

Statistics over entire affected area:

  • Mean temperature anomaly: -6.7 °C
  • Mean temperature: 5.9 °C
  • Minimum temperature anomaly: -10.5 °C
  • Minimum temperature: -1.5 °C

Event center: 39.0°N 272.5°E

Area affected: 1639867 km$^2$


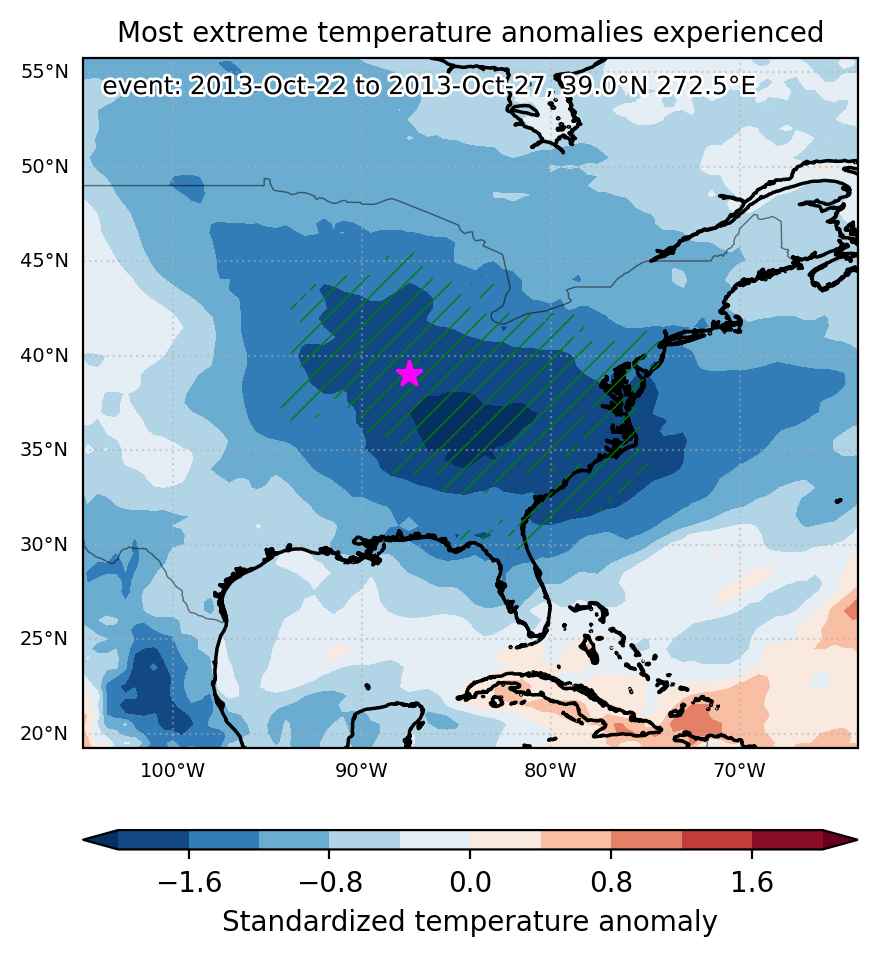
Fig. 1: Map of most extreme temperature anomalies (standardized) experienced during the event. The purple star indicates the center of the extreme event. Green hatching illustrates all areas under the effect of extremes at some time during the event.


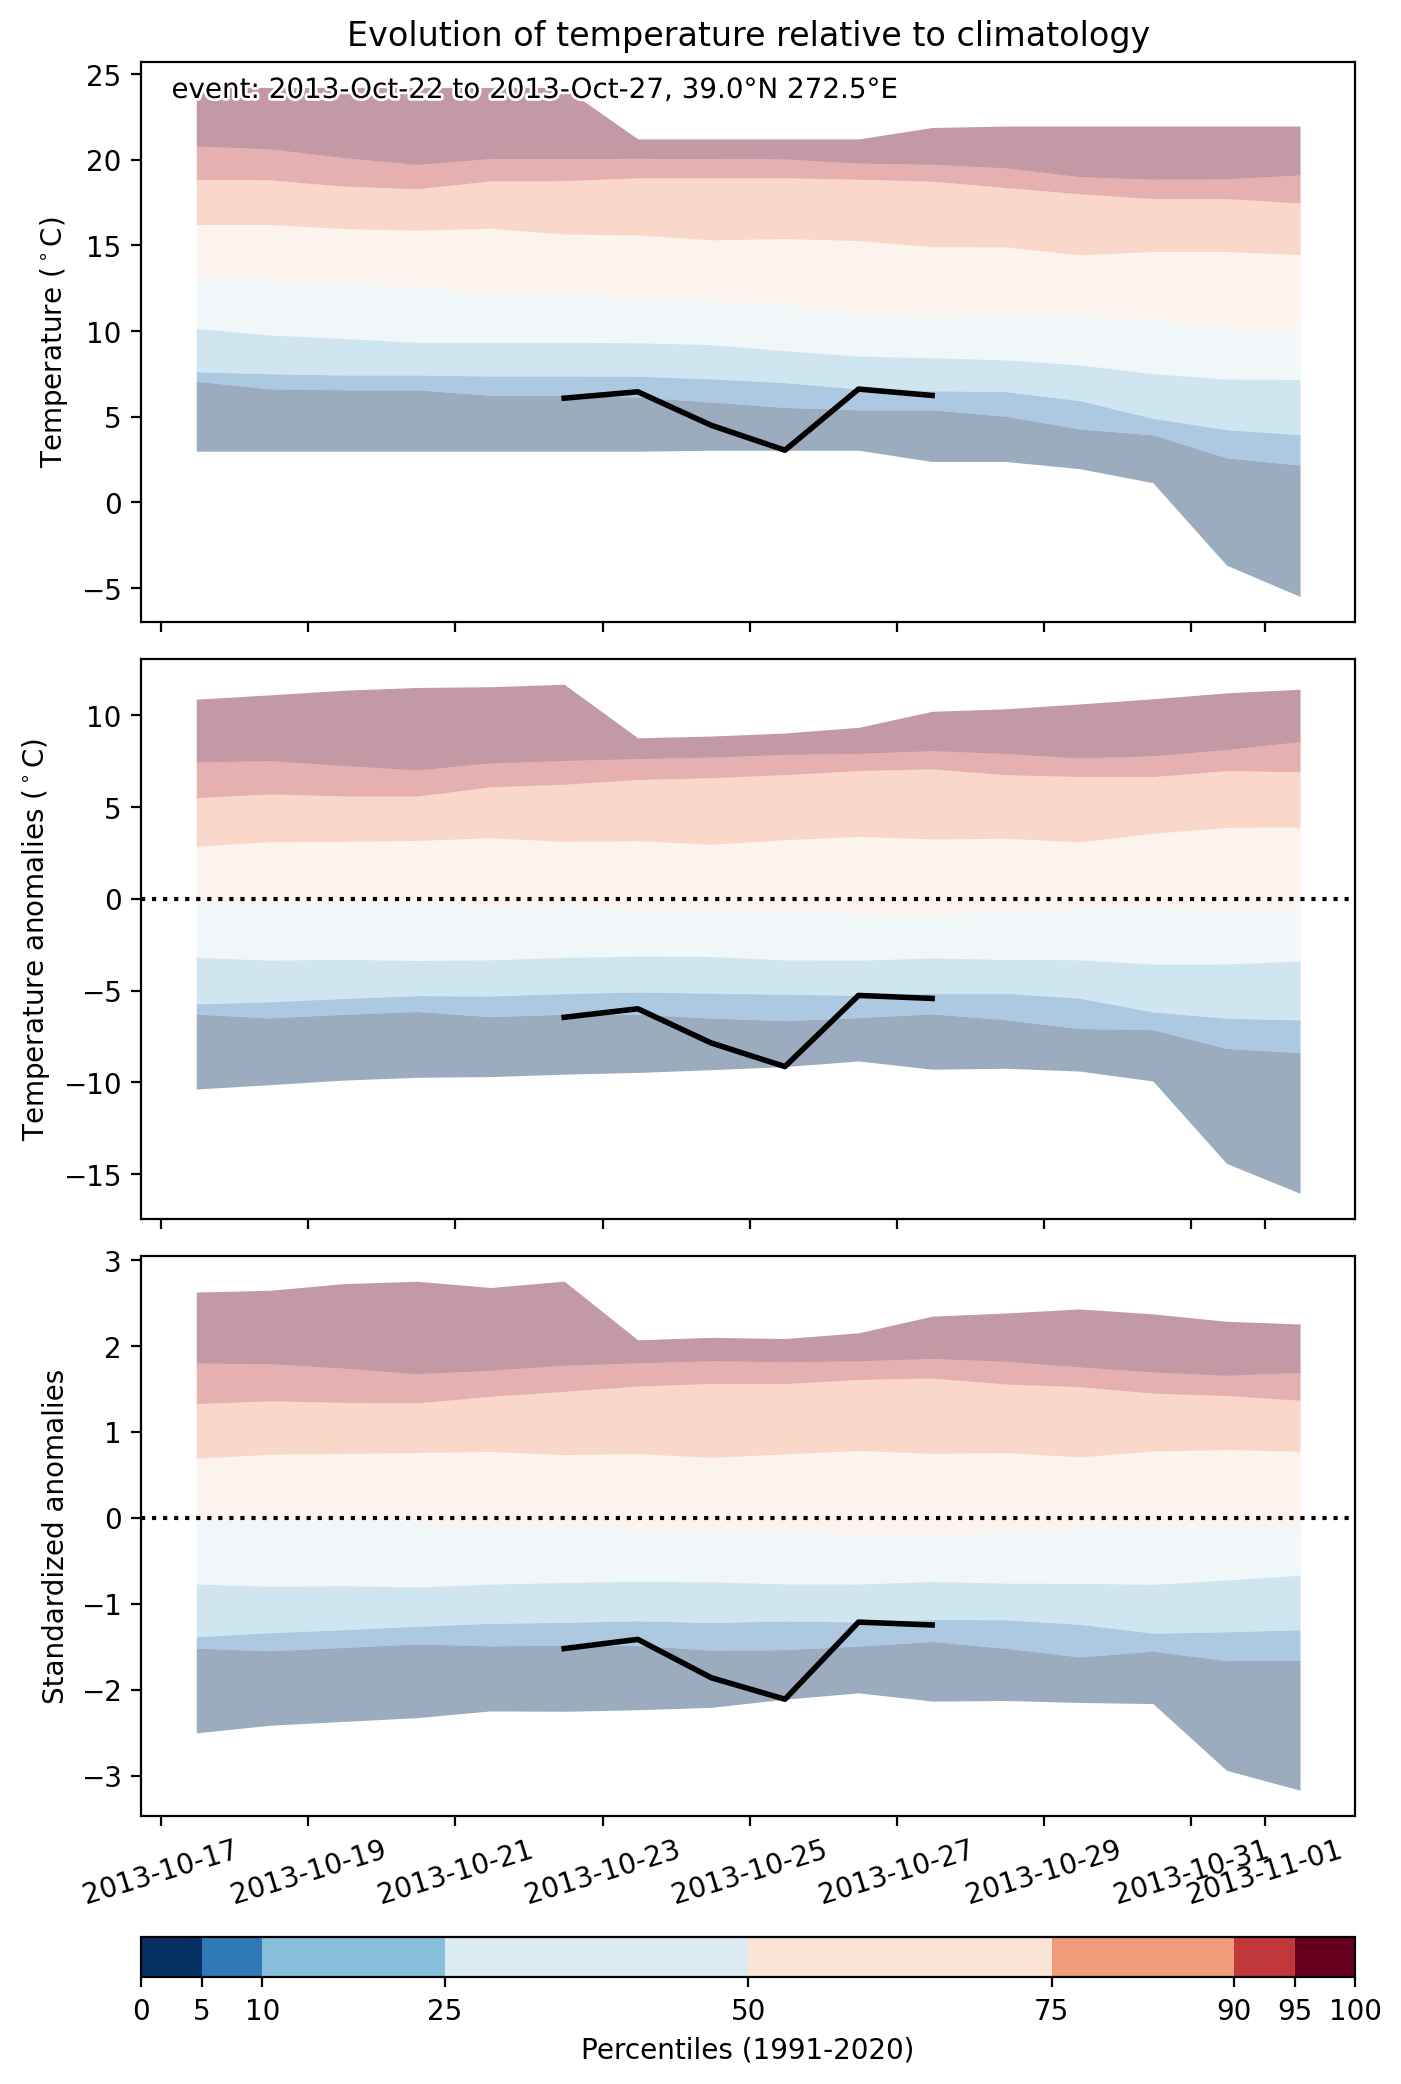
Fig. 2: Evolution of temperature at the center of the event. The climatological percentile distribution is illustrated with color shadings.


Fig. 3: Maps illustrating the evolution of standardized temperature anomalies during the event.

Event ID: Cold_spell_2013-Oct-22_to_2013-Oct-27_272.5_39.0

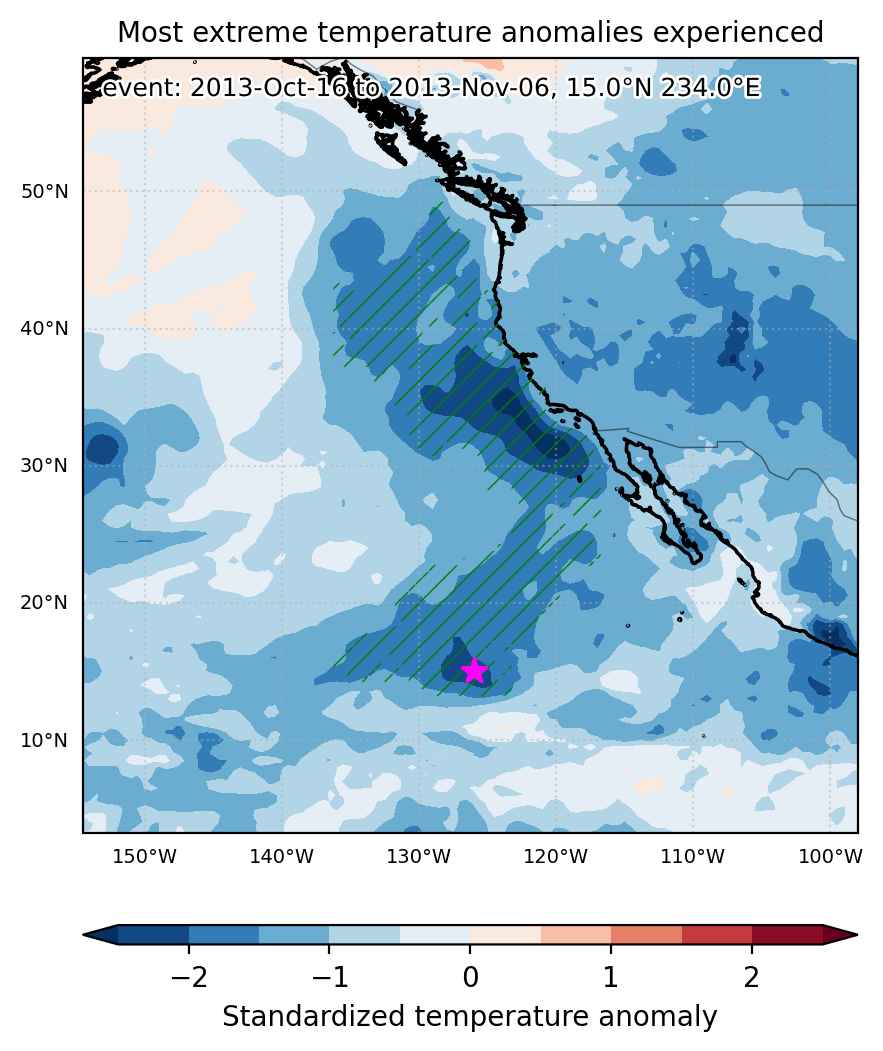
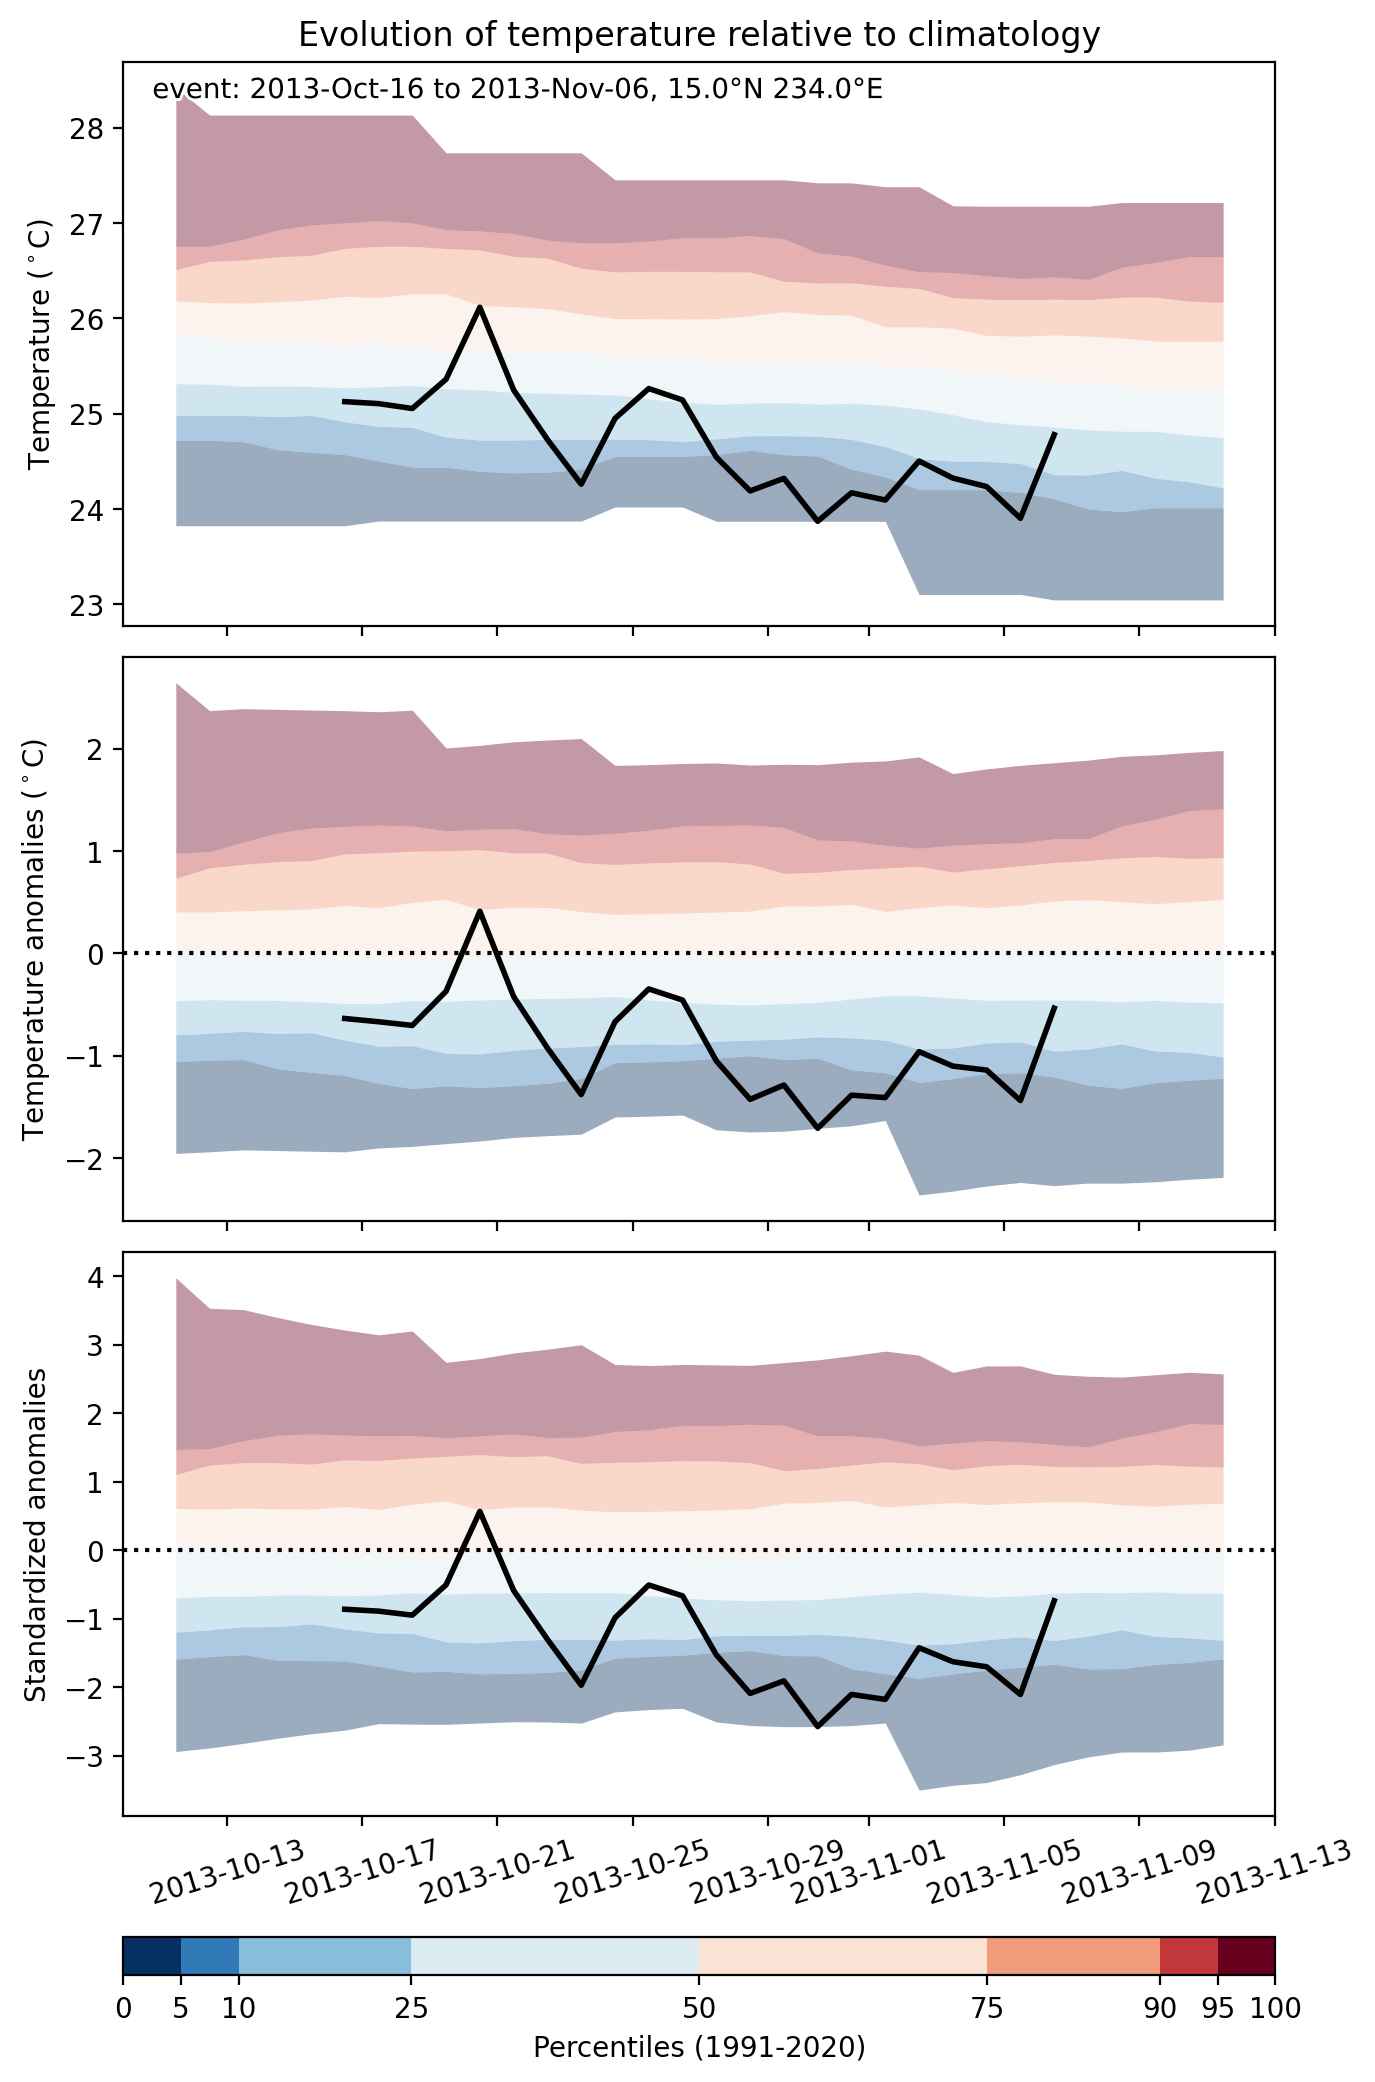
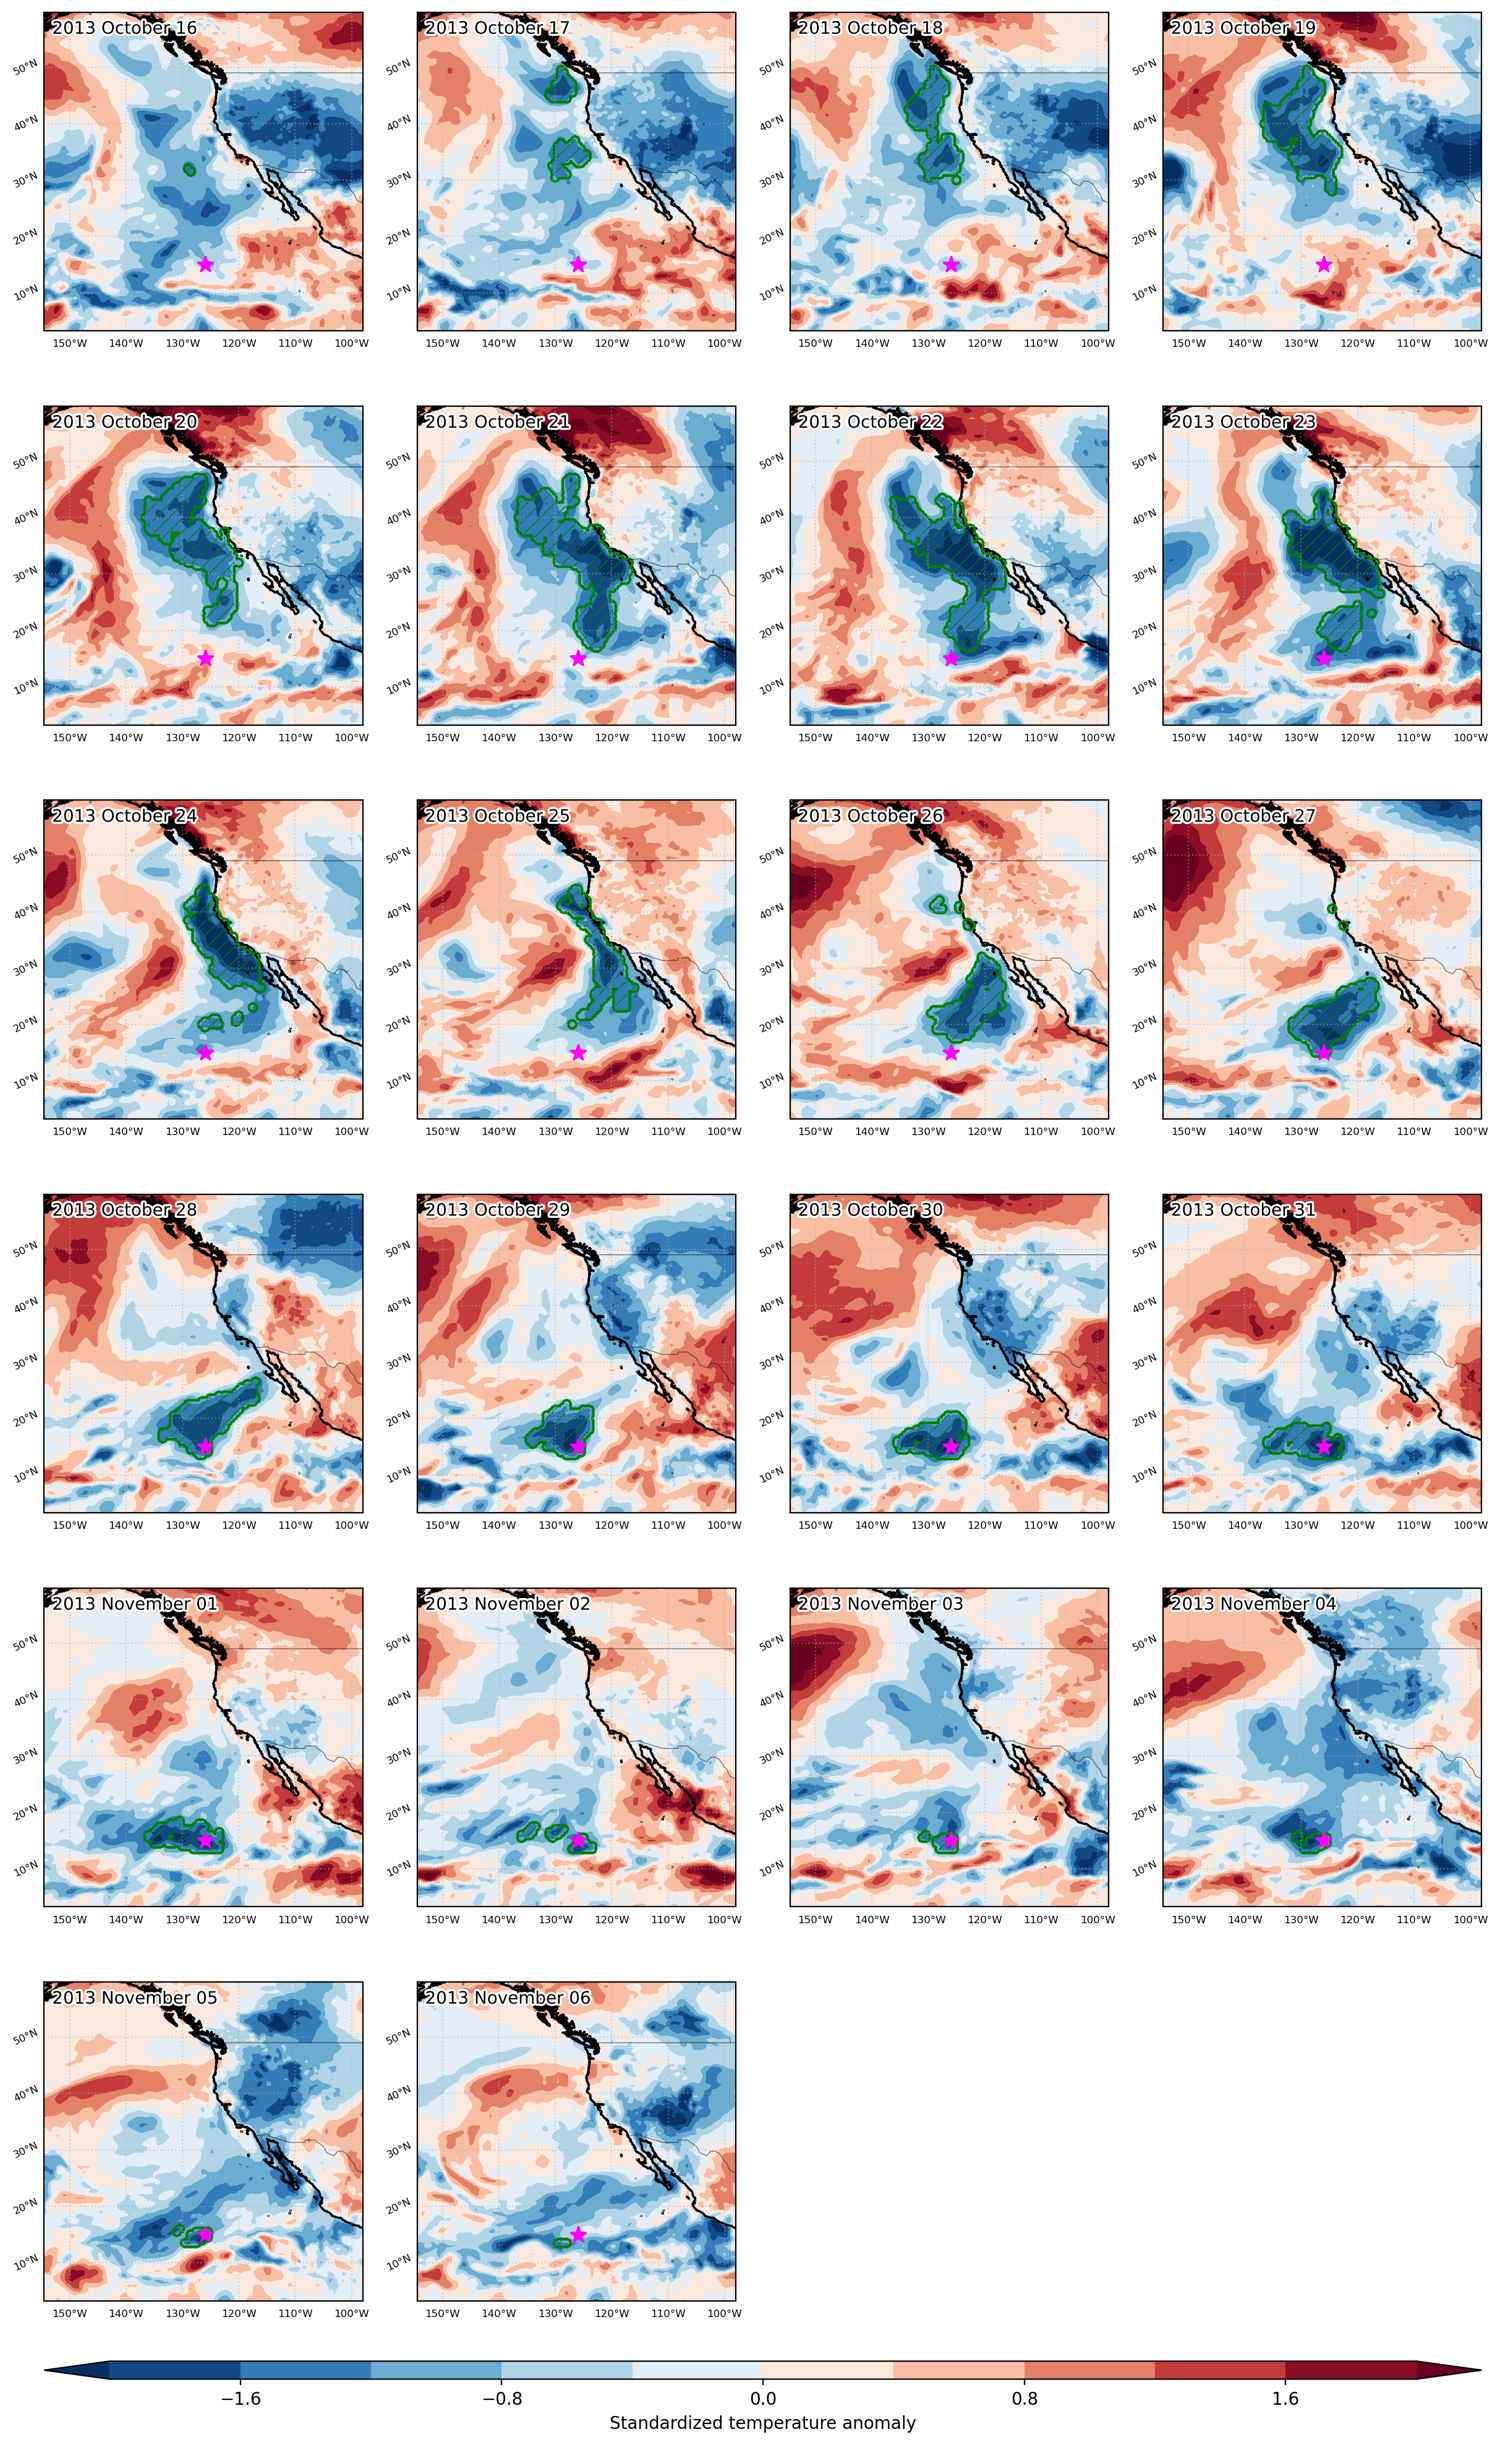
Cold spell occuring from October 16 2013 to November 06 2013 at 15.0°N 234.0°E

Download data: JSON

Event type: Cold spell

Countries affected (identified with ArcGIS Online; provided only for geographical reference):

  • United States

Duration: 22 days

Time span: October 16 2013 to November 06 2013

Statistics over entire affected area:

  • Mean temperature anomaly: -1.9 °C
  • Mean temperature: 17.6 °C
  • Minimum temperature anomaly: -3.7 °C
  • Minimum temperature: 9.5 °C

Event center: 15.0°N 234.0°E

Area affected: 3271683 km$^2$


Fig. 1: Map of most extreme temperature anomalies (standardized) experienced during the event. The purple star indicates the center of the extreme event. Green hatching illustrates all areas under the effect of extremes at some time during the event.


Fig. 2: Evolution of temperature at the center of the event. The climatological percentile distribution is illustrated with color shadings.


Fig. 3: Maps illustrating the evolution of standardized temperature anomalies during the event.

Event ID: Cold_spell_2013-Oct-16_to_2013-Nov-06_234.0_15.0

Cold spell occuring from October 15 2013 to October 22 2013 at 38.0°N 253.0°E

Download data: JSON

Event type: Cold spell

Countries affected (identified with ArcGIS Online; provided only for geographical reference):

  • United States

Duration: 8 days

Time span: October 15 2013 to October 22 2013

Statistics over entire affected area:

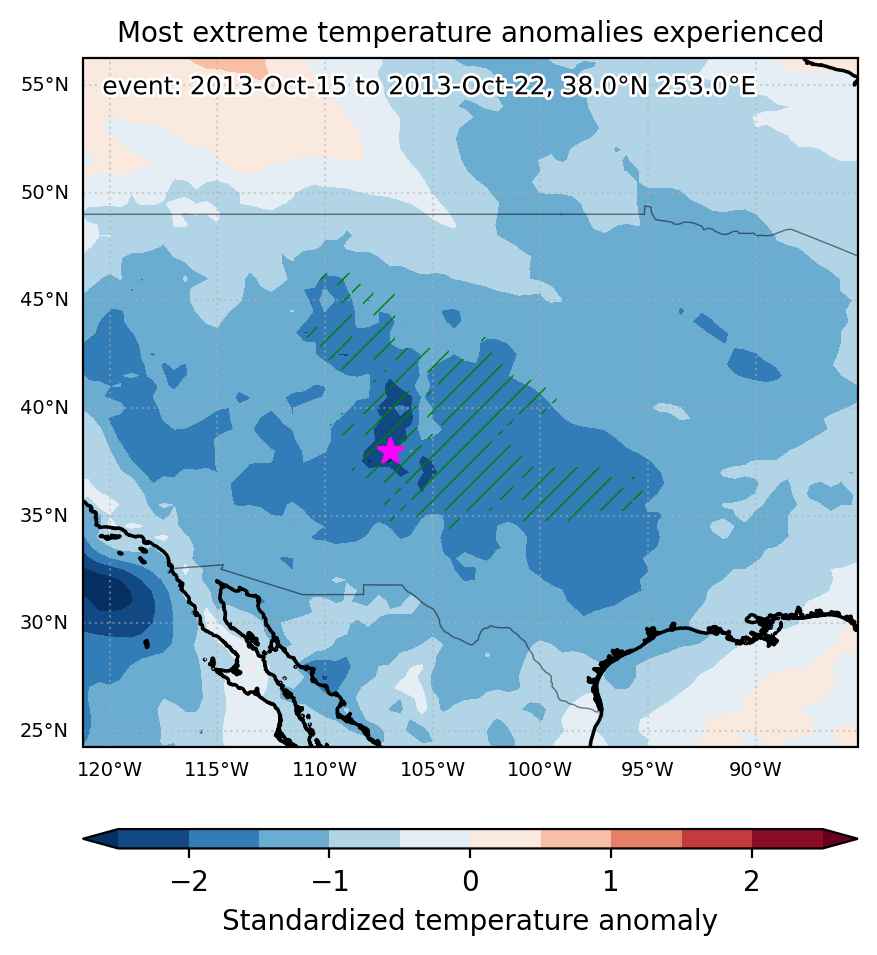
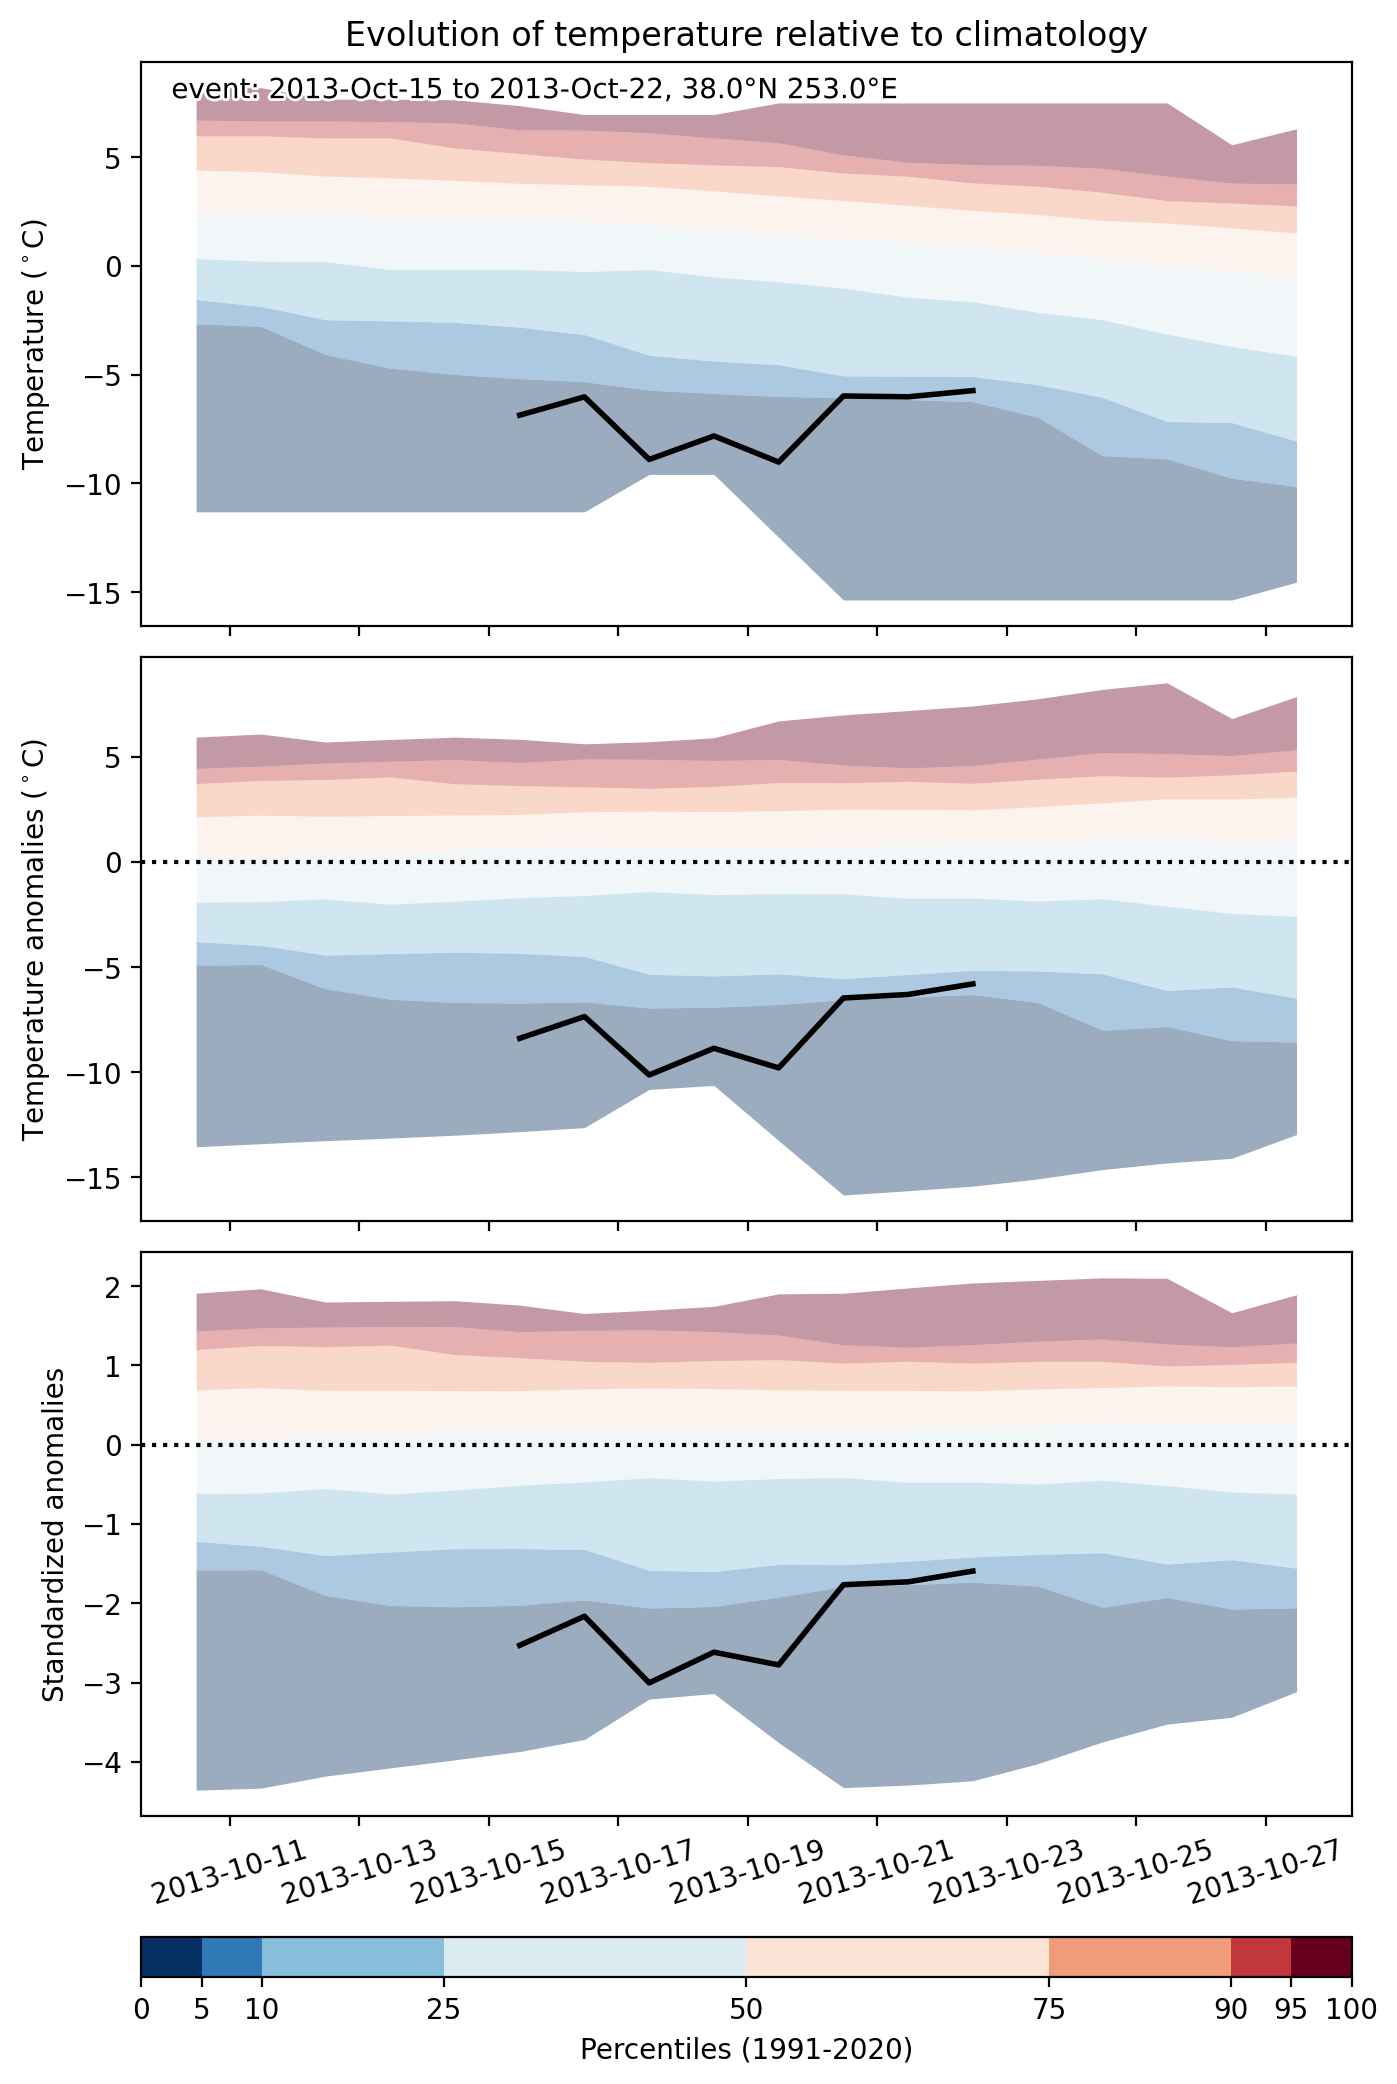
  • Mean temperature anomaly: -6.8 °C
  • Mean temperature: 2.9 °C
  • Minimum temperature anomaly: -11.6 °C
  • Minimum temperature: -10.1 °C

Event center: 38.0°N 253.0°E

Area affected: 640477 km$^2$


Fig. 1: Map of most extreme temperature anomalies (standardized) experienced during the event. The purple star indicates the center of the extreme event. Green hatching illustrates all areas under the effect of extremes at some time during the event.


Fig. 2: Evolution of temperature at the center of the event. The climatological percentile distribution is illustrated with color shadings.


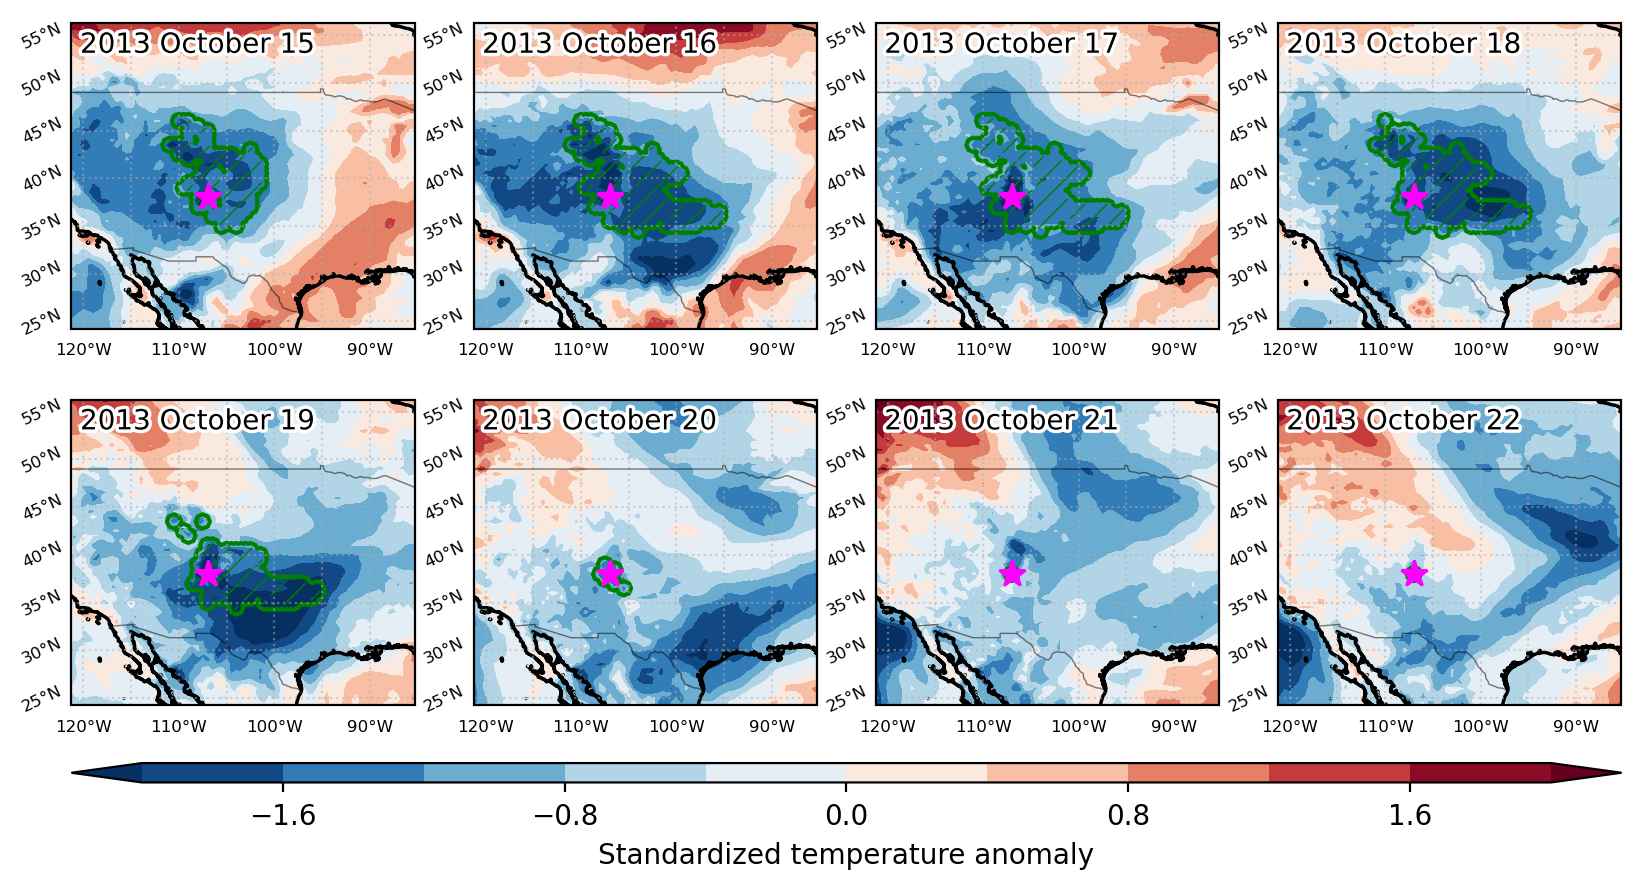
Fig. 3: Maps illustrating the evolution of standardized temperature anomalies during the event.

Event ID: Cold_spell_2013-Oct-15_to_2013-Oct-22_253.0_38.0

Cold spell occuring from October 09 2013 to October 17 2013 at 37.5°N 241.5°E

Download data: JSON

Event type: Cold spell

Countries affected (identified with ArcGIS Online; provided only for geographical reference):

  • United States

Duration: 9 days

Time span: October 09 2013 to October 17 2013

Statistics over entire affected area:

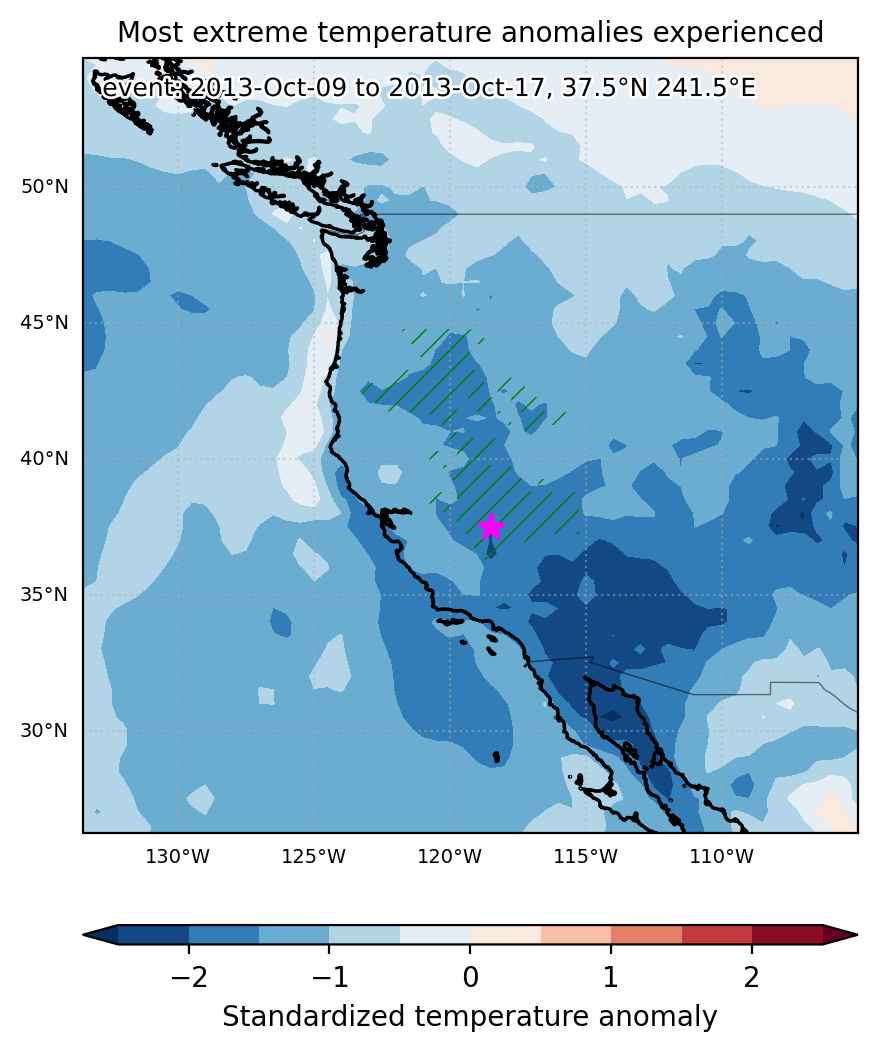
  • Mean temperature anomaly: -5.9 °C
  • Mean temperature: 4.6 °C
  • Minimum temperature anomaly: -10.5 °C
  • Minimum temperature: -3.8 °C

Event center: 37.5°N 241.5°E

Area affected: 237004 km$^2$


Fig. 1: Map of most extreme temperature anomalies (standardized) experienced during the event. The purple star indicates the center of the extreme event. Green hatching illustrates all areas under the effect of extremes at some time during the event.


Fig. 2: Evolution of temperature at the center of the event. The climatological percentile distribution is illustrated with color shadings.


Fig. 3: Maps illustrating the evolution of standardized temperature anomalies during the event.

Event ID: Cold_spell_2013-Oct-09_to_2013-Oct-17_241.5_37.5

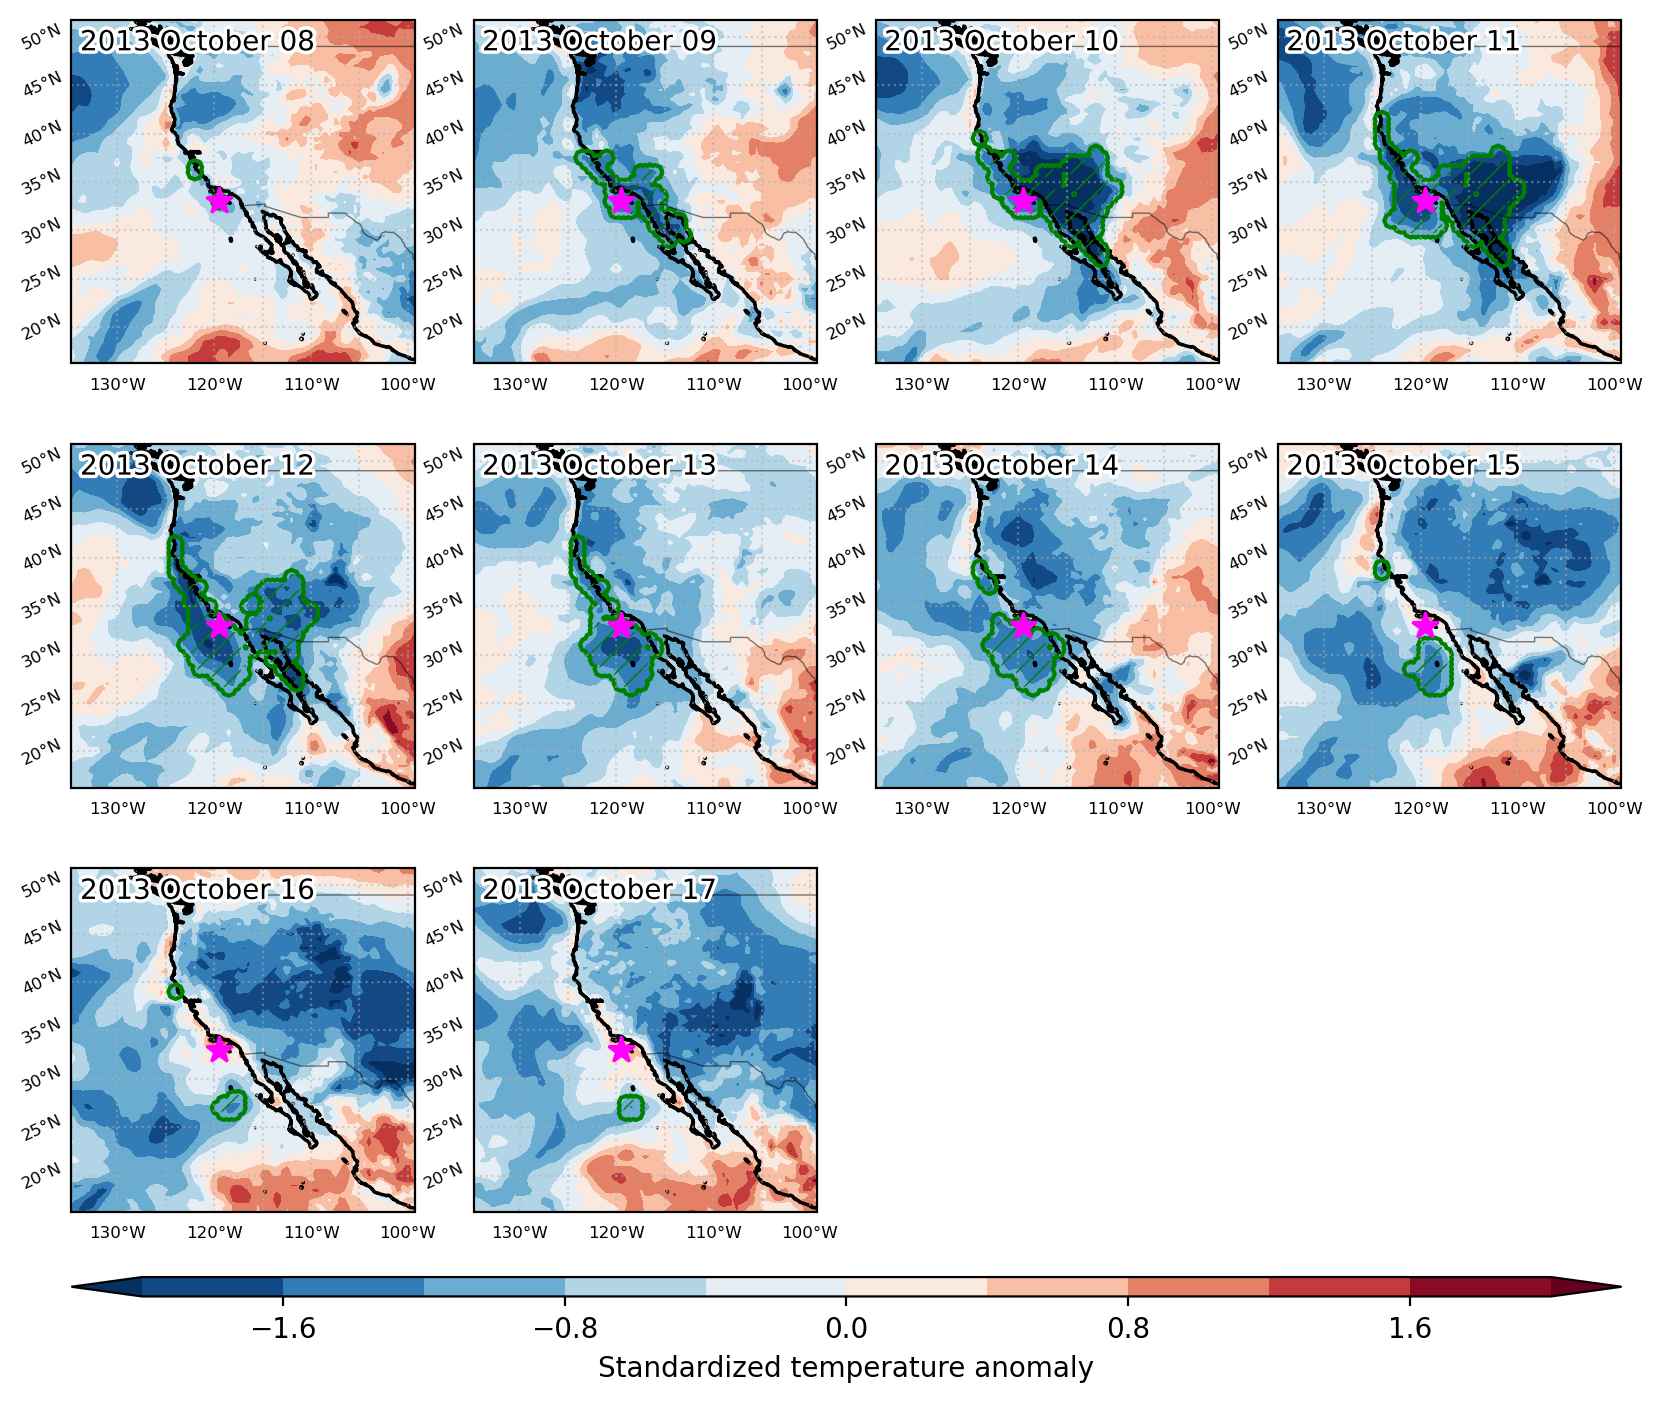
Cold spell occuring from October 08 2013 to October 17 2013 at 33.0°N 240.5°E

Download data: JSON

Event type: Cold spell

Countries affected (identified with ArcGIS Online; provided only for geographical reference):

  • Mexico
  • United States

Duration: 10 days

Time span: October 08 2013 to October 17 2013

Statistics over entire affected area:

  • Mean temperature anomaly: -3.7 °C
  • Mean temperature: 15.7 °C
  • Minimum temperature anomaly: -10.1 °C
  • Minimum temperature: 0.7 °C

Event center: 33.0°N 240.5°E

Area affected: 903801 km$^2$


Fig. 1: Map of most extreme temperature anomalies (standardized) experienced during the event. The purple star indicates the center of the extreme event. Green hatching illustrates all areas under the effect of extremes at some time during the event.


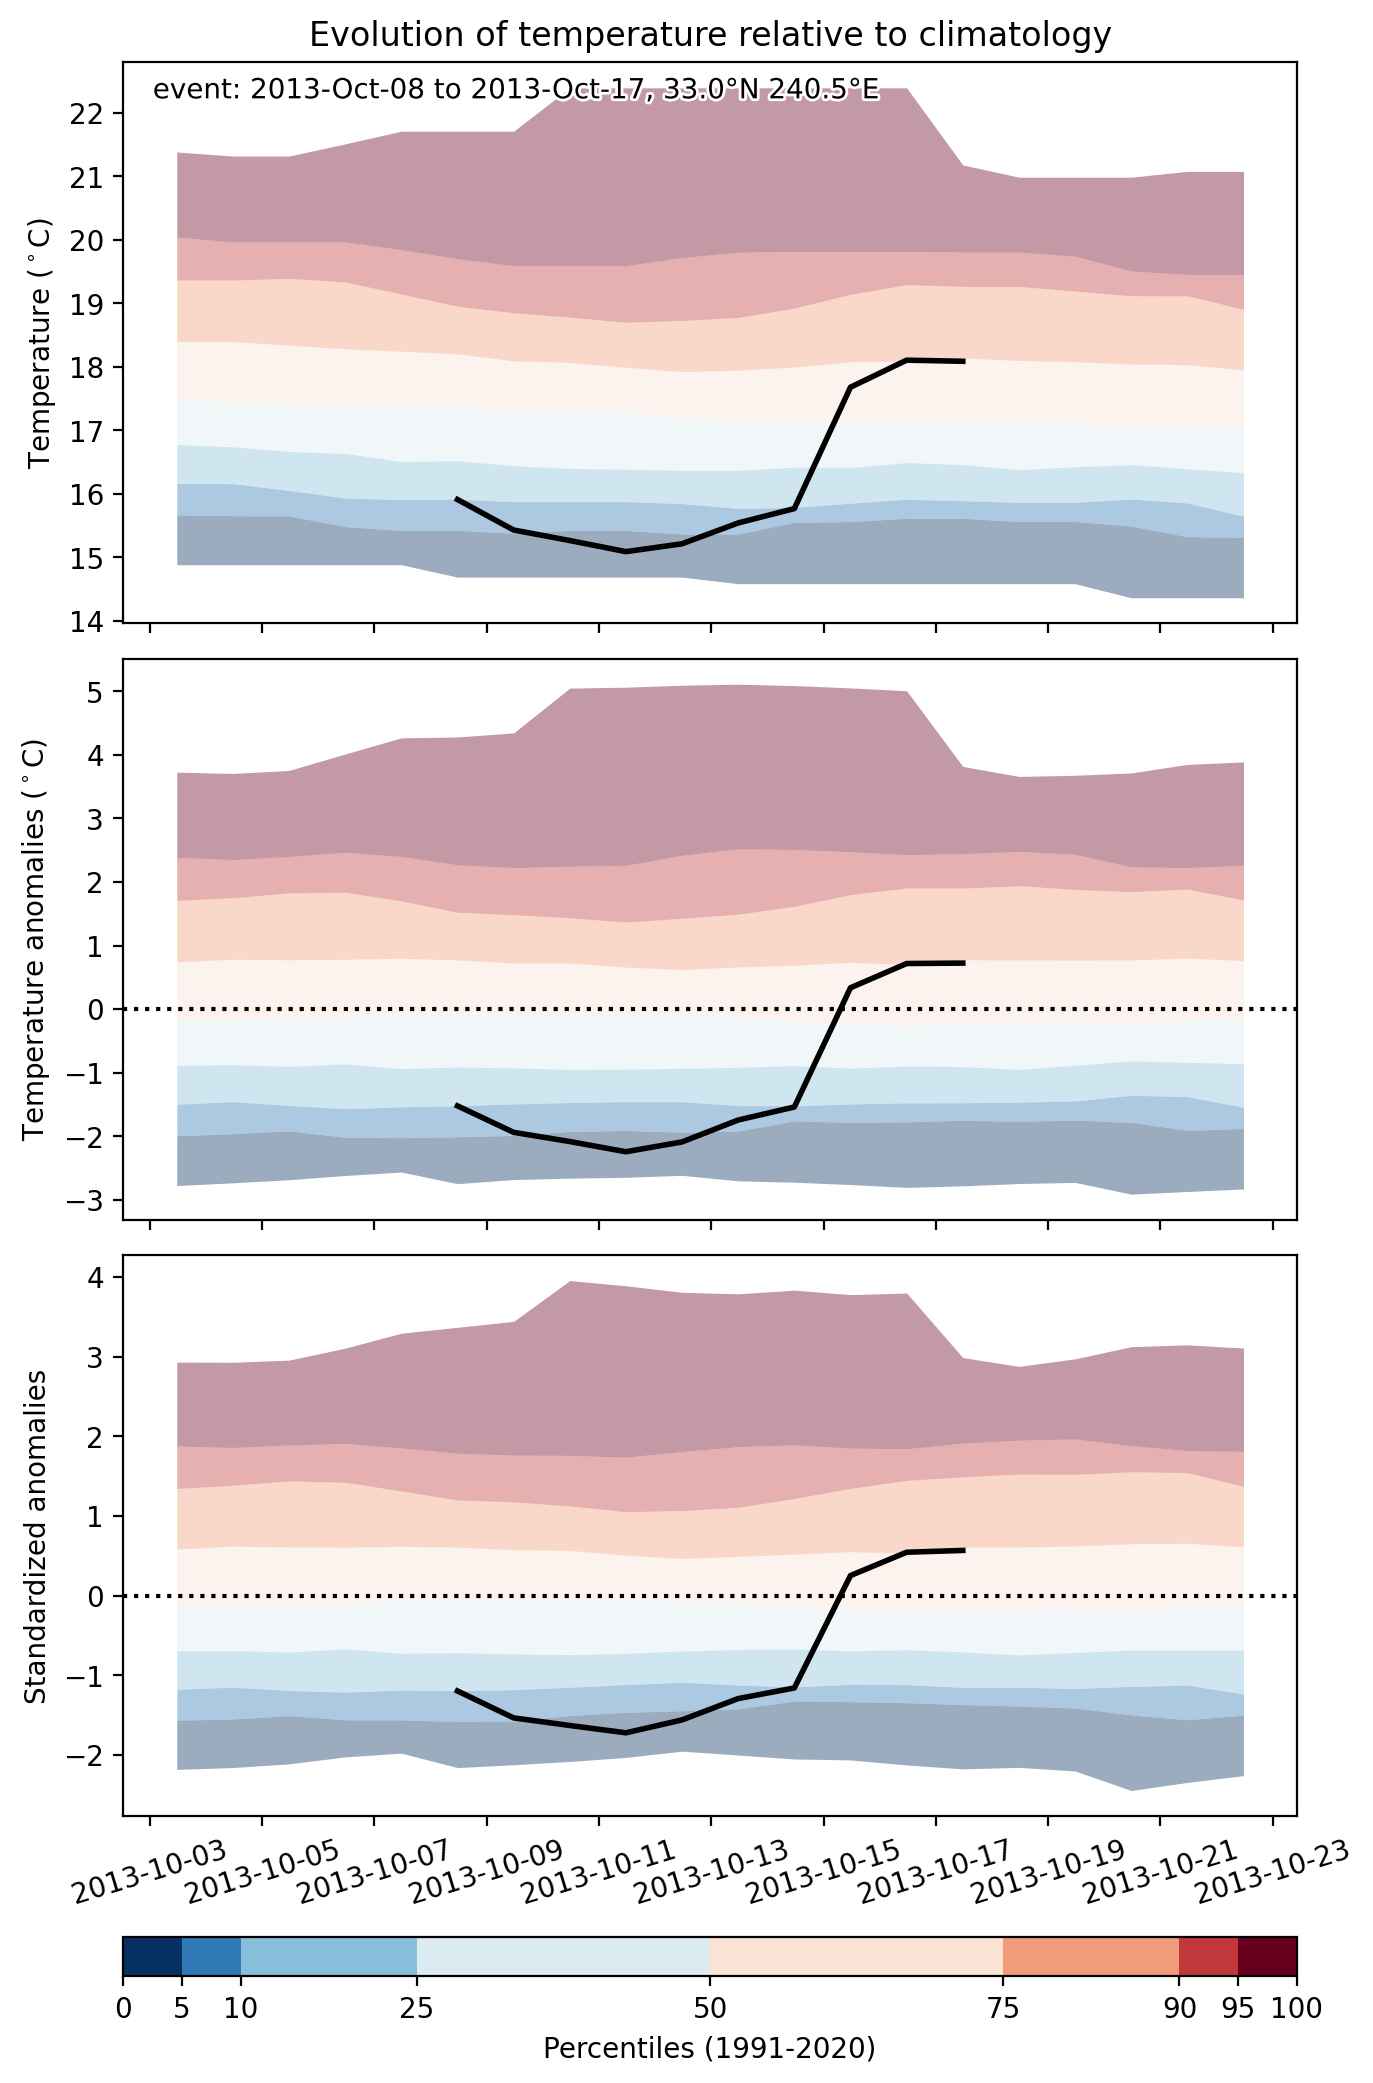
Fig. 2: Evolution of temperature at the center of the event. The climatological percentile distribution is illustrated with color shadings.


Fig. 3: Maps illustrating the evolution of standardized temperature anomalies during the event.

Event ID: Cold_spell_2013-Oct-08_to_2013-Oct-17_240.5_33.0

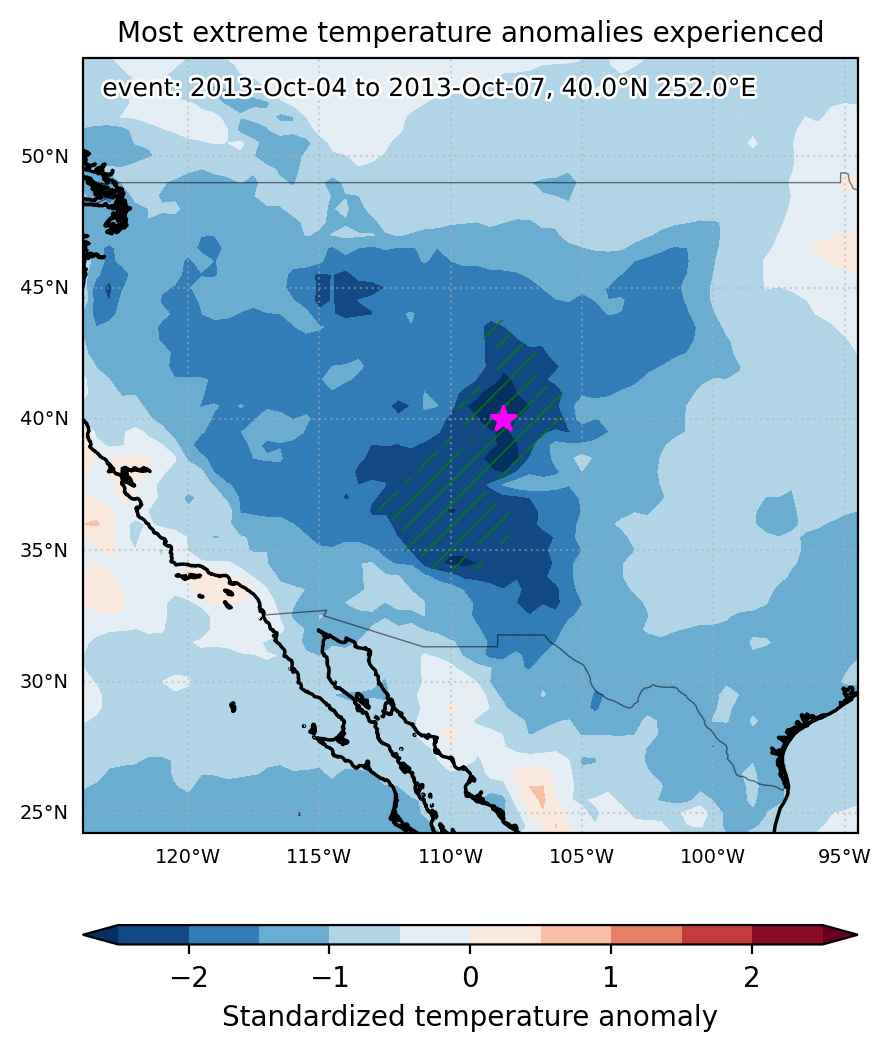
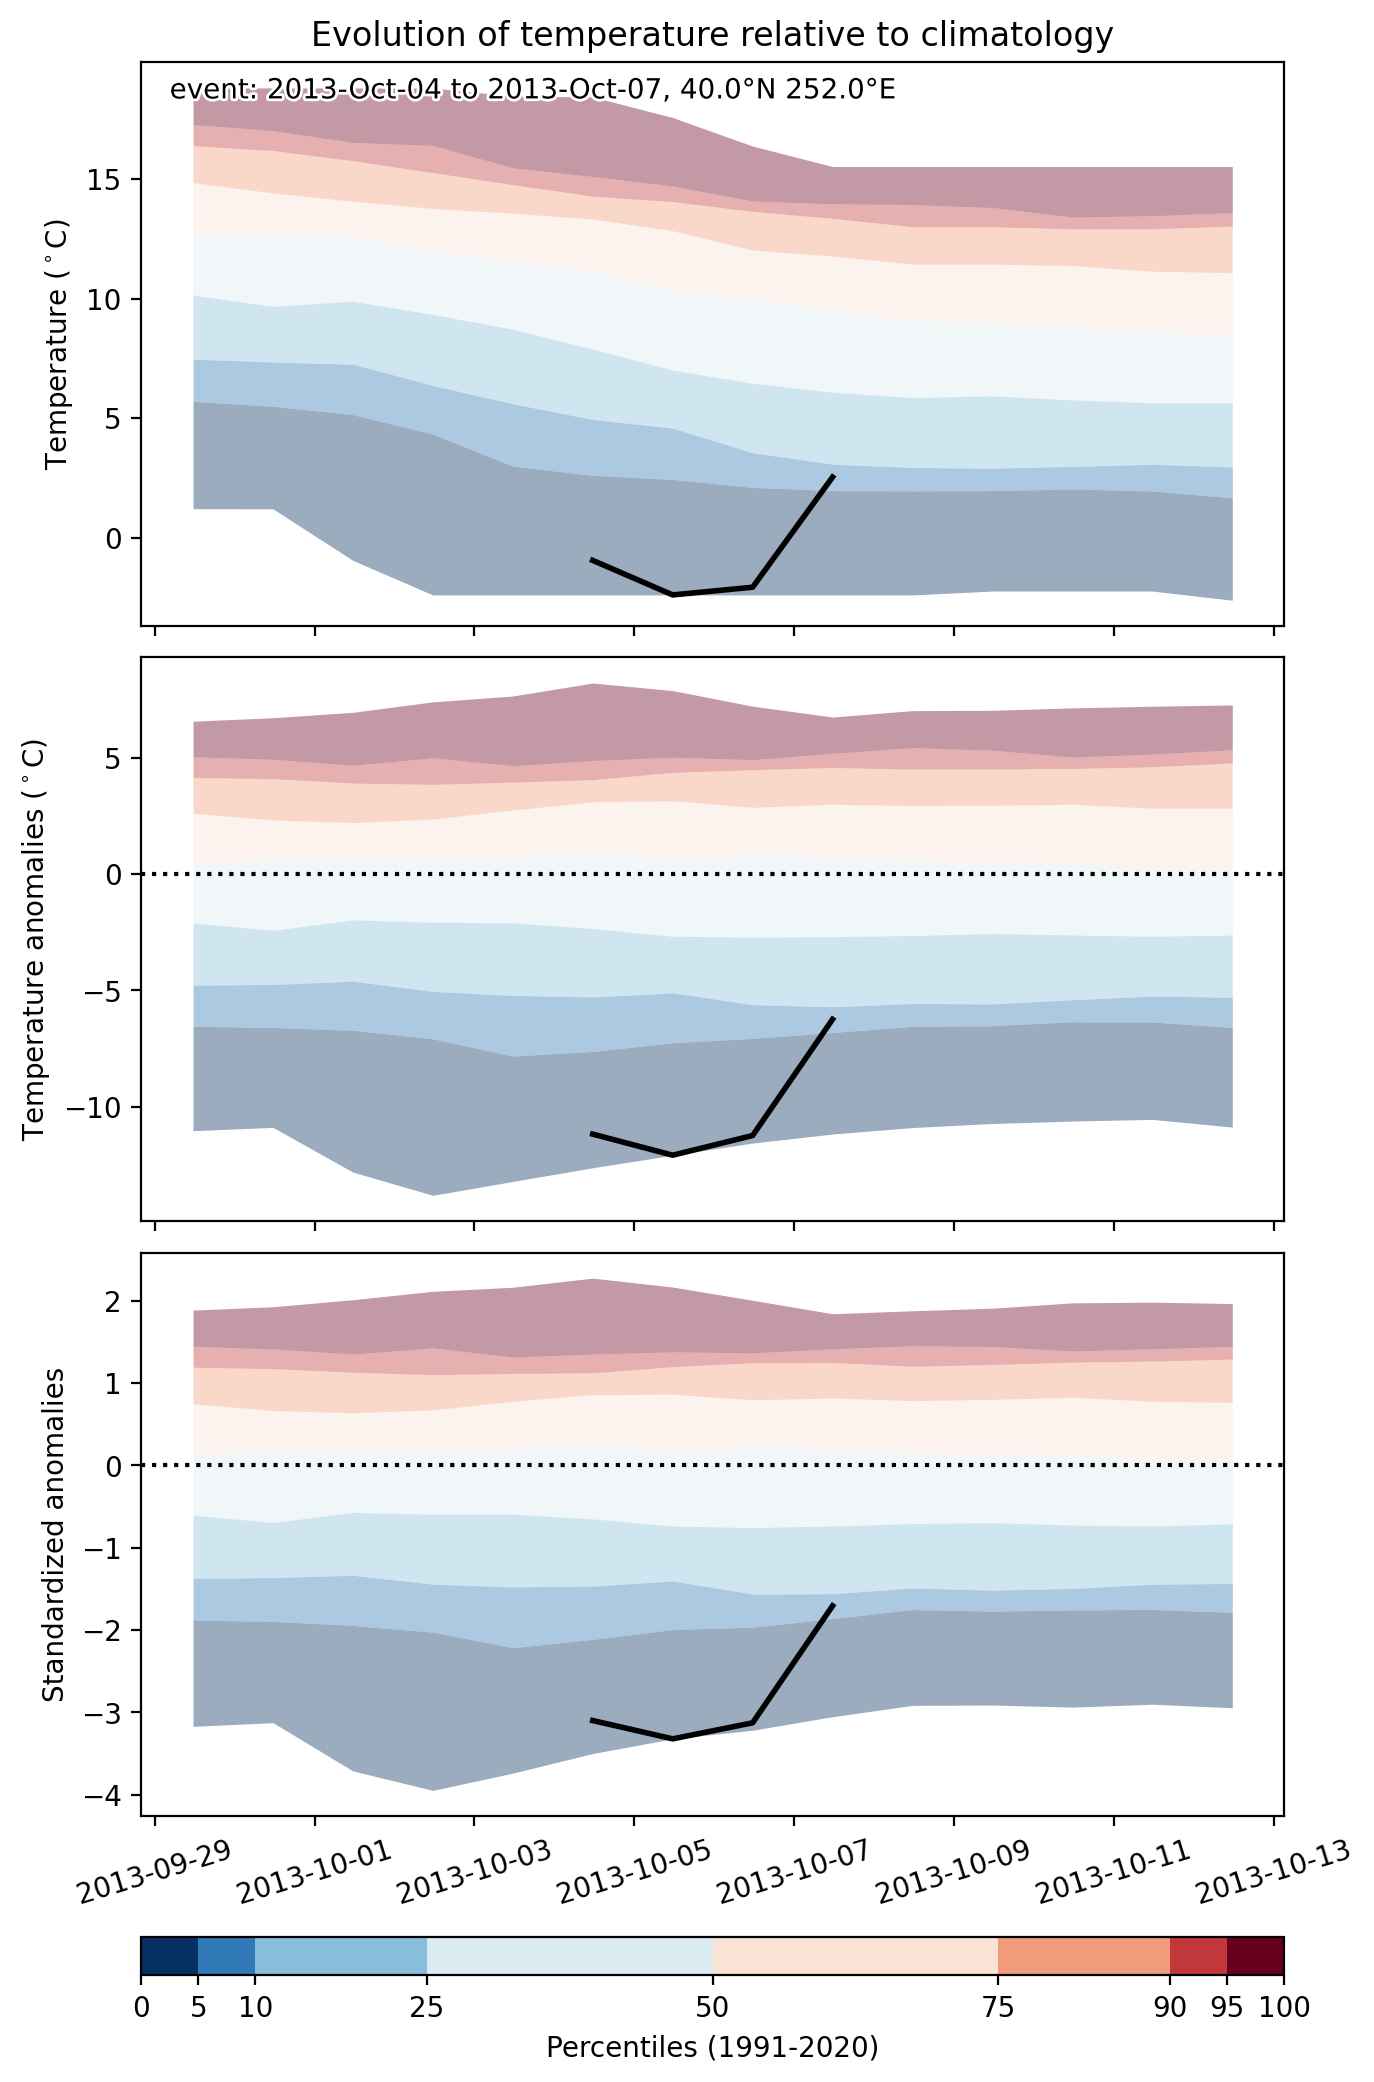
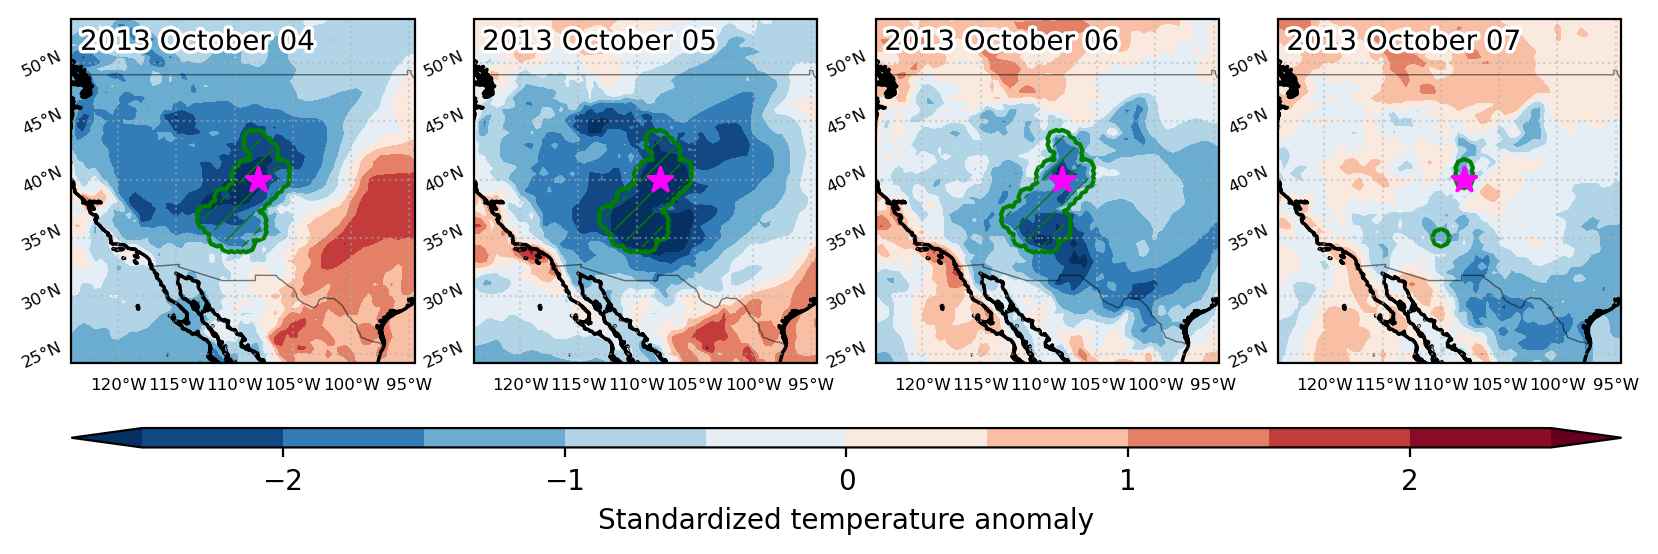
Cold spell occuring from October 04 2013 to October 07 2013 at 40.0°N 252.0°E

Download data: JSON

Event type: Cold spell

Countries affected (identified with ArcGIS Online; provided only for geographical reference):

  • United States

Duration: 4 days

Time span: October 04 2013 to October 07 2013

Statistics over entire affected area:

  • Mean temperature anomaly: -8.3 °C
  • Mean temperature: 4.1 °C
  • Minimum temperature anomaly: -14.0 °C
  • Minimum temperature: -7.2 °C

Event center: 40.0°N 252.0°E

Area affected: 271162 km$^2$


Fig. 1: Map of most extreme temperature anomalies (standardized) experienced during the event. The purple star indicates the center of the extreme event. Green hatching illustrates all areas under the effect of extremes at some time during the event.


Fig. 2: Evolution of temperature at the center of the event. The climatological percentile distribution is illustrated with color shadings.


Fig. 3: Maps illustrating the evolution of standardized temperature anomalies during the event.

Event ID: Cold_spell_2013-Oct-04_to_2013-Oct-07_252.0_40.0

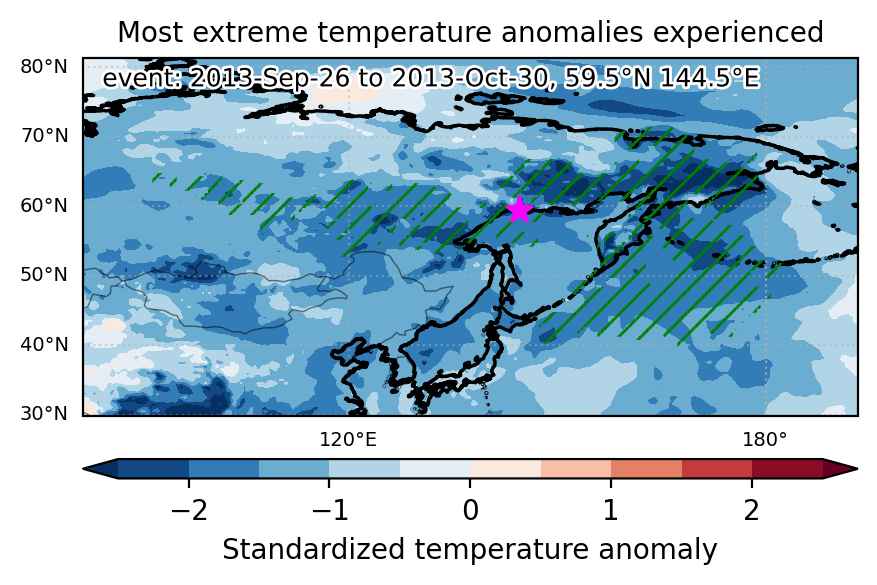
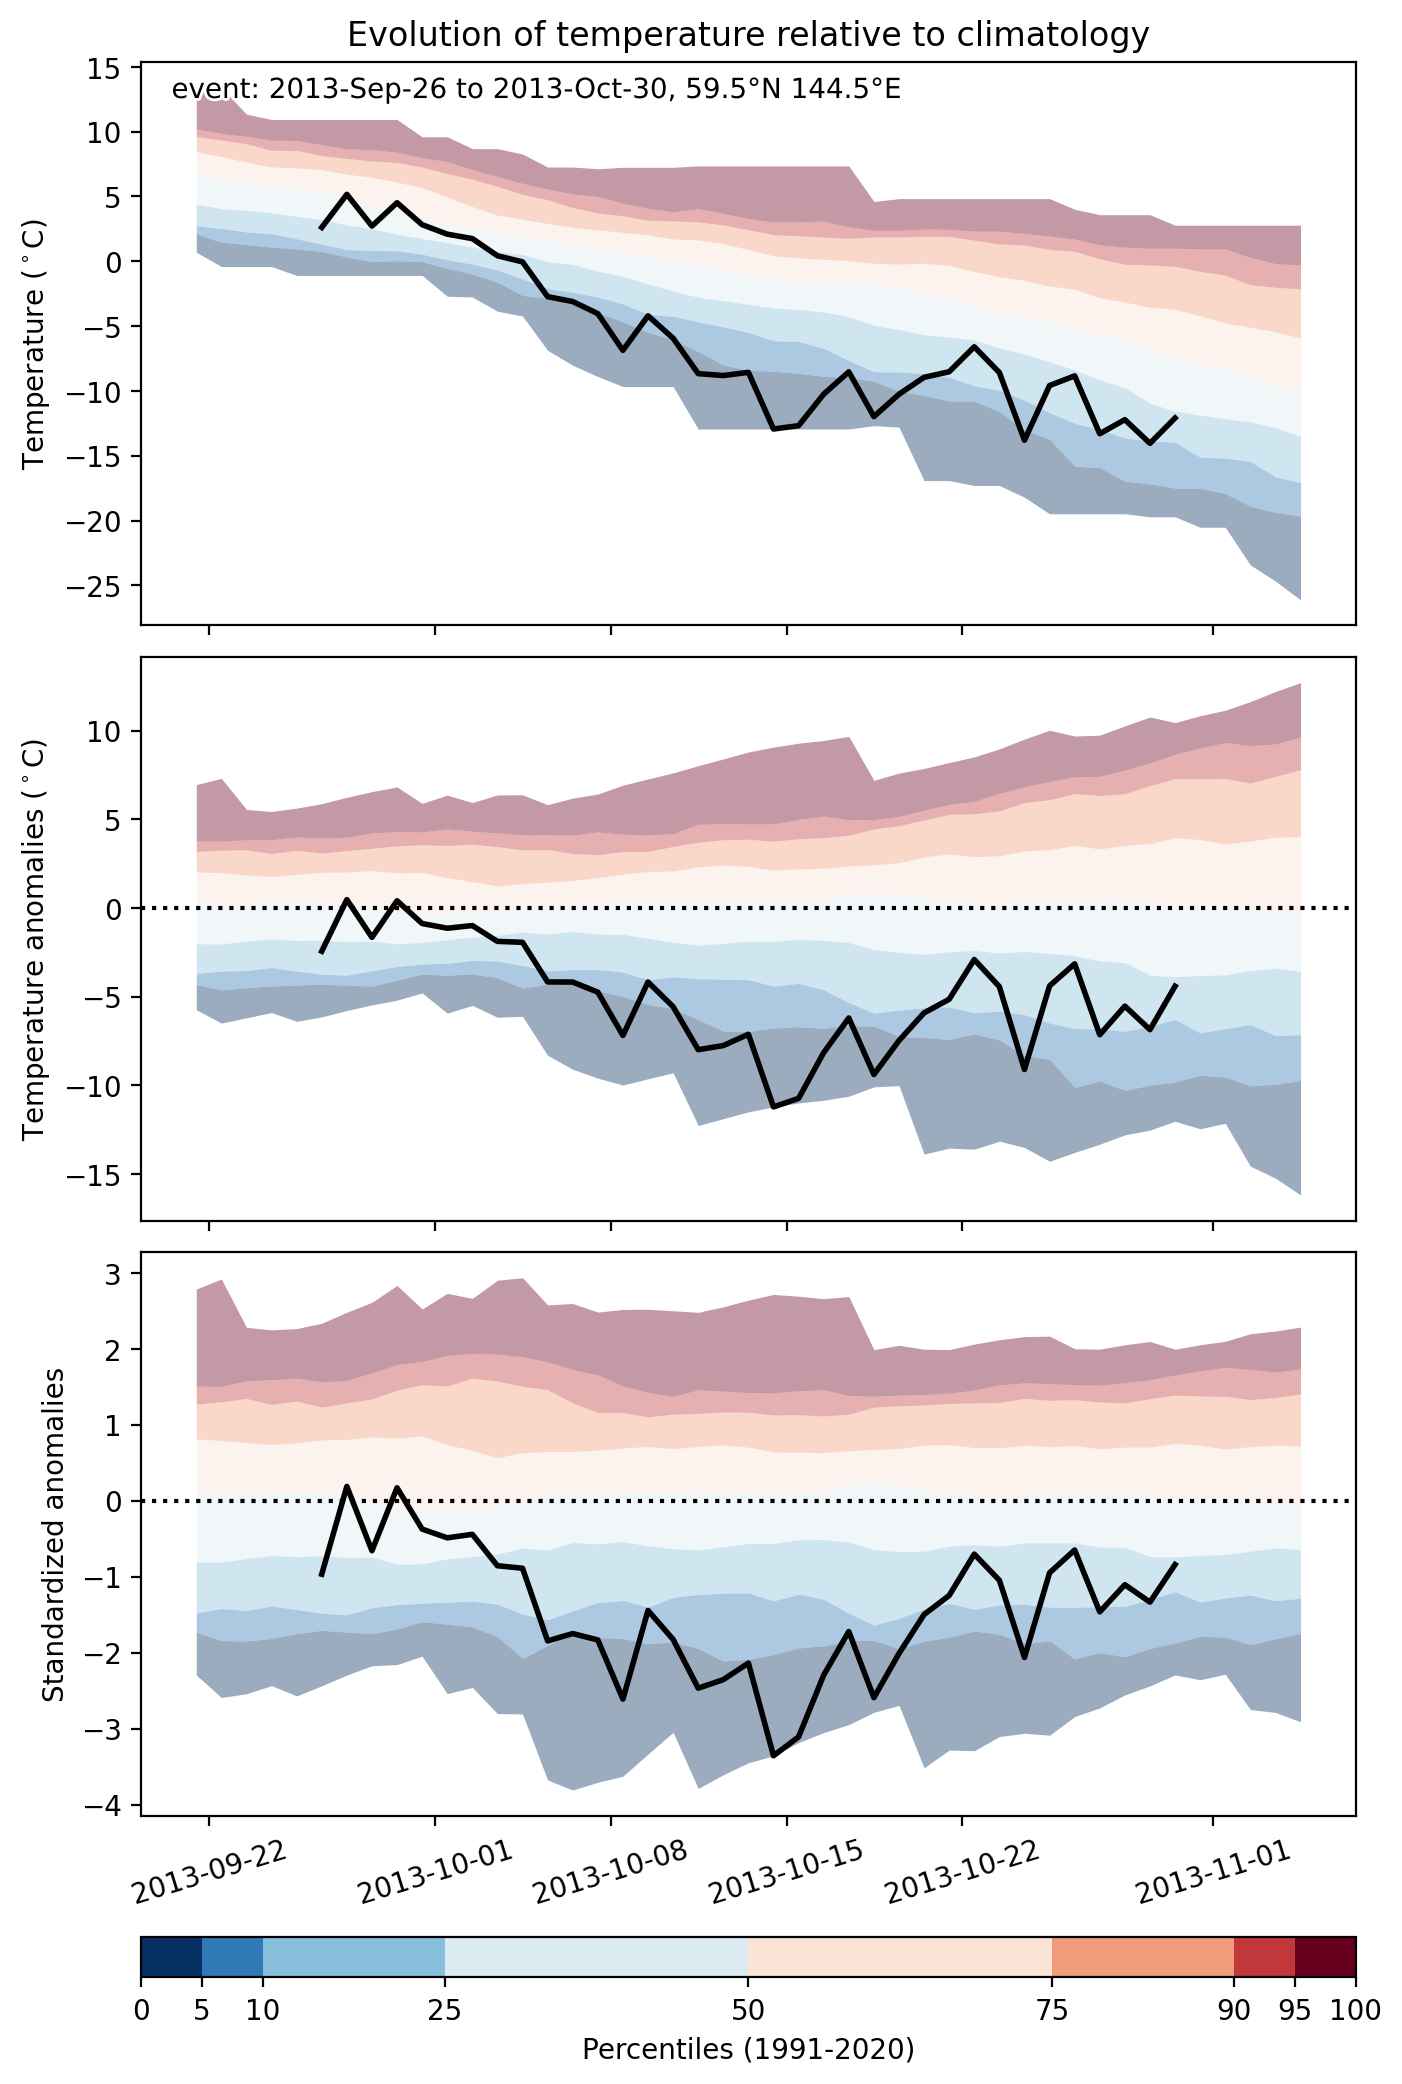
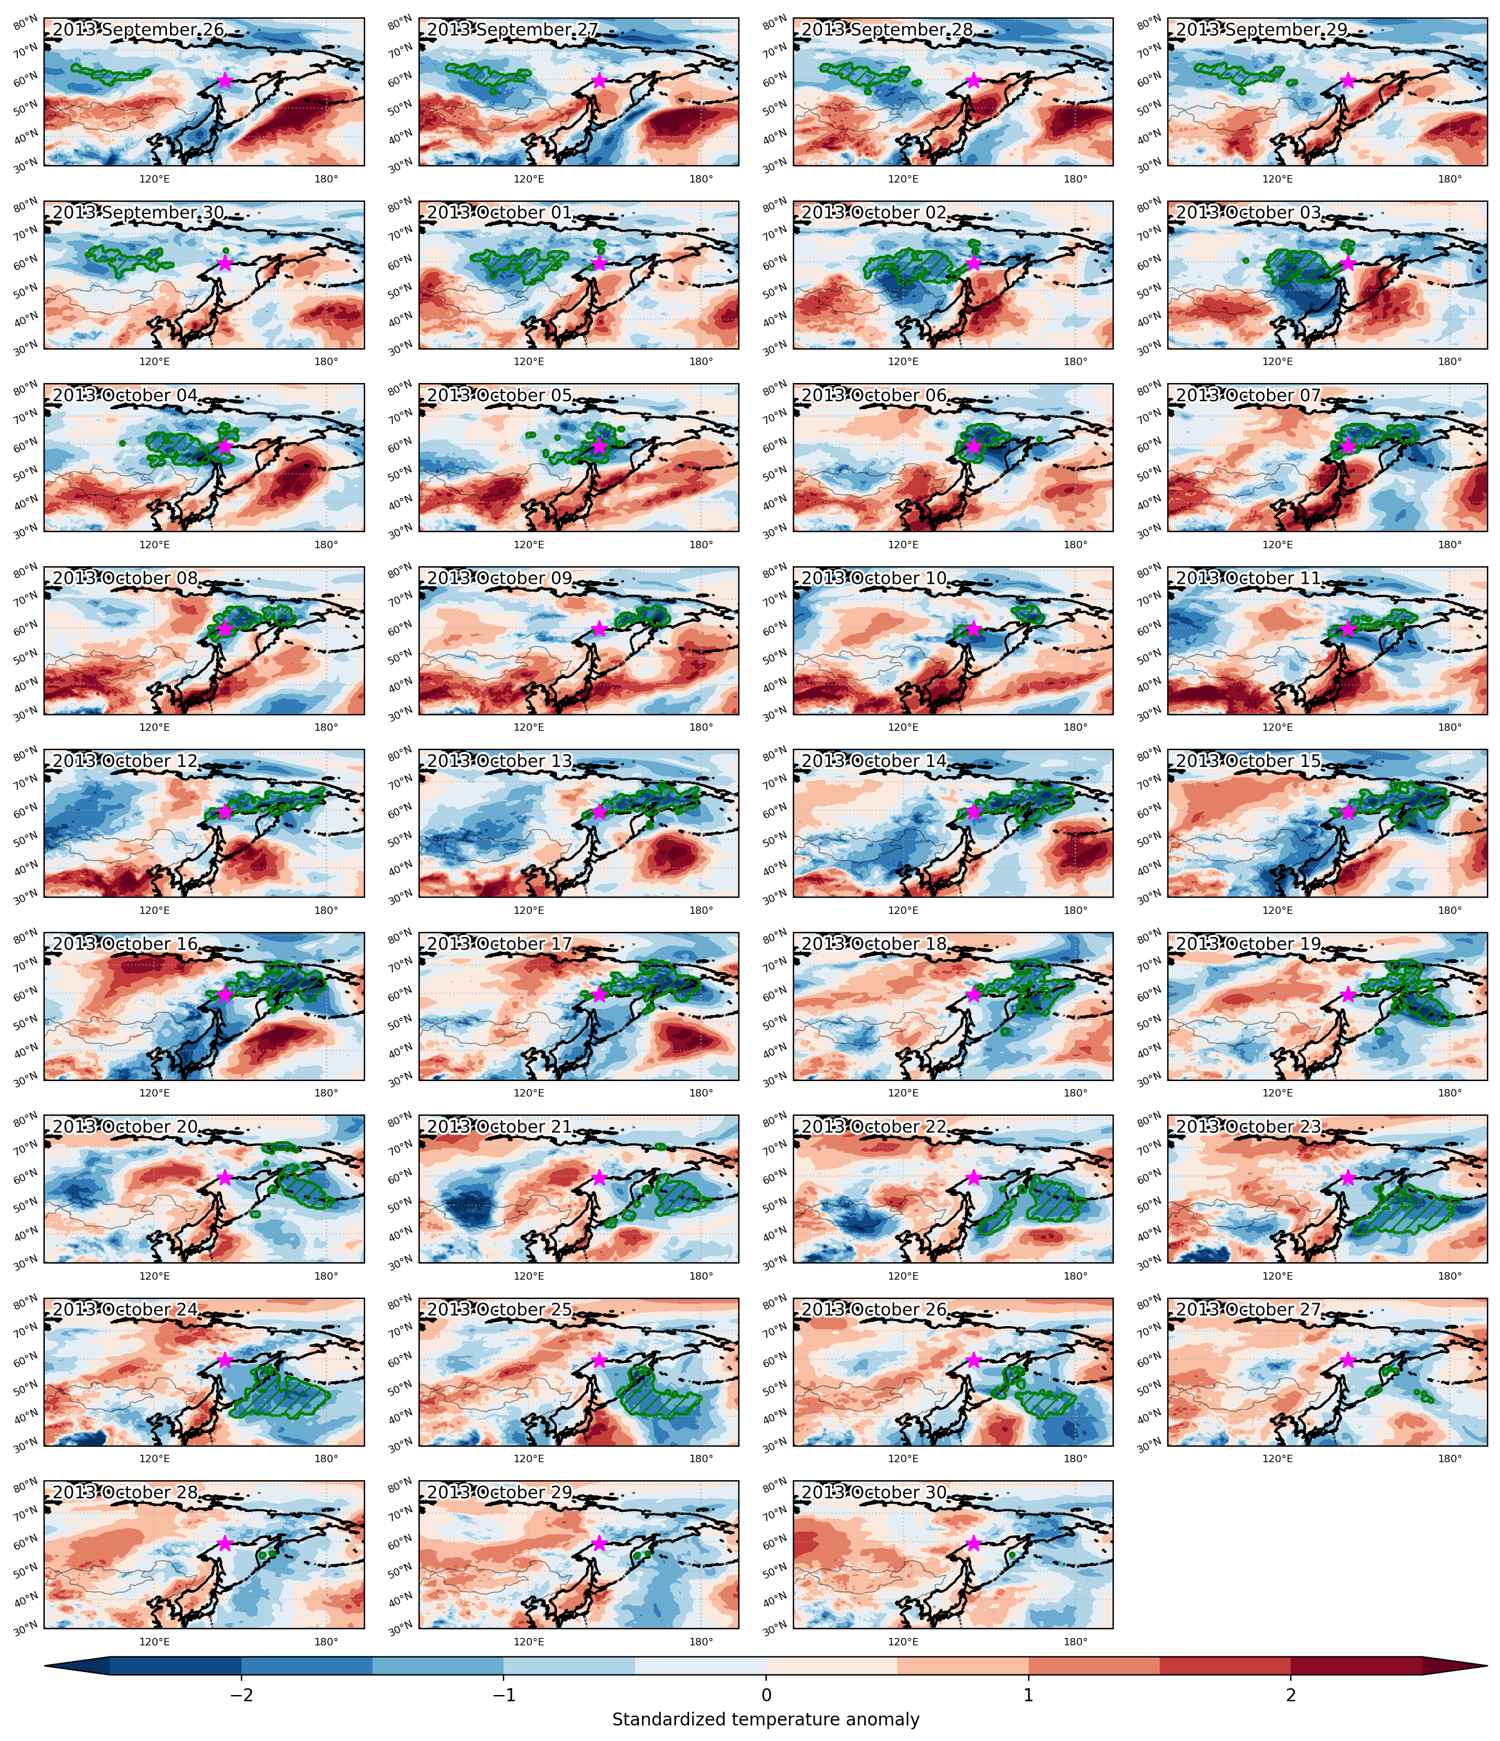
Cold spell occuring from September 26 2013 to October 30 2013 at 59.5°N 144.5°E

Download data: JSON

Event type: Cold spell

Countries affected (identified with ArcGIS Online; provided only for geographical reference):

  • China
  • Russian Federation
  • United States

Duration: 35 days

Time span: September 26 2013 to October 30 2013

Statistics over entire affected area:

  • Mean temperature anomaly: -5.8 °C
  • Mean temperature: -5.3 °C
  • Minimum temperature anomaly: -17.9 °C
  • Minimum temperature: -26.8 °C

Event center: 59.5°N 144.5°E

Area affected: 6160434 km$^2$


Fig. 1: Map of most extreme temperature anomalies (standardized) experienced during the event. The purple star indicates the center of the extreme event. Green hatching illustrates all areas under the effect of extremes at some time during the event.


Fig. 2: Evolution of temperature at the center of the event. The climatological percentile distribution is illustrated with color shadings.


Fig. 3: Maps illustrating the evolution of standardized temperature anomalies during the event.

Event ID: Cold_spell_2013-Sep-26_to_2013-Oct-30_144.5_59.5

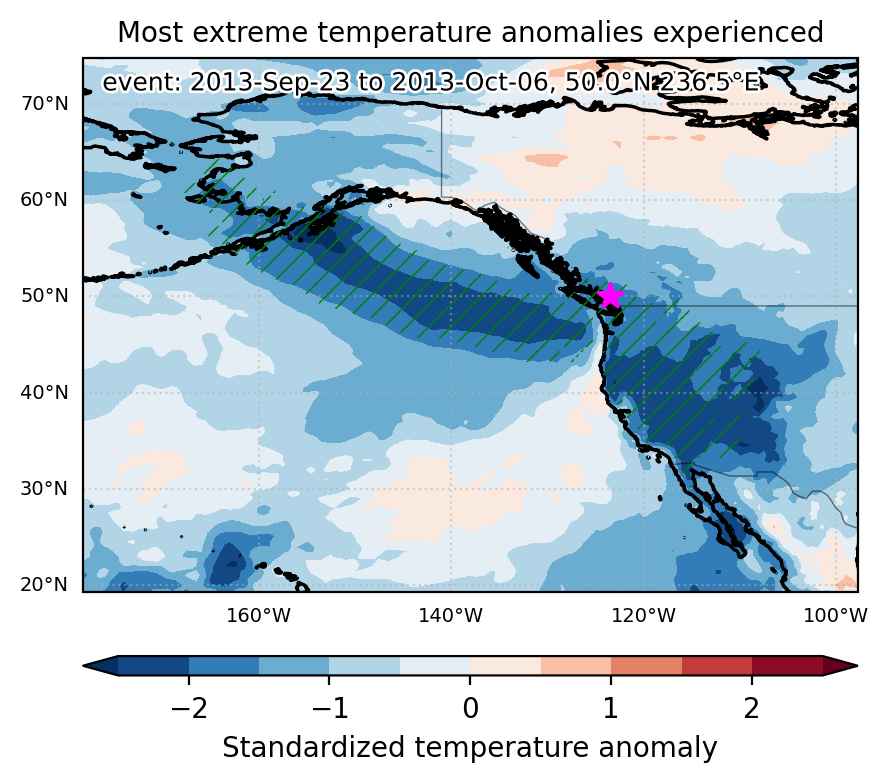
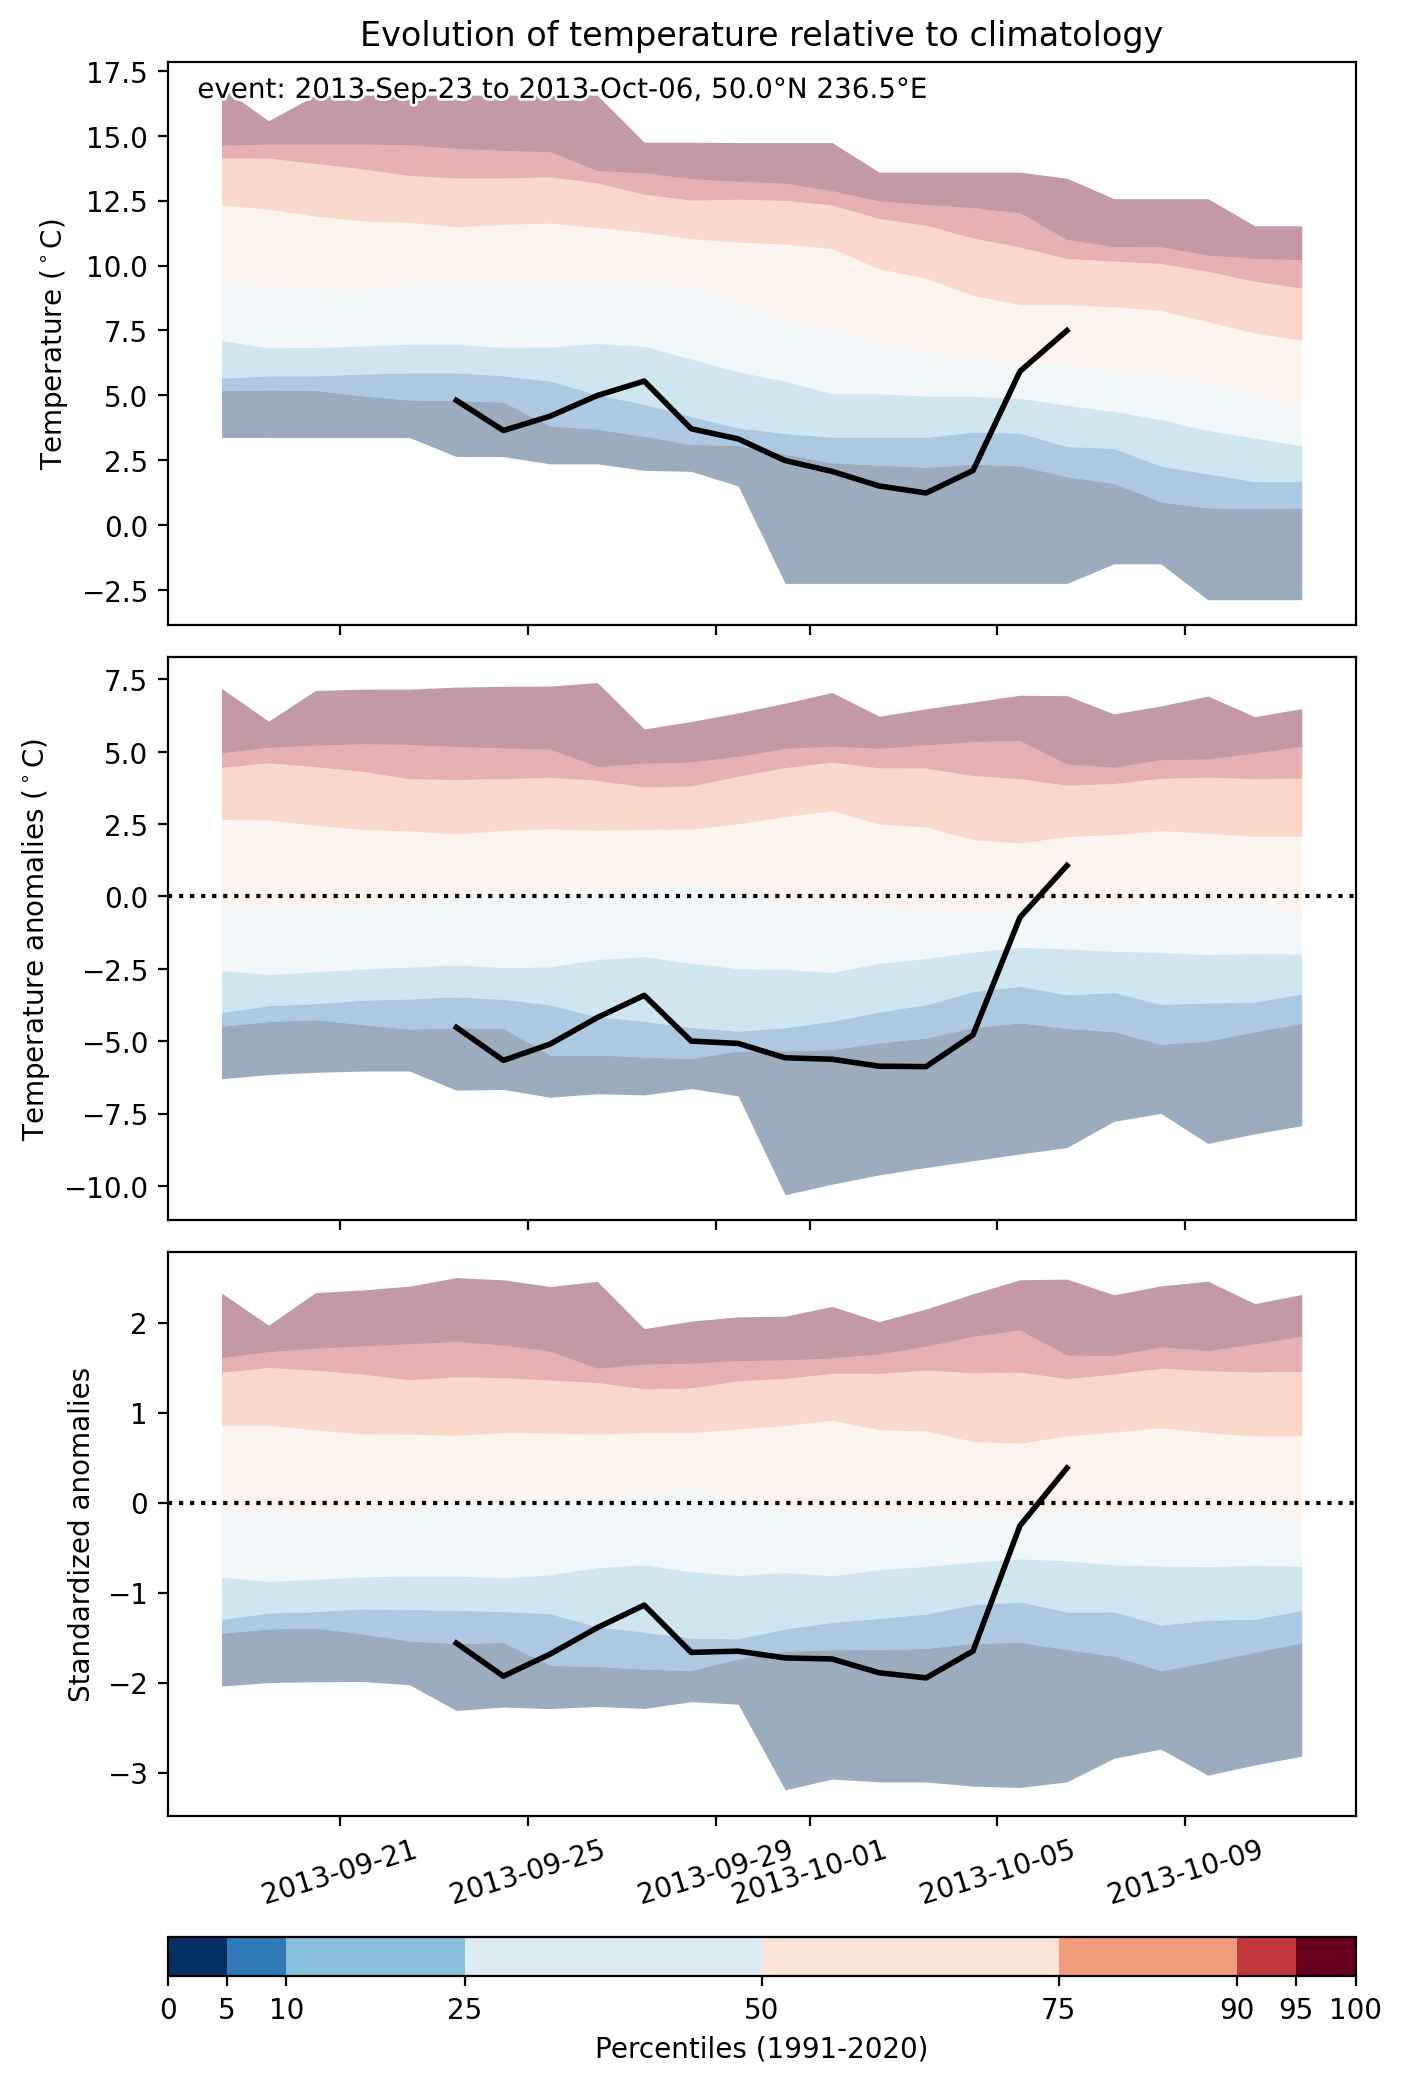
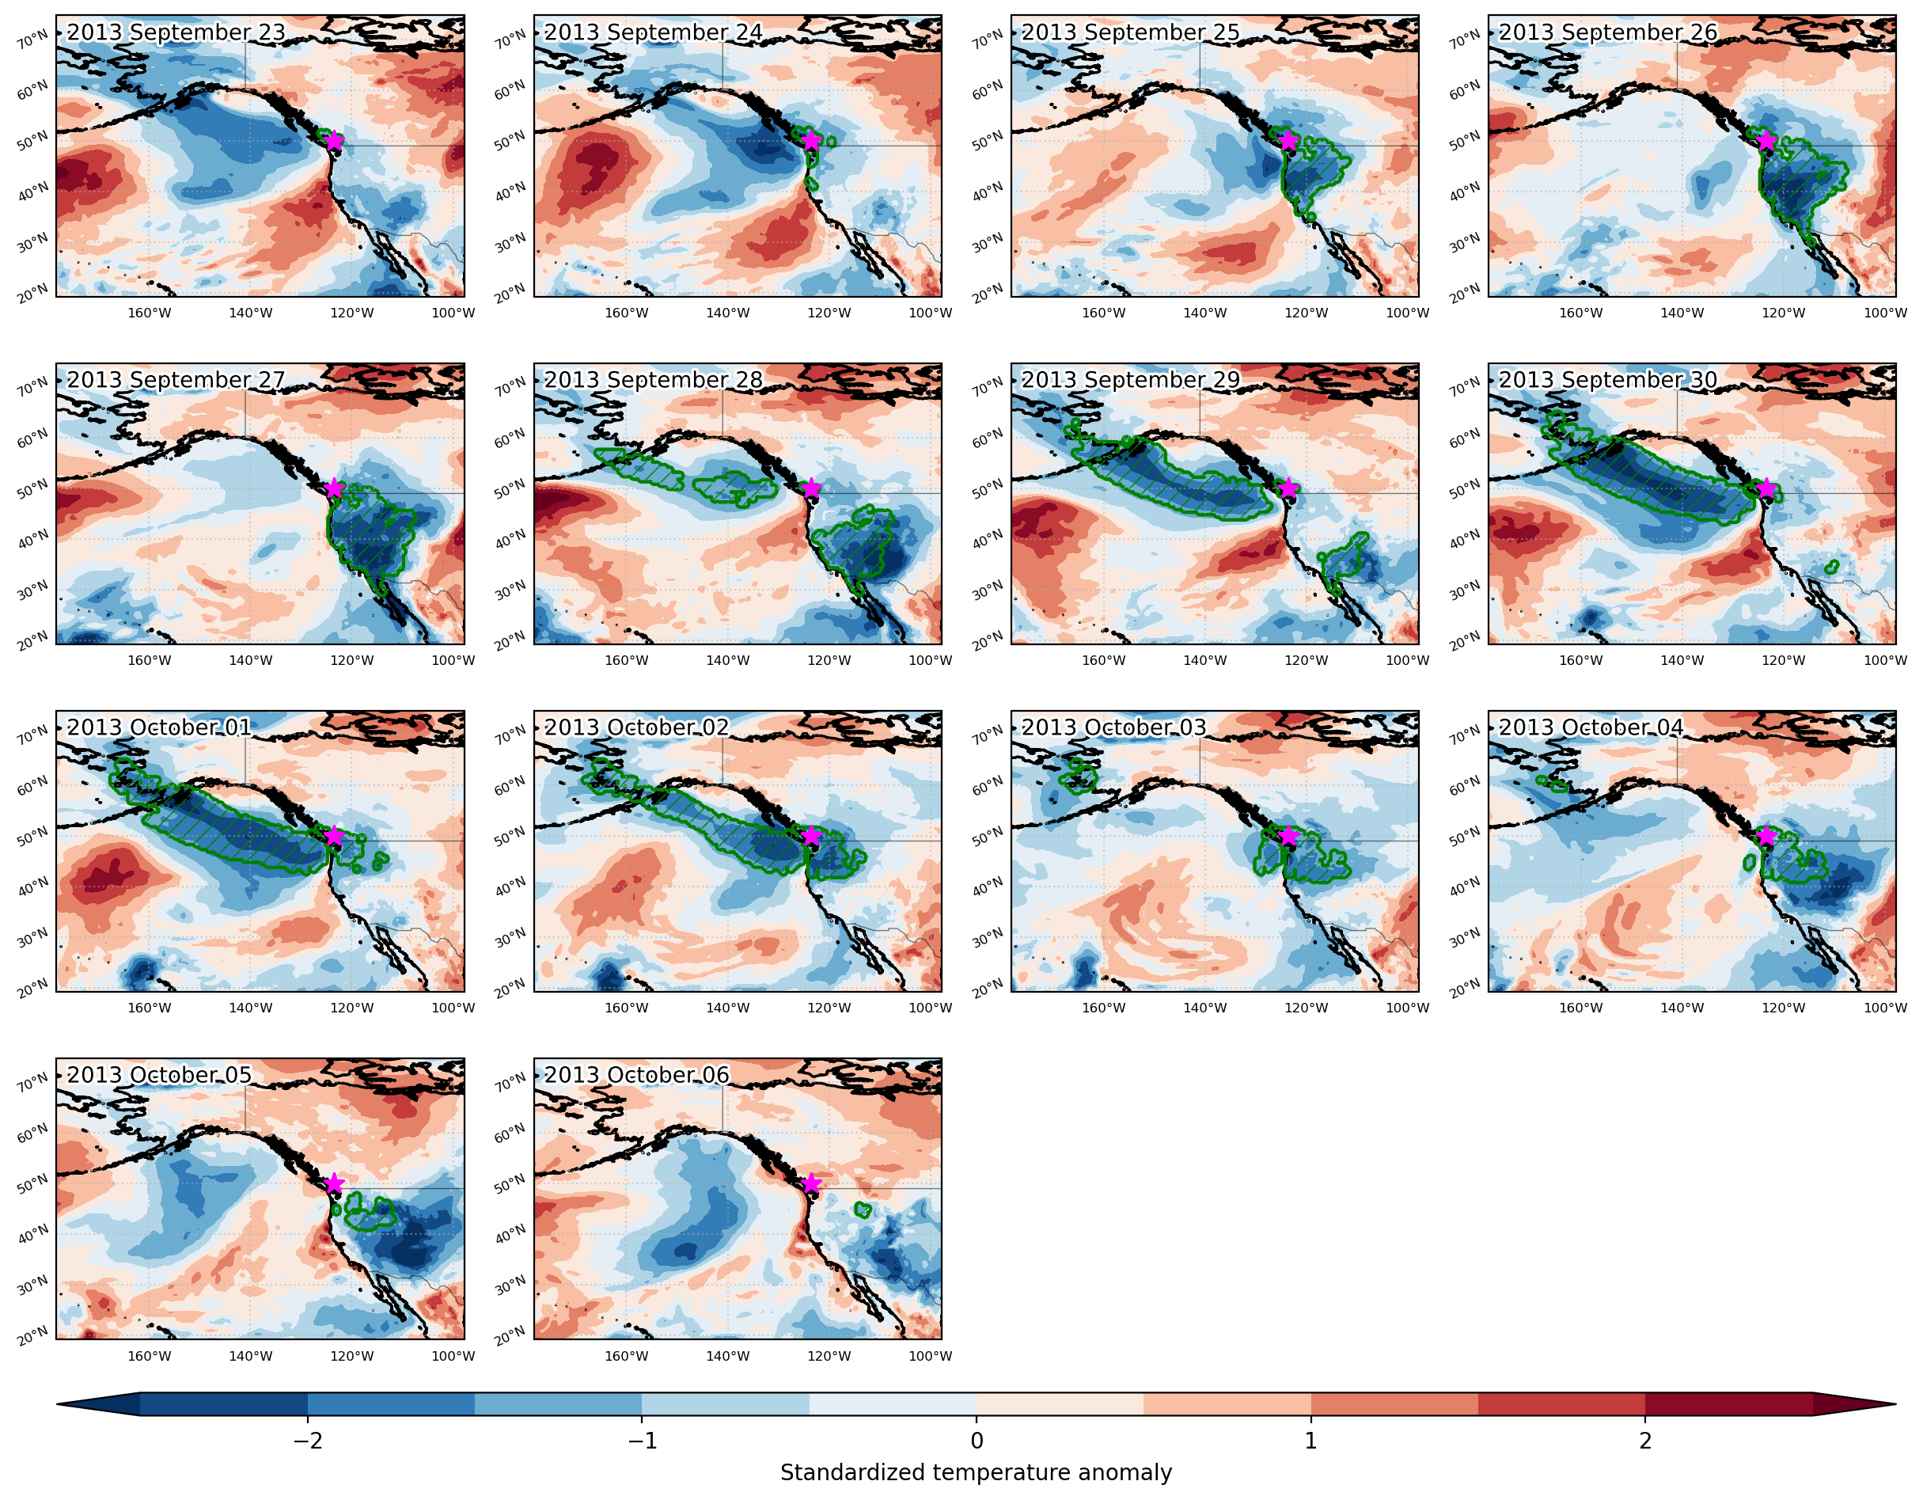
Cold spell occuring from September 23 2013 to October 06 2013 at 50.0°N 236.5°E

Download data: JSON

Event type: Cold spell

Countries affected (identified with ArcGIS Online; provided only for geographical reference):

  • Canada
  • Mexico
  • United States

Duration: 14 days

Time span: September 23 2013 to October 06 2013

Statistics over entire affected area:

  • Mean temperature anomaly: -4.5 °C
  • Mean temperature: 8.0 °C
  • Minimum temperature anomaly: -14.2 °C
  • Minimum temperature: -8.6 °C

Event center: 50.0°N 236.5°E

Area affected: 4196556 km$^2$


Fig. 1: Map of most extreme temperature anomalies (standardized) experienced during the event. The purple star indicates the center of the extreme event. Green hatching illustrates all areas under the effect of extremes at some time during the event.


Fig. 2: Evolution of temperature at the center of the event. The climatological percentile distribution is illustrated with color shadings.


Fig. 3: Maps illustrating the evolution of standardized temperature anomalies during the event.

Event ID: Cold_spell_2013-Sep-23_to_2013-Oct-06_236.5_50.0