Cold spell occuring from February 24 2026 to April 17 2026 at 59.5°N 205.0°E

Download data: JSON

Event type: Cold spell

Countries affected (identified with ArcGIS Online; provided only for geographical reference):

  • Canada
  • Greenland
  • United States

Duration: 53 days

Time span: February 24 2026 to April 17 2026

Statistics over entire affected area:

  • Mean temperature anomaly: -8.6 °C
  • Mean temperature: -18.6 °C
  • Minimum temperature anomaly: -24.8 °C
  • Minimum temperature: -50.8 °C

Event center: 59.5°N 205.0°E

Area affected: 21077827 km$^2$


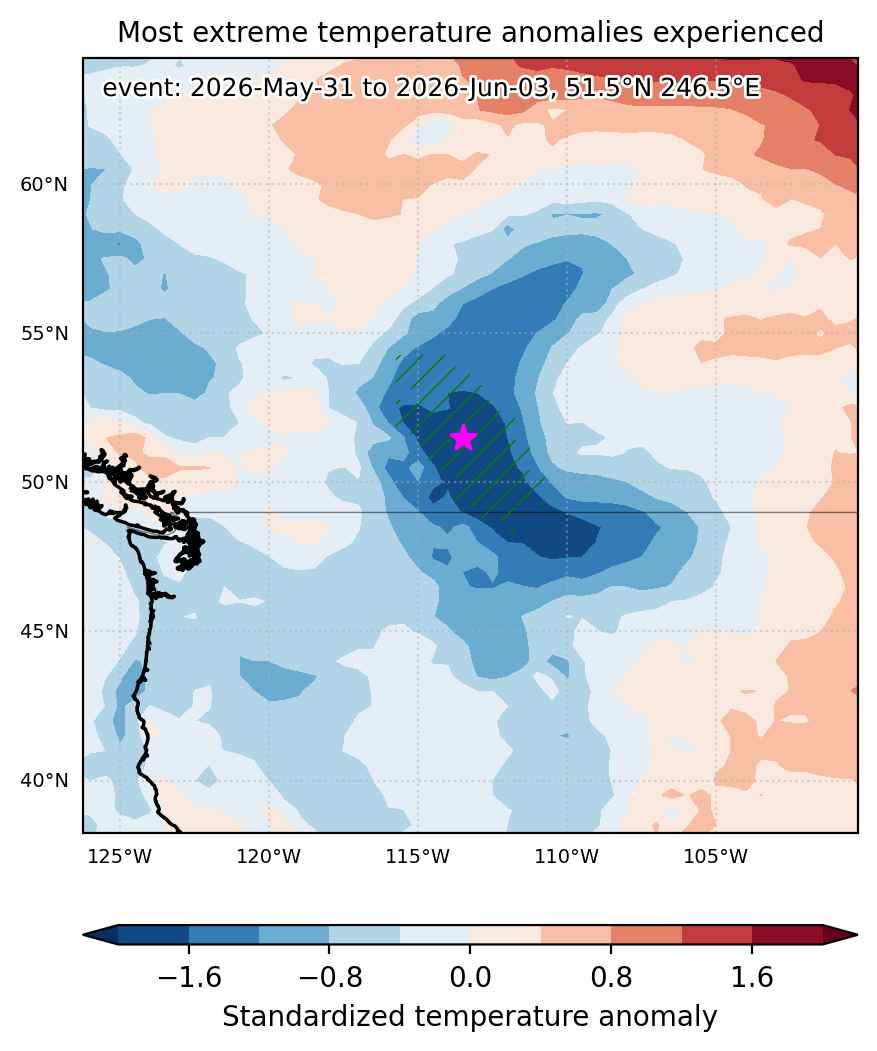
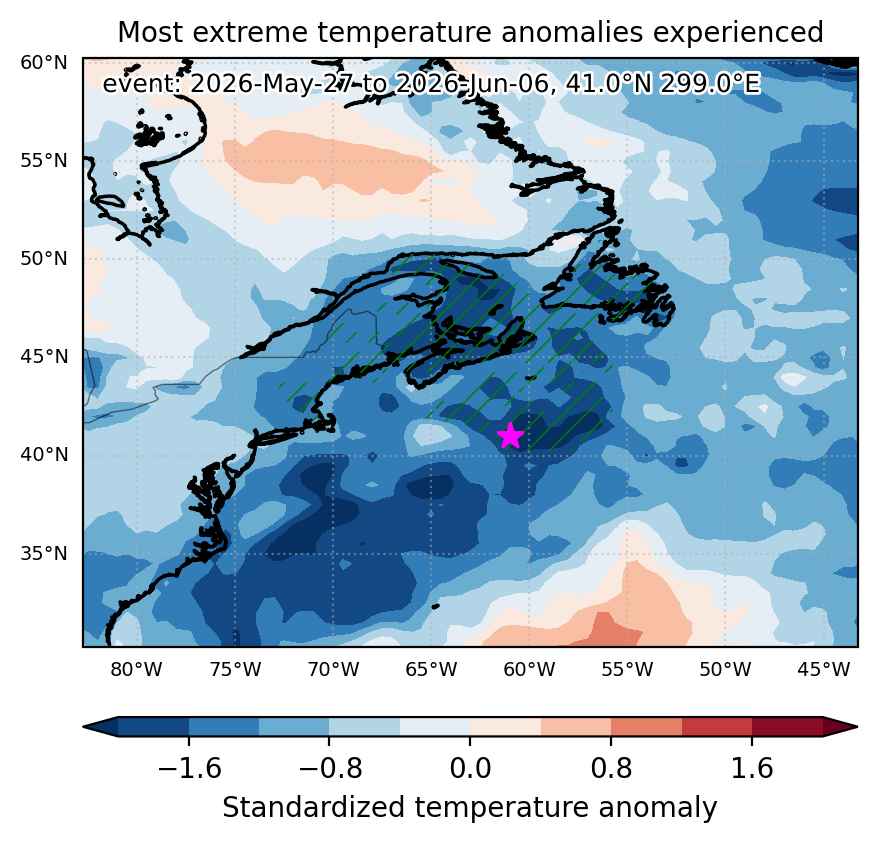
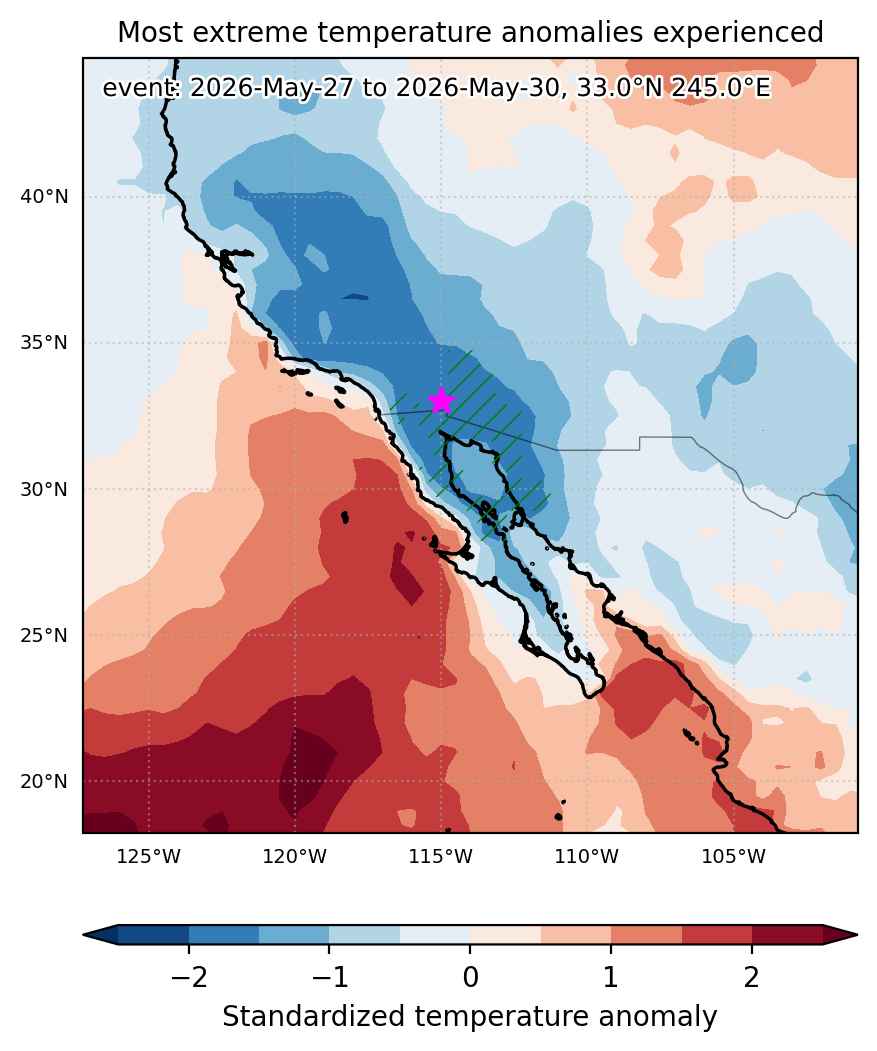
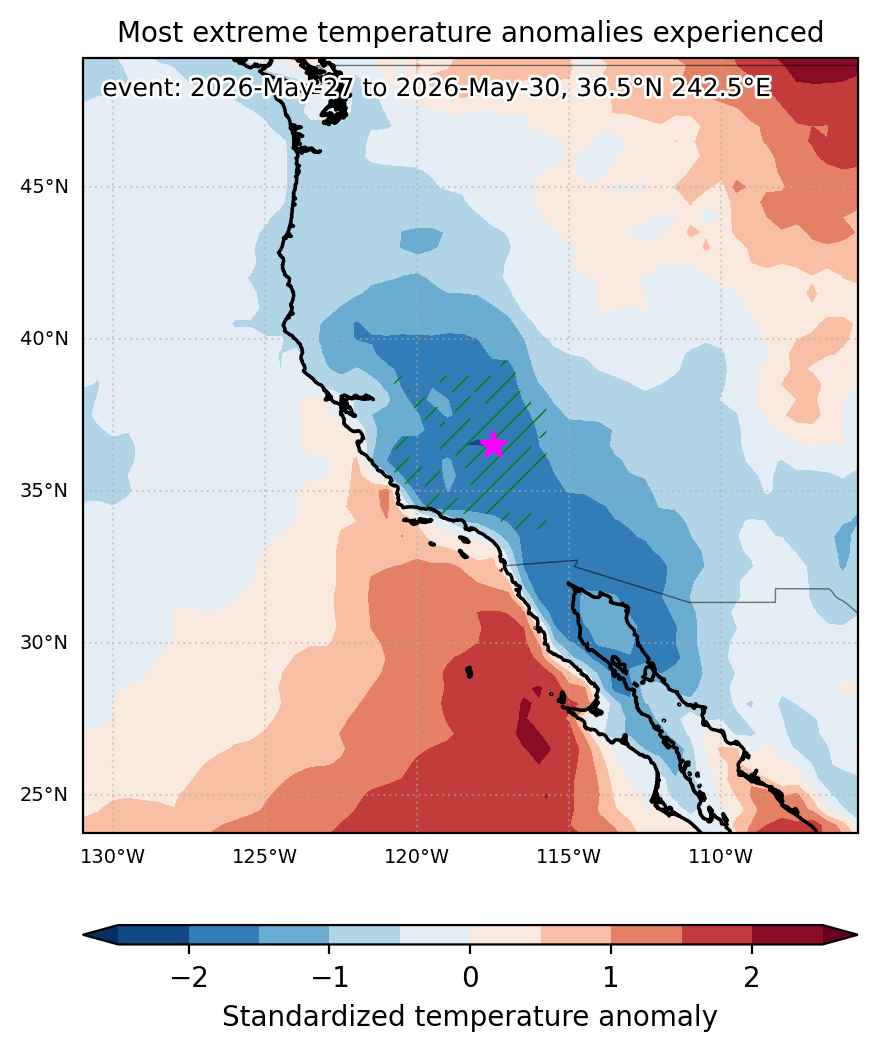
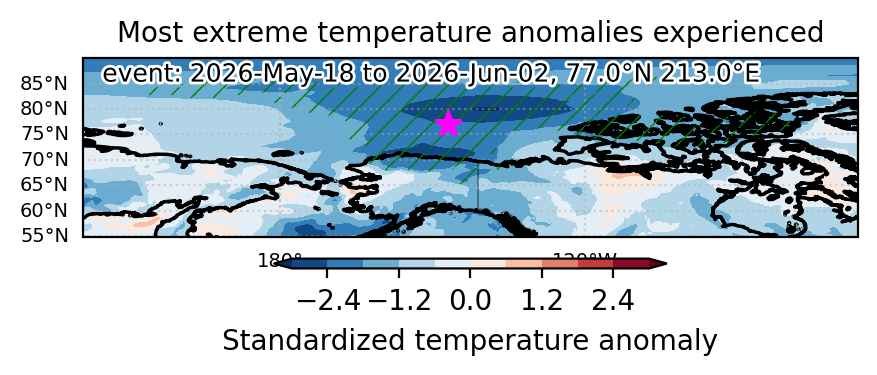
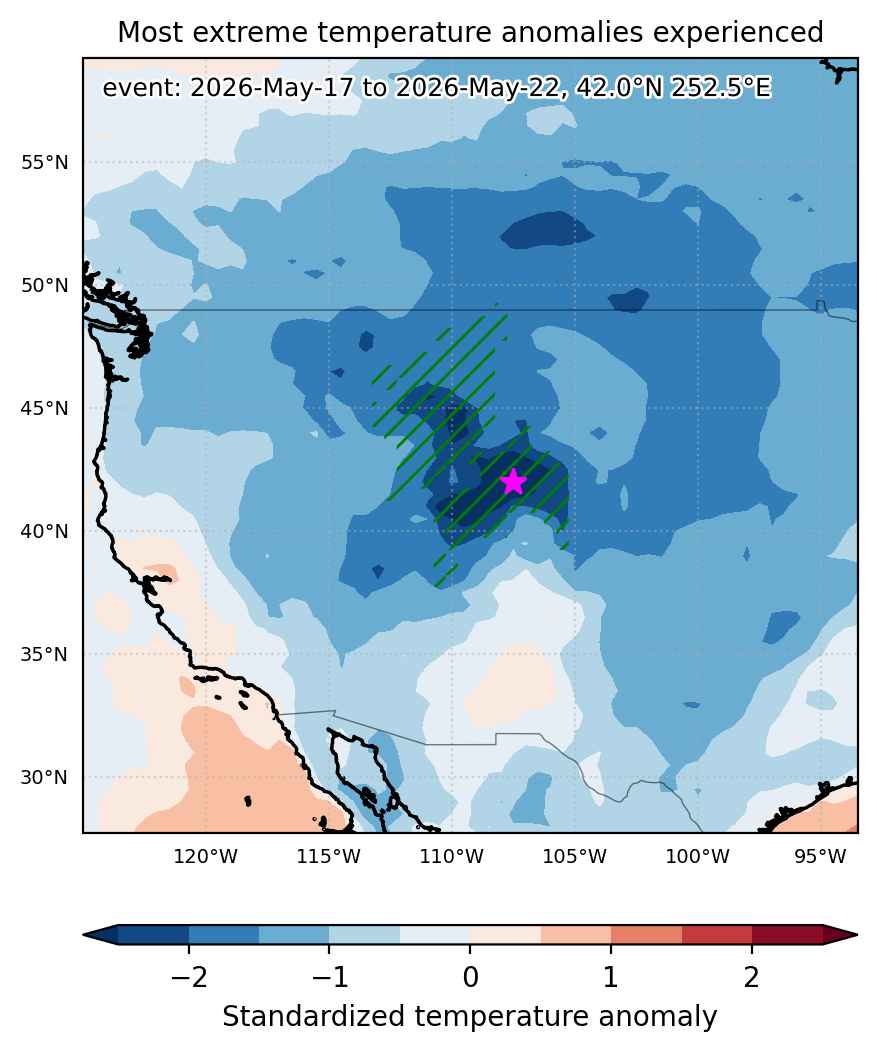
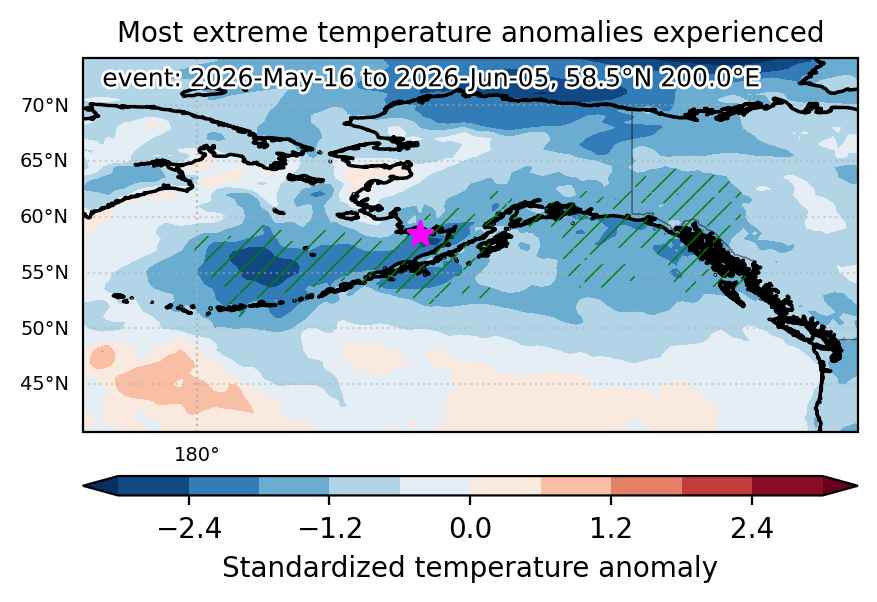
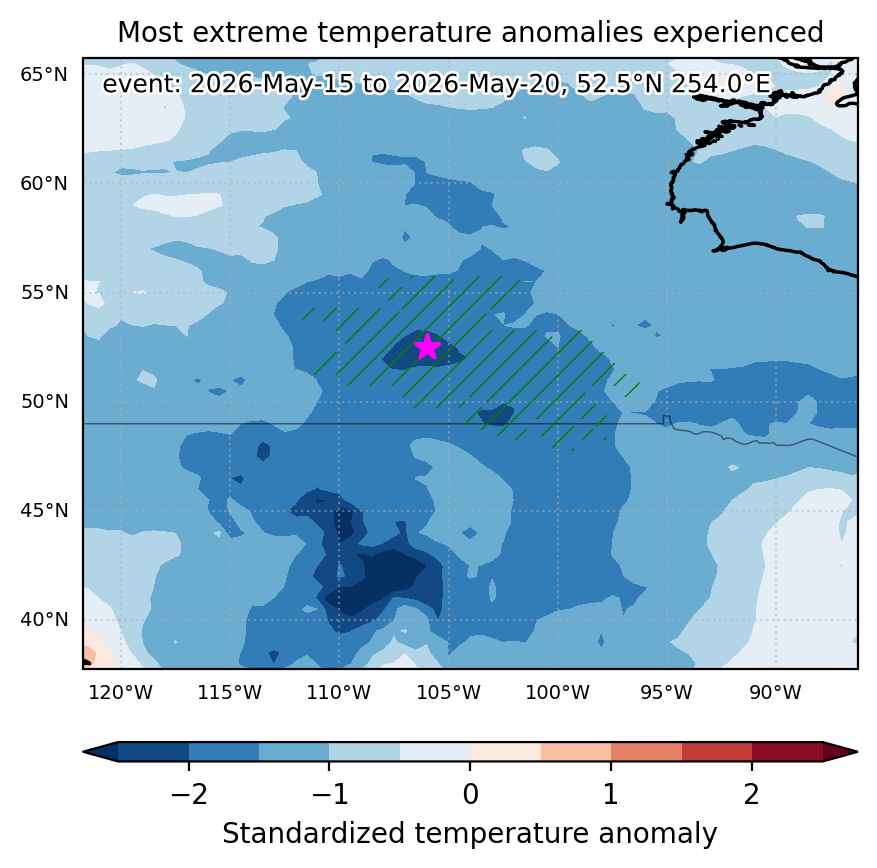
Fig. 1: Map of most extreme temperature anomalies (standardized) experienced during the event. The purple star indicates the center of the extreme event. Green hatching illustrates all areas under the effect of extremes at some time during the event.
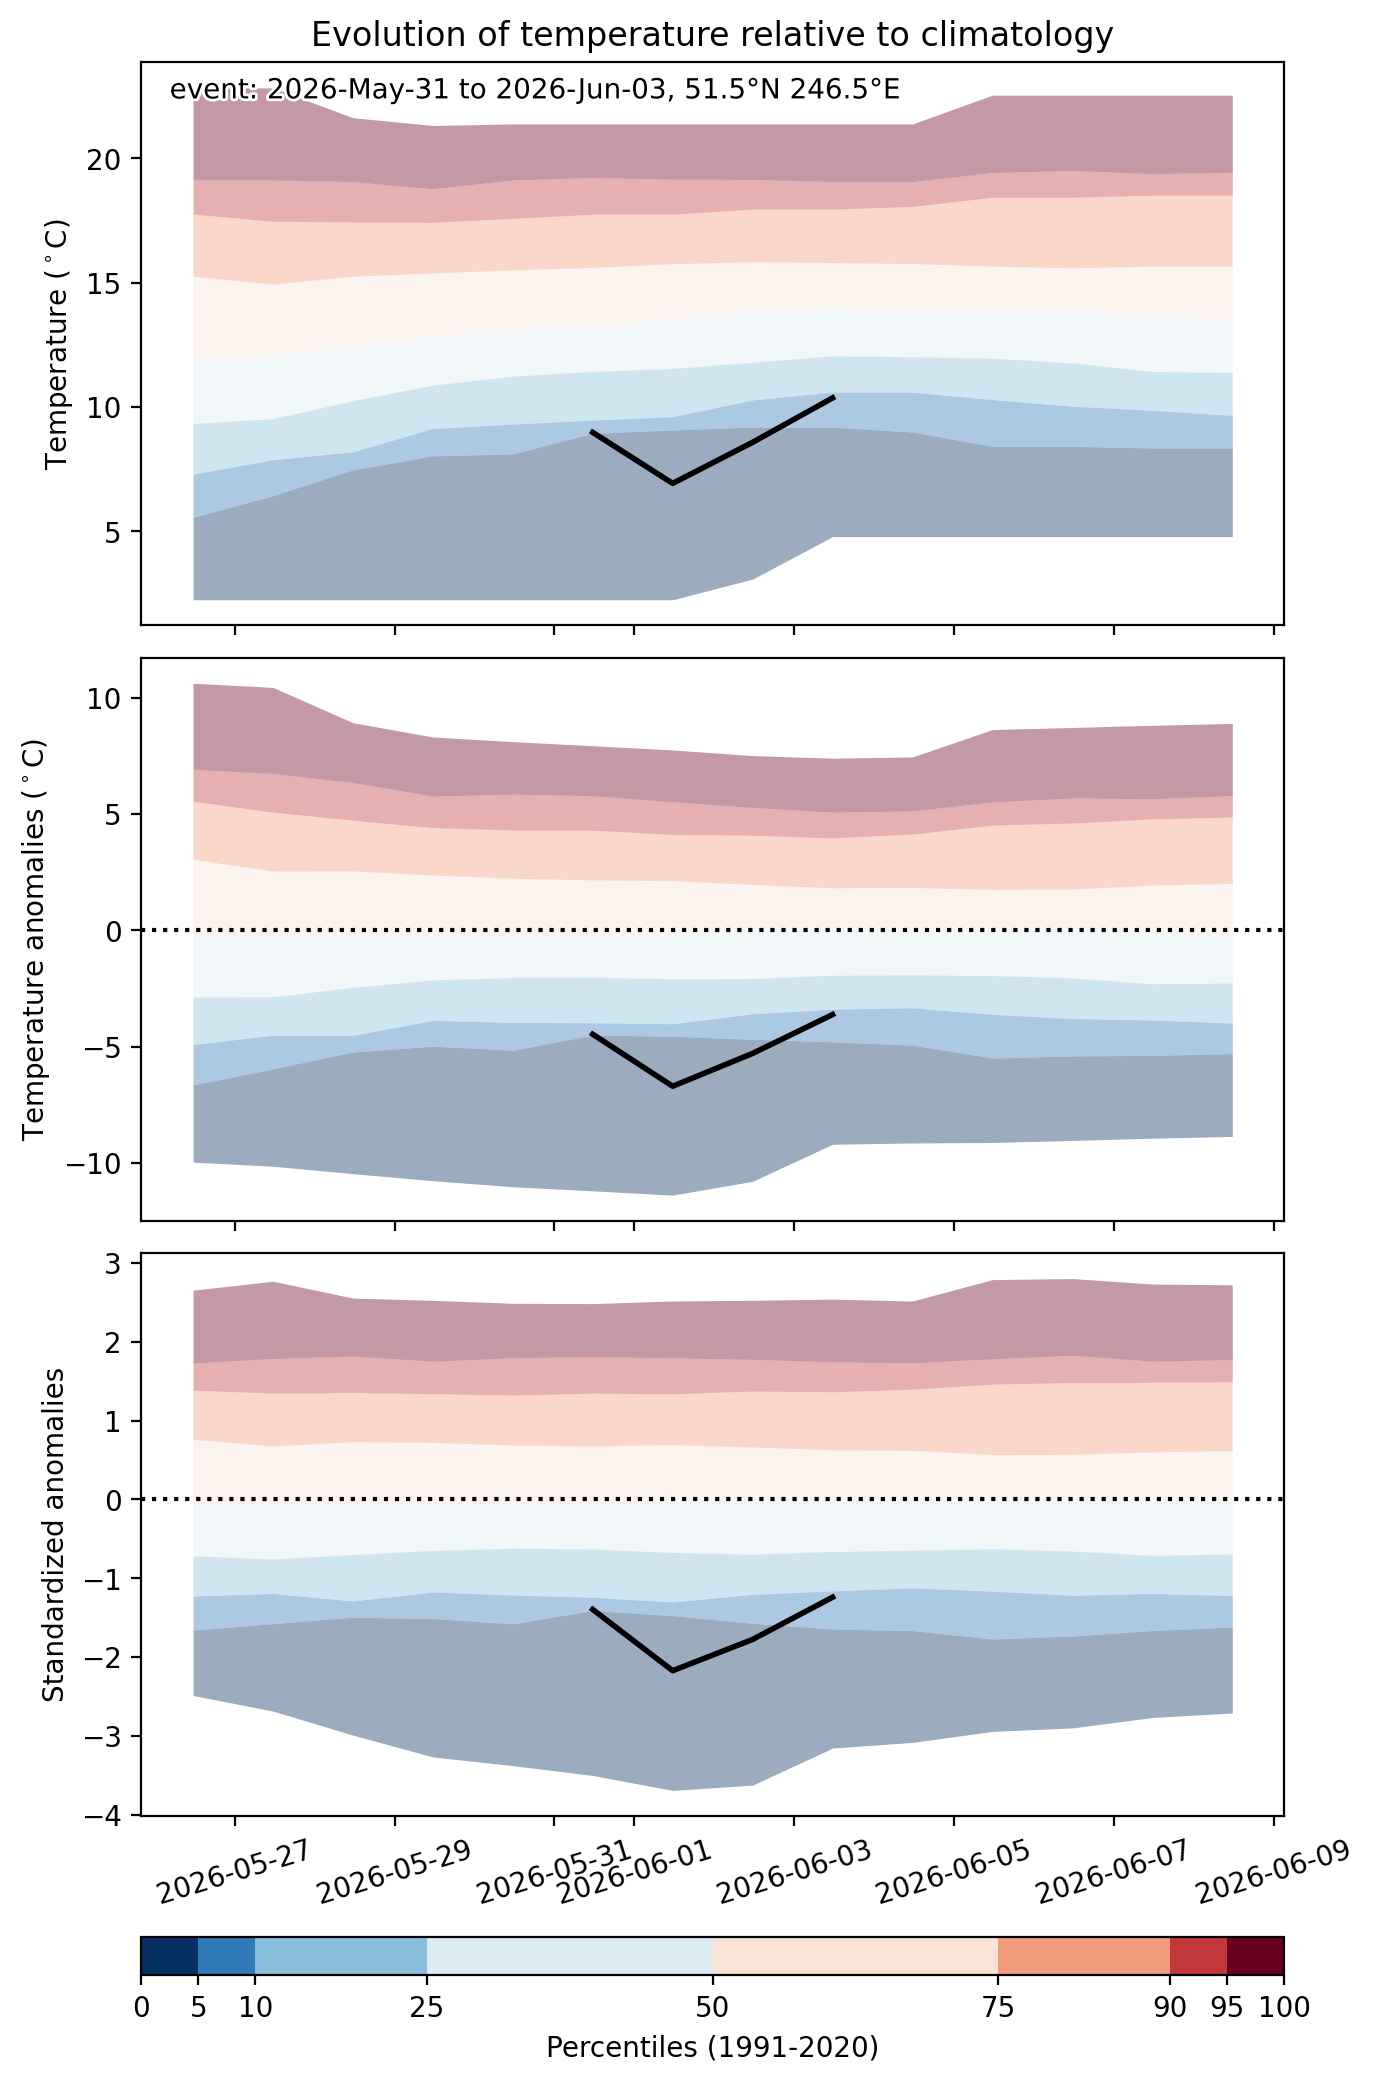


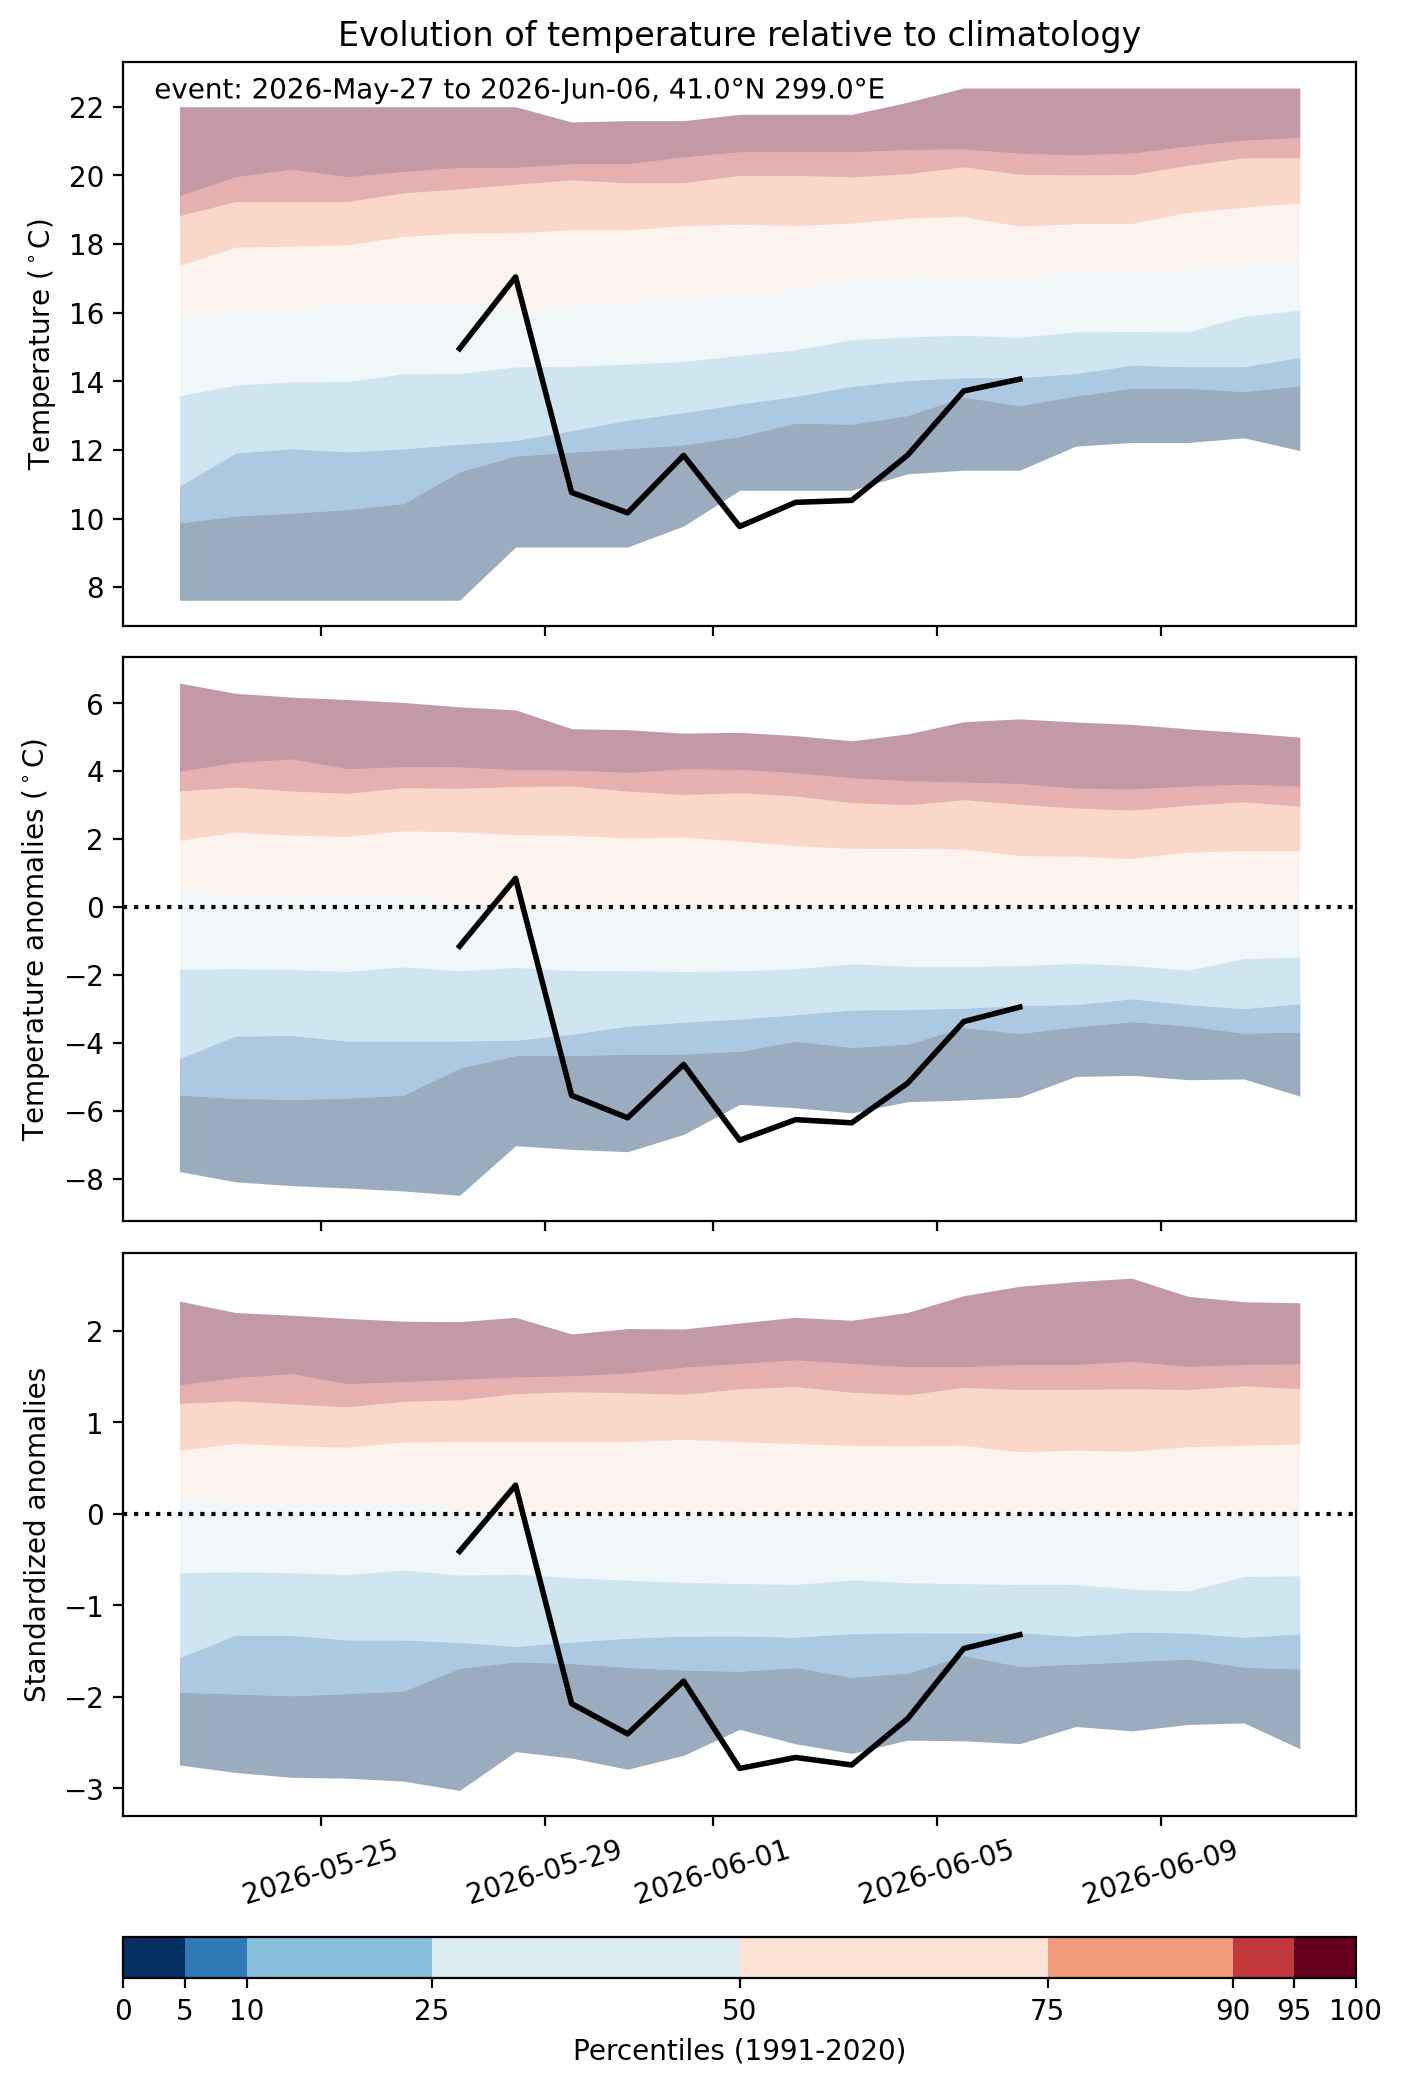
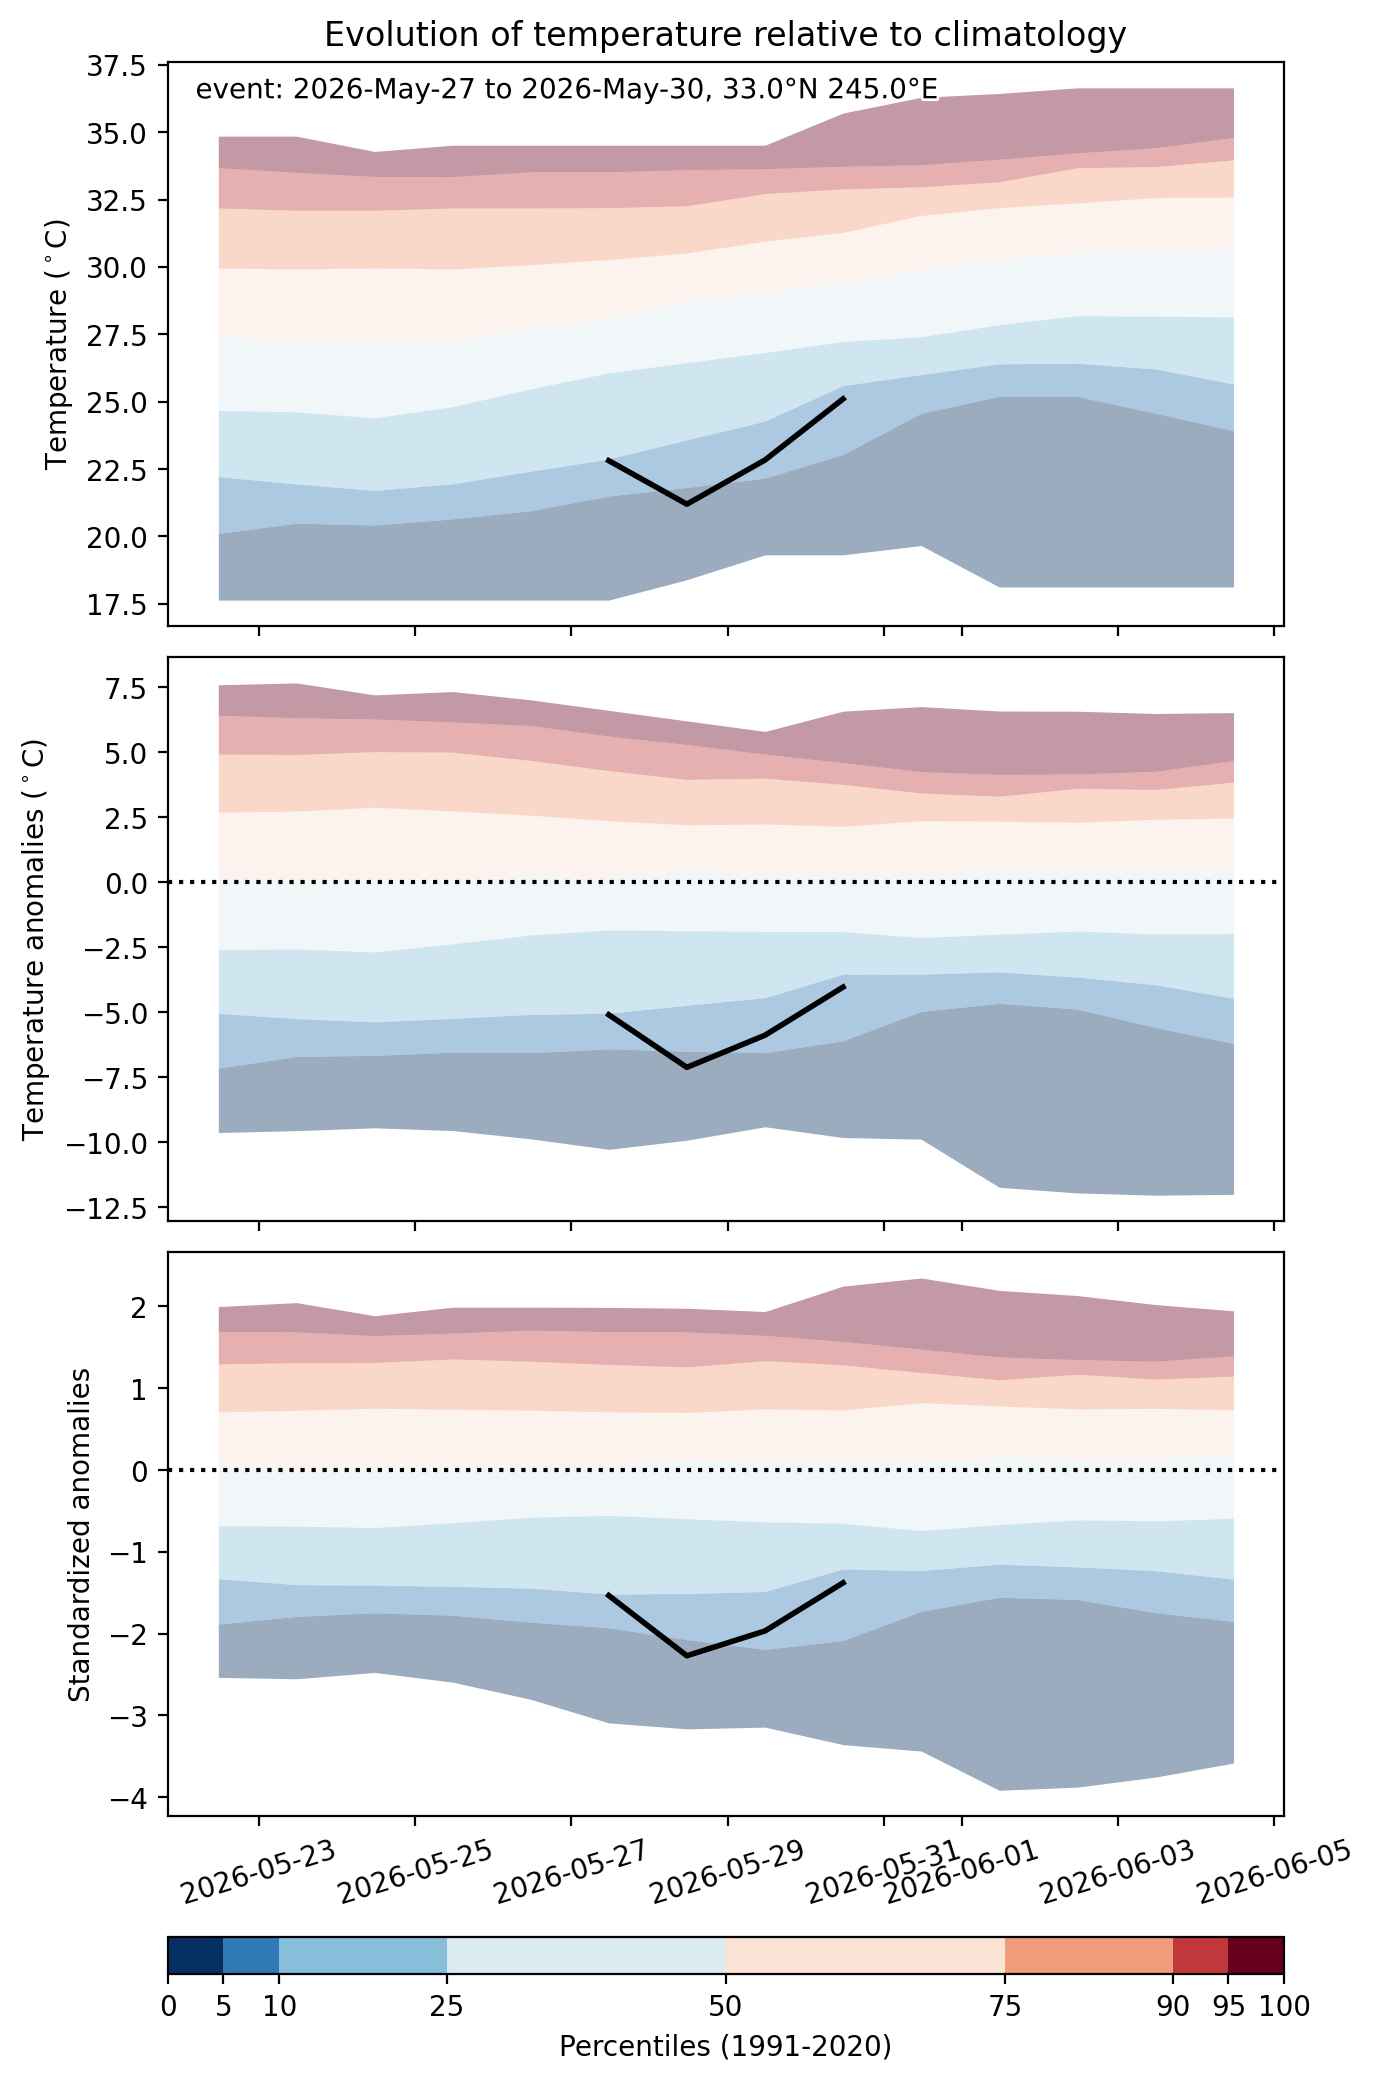
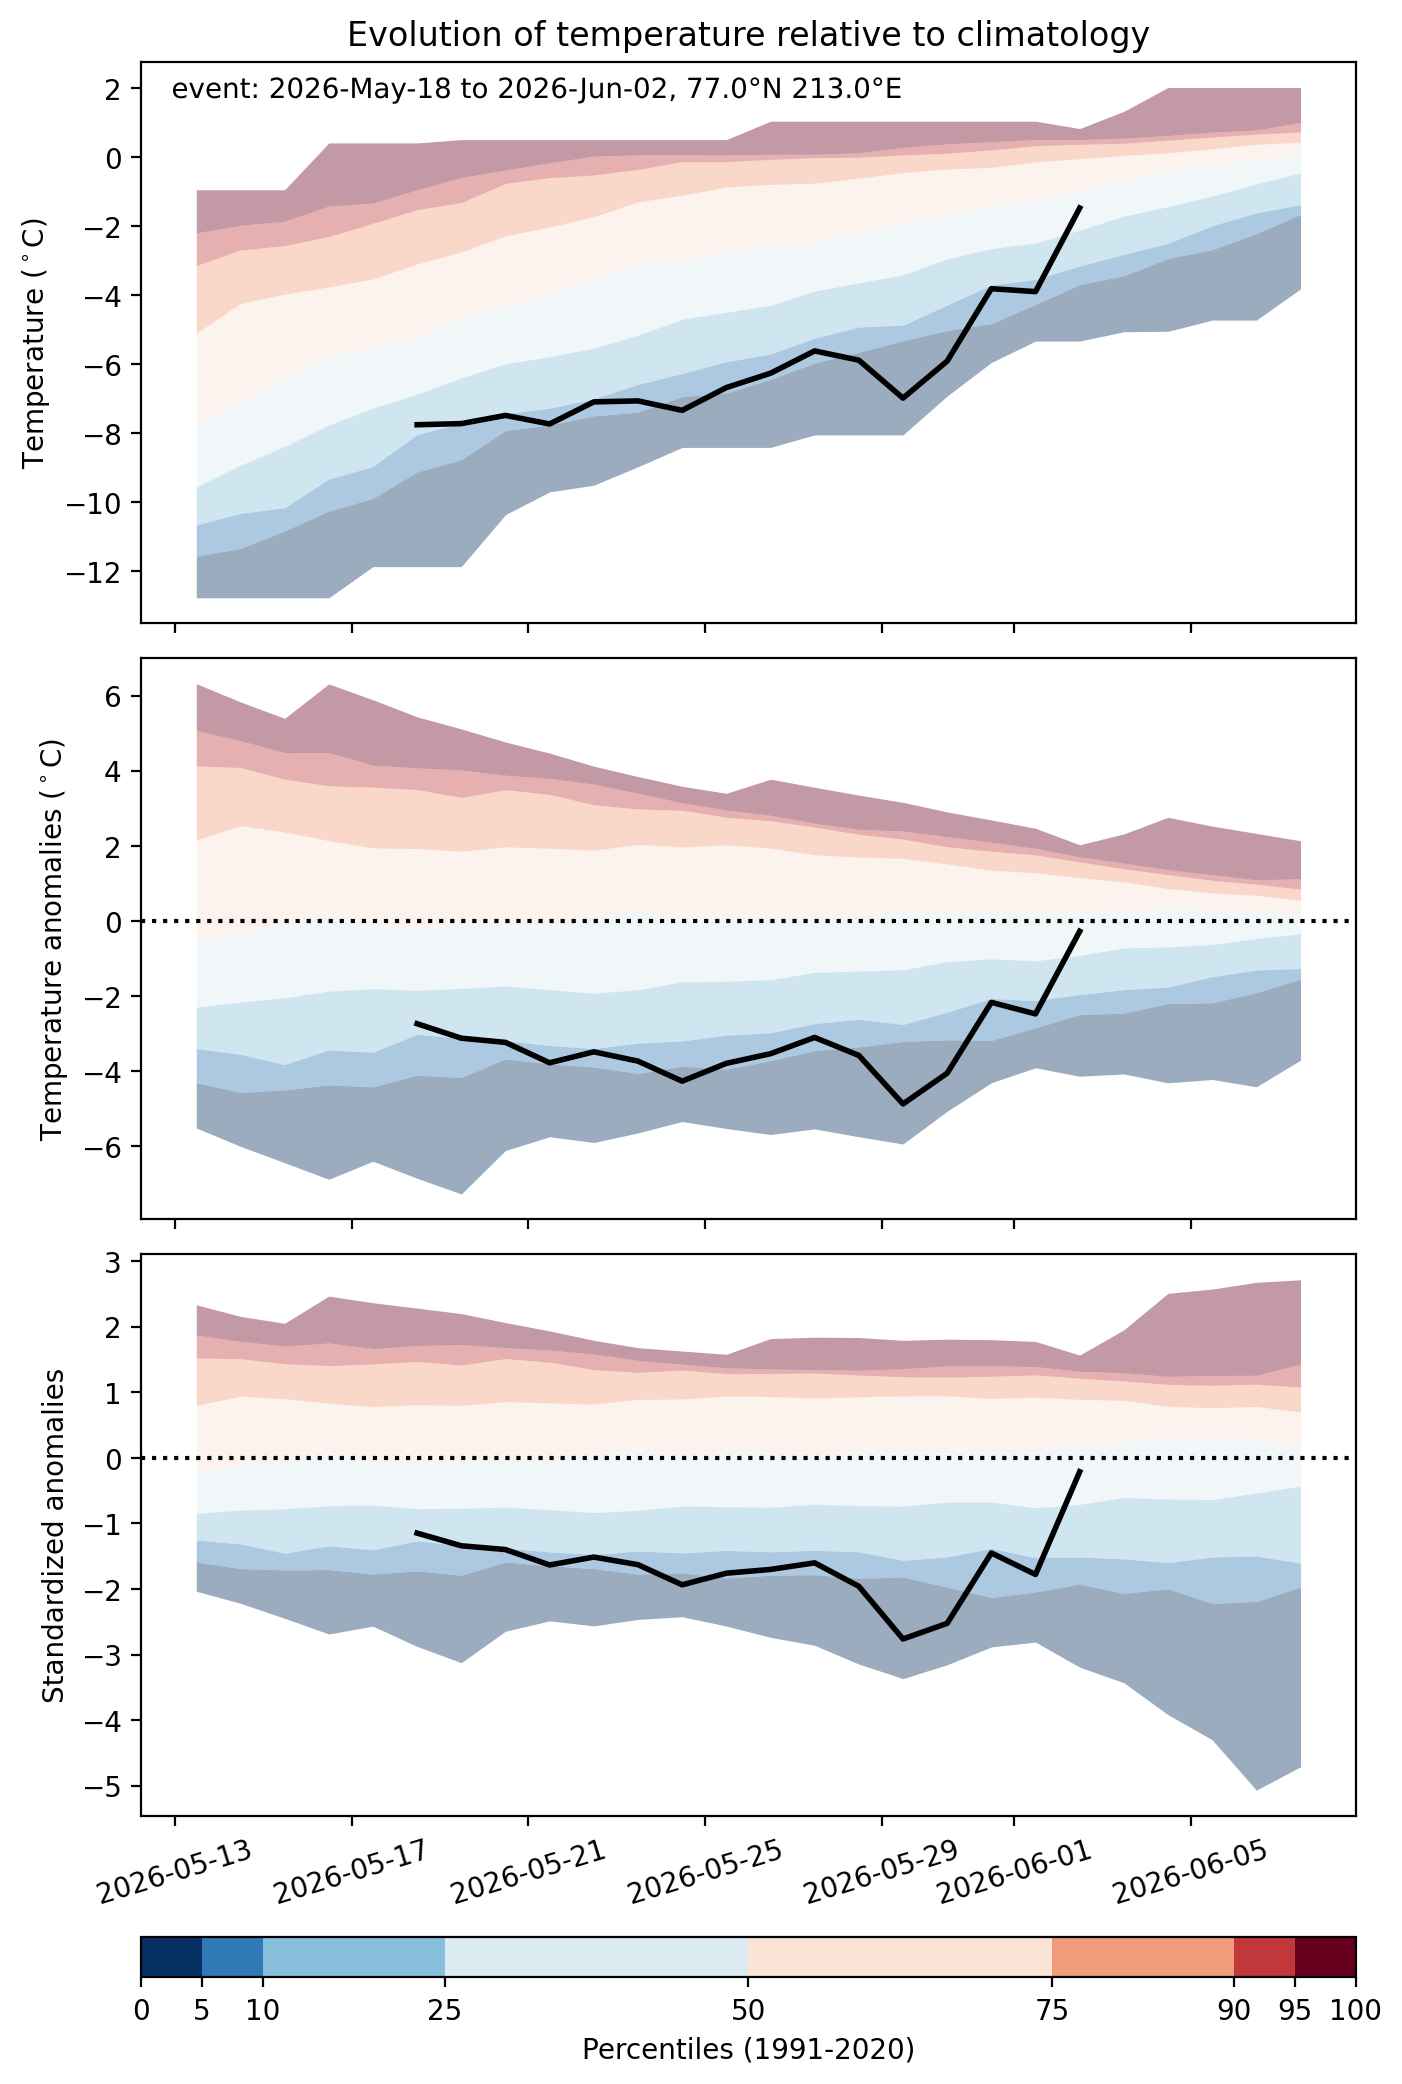
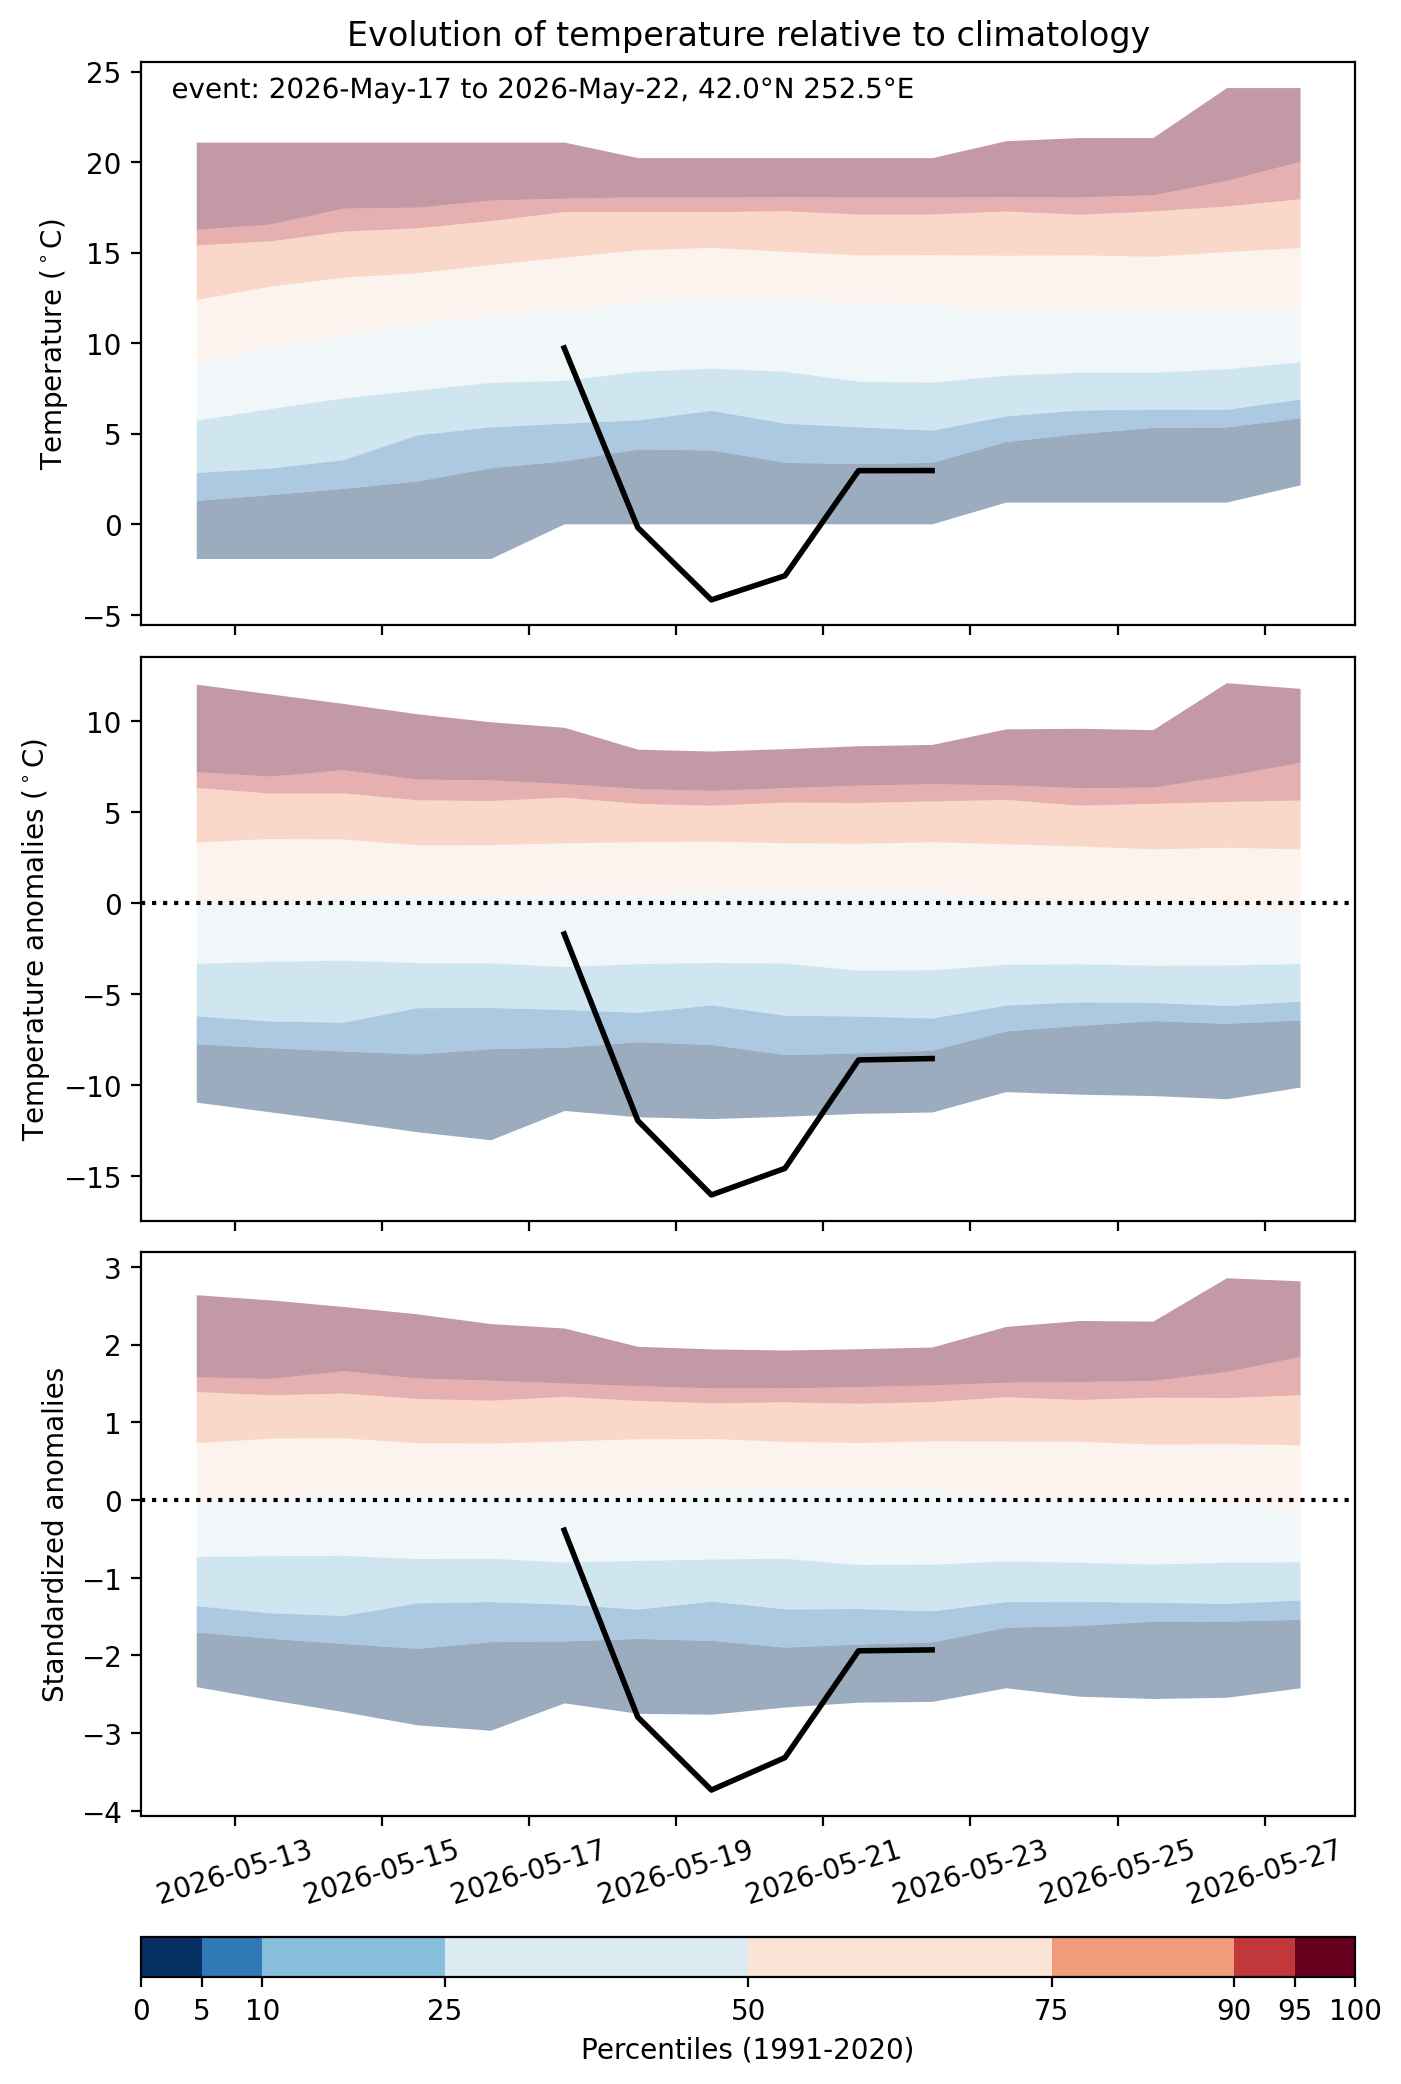
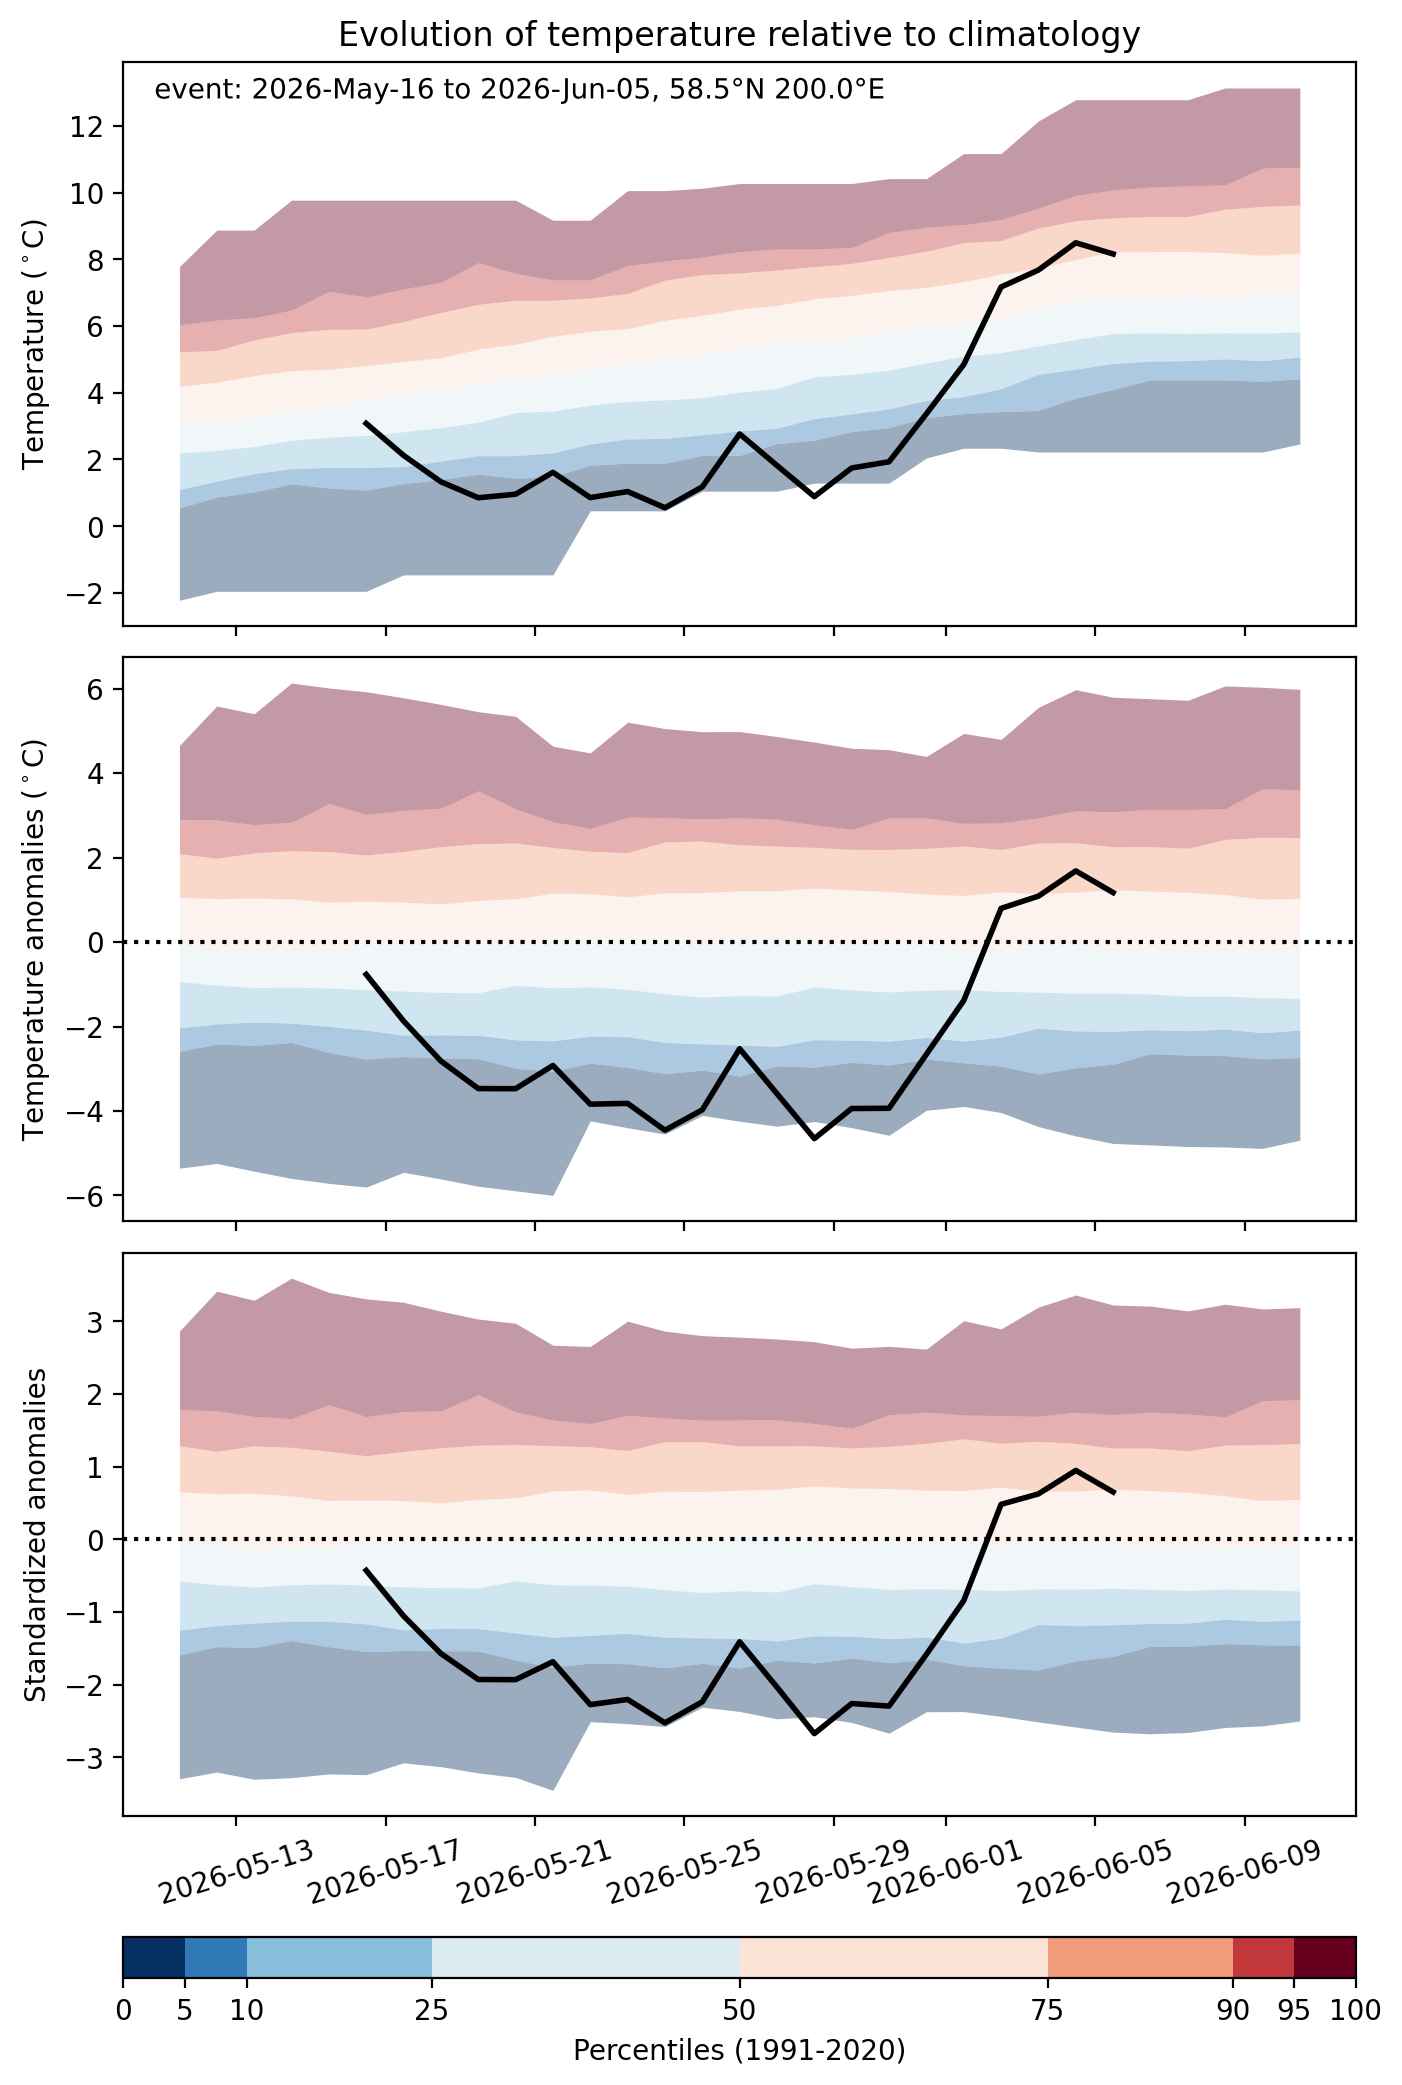
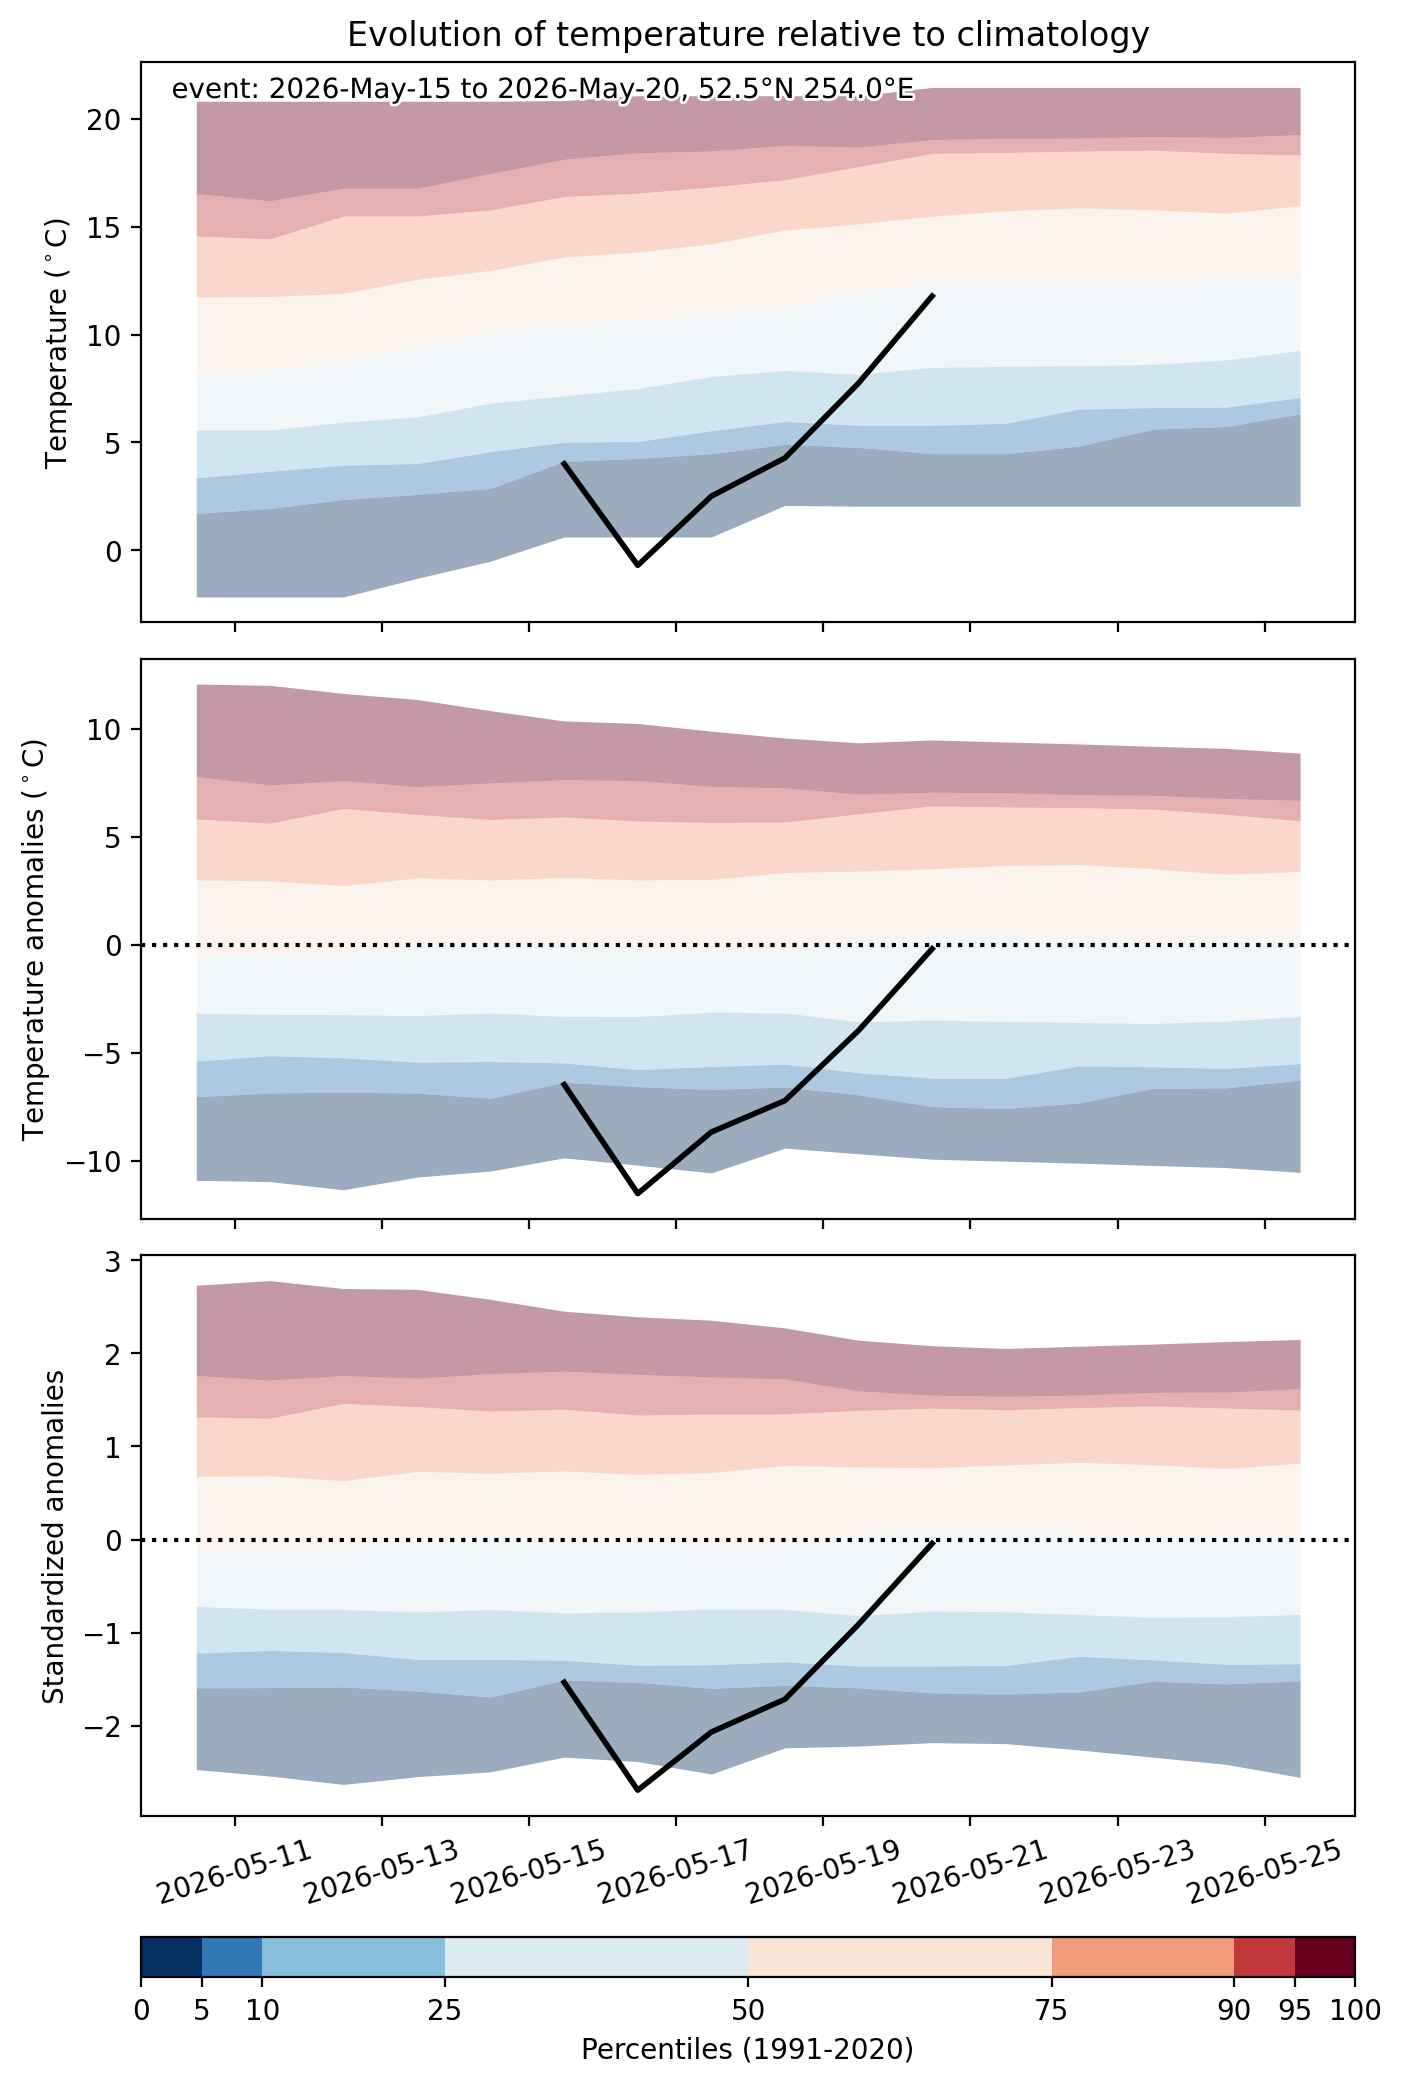
Fig. 2: Evolution of temperature at the center of the event. The climatological percentile distribution is illustrated with color shadings.
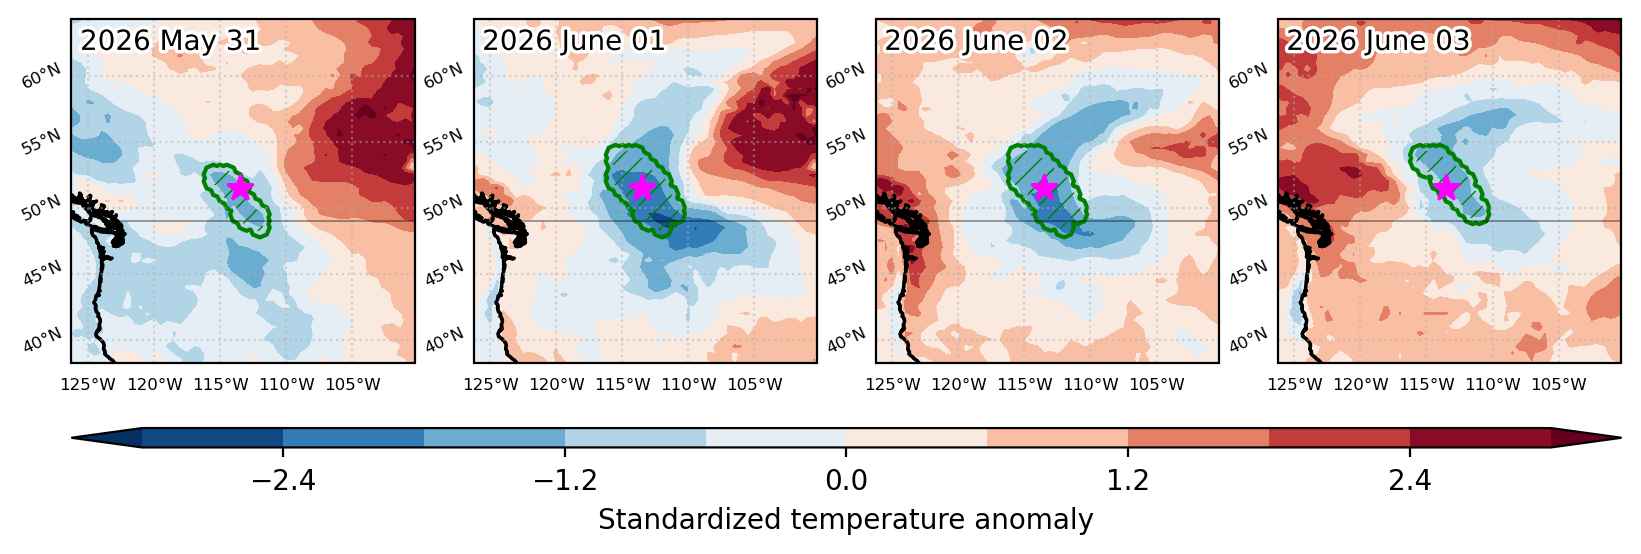


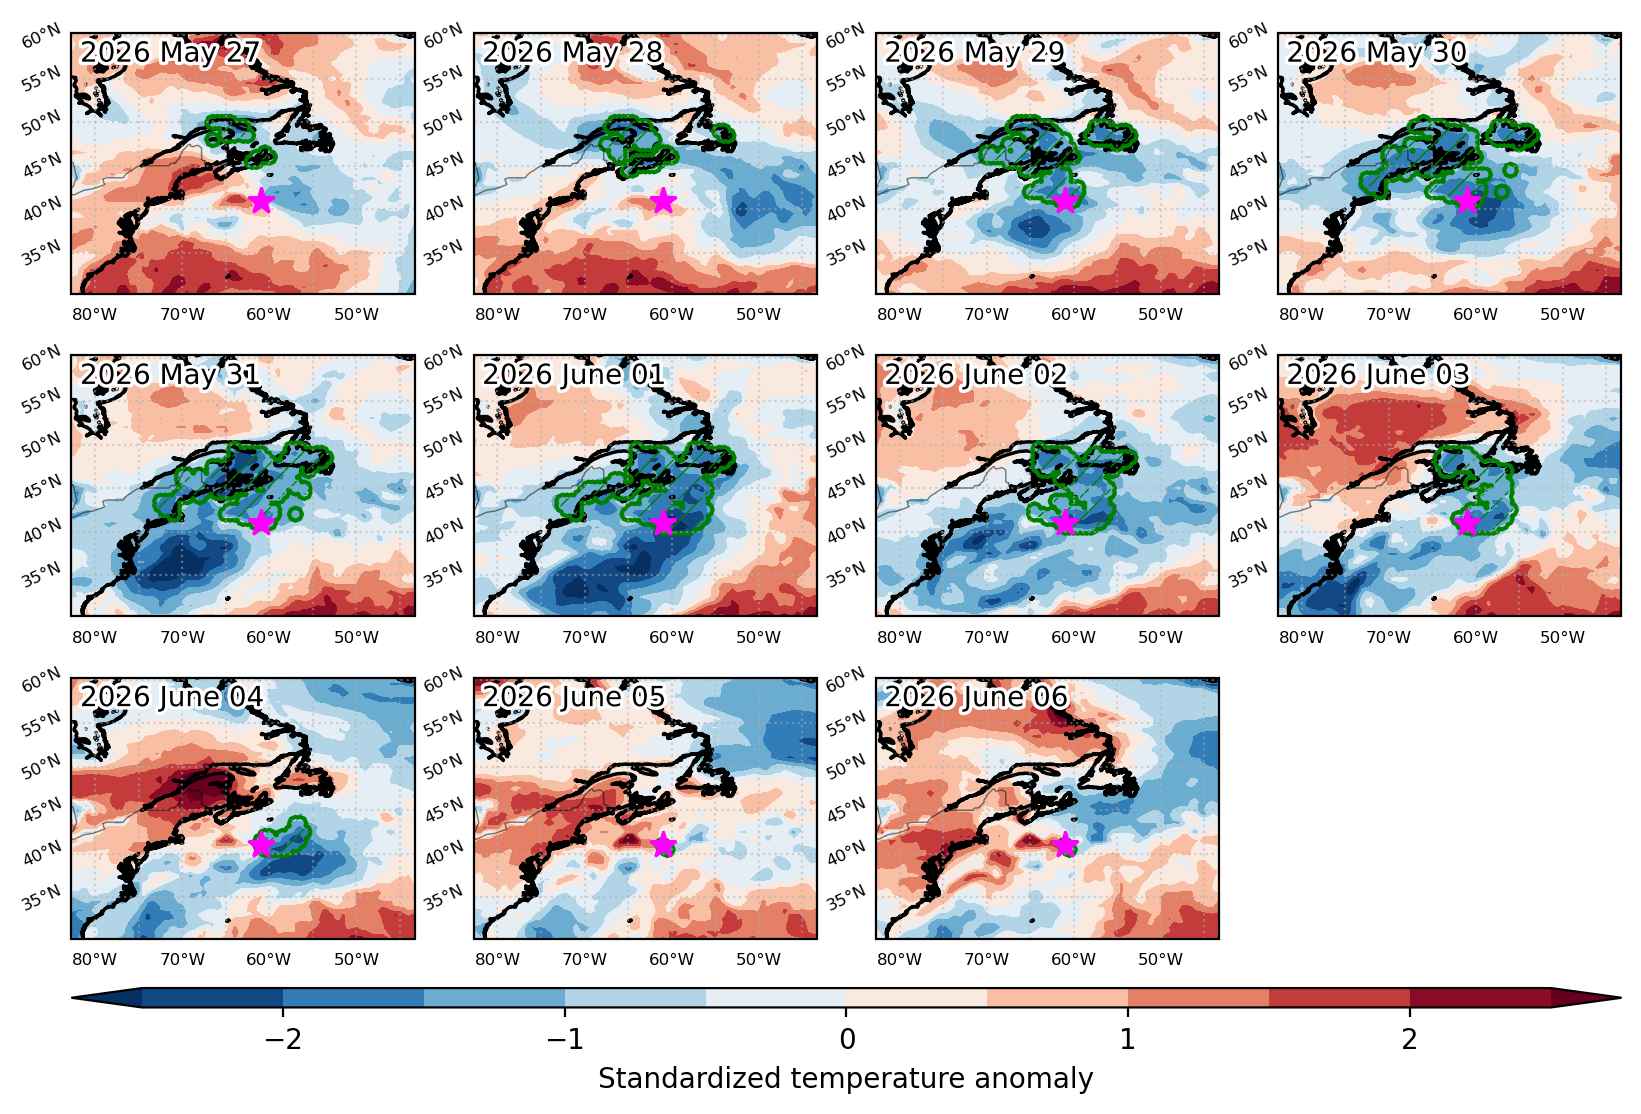
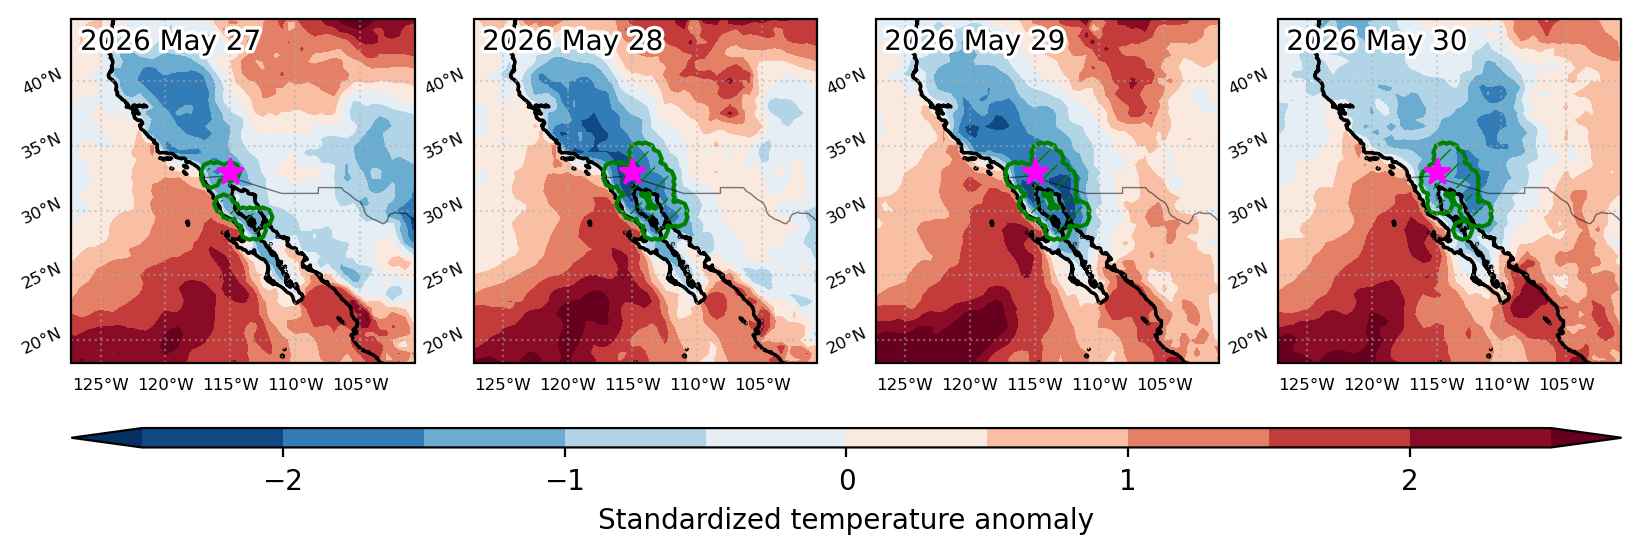
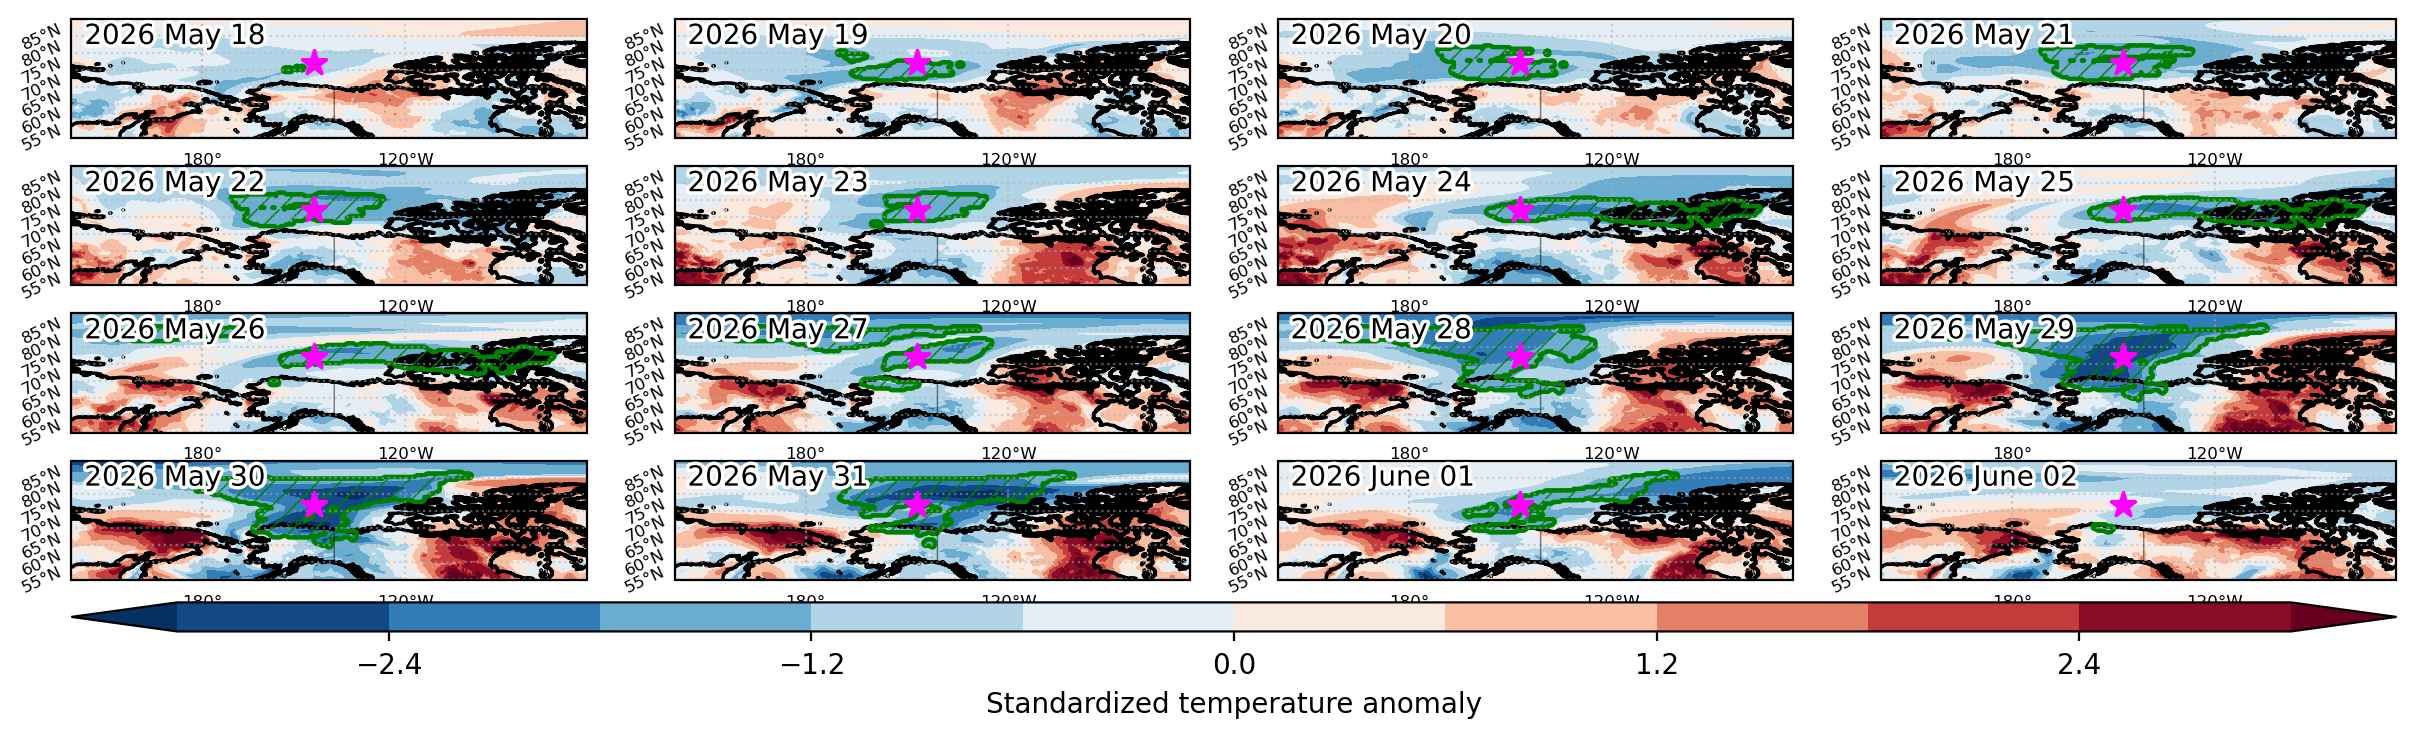
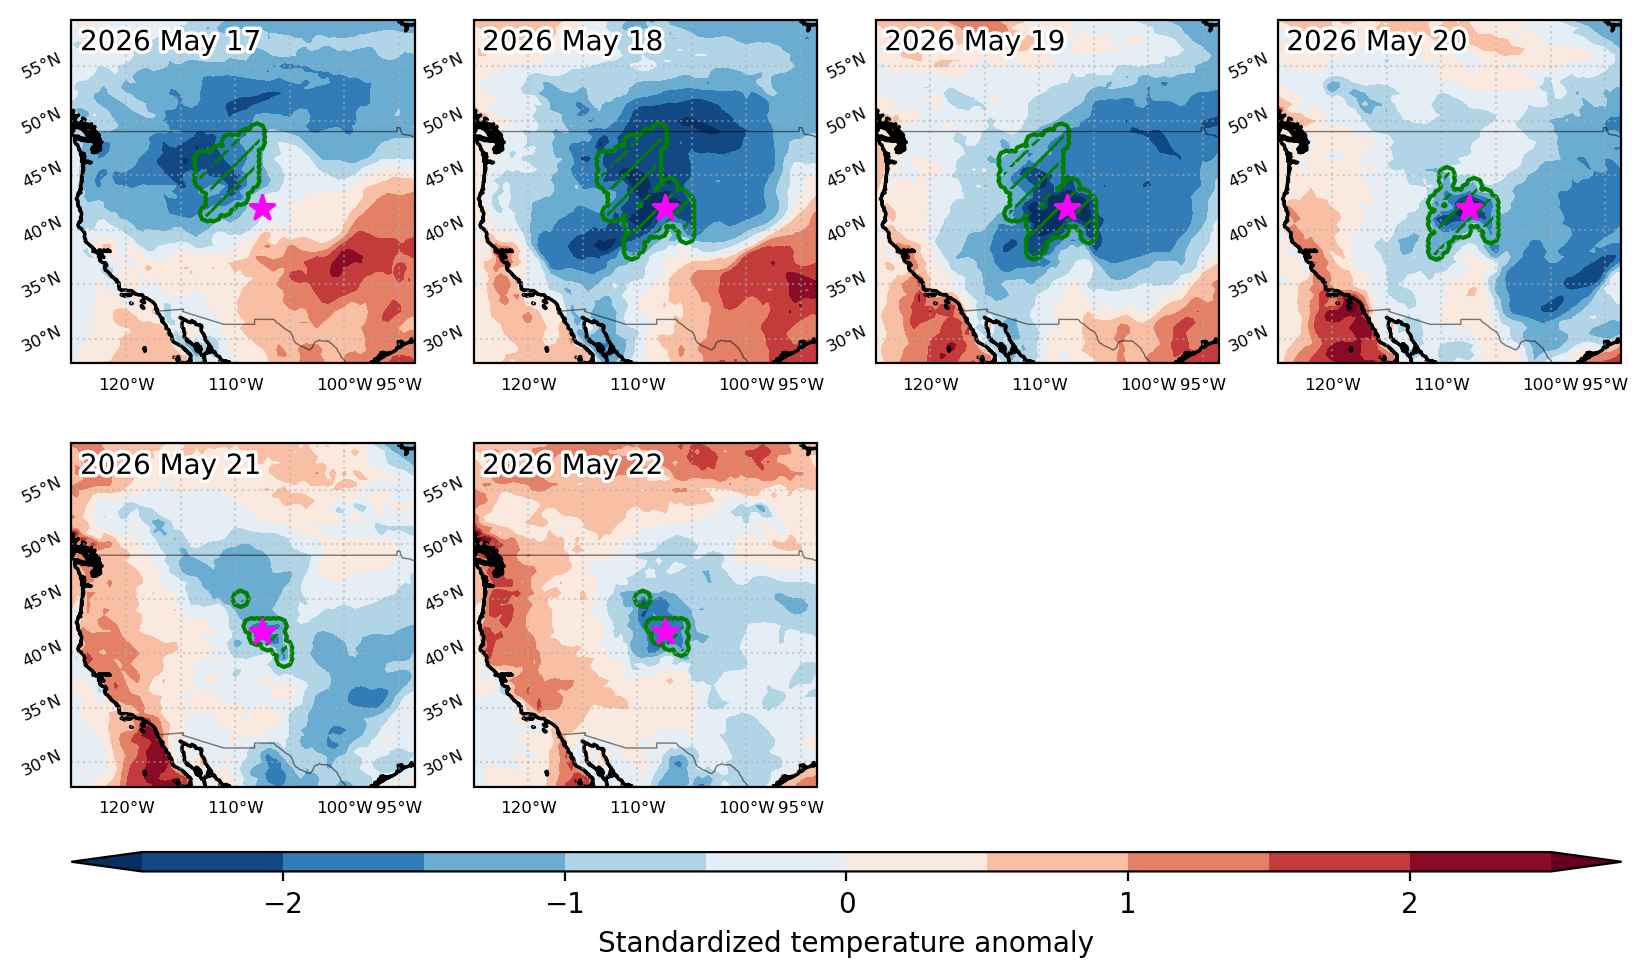
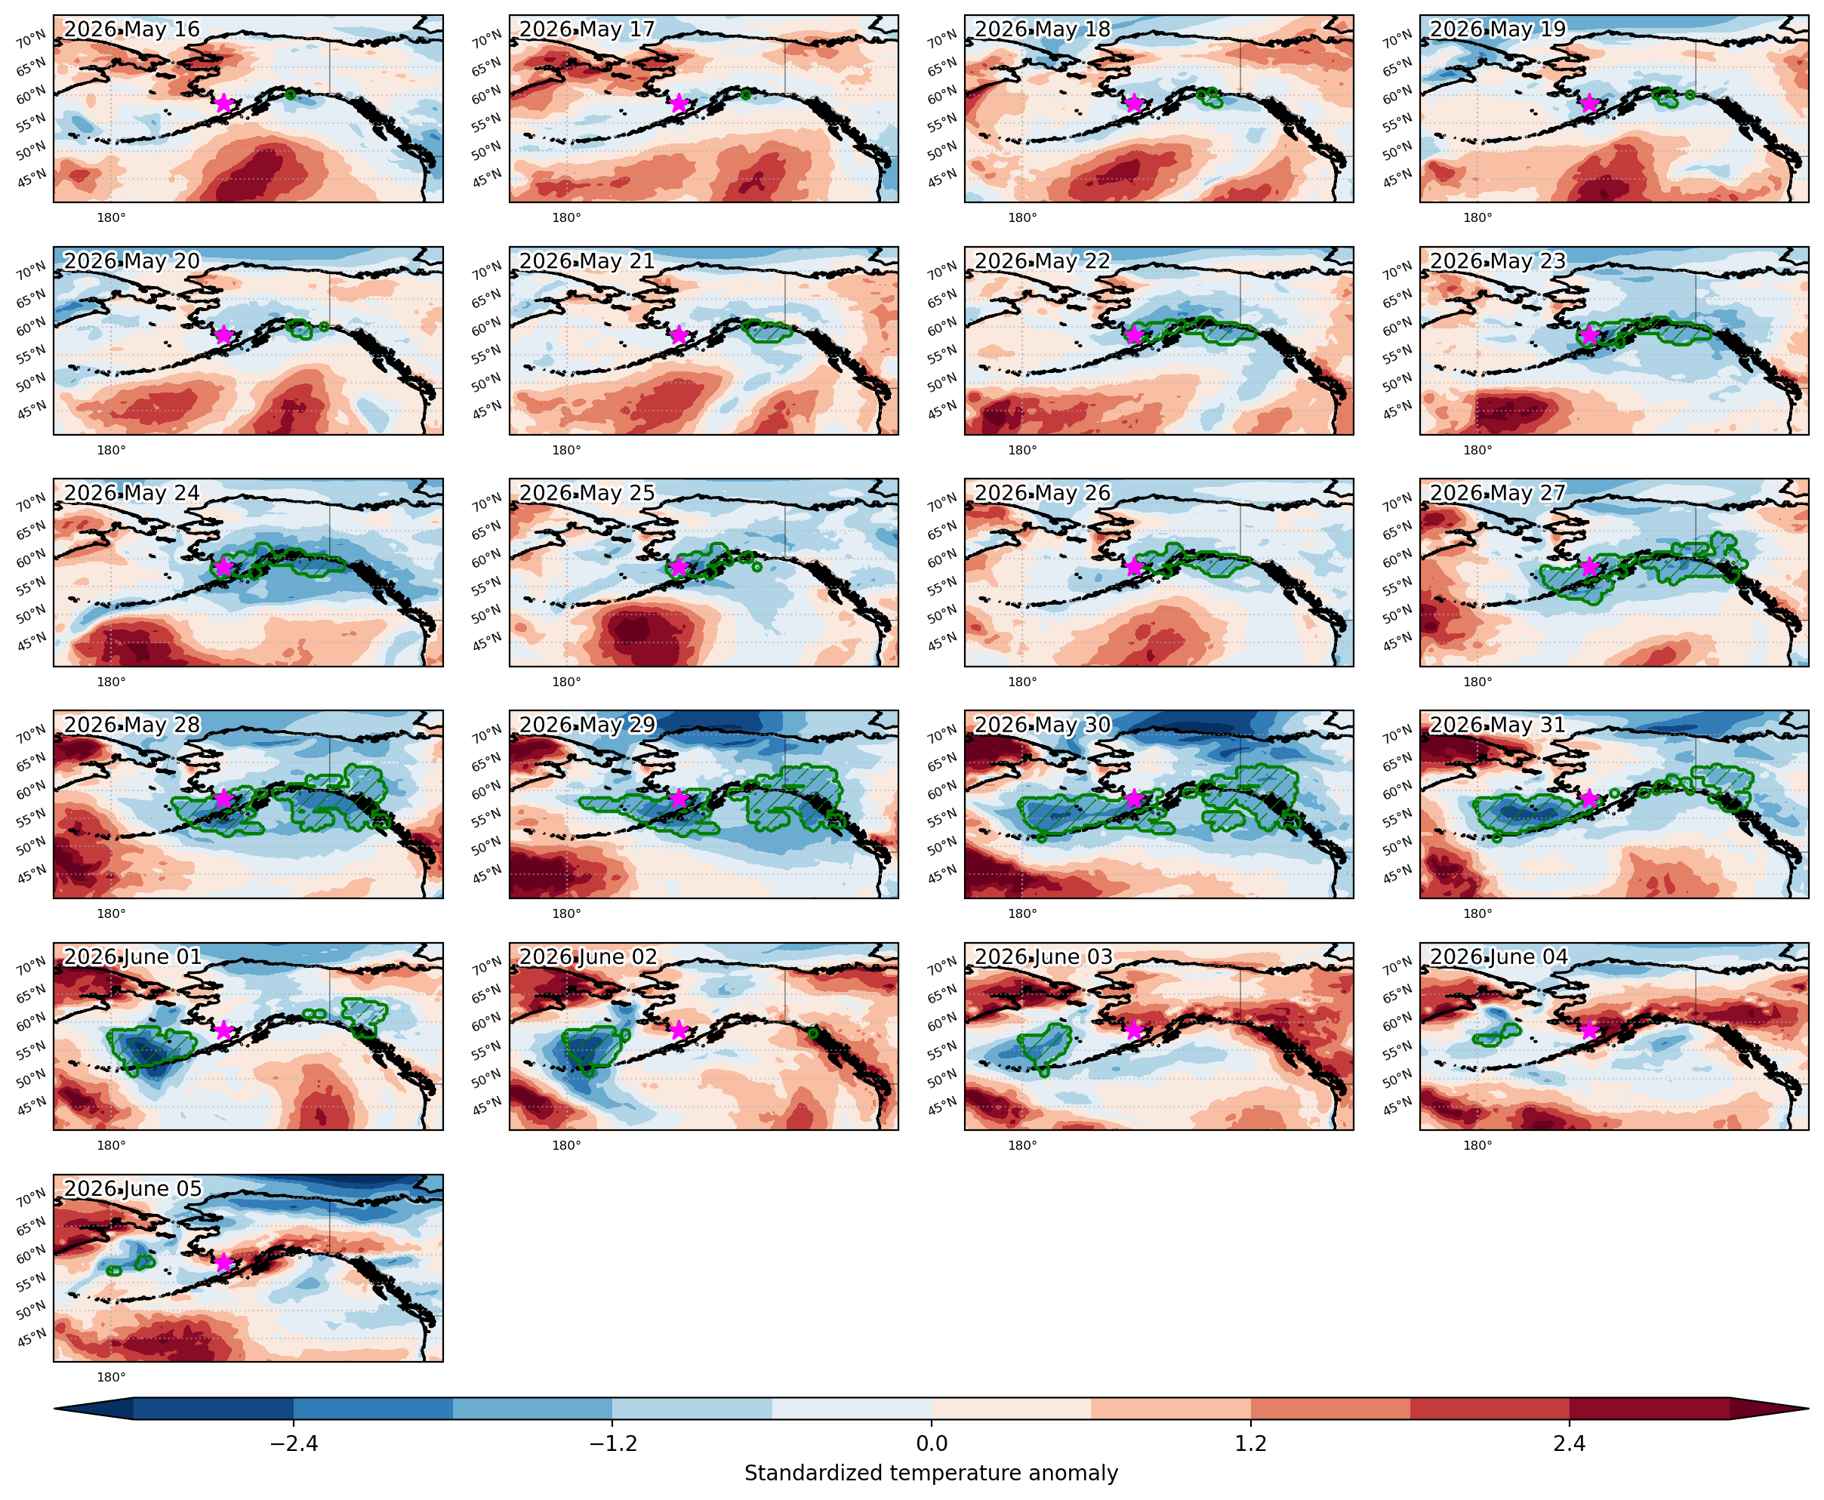
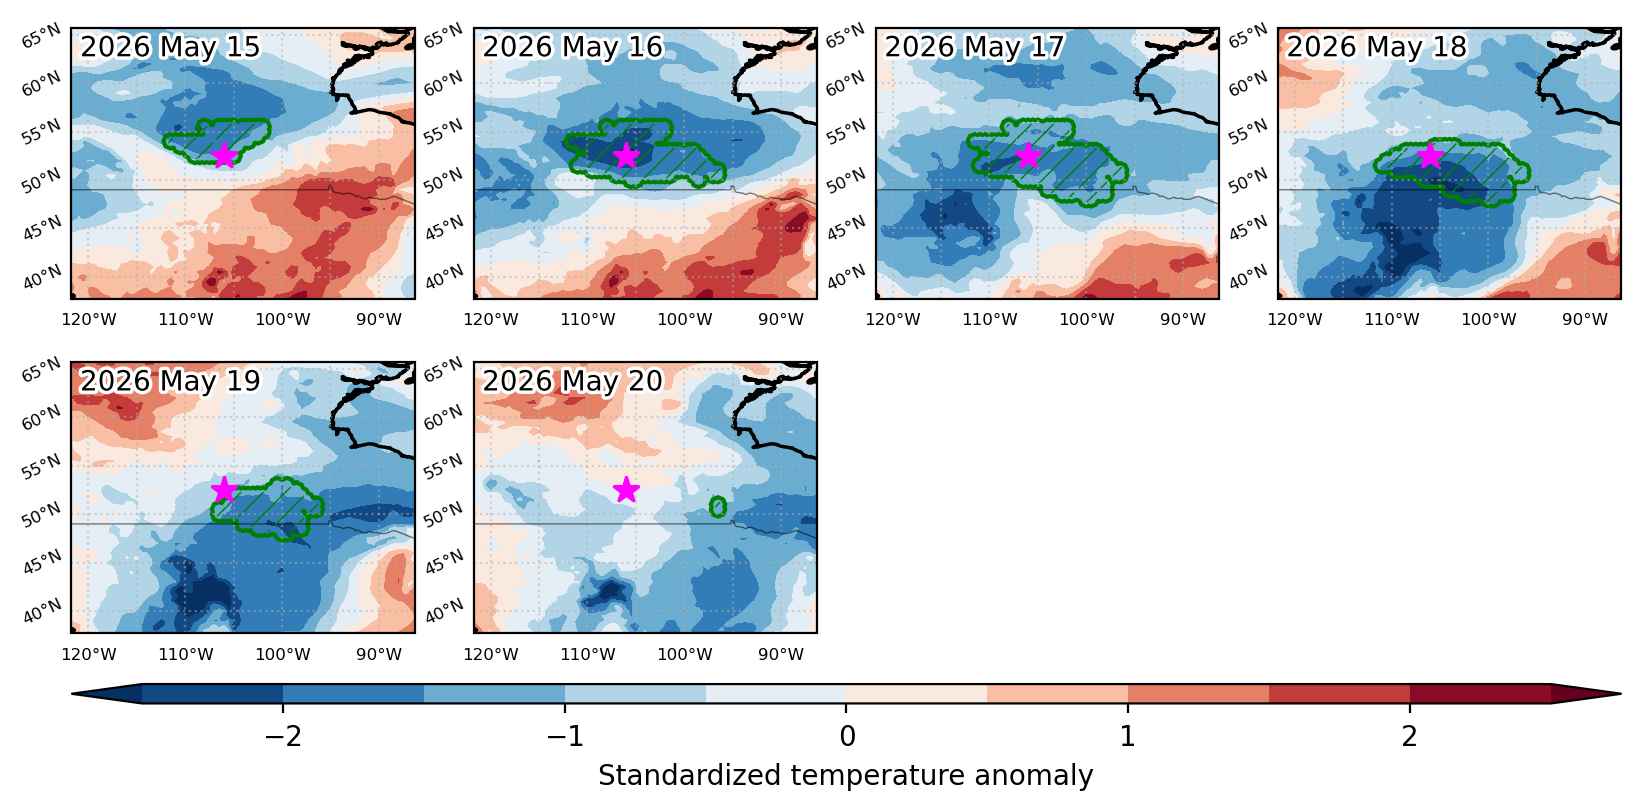
Fig. 3: Maps illustrating the evolution of standardized temperature anomalies during the event.

Event ID: Cold_spell_2026-Feb-24_to_2026-Apr-17_205.0_59.5

Cold spell occuring from March 17 2026 to March 19 2026 at 30.5°N 274.5°E

Download data: JSON

Event type: Cold spell

Countries affected (identified with ArcGIS Online; provided only for geographical reference):

  • United States

Duration: 3 days

Time span: March 17 2026 to March 19 2026

Statistics over entire affected area:

  • Mean temperature anomaly: -7.7 °C
  • Mean temperature: 9.5 °C
  • Minimum temperature anomaly: -10.5 °C
  • Minimum temperature: 5.4 °C

Event center: 30.5°N 274.5°E

Area affected: 125252 km$^2$


Fig. 1: Map of most extreme temperature anomalies (standardized) experienced during the event. The purple star indicates the center of the extreme event. Green hatching illustrates all areas under the effect of extremes at some time during the event.


Fig. 2: Evolution of temperature at the center of the event. The climatological percentile distribution is illustrated with color shadings.


Fig. 3: Maps illustrating the evolution of standardized temperature anomalies during the event.

Event ID: Cold_spell_2026-Mar-17_to_2026-Mar-19_274.5_30.5

Cold spell occuring from March 16 2026 to March 18 2026 at 41.5°N 269.0°E

Download data: JSON

Event type: Cold spell

Countries affected (identified with ArcGIS Online; provided only for geographical reference):

  • United States

Duration: 3 days

Time span: March 16 2026 to March 18 2026

Statistics over entire affected area:

  • Mean temperature anomaly: -9.6 °C
  • Mean temperature: -6.3 °C
  • Minimum temperature anomaly: -15.8 °C
  • Minimum temperature: -11.5 °C

Event center: 41.5°N 269.0°E

Area affected: 72885 km$^2$


Fig. 1: Map of most extreme temperature anomalies (standardized) experienced during the event. The purple star indicates the center of the extreme event. Green hatching illustrates all areas under the effect of extremes at some time during the event.


Fig. 2: Evolution of temperature at the center of the event. The climatological percentile distribution is illustrated with color shadings.


Fig. 3: Maps illustrating the evolution of standardized temperature anomalies during the event.

Event ID: Cold_spell_2026-Mar-16_to_2026-Mar-18_269.0_41.5

Cold spell occuring from February 22 2026 to March 05 2026 at 11.5°N 263.5°E

Download data: JSON

Event type: Cold spell

Countries affected (identified with ArcGIS Online; provided only for geographical reference):

  • Bahamas
  • Belize
  • Cuba
  • Guatemala
  • Mexico
  • United States

Duration: 12 days

Time span: February 22 2026 to March 05 2026

Statistics over entire affected area:

  • Mean temperature anomaly: -4.0 °C
  • Mean temperature: 19.3 °C
  • Minimum temperature anomaly: -11.5 °C
  • Minimum temperature: 4.3 °C

Event center: 11.5°N 263.5°E

Area affected: 1904195 km$^2$


Fig. 1: Map of most extreme temperature anomalies (standardized) experienced during the event. The purple star indicates the center of the extreme event. Green hatching illustrates all areas under the effect of extremes at some time during the event.


Fig. 2: Evolution of temperature at the center of the event. The climatological percentile distribution is illustrated with color shadings.


Fig. 3: Maps illustrating the evolution of standardized temperature anomalies during the event.

Event ID: Cold_spell_2026-Feb-22_to_2026-Mar-05_263.5_11.5

Cold spell occuring from February 19 2026 to February 22 2026 at 37.0°N 253.0°E

Download data: JSON

Event type: Cold spell

Countries affected (identified with ArcGIS Online; provided only for geographical reference):

  • United States

Duration: 4 days

Time span: February 19 2026 to February 22 2026

Statistics over entire affected area:

  • Mean temperature anomaly: -6.0 °C
  • Mean temperature: -11.7 °C
  • Minimum temperature anomaly: -9.7 °C
  • Minimum temperature: -18.1 °C

Event center: 37.0°N 253.0°E

Area affected: 62783 km$^2$


Fig. 1: Map of most extreme temperature anomalies (standardized) experienced during the event. The purple star indicates the center of the extreme event. Green hatching illustrates all areas under the effect of extremes at some time during the event.


Fig. 2: Evolution of temperature at the center of the event. The climatological percentile distribution is illustrated with color shadings.


Fig. 3: Maps illustrating the evolution of standardized temperature anomalies during the event.

Event ID: Cold_spell_2026-Feb-19_to_2026-Feb-22_253.0_37.0

Cold spell occuring from February 01 2026 to February 28 2026 at 76.0°N 274.5°E

Download data: JSON

Event type: Cold spell

Countries affected (identified with ArcGIS Online; provided only for geographical reference):

  • Canada
  • Greenland
  • Russian Federation
  • United States

Duration: 28 days

Time span: February 01 2026 to February 28 2026

Statistics over entire affected area:

  • Mean temperature anomaly: -9.4 °C
  • Mean temperature: -33.7 °C
  • Minimum temperature anomaly: -26.6 °C
  • Minimum temperature: -59.3 °C

Event center: 76.0°N 274.5°E

Area affected: 7556909 km$^2$


Fig. 1: Map of most extreme temperature anomalies (standardized) experienced during the event. The purple star indicates the center of the extreme event. Green hatching illustrates all areas under the effect of extremes at some time during the event.


Fig. 2: Evolution of temperature at the center of the event. The climatological percentile distribution is illustrated with color shadings.


Fig. 3: Maps illustrating the evolution of standardized temperature anomalies during the event.

Event ID: Cold_spell_2026-Feb-01_to_2026-Feb-28_274.5_76.0

Cold spell occuring from January 21 2026 to February 22 2026 at 12.0°N 265.5°E

Download data: JSON

Event type: Cold spell

Countries affected (identified with ArcGIS Online; provided only for geographical reference):

  • Bahamas
  • Belize
  • Canada
  • Colombia
  • Costa Rica
  • Cuba
  • El Salvador
  • Guatemala
  • Haiti
  • Honduras
  • Mexico
  • Nicaragua
  • Panama
  • Turks and Caicos Islands
  • United States

Duration: 33 days

Time span: January 21 2026 to February 22 2026

Statistics over entire affected area:

  • Mean temperature anomaly: -7.7 °C
  • Mean temperature: 2.4 °C
  • Minimum temperature anomaly: -25.2 °C
  • Minimum temperature: -41.8 °C

Event center: 12.0°N 265.5°E

Area affected: 15448330 km$^2$


Fig. 1: Map of most extreme temperature anomalies (standardized) experienced during the event. The purple star indicates the center of the extreme event. Green hatching illustrates all areas under the effect of extremes at some time during the event.


Fig. 2: Evolution of temperature at the center of the event. The climatological percentile distribution is illustrated with color shadings.


Fig. 3: Maps illustrating the evolution of standardized temperature anomalies during the event.

Event ID: Cold_spell_2026-Jan-21_to_2026-Feb-22_265.5_12.0

Cold spell occuring from December 12 2025 to December 16 2025 at 41.5°N 282.5°E

Download data: JSON

Event type: Cold spell

Countries affected (identified with ArcGIS Online; provided only for geographical reference):

  • United States

Duration: 5 days

Time span: December 12 2025 to December 16 2025

Statistics over entire affected area:

  • Mean temperature anomaly: -10.0 °C
  • Mean temperature: -9.0 °C
  • Minimum temperature anomaly: -17.2 °C
  • Minimum temperature: -15.4 °C

Event center: 41.5°N 282.5°E

Area affected: 145745 km$^2$


Fig. 1: Map of most extreme temperature anomalies (standardized) experienced during the event. The purple star indicates the center of the extreme event. Green hatching illustrates all areas under the effect of extremes at some time during the event.


Fig. 2: Evolution of temperature at the center of the event. The climatological percentile distribution is illustrated with color shadings.


Fig. 3: Maps illustrating the evolution of standardized temperature anomalies during the event.

Event ID: Cold_spell_2025-Dec-12_to_2025-Dec-16_282.5_41.5

Cold spell occuring from December 12 2025 to December 16 2025 at 39.5°N 272.0°E

Download data: JSON

Event type: Cold spell

Countries affected (identified with ArcGIS Online; provided only for geographical reference):

  • United States

Duration: 5 days

Time span: December 12 2025 to December 16 2025

Statistics over entire affected area:

  • Mean temperature anomaly: -11.8 °C
  • Mean temperature: -12.6 °C
  • Minimum temperature anomaly: -19.9 °C
  • Minimum temperature: -20.7 °C

Event center: 39.5°N 272.0°E

Area affected: 193183 km$^2$


Fig. 1: Map of most extreme temperature anomalies (standardized) experienced during the event. The purple star indicates the center of the extreme event. Green hatching illustrates all areas under the effect of extremes at some time during the event.


Fig. 2: Evolution of temperature at the center of the event. The climatological percentile distribution is illustrated with color shadings.


Fig. 3: Maps illustrating the evolution of standardized temperature anomalies during the event.

Event ID: Cold_spell_2025-Dec-12_to_2025-Dec-16_272.0_39.5

Cold spell occuring from December 11 2025 to December 26 2025 at 26.0°N 170.5°E

Download data: JSON

Event type: Cold spell

Countries affected (identified with ArcGIS Online; provided only for geographical reference):

  • United States

Duration: 16 days

Time span: December 11 2025 to December 26 2025

Statistics over entire affected area:

  • Mean temperature anomaly: -2.3 °C
  • Mean temperature: 21.4 °C
  • Minimum temperature anomaly: -5.5 °C
  • Minimum temperature: 13.2 °C

Event center: 26.0°N 170.5°E

Area affected: 4154775 km$^2$


Fig. 1: Map of most extreme temperature anomalies (standardized) experienced during the event. The purple star indicates the center of the extreme event. Green hatching illustrates all areas under the effect of extremes at some time during the event.


Fig. 2: Evolution of temperature at the center of the event. The climatological percentile distribution is illustrated with color shadings.


Fig. 3: Maps illustrating the evolution of standardized temperature anomalies during the event.

Event ID: Cold_spell_2025-Dec-11_to_2025-Dec-26_170.5_26.0