Heat wave occuring from July 18 2022 to August 08 2022 at -17.0°S 293.5°E

Download data: JSON

Event type: Heat wave

Countries affected (identified with ArcGIS Online; provided only for geographical reference):

  • Argentina
  • Bolivia, Plurinational State of
  • Brazil
  • Chile
  • Paraguay
  • Peru
  • Uruguay

Duration: 22 days

Time span: July 18 2022 to August 08 2022

Statistics over entire affected area:

  • Mean temperature anomaly: 6.0 °C
  • Mean temperature: 19.3 °C
  • Maximum temperature anomaly: 14.9 °C
  • Maximum temperature: 30.4 °C

Event center: -17.0°S 293.5°E

Area affected: 3957873 km$^2$
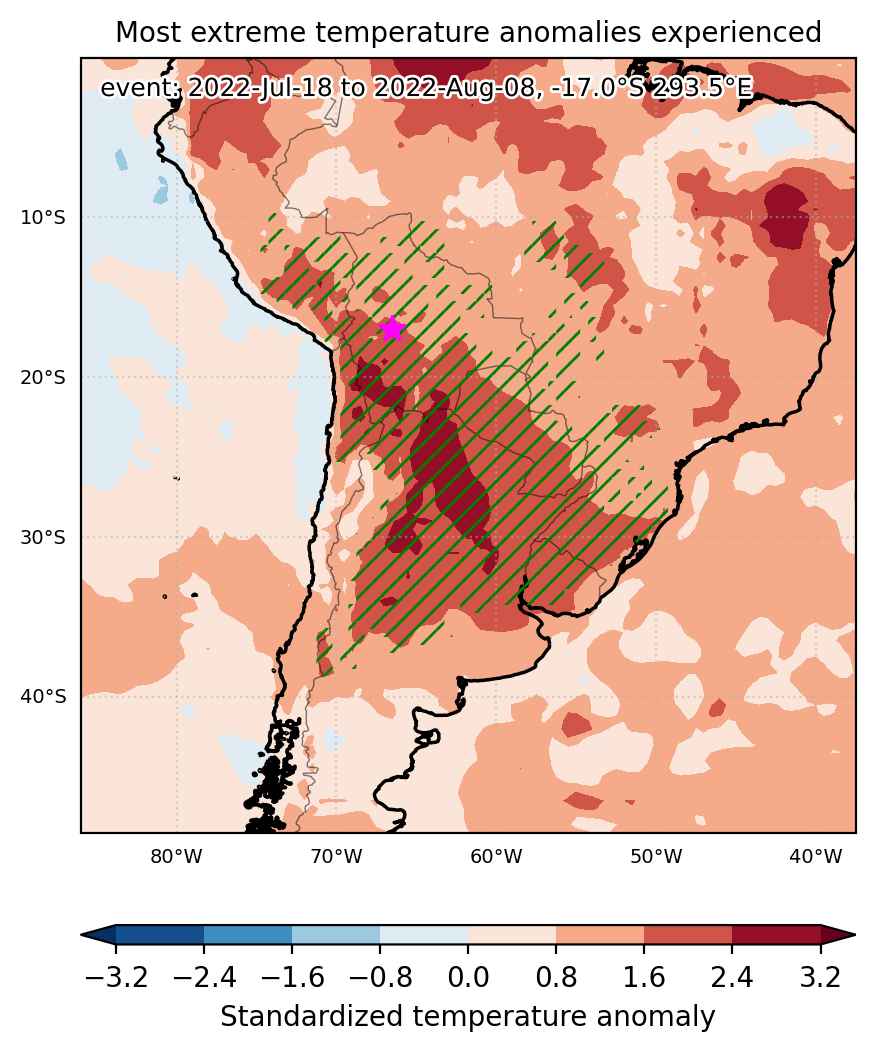

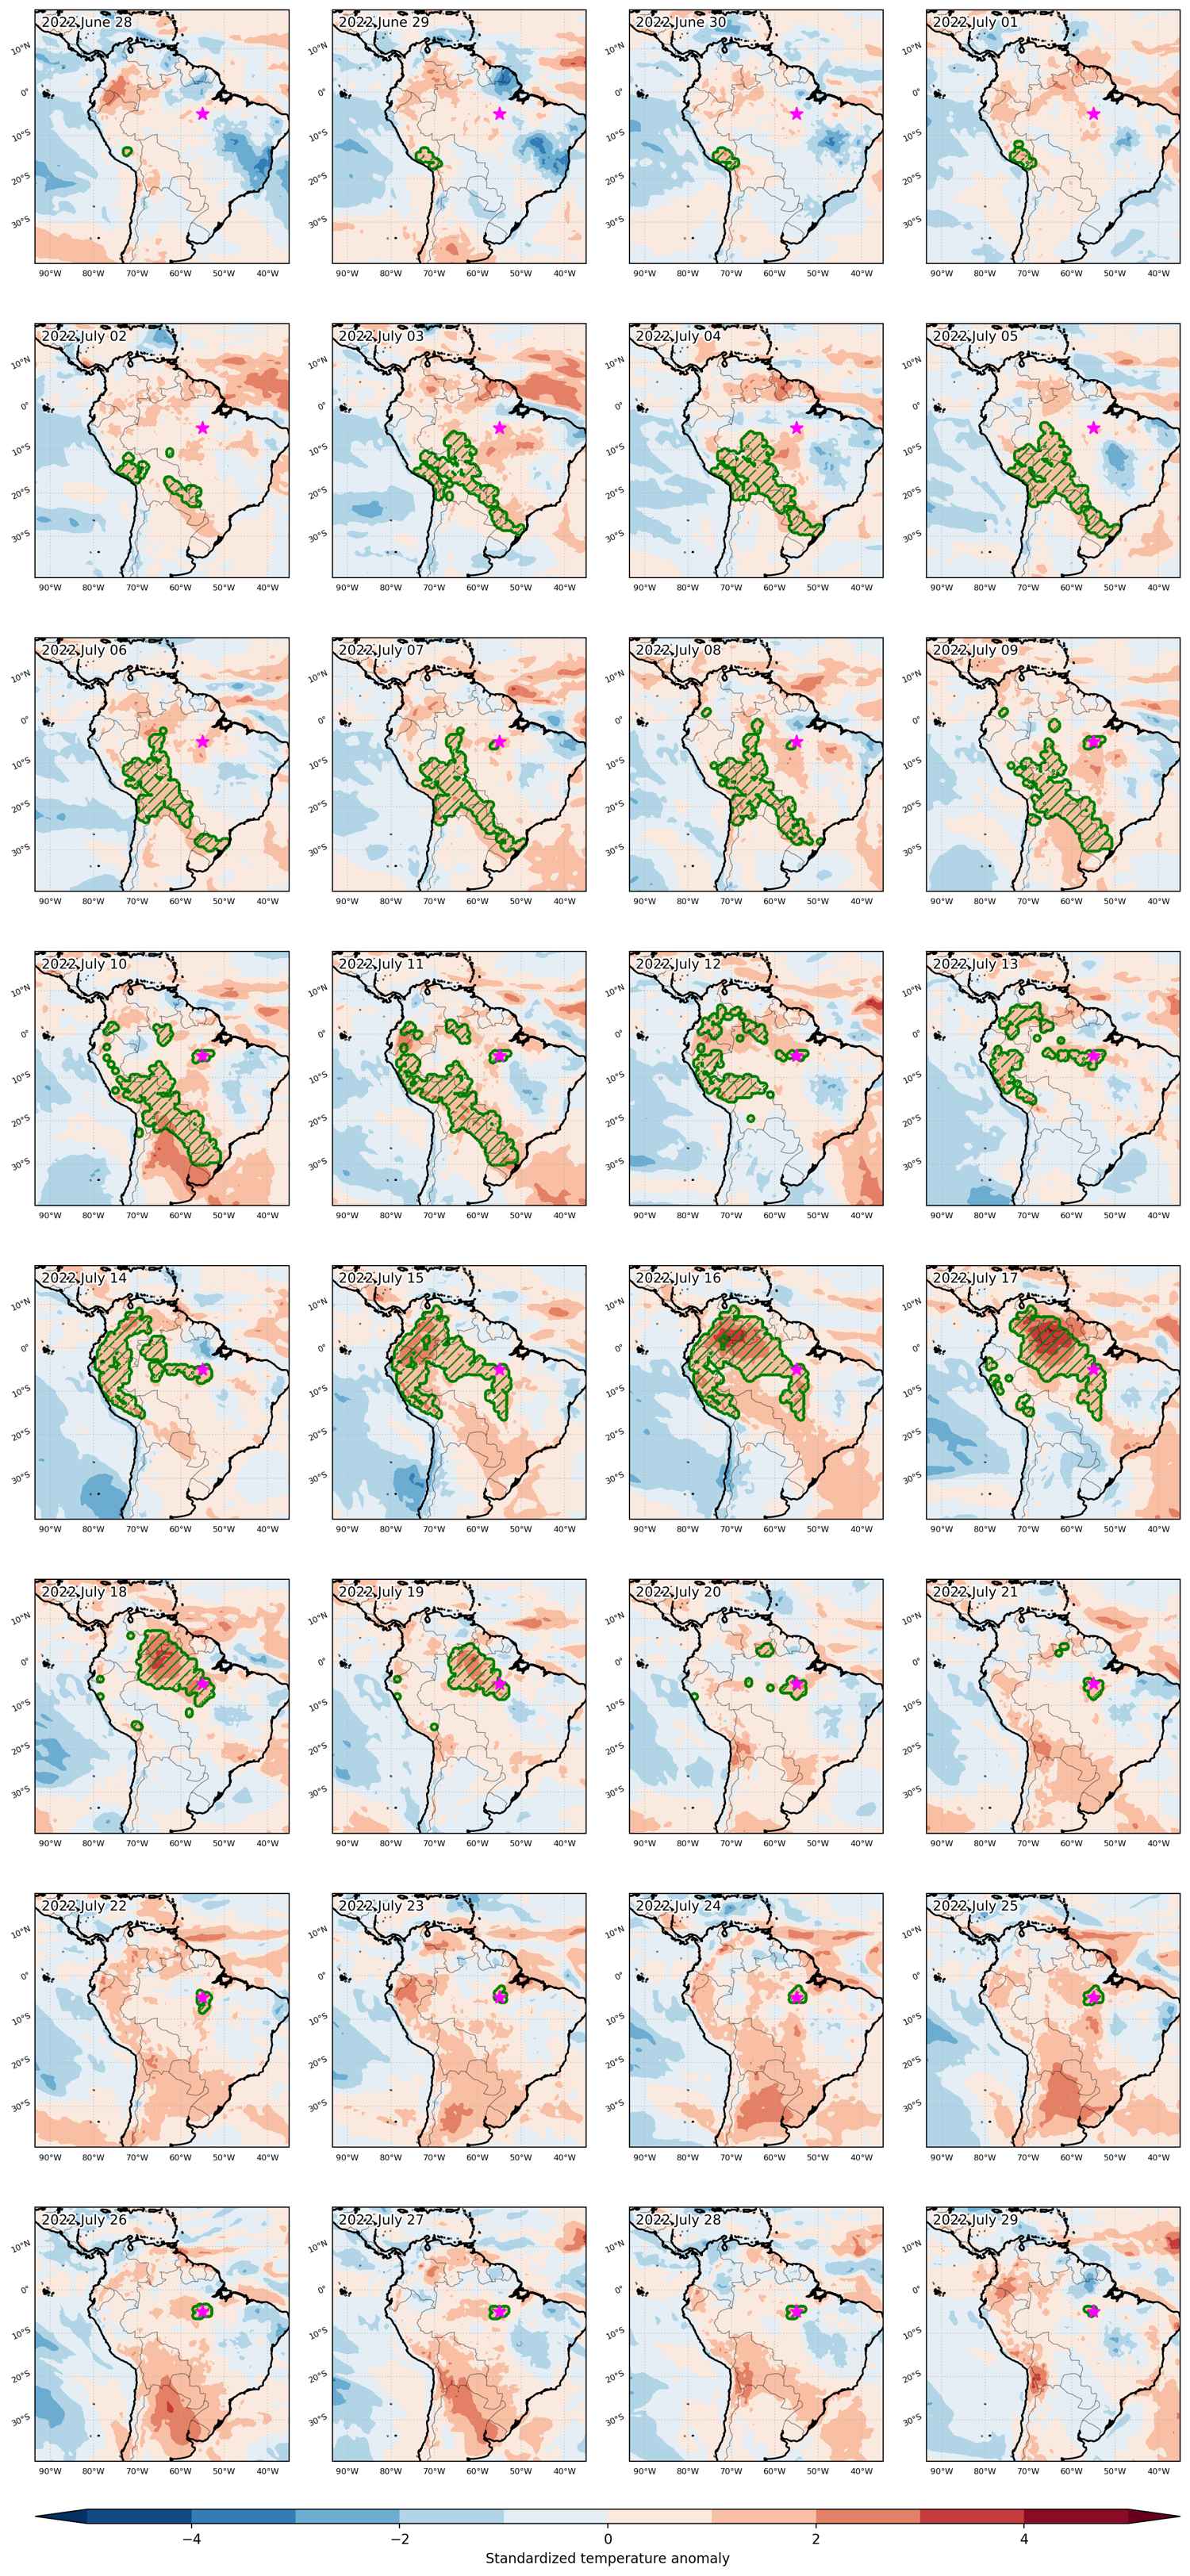
Fig. 1: Map of most extreme temperature anomalies (standardized) experienced during the event. The purple star indicates the center of the extreme event. Green hatching illustrates all areas under the effect of extremes at some time during the event.
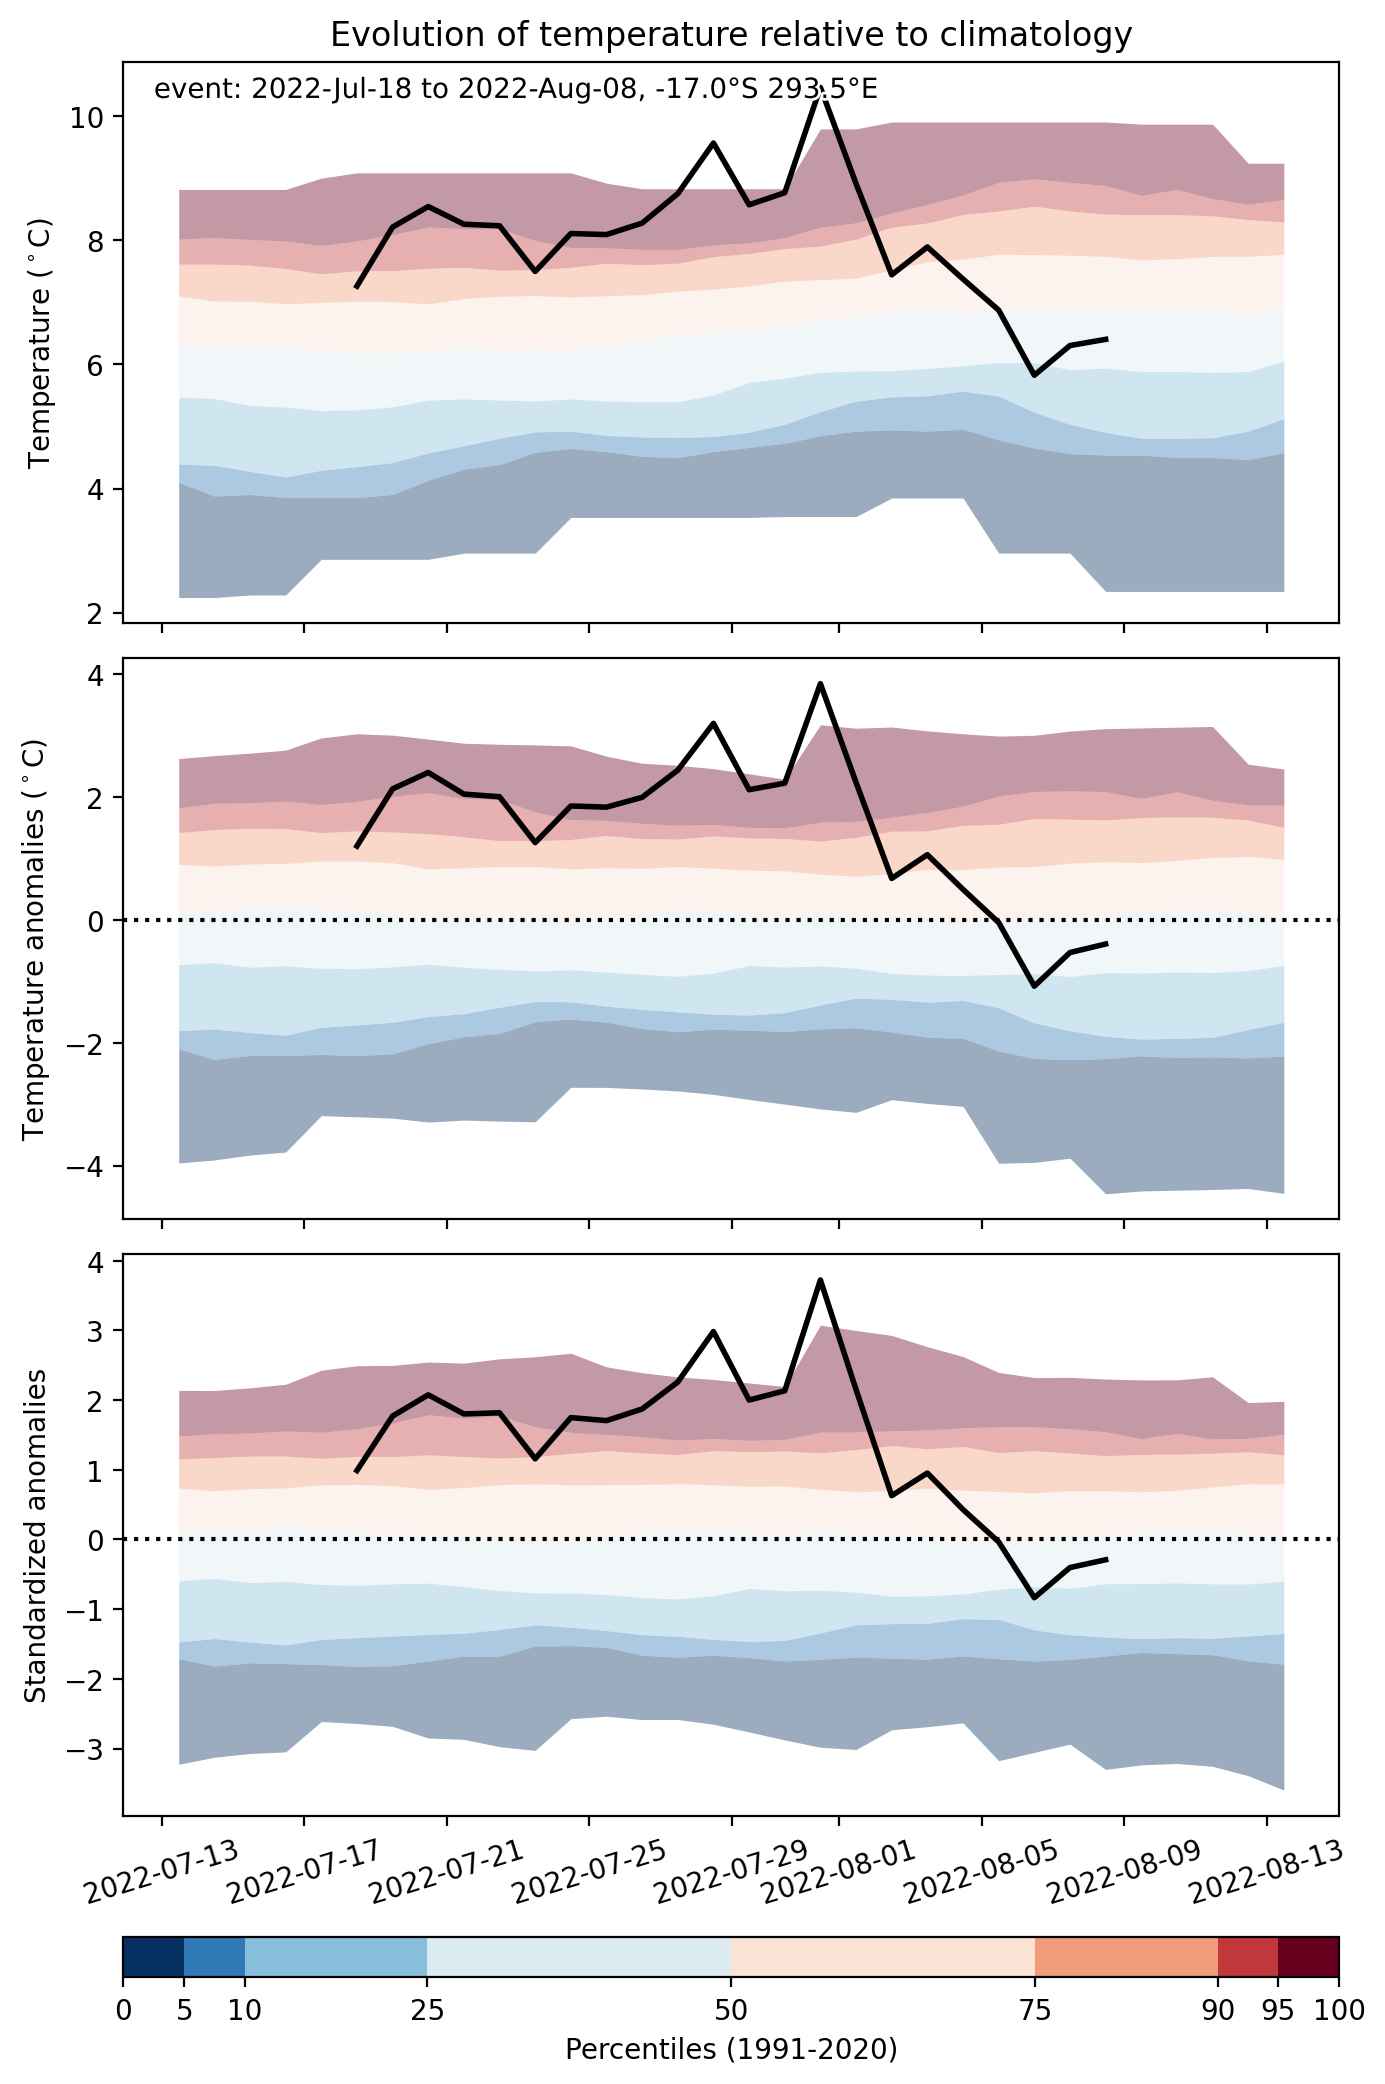


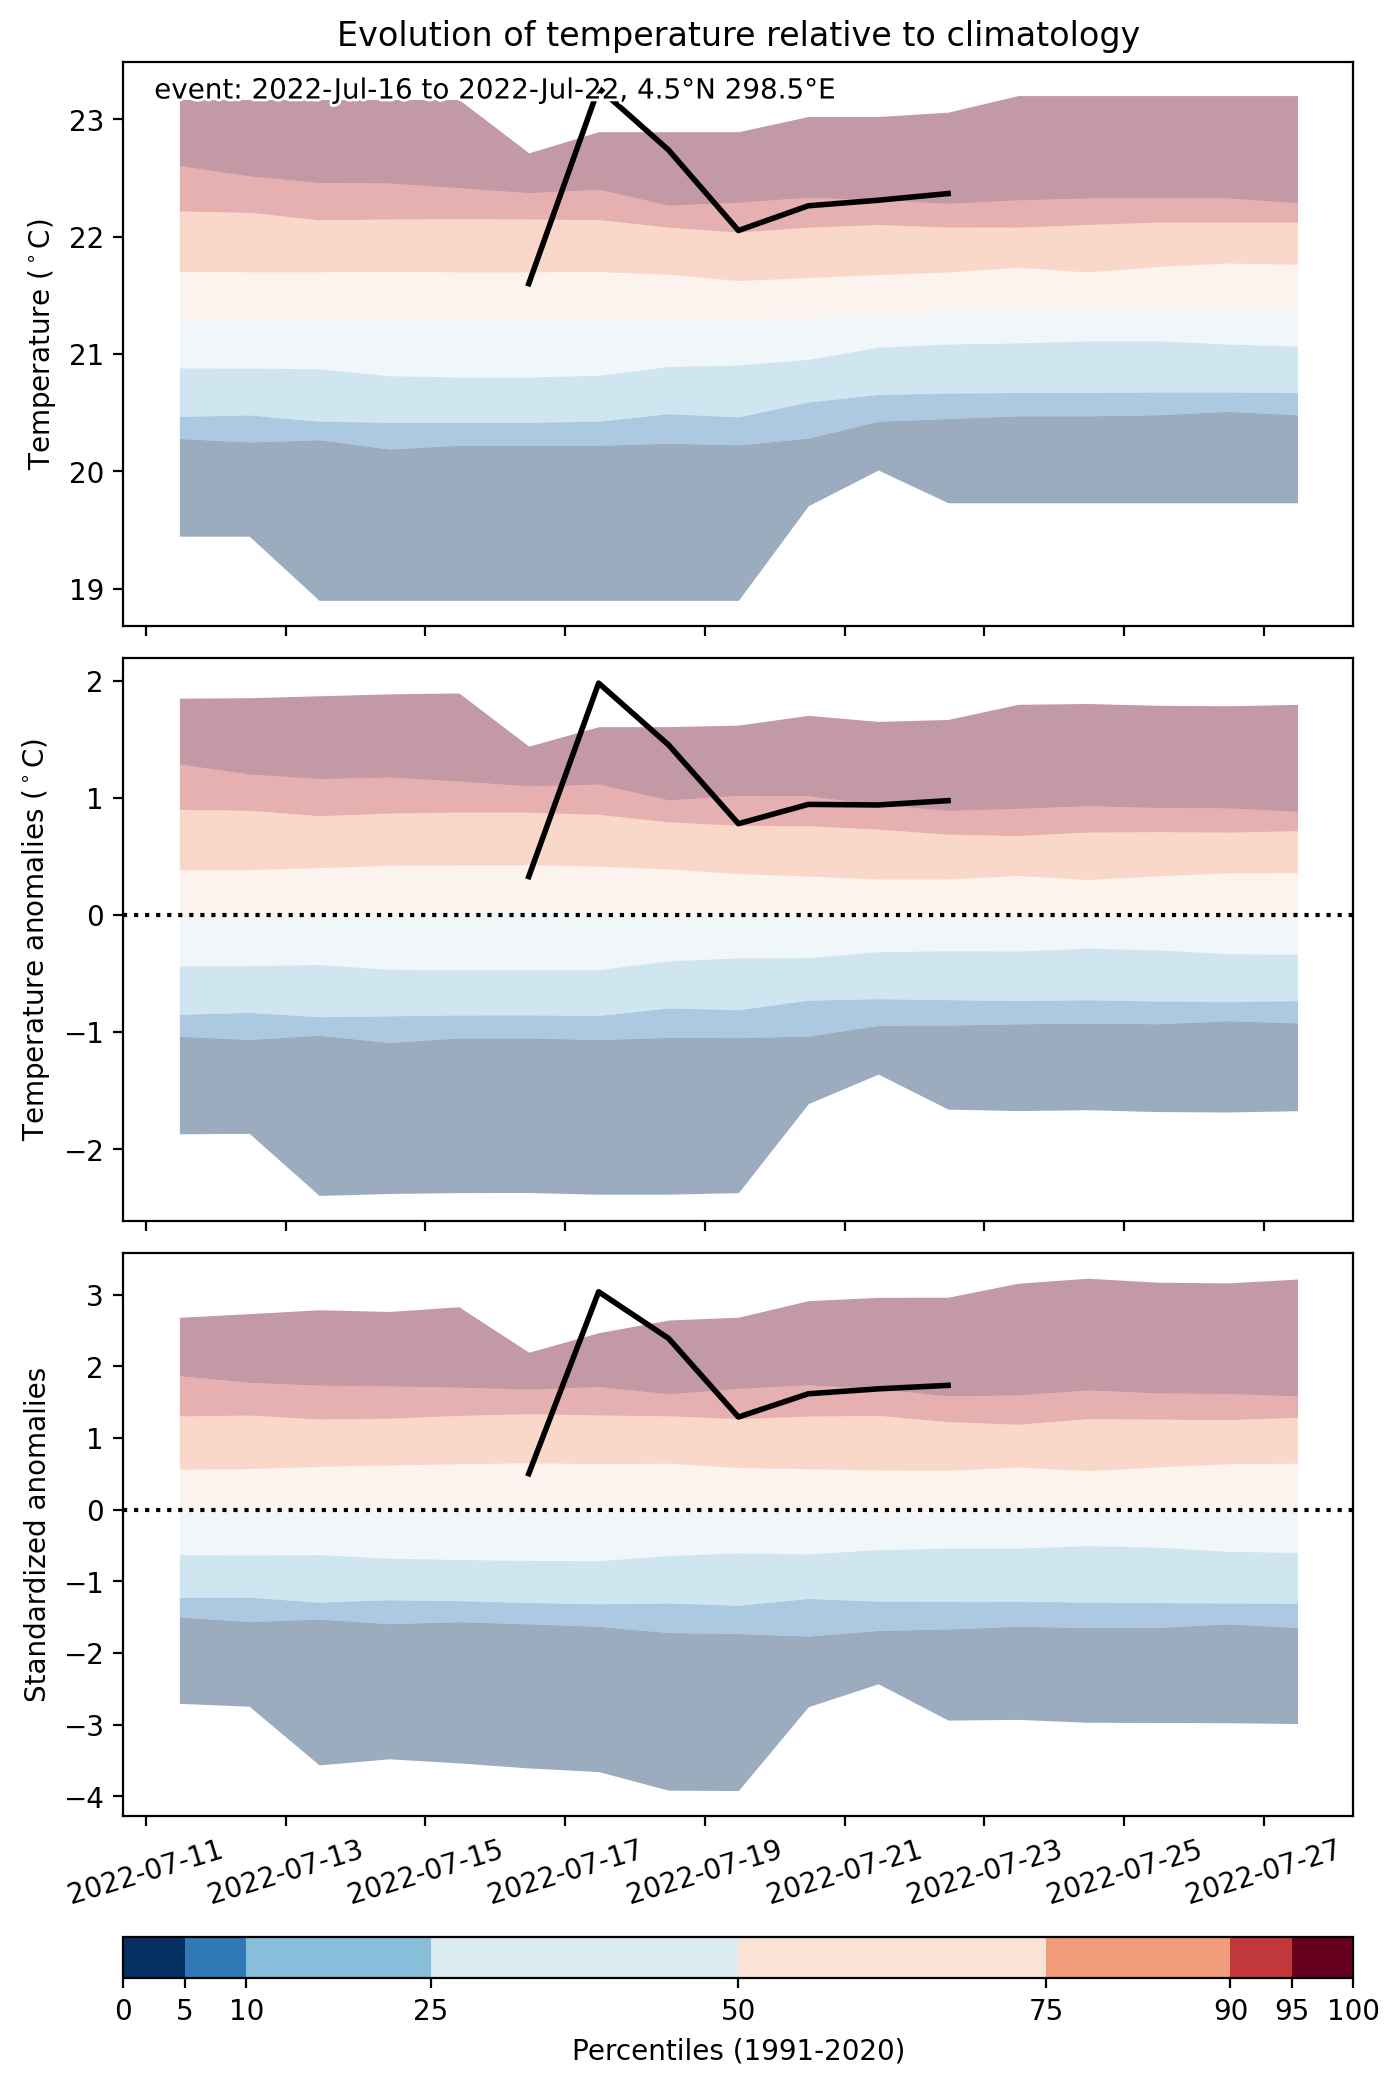
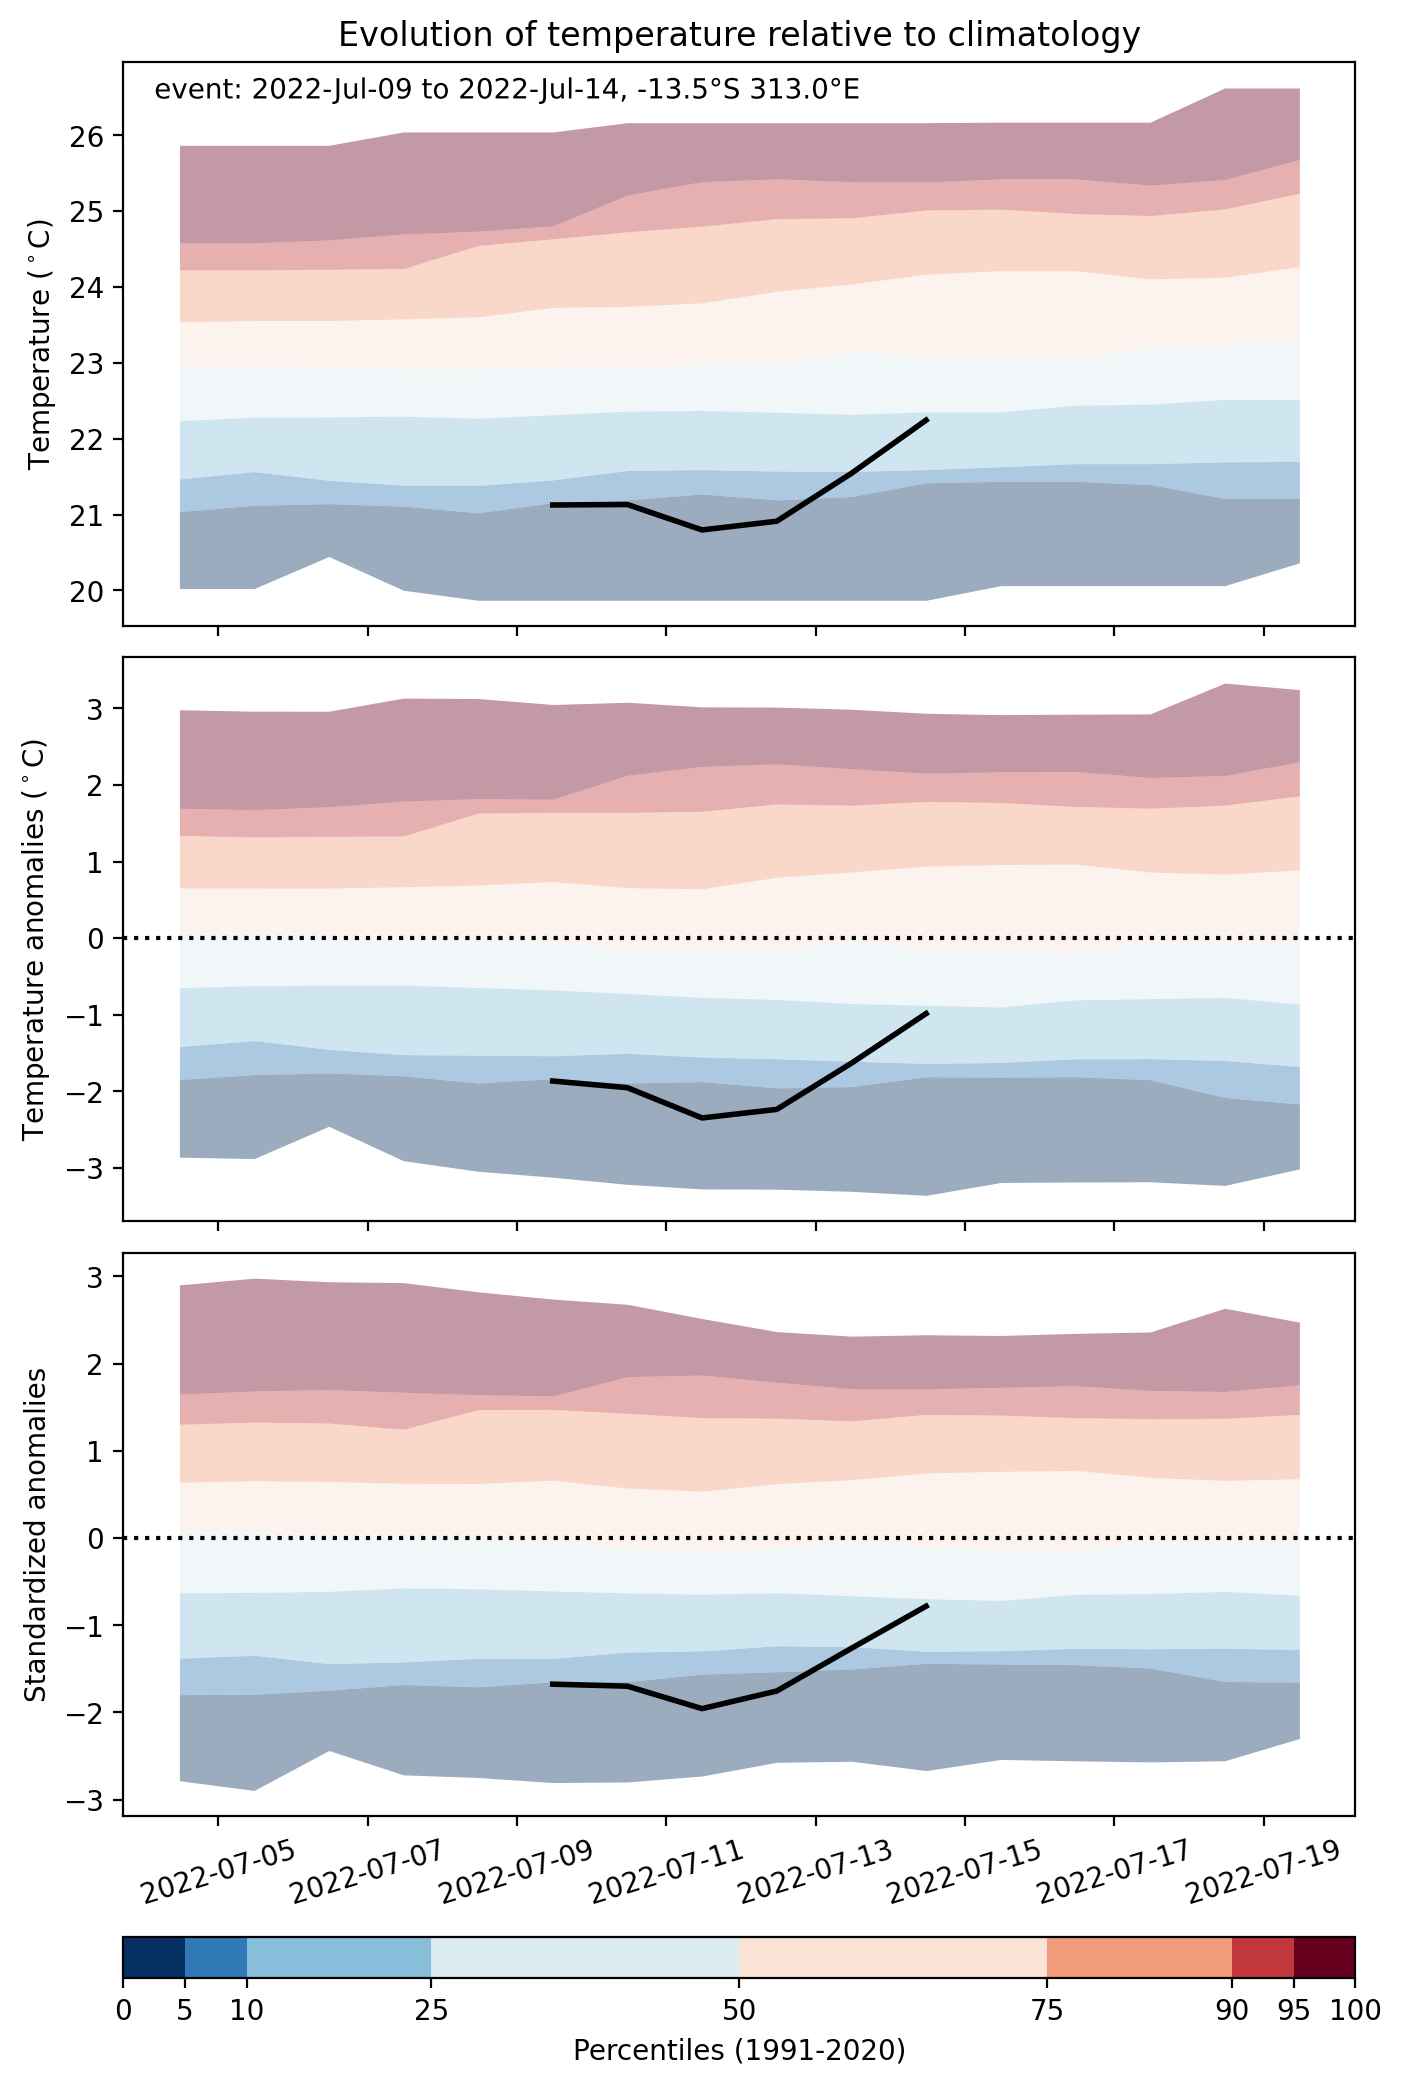
Fig. 2: Evolution of temperature at the center of the event. The climatological percentile distribution is illustrated with color shadings.
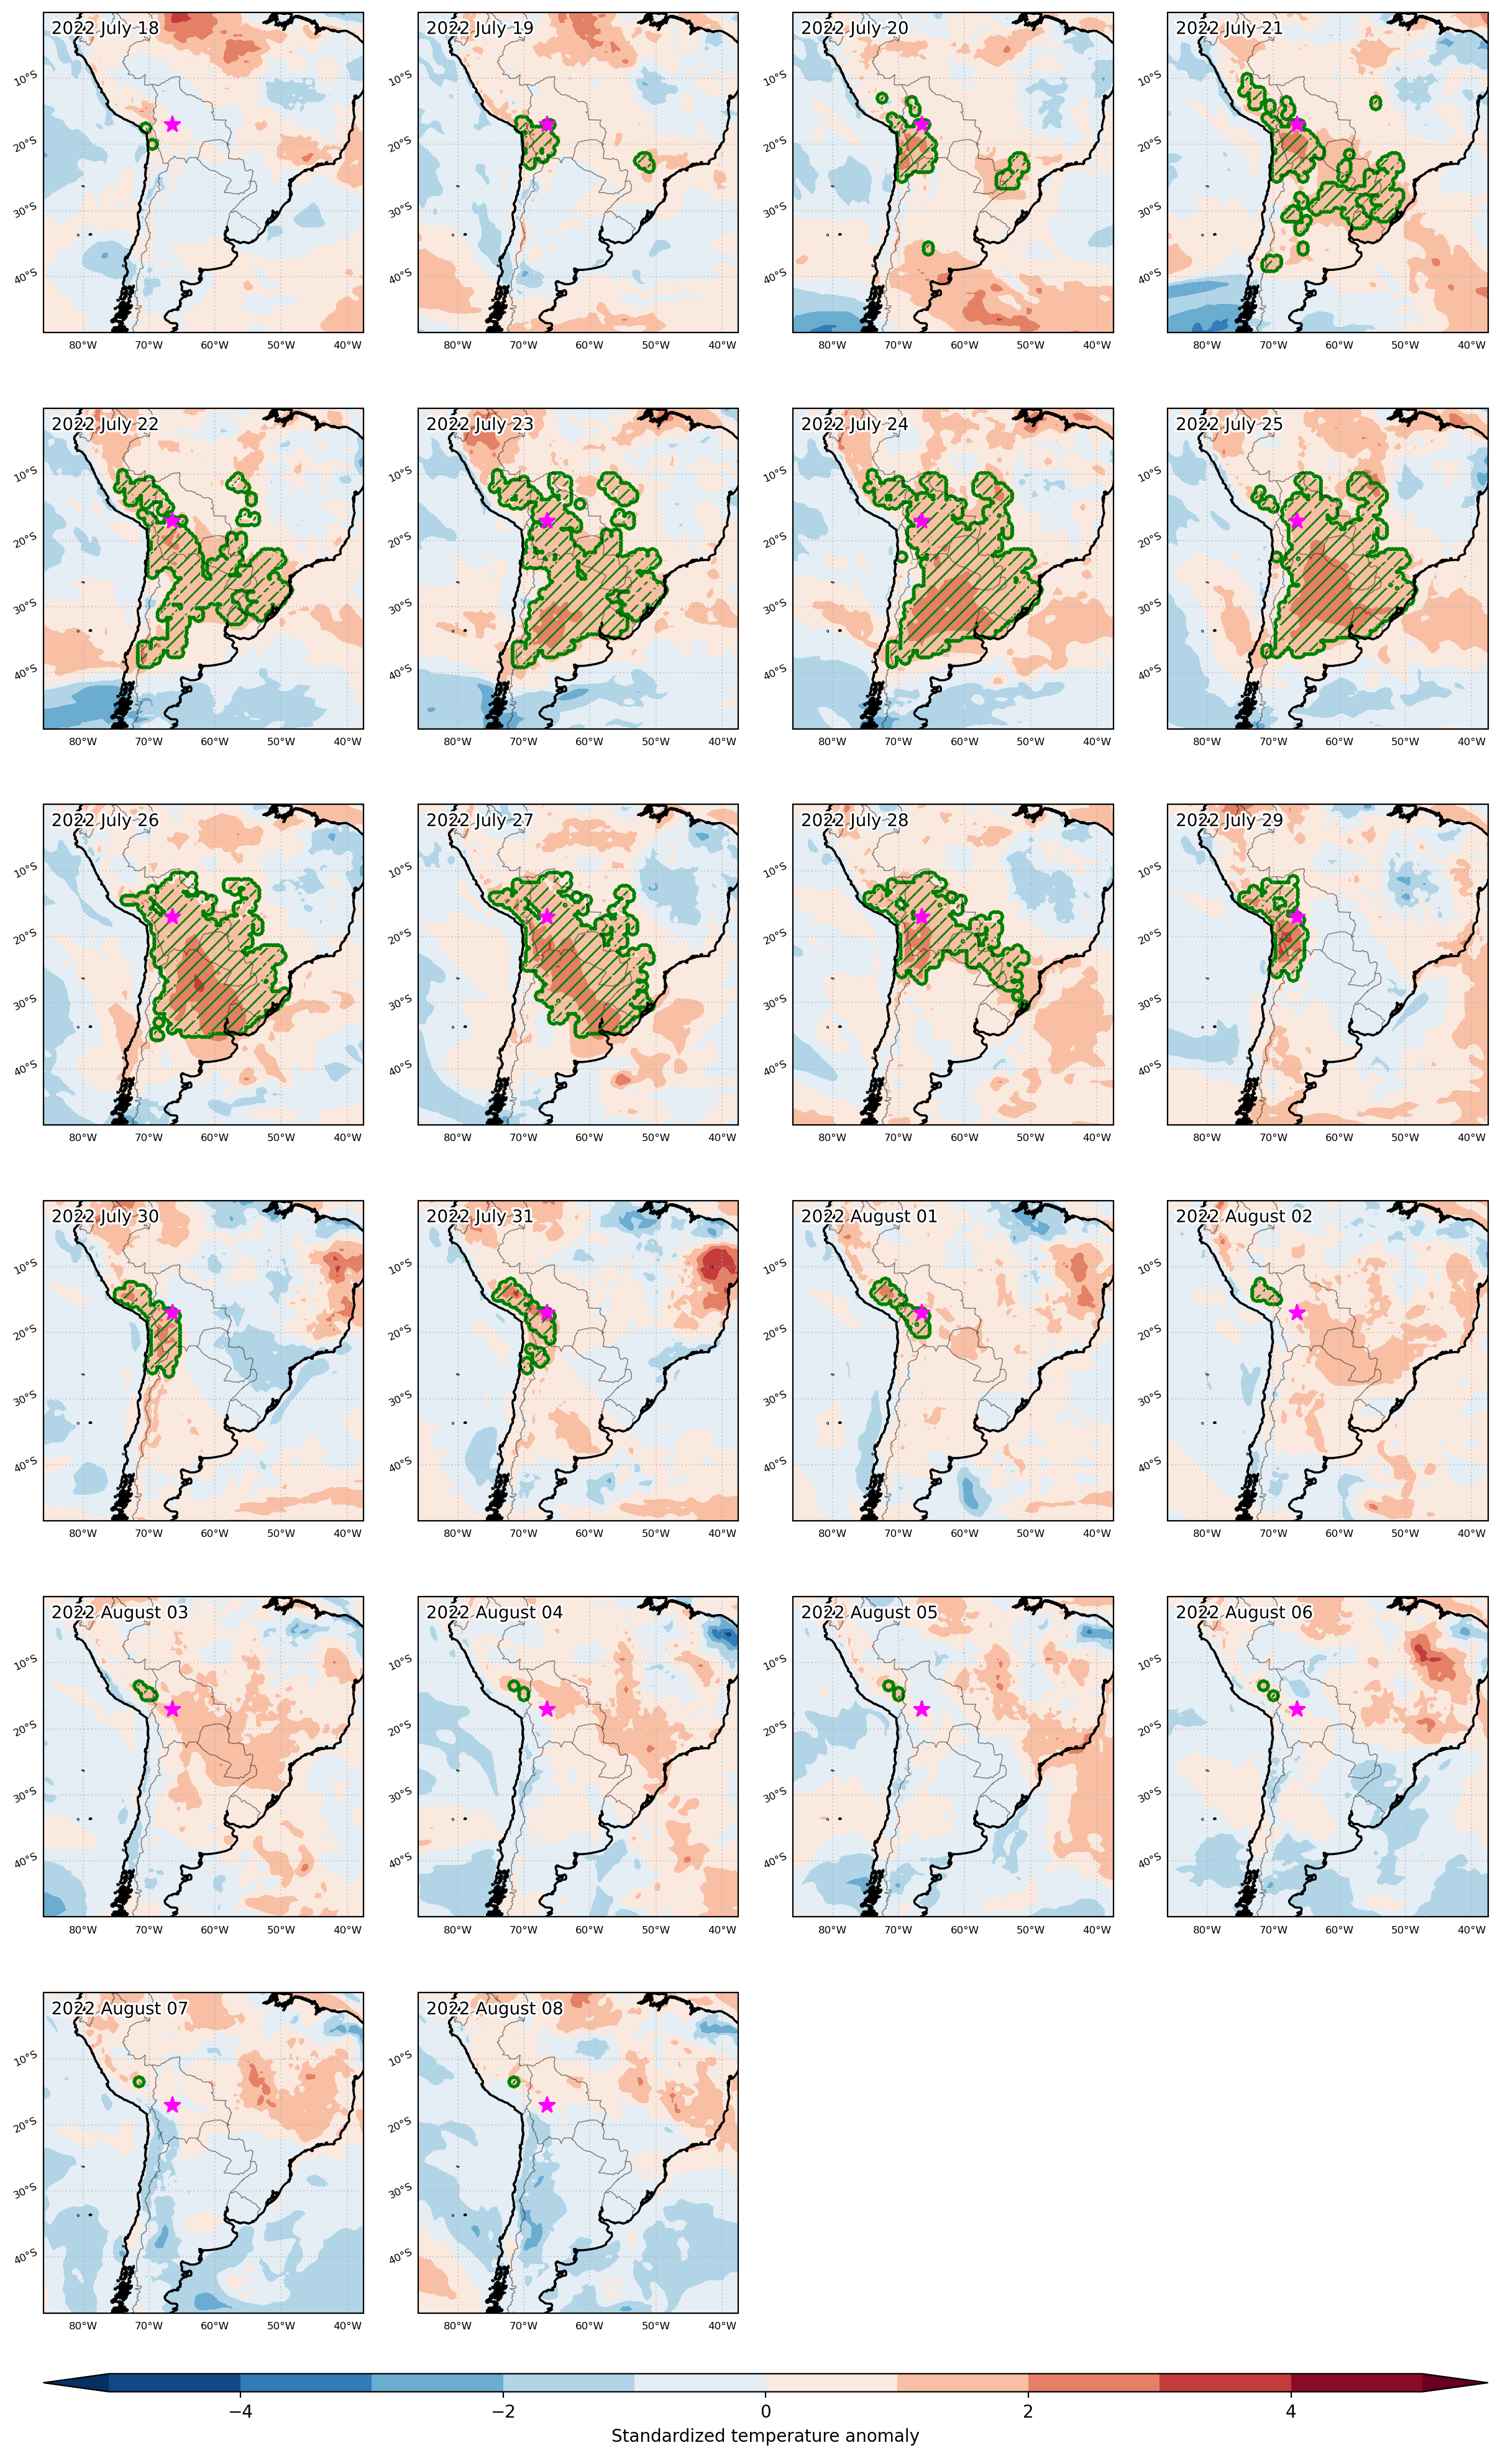


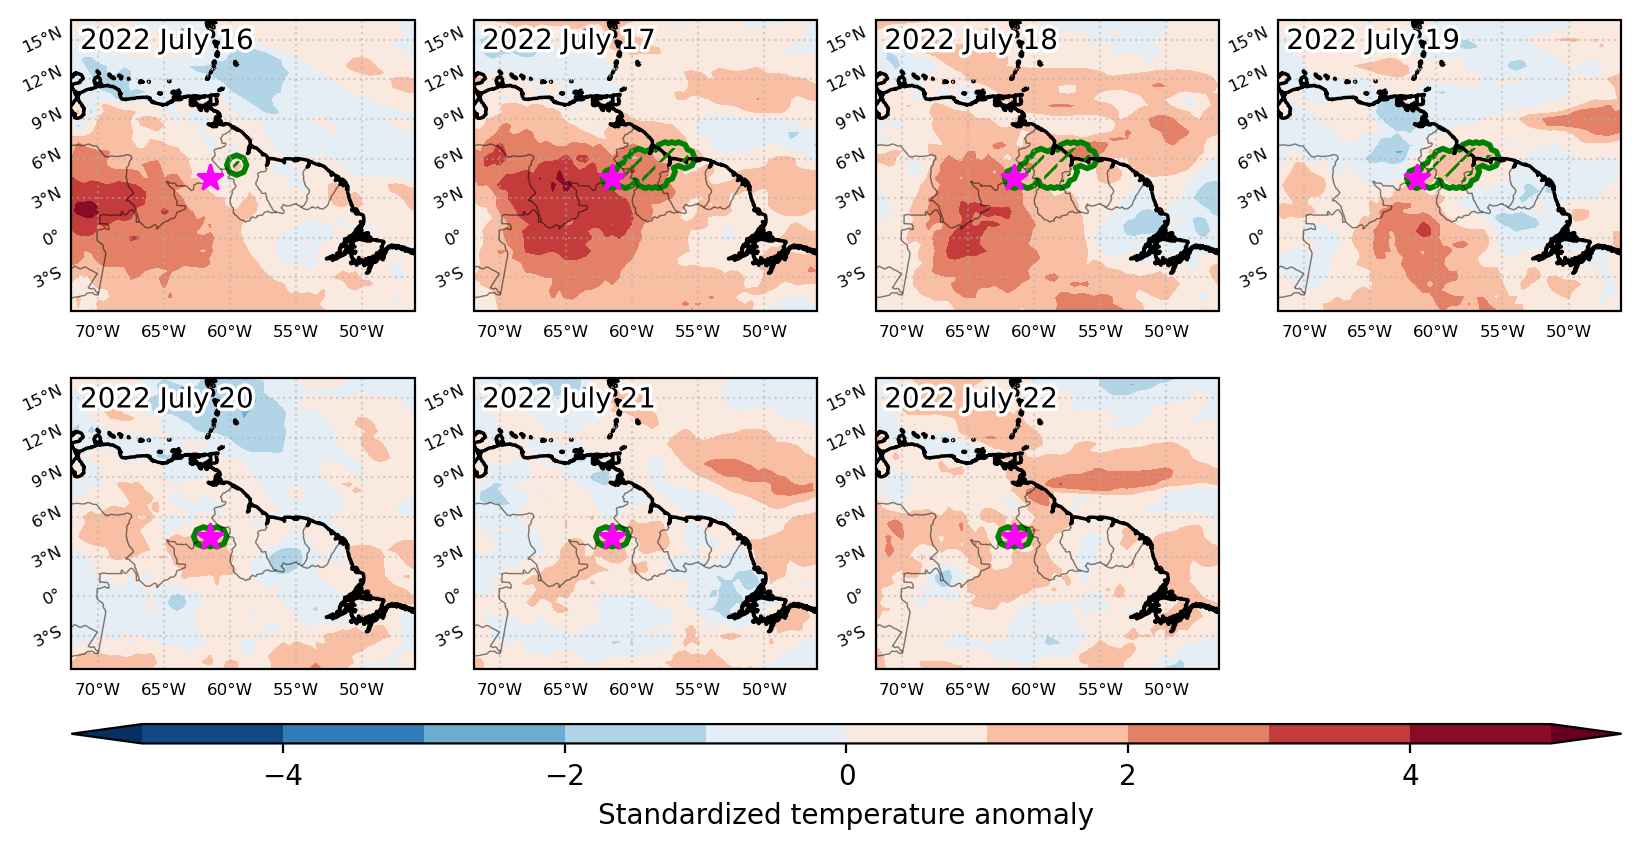
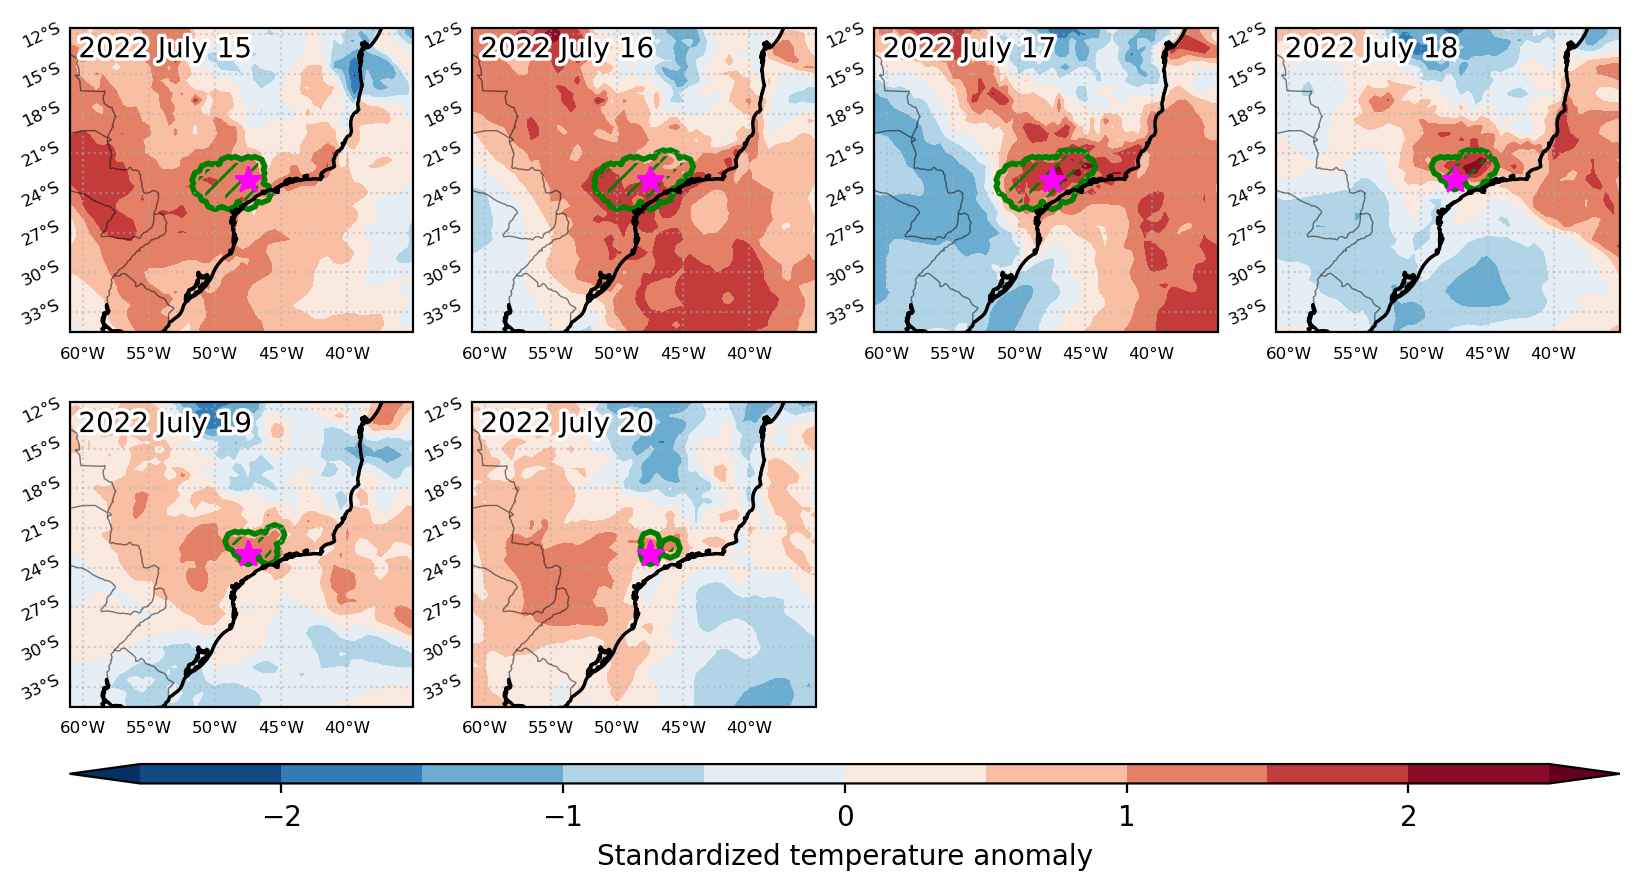
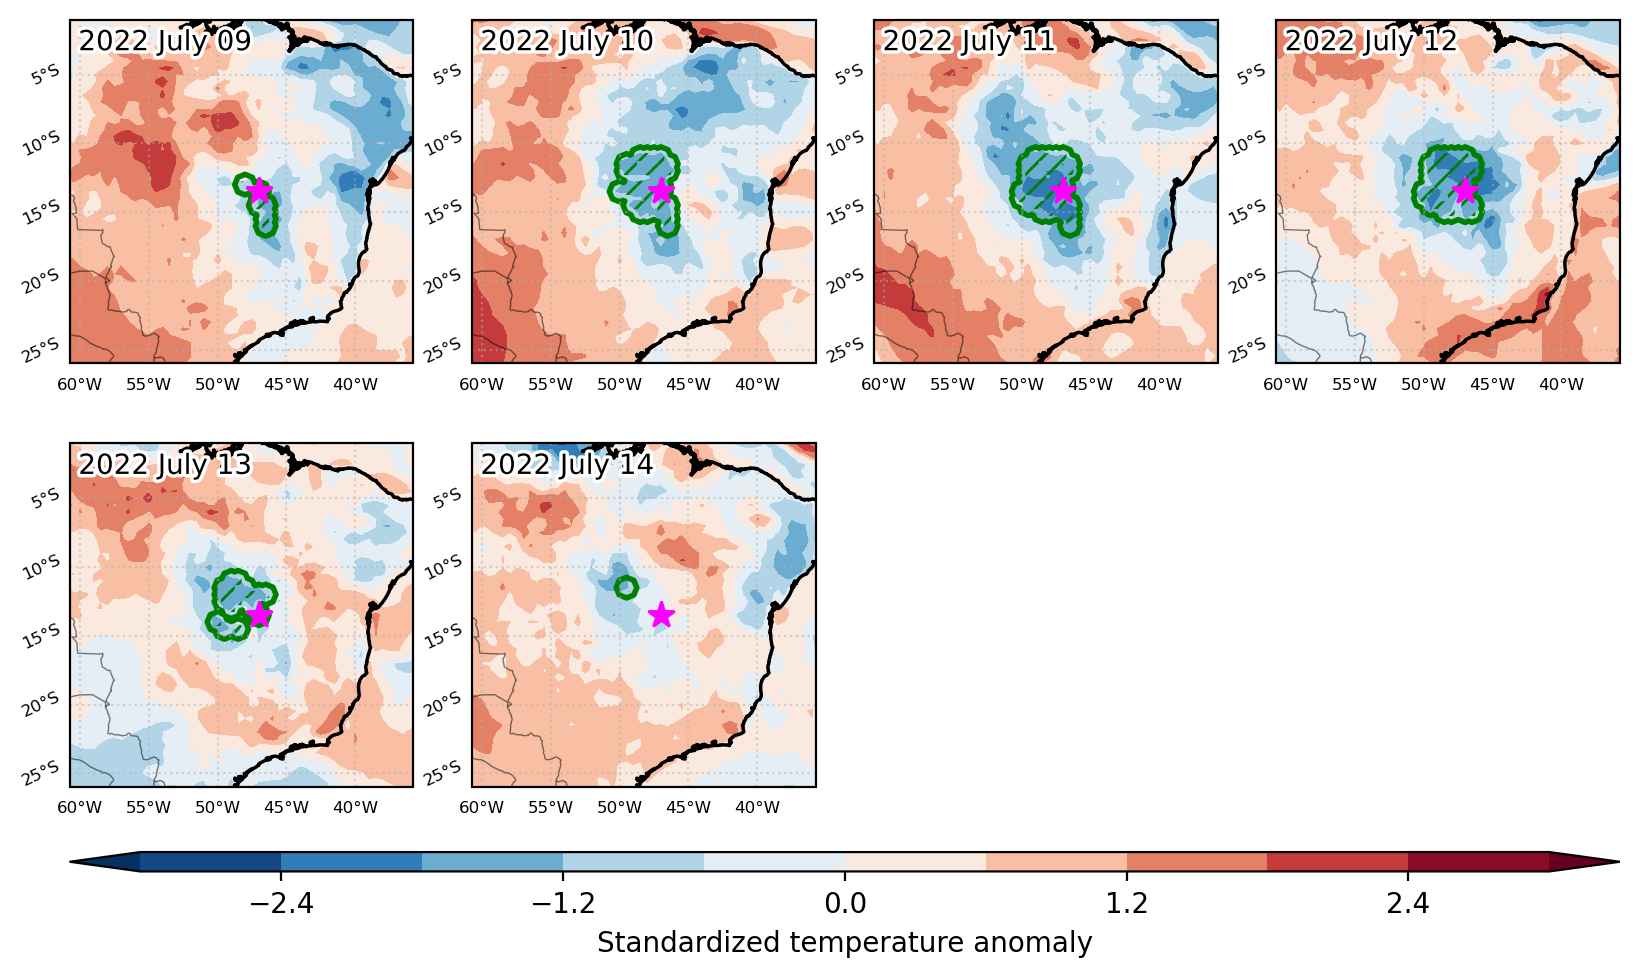
Fig. 3: Maps illustrating the evolution of standardized temperature anomalies during the event.

Event ID: Heat_wave_2022-Jul-18_to_2022-Aug-08_293.5_-17.0
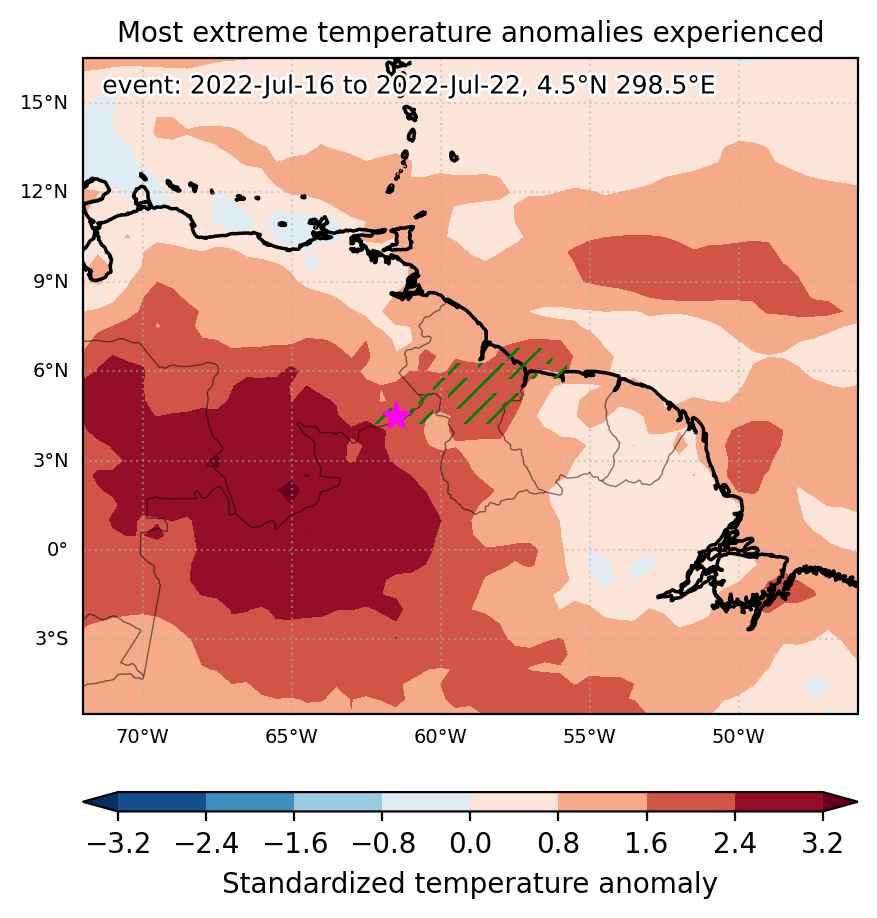
Heat wave occuring from July 16 2022 to July 22 2022 at 4.5°N 298.5°E

Download data: JSON

Event type: Heat wave

Countries affected (identified with ArcGIS Online; provided only for geographical reference):

  • Brazil
  • Guyana
  • Suriname
  • Venezuela, Bolivarian Republic of

Duration: 7 days

Time span: July 16 2022 to July 22 2022

Statistics over entire affected area:

  • Mean temperature anomaly: 1.1 °C
  • Mean temperature: 25.5 °C
  • Maximum temperature anomaly: 2.1 °C
  • Maximum temperature: 27.6 °C

Event center: 4.5°N 298.5°E

Area affected: 80012 km$^2$


Fig. 1: Map of most extreme temperature anomalies (standardized) experienced during the event. The purple star indicates the center of the extreme event. Green hatching illustrates all areas under the effect of extremes at some time during the event.


Fig. 2: Evolution of temperature at the center of the event. The climatological percentile distribution is illustrated with color shadings.


Fig. 3: Maps illustrating the evolution of standardized temperature anomalies during the event.

Event ID: Heat_wave_2022-Jul-16_to_2022-Jul-22_298.5_4.5

Heat wave occuring from July 15 2022 to July 20 2022 at -23.0°S 312.5°E

Download data: JSON

Event type: Heat wave

Countries affected (identified with ArcGIS Online; provided only for geographical reference):

  • Brazil

Duration: 6 days

Time span: July 15 2022 to July 20 2022

Statistics over entire affected area:

  • Mean temperature anomaly: 3.9 °C
  • Mean temperature: 21.3 °C
  • Maximum temperature anomaly: 6.2 °C
  • Maximum temperature: 24.7 °C

Event center: -23.0°S 312.5°E

Area affected: 142253 km$^2$


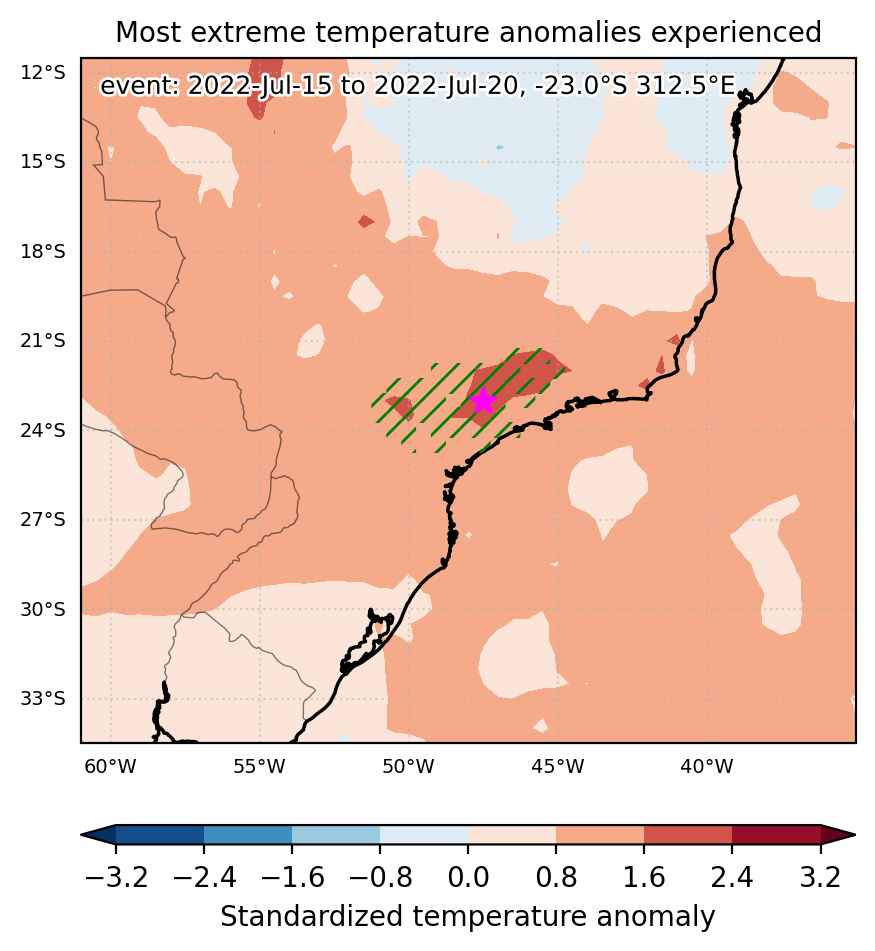
Fig. 1: Map of most extreme temperature anomalies (standardized) experienced during the event. The purple star indicates the center of the extreme event. Green hatching illustrates all areas under the effect of extremes at some time during the event.


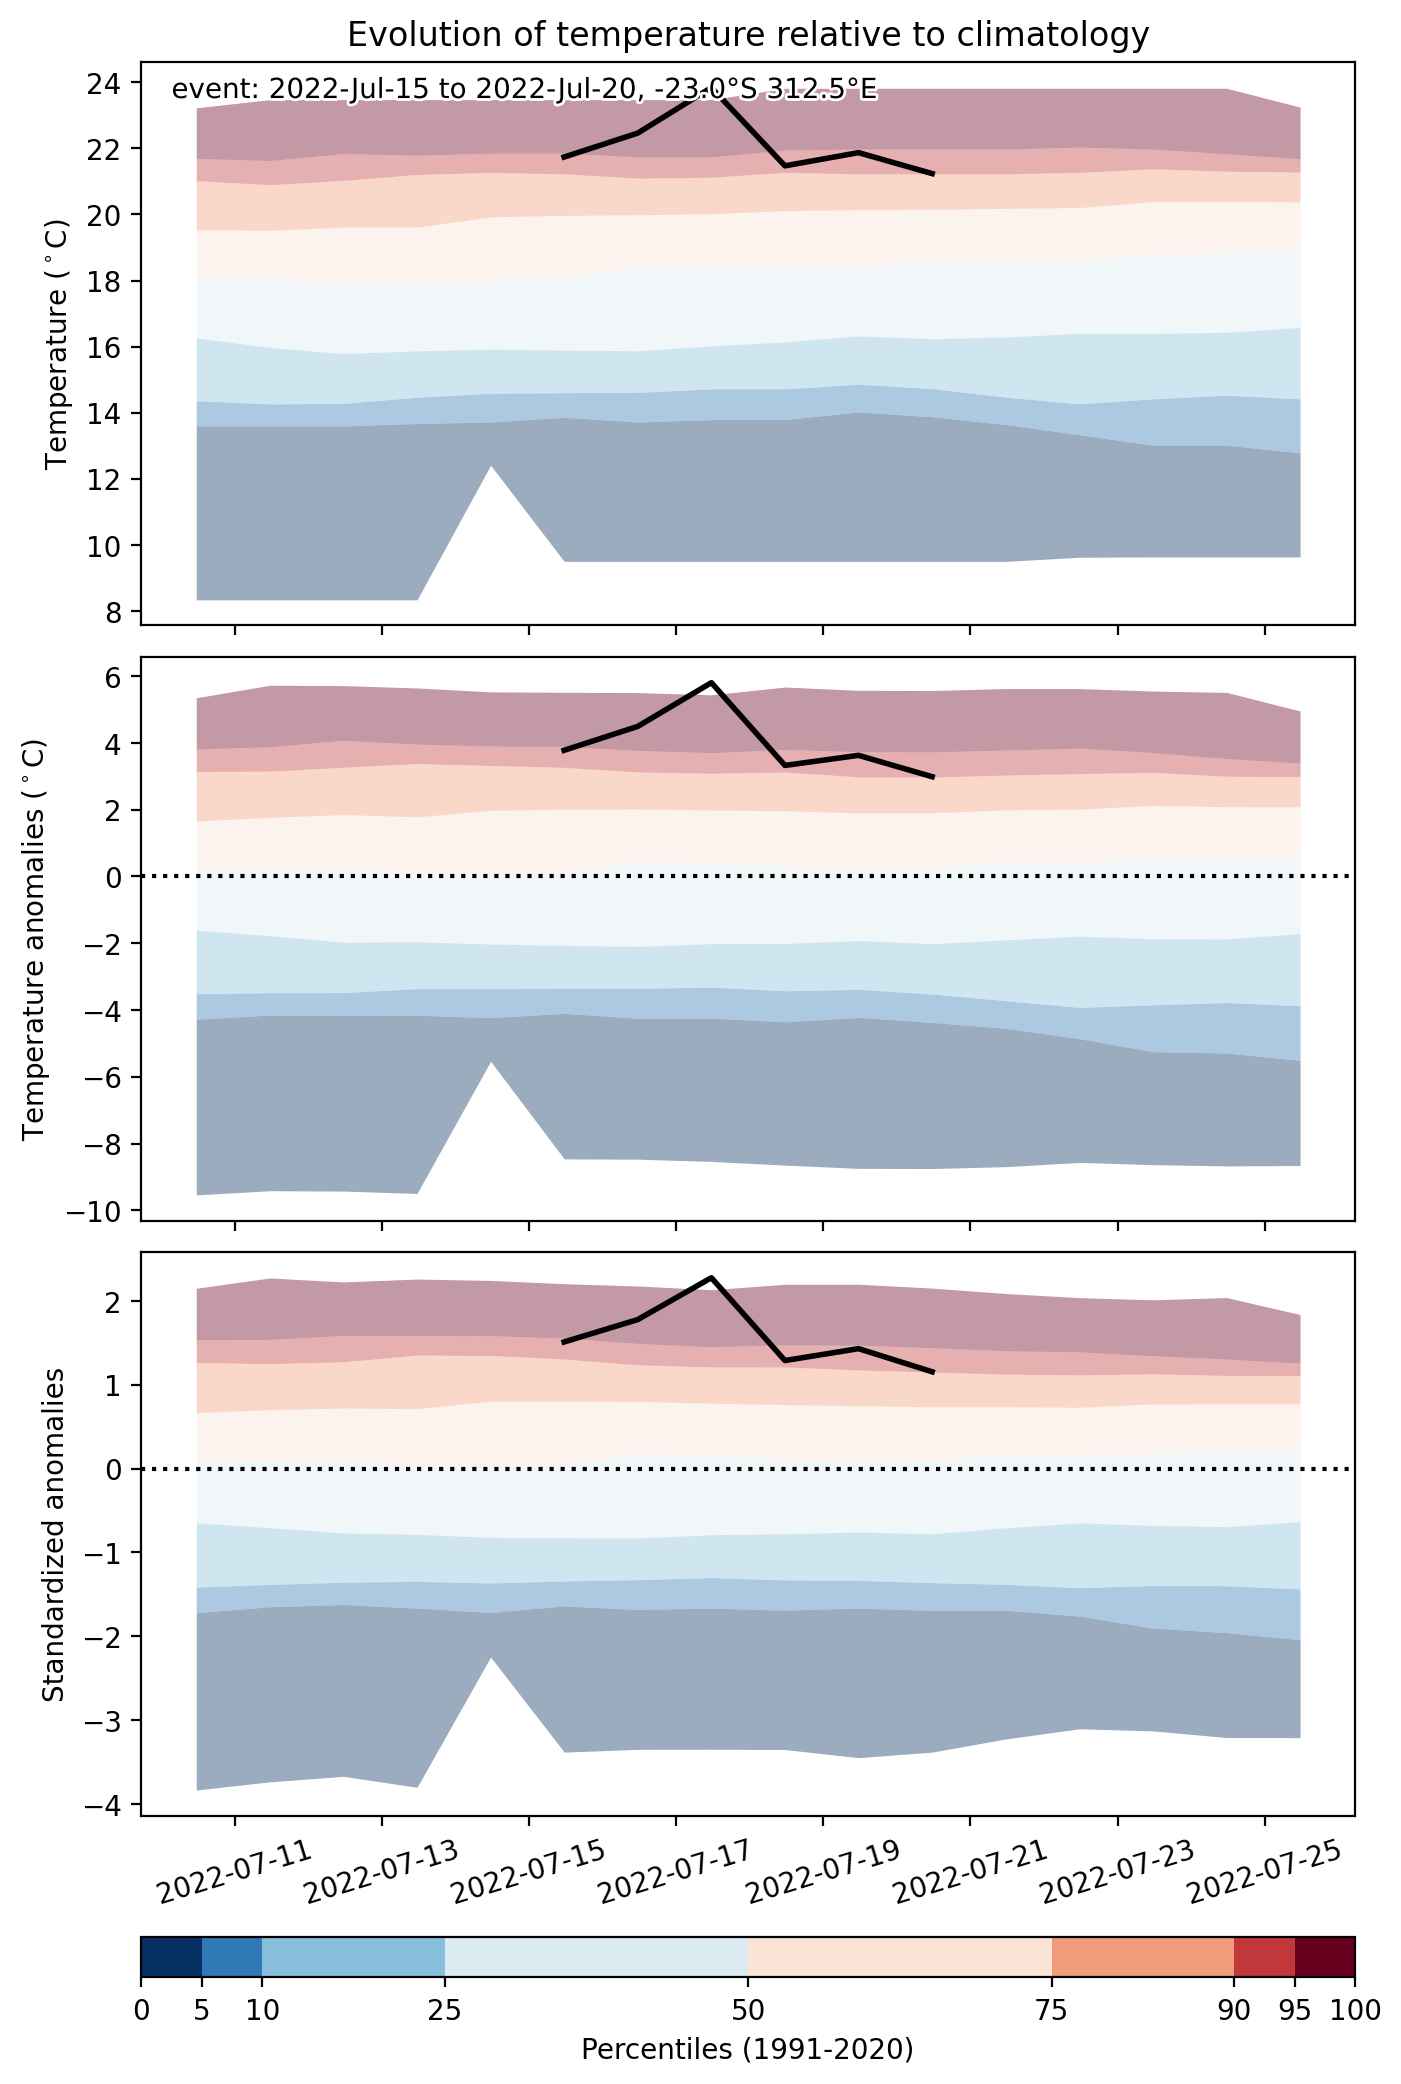
Fig. 2: Evolution of temperature at the center of the event. The climatological percentile distribution is illustrated with color shadings.


Fig. 3: Maps illustrating the evolution of standardized temperature anomalies during the event.

Event ID: Heat_wave_2022-Jul-15_to_2022-Jul-20_312.5_-23.0

Heat wave occuring from July 14 2022 to July 17 2022 at -6.5°S 292.5°E

Download data: JSON

Event type: Heat wave

Countries affected (identified with ArcGIS Online; provided only for geographical reference):

  • Bolivia, Plurinational State of
  • Brazil

Duration: 4 days

Time span: July 14 2022 to July 17 2022

Statistics over entire affected area:

  • Mean temperature anomaly: 2.3 °C
  • Mean temperature: 27.2 °C
  • Maximum temperature anomaly: 3.4 °C
  • Maximum temperature: 28.5 °C

Event center: -6.5°S 292.5°E

Area affected: 64230 km$^2$


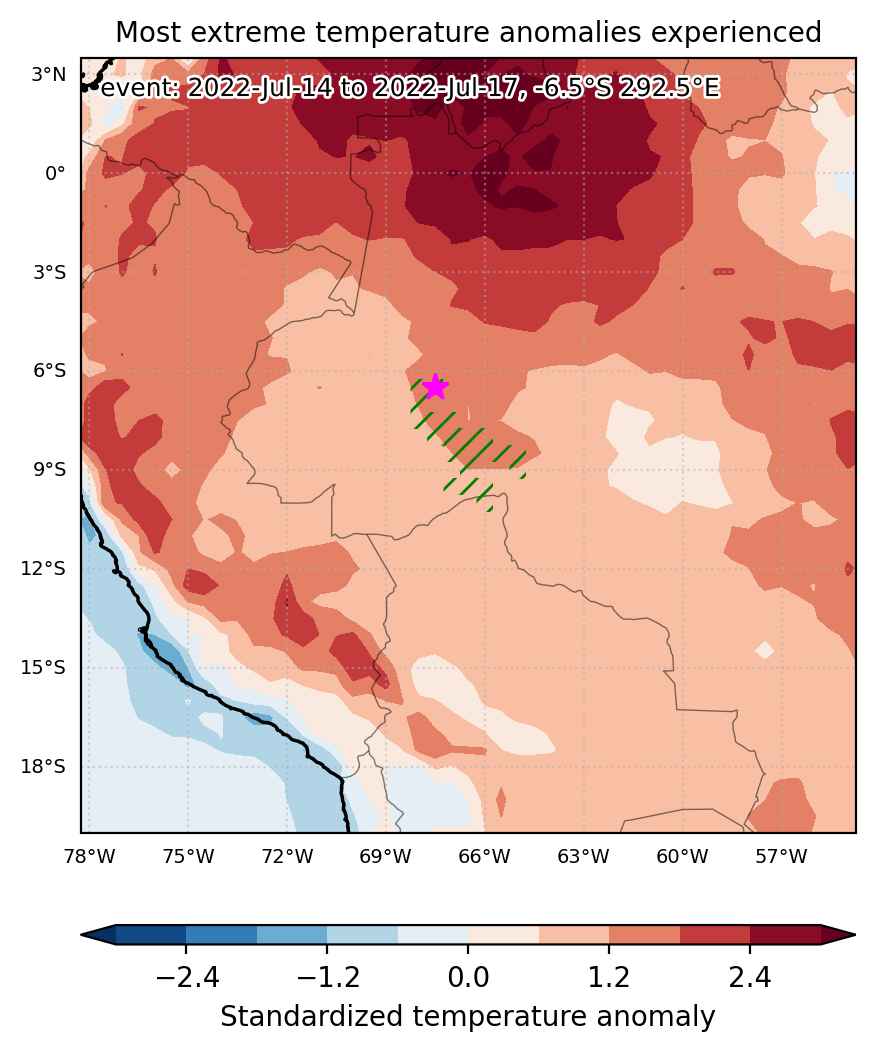
Fig. 1: Map of most extreme temperature anomalies (standardized) experienced during the event. The purple star indicates the center of the extreme event. Green hatching illustrates all areas under the effect of extremes at some time during the event.


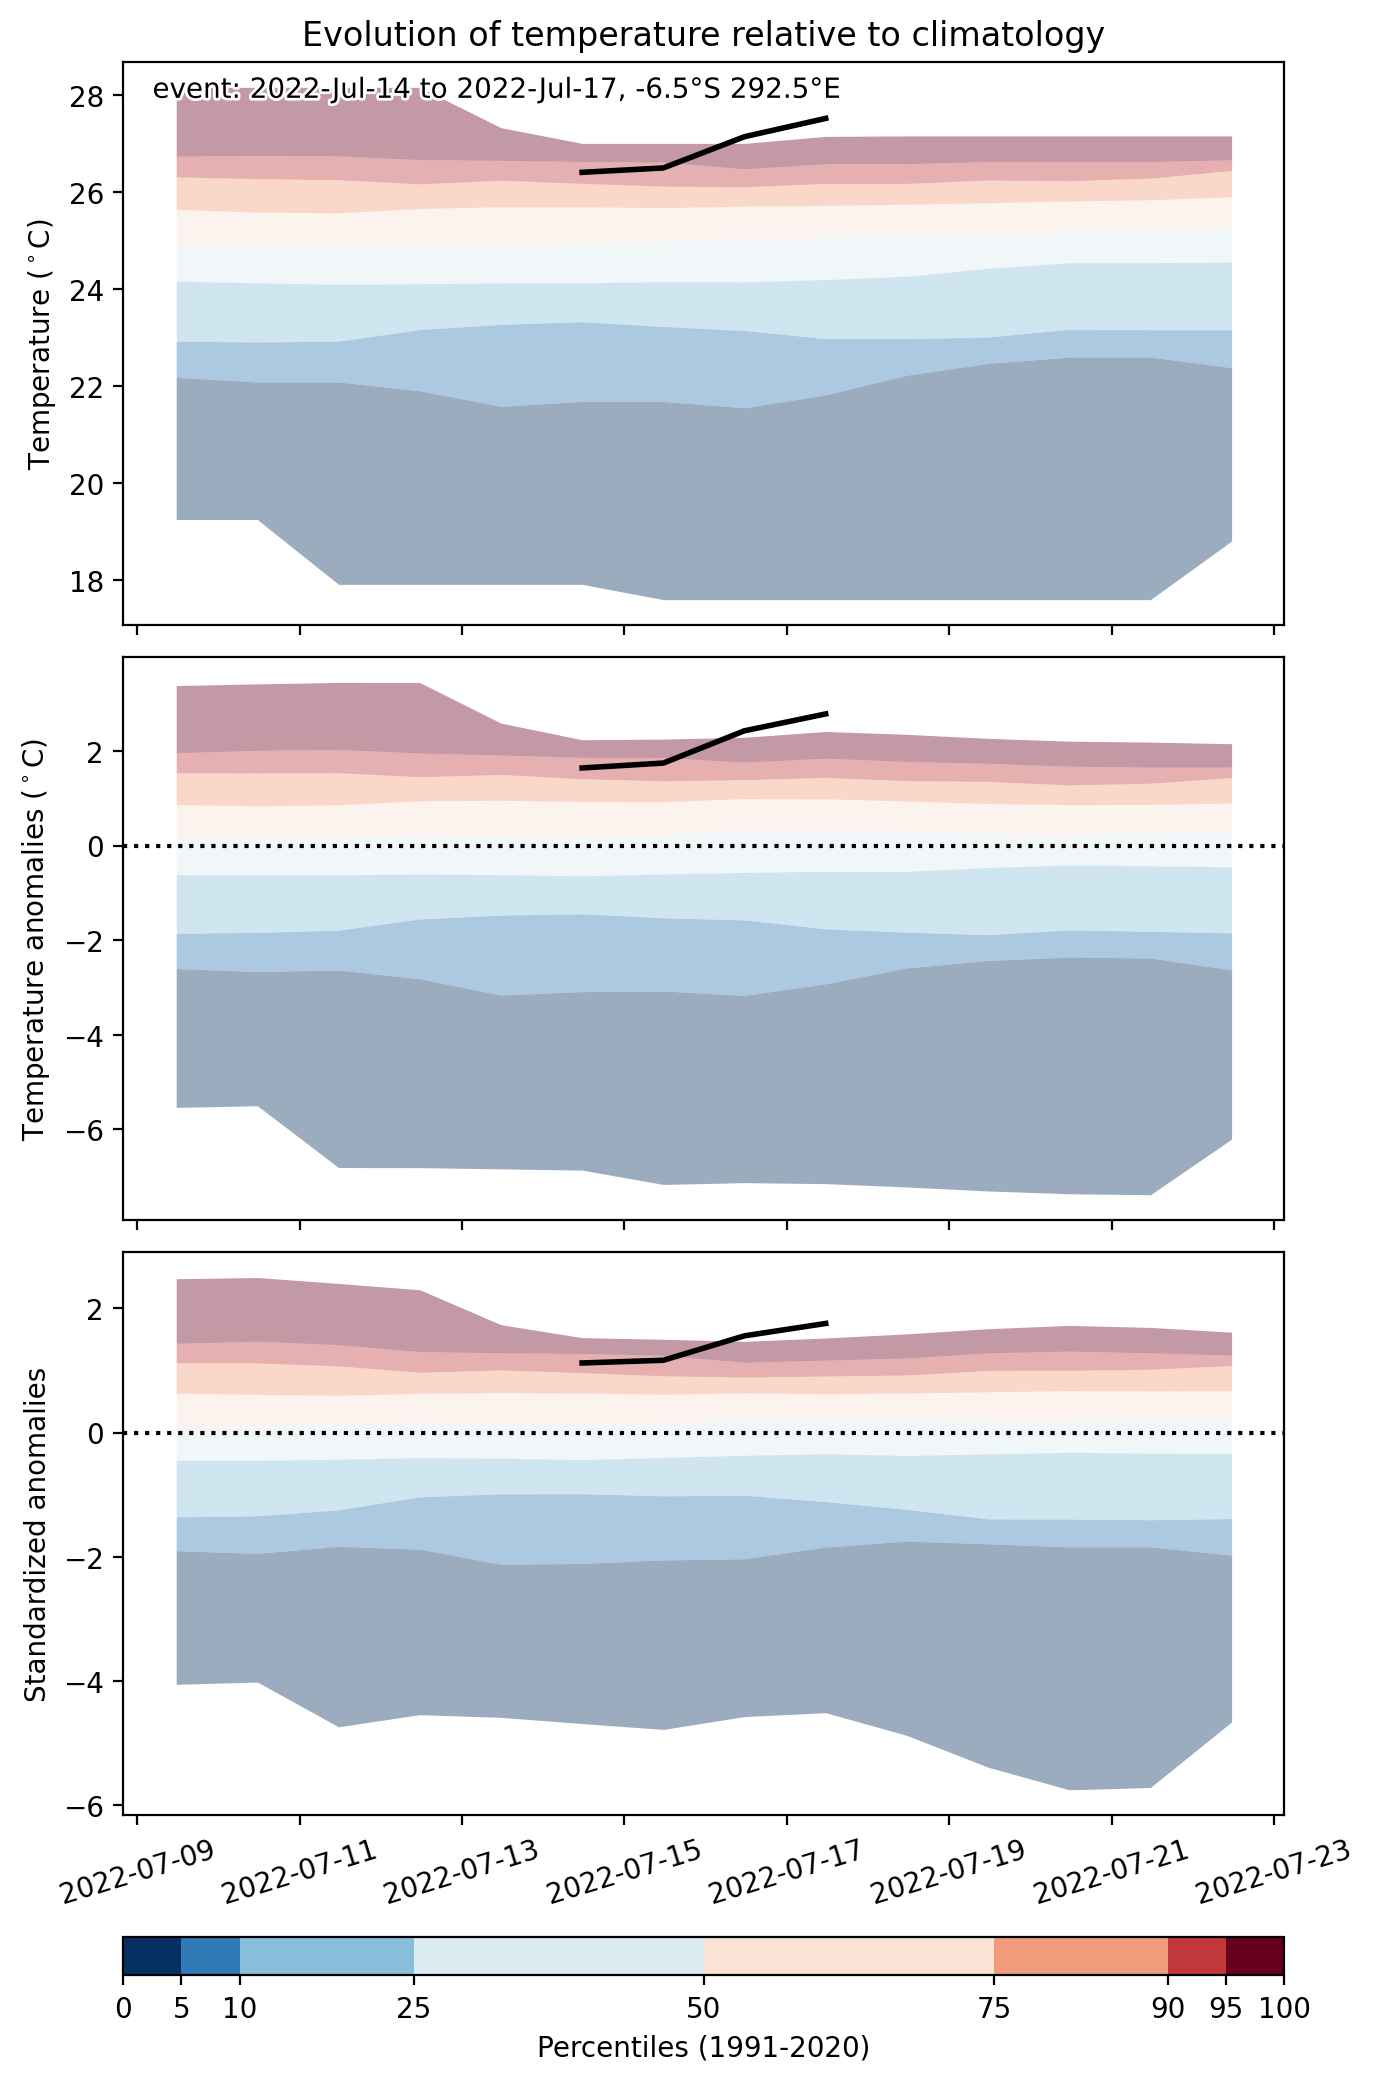
Fig. 2: Evolution of temperature at the center of the event. The climatological percentile distribution is illustrated with color shadings.


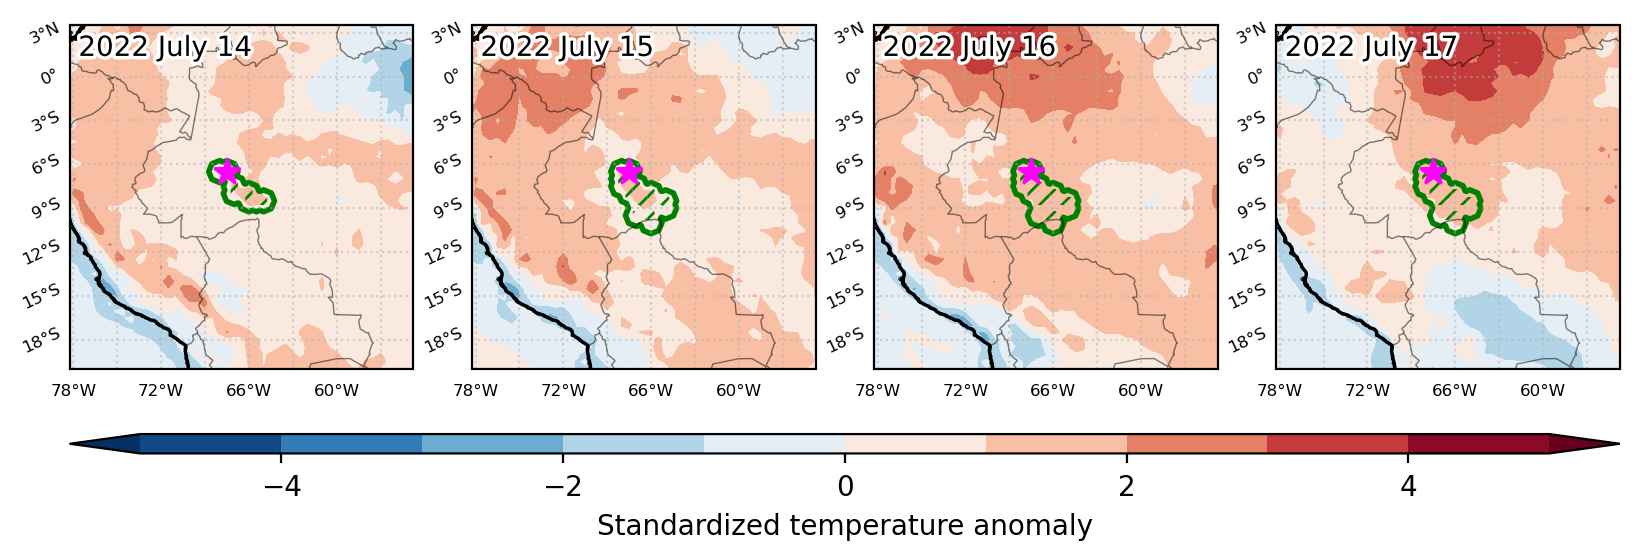
Fig. 3: Maps illustrating the evolution of standardized temperature anomalies during the event.

Event ID: Heat_wave_2022-Jul-14_to_2022-Jul-17_292.5_-6.5

Heat wave occuring from July 13 2022 to July 17 2022 at -6.5°S 289.0°E

Download data: JSON

Event type: Heat wave

Countries affected (identified with ArcGIS Online; provided only for geographical reference):

  • Brazil

Duration: 5 days

Time span: July 13 2022 to July 17 2022

Statistics over entire affected area:

  • Mean temperature anomaly: 1.8 °C
  • Mean temperature: 26.2 °C
  • Maximum temperature anomaly: 2.6 °C
  • Maximum temperature: 26.8 °C

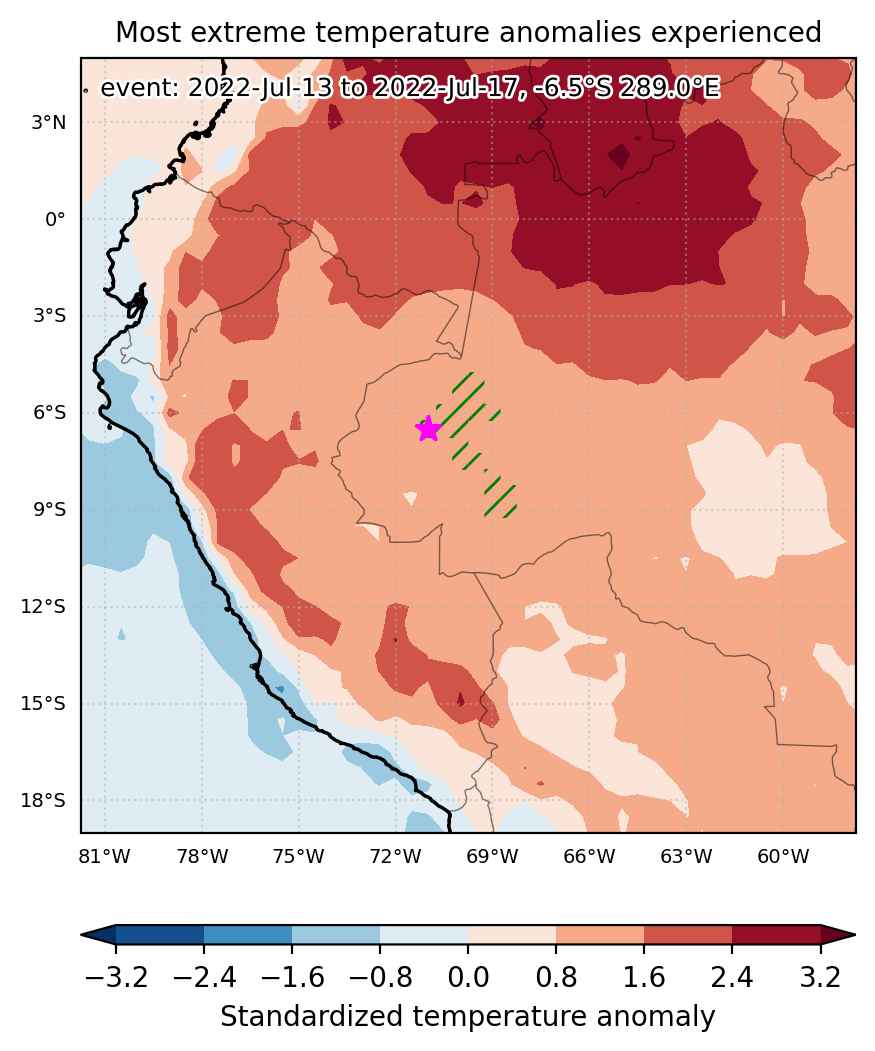
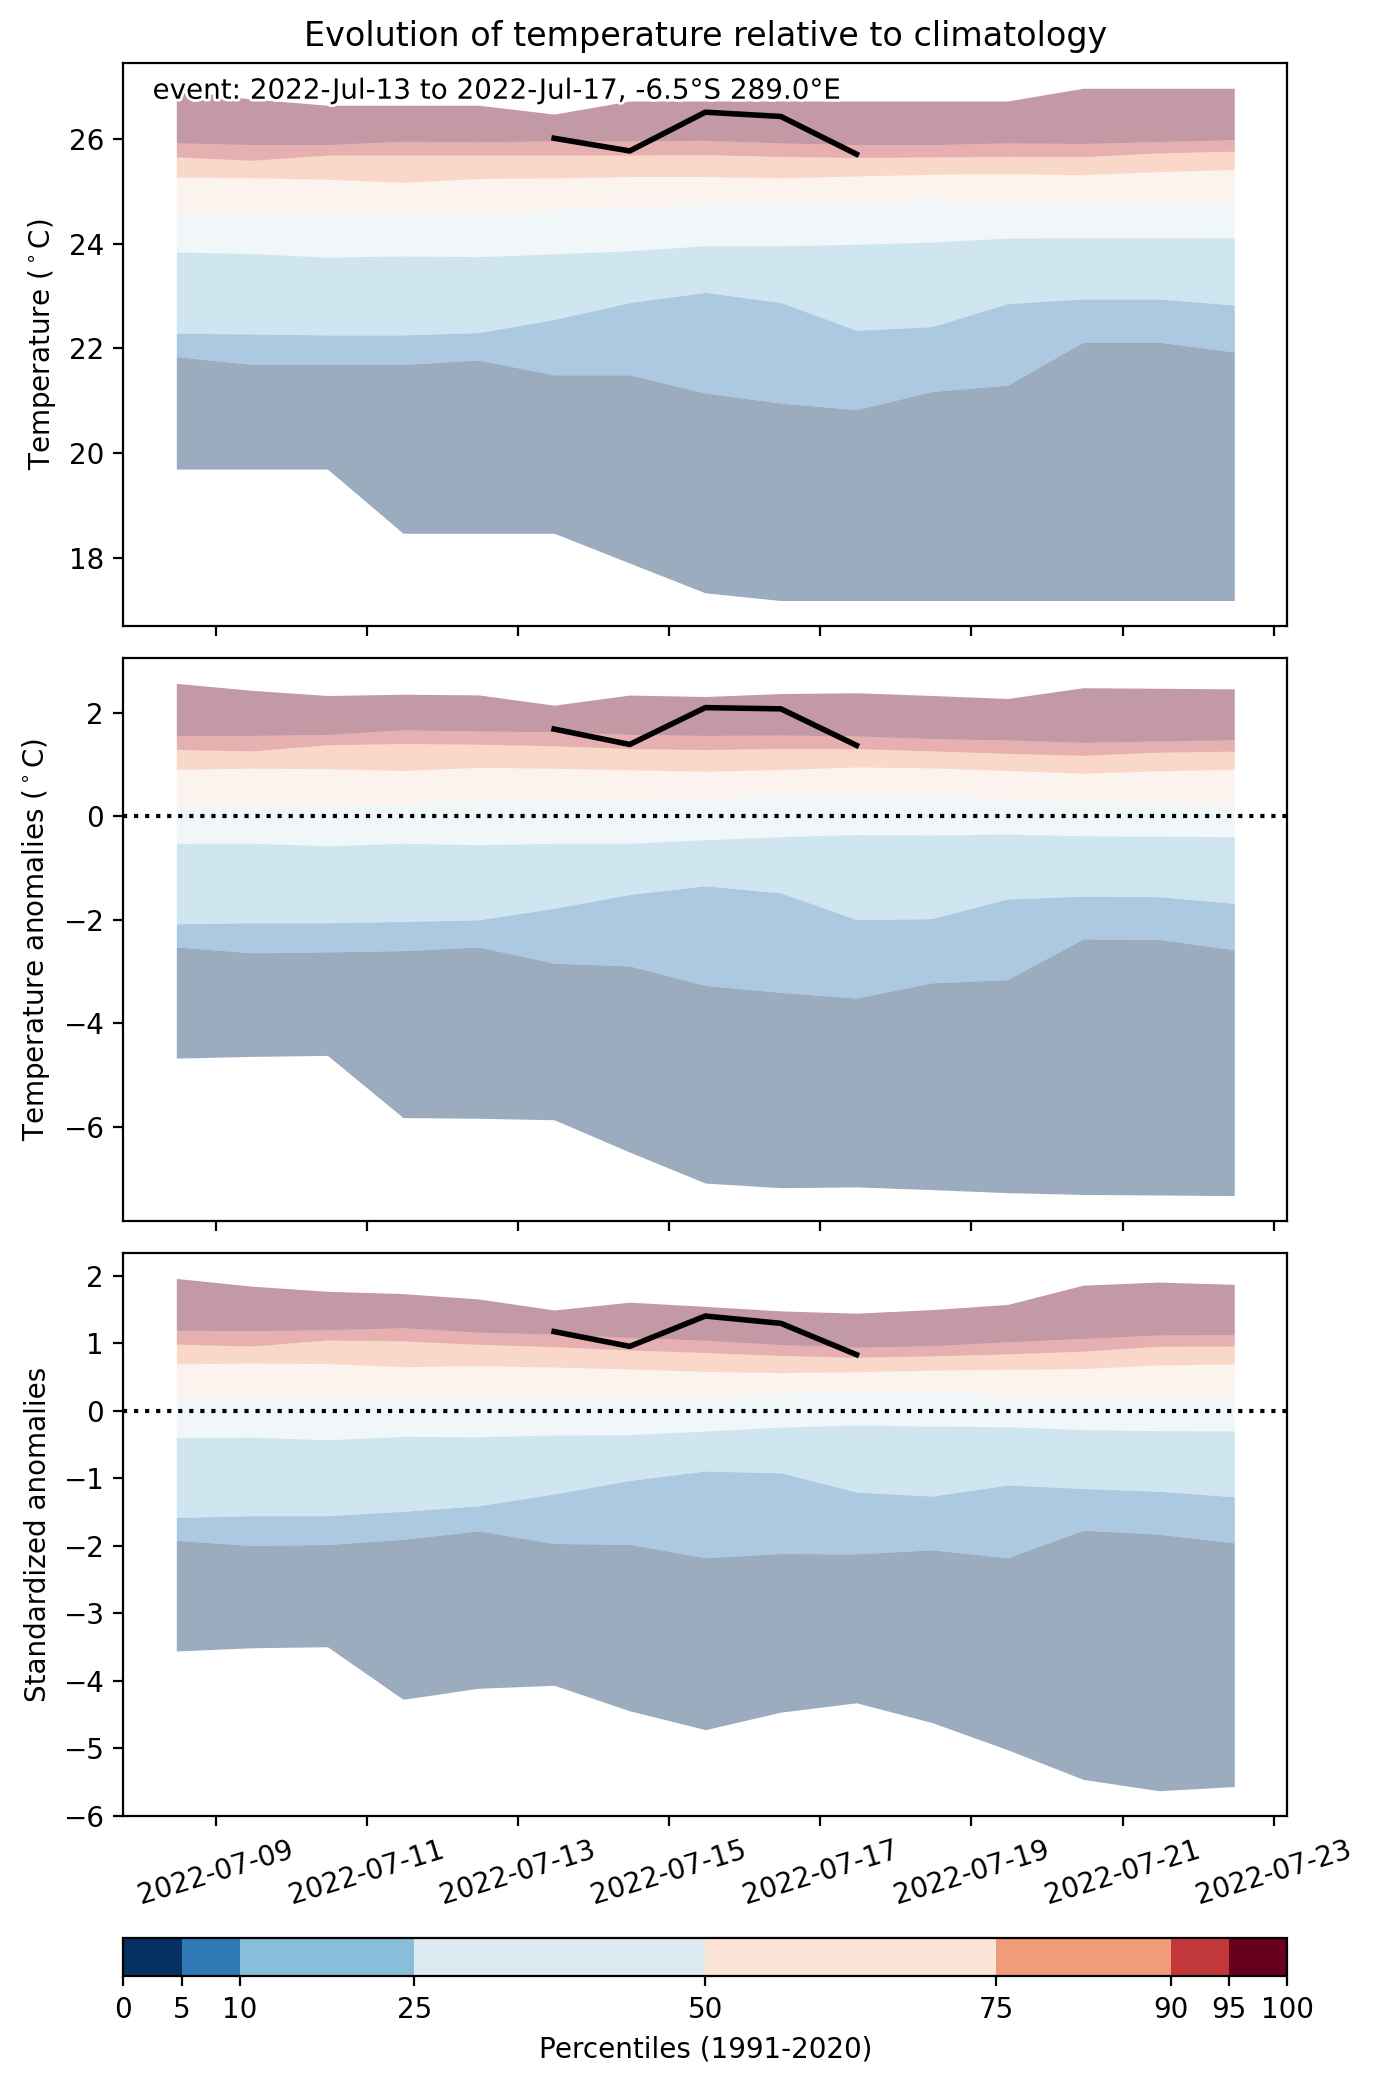
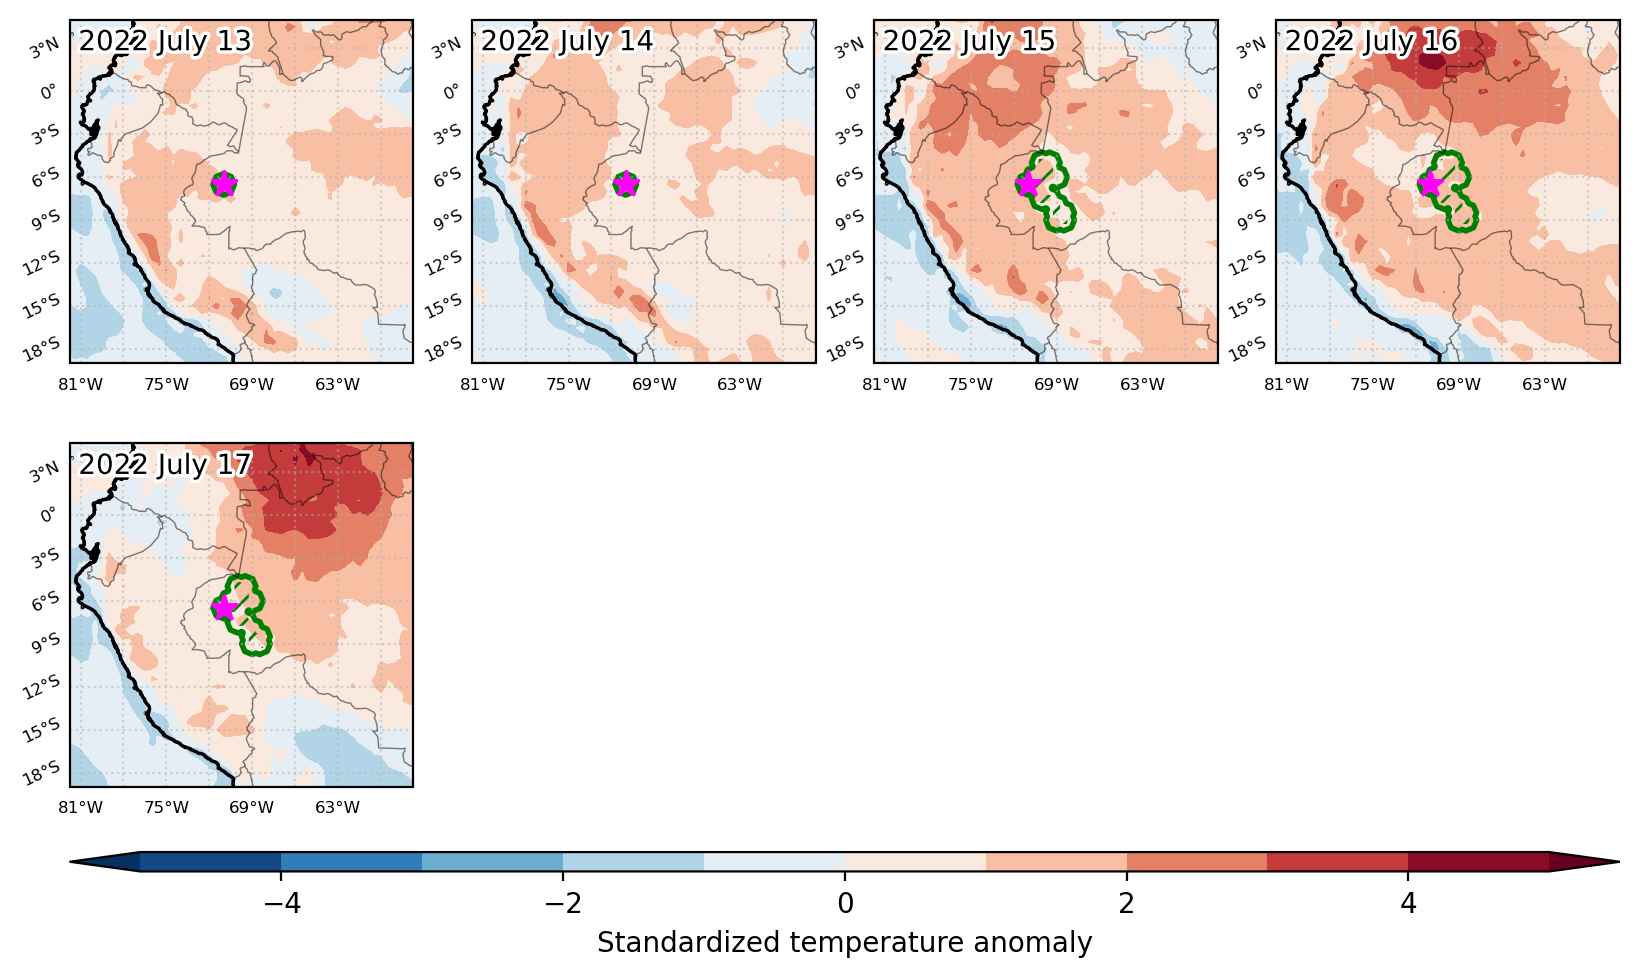
Event center: -6.5°S 289.0°E

Area affected: 58301 km$^2$


Fig. 1: Map of most extreme temperature anomalies (standardized) experienced during the event. The purple star indicates the center of the extreme event. Green hatching illustrates all areas under the effect of extremes at some time during the event.


Fig. 2: Evolution of temperature at the center of the event. The climatological percentile distribution is illustrated with color shadings.


Fig. 3: Maps illustrating the evolution of standardized temperature anomalies during the event.

Event ID: Heat_wave_2022-Jul-13_to_2022-Jul-17_289.0_-6.5

Cold spell occuring from July 09 2022 to July 14 2022 at -13.5°S 313.0°E

Download data: JSON

Event type: Cold spell

Countries affected (identified with ArcGIS Online; provided only for geographical reference):

  • Brazil

Duration: 6 days

Time span: July 09 2022 to July 14 2022

Statistics over entire affected area:

  • Mean temperature anomaly: -1.8 °C
  • Mean temperature: 22.7 °C
  • Minimum temperature anomaly: -2.7 °C
  • Minimum temperature: 17.9 °C

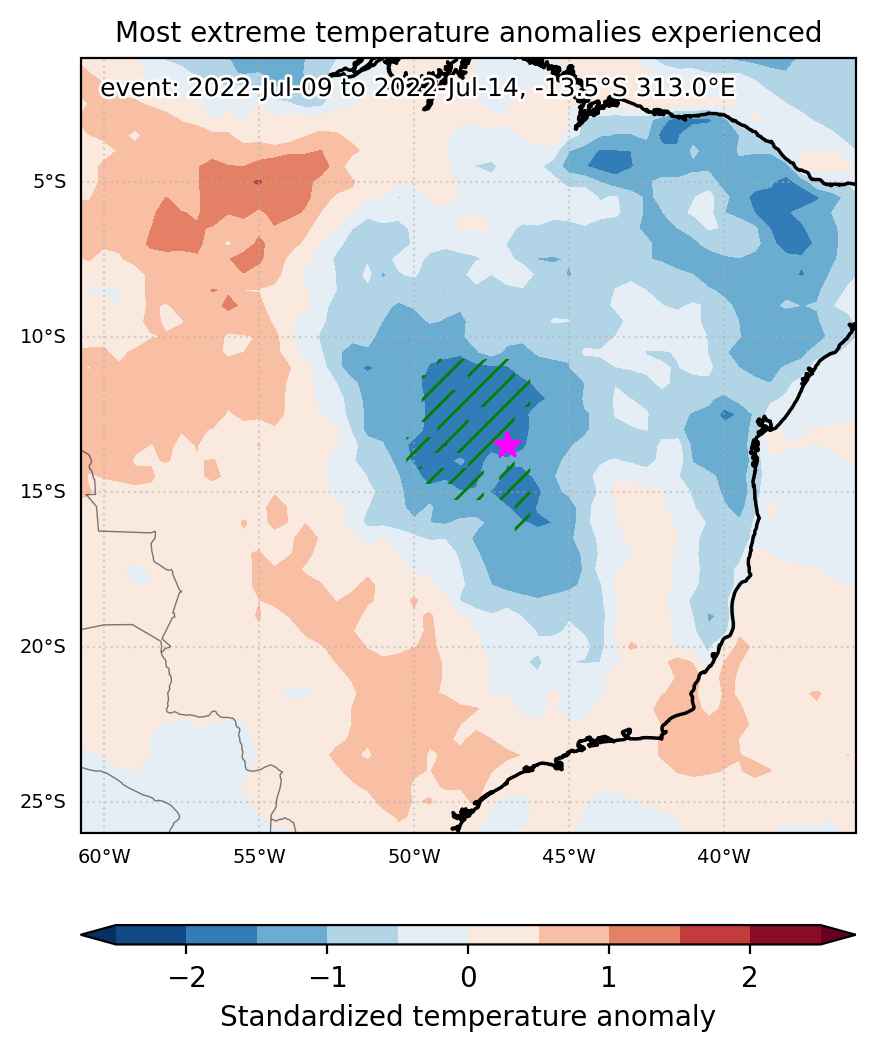
Event center: -13.5°S 313.0°E

Area affected: 150544 km$^2$


Fig. 1: Map of most extreme temperature anomalies (standardized) experienced during the event. The purple star indicates the center of the extreme event. Green hatching illustrates all areas under the effect of extremes at some time during the event.


Fig. 2: Evolution of temperature at the center of the event. The climatological percentile distribution is illustrated with color shadings.


Fig. 3: Maps illustrating the evolution of standardized temperature anomalies during the event.

Event ID: Cold_spell_2022-Jul-09_to_2022-Jul-14_313.0_-13.5

Cold spell occuring from July 04 2022 to July 07 2022 at -11.0°S 311.5°E

Download data: JSON

Event type: Cold spell

Countries affected (identified with ArcGIS Online; provided only for geographical reference):

  • Brazil

Duration: 4 days

Time span: July 04 2022 to July 07 2022

Statistics over entire affected area:

  • Mean temperature anomaly: -1.6 °C
  • Mean temperature: 24.1 °C
  • Minimum temperature anomaly: -2.5 °C
  • Minimum temperature: 20.8 °C

Event center: -11.0°S 311.5°E

Area affected: 142213 km$^2$


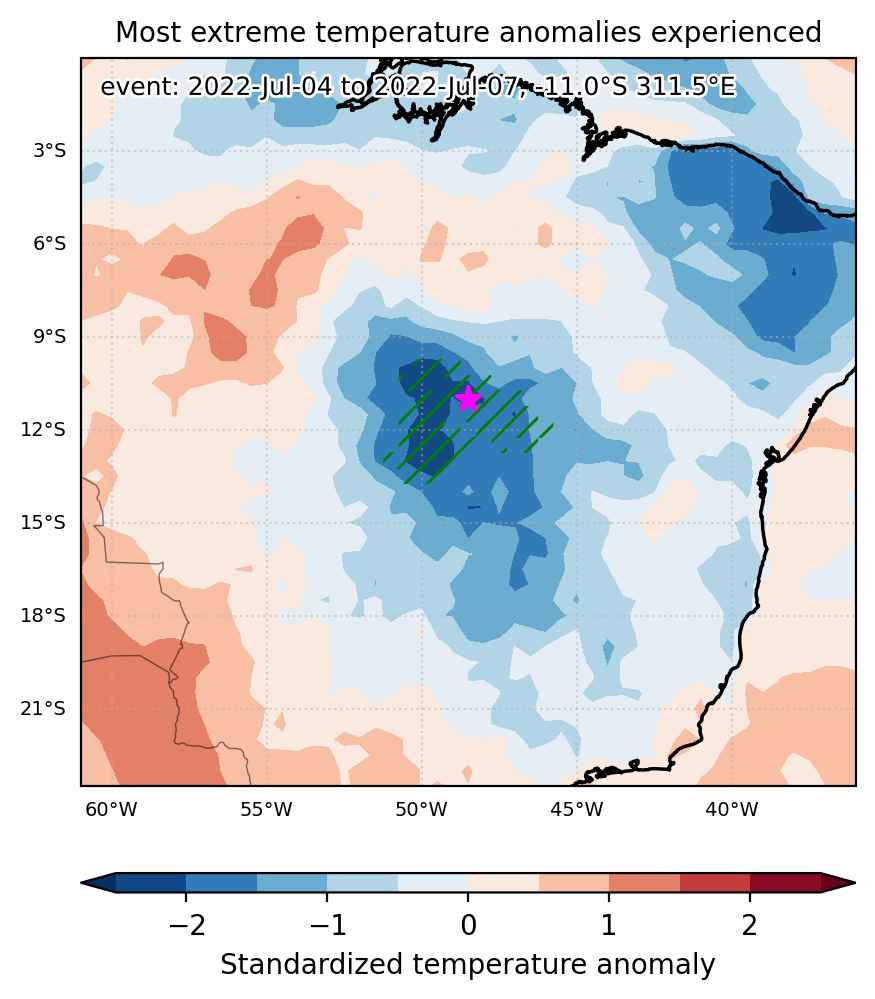
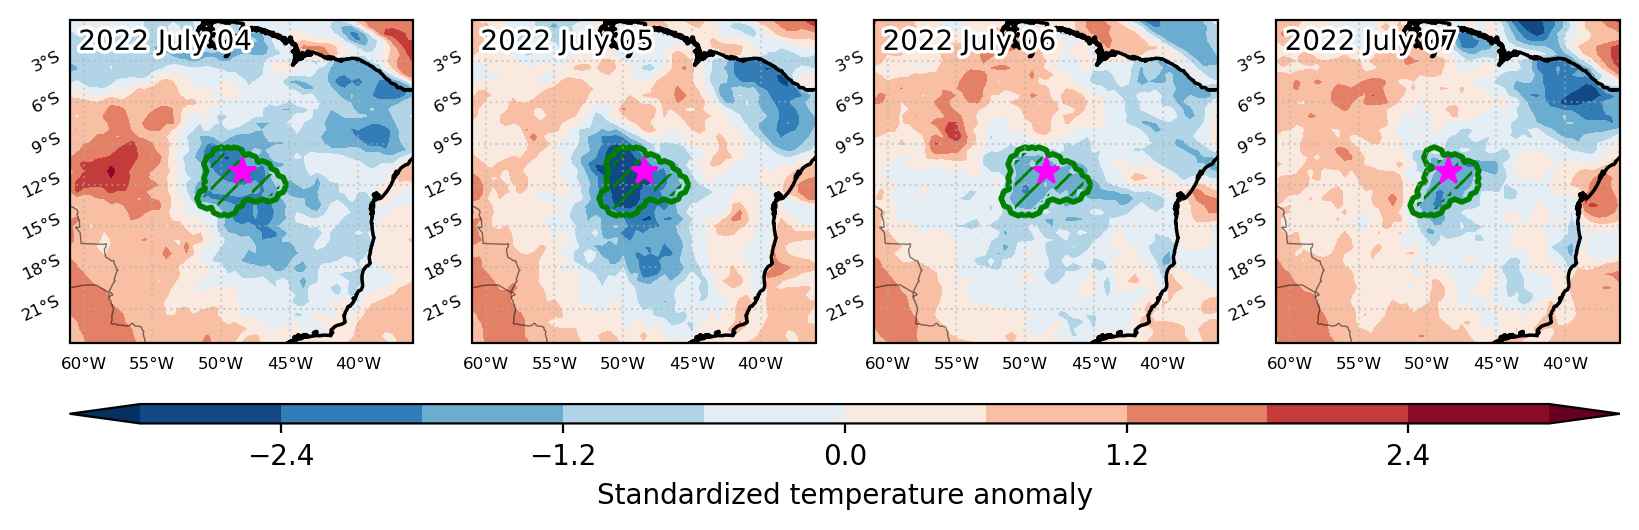
Fig. 1: Map of most extreme temperature anomalies (standardized) experienced during the event. The purple star indicates the center of the extreme event. Green hatching illustrates all areas under the effect of extremes at some time during the event.


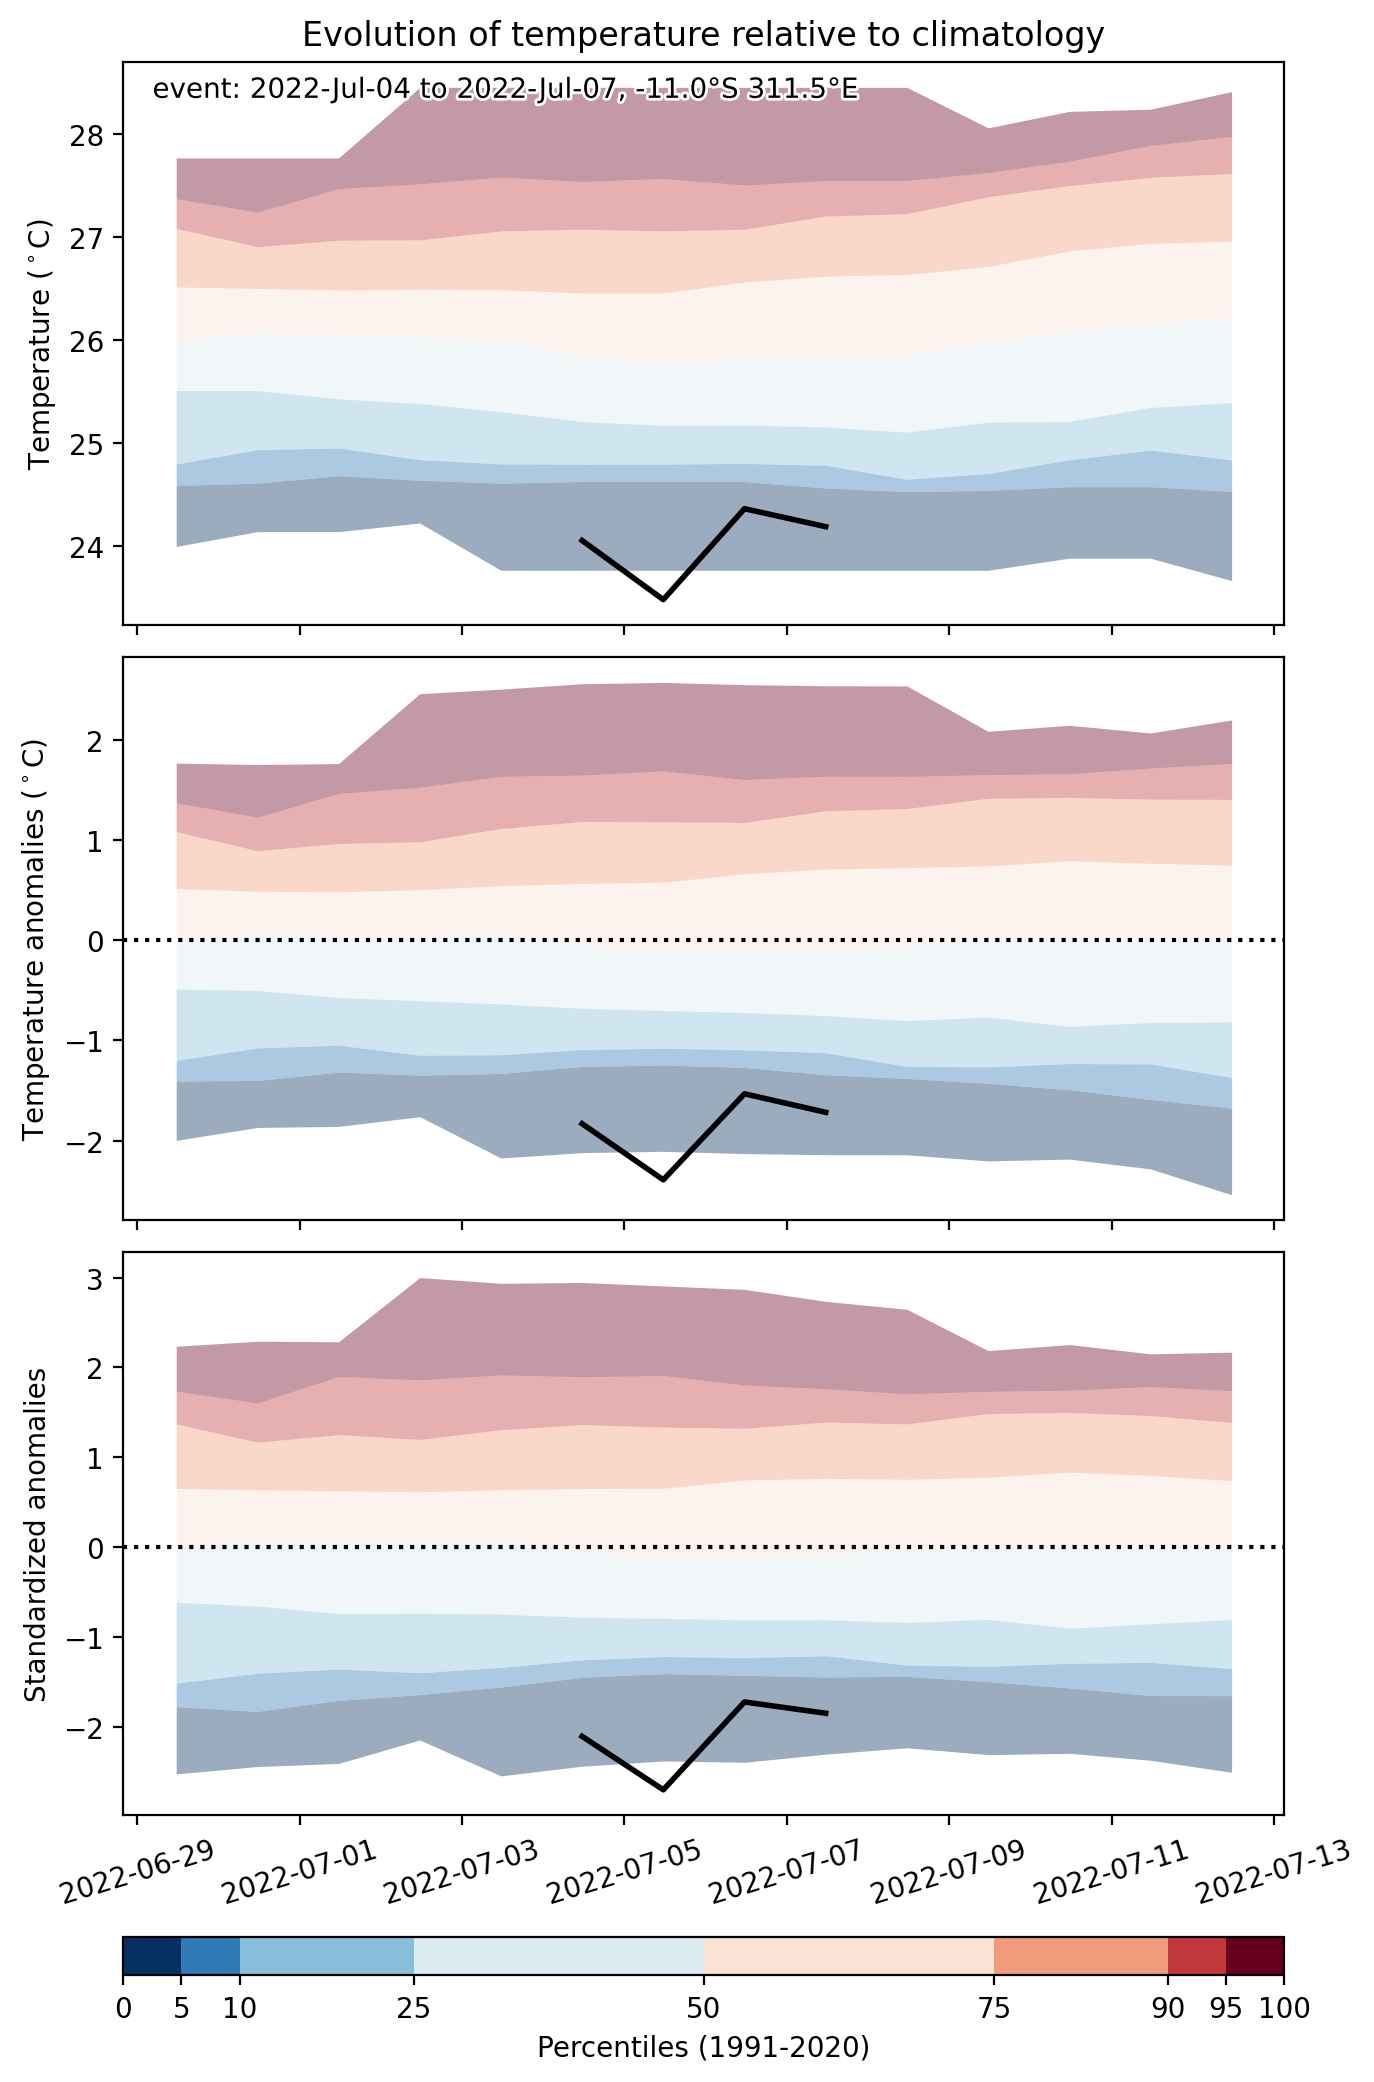
Fig. 2: Evolution of temperature at the center of the event. The climatological percentile distribution is illustrated with color shadings.


Fig. 3: Maps illustrating the evolution of standardized temperature anomalies during the event.

Event ID: Cold_spell_2022-Jul-04_to_2022-Jul-07_311.5_-11.0

Heat wave occuring from July 01 2022 to July 07 2022 at 3.5°N 307.5°E

Download data: JSON

Event type: Heat wave

Countries affected (identified with ArcGIS Online; provided only for geographical reference):

  • Brazil
  • French Guiana
  • Suriname

Duration: 7 days

Time span: July 01 2022 to July 07 2022

Statistics over entire affected area:

  • Mean temperature anomaly: 1.0 °C
  • Mean temperature: 26.3 °C
  • Maximum temperature anomaly: 1.6 °C
  • Maximum temperature: 27.0 °C

Event center: 3.5°N 307.5°E

Area affected: 64714 km$^2$


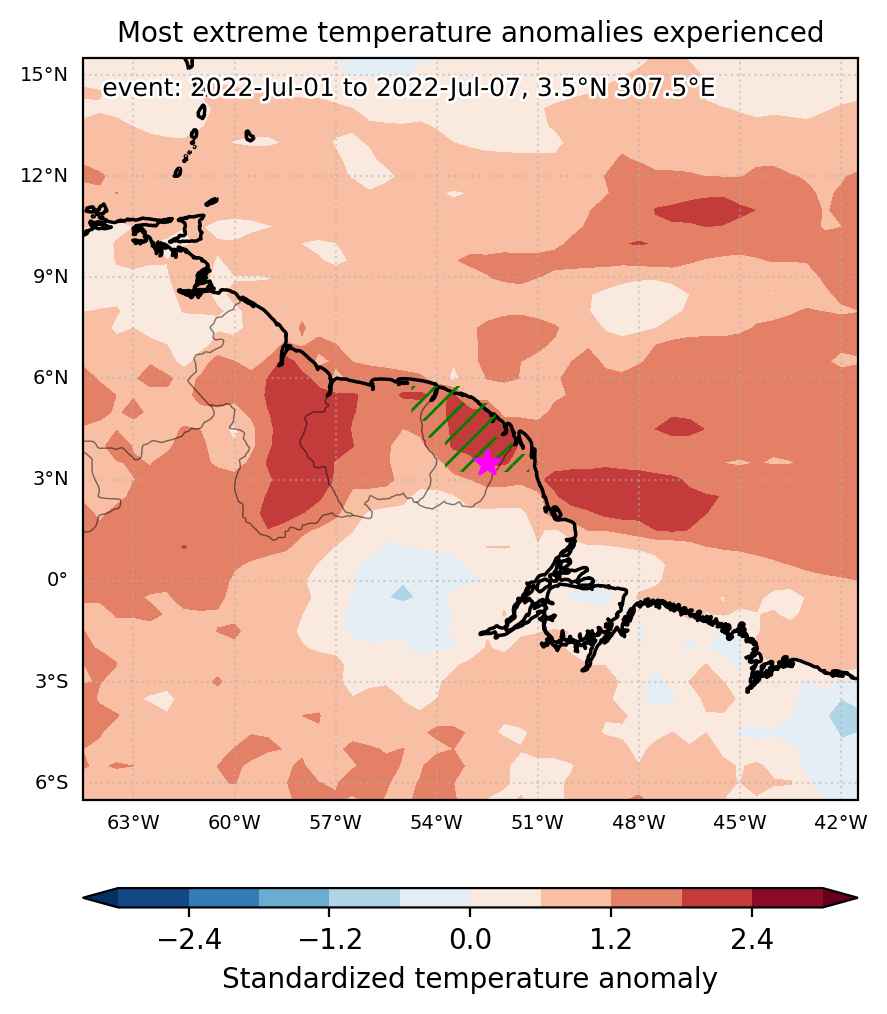
Fig. 1: Map of most extreme temperature anomalies (standardized) experienced during the event. The purple star indicates the center of the extreme event. Green hatching illustrates all areas under the effect of extremes at some time during the event.


Fig. 2: Evolution of temperature at the center of the event. The climatological percentile distribution is illustrated with color shadings.


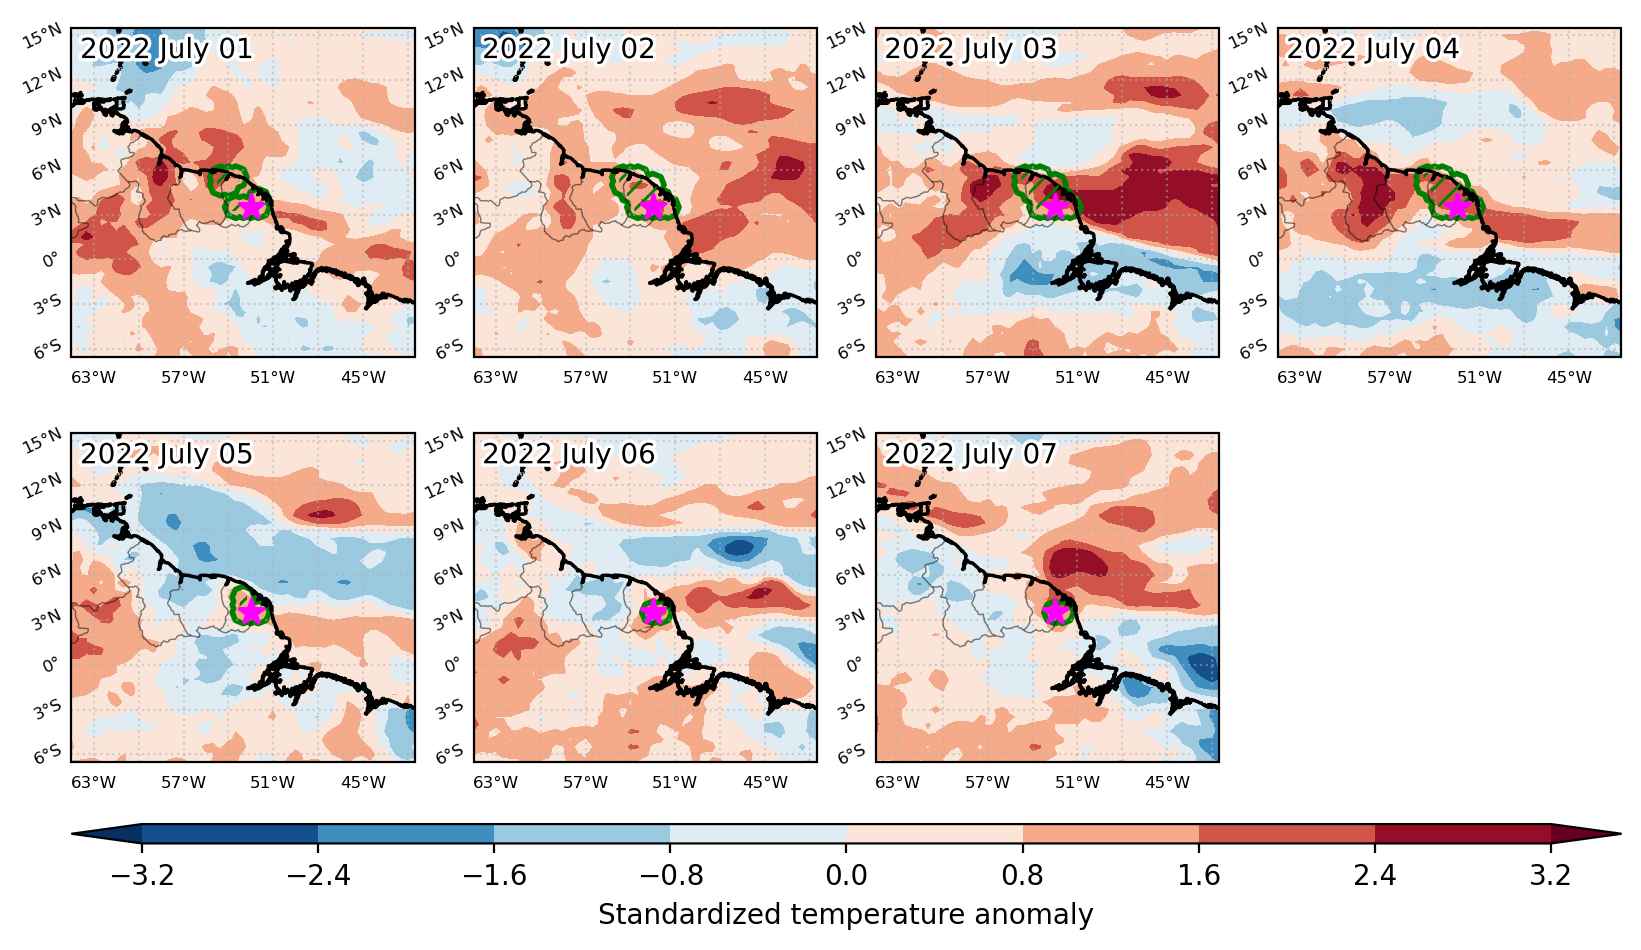
Fig. 3: Maps illustrating the evolution of standardized temperature anomalies during the event.

Event ID: Heat_wave_2022-Jul-01_to_2022-Jul-07_307.5_3.5

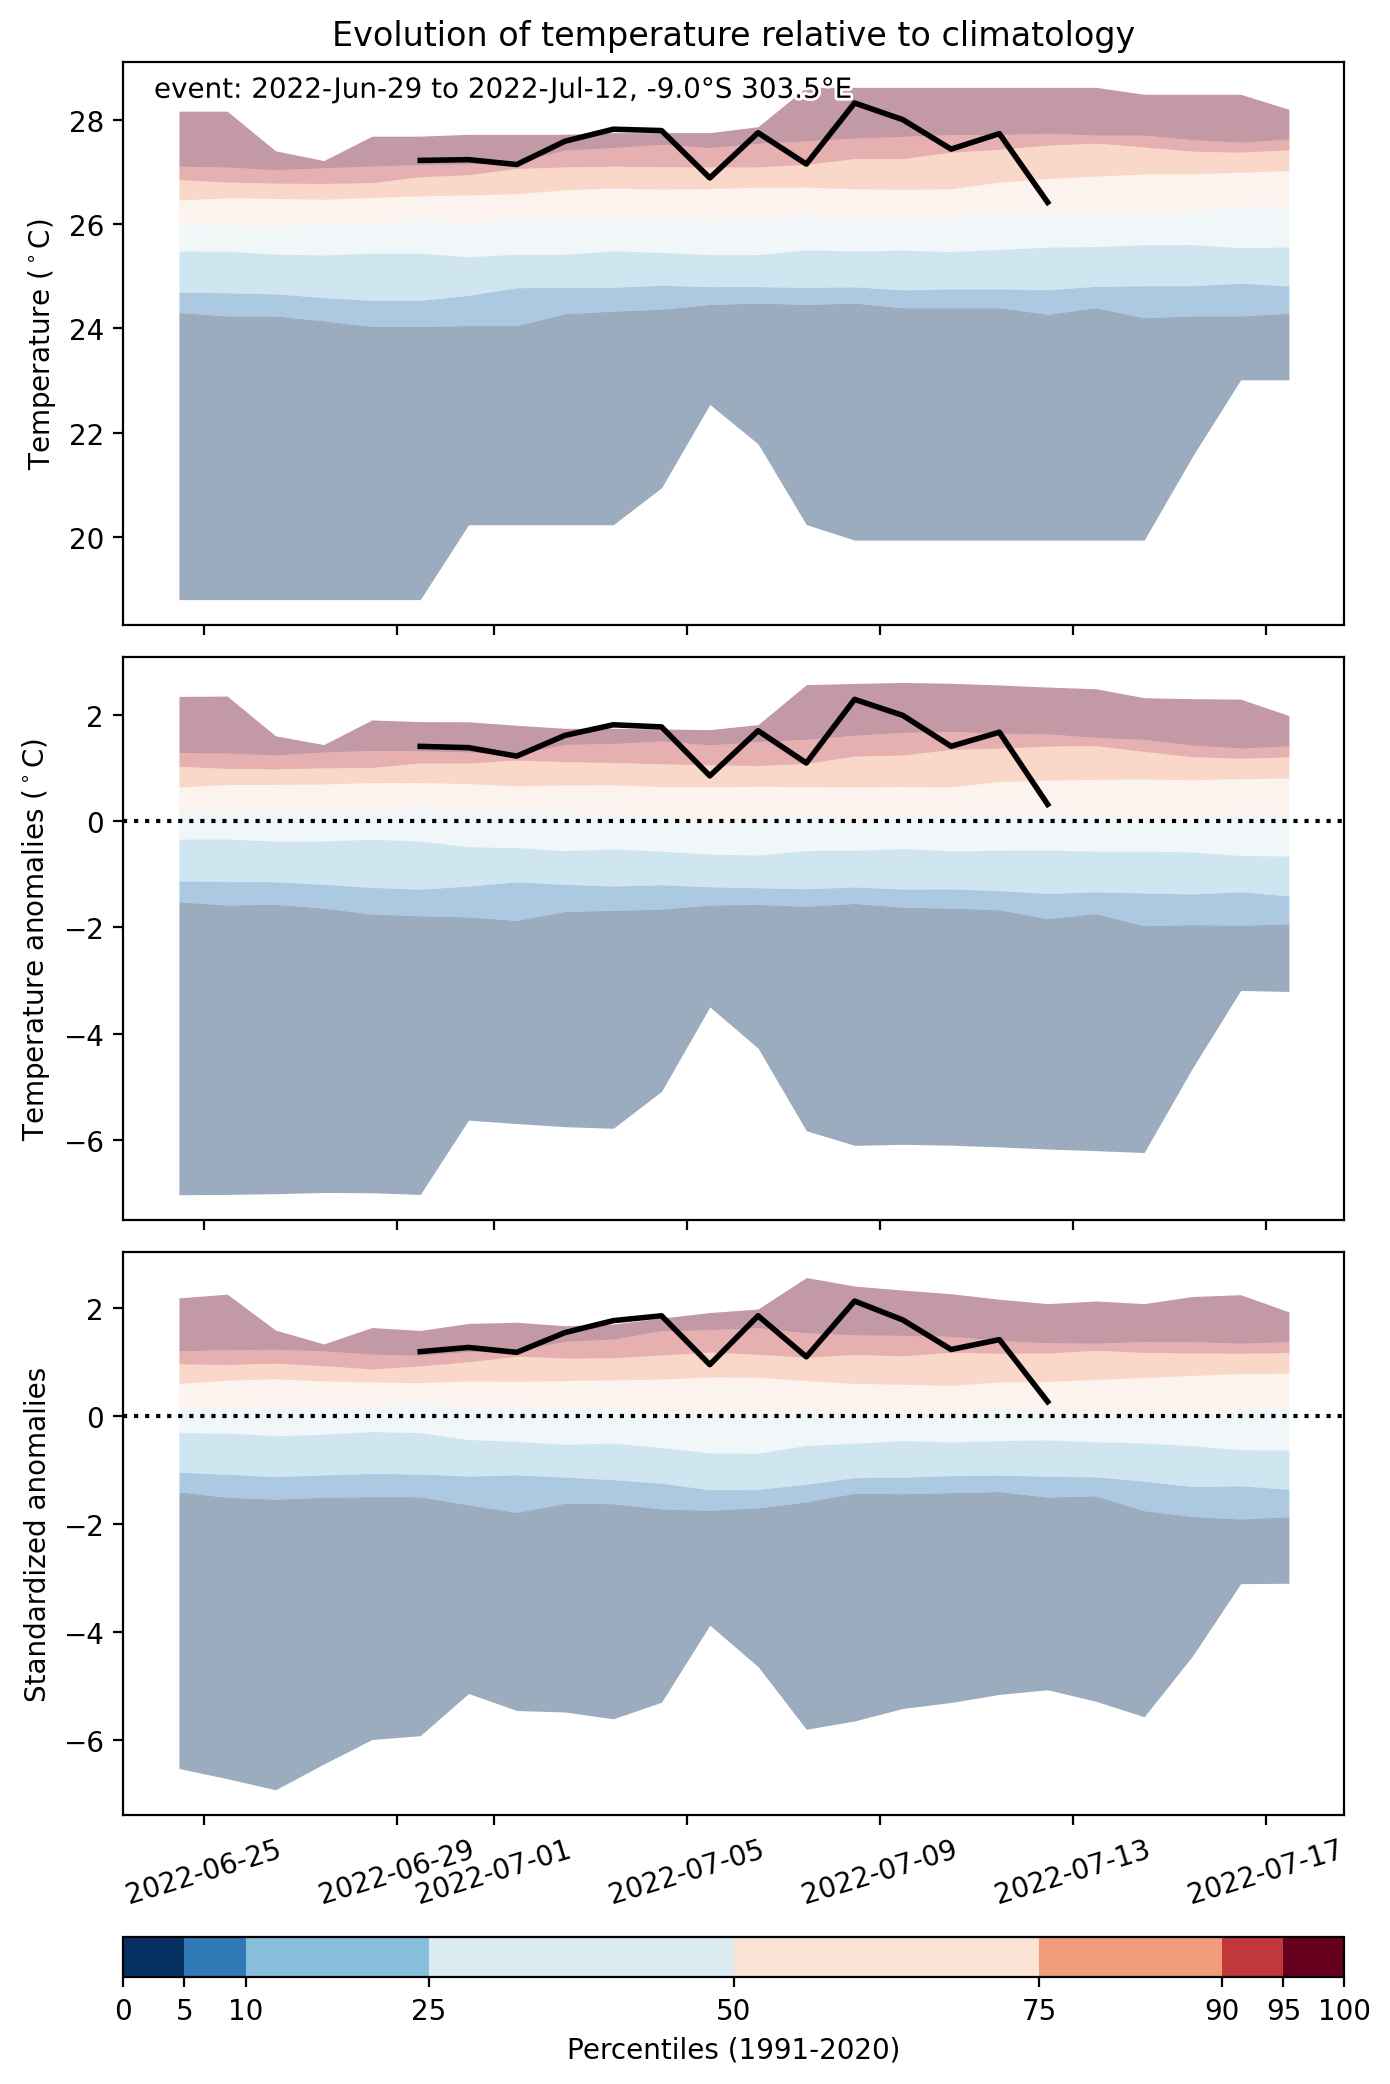
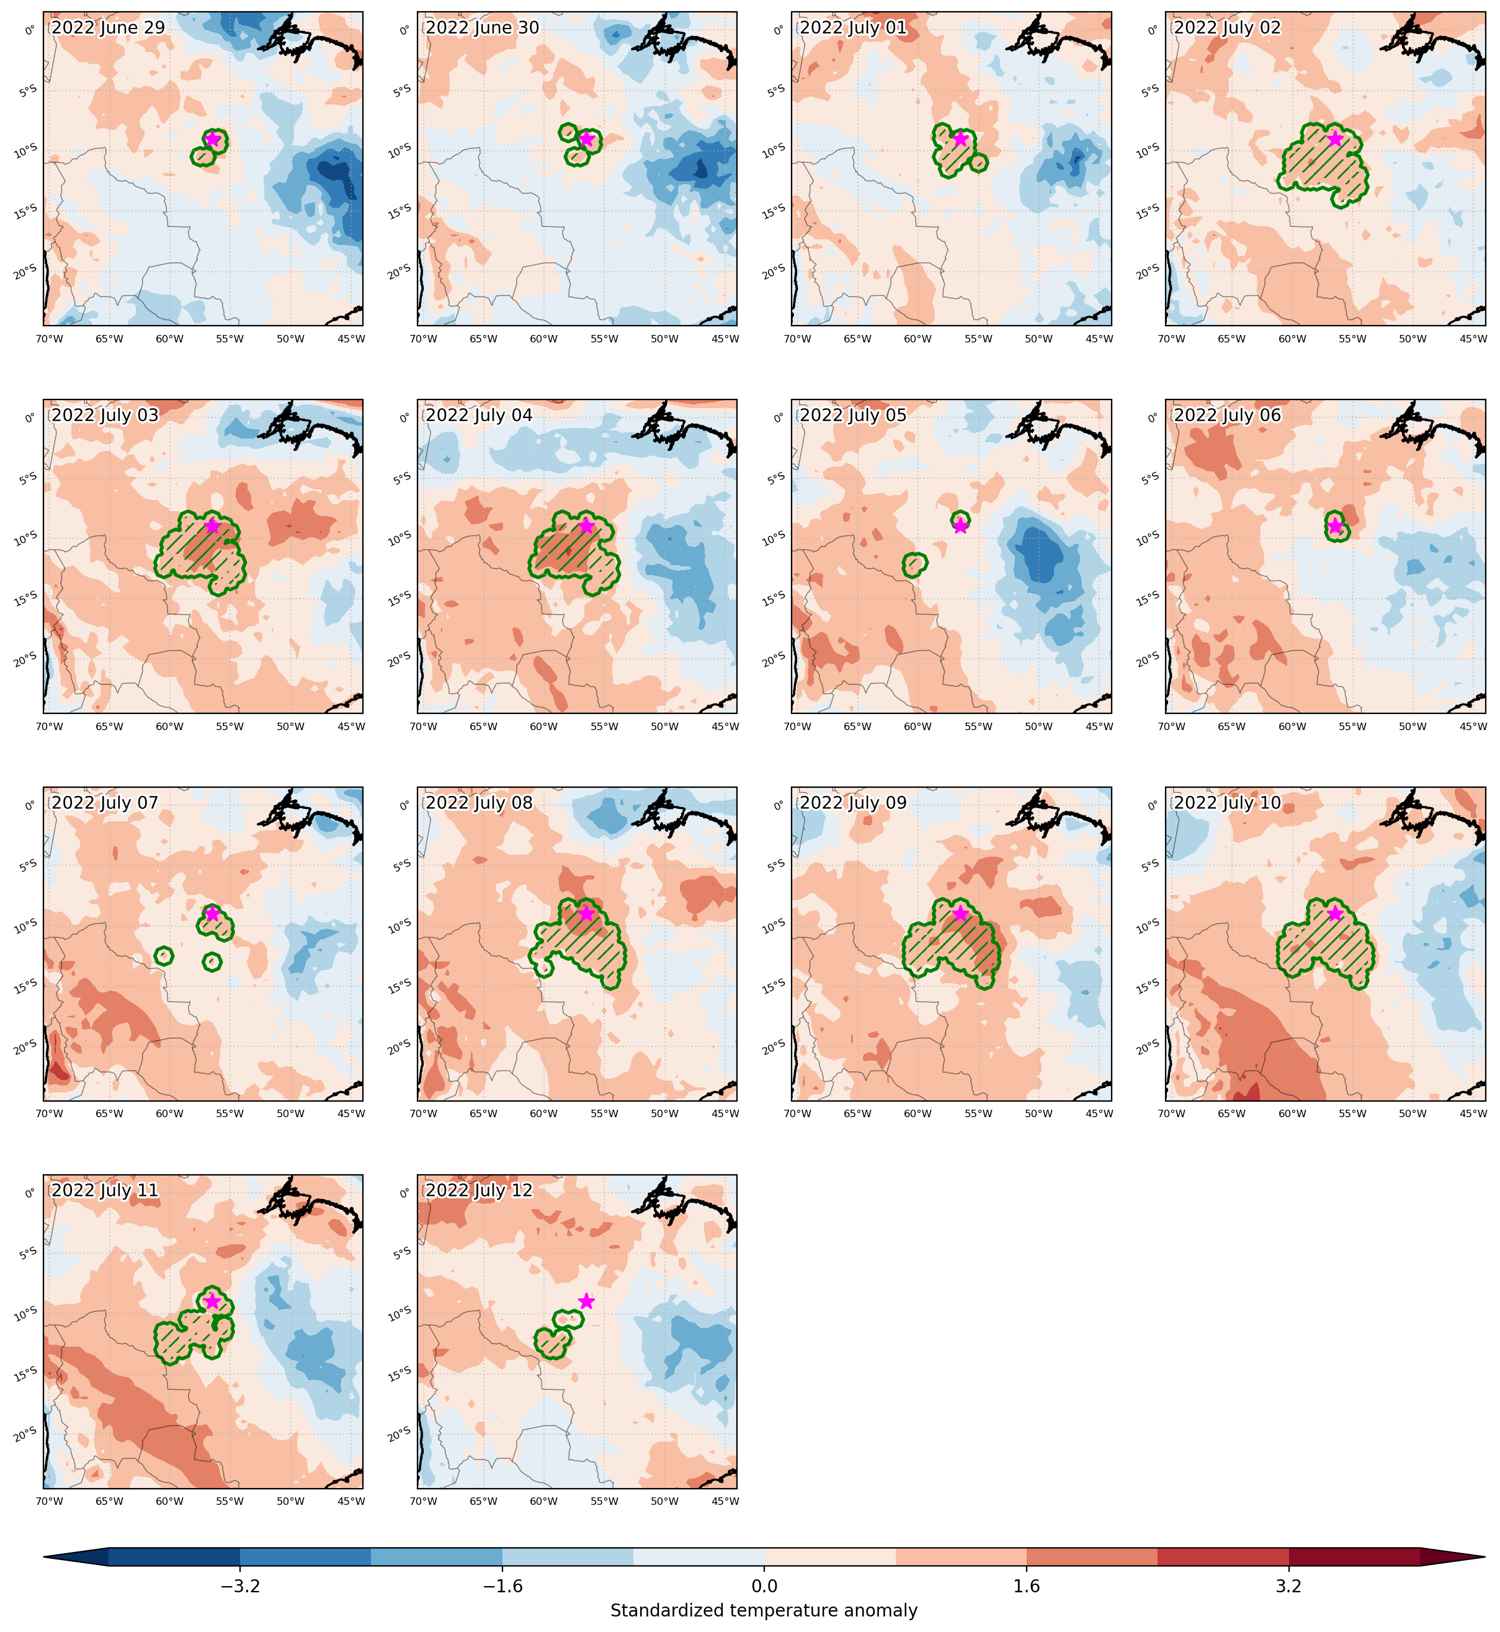
Heat wave occuring from June 29 2022 to July 12 2022 at -9.0°S 303.5°E

Download data: JSON

Event type: Heat wave

Countries affected (identified with ArcGIS Online; provided only for geographical reference):

  • Brazil

Duration: 14 days

Time span: June 29 2022 to July 12 2022

Statistics over entire affected area:

  • Mean temperature anomaly: 1.9 °C
  • Mean temperature: 26.8 °C
  • Maximum temperature anomaly: 3.3 °C
  • Maximum temperature: 28.5 °C

Event center: -9.0°S 303.5°E

Area affected: 315223 km$^2$


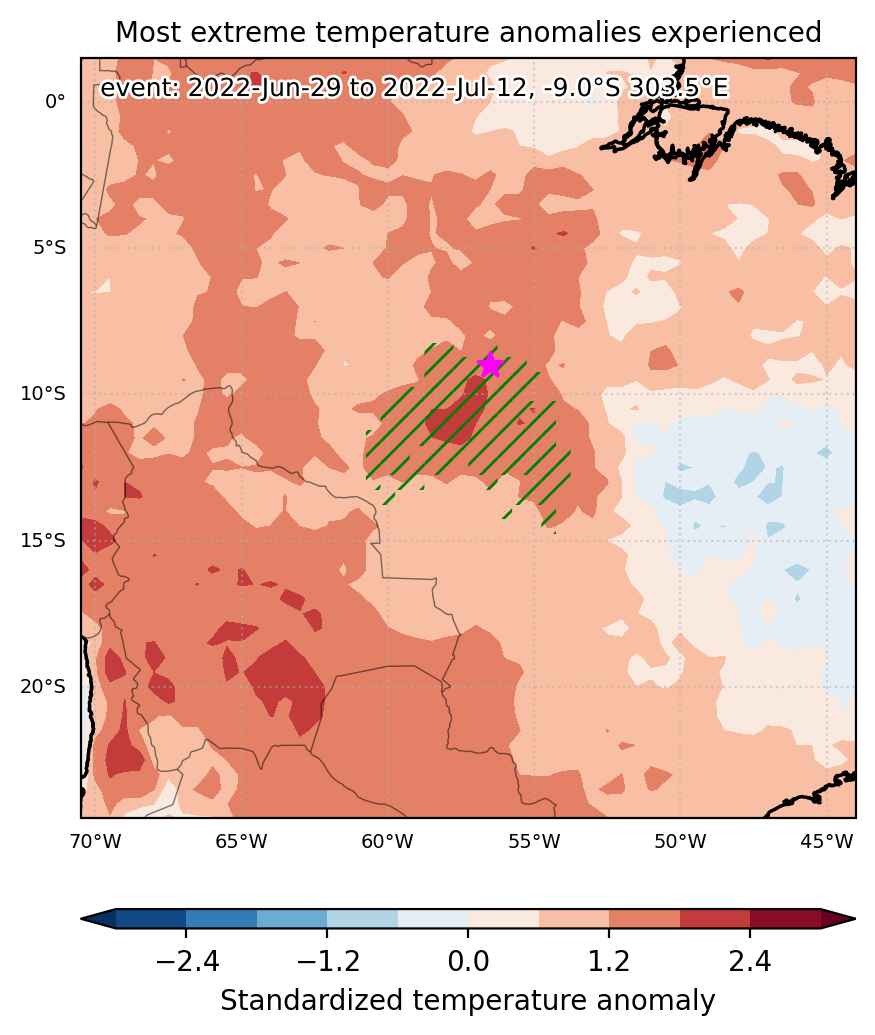
Fig. 1: Map of most extreme temperature anomalies (standardized) experienced during the event. The purple star indicates the center of the extreme event. Green hatching illustrates all areas under the effect of extremes at some time during the event.


Fig. 2: Evolution of temperature at the center of the event. The climatological percentile distribution is illustrated with color shadings.


Fig. 3: Maps illustrating the evolution of standardized temperature anomalies during the event.

Event ID: Heat_wave_2022-Jun-29_to_2022-Jul-12_303.5_-9.0

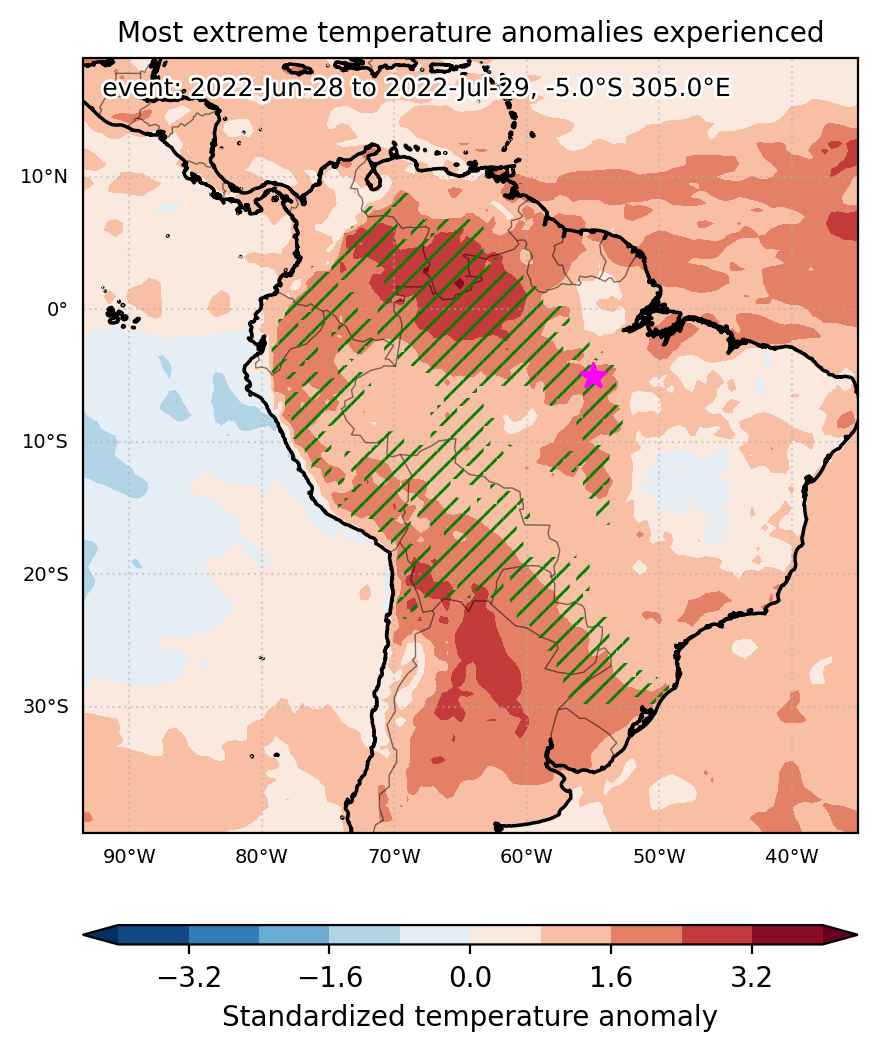
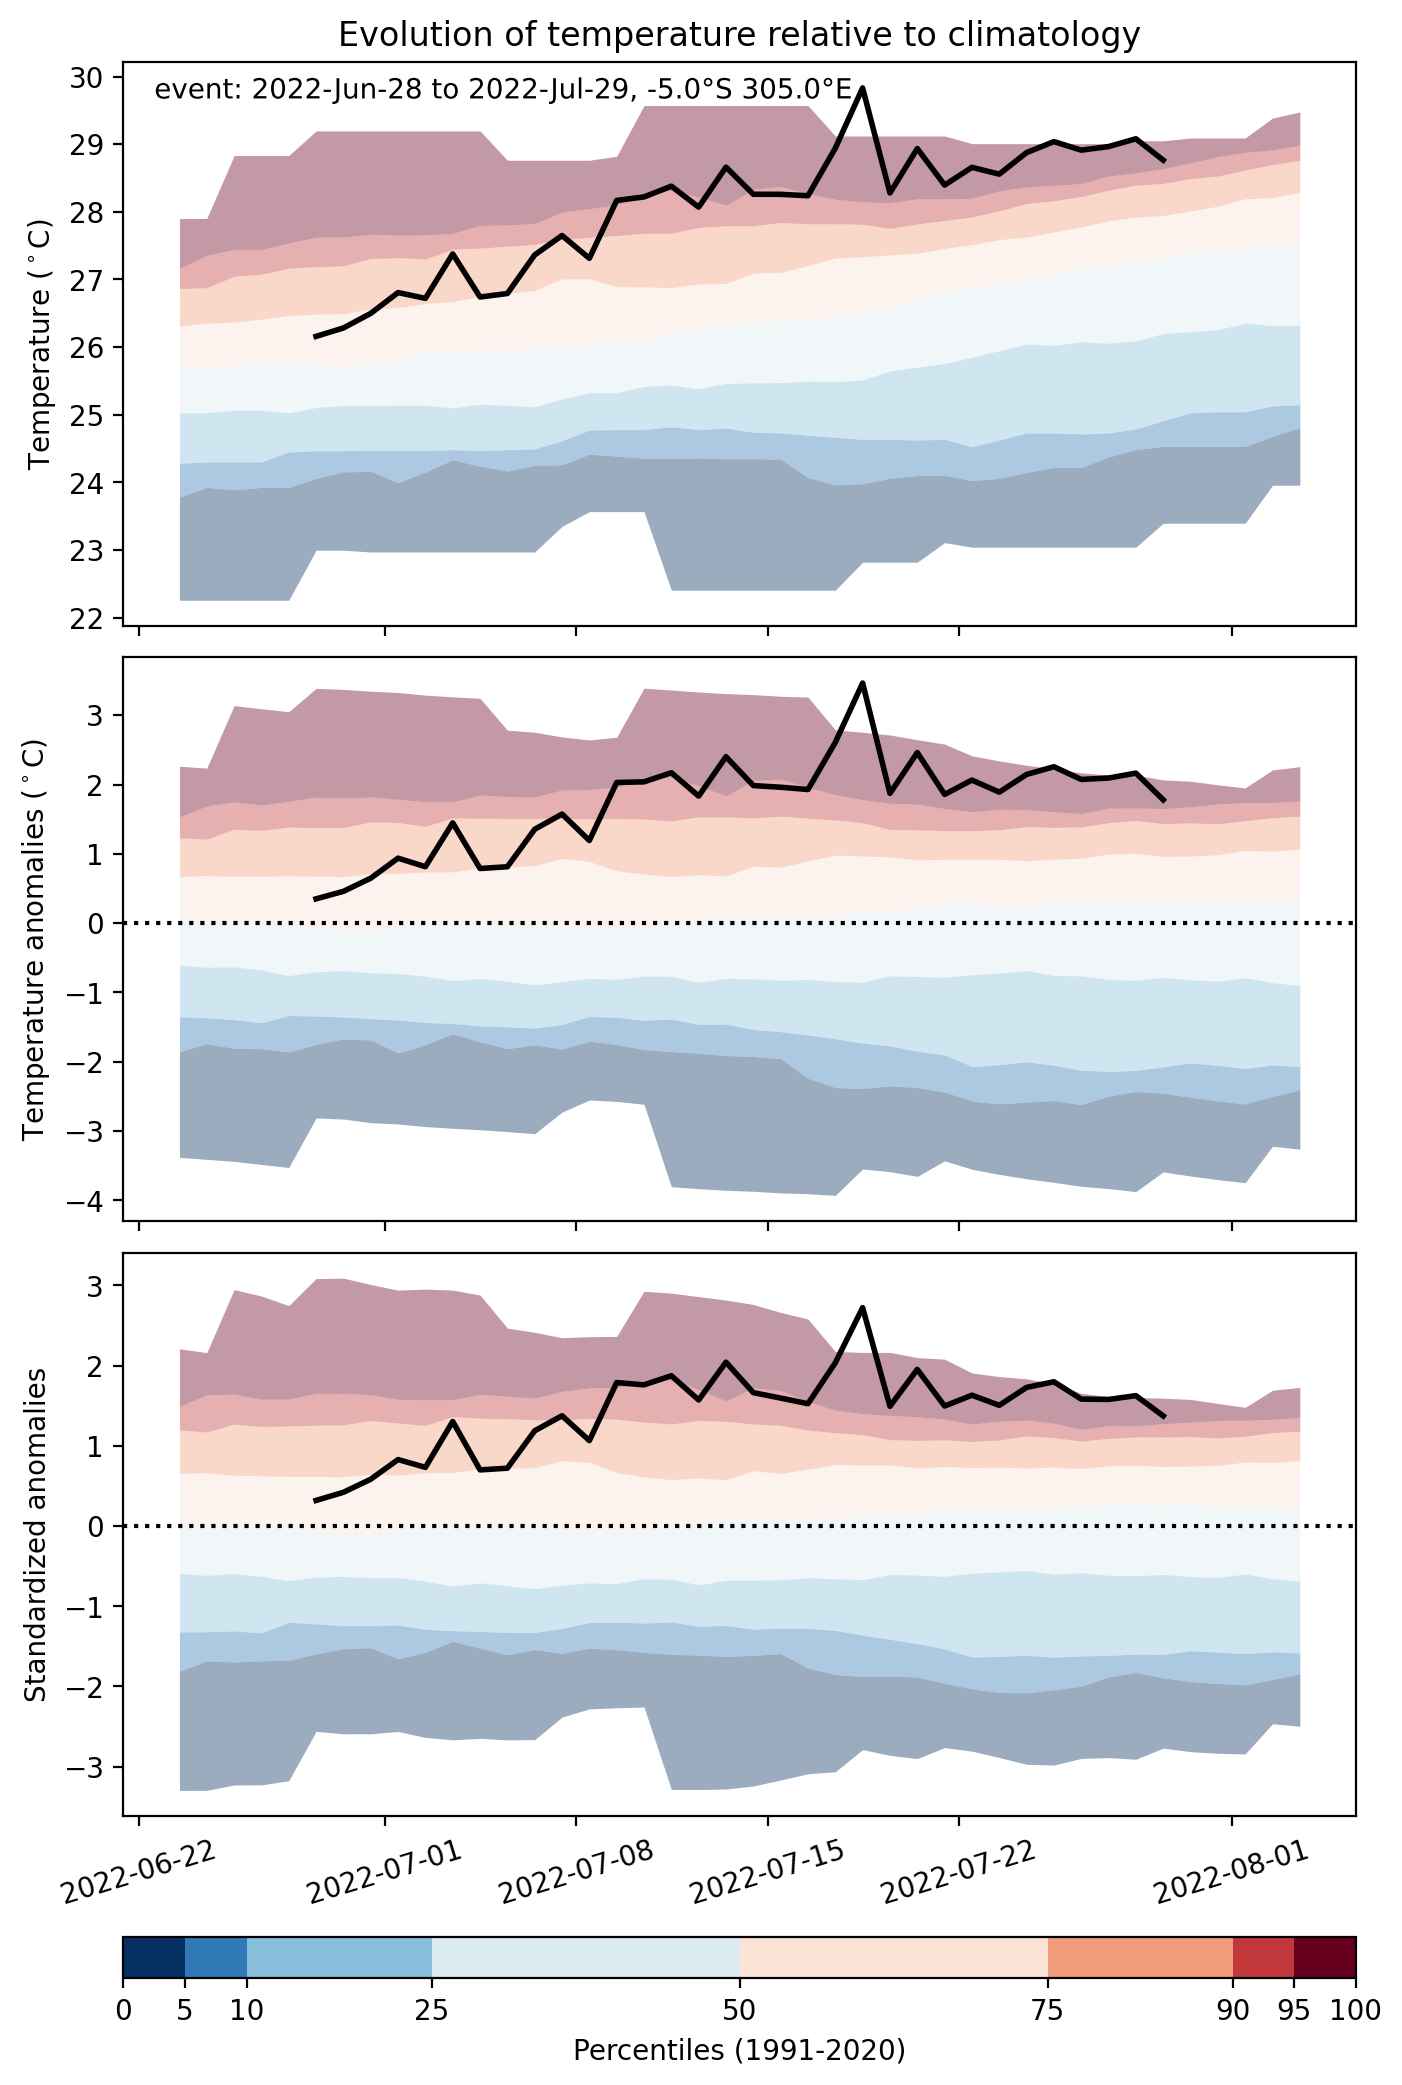
Heat wave occuring from June 28 2022 to July 29 2022 at -5.0°S 305.0°E

Download data: JSON

Event type: Heat wave

Countries affected (identified with ArcGIS Online; provided only for geographical reference):

  • Argentina
  • Bolivia, Plurinational State of
  • Brazil
  • Chile
  • Colombia
  • Ecuador
  • Paraguay
  • Peru
  • Venezuela, Bolivarian Republic of

Duration: 32 days

Time span: June 28 2022 to July 29 2022

Statistics over entire affected area:

  • Mean temperature anomaly: 3.1 °C
  • Mean temperature: 24.1 °C
  • Maximum temperature anomaly: 11.0 °C
  • Maximum temperature: 31.5 °C

Event center: -5.0°S 305.0°E

Area affected: 5172640 km$^2$


Fig. 1: Map of most extreme temperature anomalies (standardized) experienced during the event. The purple star indicates the center of the extreme event. Green hatching illustrates all areas under the effect of extremes at some time during the event.


Fig. 2: Evolution of temperature at the center of the event. The climatological percentile distribution is illustrated with color shadings.


Fig. 3: Maps illustrating the evolution of standardized temperature anomalies during the event.

Event ID: Heat_wave_2022-Jun-28_to_2022-Jul-29_305.0_-5.0