Heat wave occuring from February 27 2025 to March 03 2025 at 42.5°N 129.0°E

Download data: JSON

Event type: Heat wave

Countries affected (identified with ArcGIS Online; provided only for geographical reference):

  • China
  • Korea, Democratic People’s Republic of
  • Korea, Republic of

Duration: 5 days

Time span: February 27 2025 to March 03 2025

Statistics over entire affected area:

  • Mean temperature anomaly: 7.0 °C
  • Mean temperature: 2.8 °C
  • Maximum temperature anomaly: 11.2 °C
  • Maximum temperature: 10.5 °C

Event center: 42.5°N 129.0°E

Area affected: 153744 km$^2$
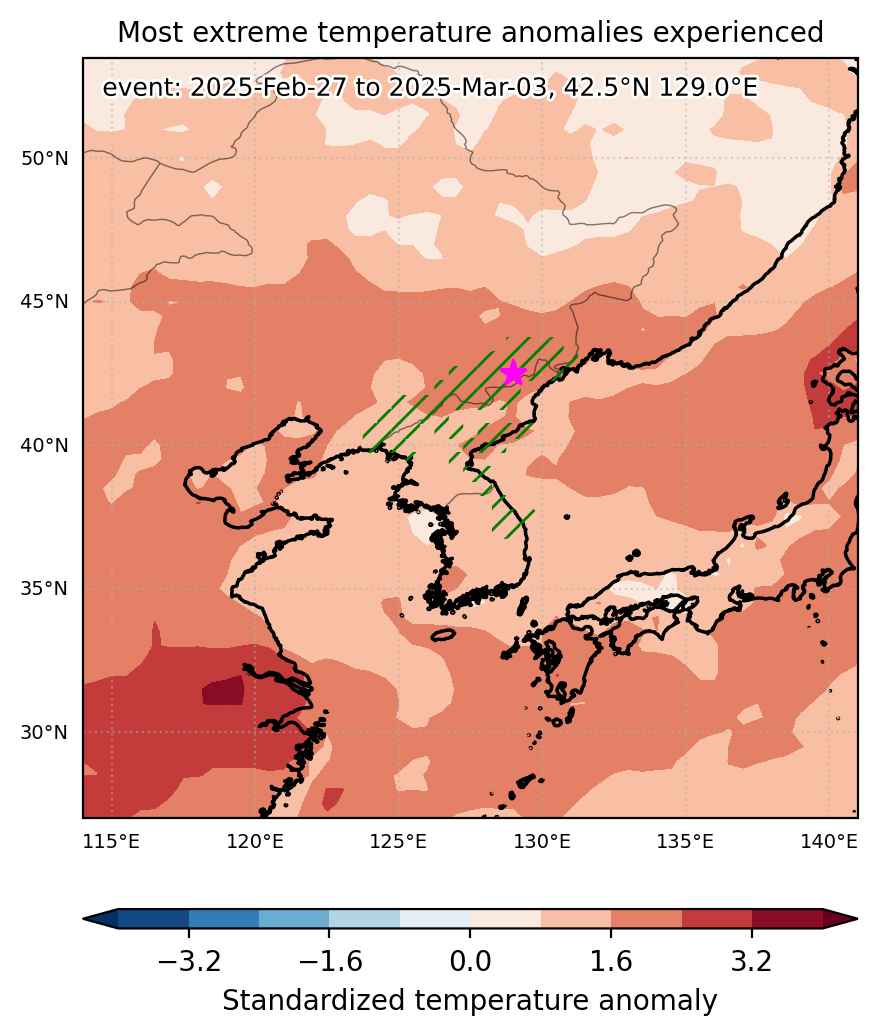

Fig. 1: Map of most extreme temperature anomalies (standardized) experienced during the event. The purple star indicates the center of the extreme event. Green hatching illustrates all areas under the effect of extremes at some time during the event.
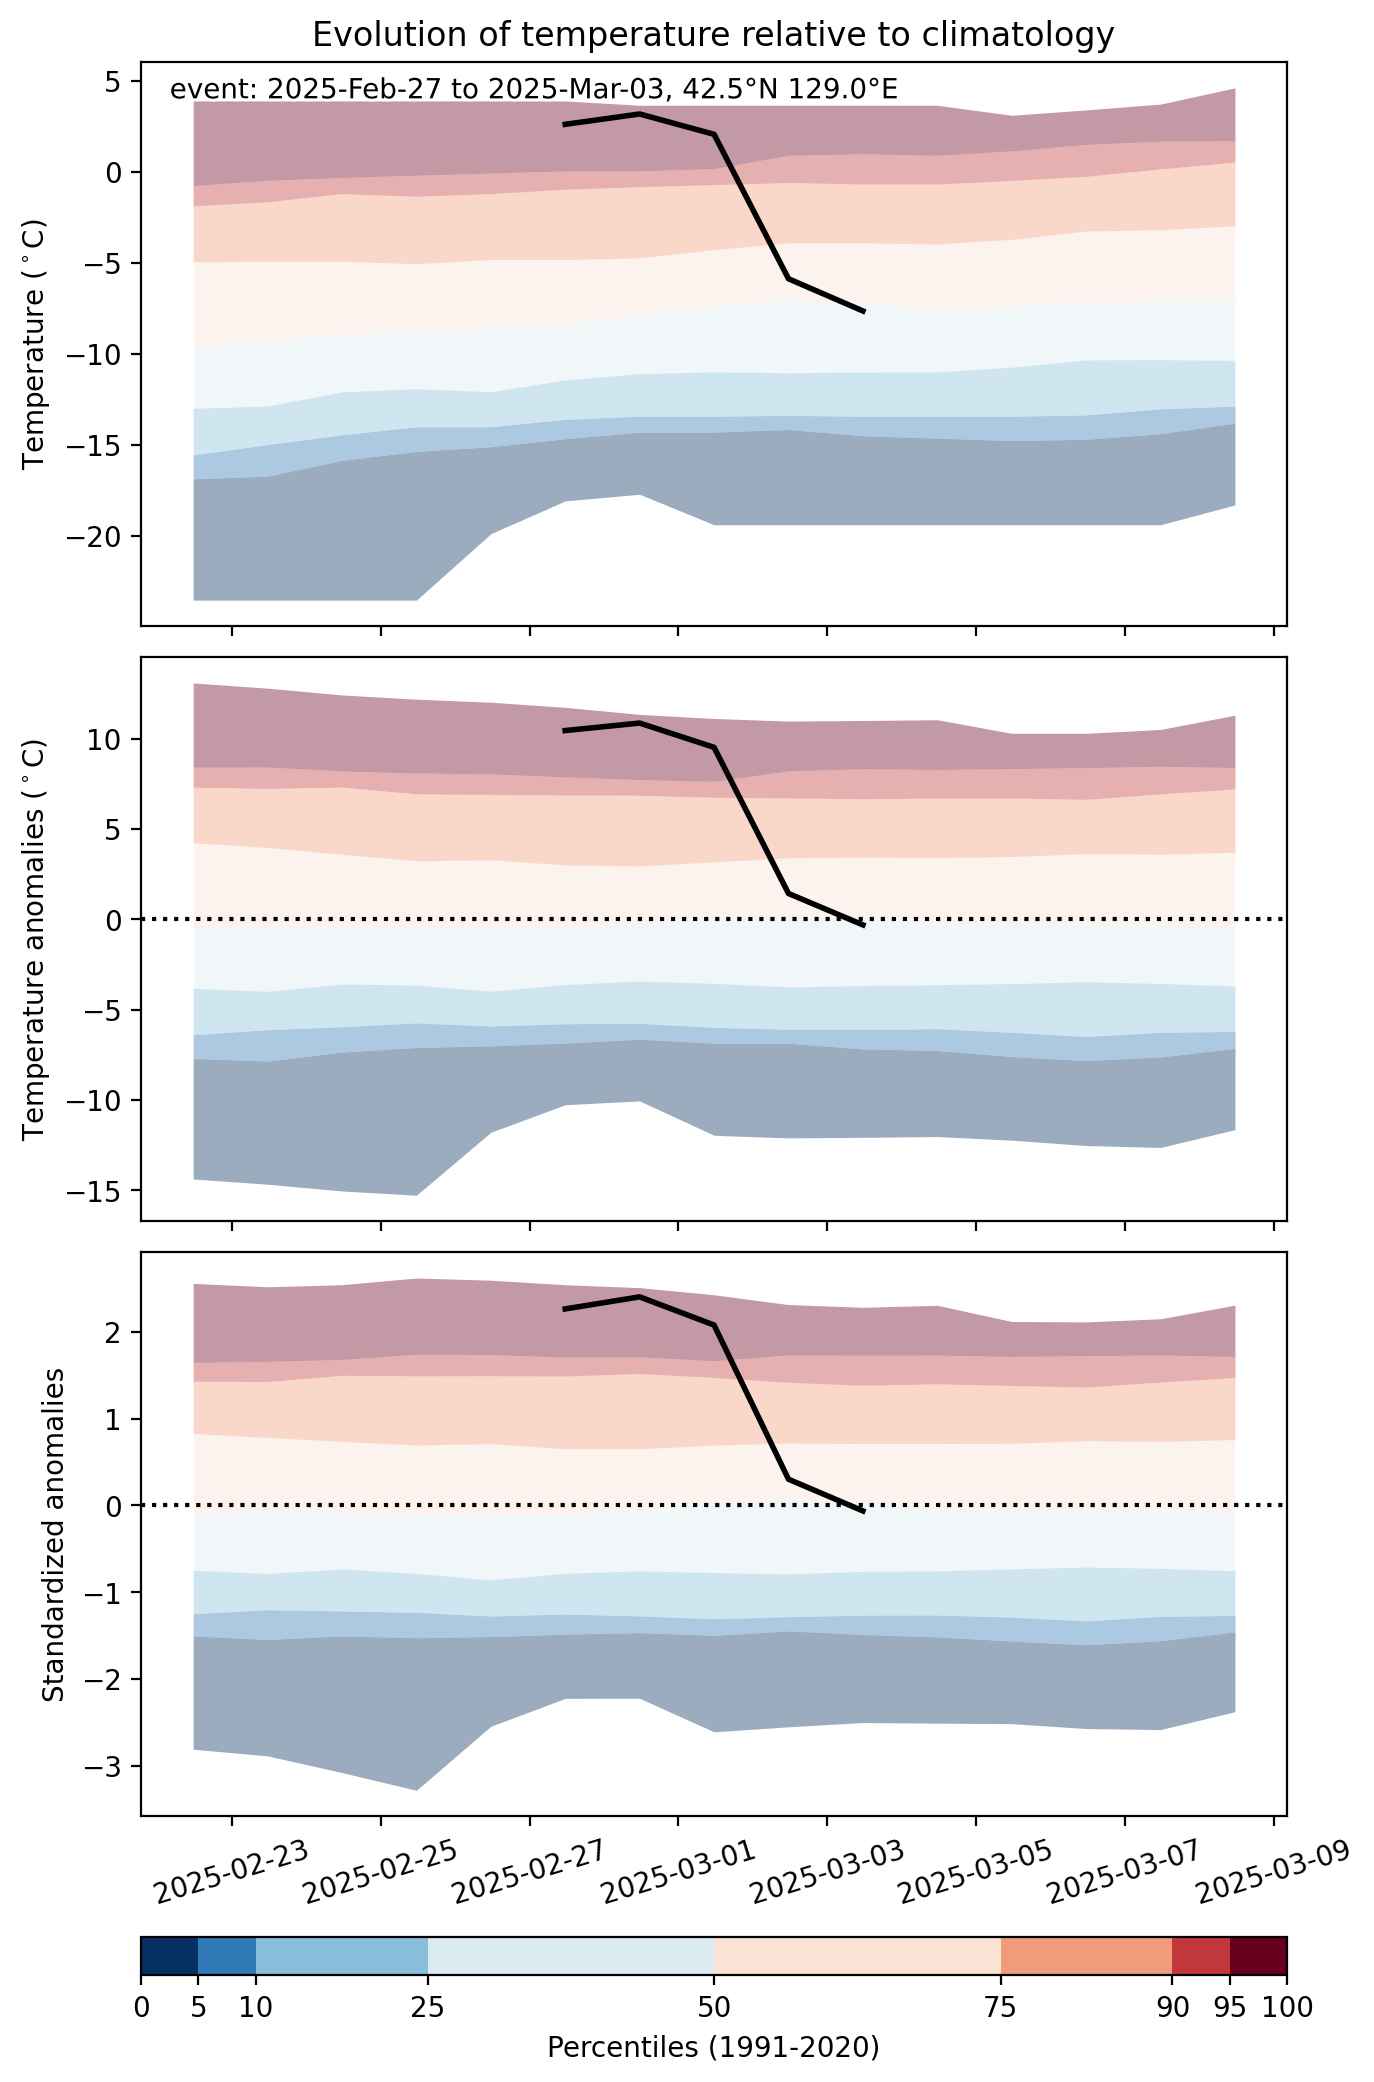


Fig. 2: Evolution of temperature at the center of the event. The climatological percentile distribution is illustrated with color shadings.
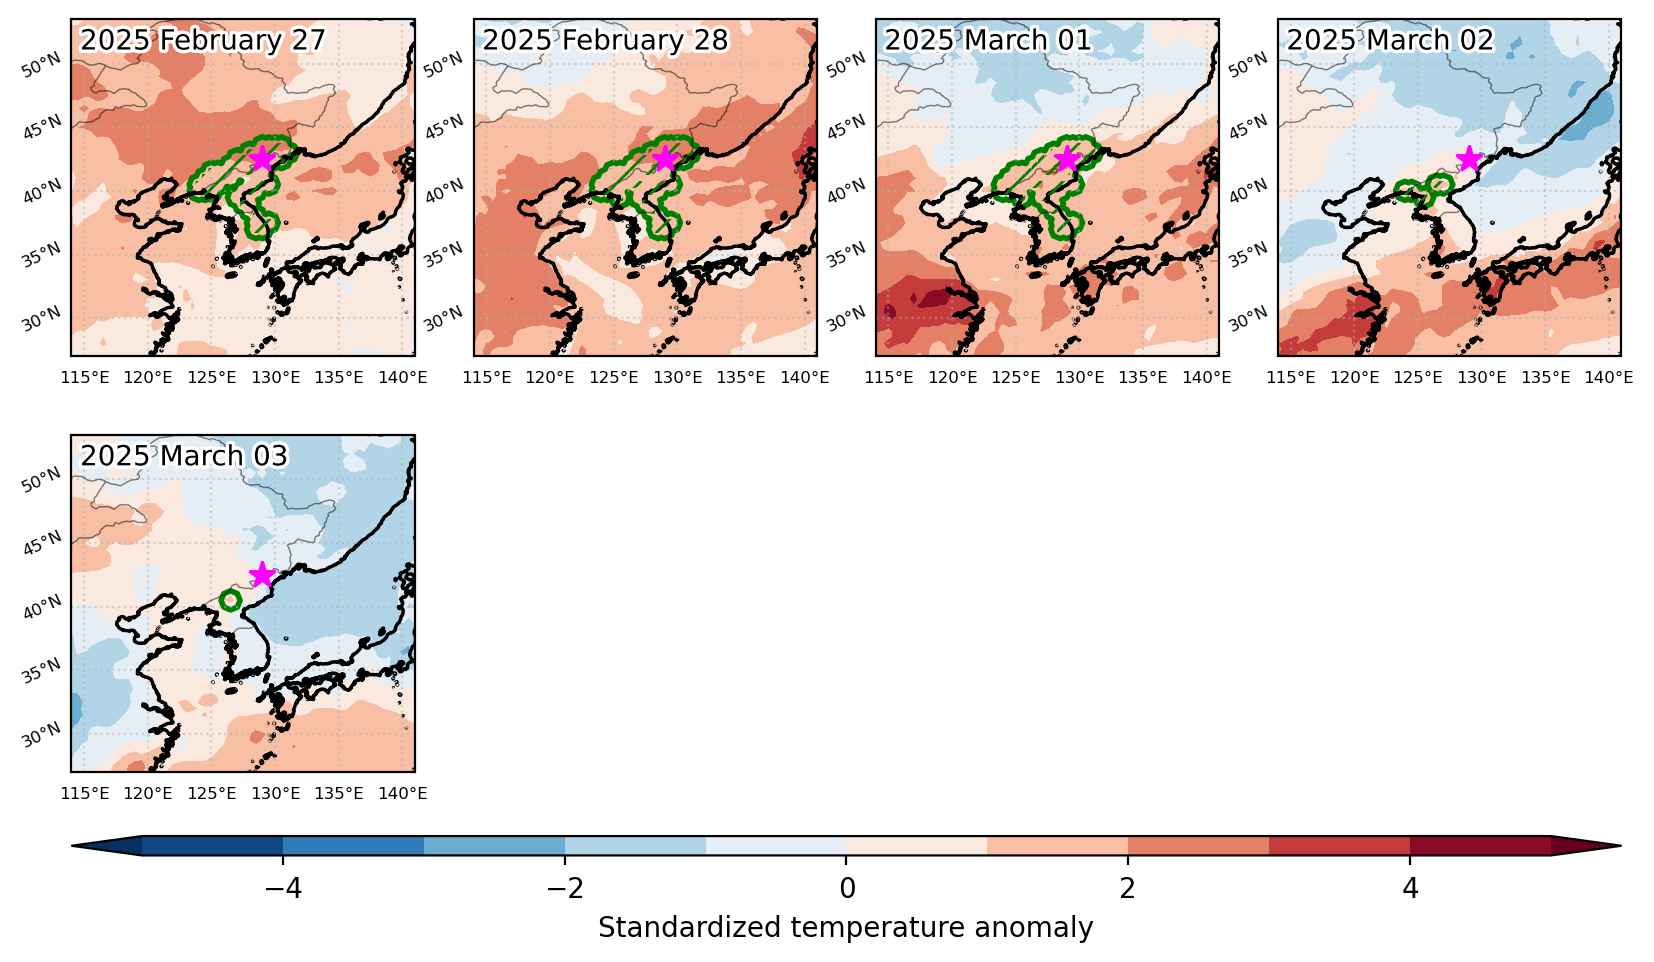


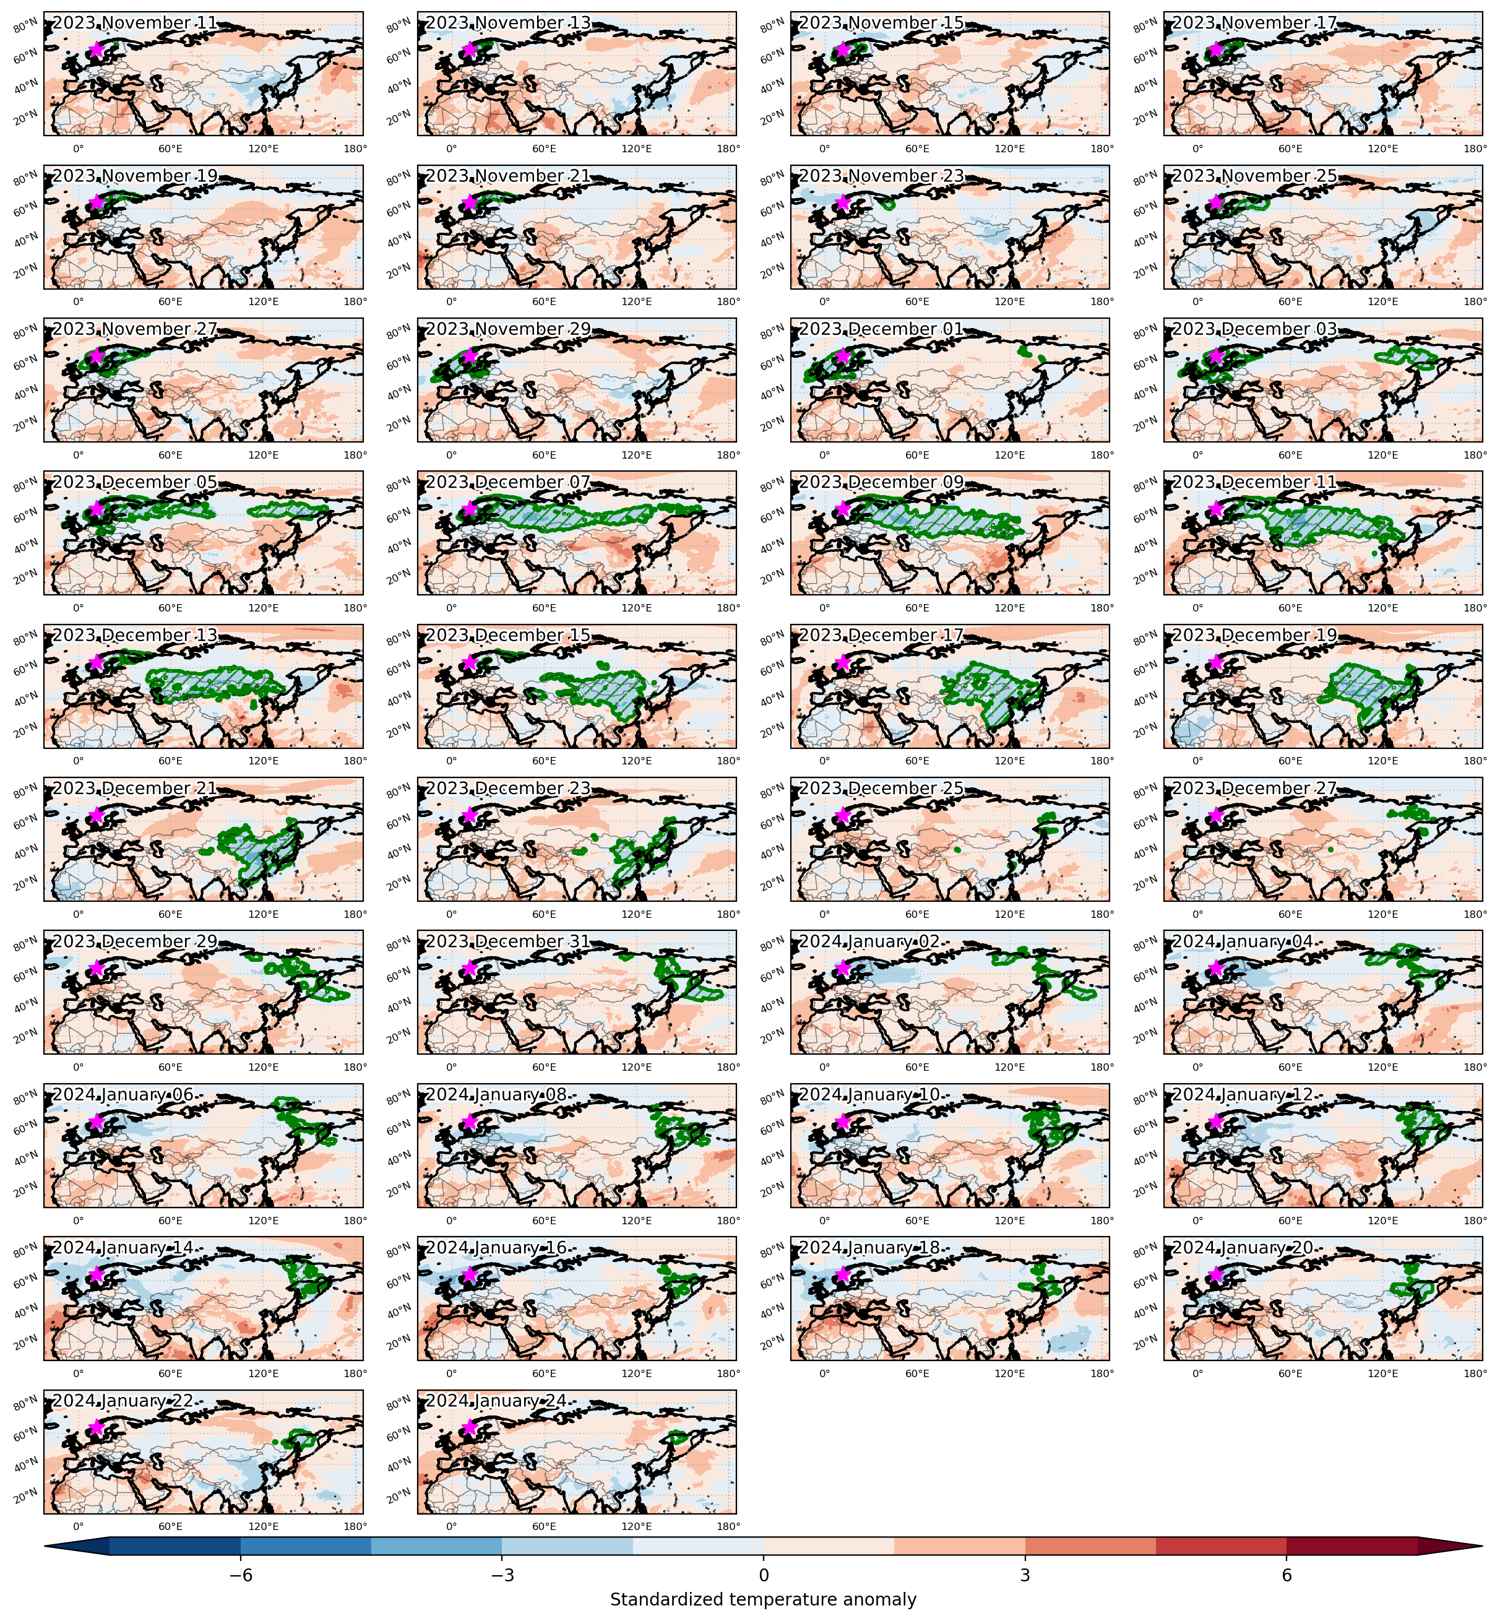
Fig. 3: Maps illustrating the evolution of standardized temperature anomalies during the event.

Event ID: Heat_wave_2025-Feb-27_to_2025-Mar-03_129.0_42.5
Cold spell occuring from February 03 2025 to February 07 2025 at 41.0°N 129.0°E

Download data: JSON

Event type: Cold spell

Countries affected (identified with ArcGIS Online; provided only for geographical reference):

  • China
  • Korea, Democratic People’s Republic of

Duration: 5 days

Time span: February 03 2025 to February 07 2025

Statistics over entire affected area:

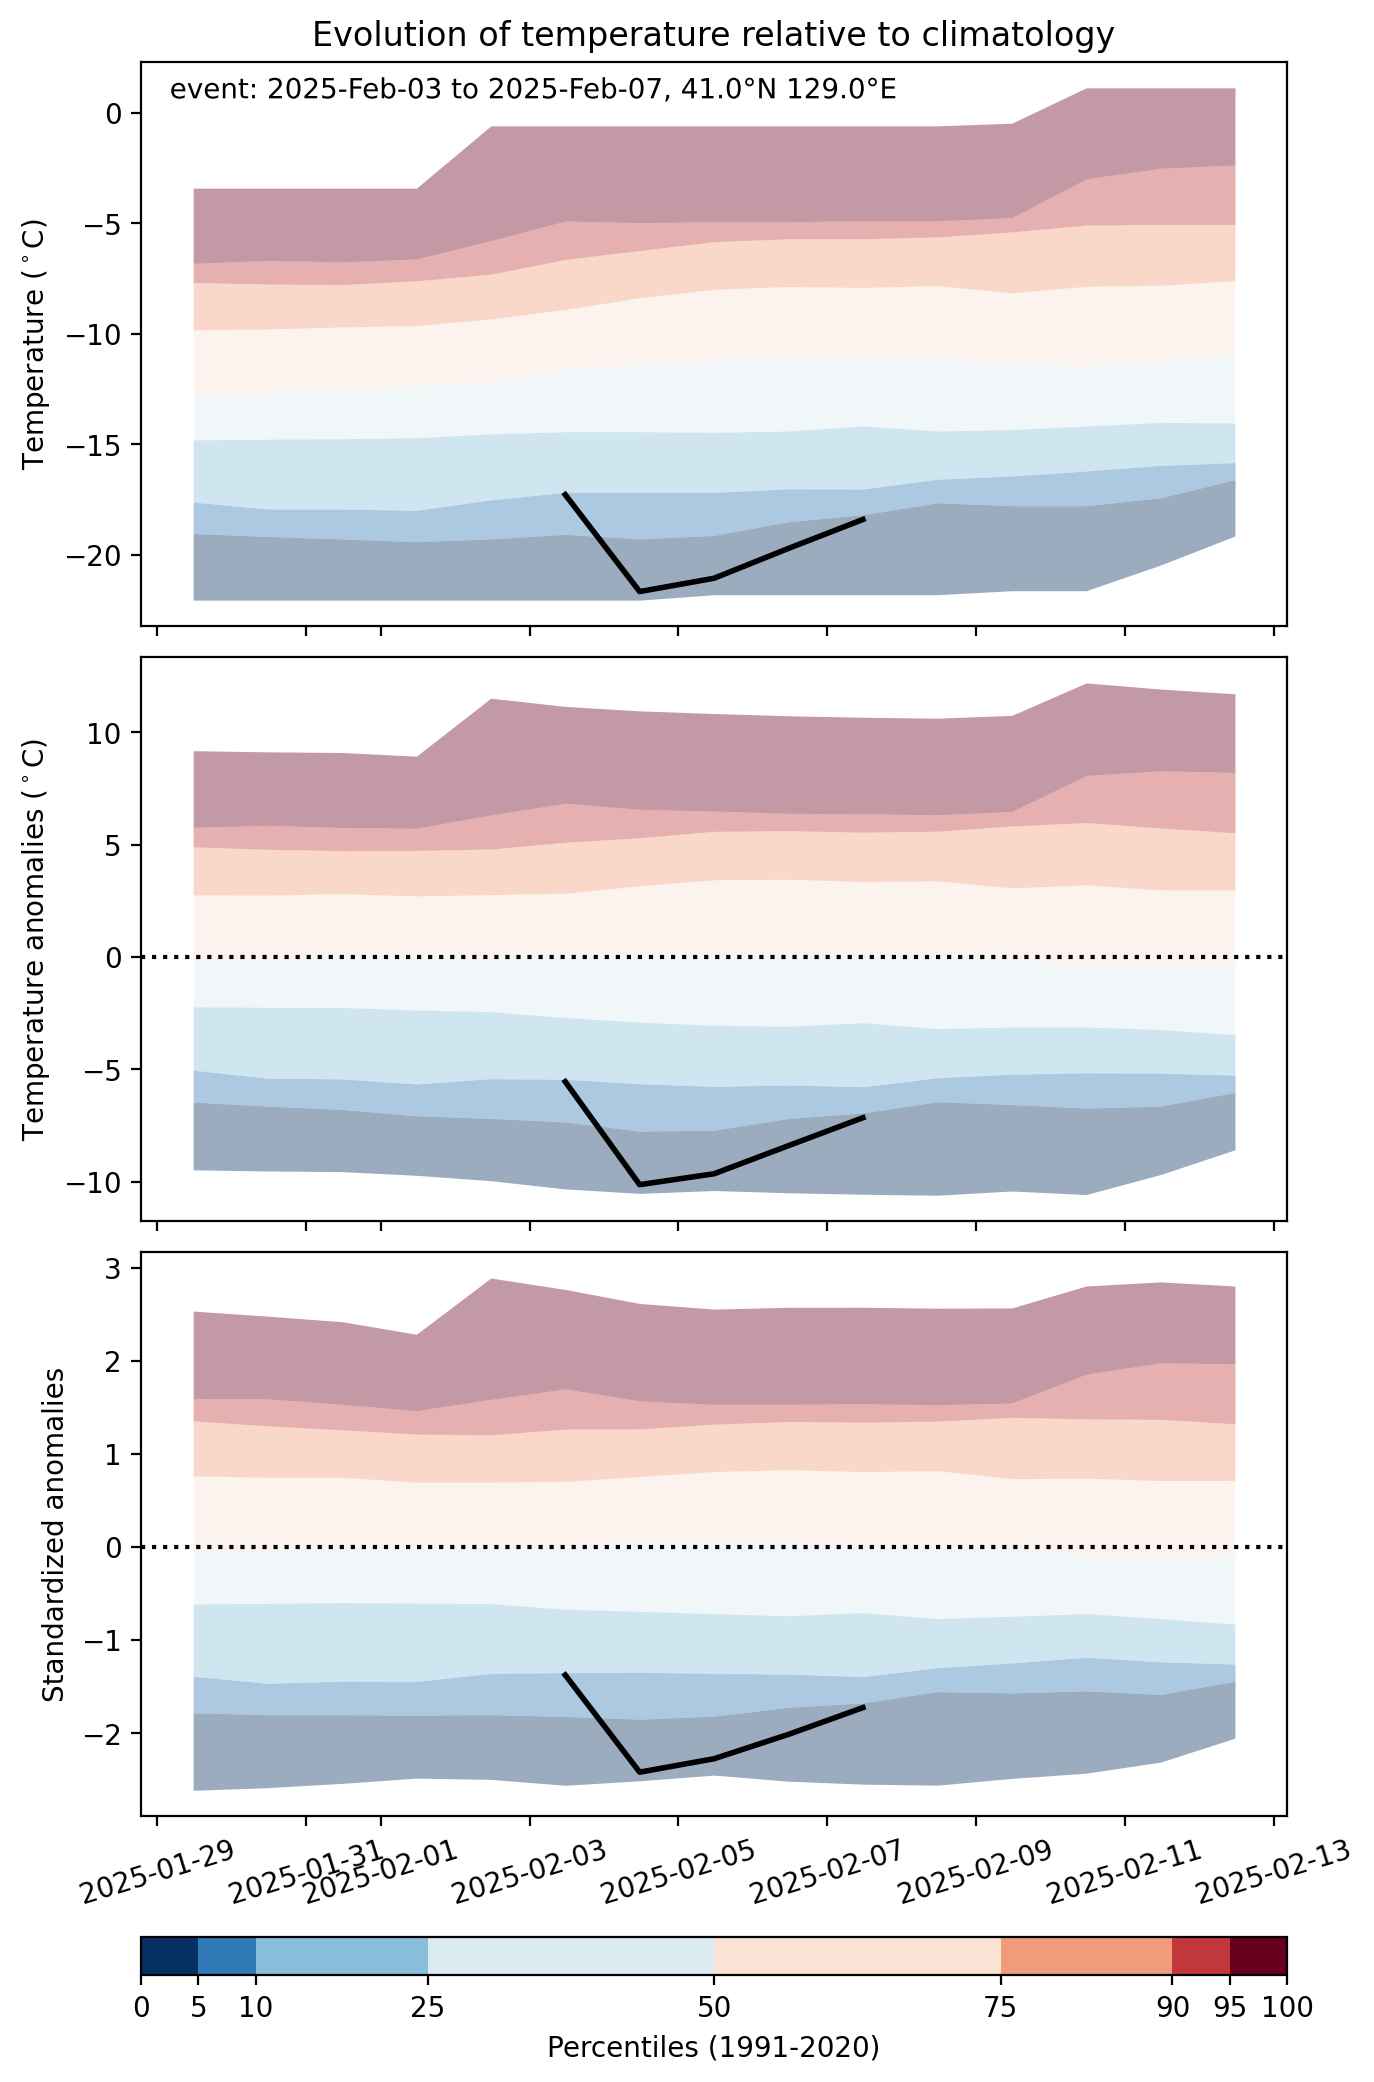
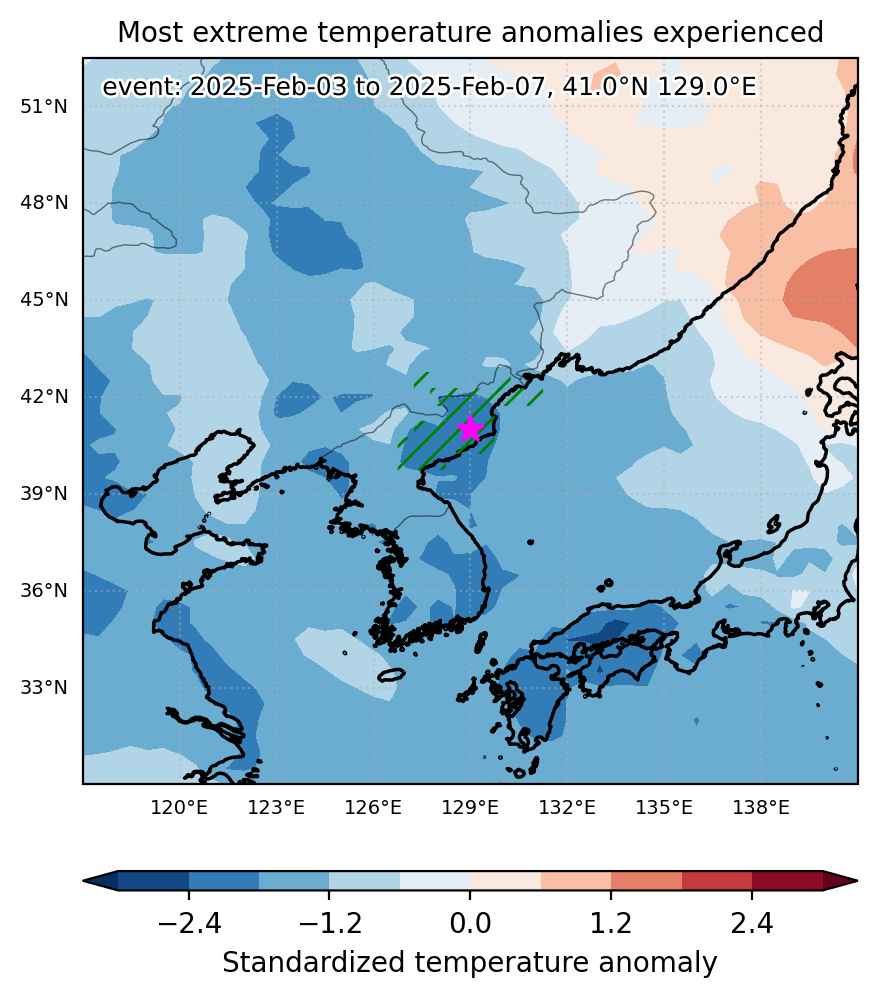
  • Mean temperature anomaly: -7.9 °C
  • Mean temperature: -18.1 °C
  • Minimum temperature anomaly: -11.8 °C
  • Minimum temperature: -27.6 °C

Event center: 41.0°N 129.0°E

Area affected: 60453 km$^2$


Fig. 1: Map of most extreme temperature anomalies (standardized) experienced during the event. The purple star indicates the center of the extreme event. Green hatching illustrates all areas under the effect of extremes at some time during the event.


Fig. 2: Evolution of temperature at the center of the event. The climatological percentile distribution is illustrated with color shadings.


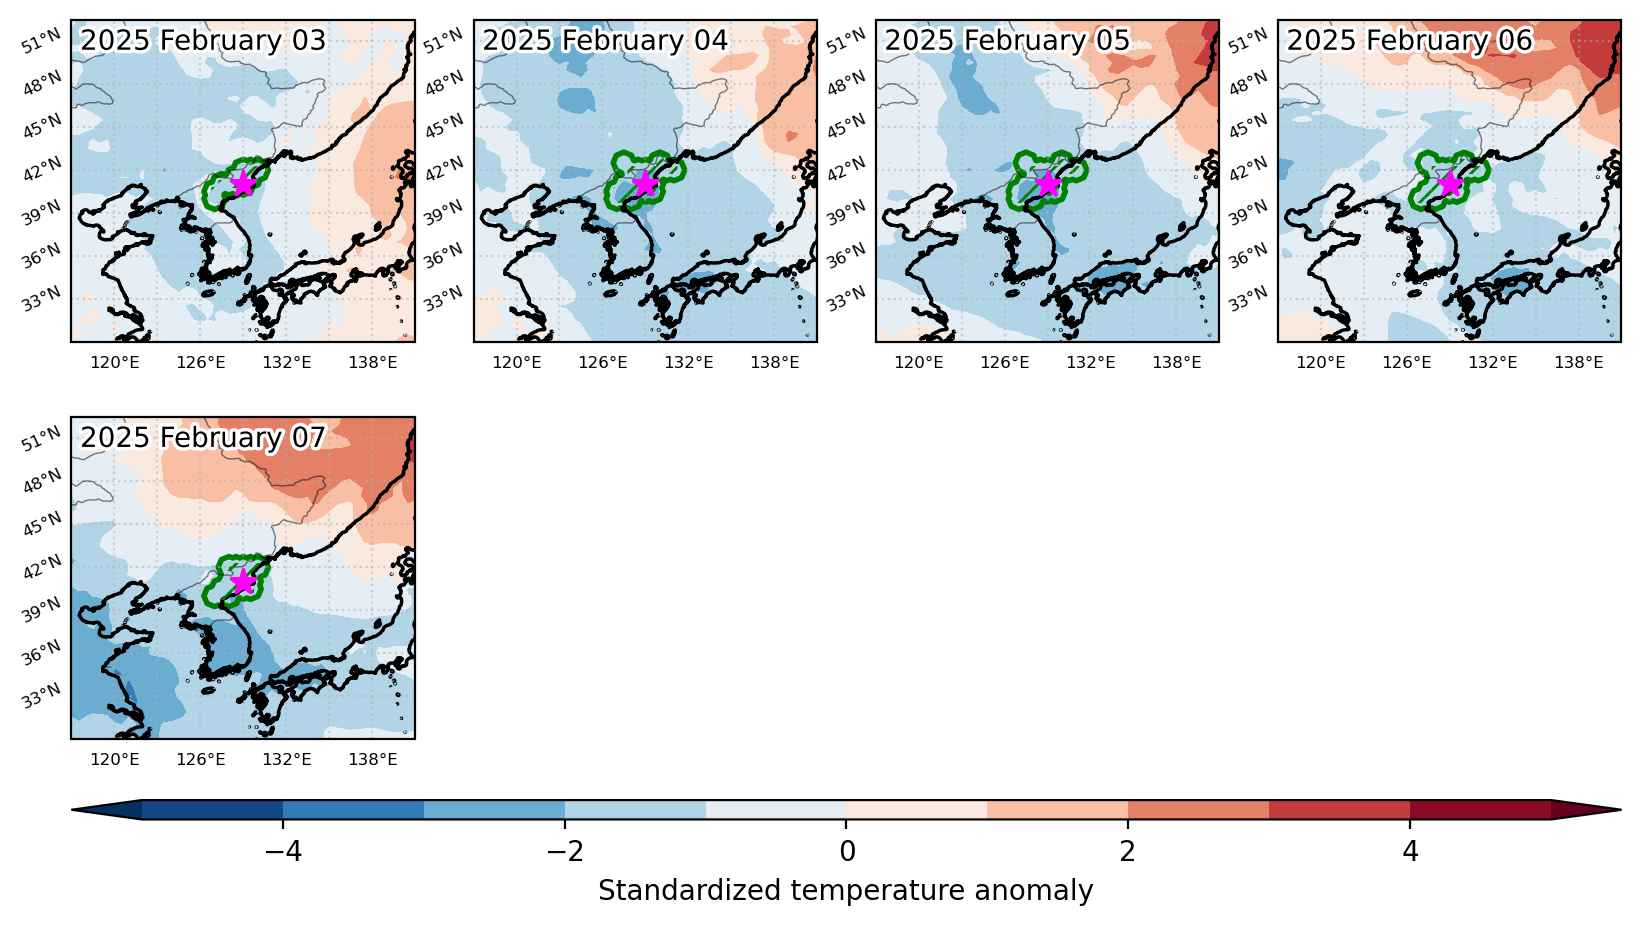
Fig. 3: Maps illustrating the evolution of standardized temperature anomalies during the event.

Event ID: Cold_spell_2025-Feb-03_to_2025-Feb-07_129.0_41.0

Cold spell occuring from January 28 2025 to February 09 2025 at 41.5°N 123.0°E

Download data: JSON

Event type: Cold spell

Countries affected (identified with ArcGIS Online; provided only for geographical reference):

  • China
  • Korea, Democratic People’s Republic of
  • Korea, Republic of

Duration: 13 days

Time span: January 28 2025 to February 09 2025

Statistics over entire affected area:

  • Mean temperature anomaly: -7.2 °C
  • Mean temperature: -15.2 °C
  • Minimum temperature anomaly: -15.0 °C
  • Minimum temperature: -29.9 °C

Event center: 41.5°N 123.0°E

Area affected: 368385 km$^2$


Fig. 1: Map of most extreme temperature anomalies (standardized) experienced during the event. The purple star indicates the center of the extreme event. Green hatching illustrates all areas under the effect of extremes at some time during the event.


Fig. 2: Evolution of temperature at the center of the event. The climatological percentile distribution is illustrated with color shadings.


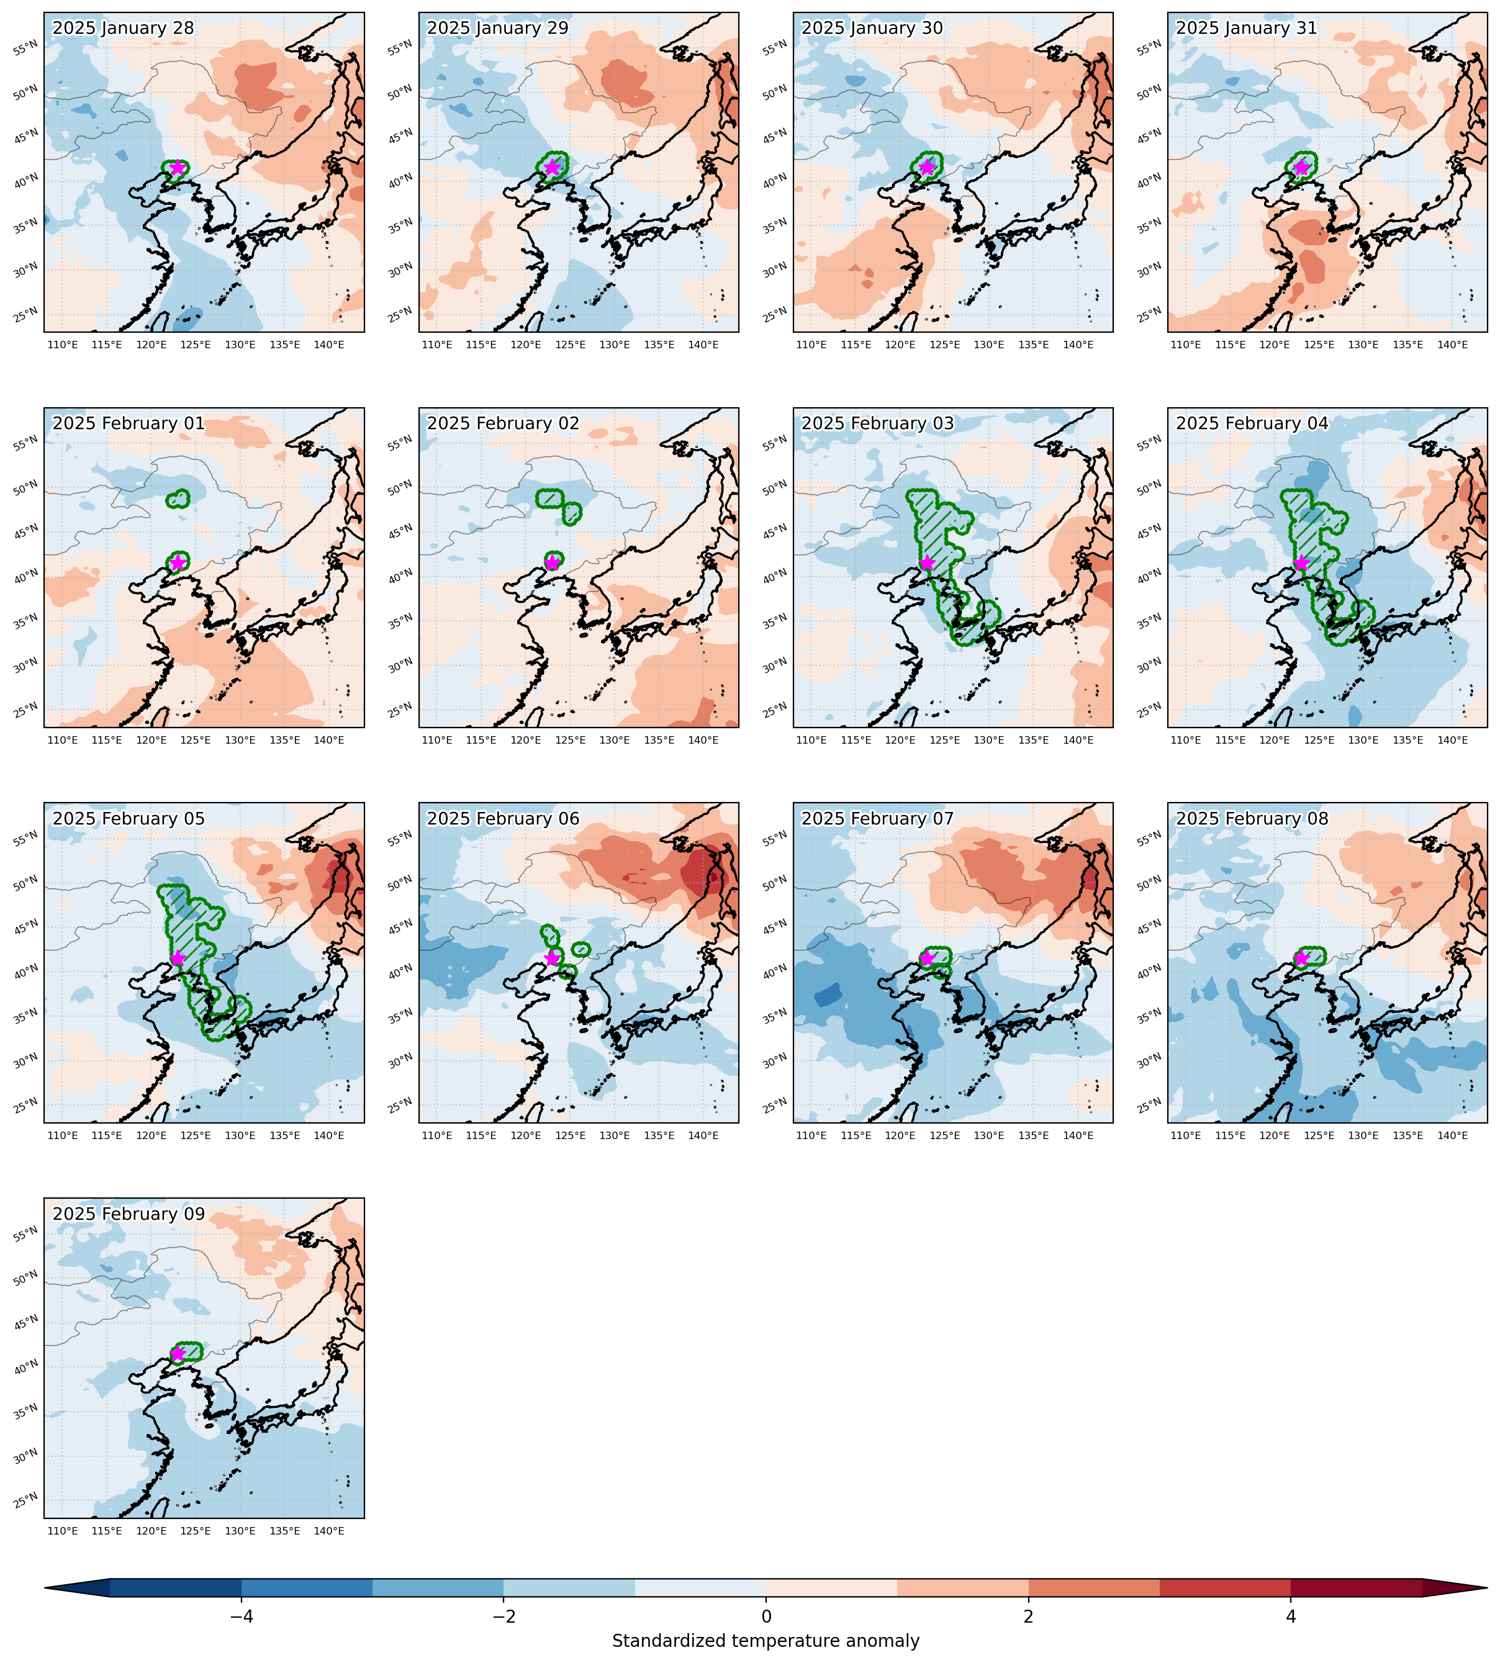
Fig. 3: Maps illustrating the evolution of standardized temperature anomalies during the event.

Event ID: Cold_spell_2025-Jan-28_to_2025-Feb-09_123.0_41.5

Heat wave occuring from June 27 2024 to June 29 2024 at 41.0°N 129.5°E

Download data: JSON

Event type: Heat wave

Countries affected (identified with ArcGIS Online; provided only for geographical reference):

  • China
  • Korea, Democratic People’s Republic of

Duration: 3 days

Time span: June 27 2024 to June 29 2024

Statistics over entire affected area:

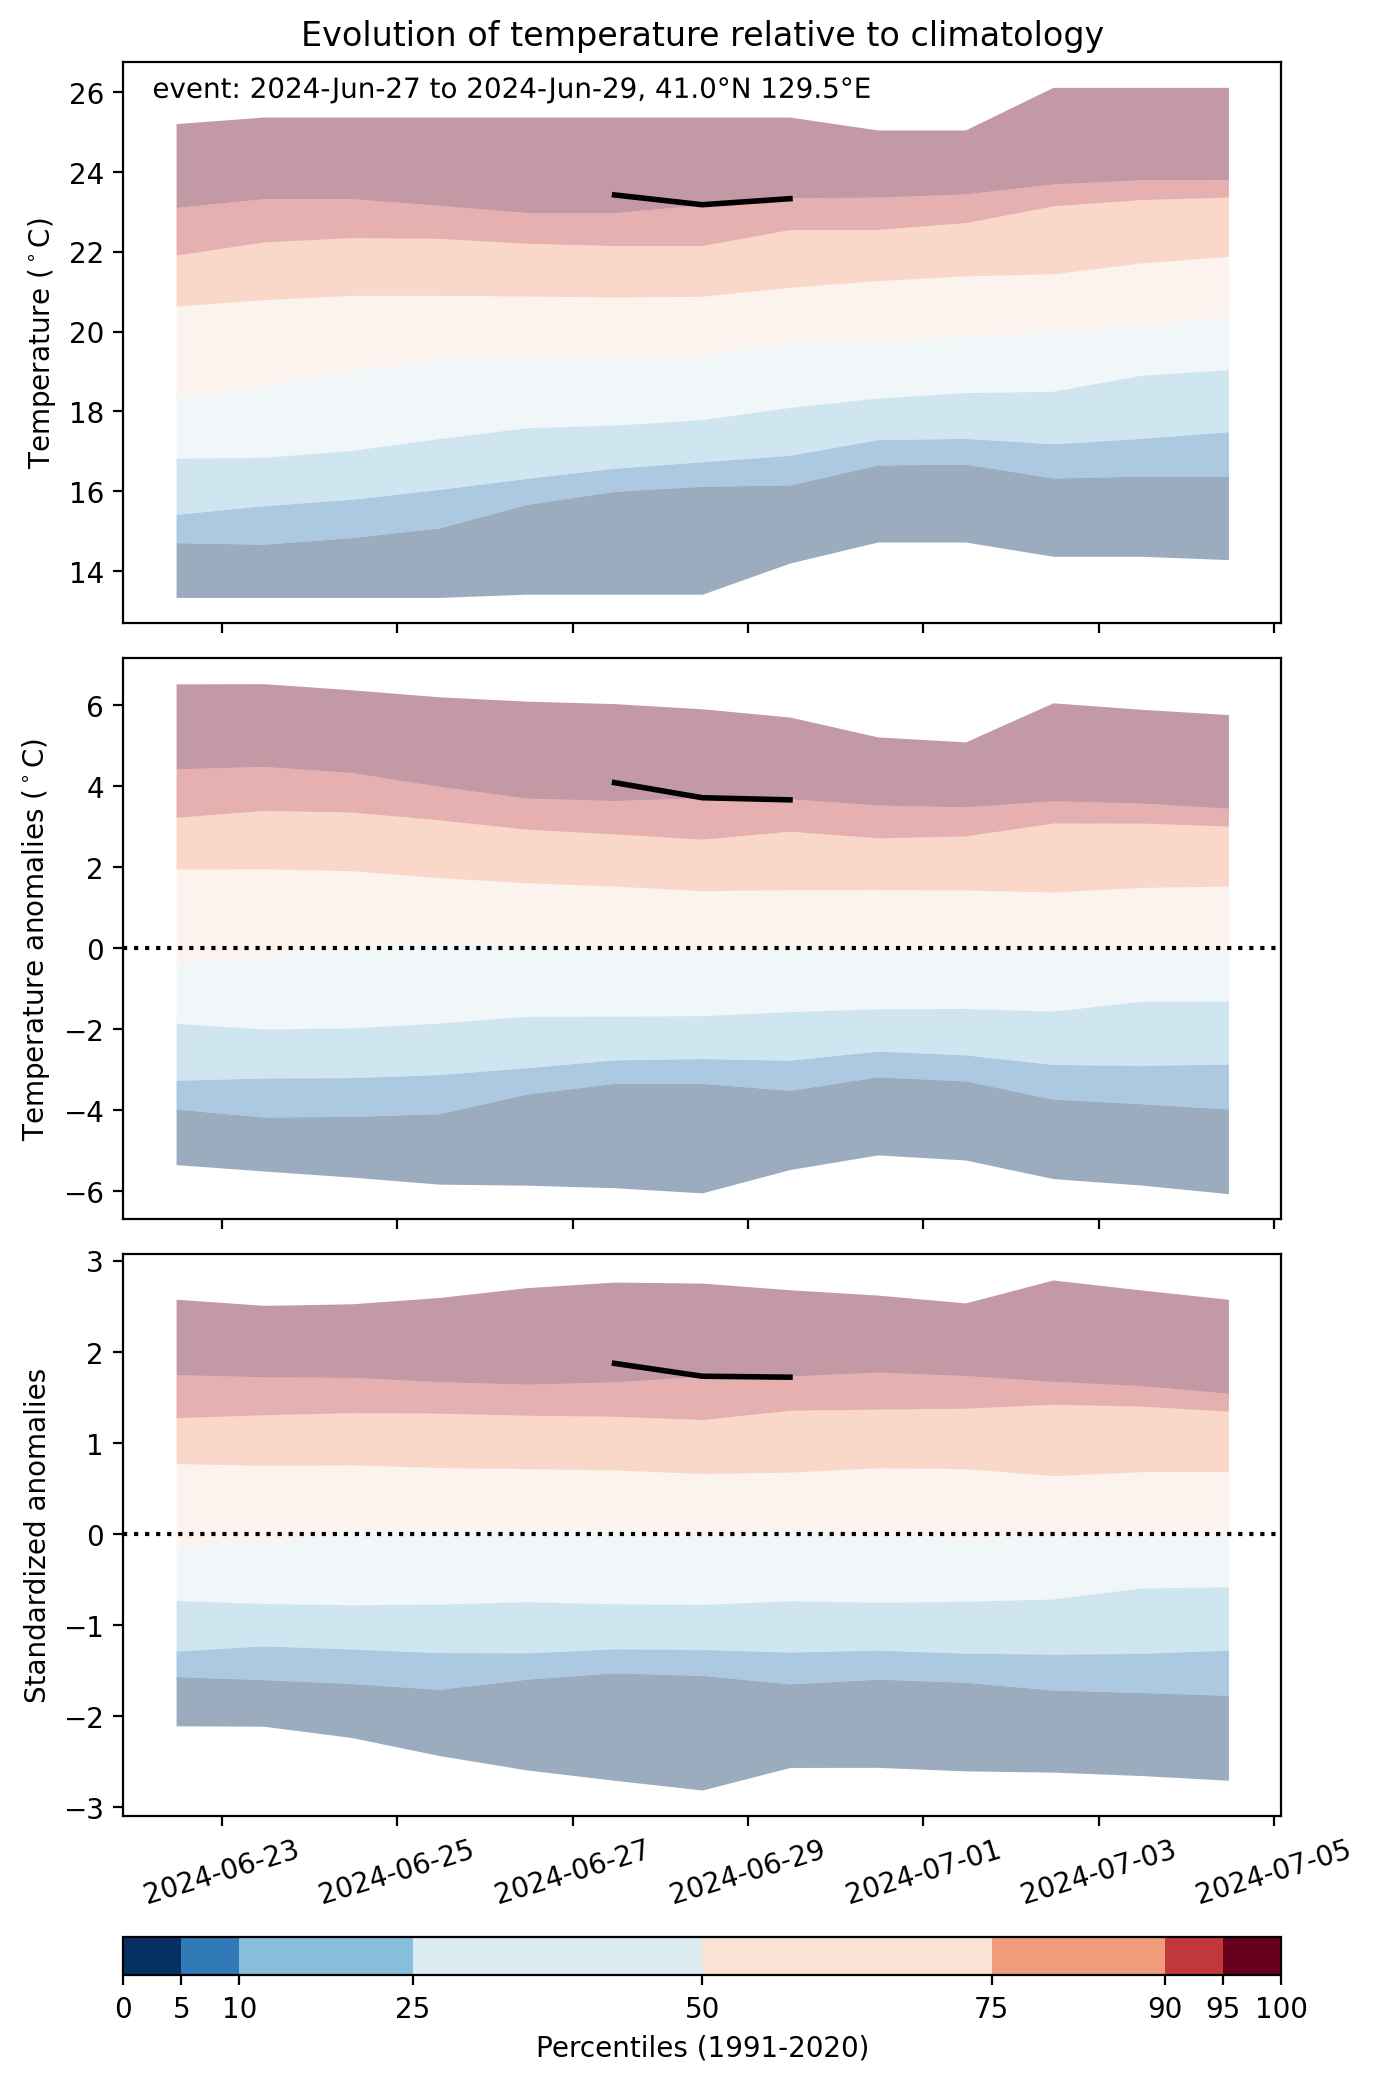
  • Mean temperature anomaly: 3.7 °C
  • Mean temperature: 22.8 °C
  • Maximum temperature anomaly: 5.1 °C
  • Maximum temperature: 26.1 °C

Event center: 41.0°N 129.5°E

Area affected: 67238 km$^2$


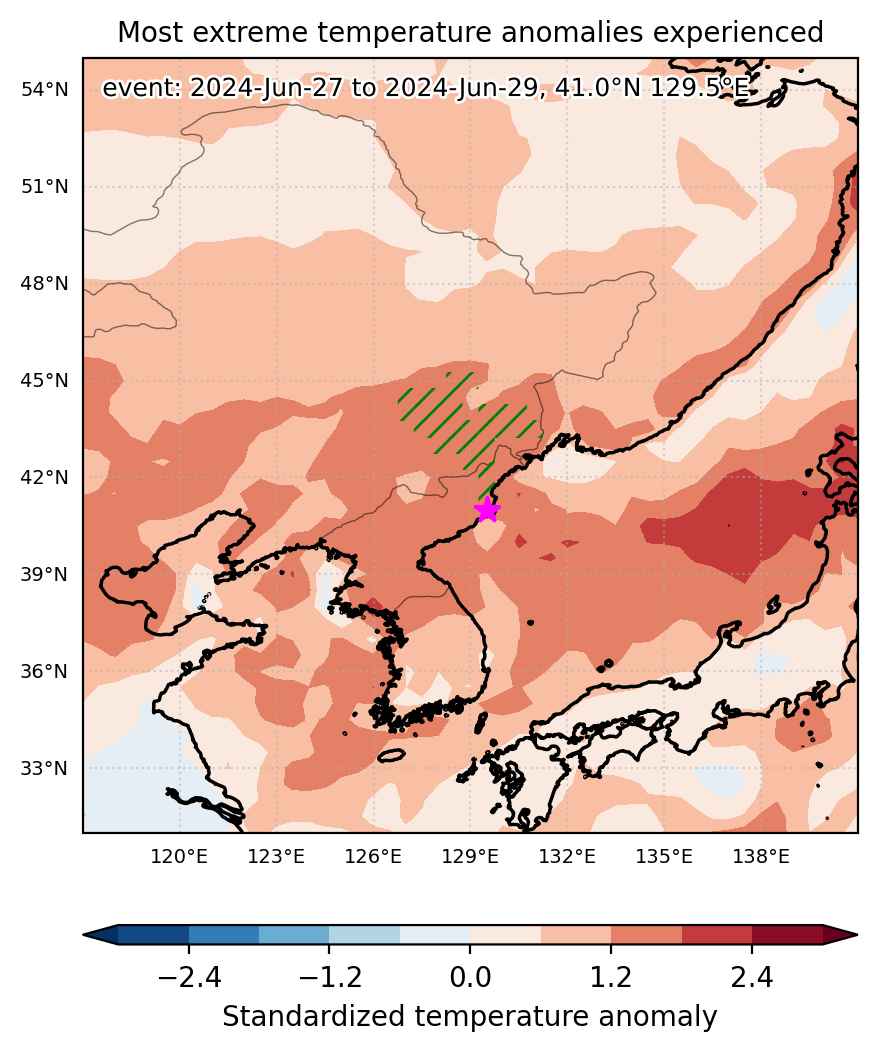
Fig. 1: Map of most extreme temperature anomalies (standardized) experienced during the event. The purple star indicates the center of the extreme event. Green hatching illustrates all areas under the effect of extremes at some time during the event.


Fig. 2: Evolution of temperature at the center of the event. The climatological percentile distribution is illustrated with color shadings.


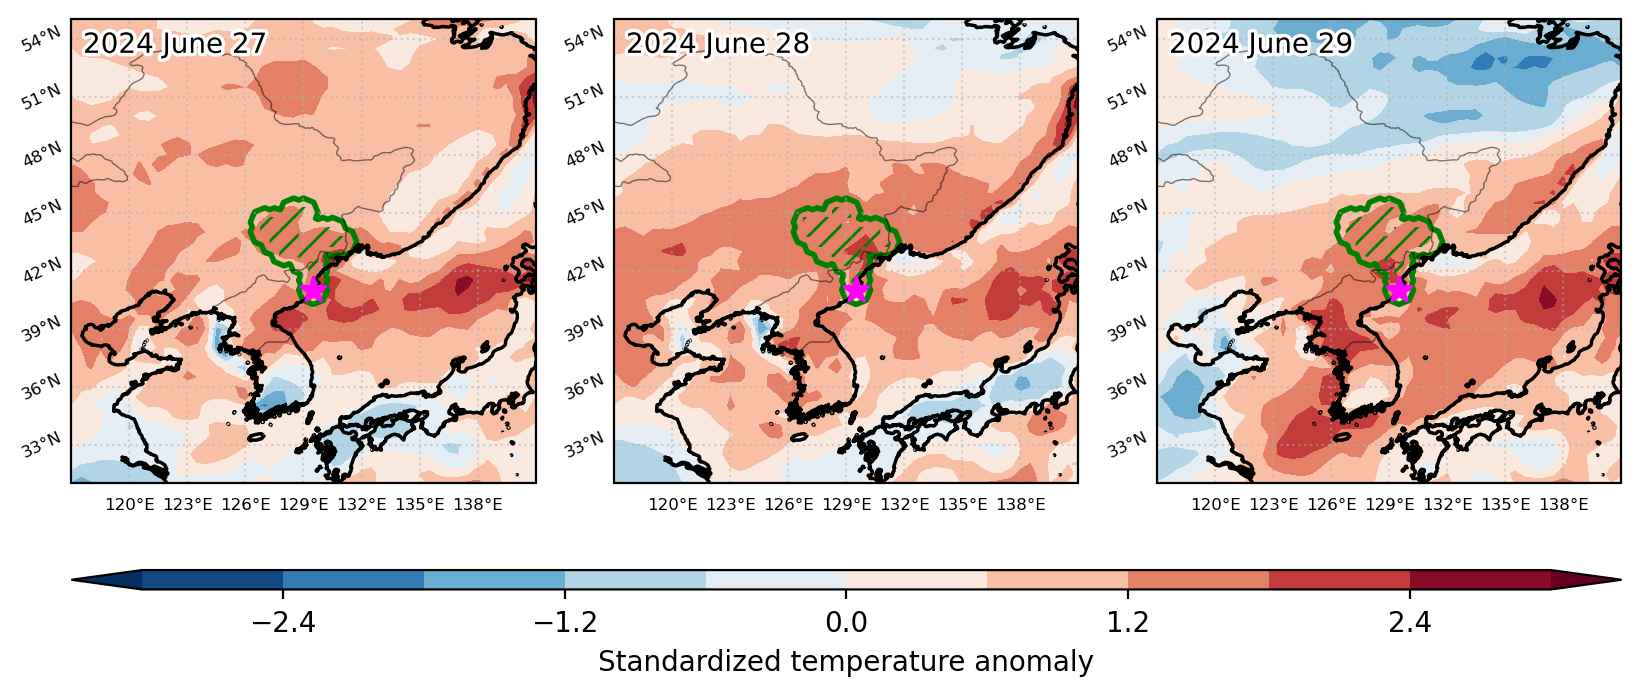
Fig. 3: Maps illustrating the evolution of standardized temperature anomalies during the event.

Event ID: Heat_wave_2024-Jun-27_to_2024-Jun-29_129.5_41.0

Heat wave occuring from April 01 2024 to April 04 2024 at 39.5°N 125.0°E

Download data: JSON

Event type: Heat wave

Countries affected (identified with ArcGIS Online; provided only for geographical reference):

  • China
  • Korea, Democratic People’s Republic of
  • Korea, Republic of

Duration: 4 days

Time span: April 01 2024 to April 04 2024

Statistics over entire affected area:

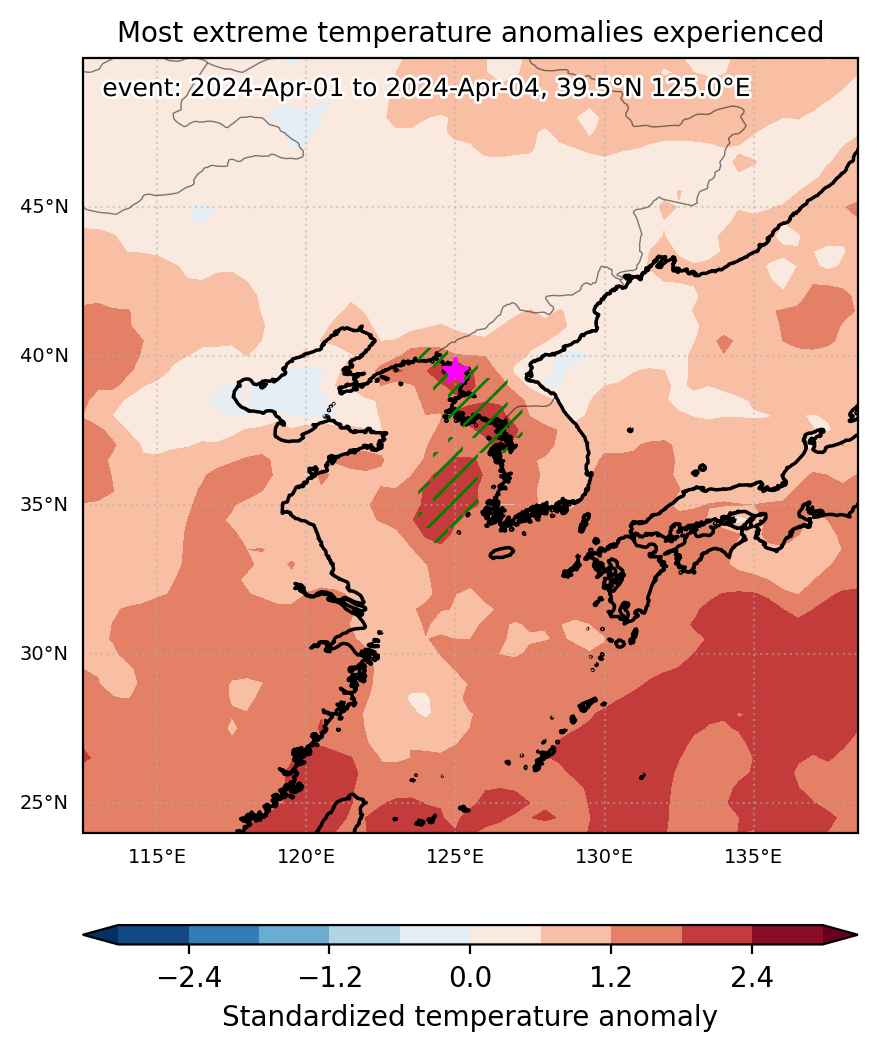
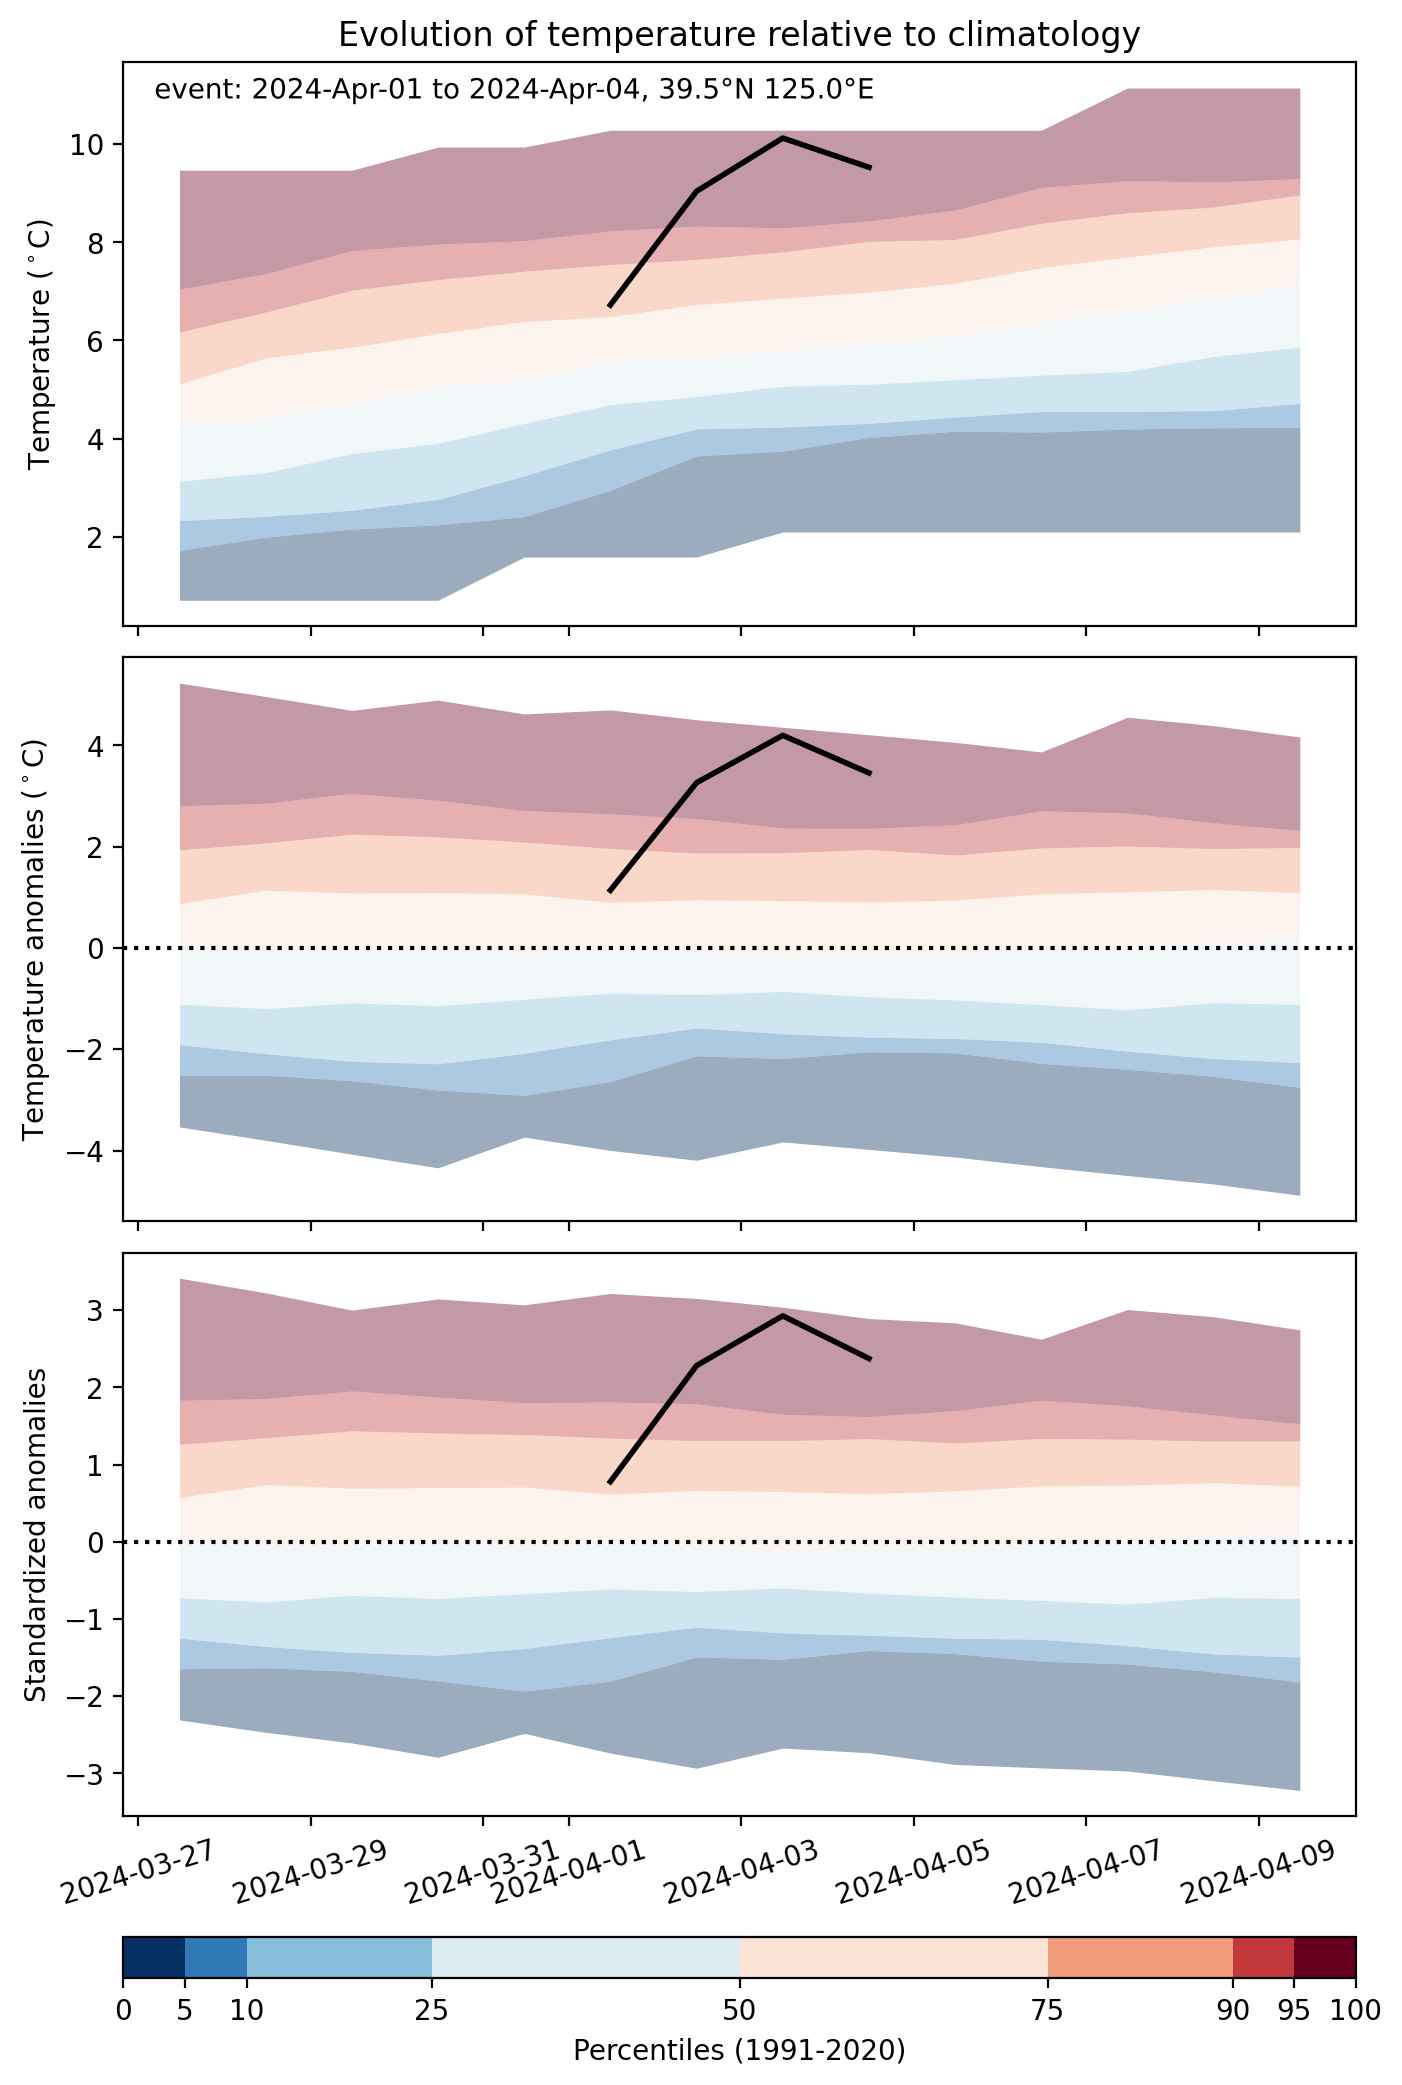
  • Mean temperature anomaly: 3.4 °C
  • Mean temperature: 11.3 °C
  • Maximum temperature anomaly: 6.8 °C
  • Maximum temperature: 15.9 °C

Event center: 39.5°N 125.0°E

Area affected: 105796 km$^2$


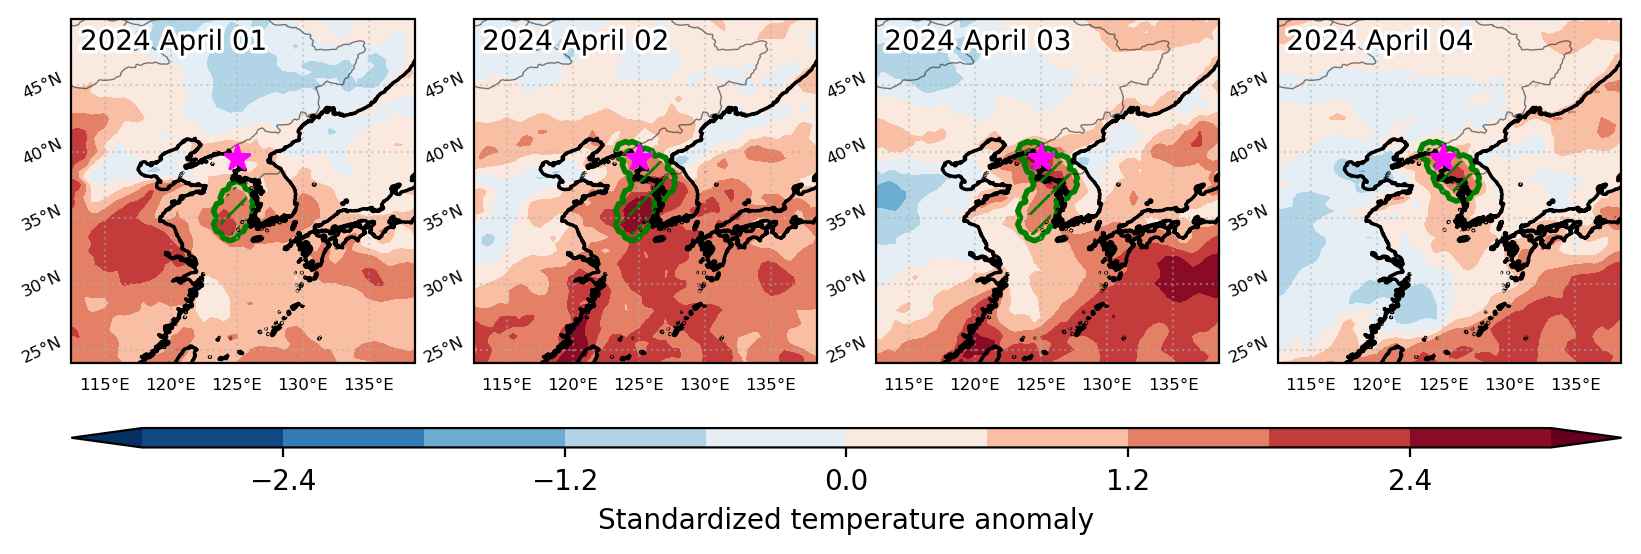
Fig. 1: Map of most extreme temperature anomalies (standardized) experienced during the event. The purple star indicates the center of the extreme event. Green hatching illustrates all areas under the effect of extremes at some time during the event.


Fig. 2: Evolution of temperature at the center of the event. The climatological percentile distribution is illustrated with color shadings.


Fig. 3: Maps illustrating the evolution of standardized temperature anomalies during the event.

Event ID: Heat_wave_2024-Apr-01_to_2024-Apr-04_125.0_39.5

Heat wave occuring from February 16 2024 to February 18 2024 at 43.5°N 128.5°E

Download data: JSON

Event type: Heat wave

Countries affected (identified with ArcGIS Online; provided only for geographical reference):

  • China
  • Korea, Democratic People’s Republic of

Duration: 3 days

Time span: February 16 2024 to February 18 2024

Statistics over entire affected area:

  • Mean temperature anomaly: 9.3 °C
  • Mean temperature: 1.2 °C
  • Maximum temperature anomaly: 15.3 °C
  • Maximum temperature: 6.8 °C

Event center: 43.5°N 128.5°E

Area affected: 215684 km$^2$


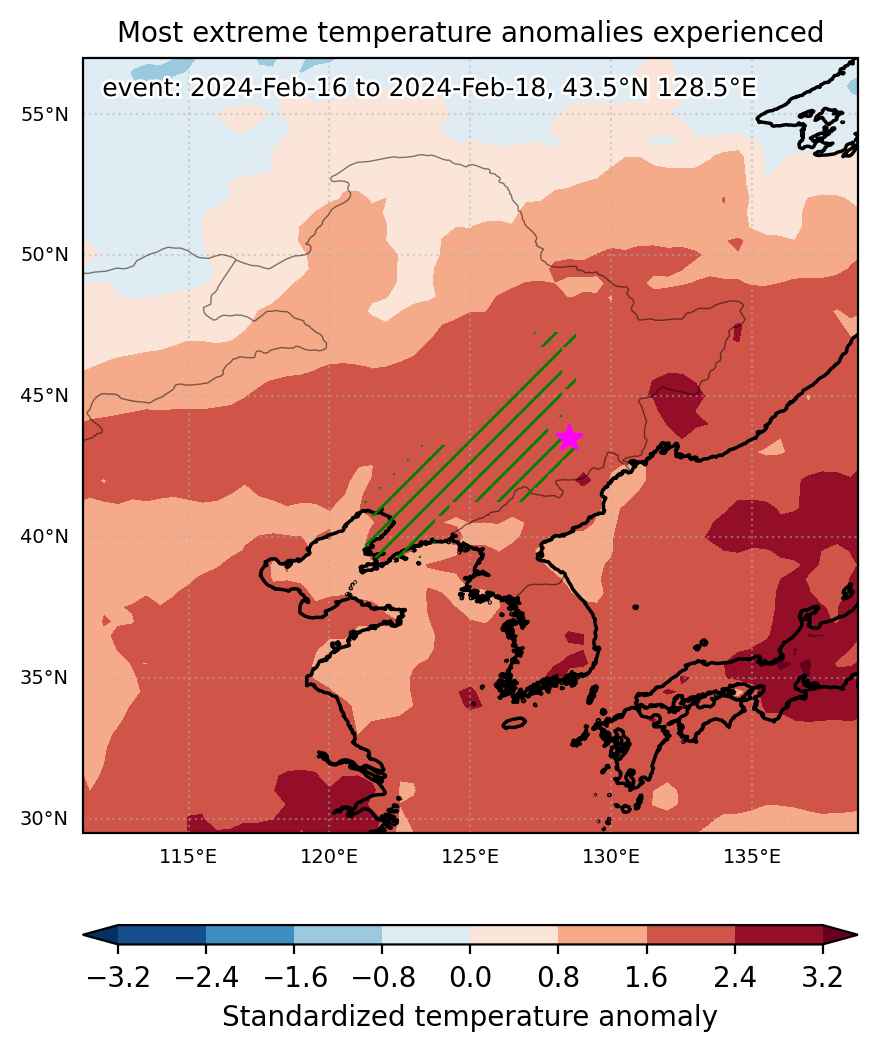
Fig. 1: Map of most extreme temperature anomalies (standardized) experienced during the event. The purple star indicates the center of the extreme event. Green hatching illustrates all areas under the effect of extremes at some time during the event.


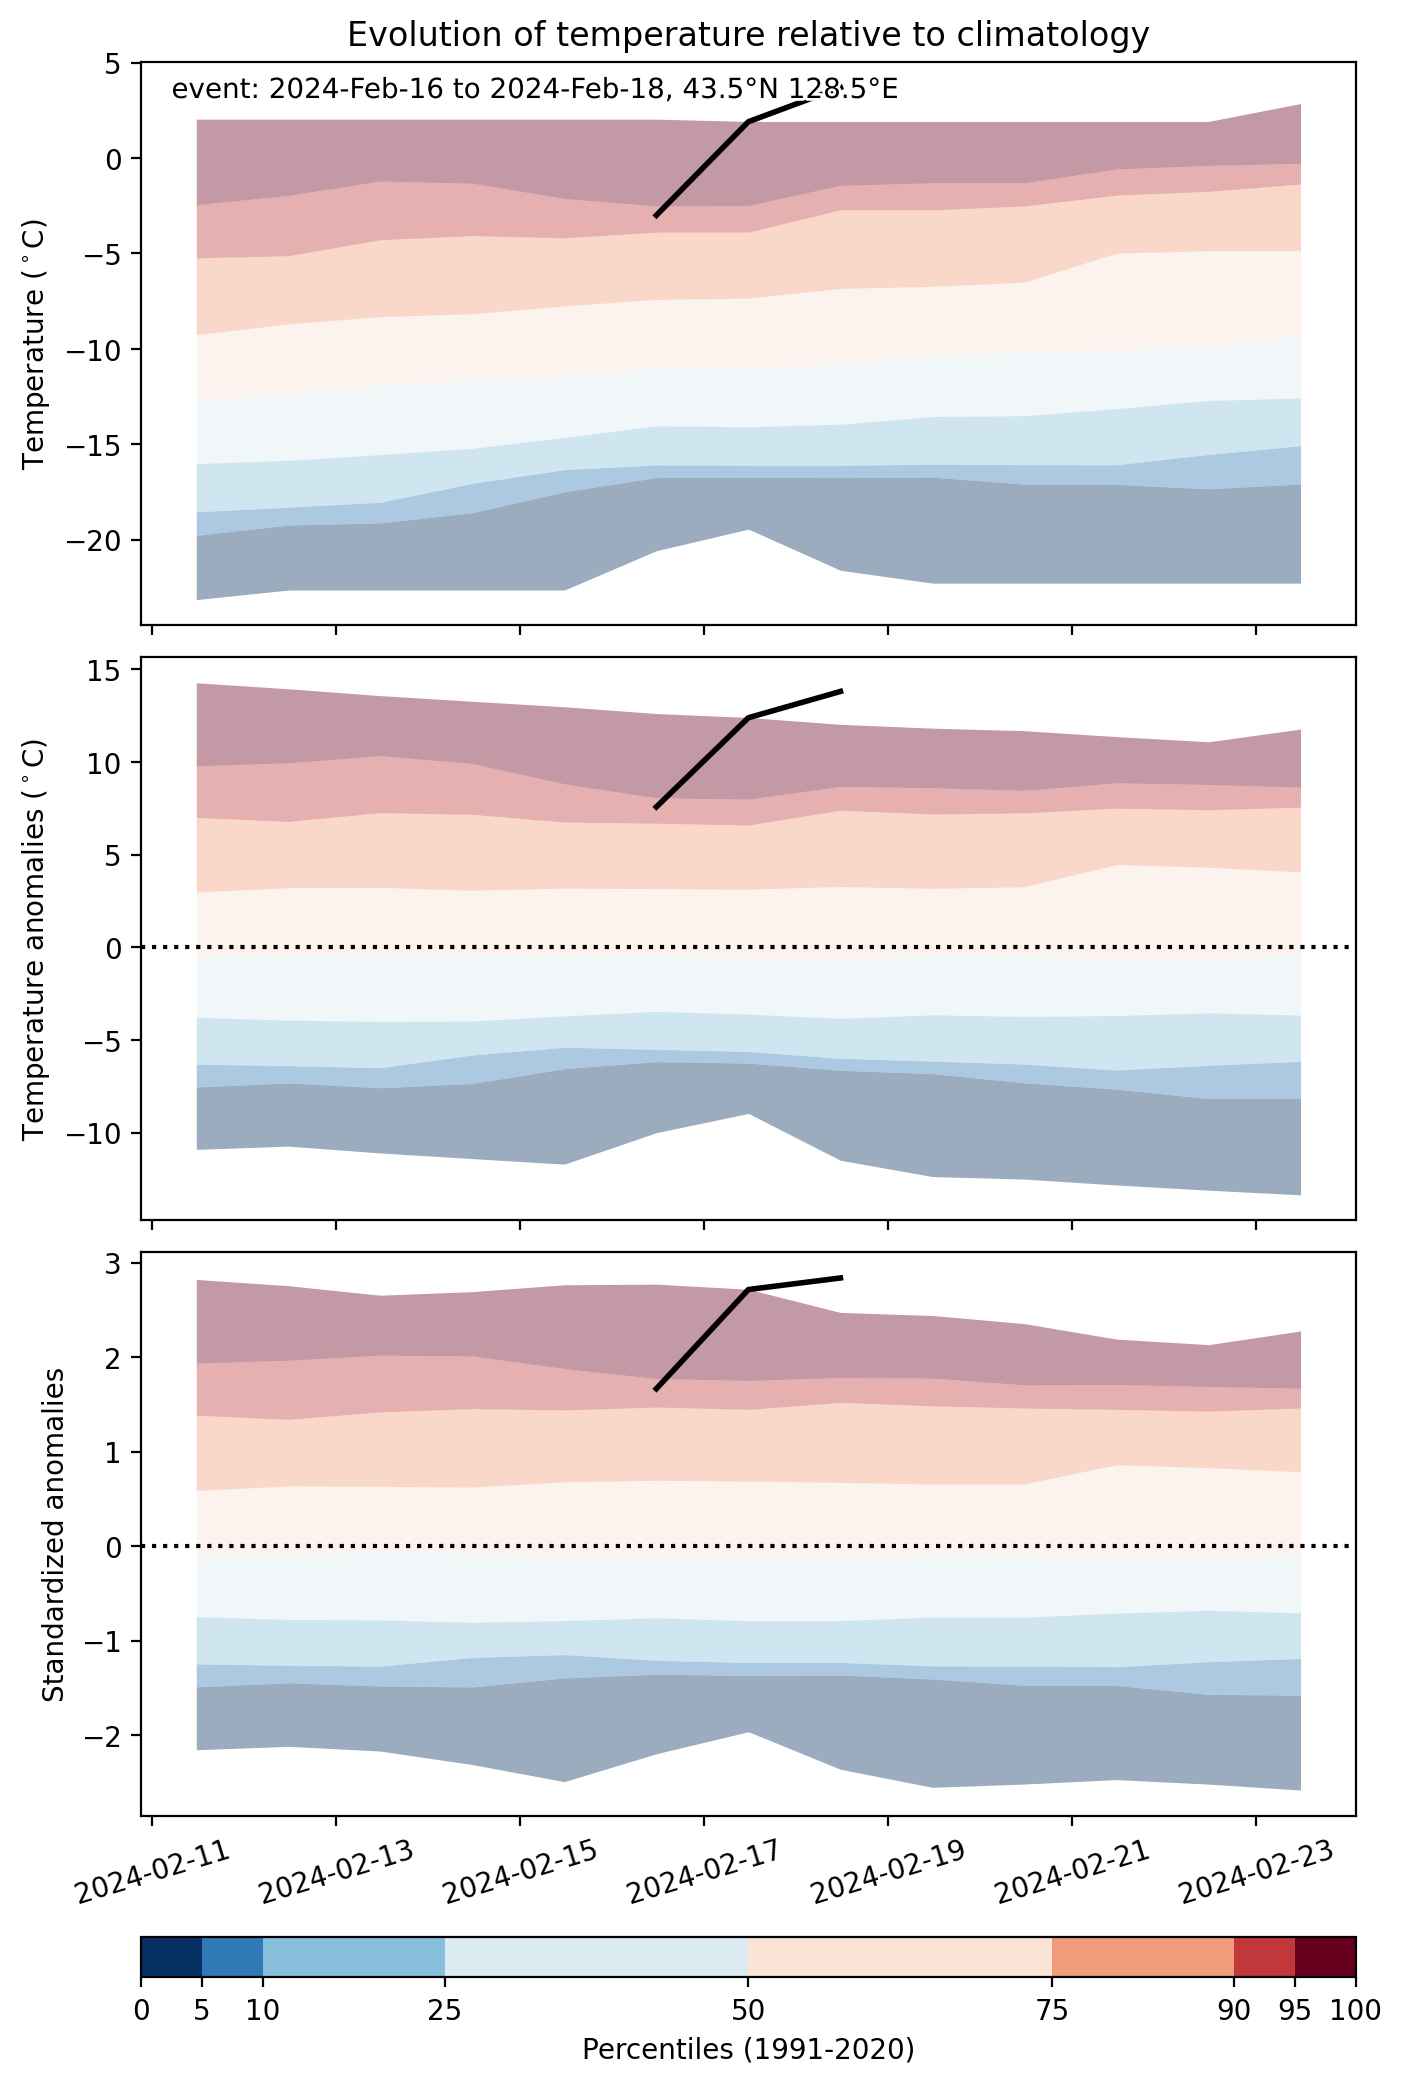
Fig. 2: Evolution of temperature at the center of the event. The climatological percentile distribution is illustrated with color shadings.


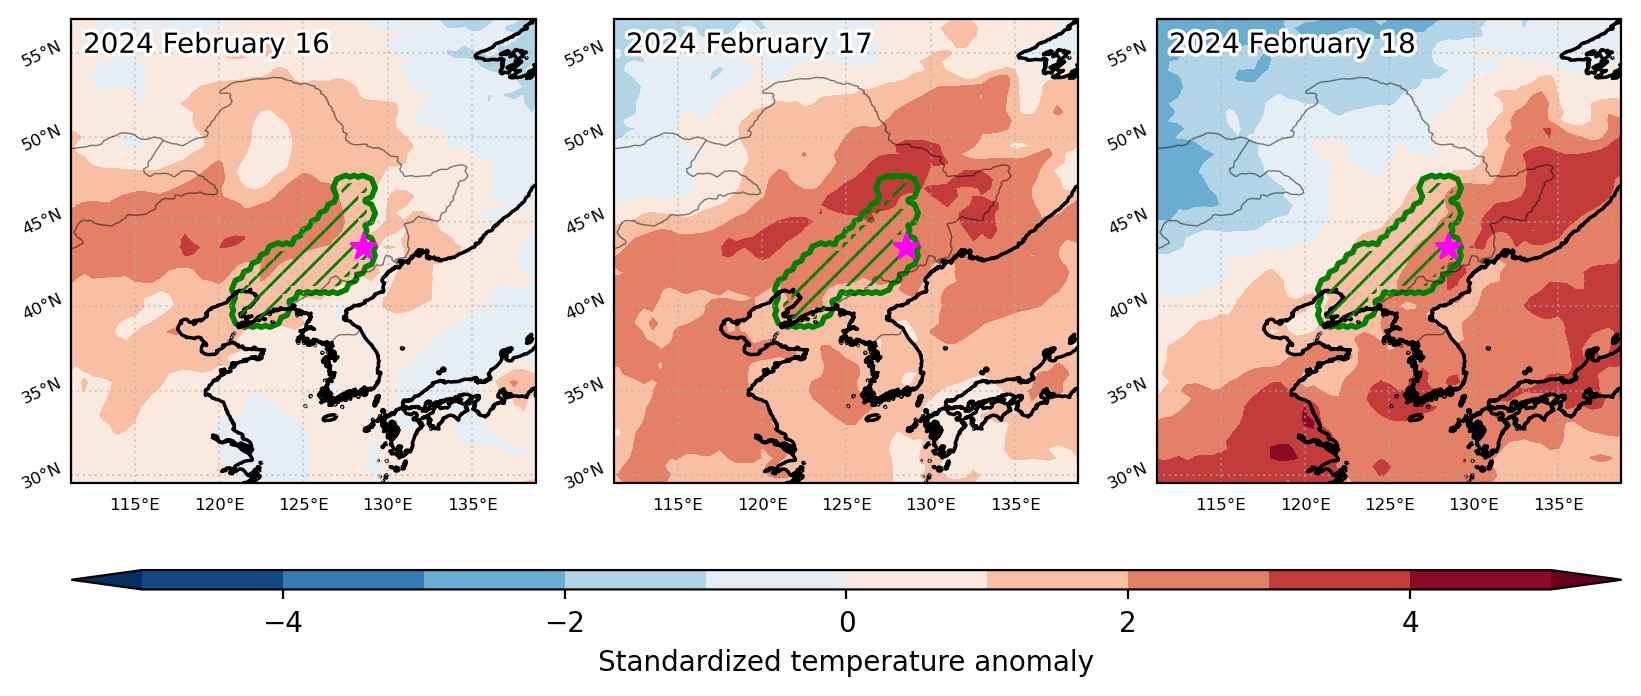
Fig. 3: Maps illustrating the evolution of standardized temperature anomalies during the event.

Event ID: Heat_wave_2024-Feb-16_to_2024-Feb-18_128.5_43.5

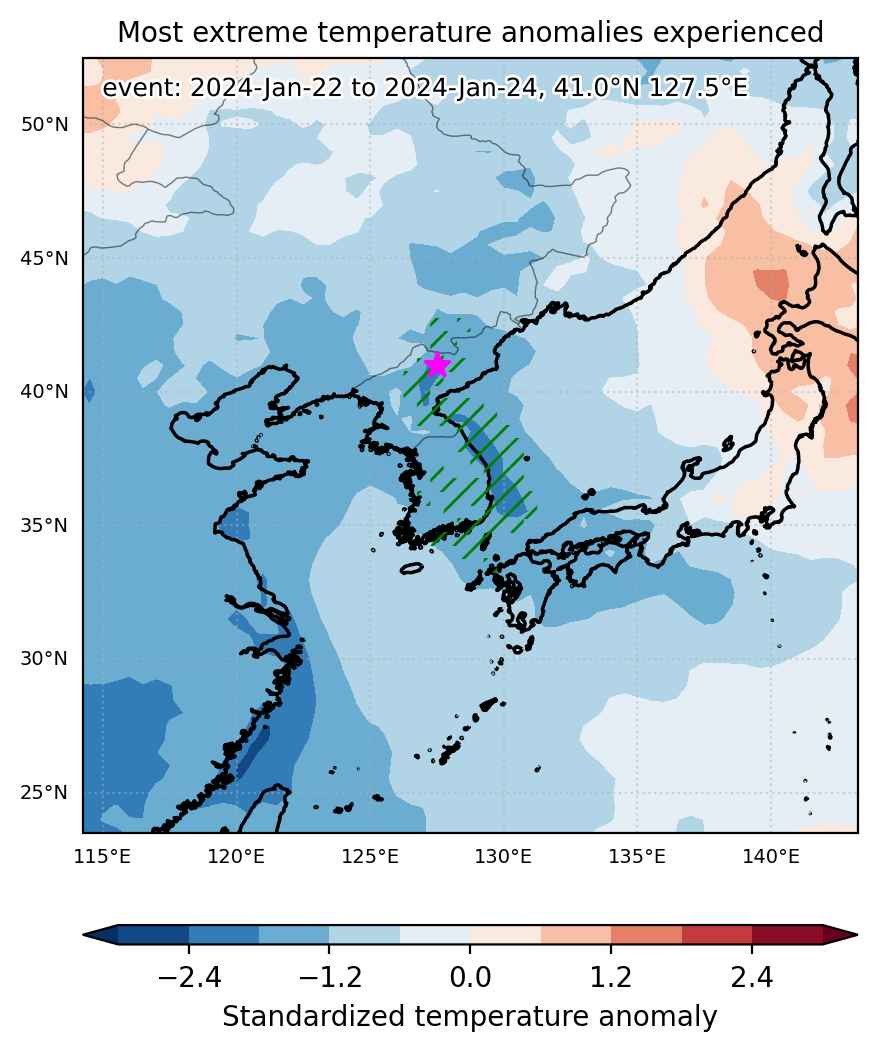
Cold spell occuring from January 22 2024 to January 24 2024 at 41.0°N 127.5°E

Download data: JSON

Event type: Cold spell

Countries affected (identified with ArcGIS Online; provided only for geographical reference):

  • China
  • Korea, Democratic People’s Republic of
  • Korea, Republic of

Duration: 3 days

Time span: January 22 2024 to January 24 2024

Statistics over entire affected area:

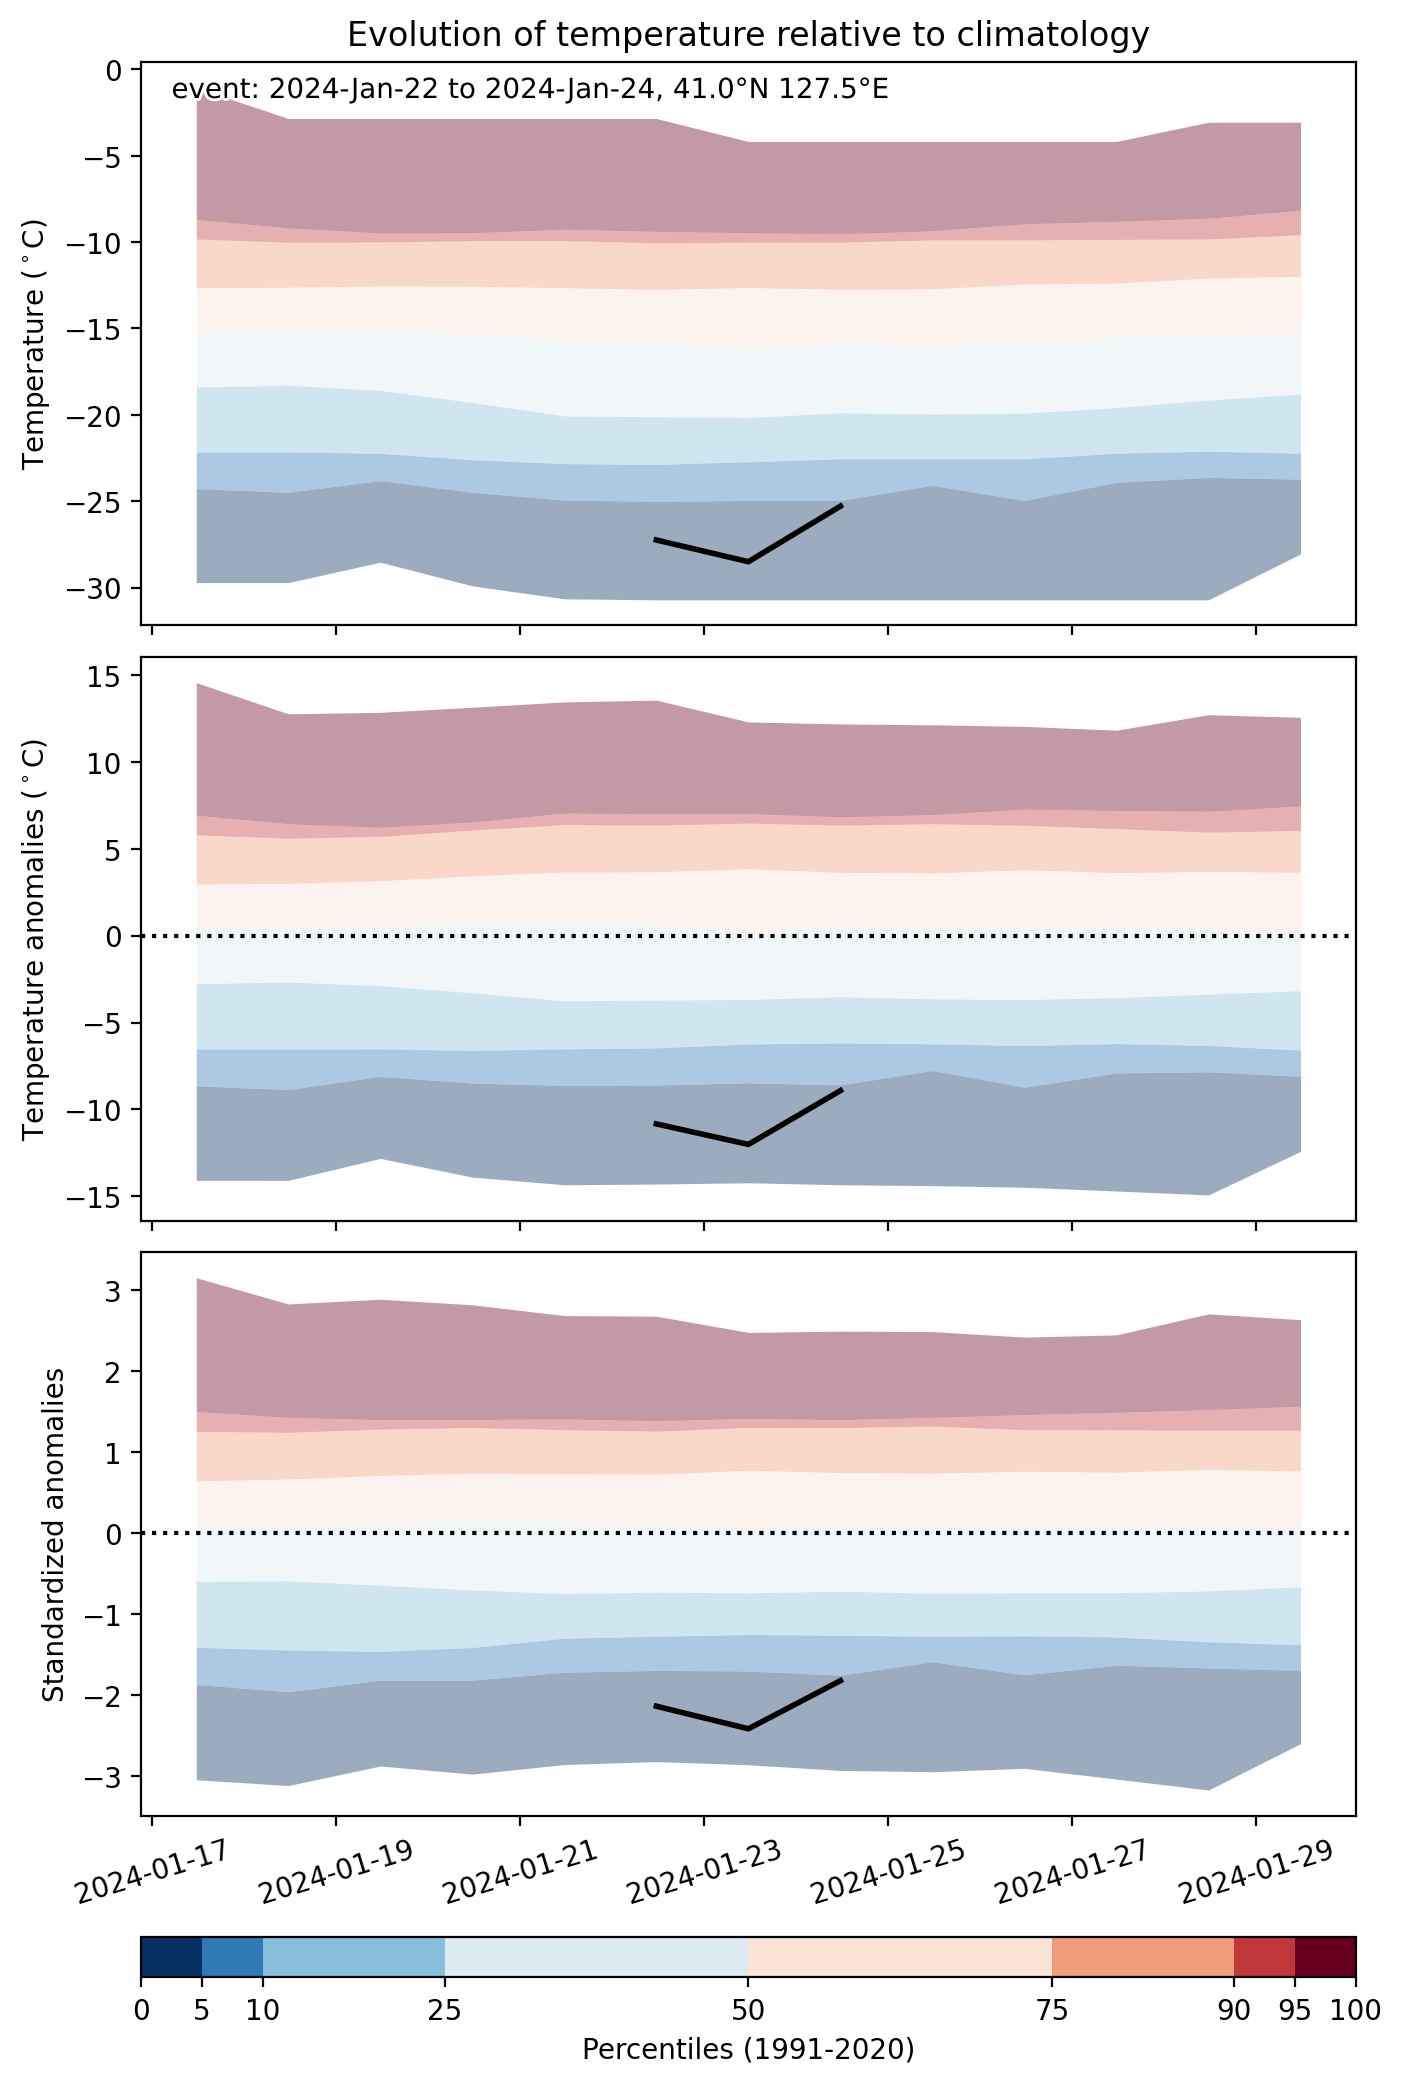
  • Mean temperature anomaly: -6.4 °C
  • Mean temperature: -7.6 °C
  • Minimum temperature anomaly: -12.0 °C
  • Minimum temperature: -28.5 °C

Event center: 41.0°N 127.5°E

Area affected: 183546 km$^2$


Fig. 1: Map of most extreme temperature anomalies (standardized) experienced during the event. The purple star indicates the center of the extreme event. Green hatching illustrates all areas under the effect of extremes at some time during the event.


Fig. 2: Evolution of temperature at the center of the event. The climatological percentile distribution is illustrated with color shadings.


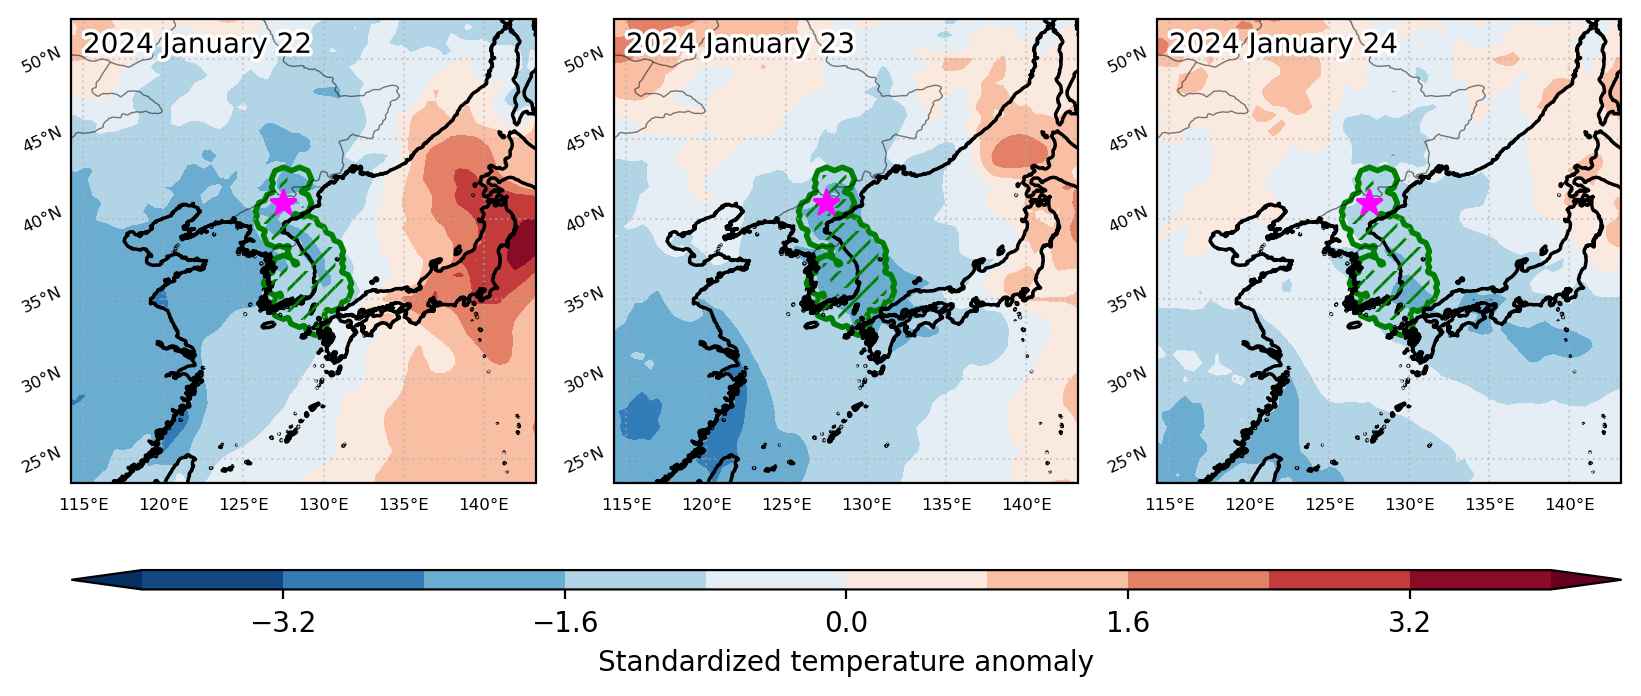
Fig. 3: Maps illustrating the evolution of standardized temperature anomalies during the event.

Event ID: Cold_spell_2024-Jan-22_to_2024-Jan-24_127.5_41.0

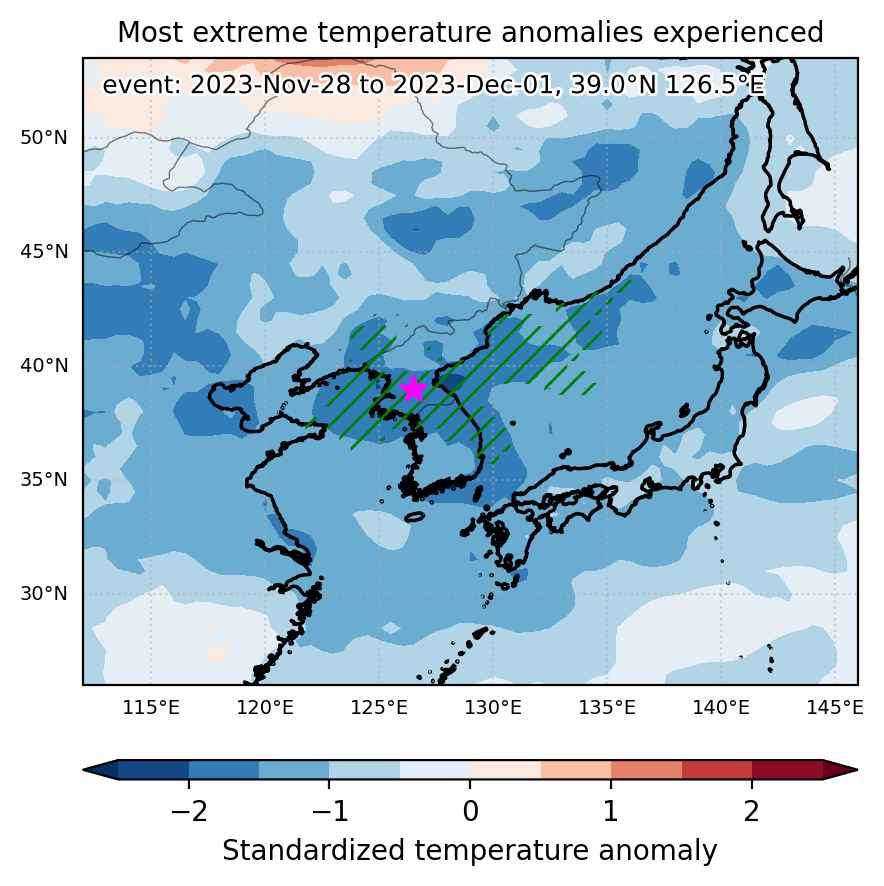
Cold spell occuring from November 28 2023 to December 01 2023 at 39.0°N 126.5°E

Download data: JSON

Event type: Cold spell

Countries affected (identified with ArcGIS Online; provided only for geographical reference):

  • China
  • Korea, Democratic People’s Republic of
  • Korea, Republic of

Duration: 4 days

Time span: November 28 2023 to December 01 2023

Statistics over entire affected area:

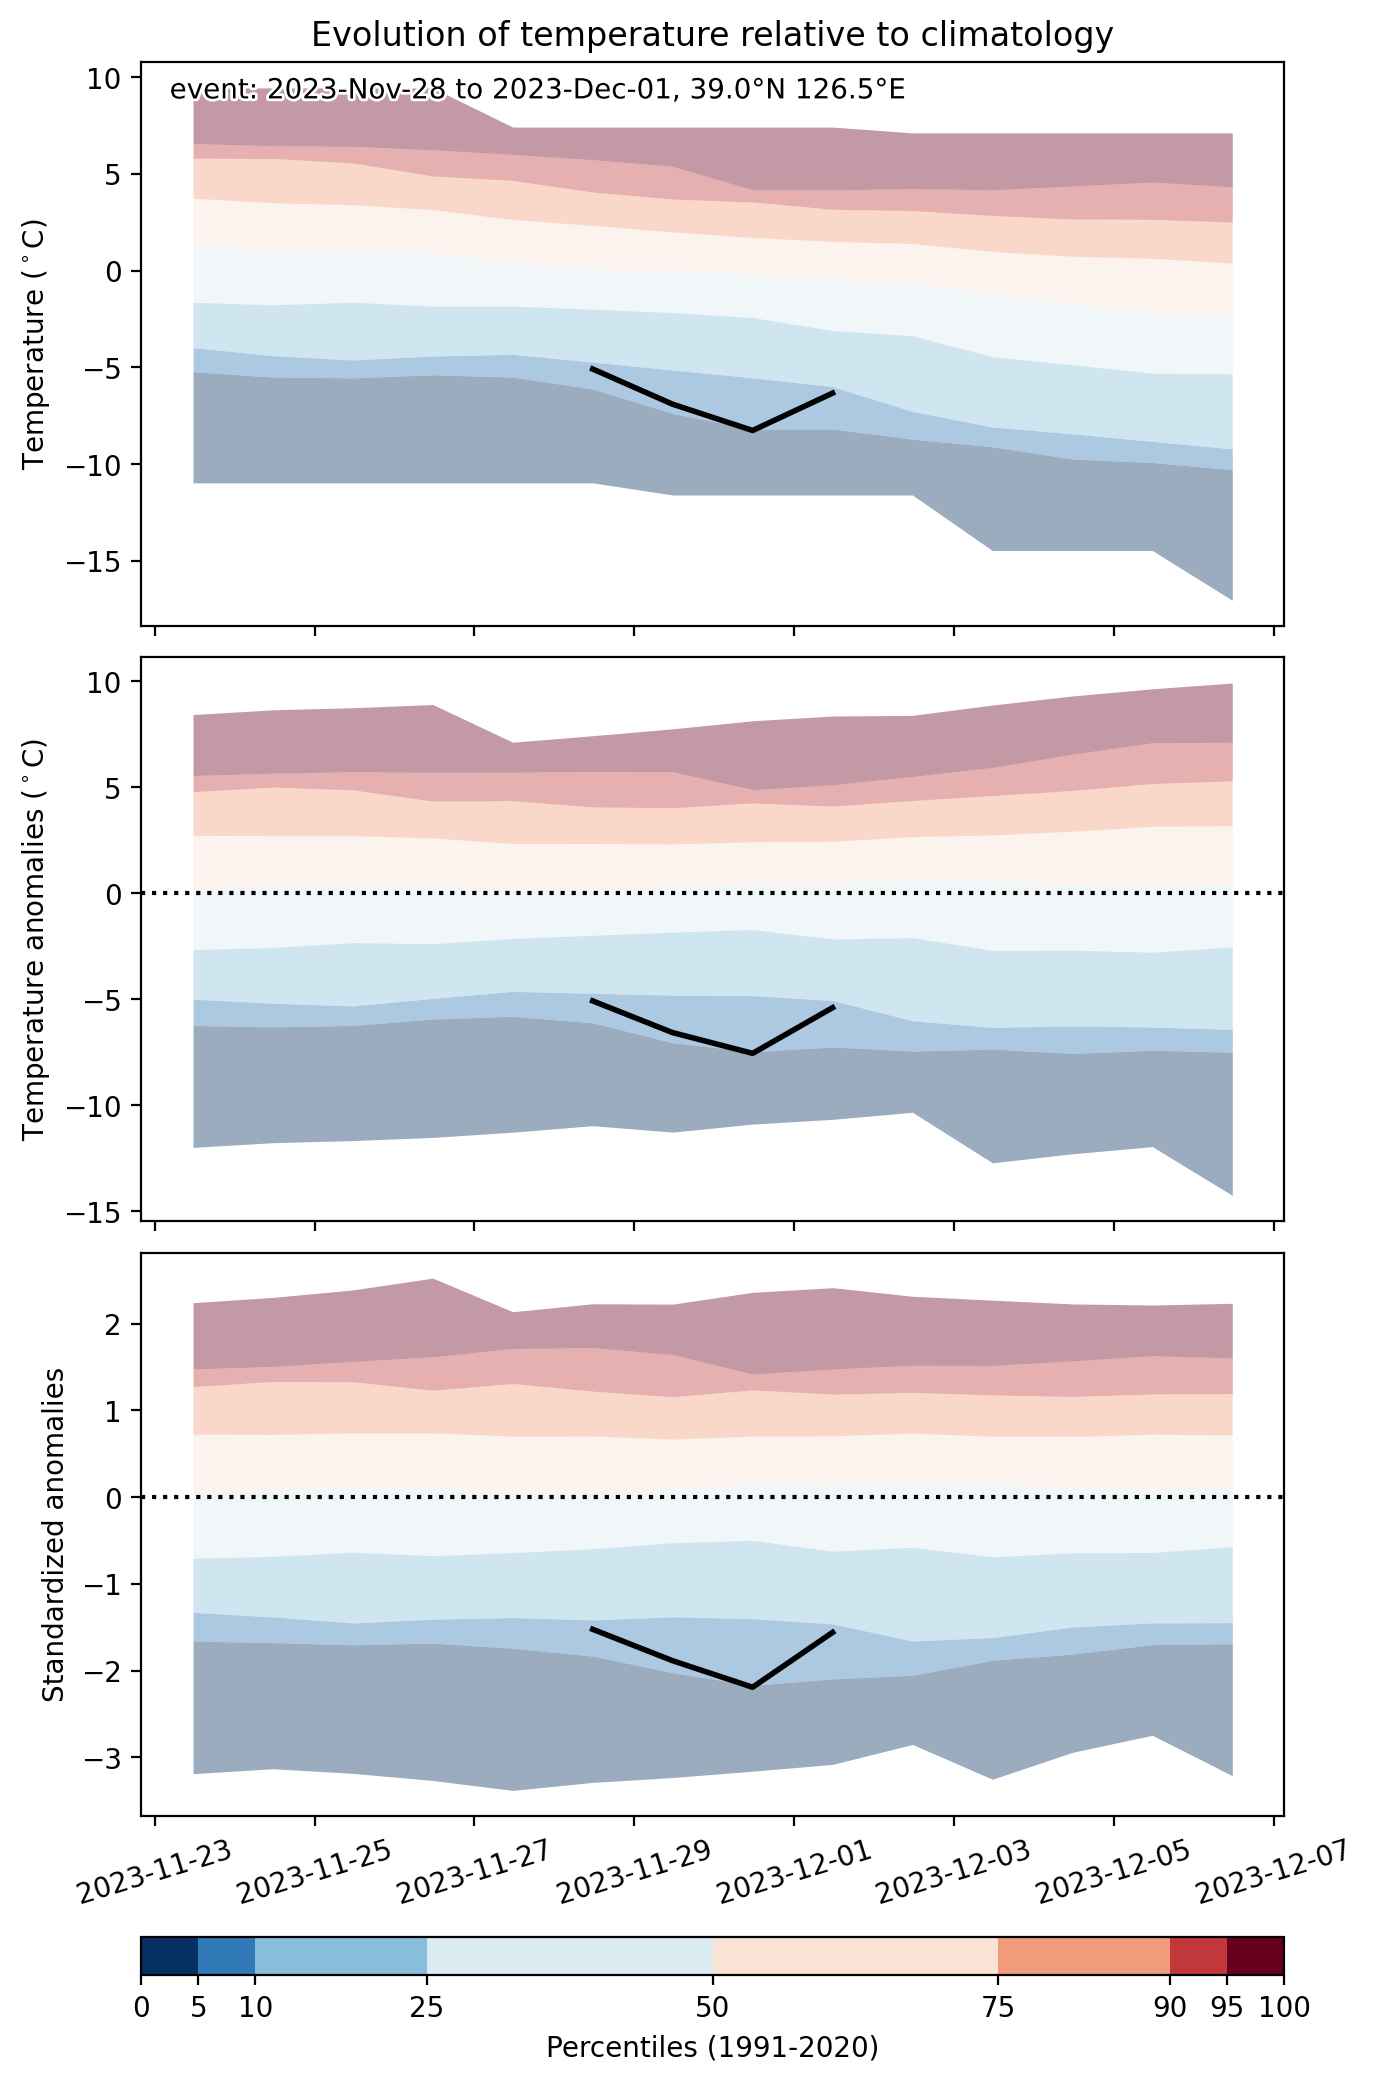
  • Mean temperature anomaly: -5.4 °C
  • Mean temperature: -1.9 °C
  • Minimum temperature anomaly: -9.3 °C
  • Minimum temperature: -18.1 °C

Event center: 39.0°N 126.5°E

Area affected: 412642 km$^2$


Fig. 1: Map of most extreme temperature anomalies (standardized) experienced during the event. The purple star indicates the center of the extreme event. Green hatching illustrates all areas under the effect of extremes at some time during the event.


Fig. 2: Evolution of temperature at the center of the event. The climatological percentile distribution is illustrated with color shadings.


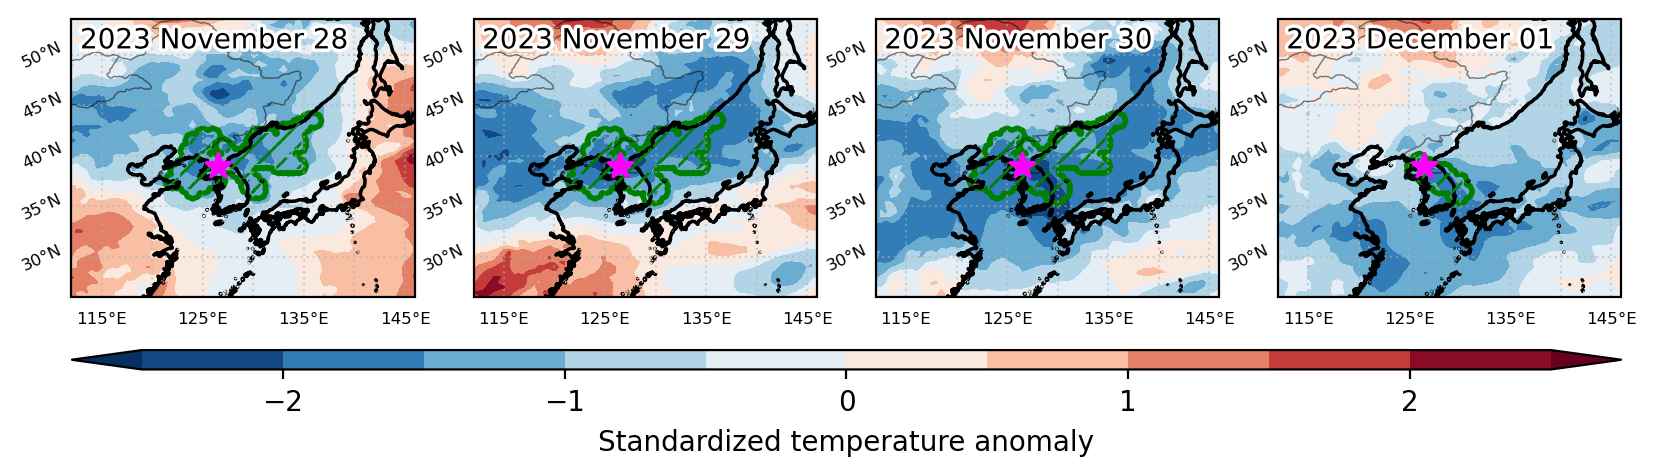
Fig. 3: Maps illustrating the evolution of standardized temperature anomalies during the event.

Event ID: Cold_spell_2023-Nov-28_to_2023-Dec-01_126.5_39.0

Cold spell occuring from November 11 2023 to January 24 2024 at 64.0°N 11.5°E

Download data: JSON

Event type: Cold spell

Countries affected (identified with ArcGIS Online; provided only for geographical reference):

  • Austria
  • Belgium
  • China
  • Czechia
  • Denmark
  • Estonia
  • Finland
  • France
  • Germany
  • Hong Kong
  • Ireland
  • Japan
  • Kazakhstan
  • Korea, Democratic People’s Republic of
  • Korea, Republic of
  • Kyrgyzstan
  • Latvia
  • Lithuania
  • Luxembourg
  • Mongolia
  • Netherlands
  • Norway
  • Poland
  • Russian Federation
  • Slovakia
  • Sweden
  • Switzerland
  • Turkmenistan
  • United Kingdom
  • Uzbekistan
  • Viet Nam

Duration: 75 days

Time span: November 11 2023 to January 24 2024

Statistics over entire affected area:

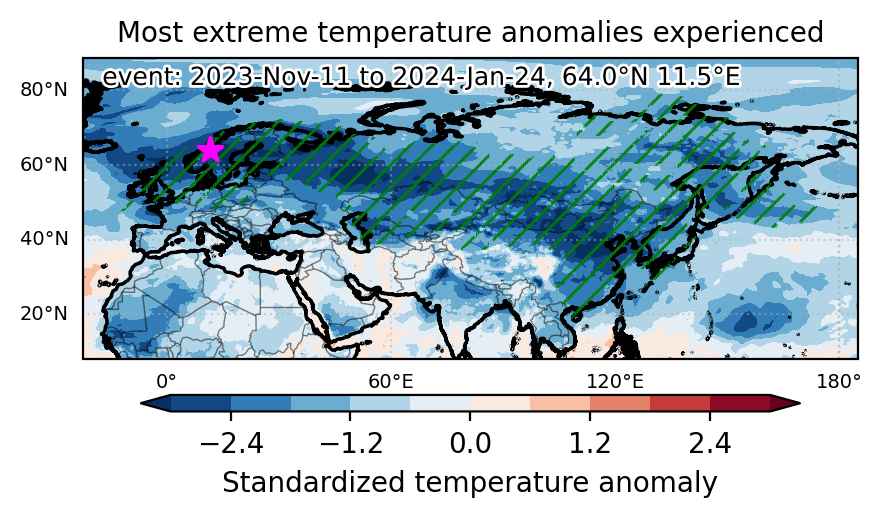
  • Mean temperature anomaly: -10.5 °C
  • Mean temperature: -22.4 °C
  • Minimum temperature anomaly: -30.3 °C
  • Minimum temperature: -58.1 °C

Event center: 64.0°N 11.5°E

Area affected: 29695508 km$^2$


Fig. 1: Map of most extreme temperature anomalies (standardized) experienced during the event. The purple star indicates the center of the extreme event. Green hatching illustrates all areas under the effect of extremes at some time during the event.


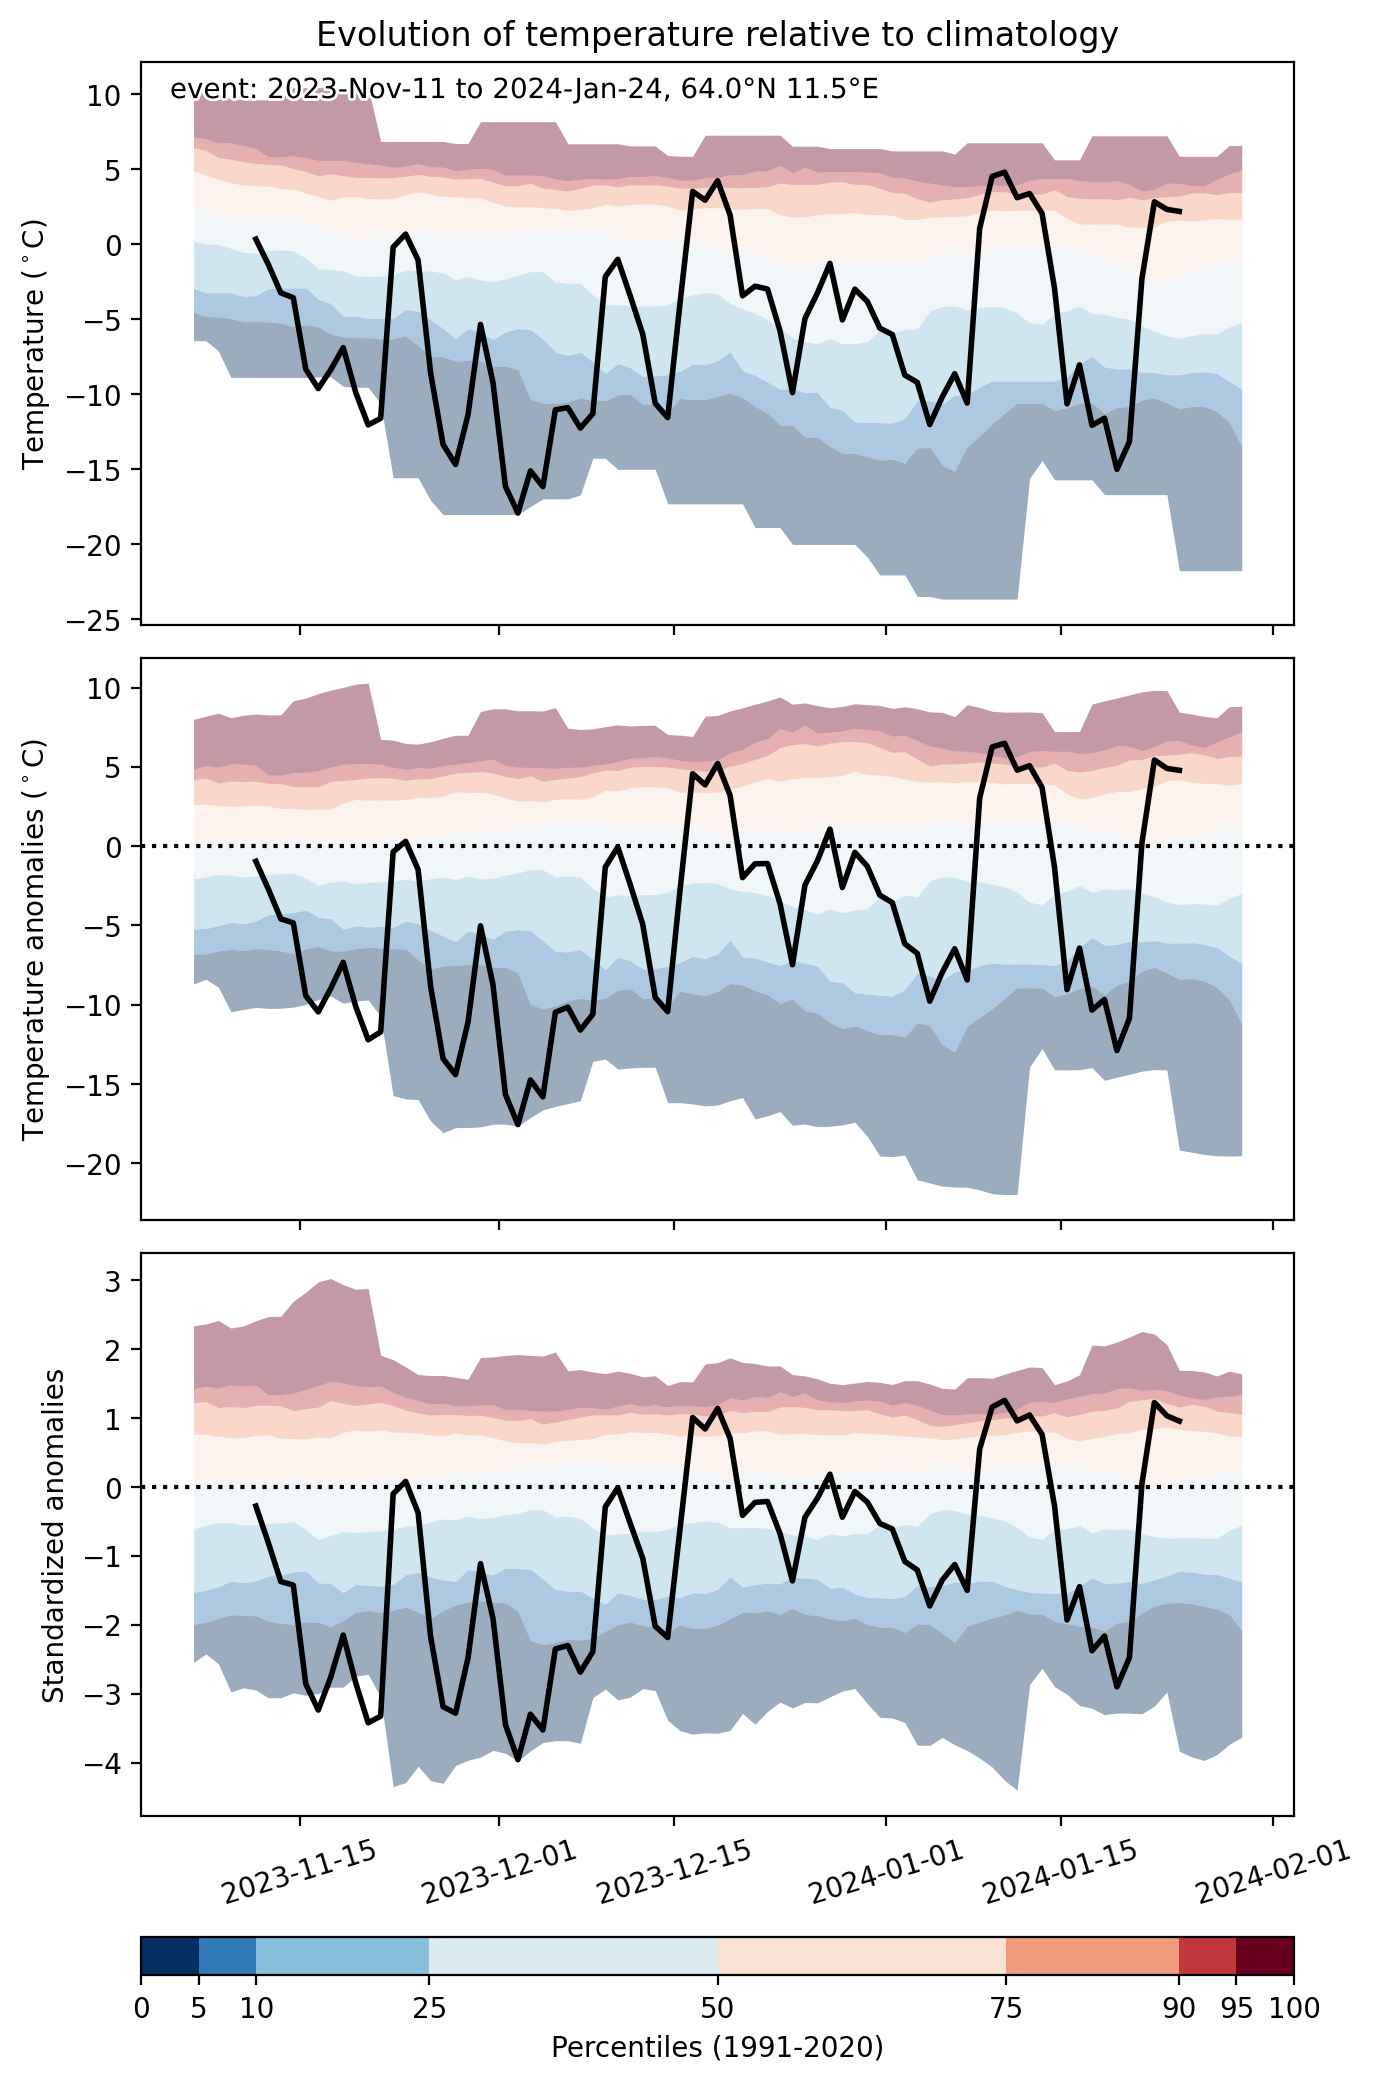
Fig. 2: Evolution of temperature at the center of the event. The climatological percentile distribution is illustrated with color shadings.


Fig. 3: Maps illustrating the evolution of standardized temperature anomalies during the event.

Event ID: Cold_spell_2023-Nov-11_to_2024-Jan-24_11.5_64.0

Cold spell occuring from November 02 2023 to November 16 2023 at 47.5°N 105.5°E

Download data: JSON

Event type: Cold spell

Countries affected (identified with ArcGIS Online; provided only for geographical reference):

  • China
  • Korea, Democratic People’s Republic of
  • Korea, Republic of
  • Mongolia
  • Russian Federation

Duration: 15 days

Time span: November 02 2023 to November 16 2023

Statistics over entire affected area:

  • Mean temperature anomaly: -7.8 °C
  • Mean temperature: -6.7 °C
  • Minimum temperature anomaly: -23.8 °C
  • Minimum temperature: -31.6 °C

Event center: 47.5°N 105.5°E

Area affected: 4111706 km$^2$


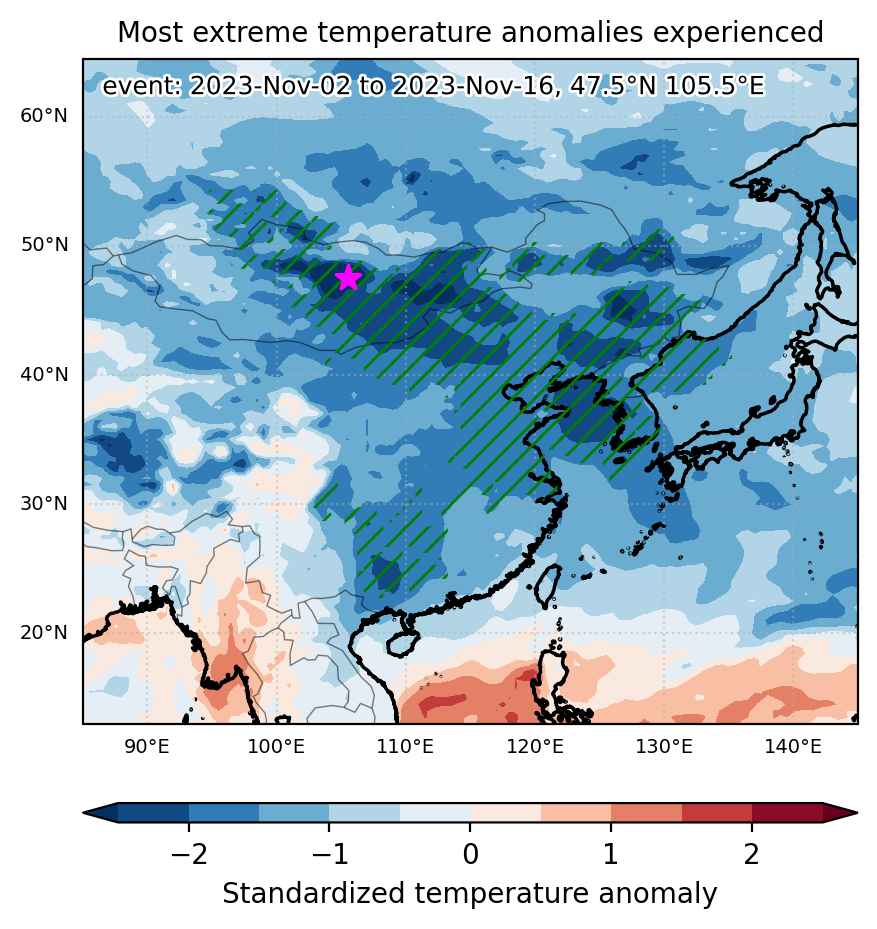
Fig. 1: Map of most extreme temperature anomalies (standardized) experienced during the event. The purple star indicates the center of the extreme event. Green hatching illustrates all areas under the effect of extremes at some time during the event.


Fig. 2: Evolution of temperature at the center of the event. The climatological percentile distribution is illustrated with color shadings.


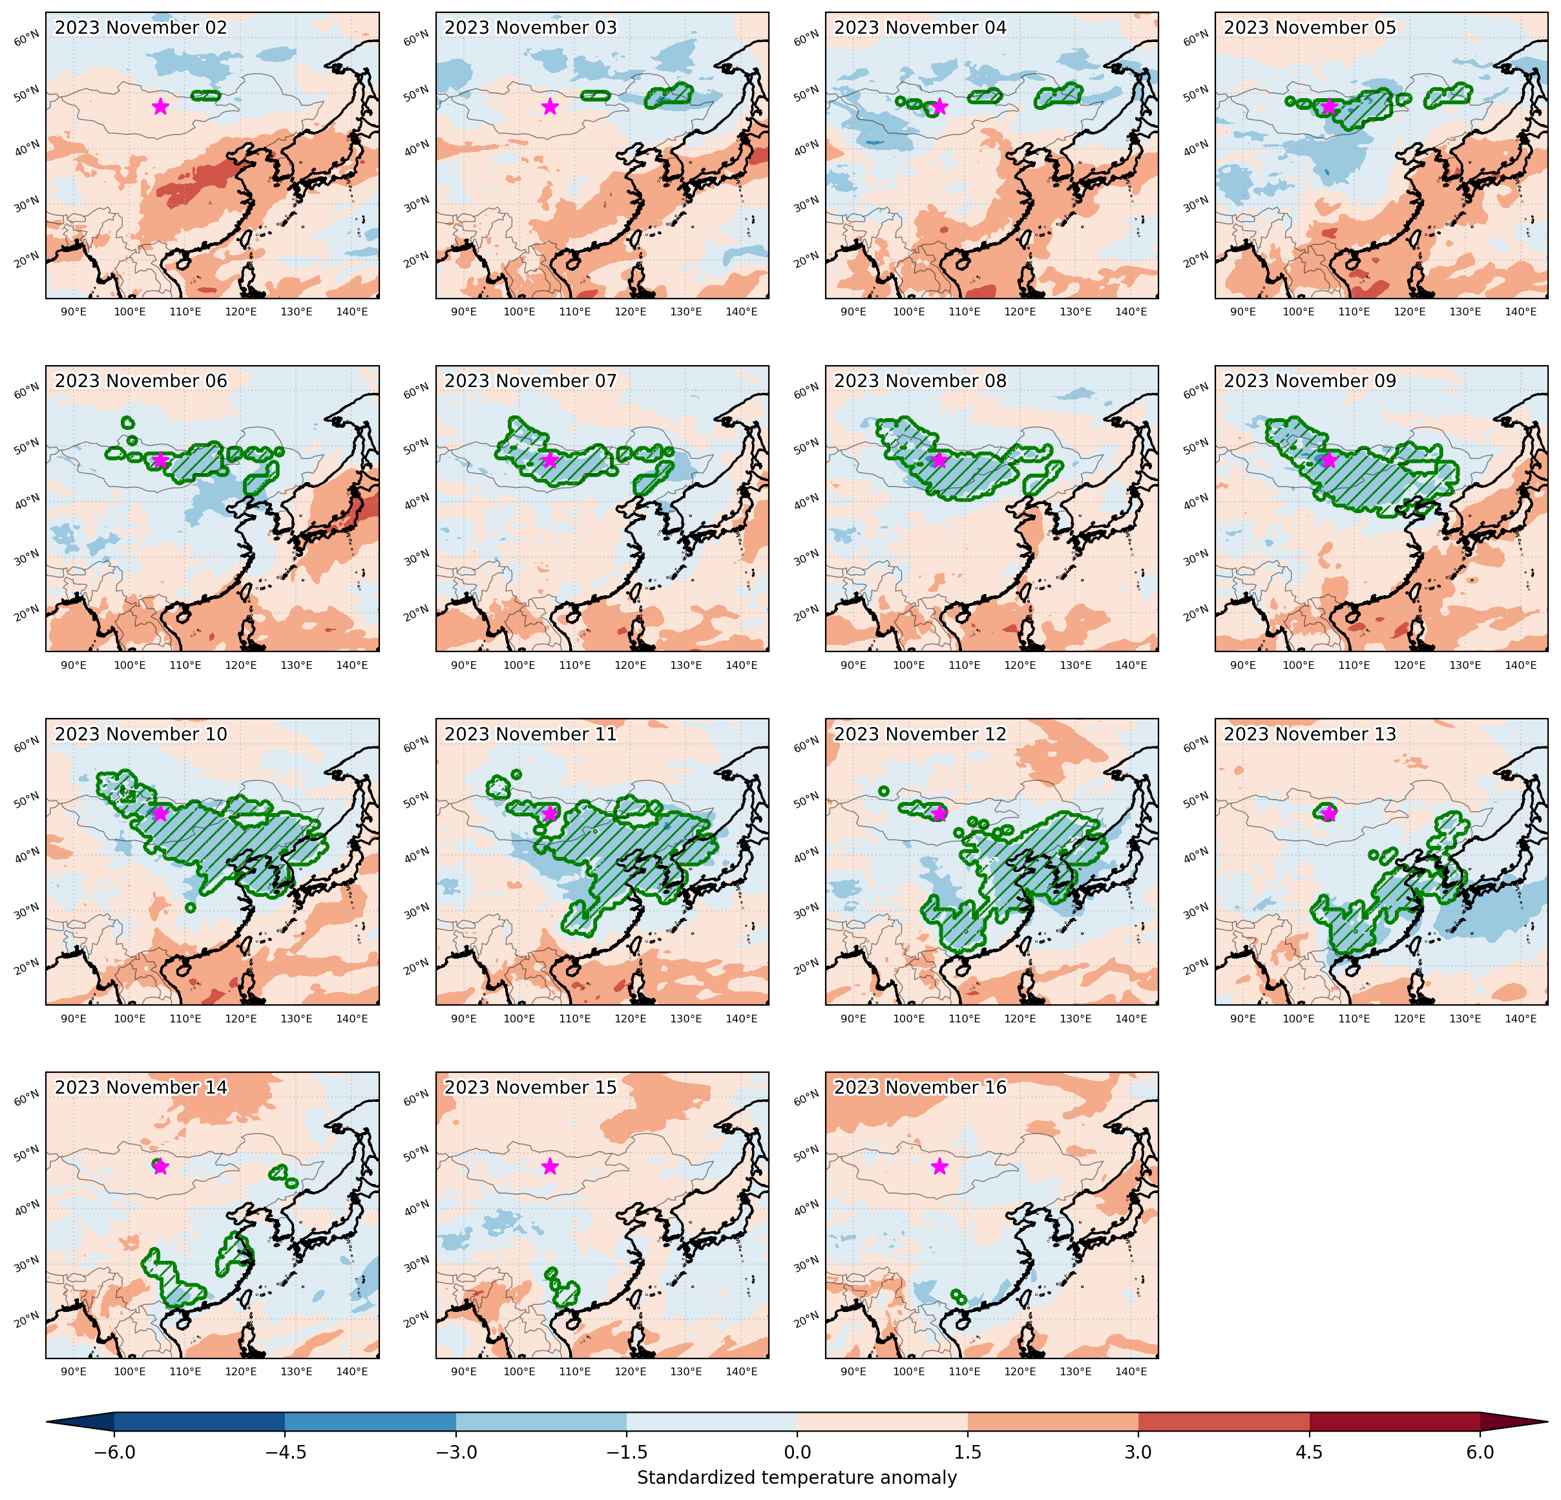
Fig. 3: Maps illustrating the evolution of standardized temperature anomalies during the event.

Event ID: Cold_spell_2023-Nov-02_to_2023-Nov-16_105.5_47.5