Heat wave occuring from October 27 2021 to November 02 2021 at -13.0°S 290.0°E

Download data: JSON

Event type: Heat wave

Countries affected (identified with ArcGIS Online; provided only for geographical reference):

  • Bolivia, Plurinational State of
  • Brazil
  • Peru

Duration: 7 days

Time span: October 27 2021 to November 02 2021

Statistics over entire affected area:

  • Mean temperature anomaly: 3.2 °C
  • Mean temperature: 28.7 °C
  • Maximum temperature anomaly: 6.2 °C
  • Maximum temperature: 32.6 °C

Event center: -13.0°S 290.0°E

Area affected: 572188 km$^2$
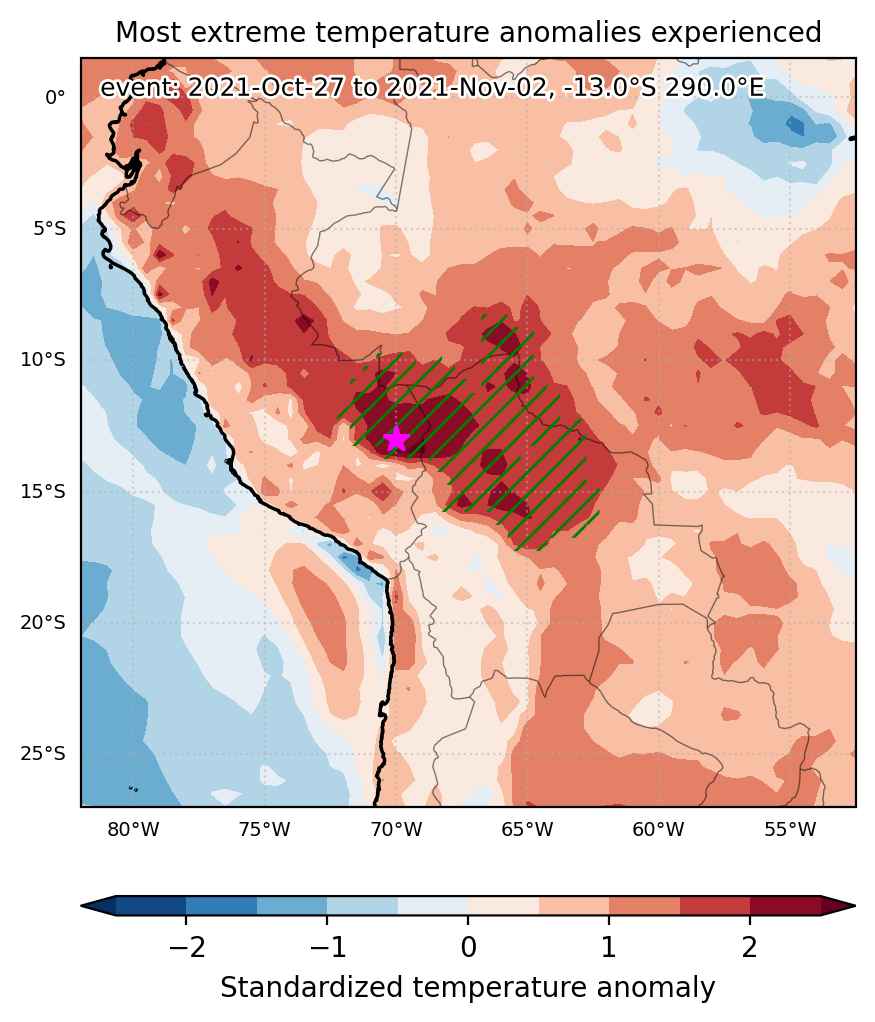

Fig. 1: Map of most extreme temperature anomalies (standardized) experienced during the event. The purple star indicates the center of the extreme event. Green hatching illustrates all areas under the effect of extremes at some time during the event.
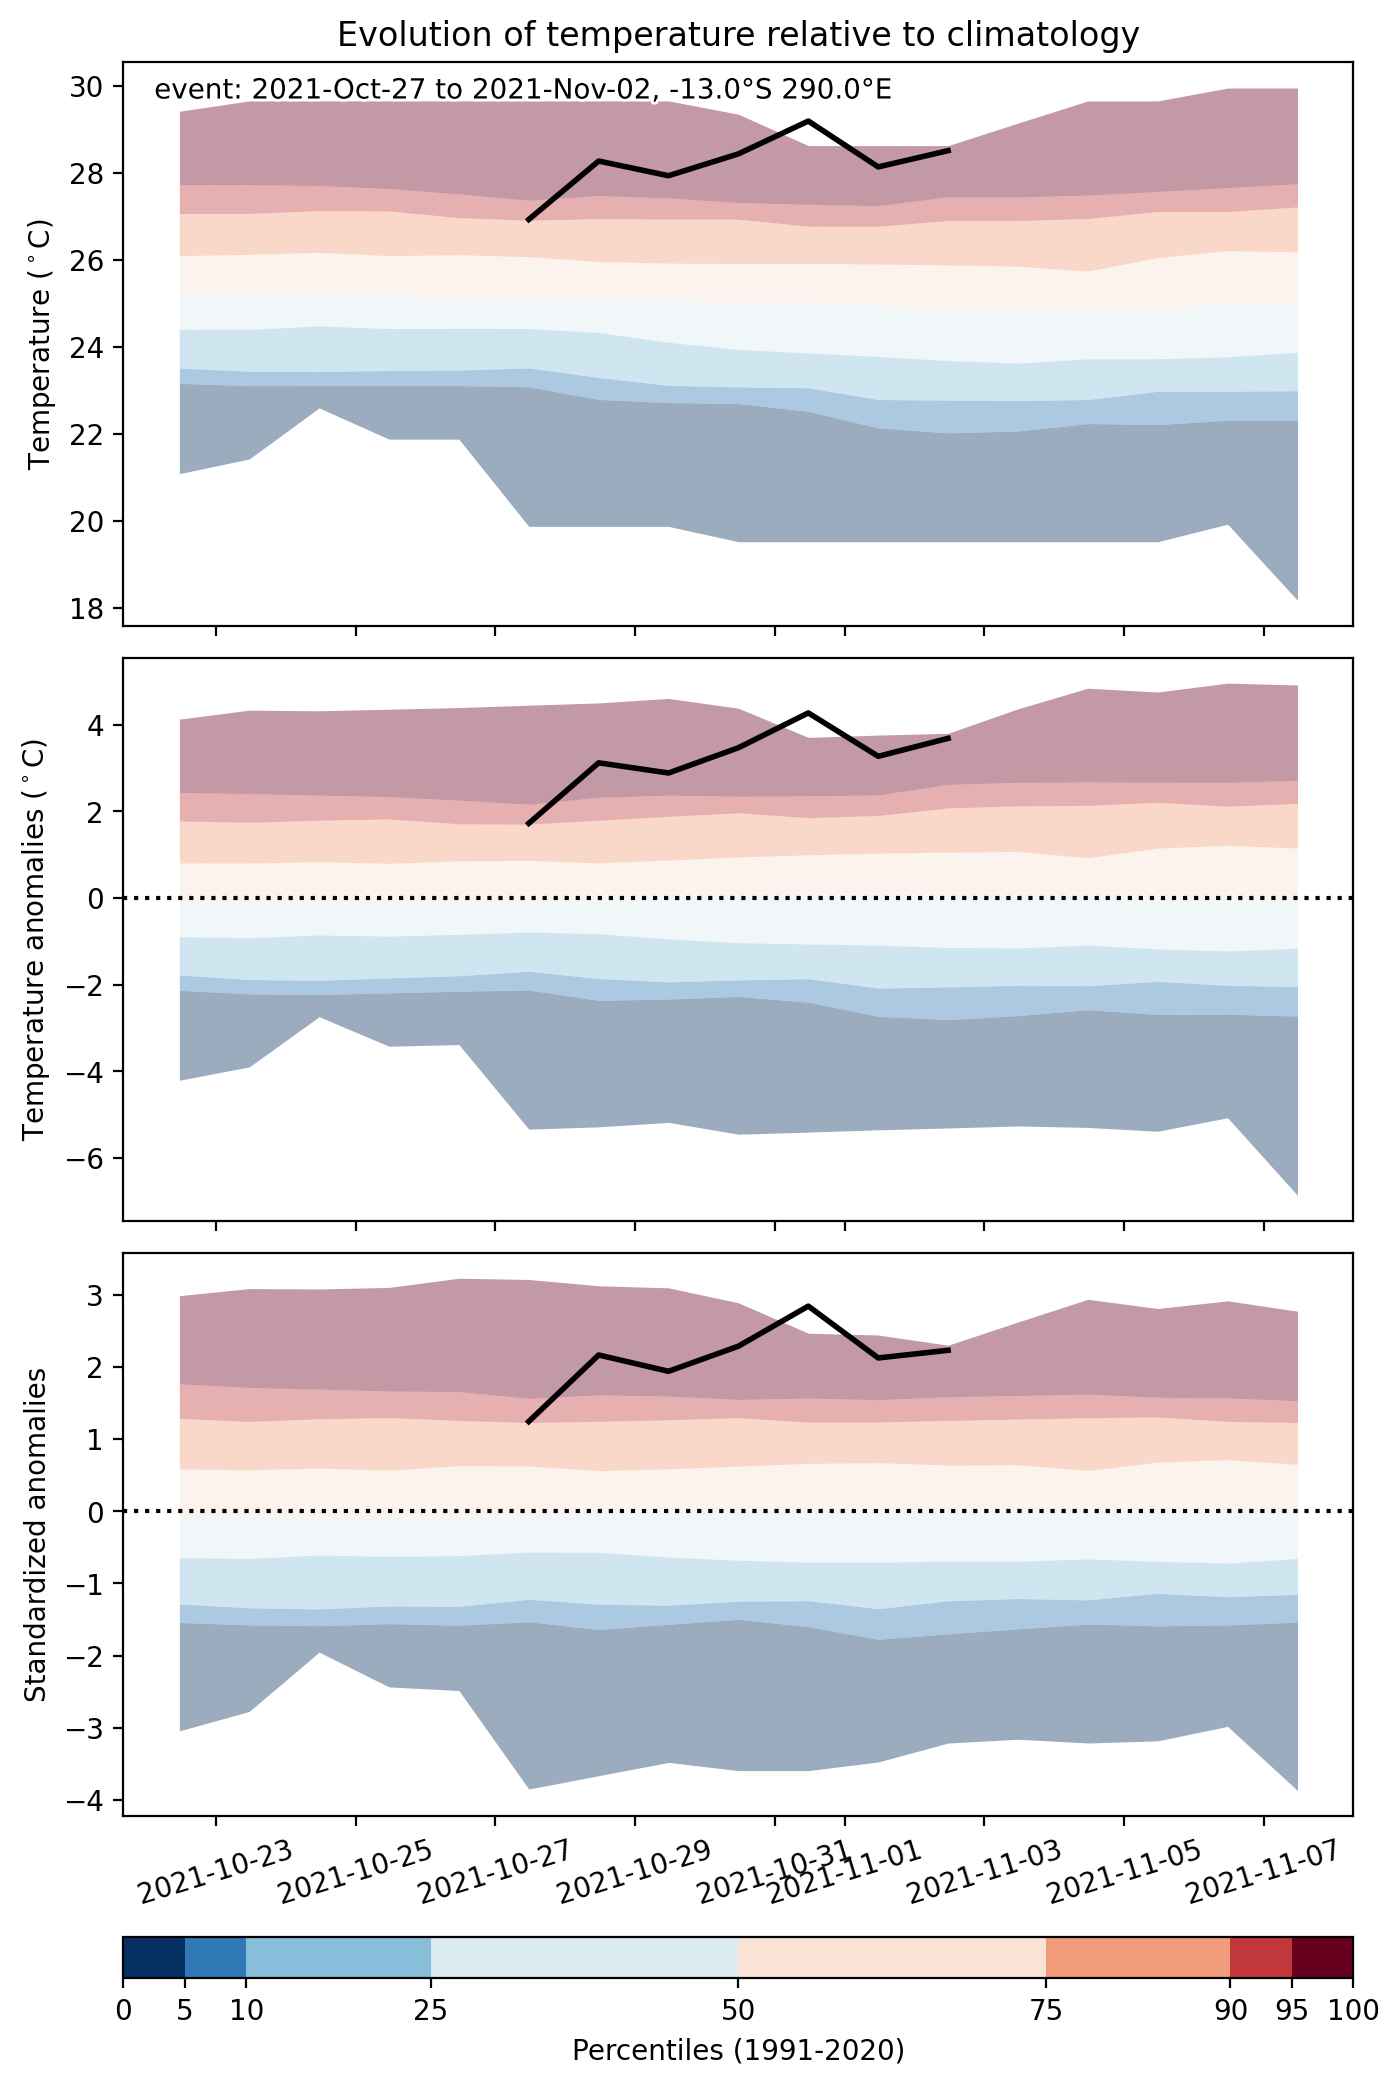


Fig. 2: Evolution of temperature at the center of the event. The climatological percentile distribution is illustrated with color shadings.
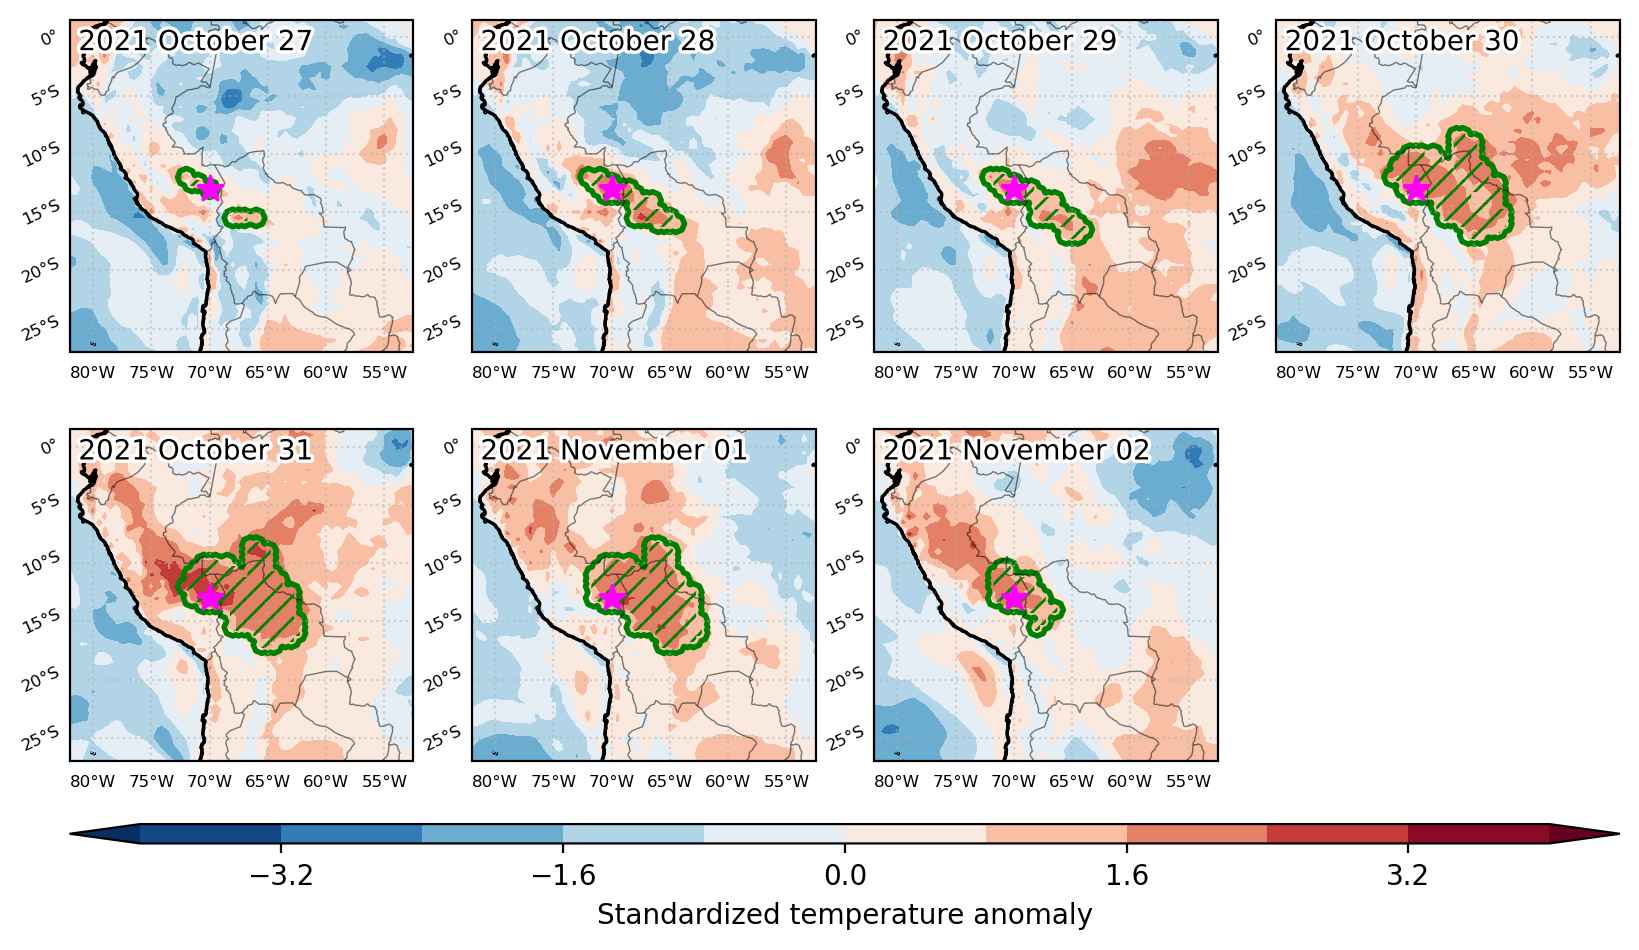


Fig. 3: Maps illustrating the evolution of standardized temperature anomalies during the event.

Event ID: Heat_wave_2021-Oct-27_to_2021-Nov-02_290.0_-13.0
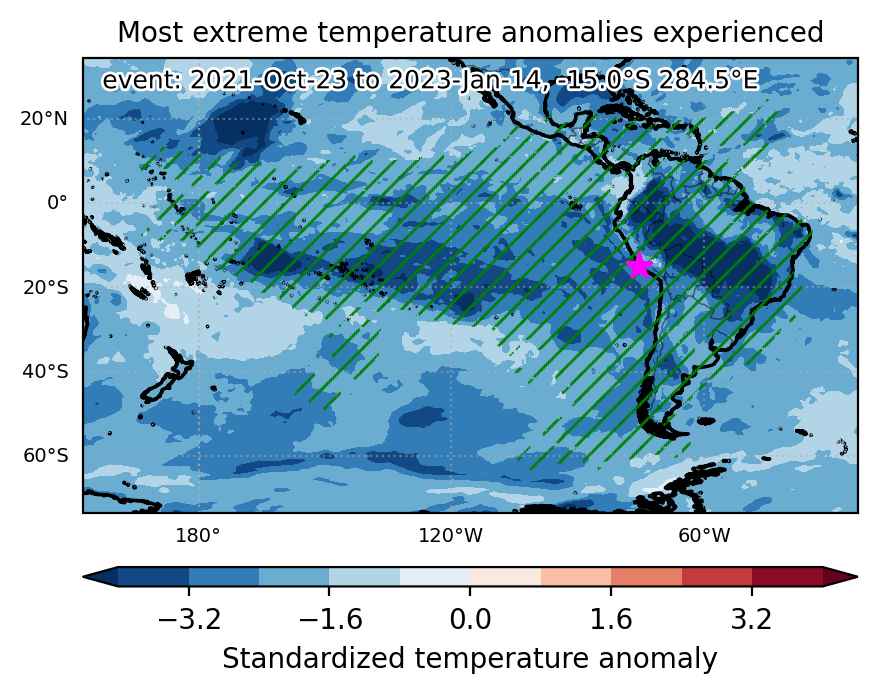
Cold spell occuring from October 23 2021 to January 14 2023 at -15.0°S 284.5°E

Download data: JSON

Event type: Cold spell

Countries affected (identified with ArcGIS Online; provided only for geographical reference):

  • Argentina
  • Aruba
  • Belize
  • Bolivia, Plurinational State of
  • Bonaire, Sint Eustatius and Saba
  • Brazil
  • Chile
  • Colombia
  • Cook Islands
  • Costa Rica
  • Cuba
  • Dominican Republic
  • Ecuador
  • El Salvador
  • French Guiana
  • French Polynesia
  • Guatemala
  • Guyana
  • Haiti
  • Honduras
  • Jamaica
  • Mexico
  • Nicaragua
  • Panama
  • Paraguay
  • Peru
  • Puerto Rico
  • Samoa
  • Sint Maarten (Dutch part)
  • Suriname
  • Uruguay
  • Venezuela, Bolivarian Republic of

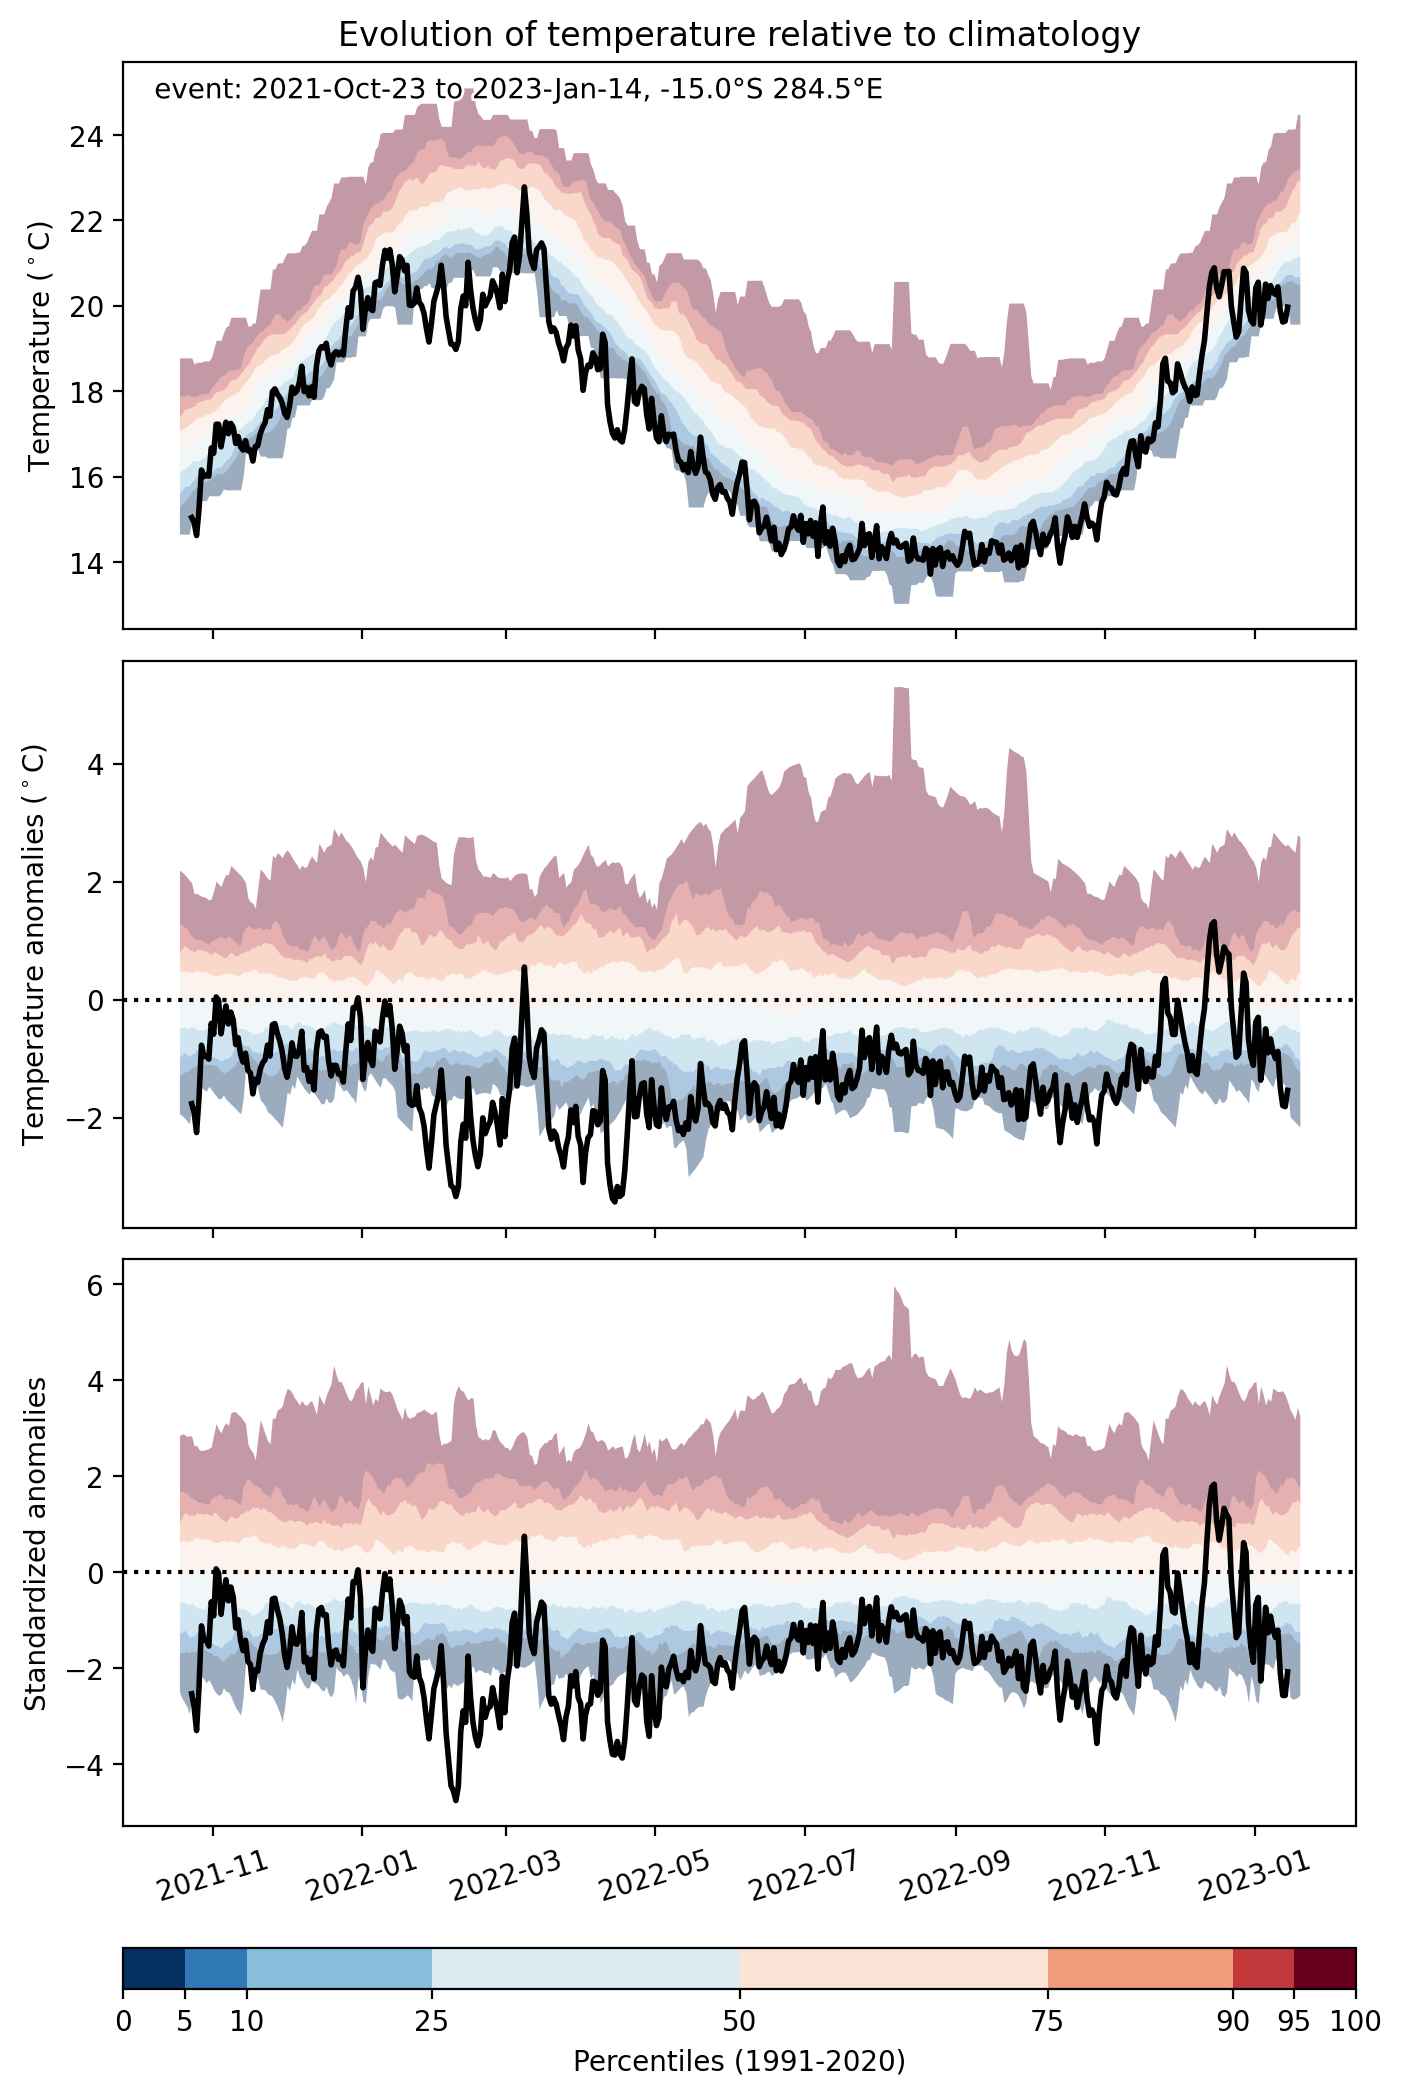
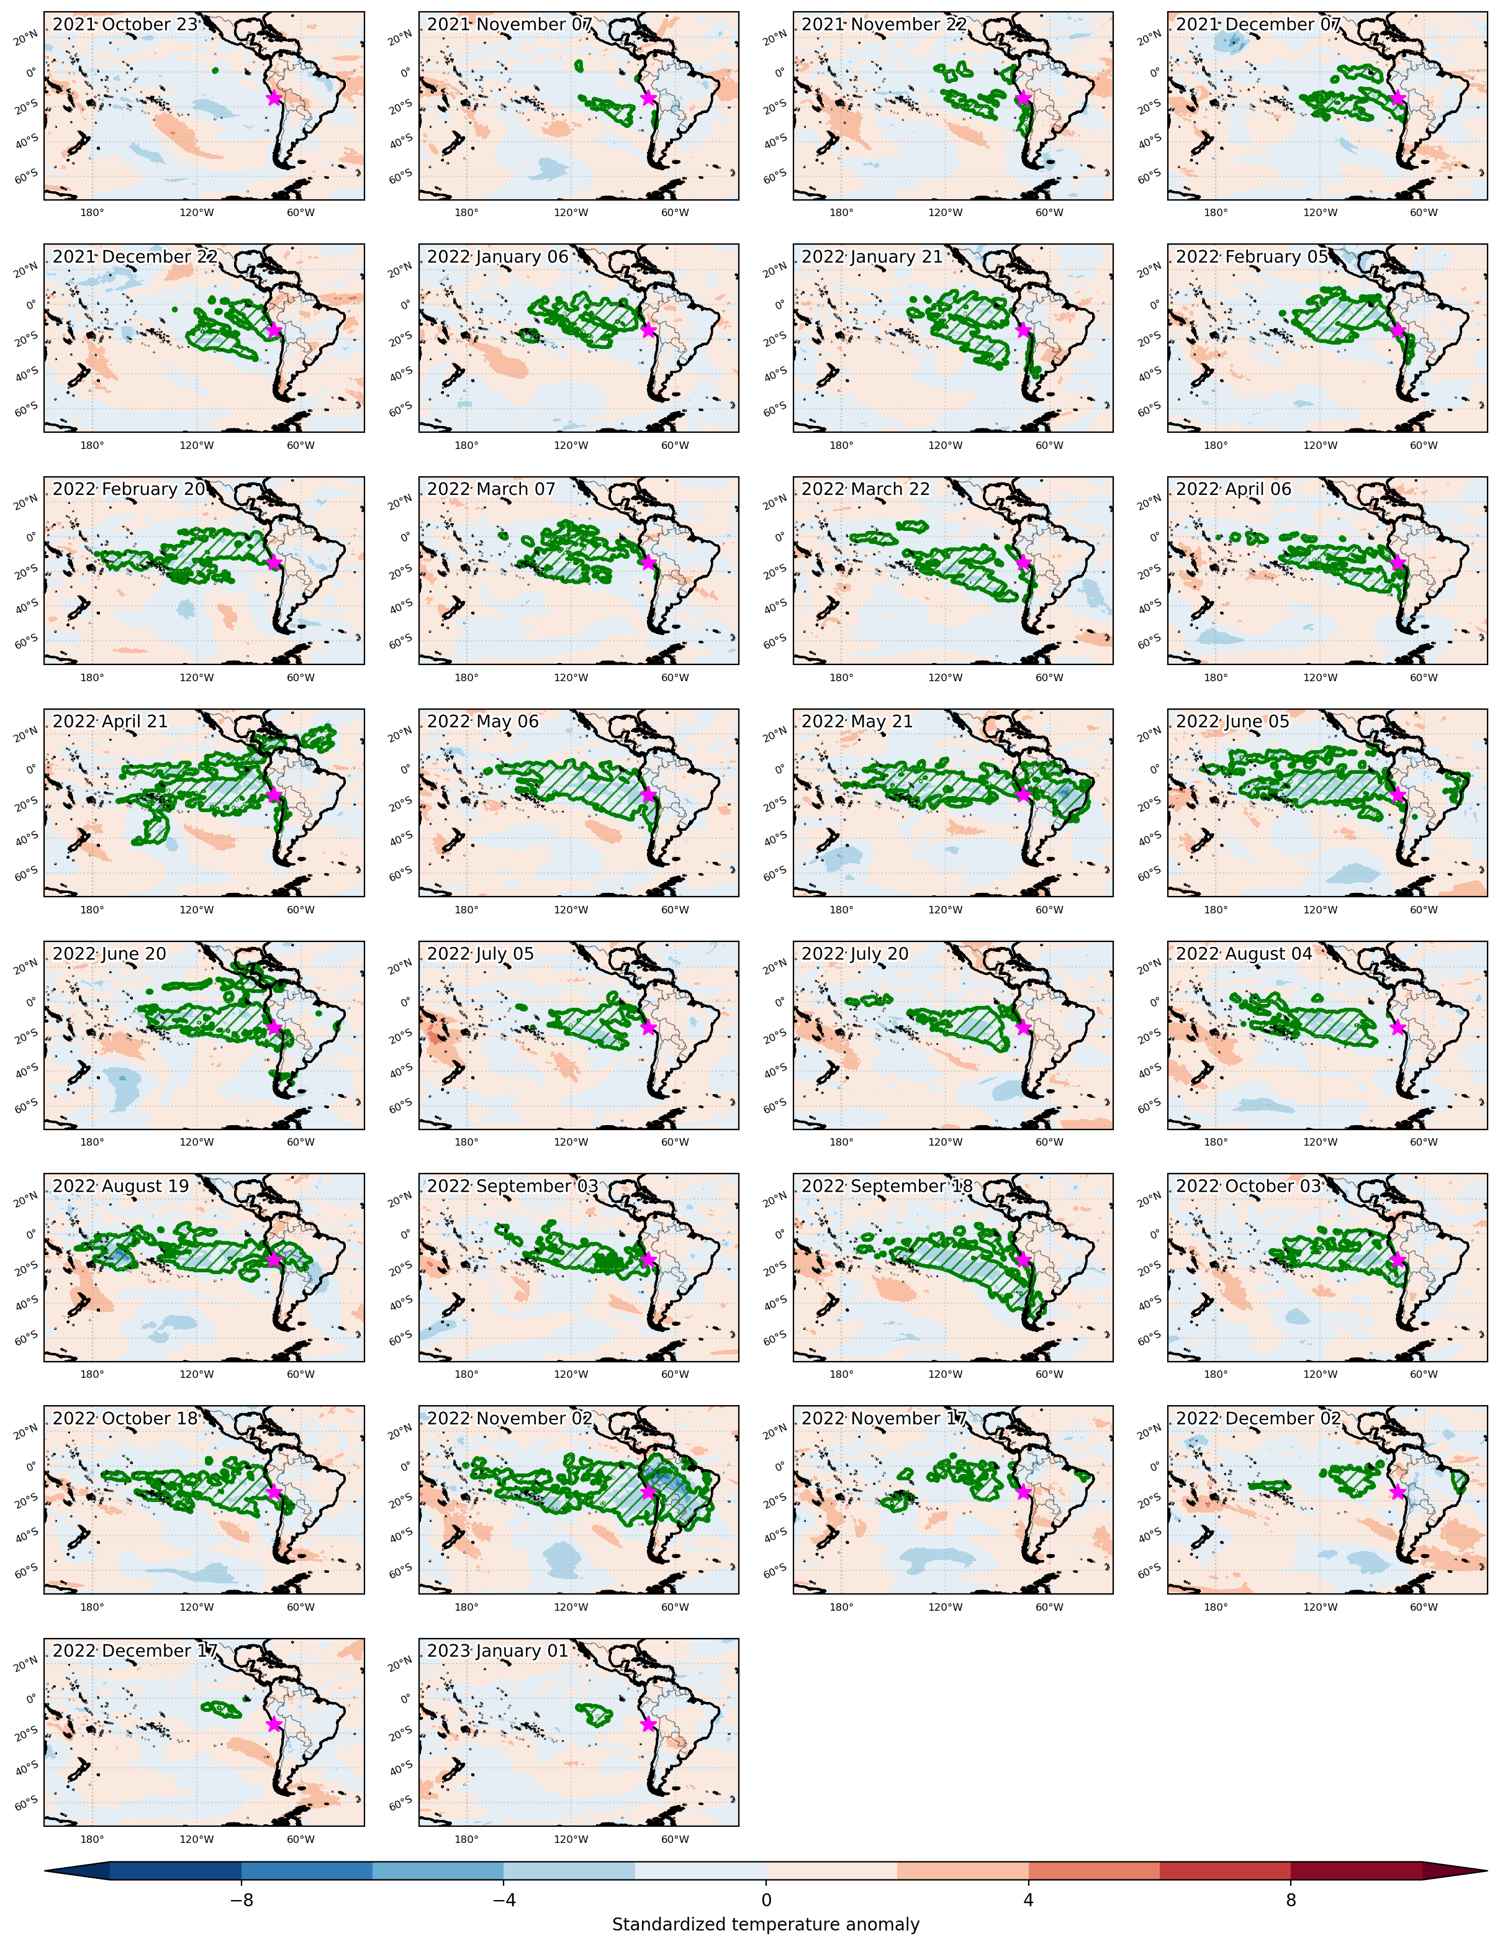
Duration: 449 days

Time span: October 23 2021 to January 14 2023

Statistics over entire affected area:

  • Mean temperature anomaly: -1.4 °C
  • Mean temperature: 21.7 °C
  • Minimum temperature anomaly: -15.4 °C
  • Minimum temperature: -25.1 °C

Event center: -15.0°S 284.5°E

Area affected: 80783998 km$^2$


Fig. 1: Map of most extreme temperature anomalies (standardized) experienced during the event. The purple star indicates the center of the extreme event. Green hatching illustrates all areas under the effect of extremes at some time during the event.


Fig. 2: Evolution of temperature at the center of the event. The climatological percentile distribution is illustrated with color shadings.


Fig. 3: Maps illustrating the evolution of standardized temperature anomalies during the event.

Event ID: Cold_spell_2021-Oct-23_to_2023-Jan-14_284.5_-15.0

Heat wave occuring from October 21 2021 to October 25 2021 at 3.0°N 285.5°E

Download data: JSON

Event type: Heat wave

Countries affected (identified with ArcGIS Online; provided only for geographical reference):

  • Colombia
  • Peru

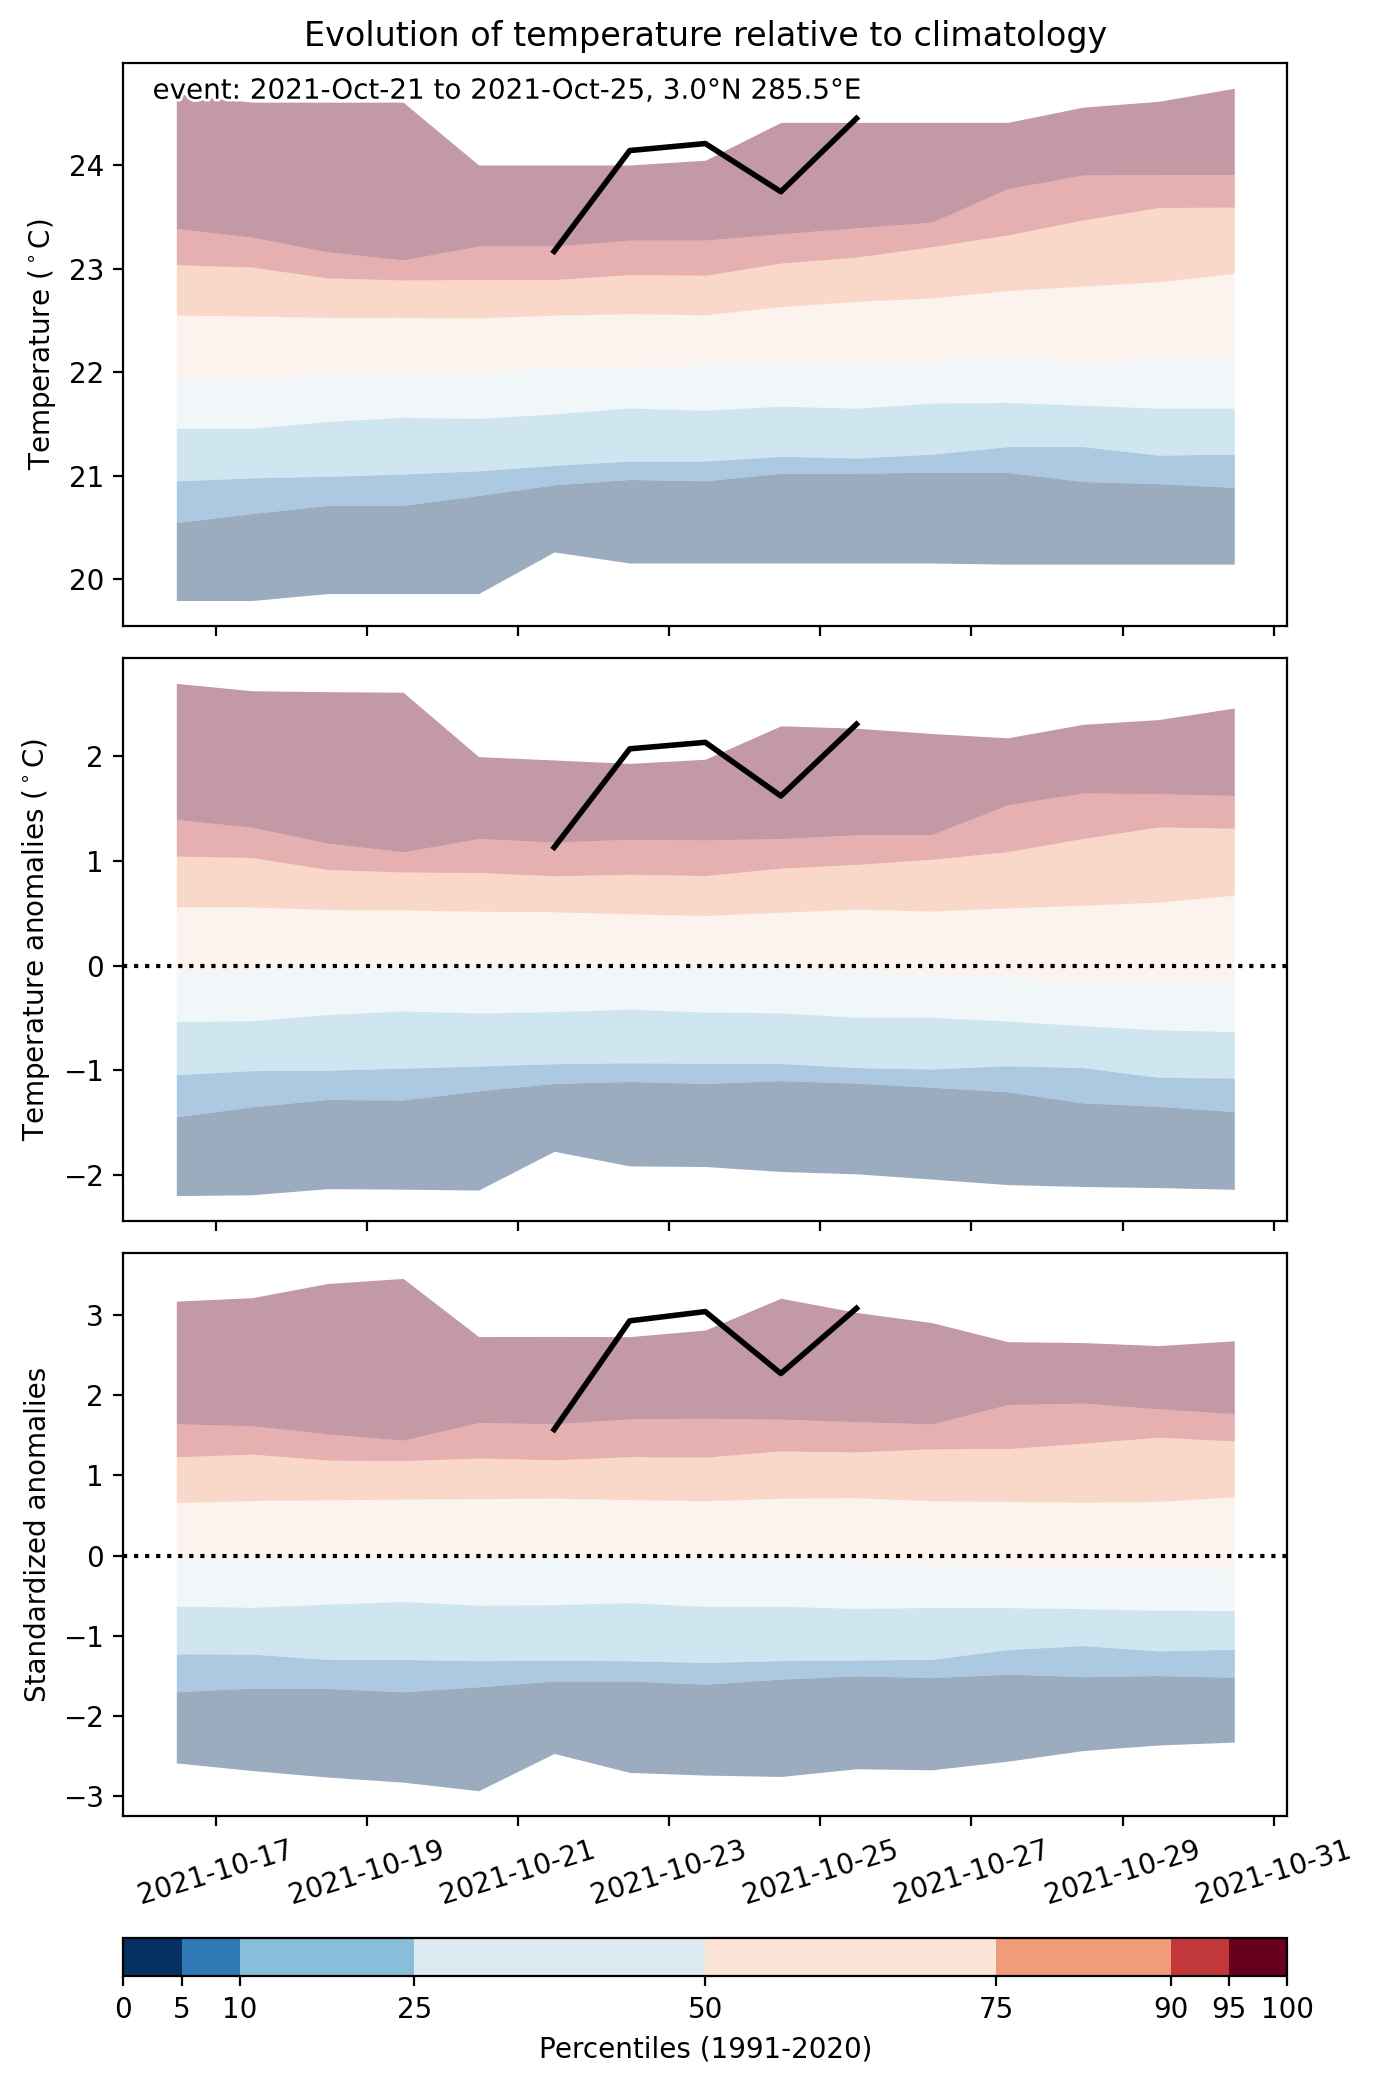
Duration: 5 days

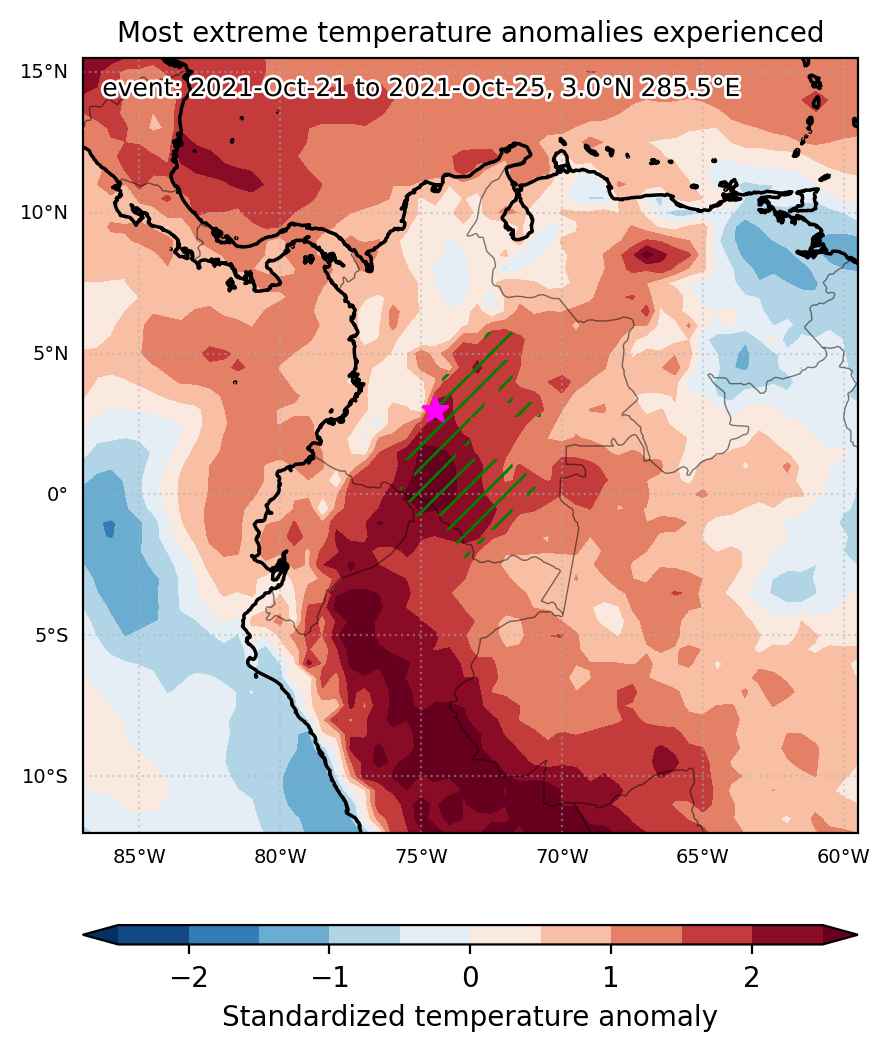
Time span: October 21 2021 to October 25 2021

Statistics over entire affected area:

  • Mean temperature anomaly: 1.6 °C
  • Mean temperature: 26.4 °C
  • Maximum temperature anomaly: 3.3 °C
  • Maximum temperature: 28.8 °C

Event center: 3.0°N 285.5°E

Area affected: 219279 km$^2$


Fig. 1: Map of most extreme temperature anomalies (standardized) experienced during the event. The purple star indicates the center of the extreme event. Green hatching illustrates all areas under the effect of extremes at some time during the event.


Fig. 2: Evolution of temperature at the center of the event. The climatological percentile distribution is illustrated with color shadings.


Fig. 3: Maps illustrating the evolution of standardized temperature anomalies during the event.

Event ID: Heat_wave_2021-Oct-21_to_2021-Oct-25_285.5_3.0

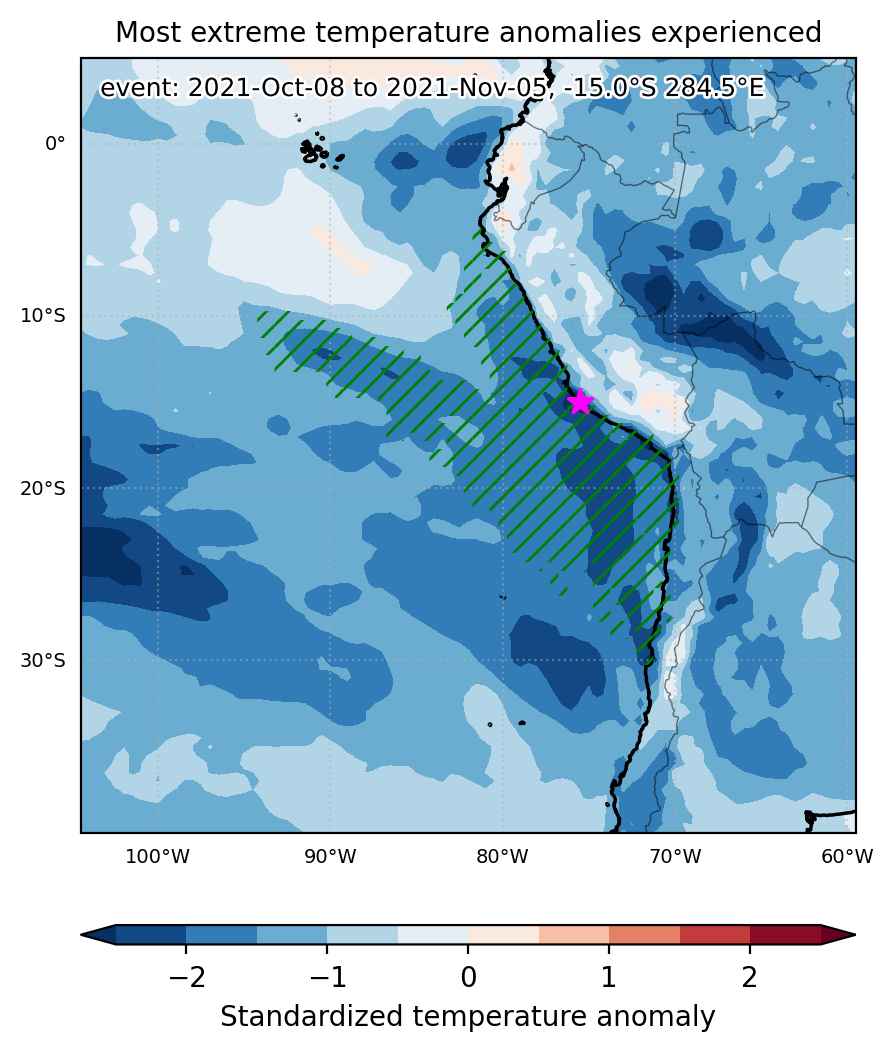
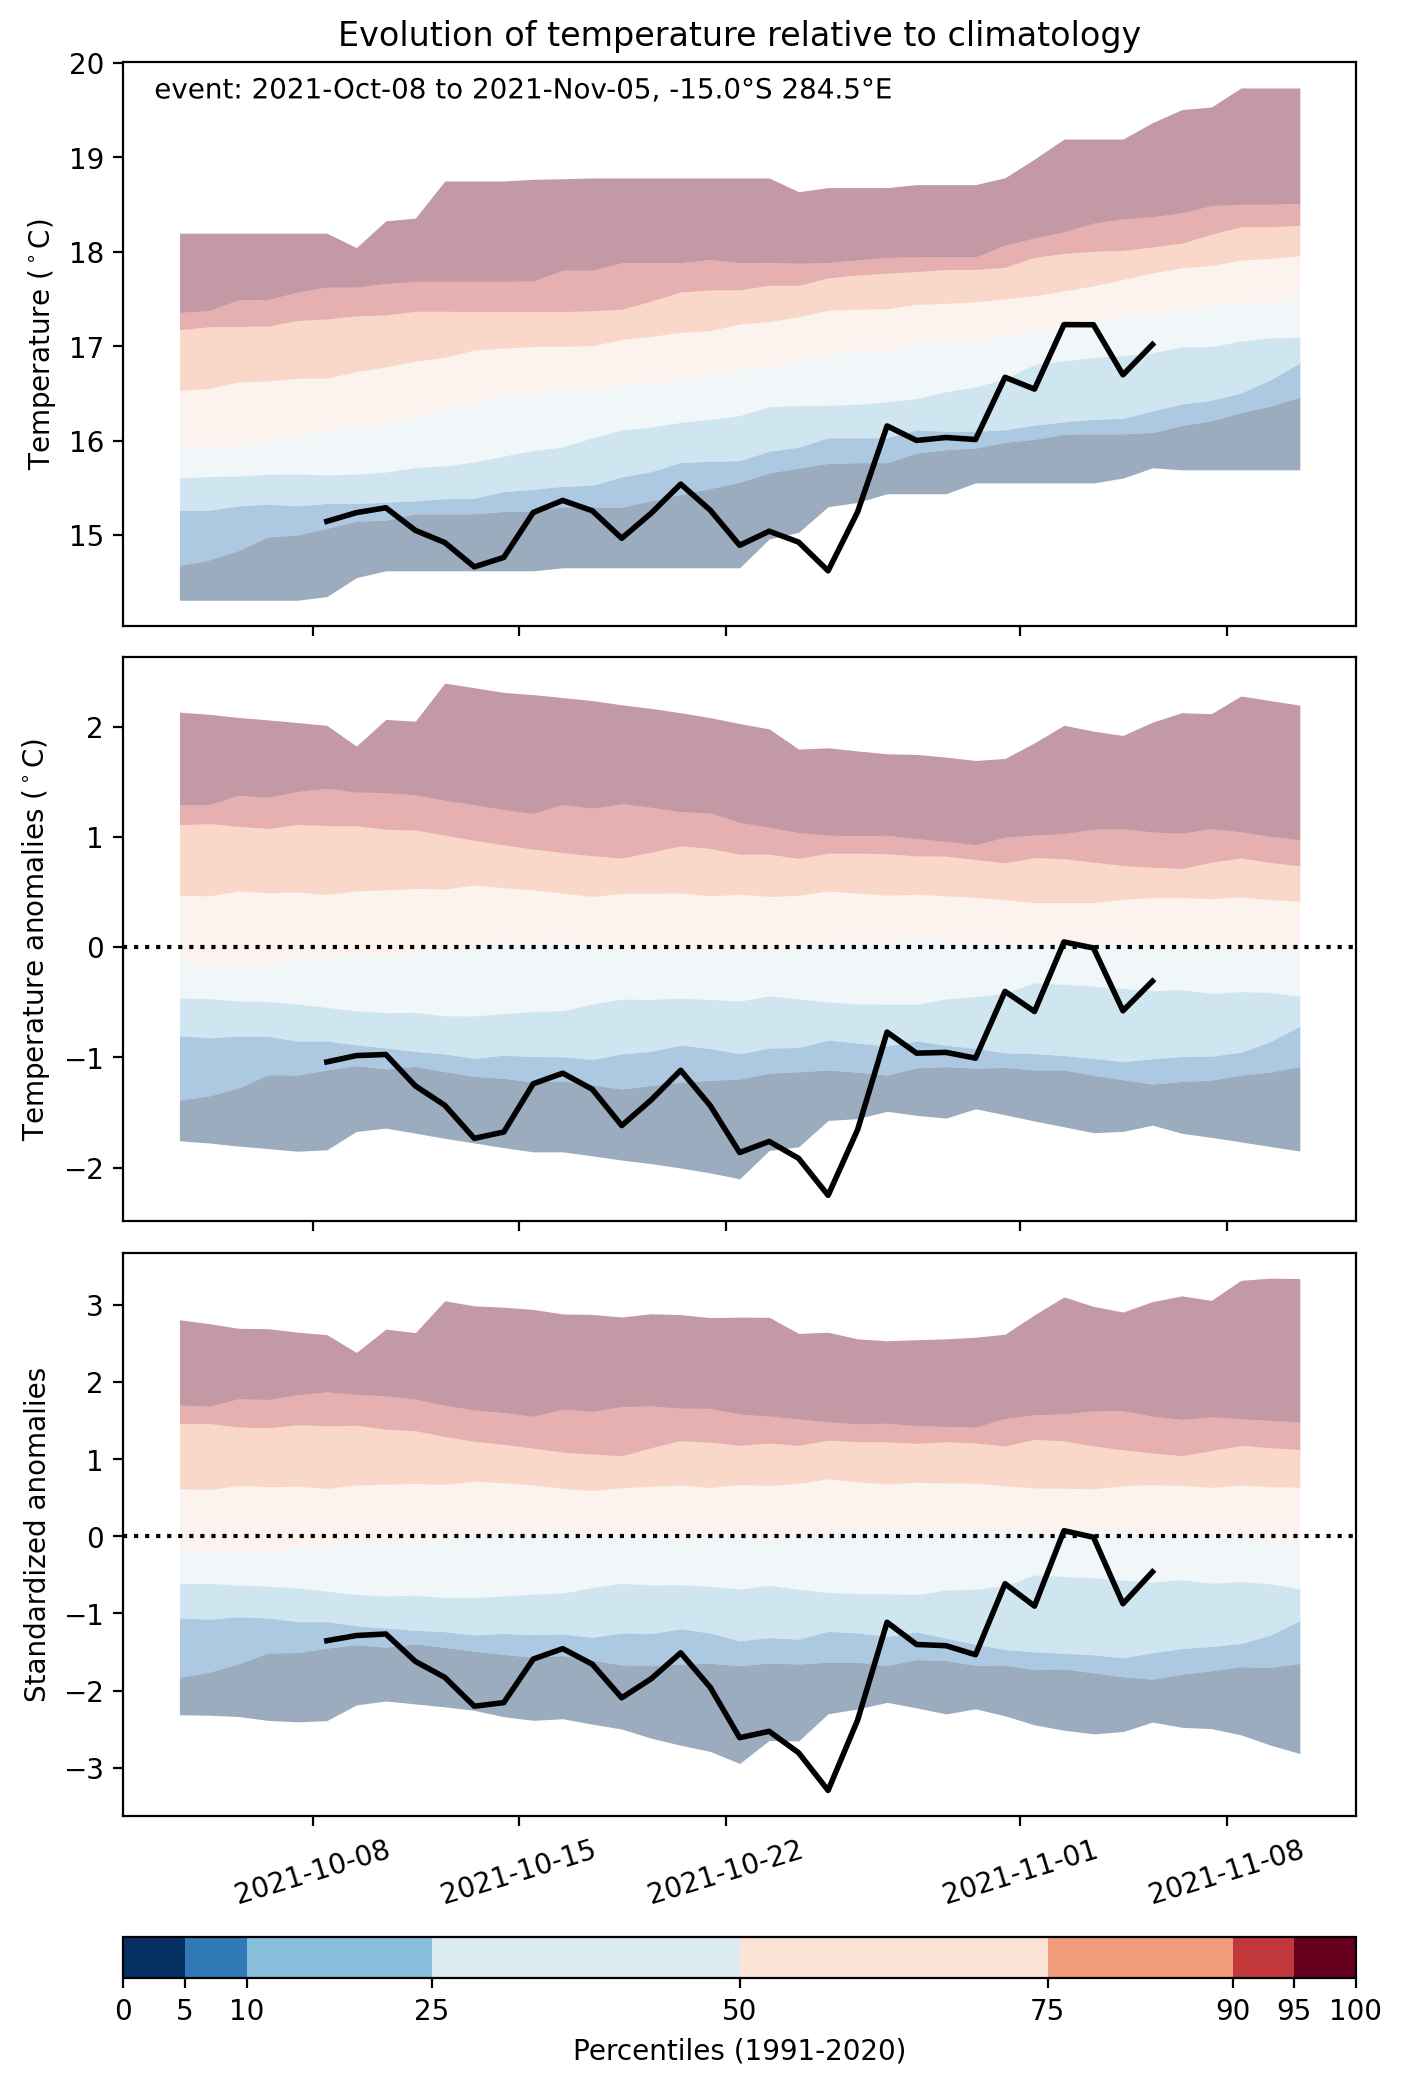
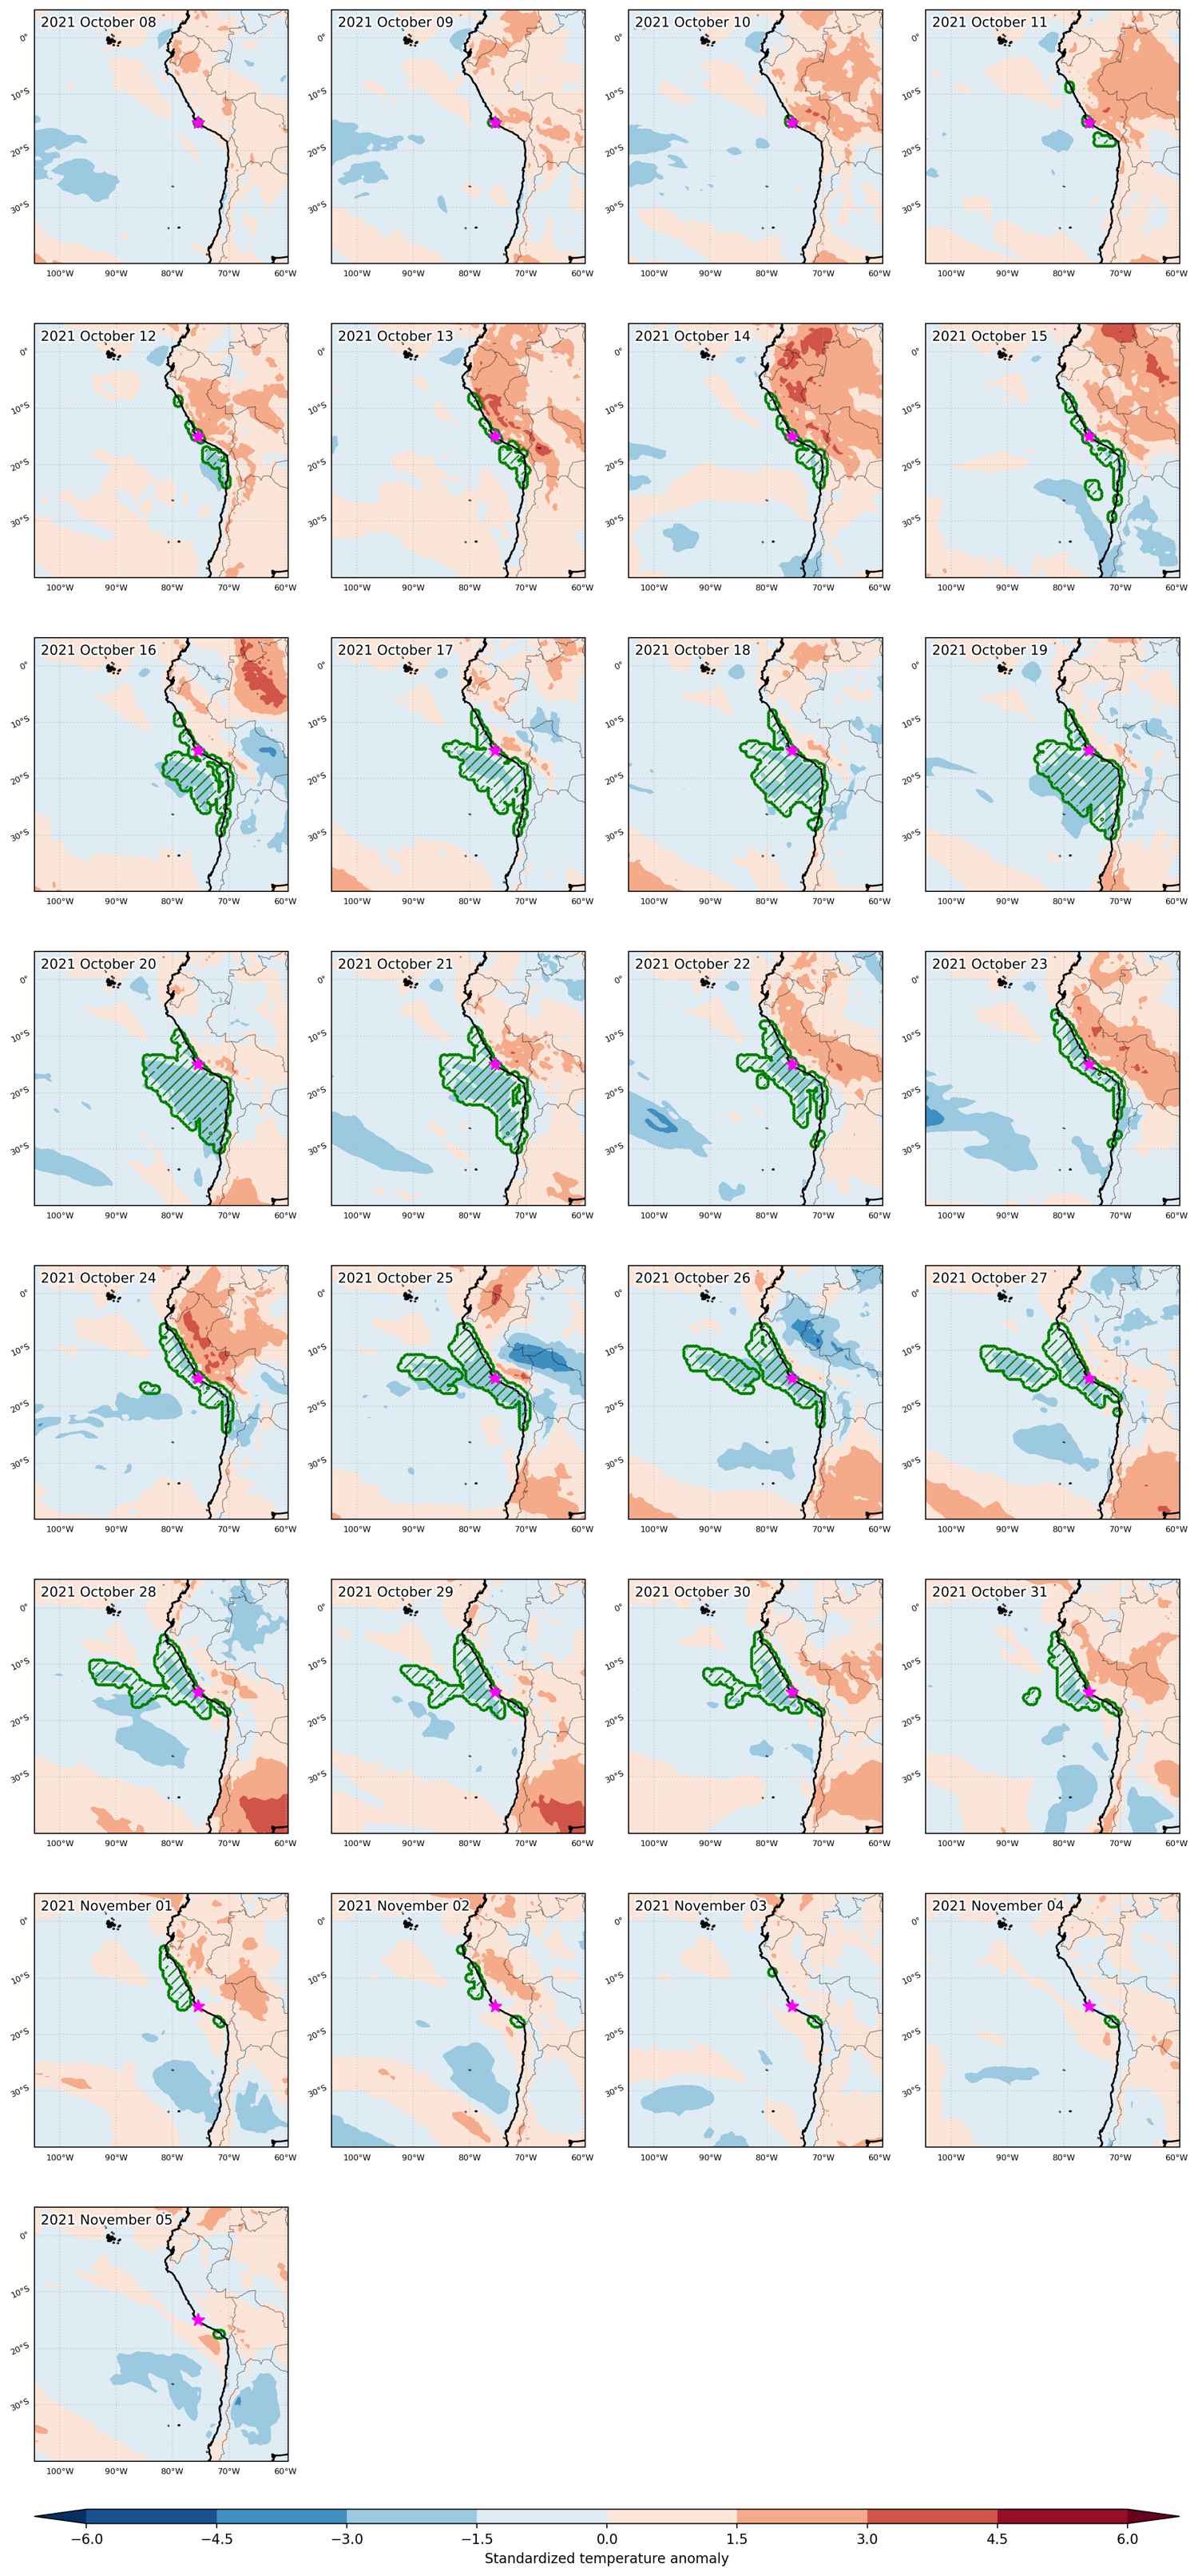
Cold spell occuring from October 08 2021 to November 05 2021 at -15.0°S 284.5°E

Download data: JSON

Event type: Cold spell

Countries affected (identified with ArcGIS Online; provided only for geographical reference):

  • Chile
  • Peru

Duration: 29 days

Time span: October 08 2021 to November 05 2021

Statistics over entire affected area:

  • Mean temperature anomaly: -1.2 °C
  • Mean temperature: 15.7 °C
  • Minimum temperature anomaly: -2.6 °C
  • Minimum temperature: 11.2 °C

Event center: -15.0°S 284.5°E

Area affected: 2377894 km$^2$


Fig. 1: Map of most extreme temperature anomalies (standardized) experienced during the event. The purple star indicates the center of the extreme event. Green hatching illustrates all areas under the effect of extremes at some time during the event.


Fig. 2: Evolution of temperature at the center of the event. The climatological percentile distribution is illustrated with color shadings.


Fig. 3: Maps illustrating the evolution of standardized temperature anomalies during the event.

Event ID: Cold_spell_2021-Oct-08_to_2021-Nov-05_284.5_-15.0

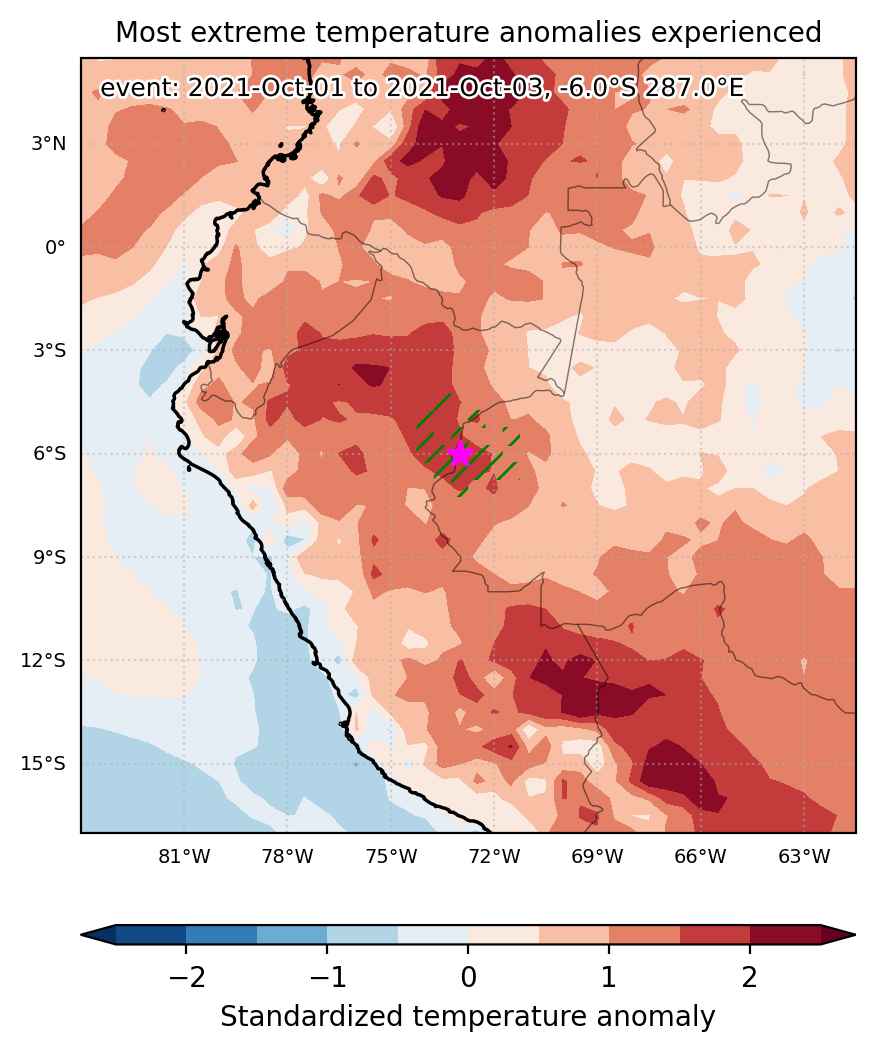
Heat wave occuring from October 01 2021 to October 03 2021 at -6.0°S 287.0°E

Download data: JSON

Event type: Heat wave

Countries affected (identified with ArcGIS Online; provided only for geographical reference):

  • Brazil
  • Peru

Duration: 3 days

Time span: October 01 2021 to October 03 2021

Statistics over entire affected area:

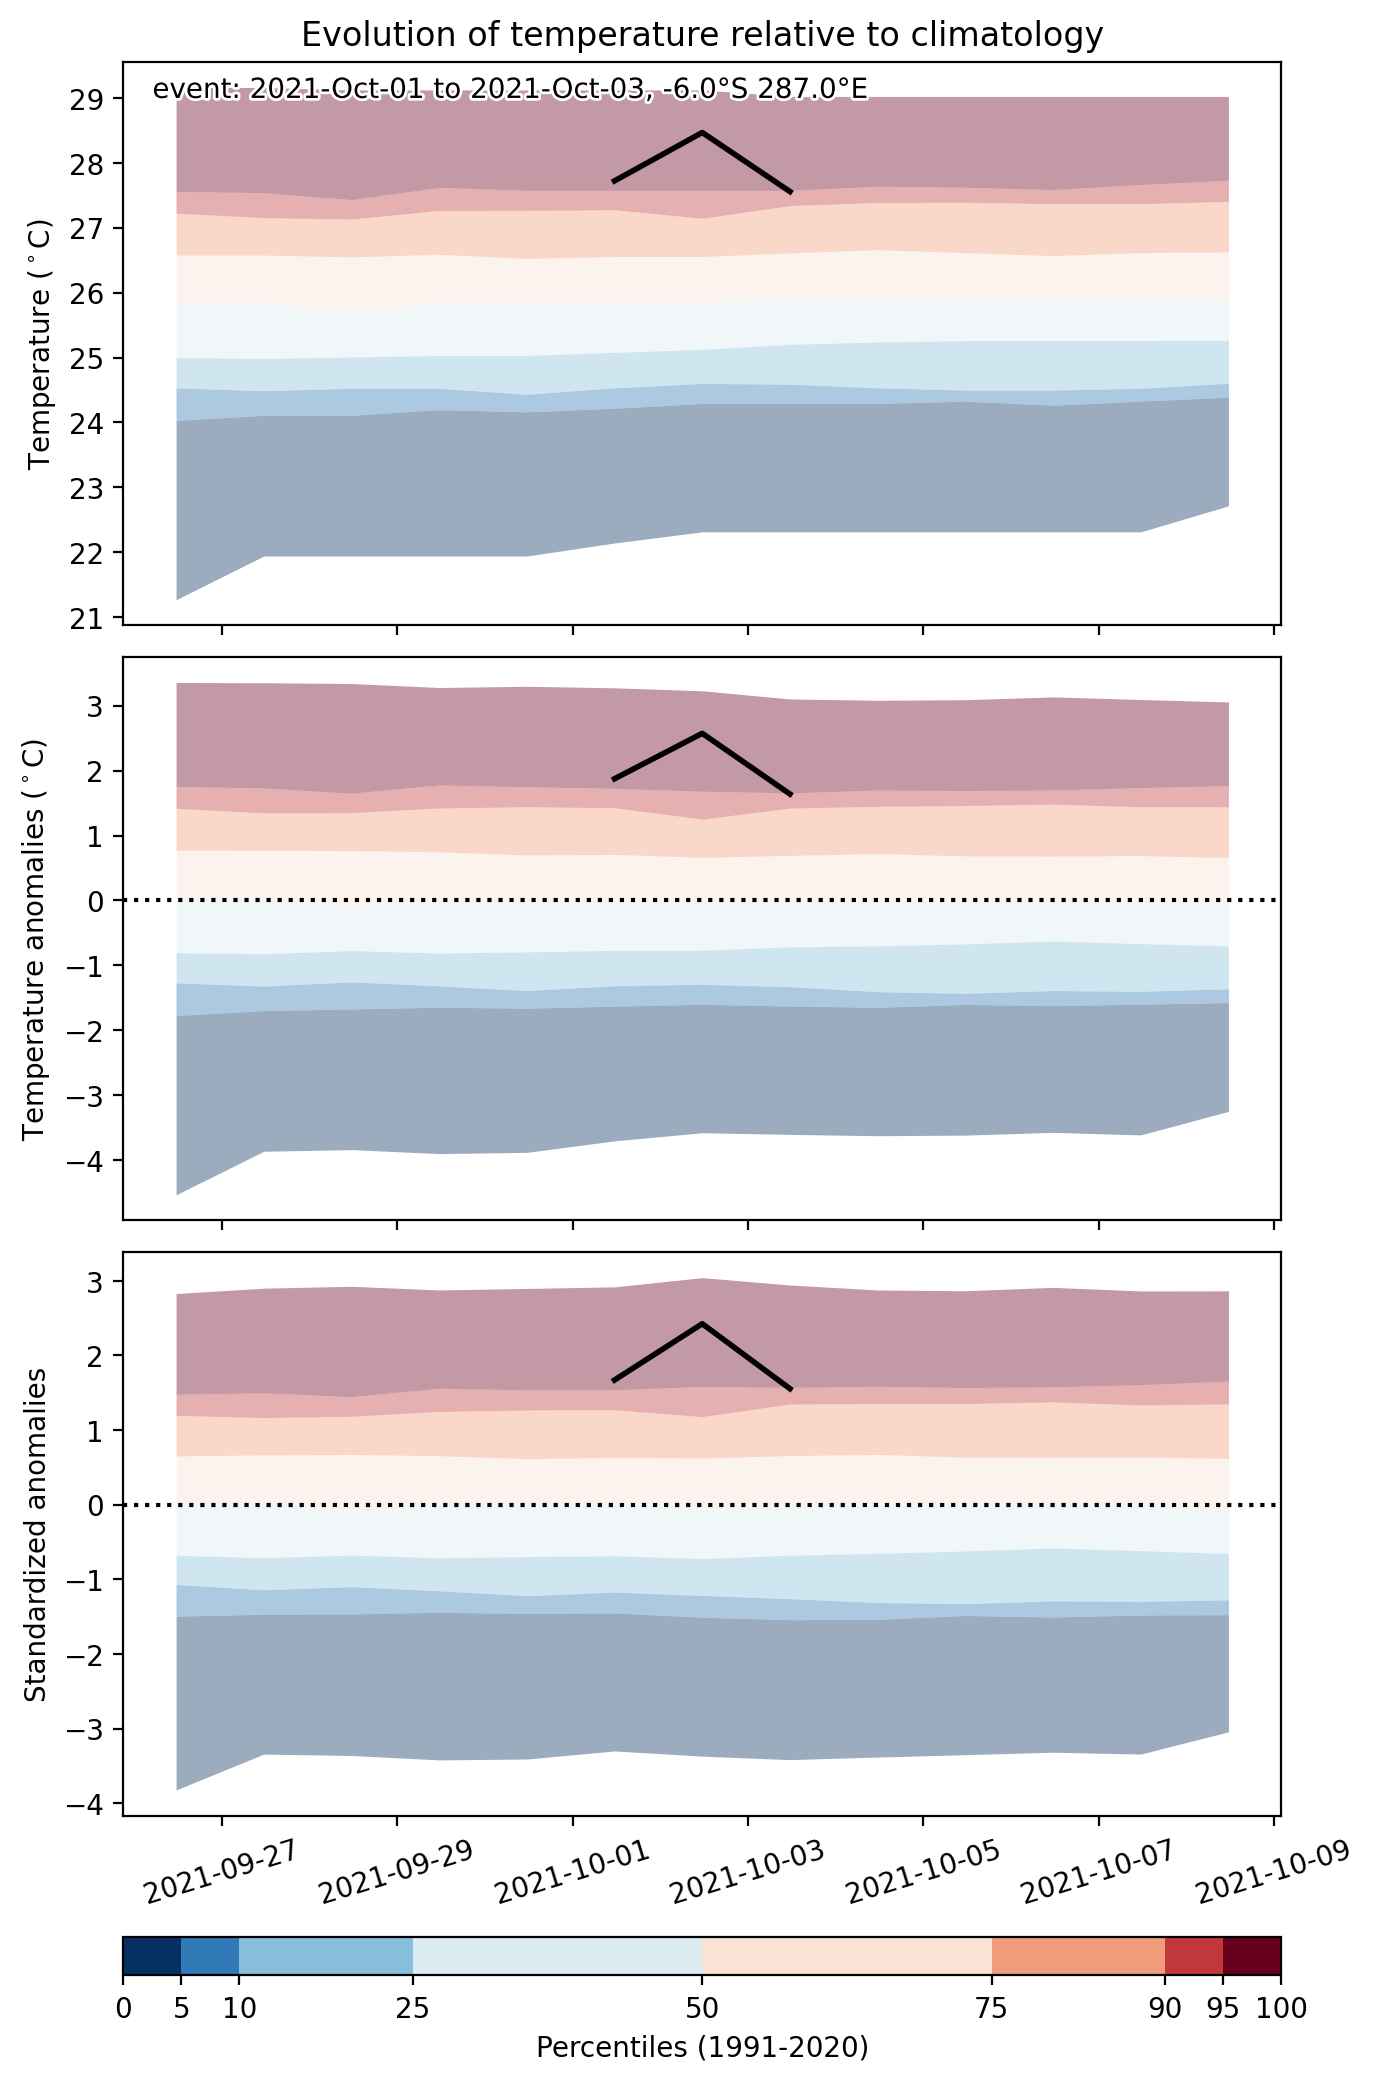
  • Mean temperature anomaly: 1.8 °C
  • Mean temperature: 27.8 °C
  • Maximum temperature anomaly: 2.6 °C
  • Maximum temperature: 28.7 °C

Event center: -6.0°S 287.0°E

Area affected: 52265 km$^2$


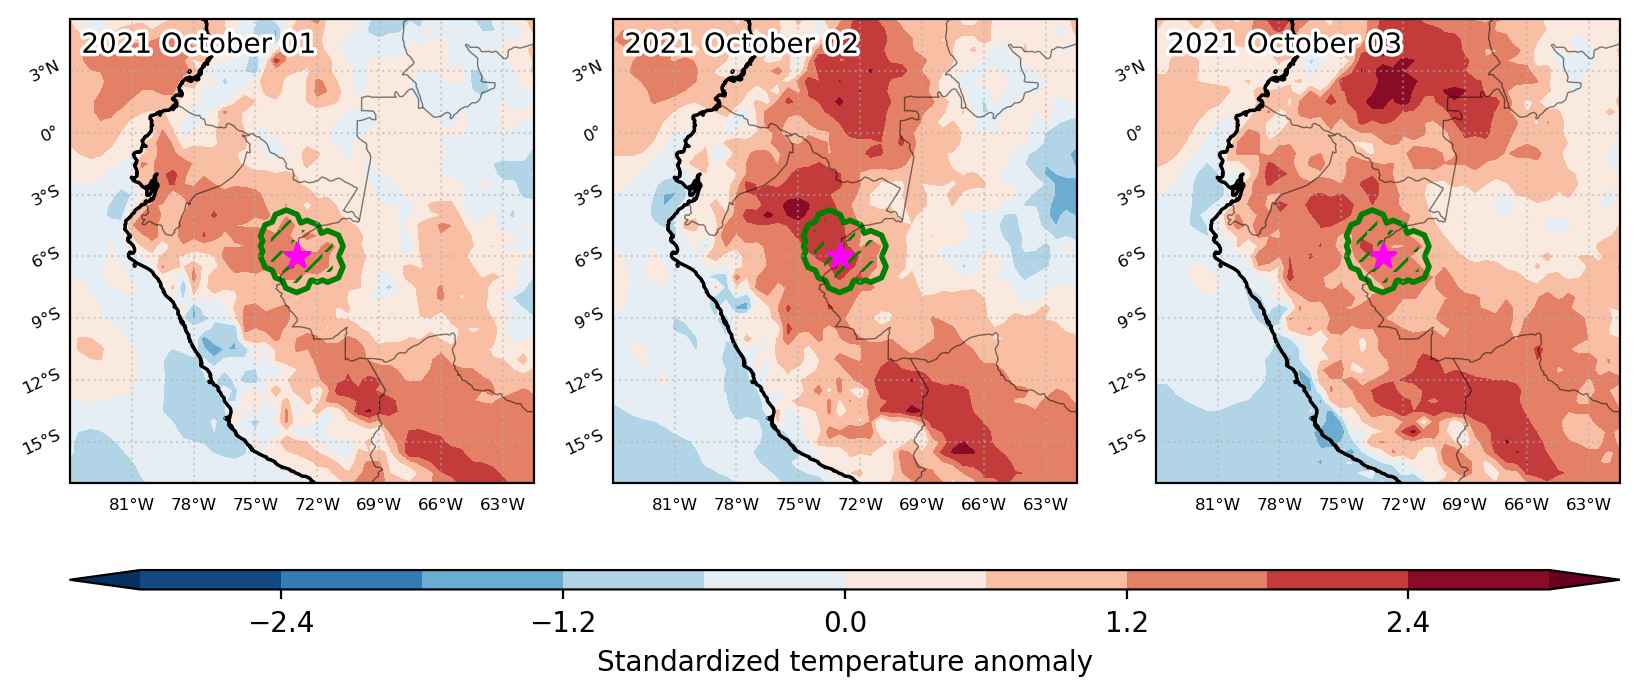
Fig. 1: Map of most extreme temperature anomalies (standardized) experienced during the event. The purple star indicates the center of the extreme event. Green hatching illustrates all areas under the effect of extremes at some time during the event.


Fig. 2: Evolution of temperature at the center of the event. The climatological percentile distribution is illustrated with color shadings.


Fig. 3: Maps illustrating the evolution of standardized temperature anomalies during the event.

Event ID: Heat_wave_2021-Oct-01_to_2021-Oct-03_287.0_-6.0

Heat wave occuring from September 23 2021 to October 30 2021 at -13.5°S 290.5°E

Download data: JSON

Event type: Heat wave

Countries affected (identified with ArcGIS Online; provided only for geographical reference):

  • Argentina
  • Bolivia, Plurinational State of
  • Brazil
  • Chile
  • Colombia
  • Ecuador
  • Paraguay
  • Peru
  • Venezuela, Bolivarian Republic of

Duration: 38 days

Time span: September 23 2021 to October 30 2021

Statistics over entire affected area:

  • Mean temperature anomaly: 2.9 °C
  • Mean temperature: 25.8 °C
  • Maximum temperature anomaly: 9.1 °C
  • Maximum temperature: 36.0 °C

Event center: -13.5°S 290.5°E

Area affected: 5873985 km$^2$


Fig. 1: Map of most extreme temperature anomalies (standardized) experienced during the event. The purple star indicates the center of the extreme event. Green hatching illustrates all areas under the effect of extremes at some time during the event.


Fig. 2: Evolution of temperature at the center of the event. The climatological percentile distribution is illustrated with color shadings.


Fig. 3: Maps illustrating the evolution of standardized temperature anomalies during the event.

Event ID: Heat_wave_2021-Sep-23_to_2021-Oct-30_290.5_-13.5

Cold spell occuring from September 21 2021 to September 26 2021 at -8.5°S 283.0°E

Download data: JSON

Event type: Cold spell

Countries affected (identified with ArcGIS Online; provided only for geographical reference):

  • Peru

Duration: 6 days

Time span: September 21 2021 to September 26 2021

Statistics over entire affected area:

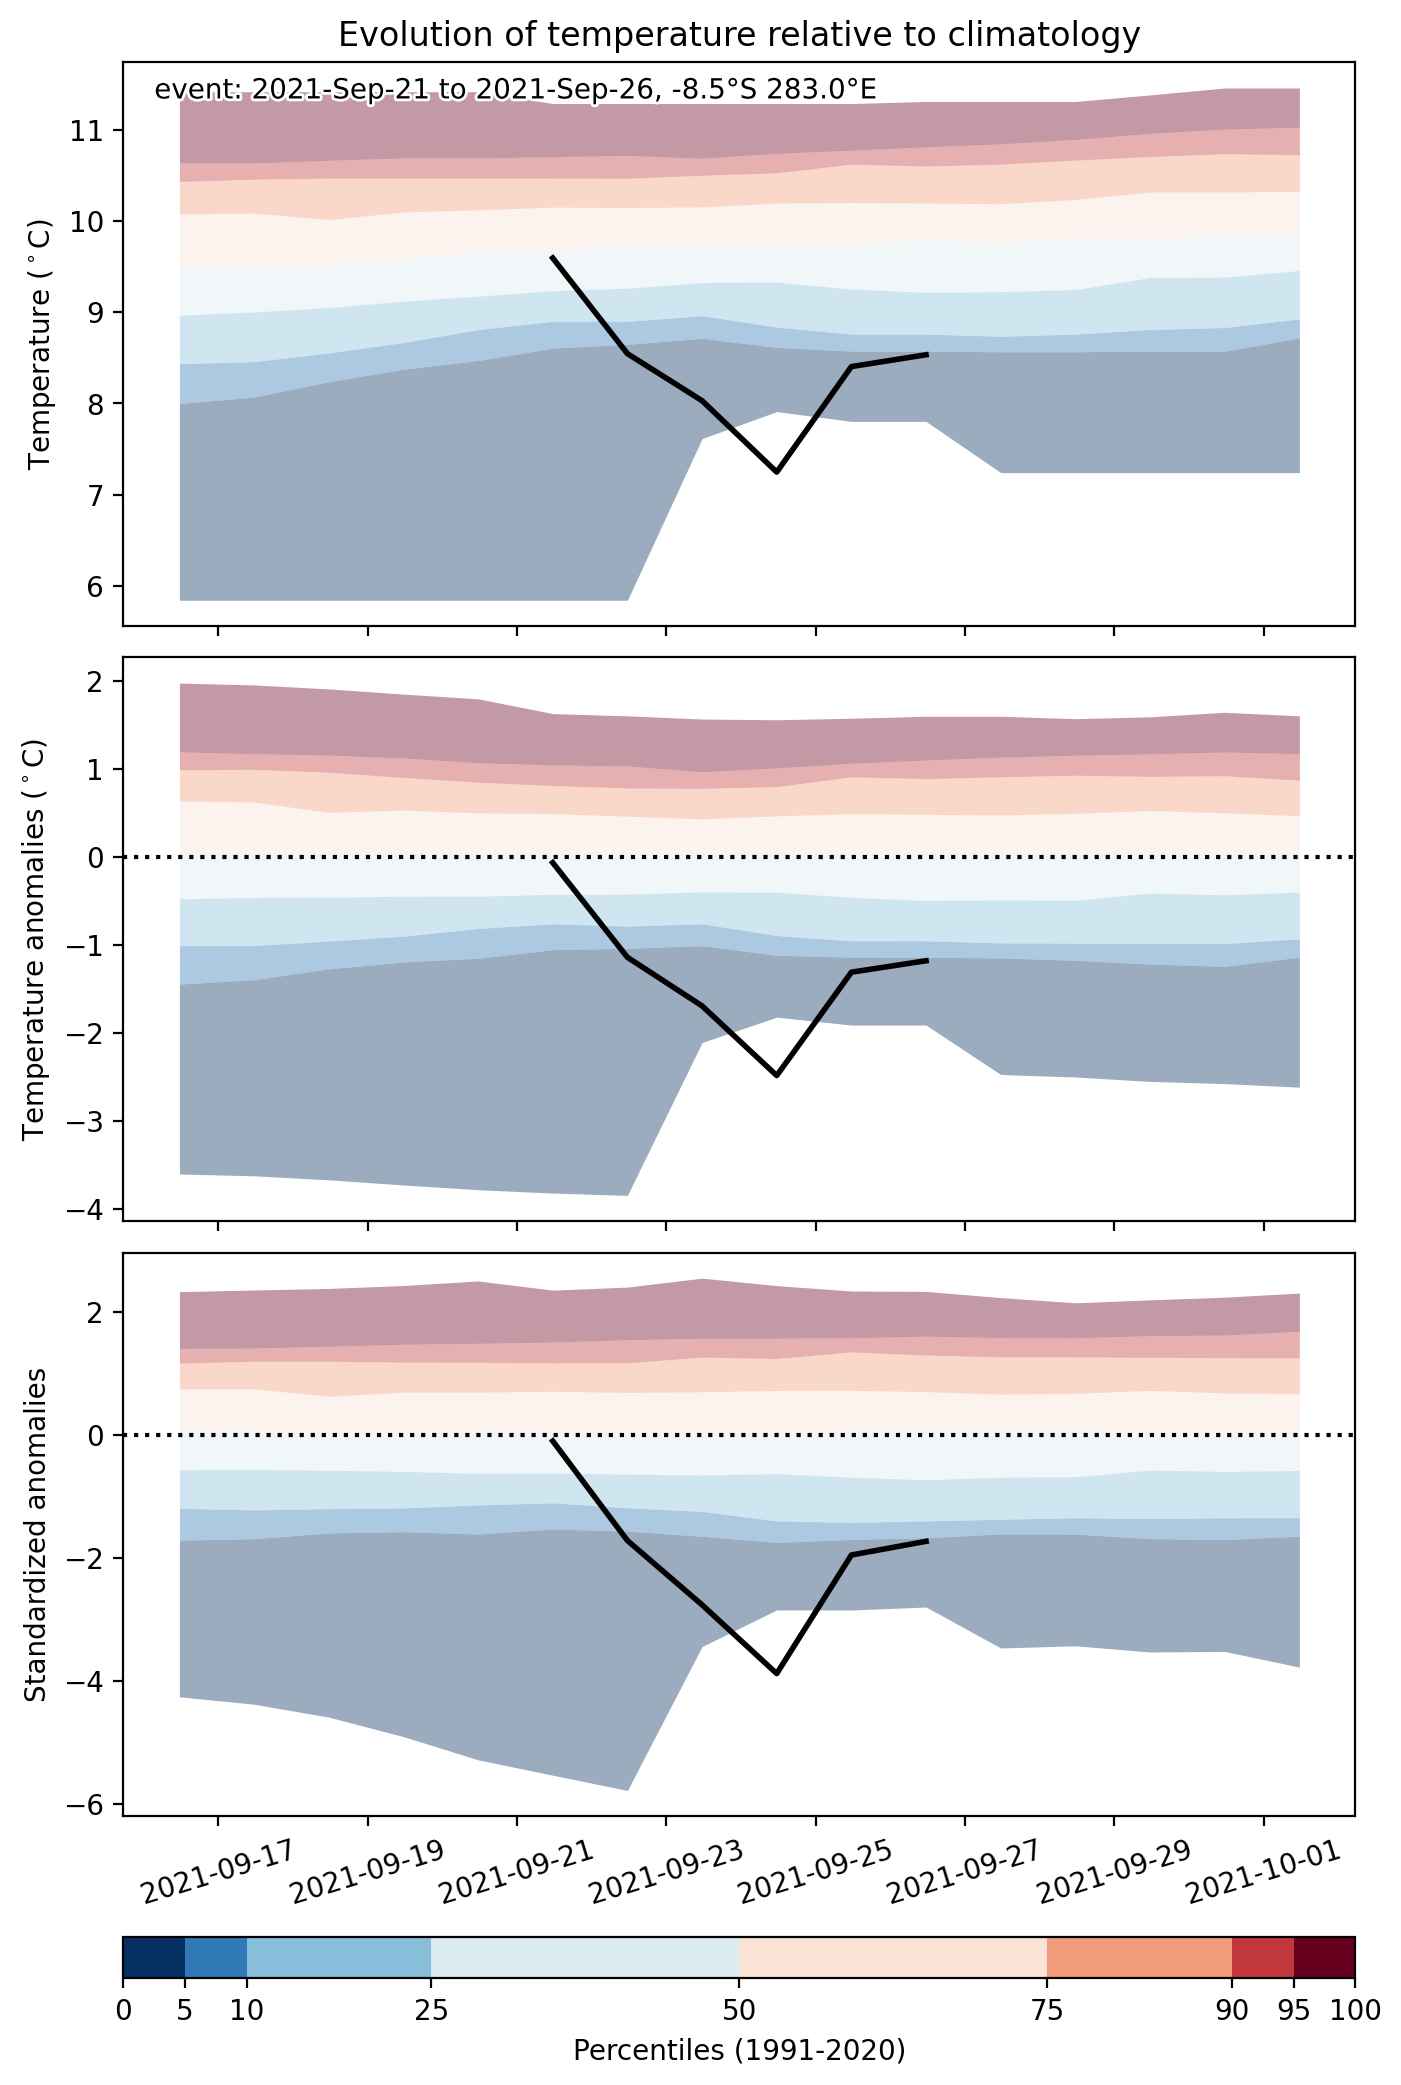
  • Mean temperature anomaly: -1.5 °C
  • Mean temperature: 6.2 °C
  • Minimum temperature anomaly: -2.8 °C
  • Minimum temperature: 0.5 °C

Event center: -8.5°S 283.0°E

Area affected: 79076 km$^2$


Fig. 1: Map of most extreme temperature anomalies (standardized) experienced during the event. The purple star indicates the center of the extreme event. Green hatching illustrates all areas under the effect of extremes at some time during the event.


Fig. 2: Evolution of temperature at the center of the event. The climatological percentile distribution is illustrated with color shadings.


Fig. 3: Maps illustrating the evolution of standardized temperature anomalies during the event.

Event ID: Cold_spell_2021-Sep-21_to_2021-Sep-26_283.0_-8.5

Heat wave occuring from September 18 2021 to September 21 2021 at -13.5°S 290.5°E

Download data: JSON

Event type: Heat wave

Countries affected (identified with ArcGIS Online; provided only for geographical reference):

  • Bolivia, Plurinational State of
  • Peru

Duration: 4 days

Time span: September 18 2021 to September 21 2021

Statistics over entire affected area:

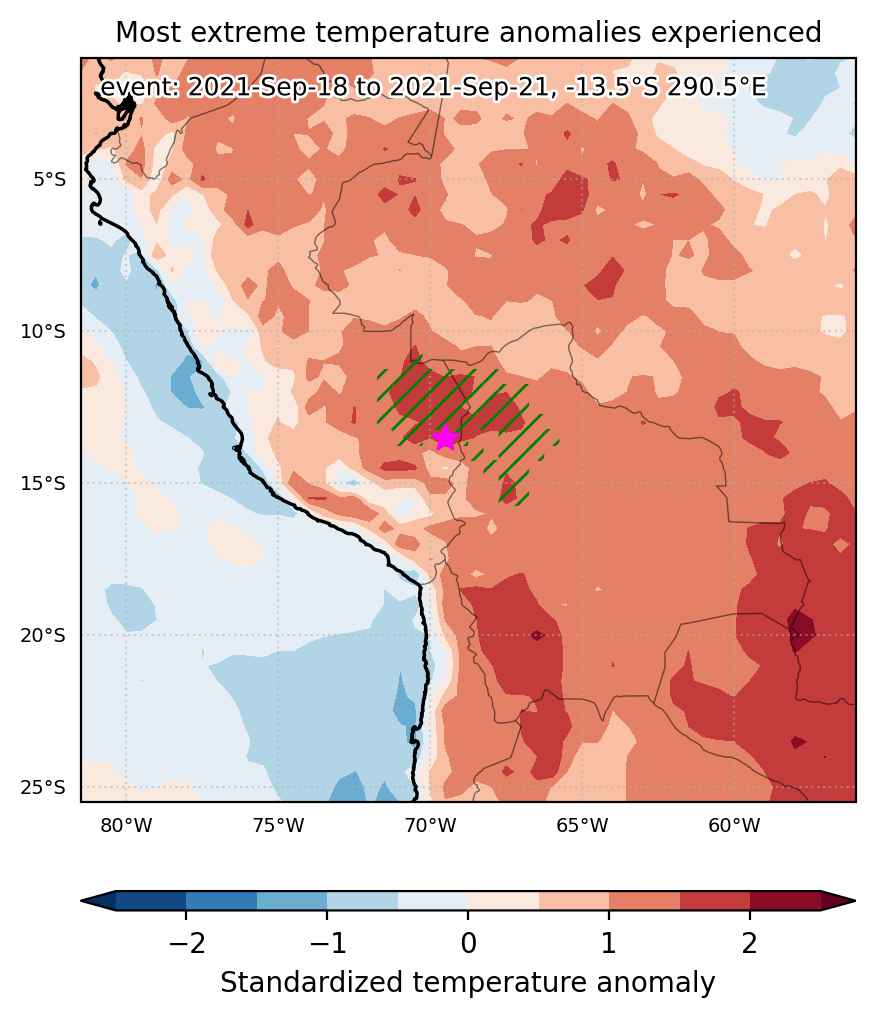
  • Mean temperature anomaly: 3.3 °C
  • Mean temperature: 28.1 °C
  • Maximum temperature anomaly: 4.9 °C
  • Maximum temperature: 32.1 °C

Event center: -13.5°S 290.5°E

Area affected: 177759 km$^2$


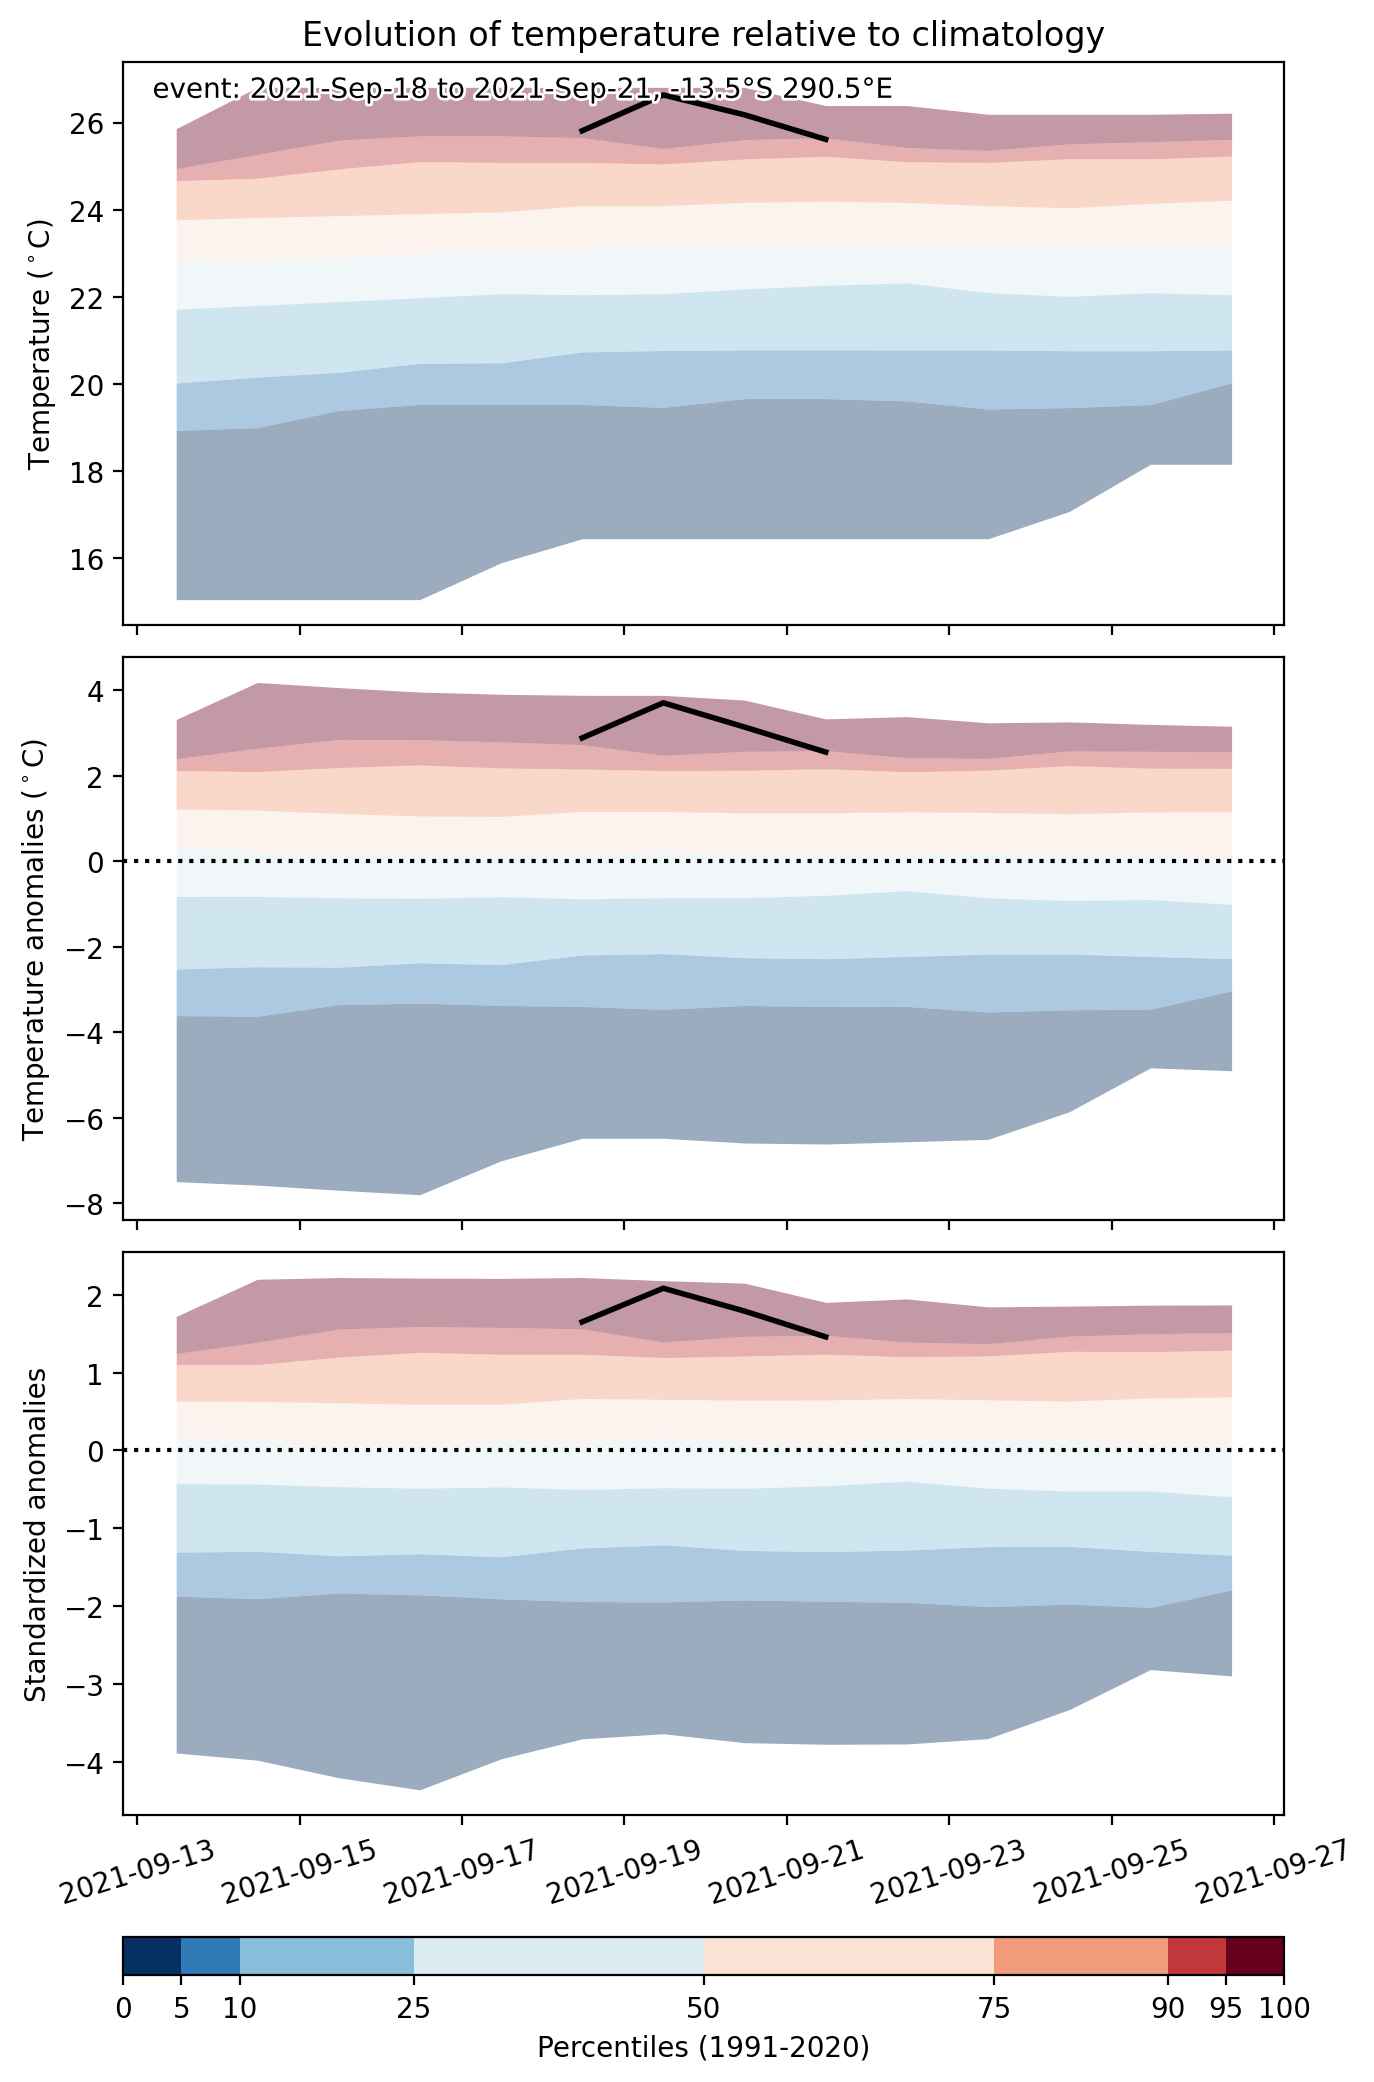
Fig. 1: Map of most extreme temperature anomalies (standardized) experienced during the event. The purple star indicates the center of the extreme event. Green hatching illustrates all areas under the effect of extremes at some time during the event.


Fig. 2: Evolution of temperature at the center of the event. The climatological percentile distribution is illustrated with color shadings.


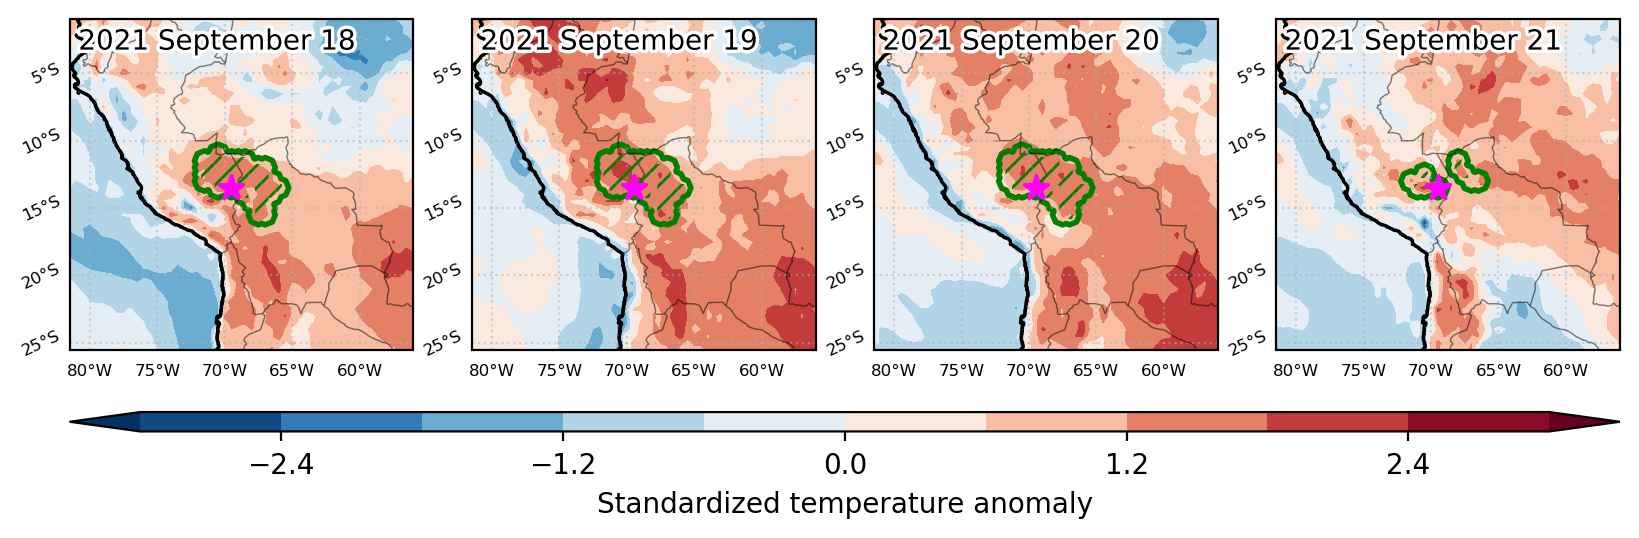
Fig. 3: Maps illustrating the evolution of standardized temperature anomalies during the event.

Event ID: Heat_wave_2021-Sep-18_to_2021-Sep-21_290.5_-13.5

Heat wave occuring from September 12 2021 to September 17 2021 at -16.5°S 290.0°E

Download data: JSON

Event type: Heat wave

Countries affected (identified with ArcGIS Online; provided only for geographical reference):

  • Bolivia, Plurinational State of
  • Peru

Duration: 6 days

Time span: September 12 2021 to September 17 2021

Statistics over entire affected area:

  • Mean temperature anomaly: 2.4 °C
  • Mean temperature: 13.8 °C
  • Maximum temperature anomaly: 4.4 °C
  • Maximum temperature: 28.0 °C

Event center: -16.5°S 290.0°E

Area affected: 86174 km$^2$


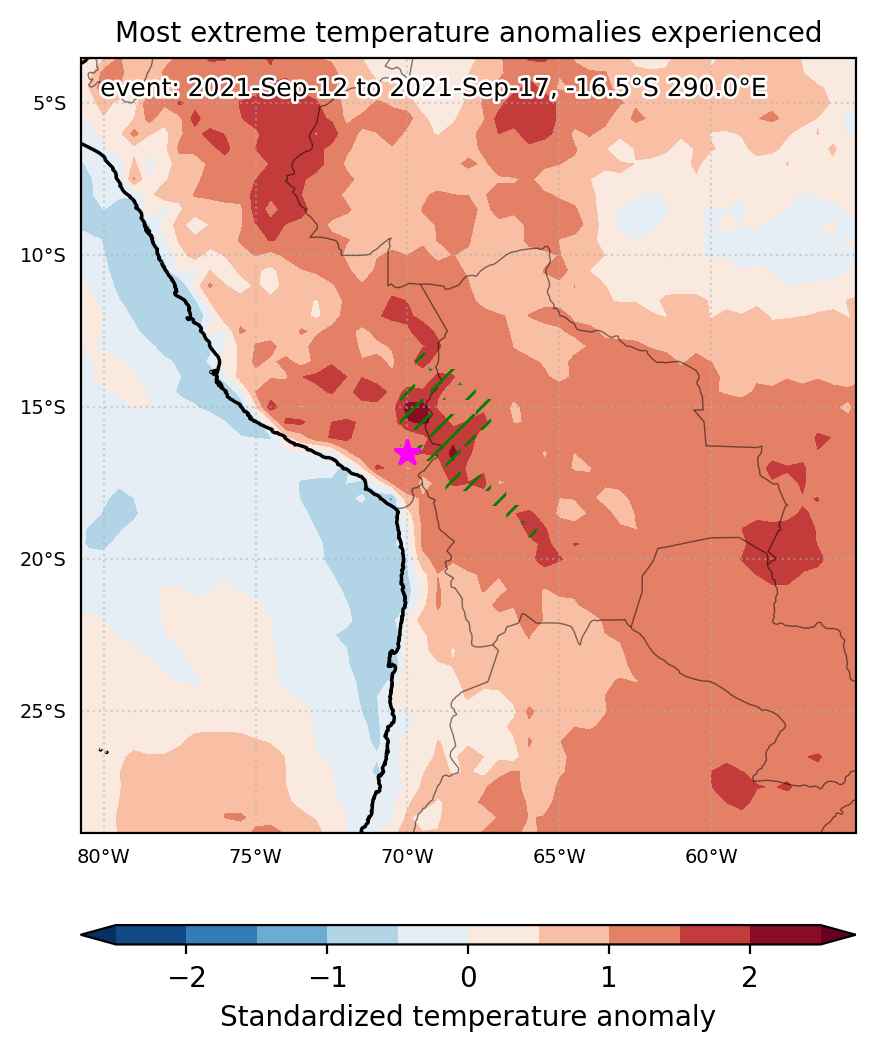
Fig. 1: Map of most extreme temperature anomalies (standardized) experienced during the event. The purple star indicates the center of the extreme event. Green hatching illustrates all areas under the effect of extremes at some time during the event.


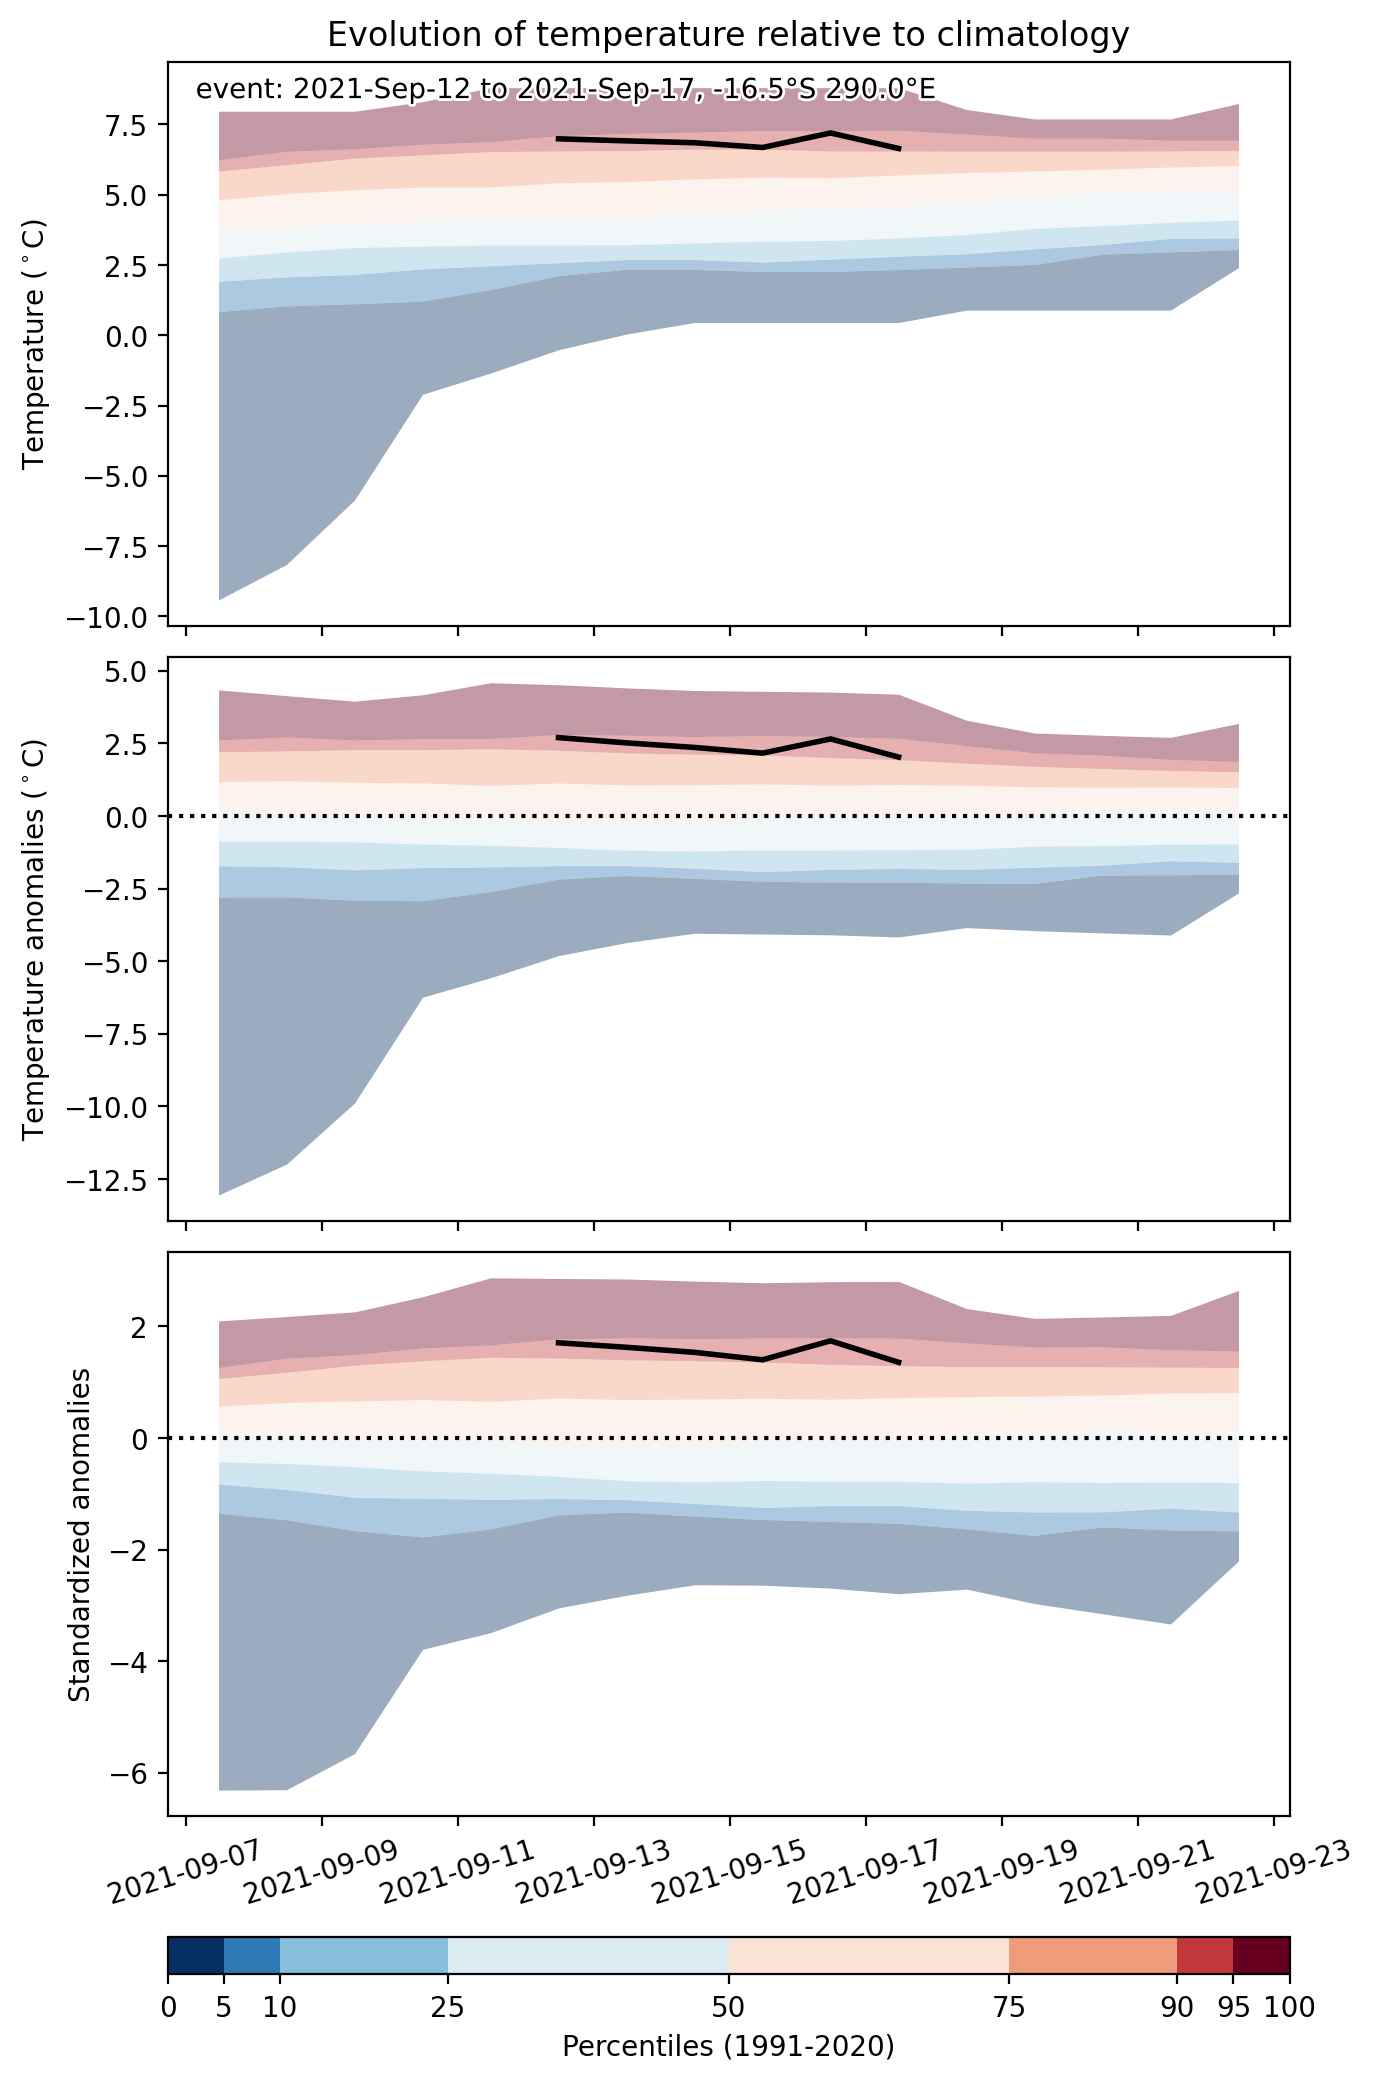
Fig. 2: Evolution of temperature at the center of the event. The climatological percentile distribution is illustrated with color shadings.


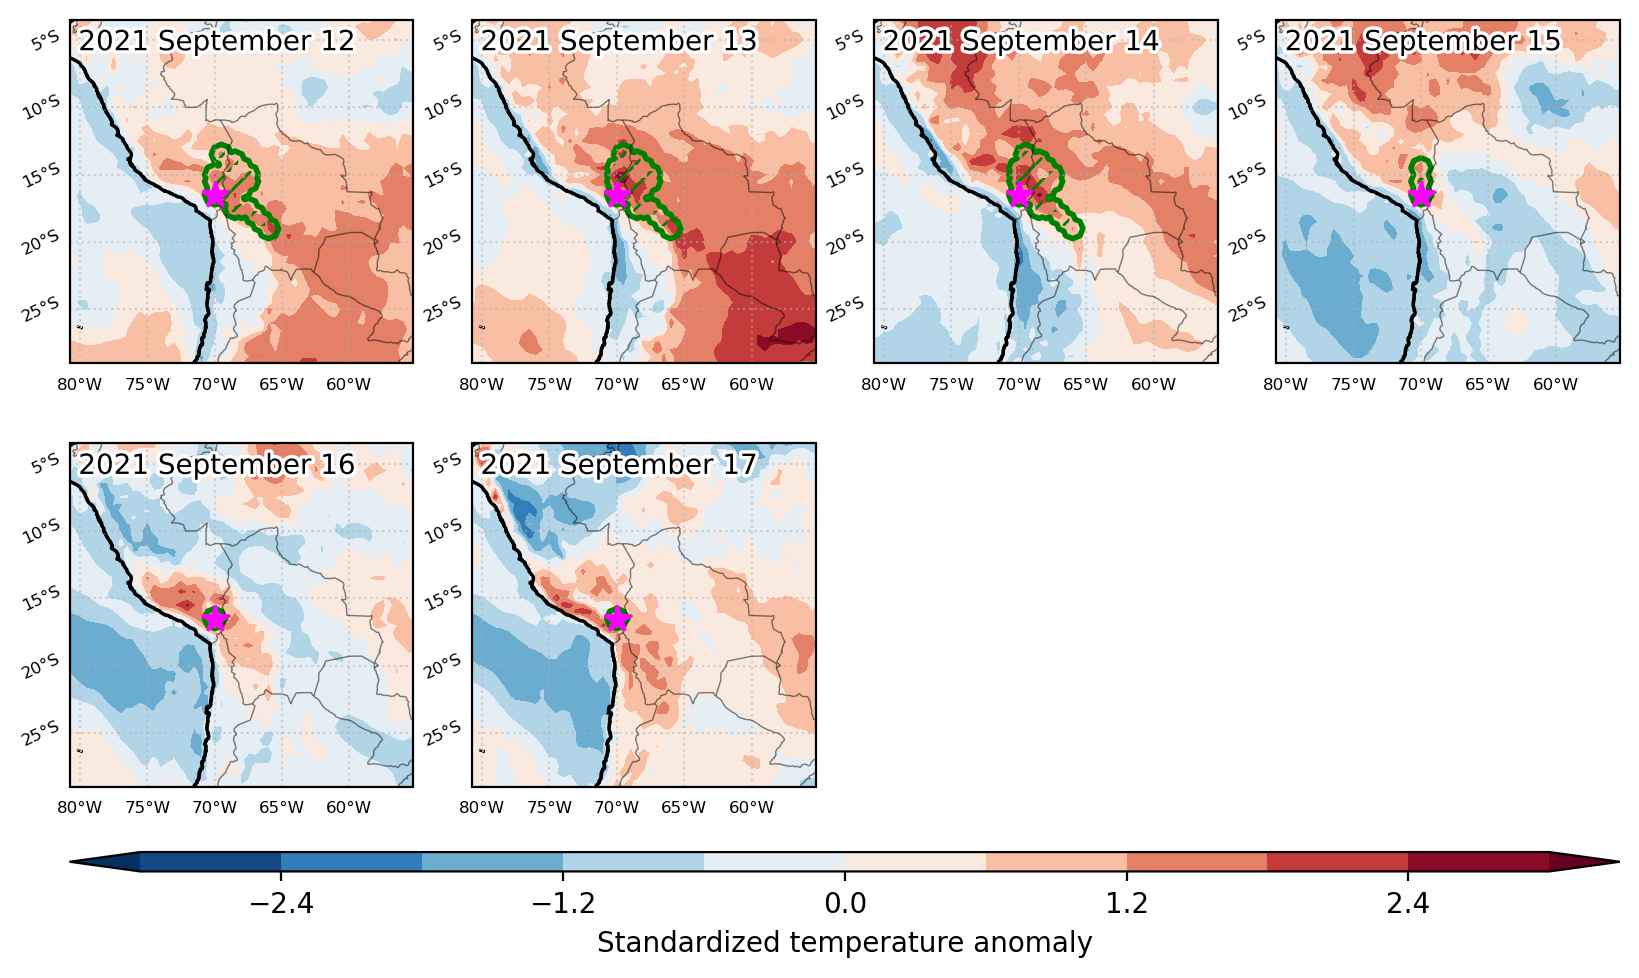
Fig. 3: Maps illustrating the evolution of standardized temperature anomalies during the event.

Event ID: Heat_wave_2021-Sep-12_to_2021-Sep-17_290.0_-16.5

Heat wave occuring from September 02 2021 to September 05 2021 at -5.5°S 289.5°E

Download data: JSON

Event type: Heat wave

Countries affected (identified with ArcGIS Online; provided only for geographical reference):

  • Brazil
  • Colombia
  • Peru

Duration: 4 days

Time span: September 02 2021 to September 05 2021

Statistics over entire affected area:

  • Mean temperature anomaly: 1.6 °C
  • Mean temperature: 27.0 °C
  • Maximum temperature anomaly: 2.9 °C
  • Maximum temperature: 28.5 °C

Event center: -5.5°S 289.5°E

Area affected: 95617 km$^2$


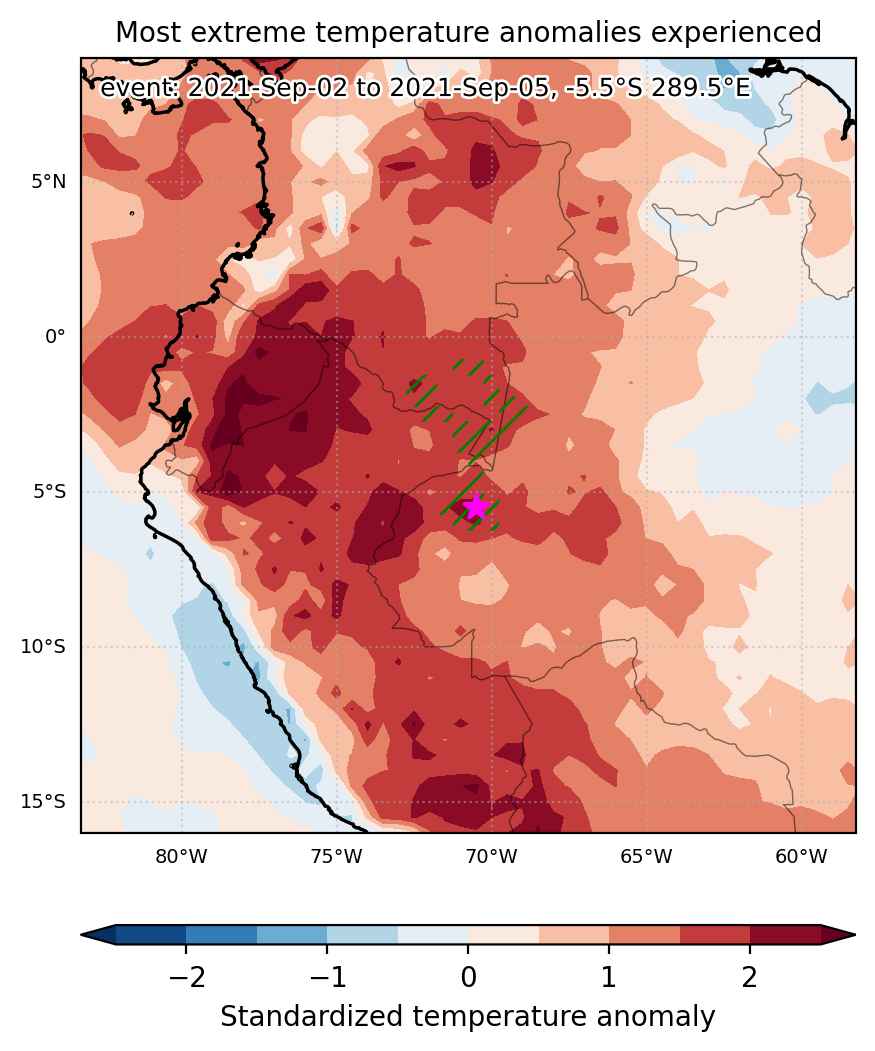
Fig. 1: Map of most extreme temperature anomalies (standardized) experienced during the event. The purple star indicates the center of the extreme event. Green hatching illustrates all areas under the effect of extremes at some time during the event.


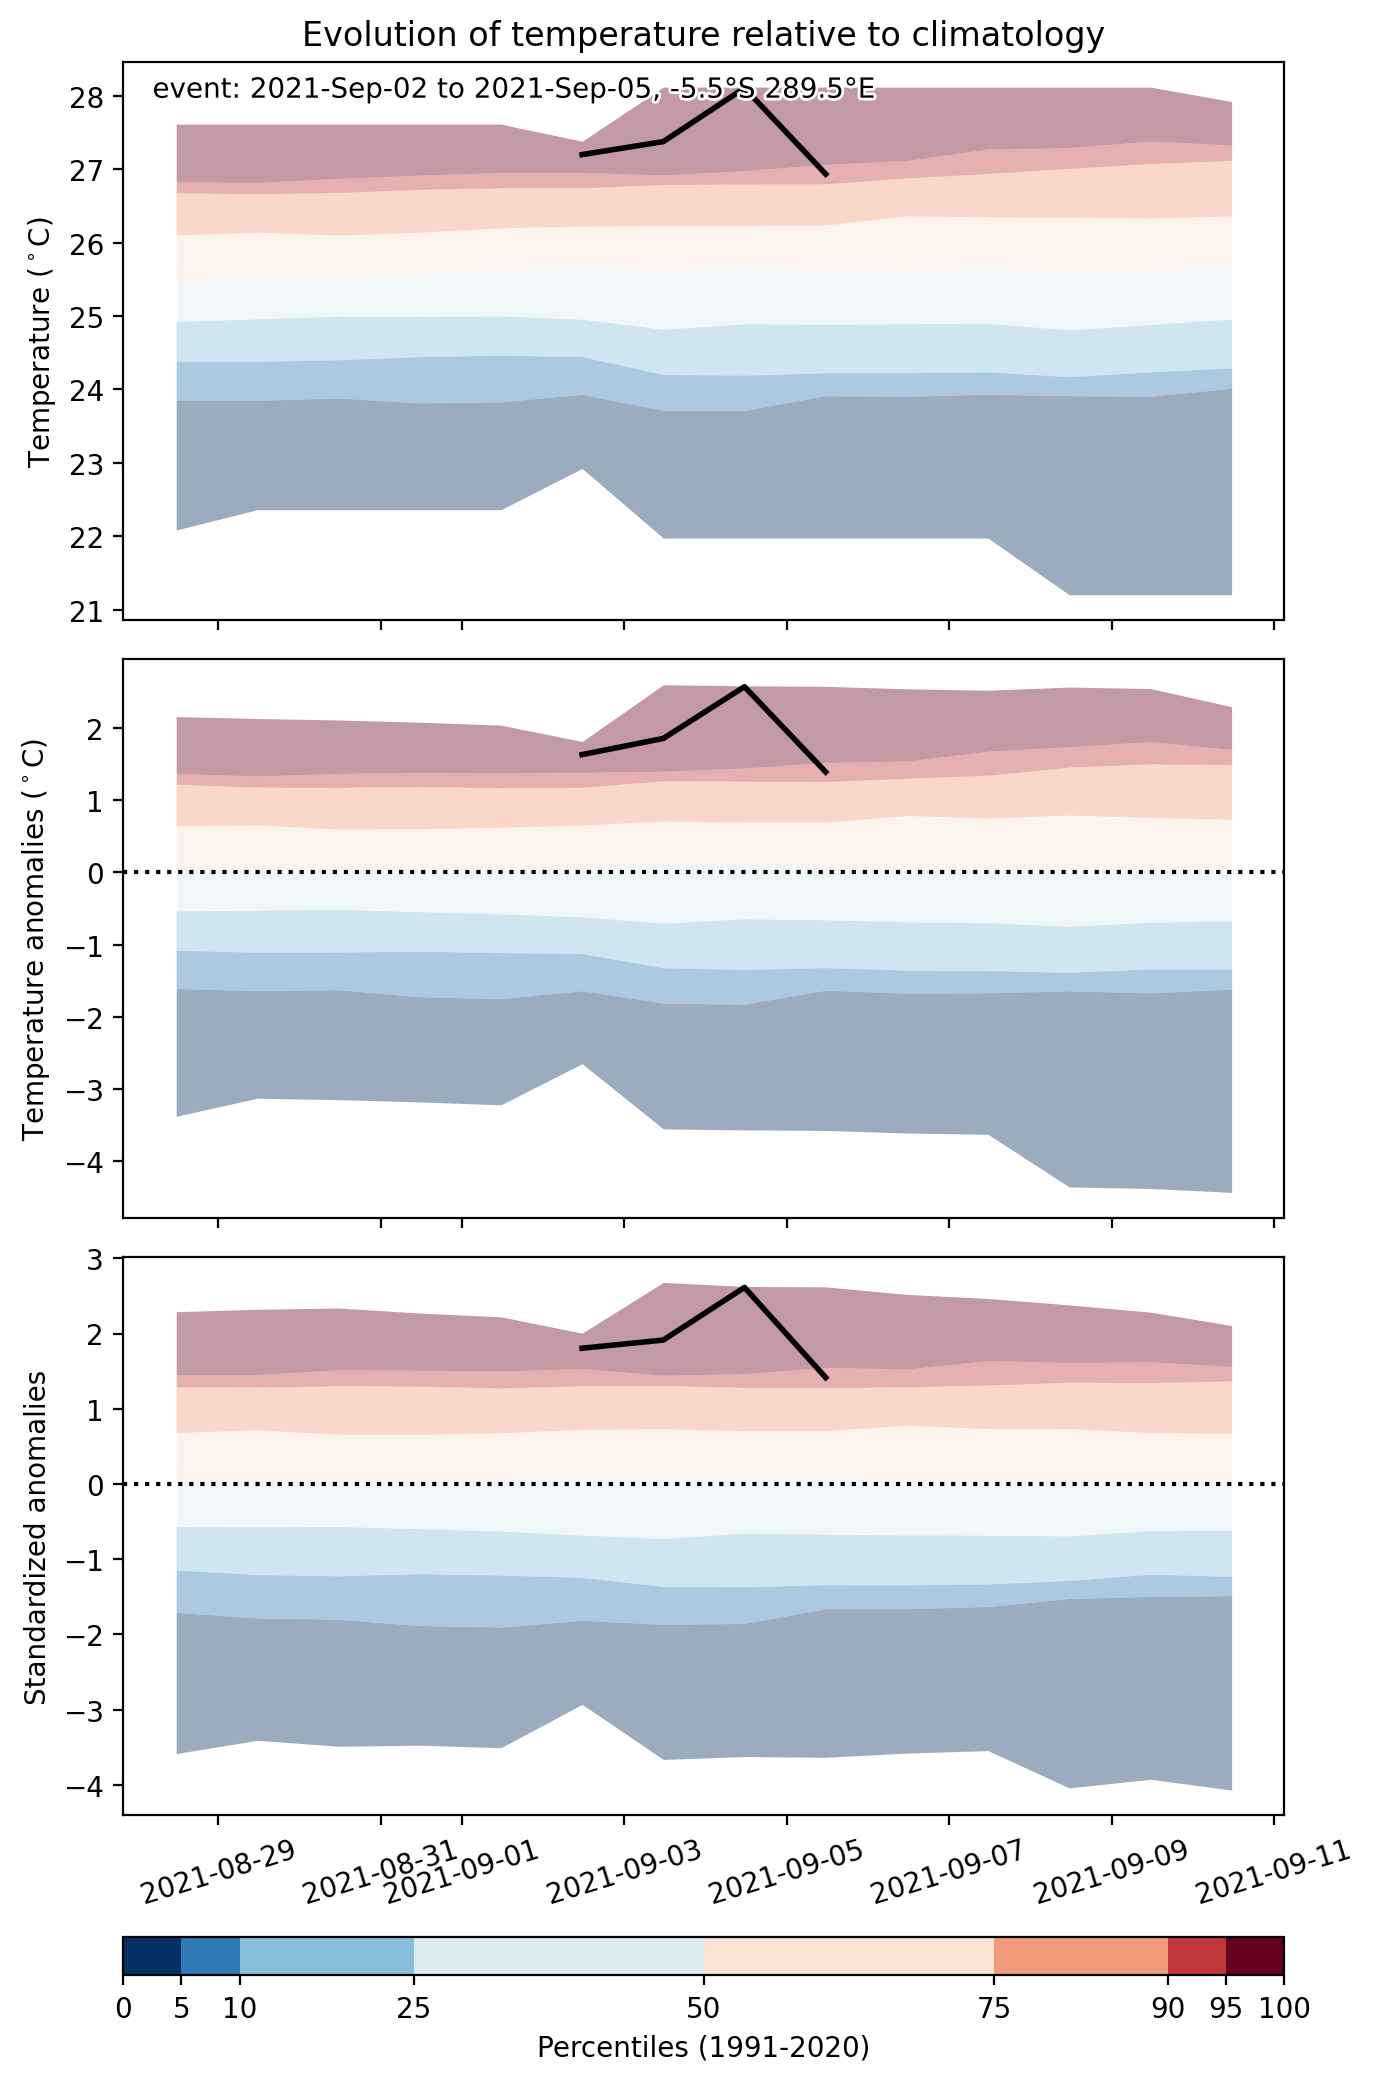
Fig. 2: Evolution of temperature at the center of the event. The climatological percentile distribution is illustrated with color shadings.


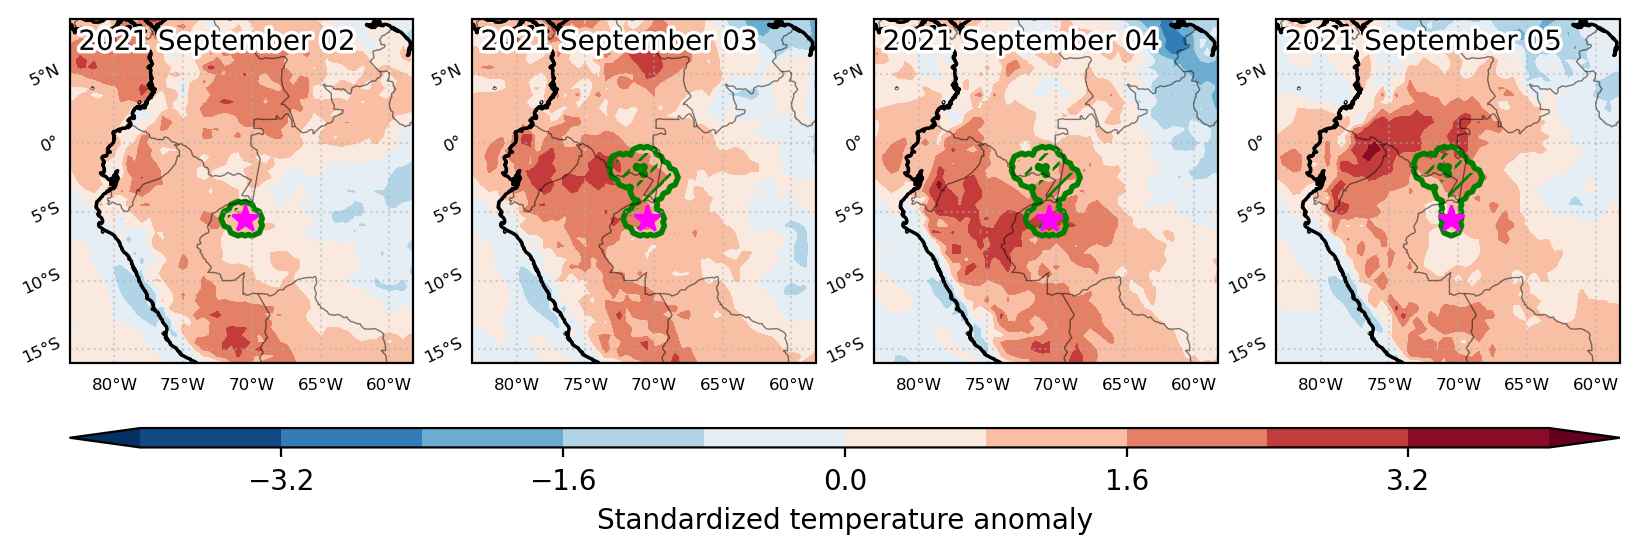
Fig. 3: Maps illustrating the evolution of standardized temperature anomalies during the event.

Event ID: Heat_wave_2021-Sep-02_to_2021-Sep-05_289.5_-5.5