Heat wave occuring from July 21 2026 to July 28 2026 at 58.0°N 133.5°E

Download data: JSON

Event type: Heat wave

Countries affected (identified with ArcGIS Online; provided only for geographical reference):

  • Russian Federation

Duration: 8 days

Time span: July 21 2026 to July 28 2026

Statistics over entire affected area:

  • Mean temperature anomaly: 5.3 °C
  • Mean temperature: 21.3 °C
  • Maximum temperature anomaly: 9.2 °C
  • Maximum temperature: 27.9 °C

Event center: 58.0°N 133.5°E

Area affected: 469692 km$^2$
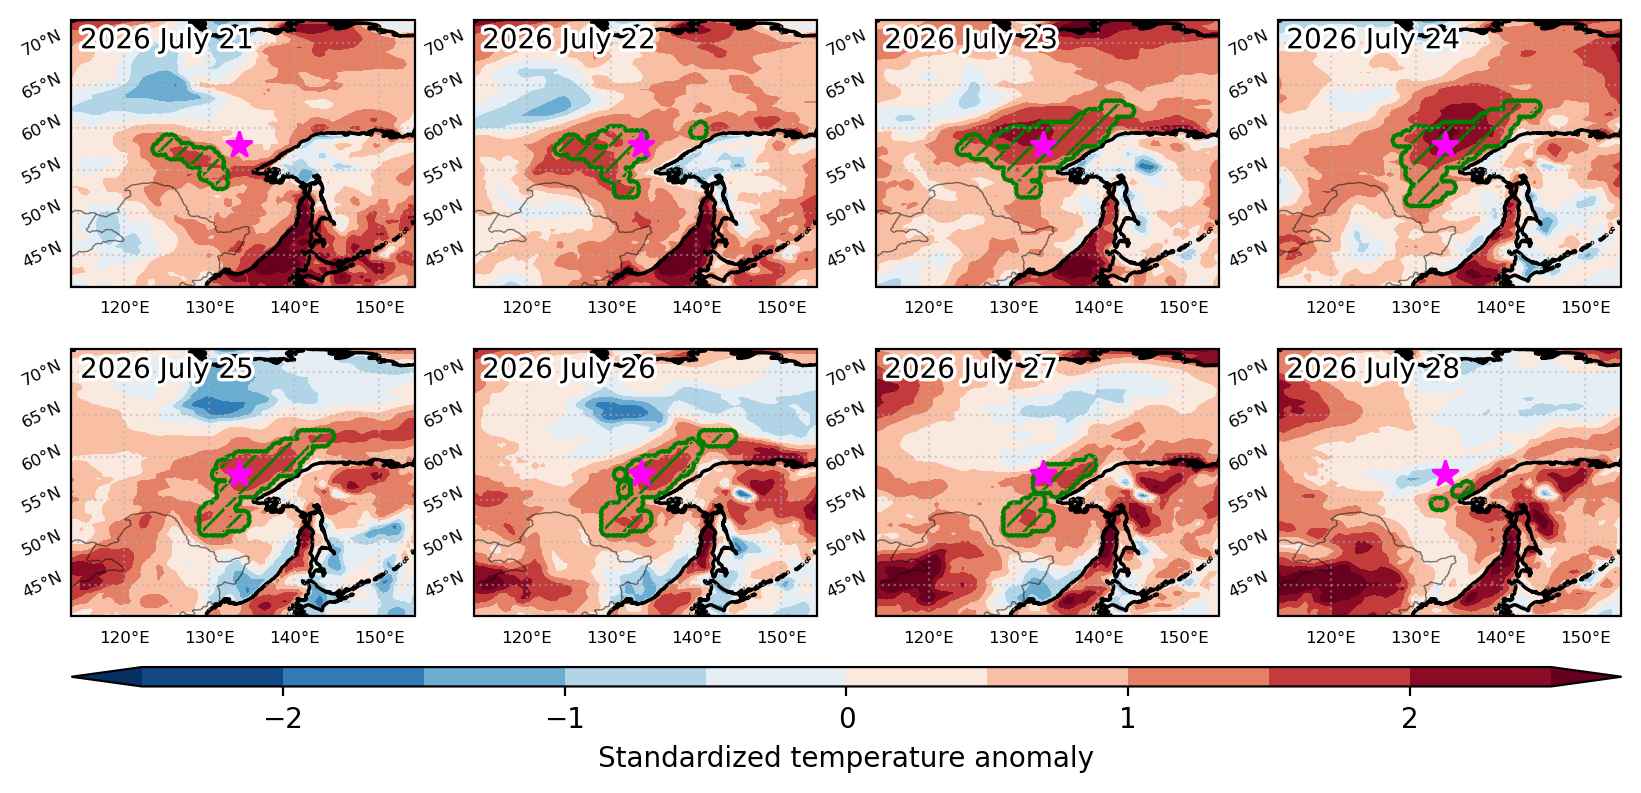


Fig. 3: Maps illustrating the evolution of standardized temperature anomalies during the event.

Event ID: Heat_wave_2026-Jul-21_to_2026-Jul-28_133.5_58.0
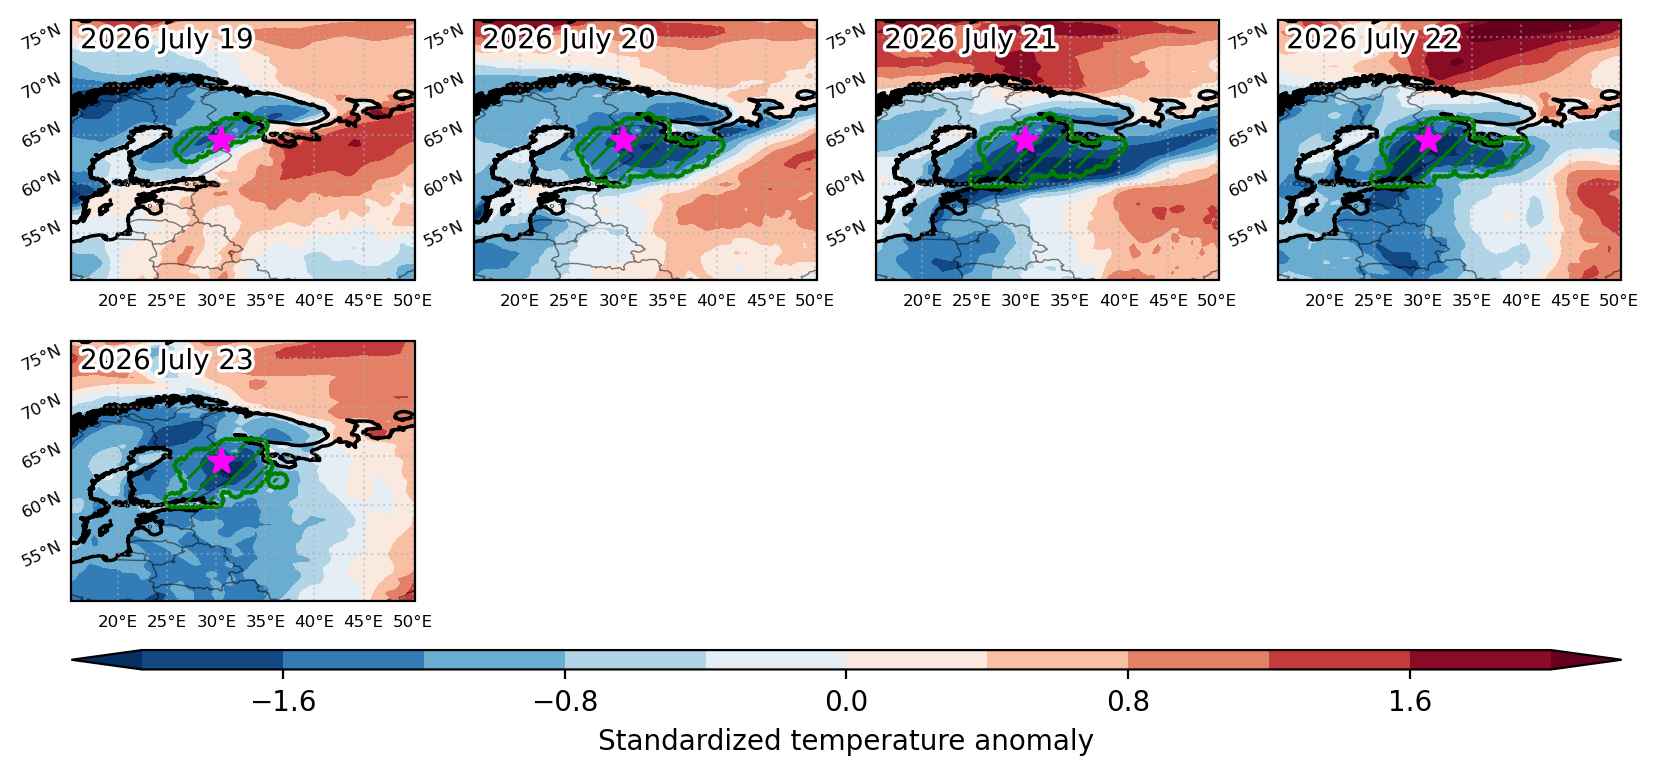
Cold spell occuring from July 19 2026 to July 23 2026 at 64.5°N 30.5°E

Download data: JSON

Event type: Cold spell

Countries affected (identified with ArcGIS Online; provided only for geographical reference):

  • Finland
  • Russian Federation

Duration: 5 days

Time span: July 19 2026 to July 23 2026

Statistics over entire affected area:

  • Mean temperature anomaly: -5.3 °C
  • Mean temperature: 11.7 °C
  • Minimum temperature anomaly: -7.5 °C
  • Minimum temperature: 9.5 °C

Event center: 64.5°N 30.5°E

Area affected: 274372 km$^2$


Fig. 3: Maps illustrating the evolution of standardized temperature anomalies during the event.

Event ID: Cold_spell_2026-Jul-19_to_2026-Jul-23_30.5_64.5

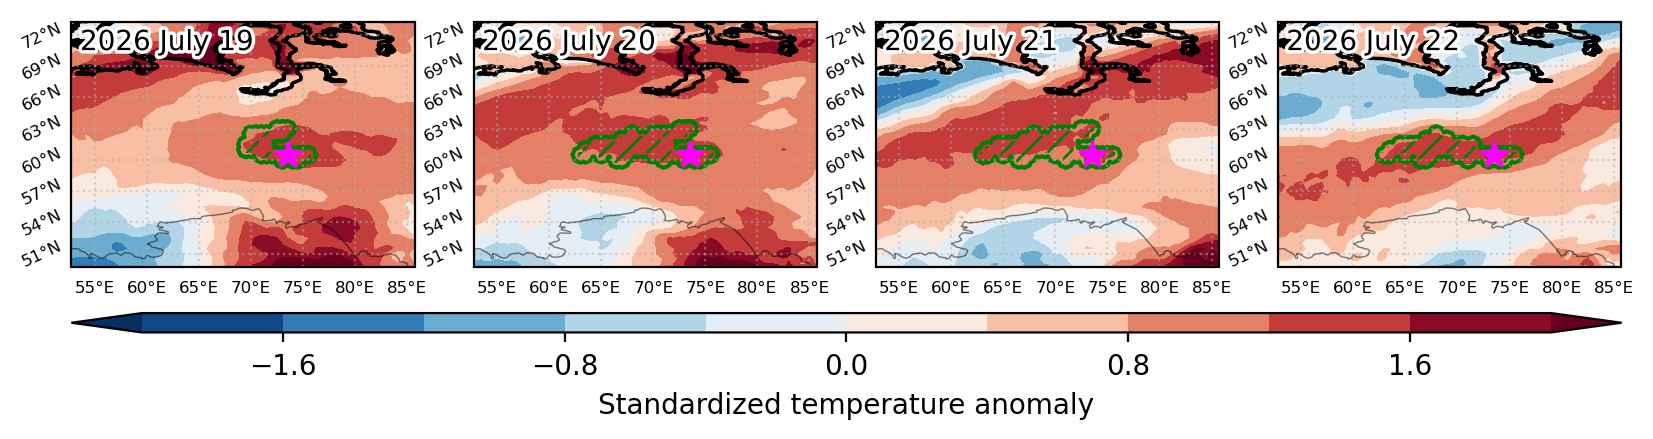
Heat wave occuring from July 19 2026 to July 22 2026 at 60.5°N 73.5°E

Download data: JSON

Event type: Heat wave

Countries affected (identified with ArcGIS Online; provided only for geographical reference):

  • Russian Federation

Duration: 4 days

Time span: July 19 2026 to July 22 2026

Statistics over entire affected area:

  • Mean temperature anomaly: 5.5 °C
  • Mean temperature: 24.1 °C
  • Maximum temperature anomaly: 6.7 °C
  • Maximum temperature: 25.1 °C

Event center: 60.5°N 73.5°E

Area affected: 104134 km$^2$


Fig. 3: Maps illustrating the evolution of standardized temperature anomalies during the event.

Event ID: Heat_wave_2026-Jul-19_to_2026-Jul-22_73.5_60.5

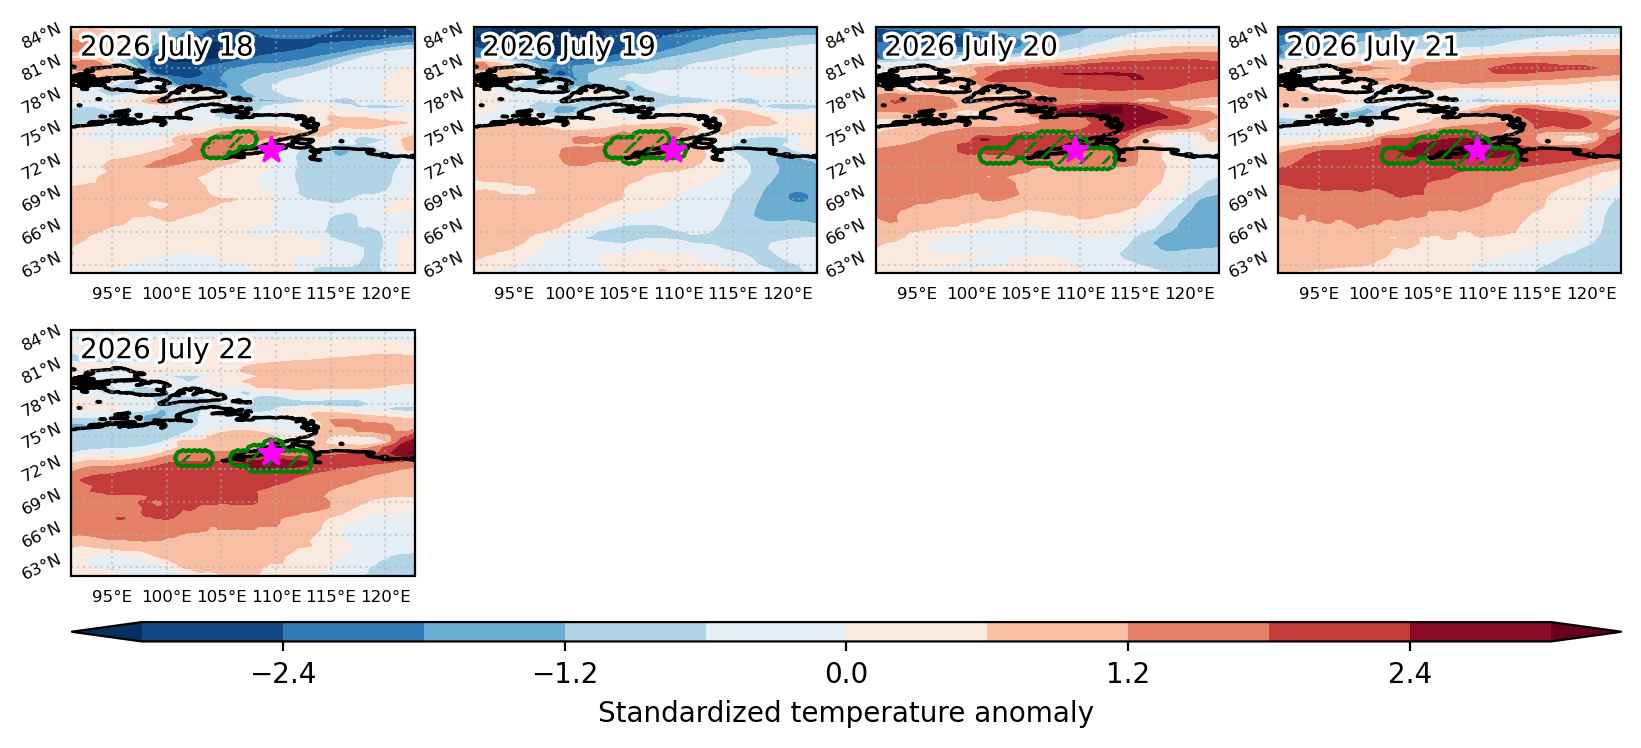
Heat wave occuring from July 18 2026 to July 22 2026 at 73.5°N 109.5°E

Download data: JSON

Event type: Heat wave

Countries affected (identified with ArcGIS Online; provided only for geographical reference):

  • Russian Federation

Duration: 5 days

Time span: July 18 2026 to July 22 2026

Statistics over entire affected area:

  • Mean temperature anomaly: 8.6 °C
  • Mean temperature: 17.7 °C
  • Maximum temperature anomaly: 13.4 °C
  • Maximum temperature: 24.4 °C

Event center: 73.5°N 109.5°E

Area affected: 50581 km$^2$


Fig. 3: Maps illustrating the evolution of standardized temperature anomalies during the event.

Event ID: Heat_wave_2026-Jul-18_to_2026-Jul-22_109.5_73.5

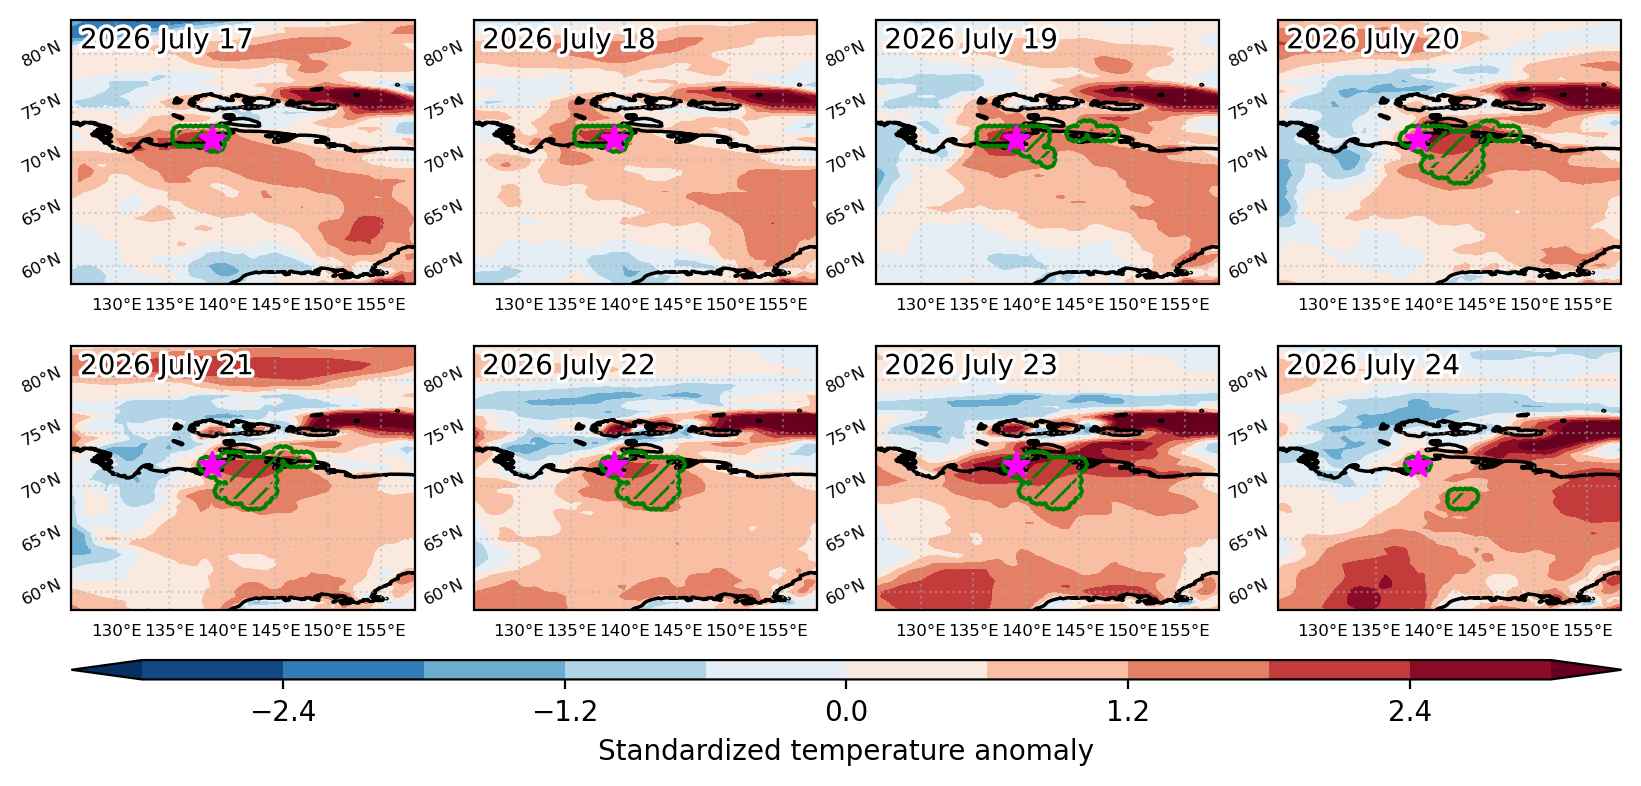
Heat wave occuring from July 17 2026 to July 24 2026 at 72.0°N 139.0°E

Download data: JSON

Event type: Heat wave

Countries affected (identified with ArcGIS Online; provided only for geographical reference):

  • Russian Federation

Duration: 8 days

Time span: July 17 2026 to July 24 2026

Statistics over entire affected area:

  • Mean temperature anomaly: 8.5 °C
  • Mean temperature: 17.6 °C
  • Maximum temperature anomaly: 14.3 °C
  • Maximum temperature: 23.9 °C

Event center: 72.0°N 139.0°E

Area affected: 93032 km$^2$


Fig. 3: Maps illustrating the evolution of standardized temperature anomalies during the event.

Event ID: Heat_wave_2026-Jul-17_to_2026-Jul-24_139.0_72.0

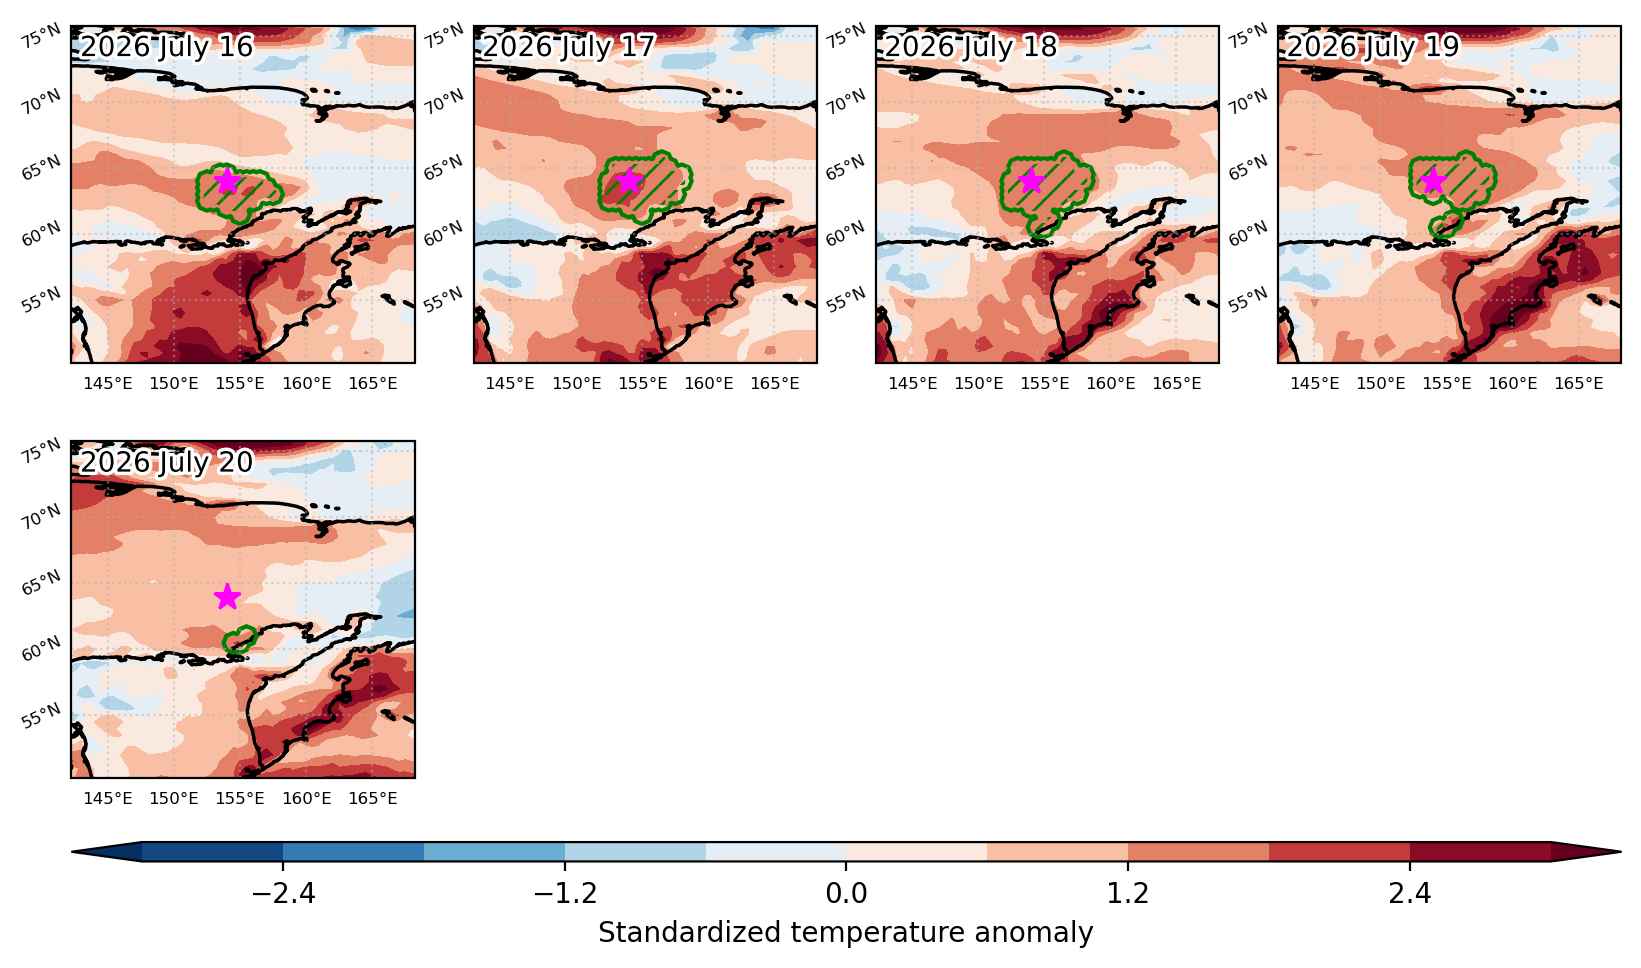
Heat wave occuring from July 16 2026 to July 20 2026 at 64.0°N 154.0°E

Download data: JSON

Event type: Heat wave

Countries affected (identified with ArcGIS Online; provided only for geographical reference):

  • Russian Federation

Duration: 5 days

Time span: July 16 2026 to July 20 2026

Statistics over entire affected area:

  • Mean temperature anomaly: 6.8 °C
  • Mean temperature: 21.9 °C
  • Maximum temperature anomaly: 9.2 °C
  • Maximum temperature: 26.5 °C

Event center: 64.0°N 154.0°E

Area affected: 96383 km$^2$


Fig. 3: Maps illustrating the evolution of standardized temperature anomalies during the event.

Event ID: Heat_wave_2026-Jul-16_to_2026-Jul-20_154.0_64.0

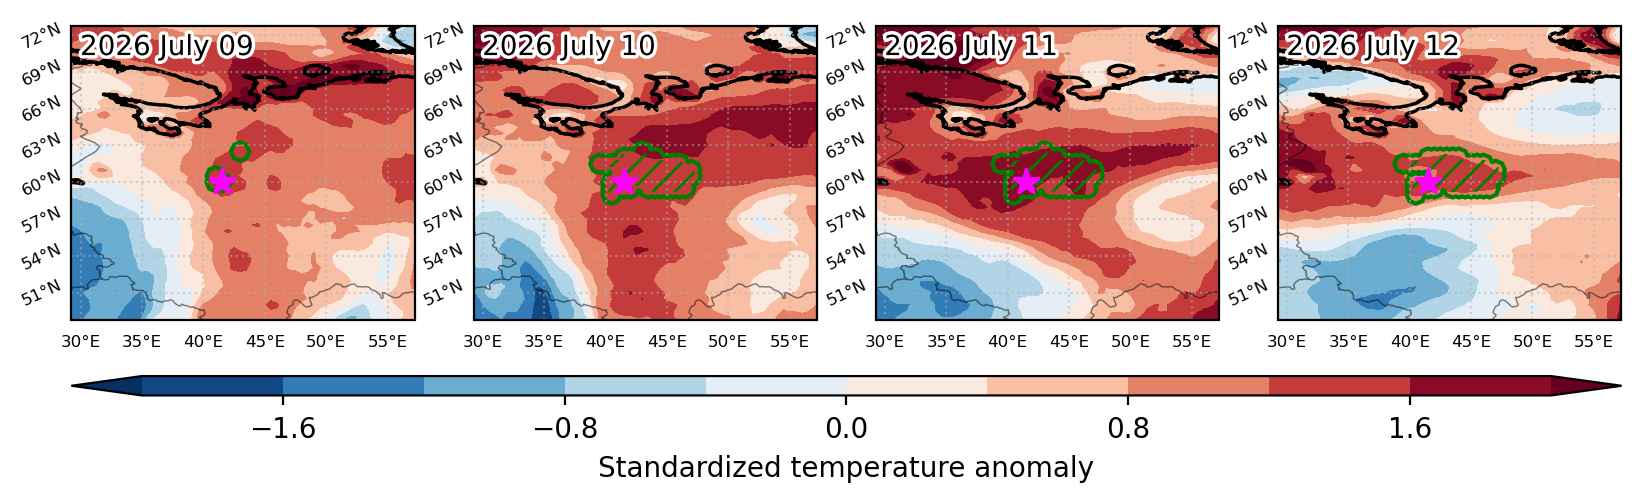
Heat wave occuring from July 09 2026 to July 12 2026 at 60.0°N 41.5°E

Download data: JSON

Event type: Heat wave

Countries affected (identified with ArcGIS Online; provided only for geographical reference):

  • Russian Federation

Duration: 4 days

Time span: July 09 2026 to July 12 2026

Statistics over entire affected area:

  • Mean temperature anomaly: 5.8 °C
  • Mean temperature: 23.5 °C
  • Maximum temperature anomaly: 7.3 °C
  • Maximum temperature: 25.4 °C

Event center: 60.0°N 41.5°E

Area affected: 101477 km$^2$


Fig. 3: Maps illustrating the evolution of standardized temperature anomalies during the event.

Event ID: Heat_wave_2026-Jul-09_to_2026-Jul-12_41.5_60.0

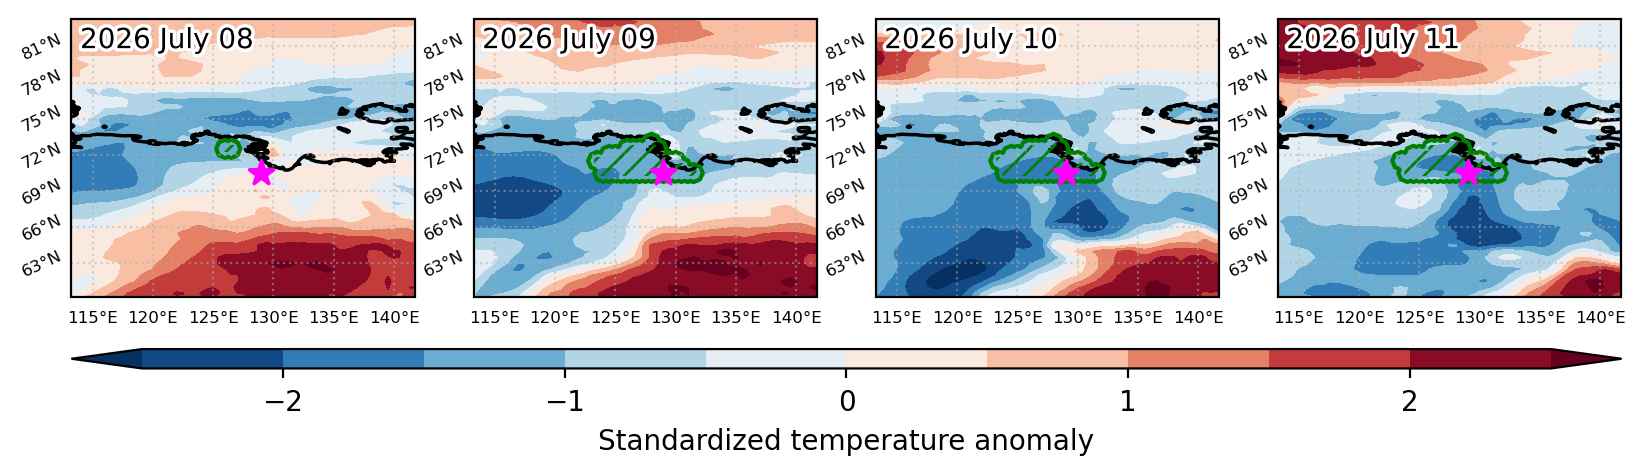
Cold spell occuring from July 08 2026 to July 11 2026 at 70.5°N 129.0°E

Download data: JSON

Event type: Cold spell

Countries affected (identified with ArcGIS Online; provided only for geographical reference):

  • Russian Federation

Duration: 4 days

Time span: July 08 2026 to July 11 2026

Statistics over entire affected area:

  • Mean temperature anomaly: -7.2 °C
  • Mean temperature: 3.2 °C
  • Minimum temperature anomaly: -10.2 °C
  • Minimum temperature: -0.4 °C

Event center: 70.5°N 129.0°E

Area affected: 58451 km$^2$


Fig. 3: Maps illustrating the evolution of standardized temperature anomalies during the event.

Event ID: Cold_spell_2026-Jul-08_to_2026-Jul-11_129.0_70.5

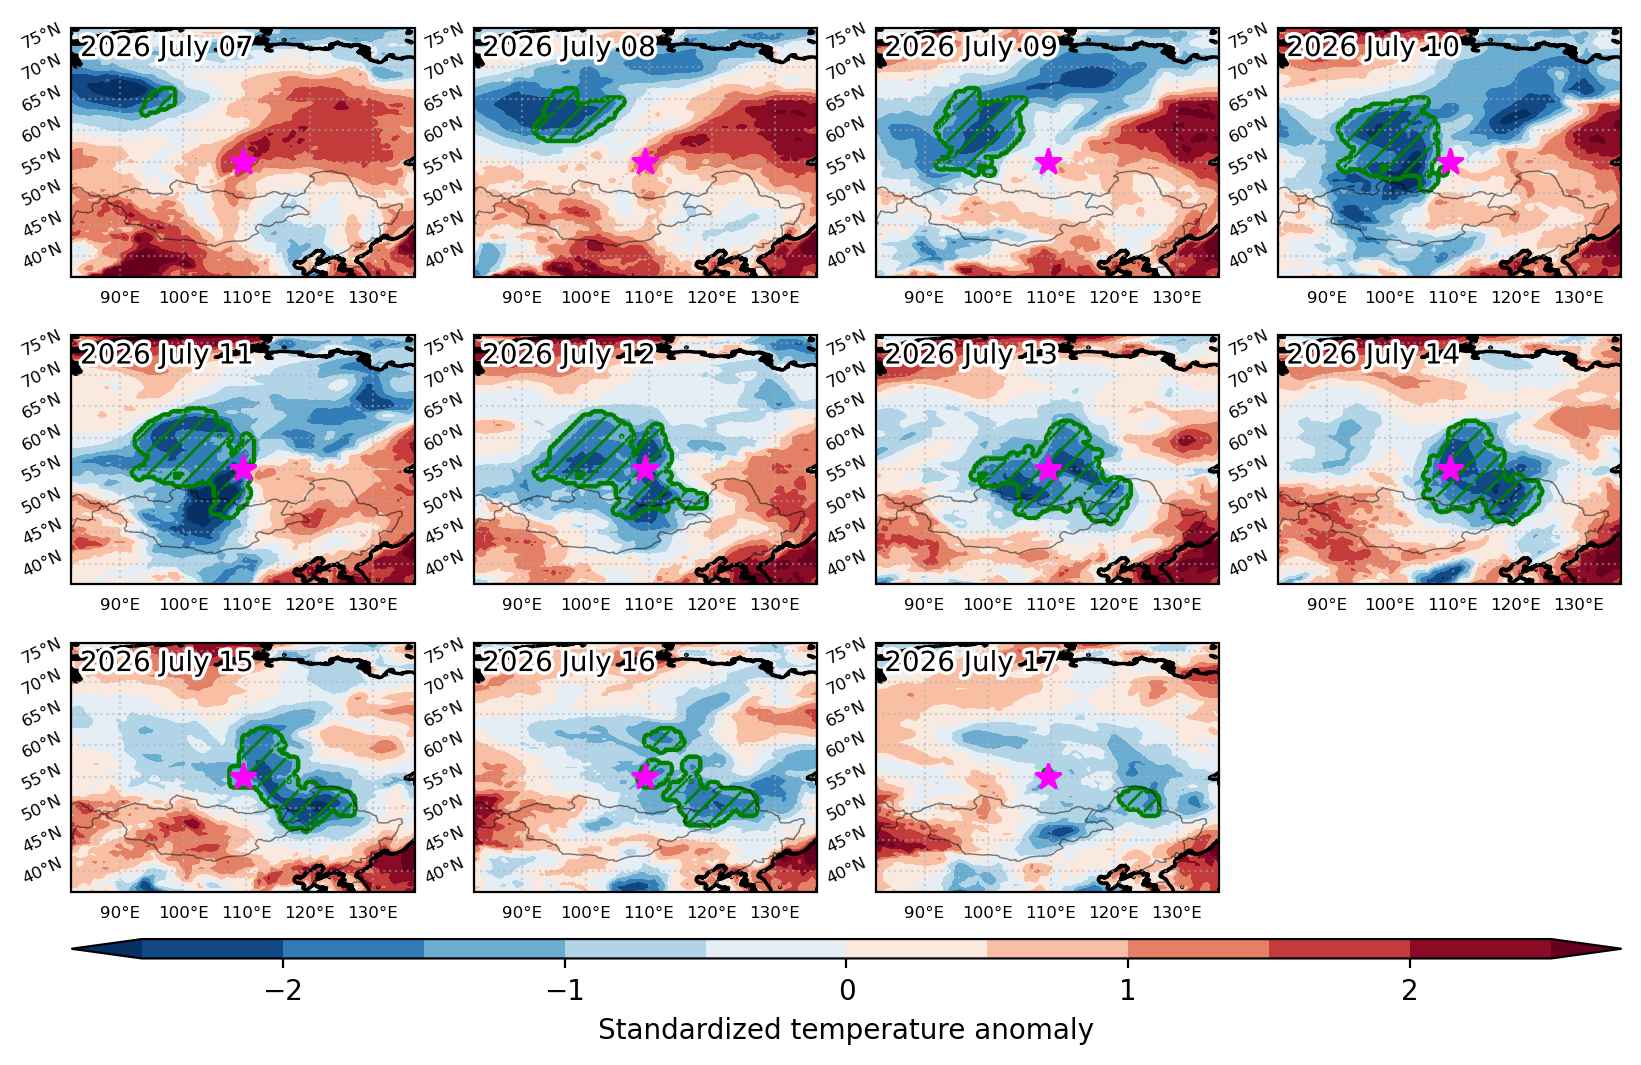
Cold spell occuring from July 07 2026 to July 17 2026 at 55.0°N 109.5°E

Download data: JSON

Event type: Cold spell

Countries affected (identified with ArcGIS Online; provided only for geographical reference):

  • China
  • Mongolia
  • Russian Federation

Duration: 11 days

Time span: July 07 2026 to July 17 2026

Statistics over entire affected area:

  • Mean temperature anomaly: -5.8 °C
  • Mean temperature: 12.5 °C
  • Minimum temperature anomaly: -9.4 °C
  • Minimum temperature: 2.7 °C

Event center: 55.0°N 109.5°E

Area affected: 2029161 km$^2$


Fig. 3: Maps illustrating the evolution of standardized temperature anomalies during the event.

Event ID: Cold_spell_2026-Jul-07_to_2026-Jul-17_109.5_55.0

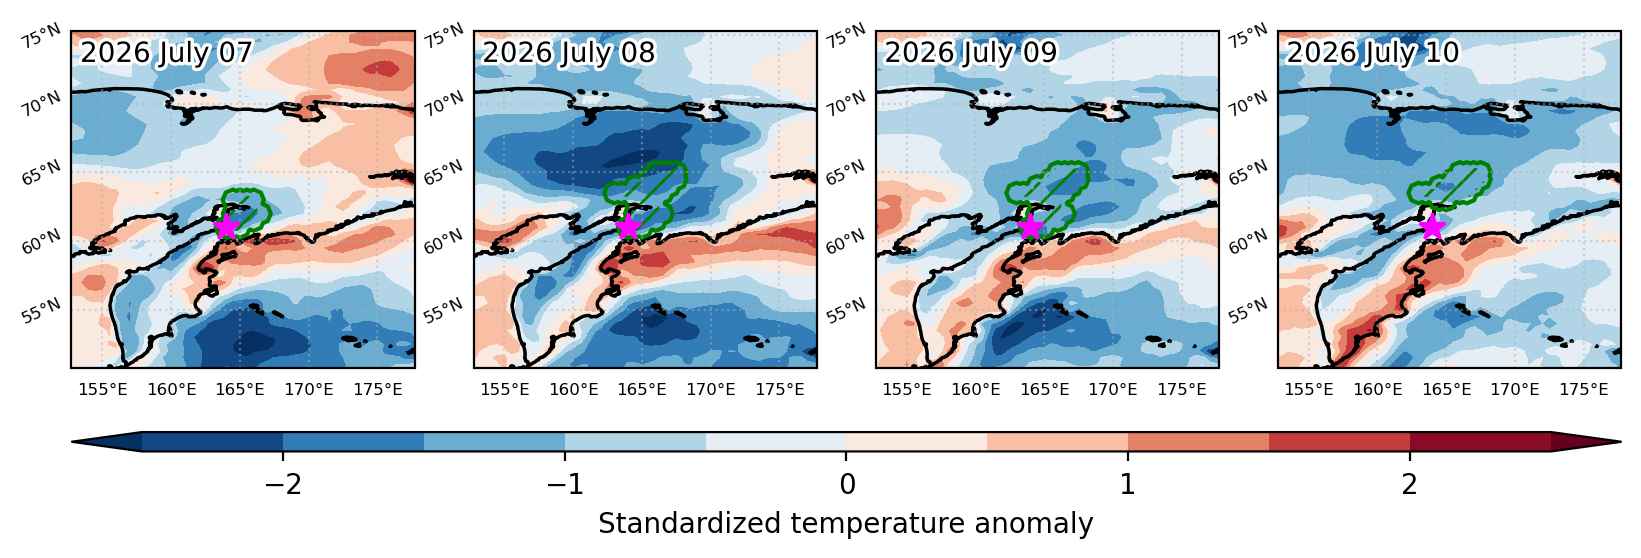
Cold spell occuring from July 07 2026 to July 10 2026 at 61.0°N 164.0°E

Download data: JSON

Event type: Cold spell

Countries affected (identified with ArcGIS Online; provided only for geographical reference):

  • Russian Federation

Duration: 4 days

Time span: July 07 2026 to July 10 2026

Statistics over entire affected area:

  • Mean temperature anomaly: -4.7 °C
  • Mean temperature: 8.6 °C
  • Minimum temperature anomaly: -7.3 °C
  • Minimum temperature: 5.2 °C

Event center: 61.0°N 164.0°E

Area affected: 57162 km$^2$


Fig. 3: Maps illustrating the evolution of standardized temperature anomalies during the event.

Event ID: Cold_spell_2026-Jul-07_to_2026-Jul-10_164.0_61.0