Heat wave occuring from September 04 2010 to January 30 2011 at 26.5°N 35.0°E

Download data: JSON

Event type: Heat wave

Countries affected (identified with ArcGIS Online; provided only for geographical reference):

  • Afghanistan
  • Albania
  • Algeria
  • Andorra
  • Armenia
  • Aruba
  • Austria
  • Azerbaijan
  • Bahrain
  • Belarus
  • Benin
  • Bosnia and Herzegovina
  • Bulgaria
  • Burkina Faso
  • Cabo Verde
  • Cameroon
  • Canarias
  • Chad
  • China
  • Croatia
  • Cyprus
  • Czech Republic
  • Djibouti
  • Egypt
  • Eritrea
  • Ethiopia
  • France
  • French Guiana
  • Gambia
  • Georgia
  • Germany
  • Greece
  • Guinea-Bissau
  • Guyana
  • Hungary
  • India
  • Iran
  • Iraq
  • Israel
  • Italy
  • Japan
  • Jordan
  • Kazakhstan
  • Kenya
  • Kuwait
  • Kyrgyzstan
  • Latvia
  • Lebanon
  • Libya
  • Lithuania
  • Luxembourg
  • Mali
  • Martinique
  • Mauritania
  • Moldova
  • Mongolia
  • Montenegro
  • Morocco
  • Nepal
  • Niger
  • Nigeria
  • North Macedonia
  • Oman
  • Pakistan
  • Palestinian Territory
  • Poland
  • Portugal
  • Romania
  • Russian Federation
  • Saint Lucia
  • Saudi Arabia
  • Senegal
  • Serbia
  • Slovakia
  • Slovenia
  • Somalia
  • South Sudan
  • Spain
  • Sudan
  • Switzerland
  • Syria
  • Tajikistan
  • Togo
  • Tunisia
  • Turkiye
  • Turkmenistan
  • Uganda
  • Ukraine
  • United Arab Emirates
  • Uzbekistan
  • Venezuela
  • Yemen

Duration: 149 days

Time span: September 04 2010 to January 30 2011

Statistics over entire affected area:

  • Mean temperature anomaly: 4.6 °C
  • Mean temperature: 19.1 °C
  • Maximum temperature anomaly: 28.2 °C
  • Maximum temperature: 37.2 °C

Event center: 26.5°N 35.0°E

Area affected: 58671948 km$^2$
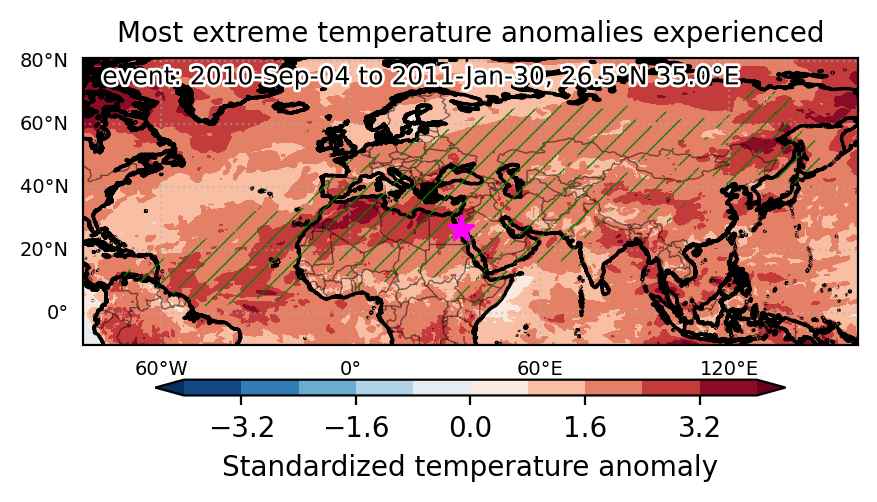

Fig. 1: Map of most extreme temperature anomalies (standardized) experienced during the event. The purple star indicates the center of the extreme event. Green hatching illustrates all areas under the effect of extremes at some time during the event.
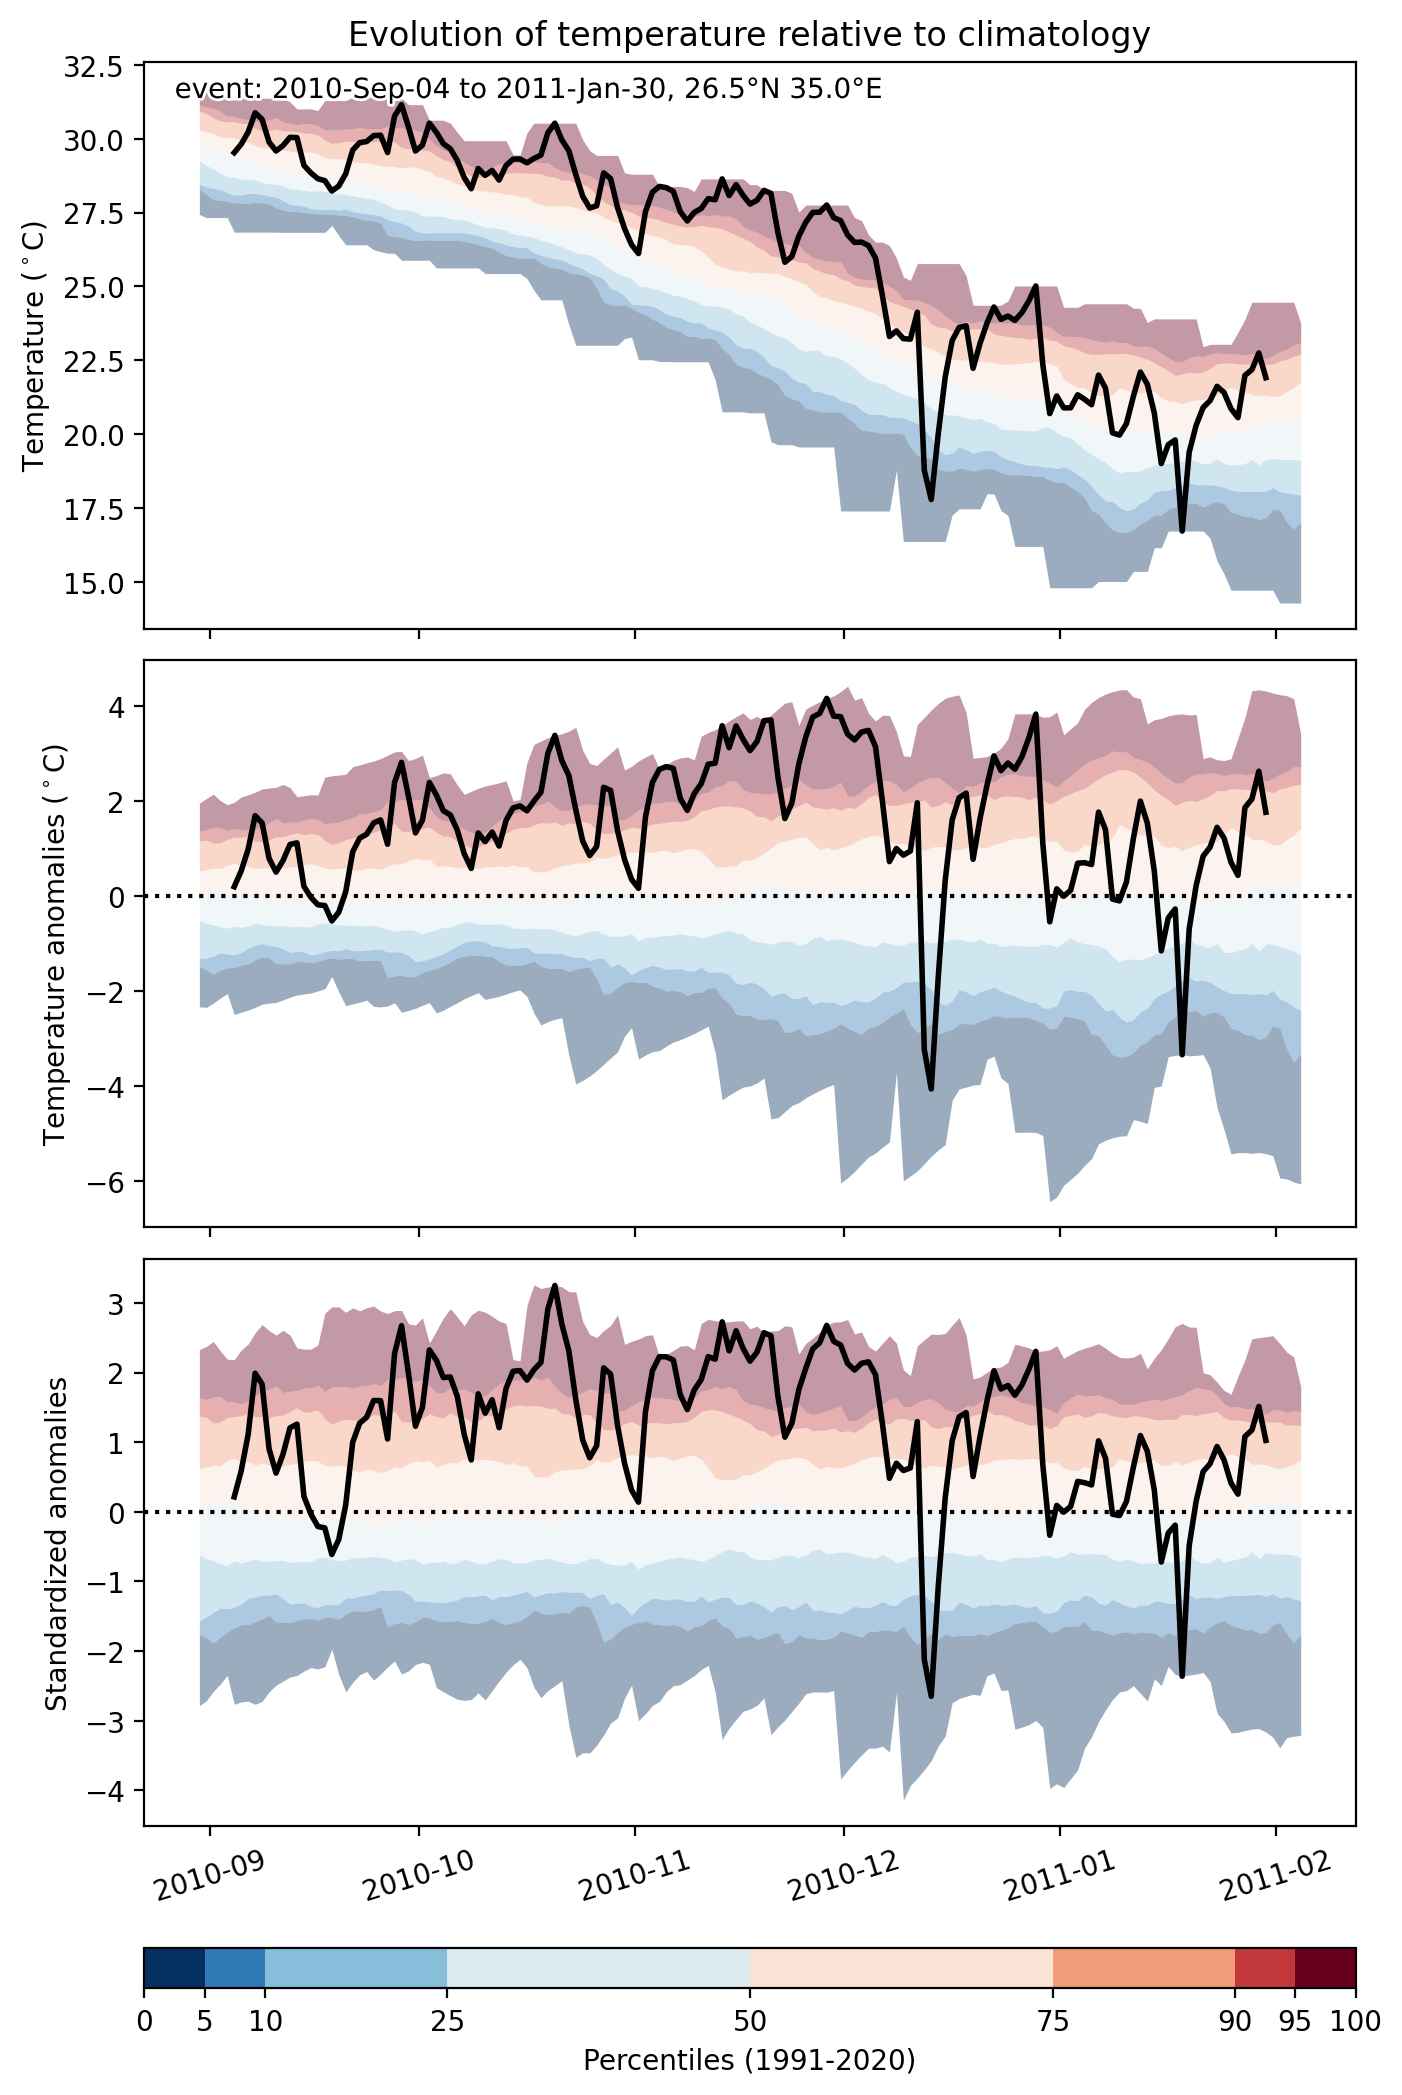


Fig. 2: Evolution of temperature at the center of the event. The climatological percentile distribution is illustrated with color shadings.
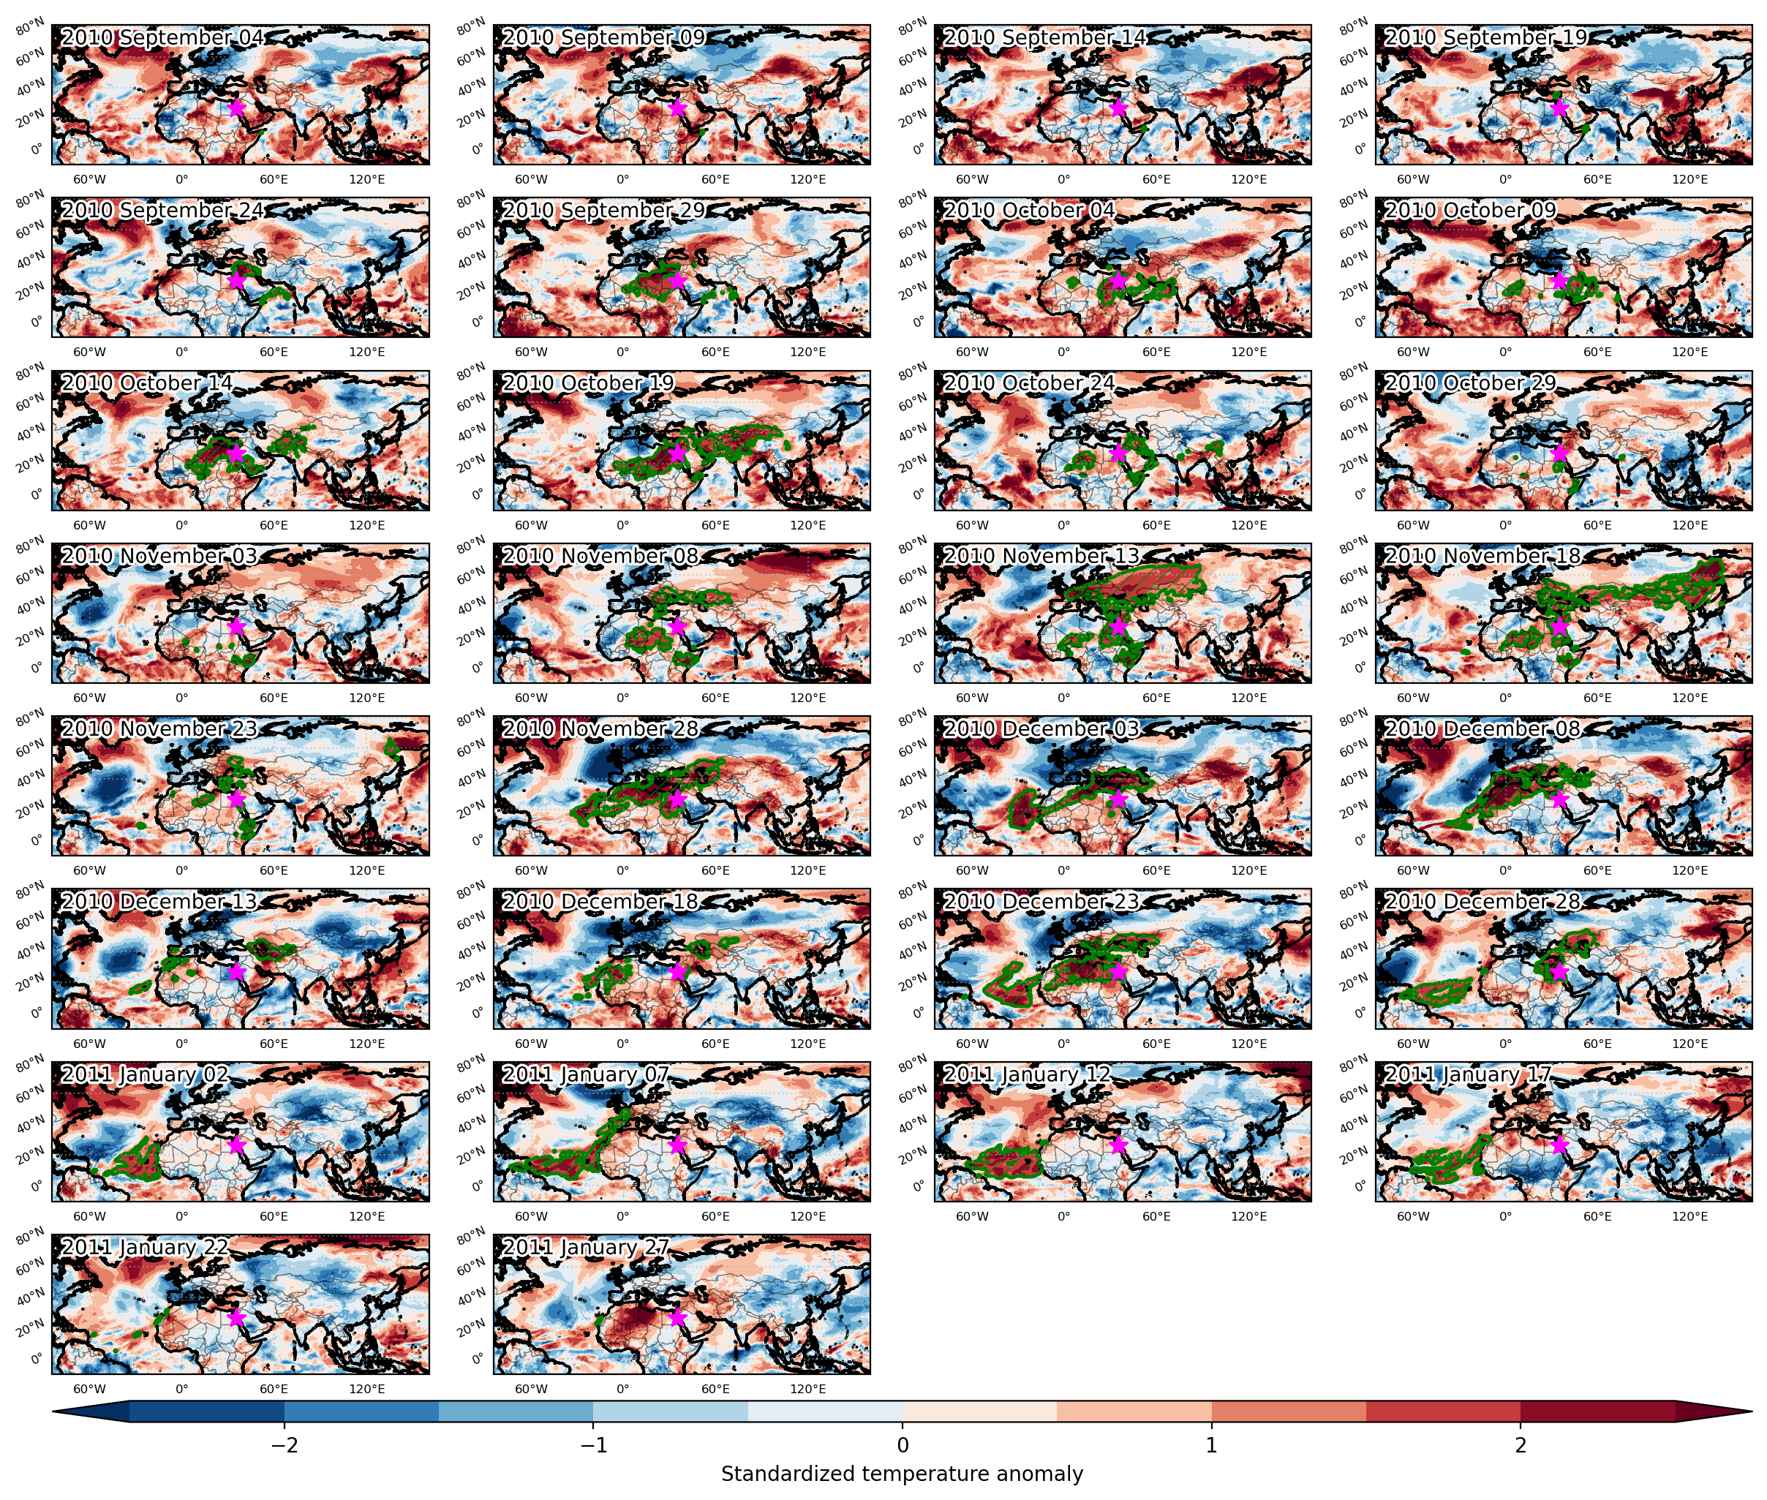


Fig. 3: Maps illustrating the evolution of standardized temperature anomalies during the event.

Event ID: Heat_wave_2010-Sep-04_to_2011-Jan-30_35.0_26.5
Cold spell occuring from September 03 2010 to September 20 2010 at 71.0°N 51.0°E

Download data: JSON

Event type: Cold spell

Countries affected (identified with ArcGIS Online; provided only for geographical reference):

  • Kazakhstan
  • Russian Federation

Duration: 18 days

Time span: September 03 2010 to September 20 2010

Statistics over entire affected area:

  • Mean temperature anomaly: -5.6 °C
  • Mean temperature: 2.9 °C
  • Minimum temperature anomaly: -10.6 °C
  • Minimum temperature: -9.4 °C

Event center: 71.0°N 51.0°E

Area affected: 4766417 km$^2$


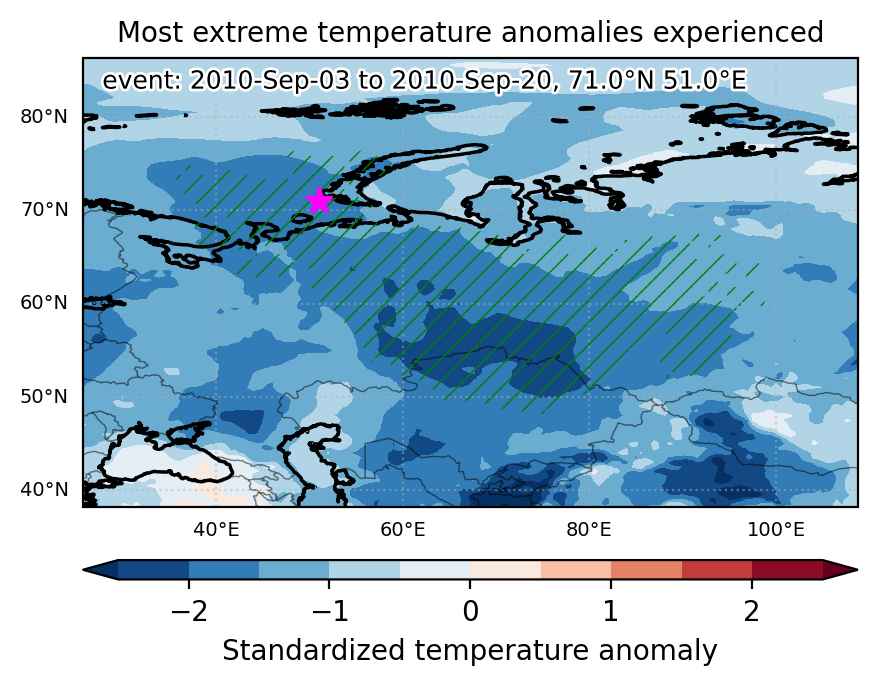
Fig. 1: Map of most extreme temperature anomalies (standardized) experienced during the event. The purple star indicates the center of the extreme event. Green hatching illustrates all areas under the effect of extremes at some time during the event.


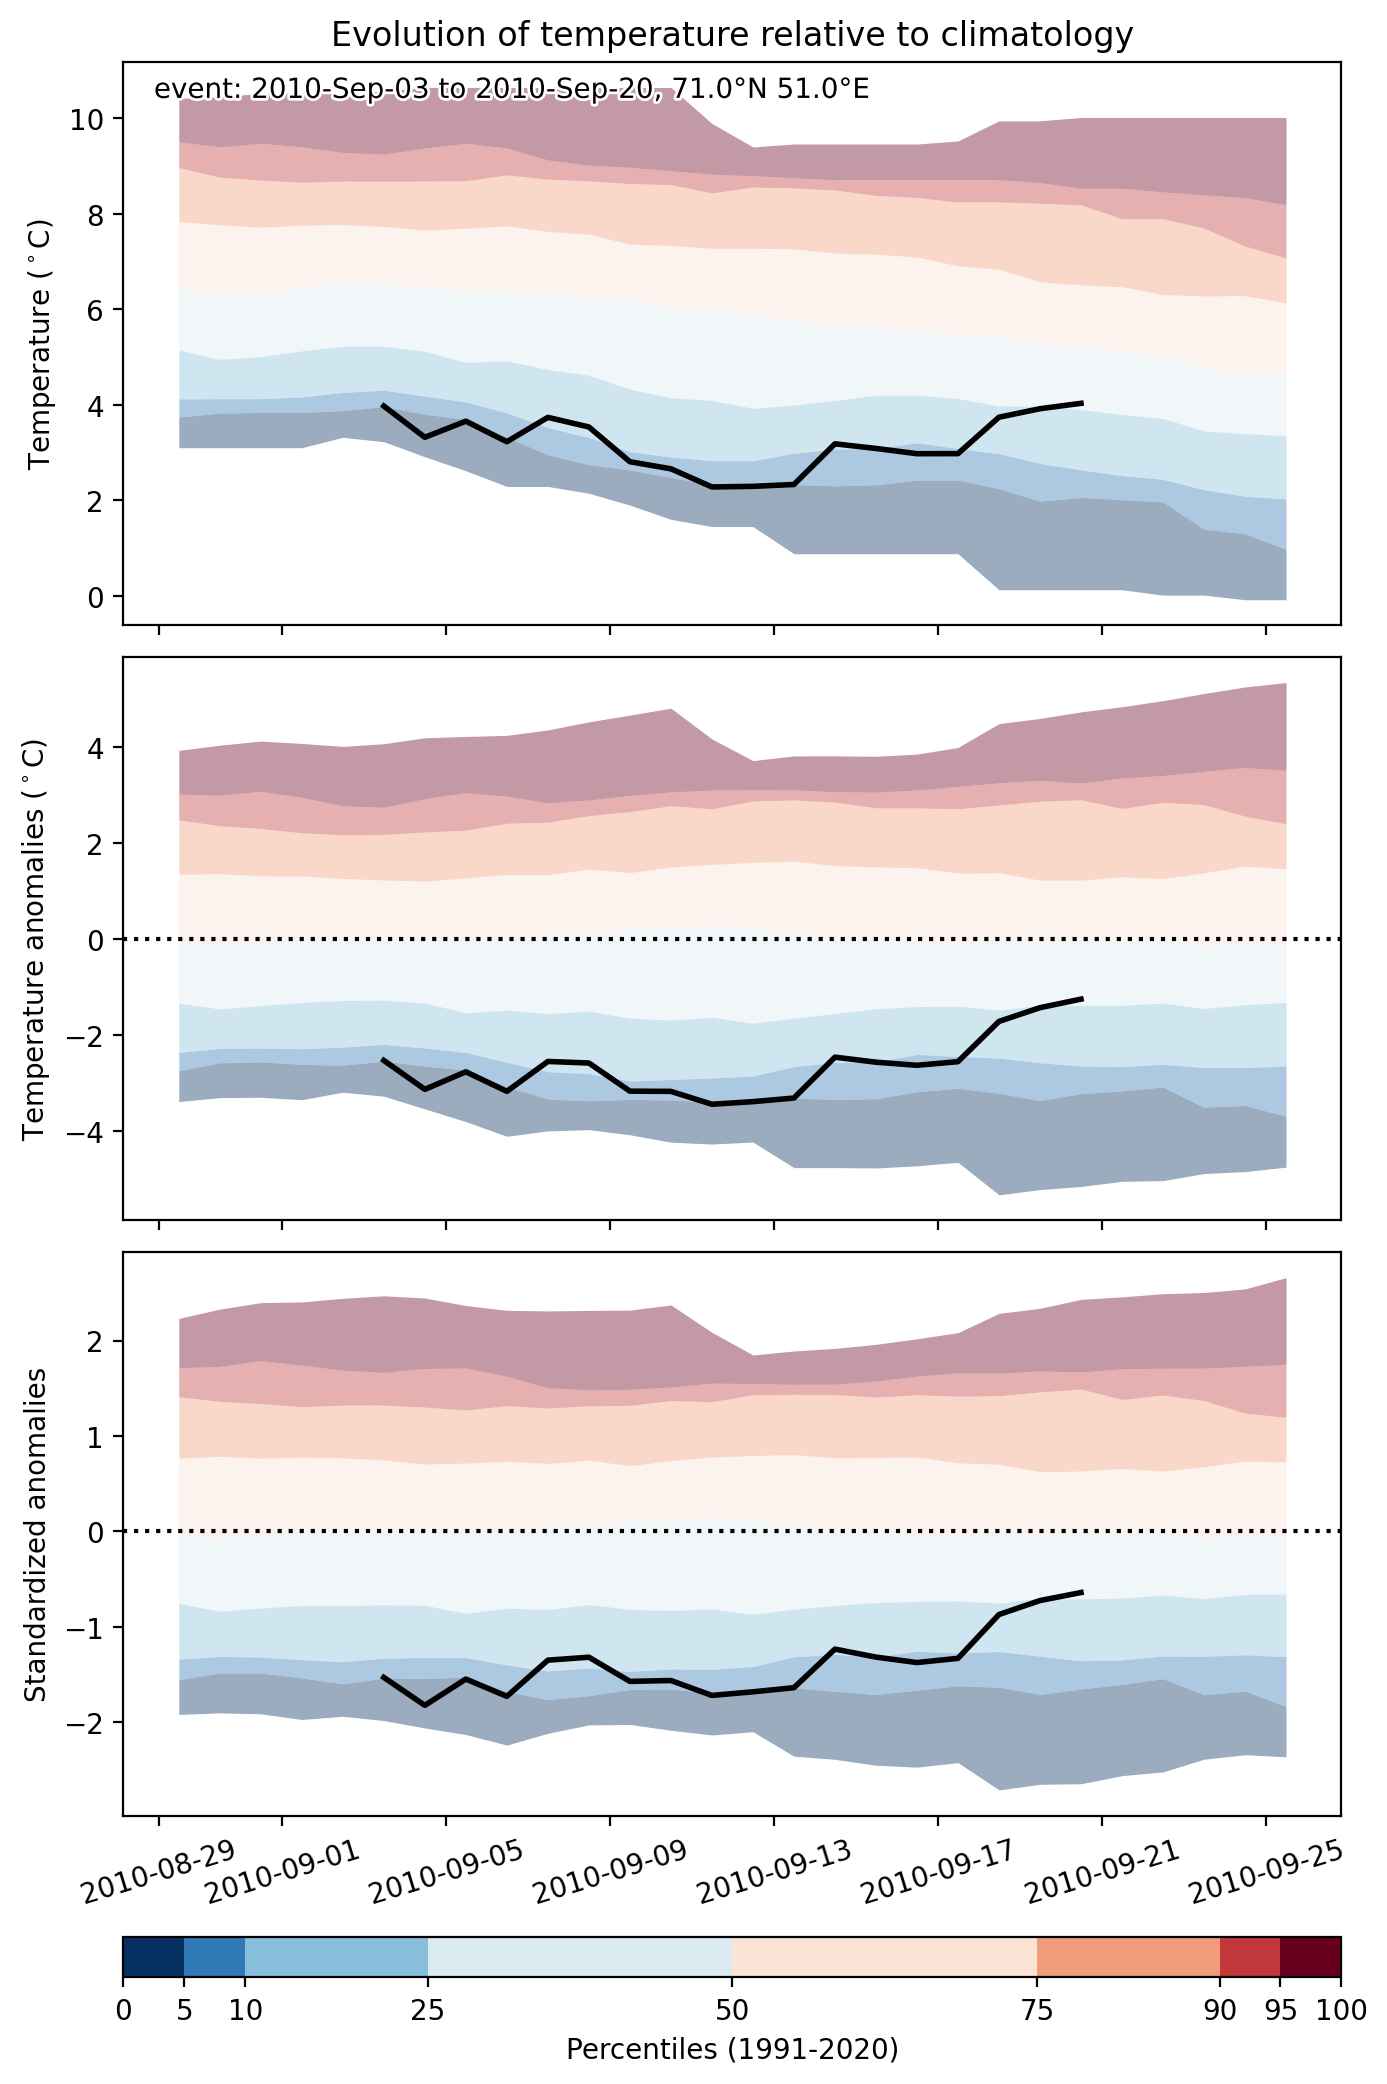
Fig. 2: Evolution of temperature at the center of the event. The climatological percentile distribution is illustrated with color shadings.


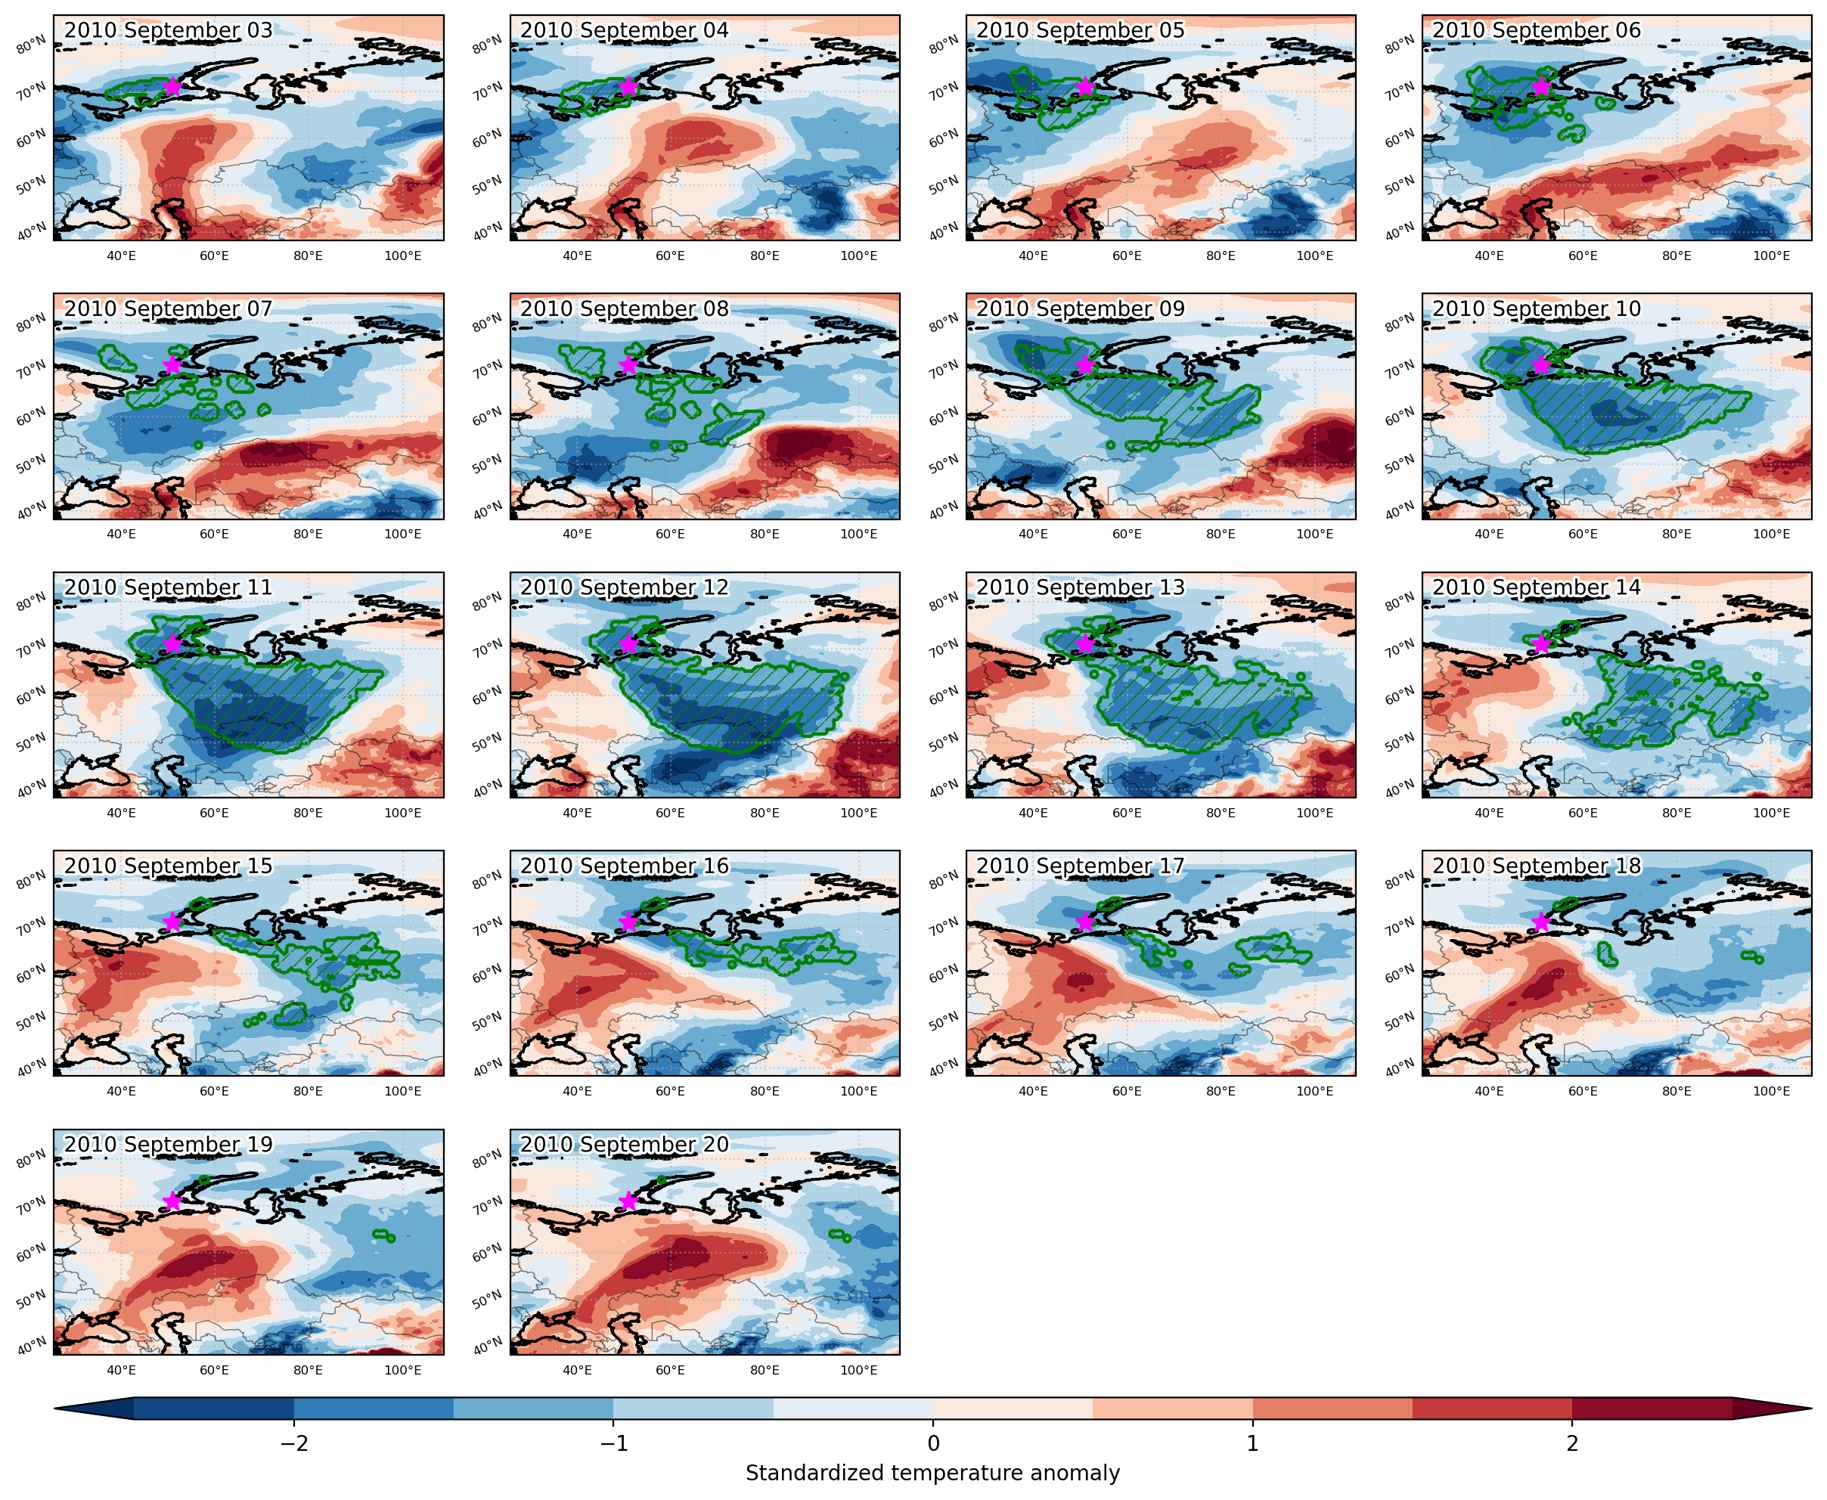
Fig. 3: Maps illustrating the evolution of standardized temperature anomalies during the event.

Event ID: Cold_spell_2010-Sep-03_to_2010-Sep-20_51.0_71.0

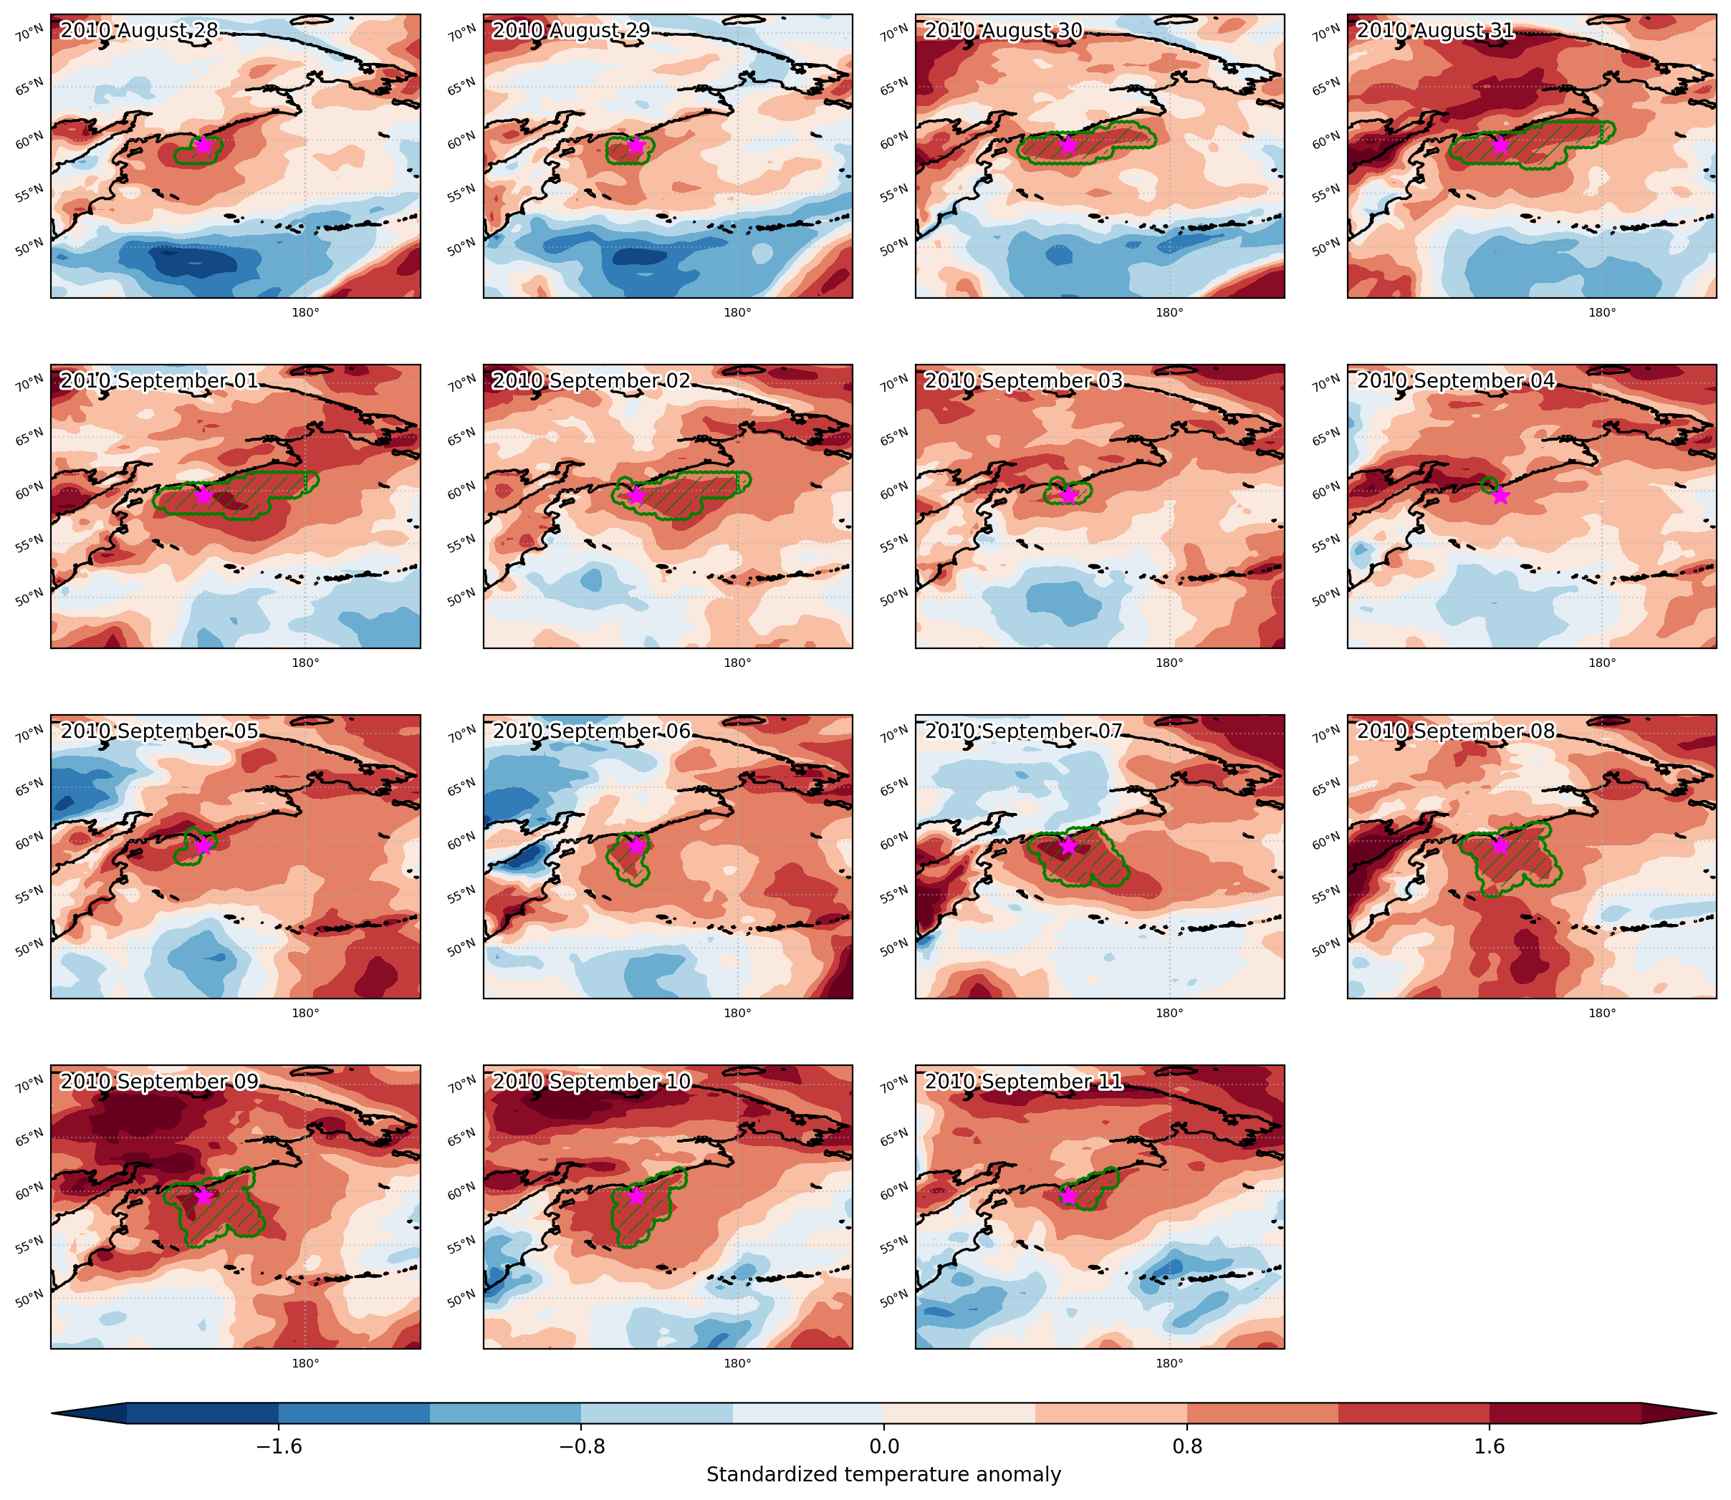
Heat wave occuring from August 28 2010 to September 11 2010 at 59.5°N 170.5°E

Download data: JSON

Event type: Heat wave

Countries affected (identified with ArcGIS Online; provided only for geographical reference):

  • Russian Federation

Duration: 15 days

Time span: August 28 2010 to September 11 2010

Statistics over entire affected area:

  • Mean temperature anomaly: 1.8 °C
  • Mean temperature: 11.8 °C
  • Maximum temperature anomaly: 2.4 °C
  • Maximum temperature: 13.0 °C

Event center: 59.5°N 170.5°E

Area affected: 266038 km$^2$


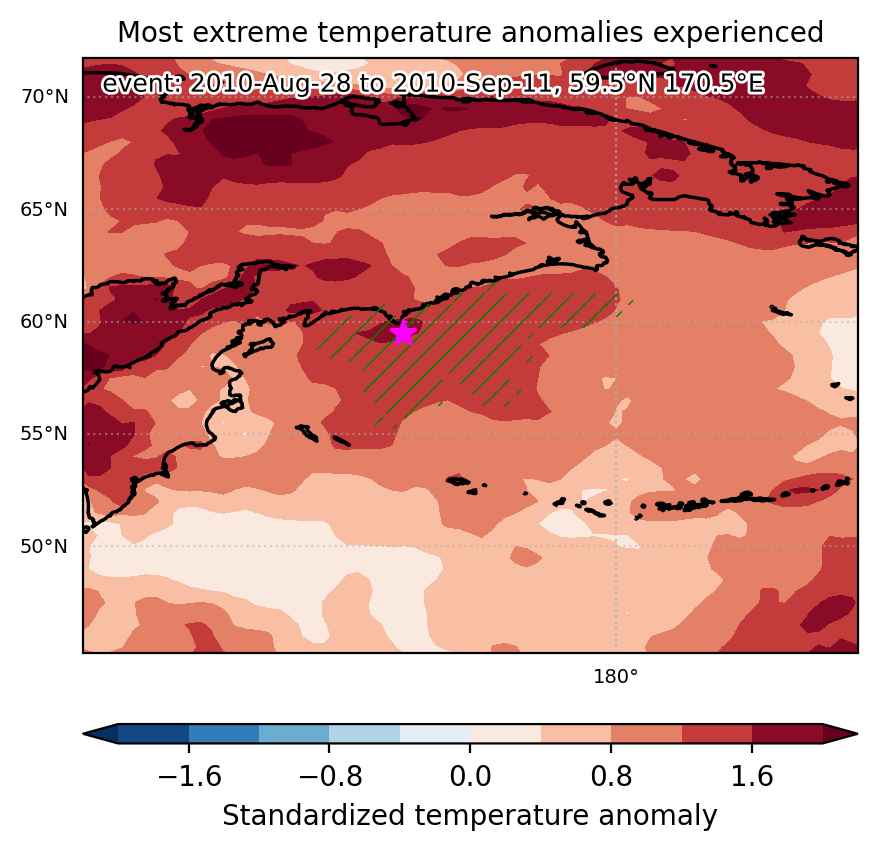
Fig. 1: Map of most extreme temperature anomalies (standardized) experienced during the event. The purple star indicates the center of the extreme event. Green hatching illustrates all areas under the effect of extremes at some time during the event.


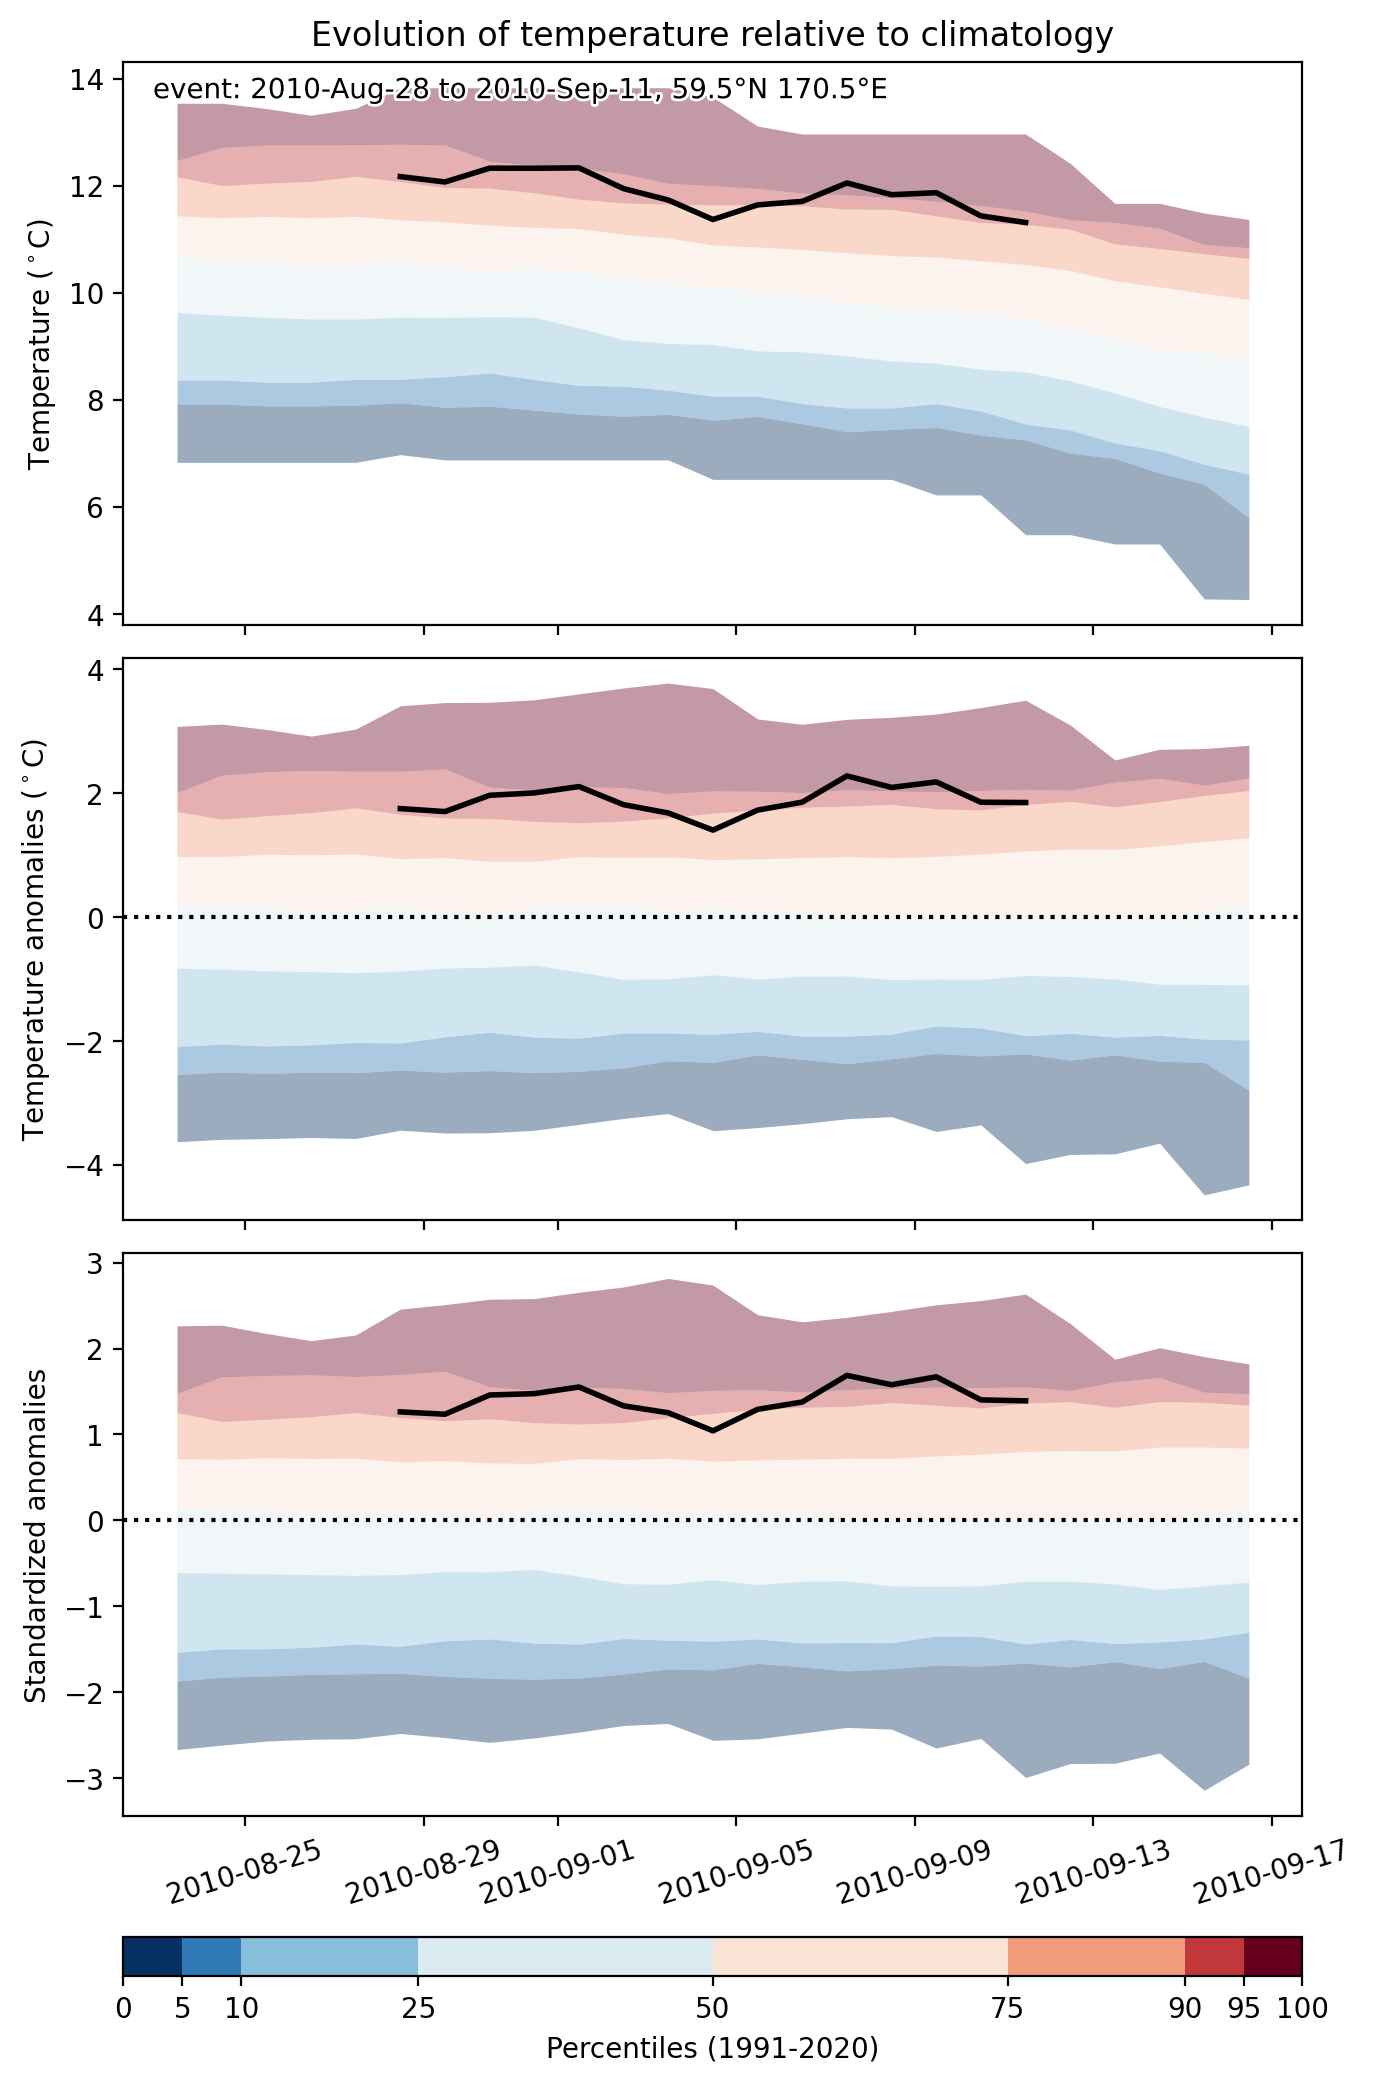
Fig. 2: Evolution of temperature at the center of the event. The climatological percentile distribution is illustrated with color shadings.


Fig. 3: Maps illustrating the evolution of standardized temperature anomalies during the event.

Event ID: Heat_wave_2010-Aug-28_to_2010-Sep-11_170.5_59.5

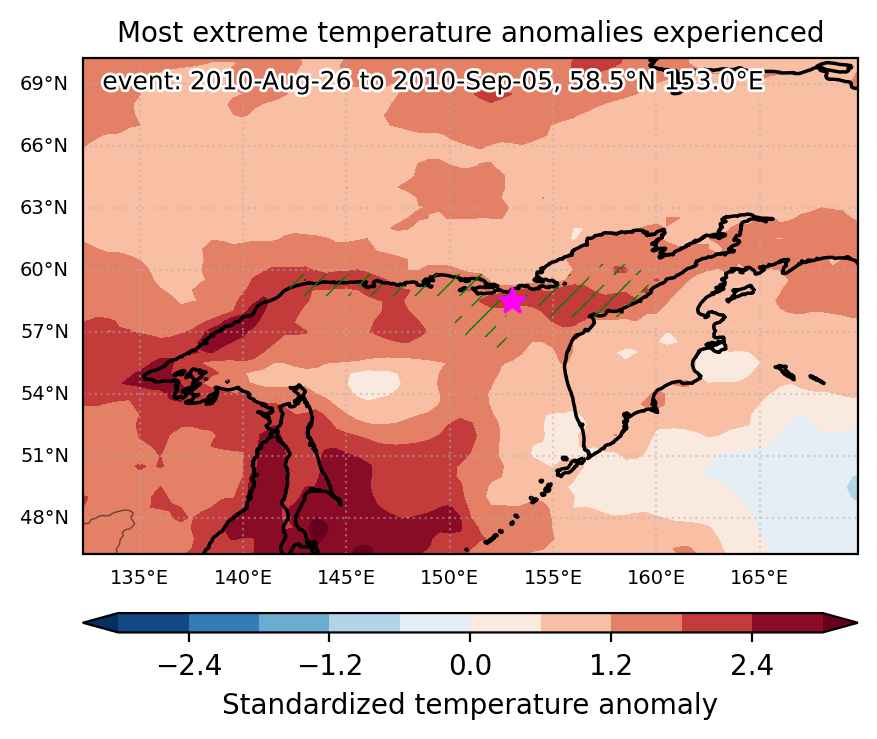
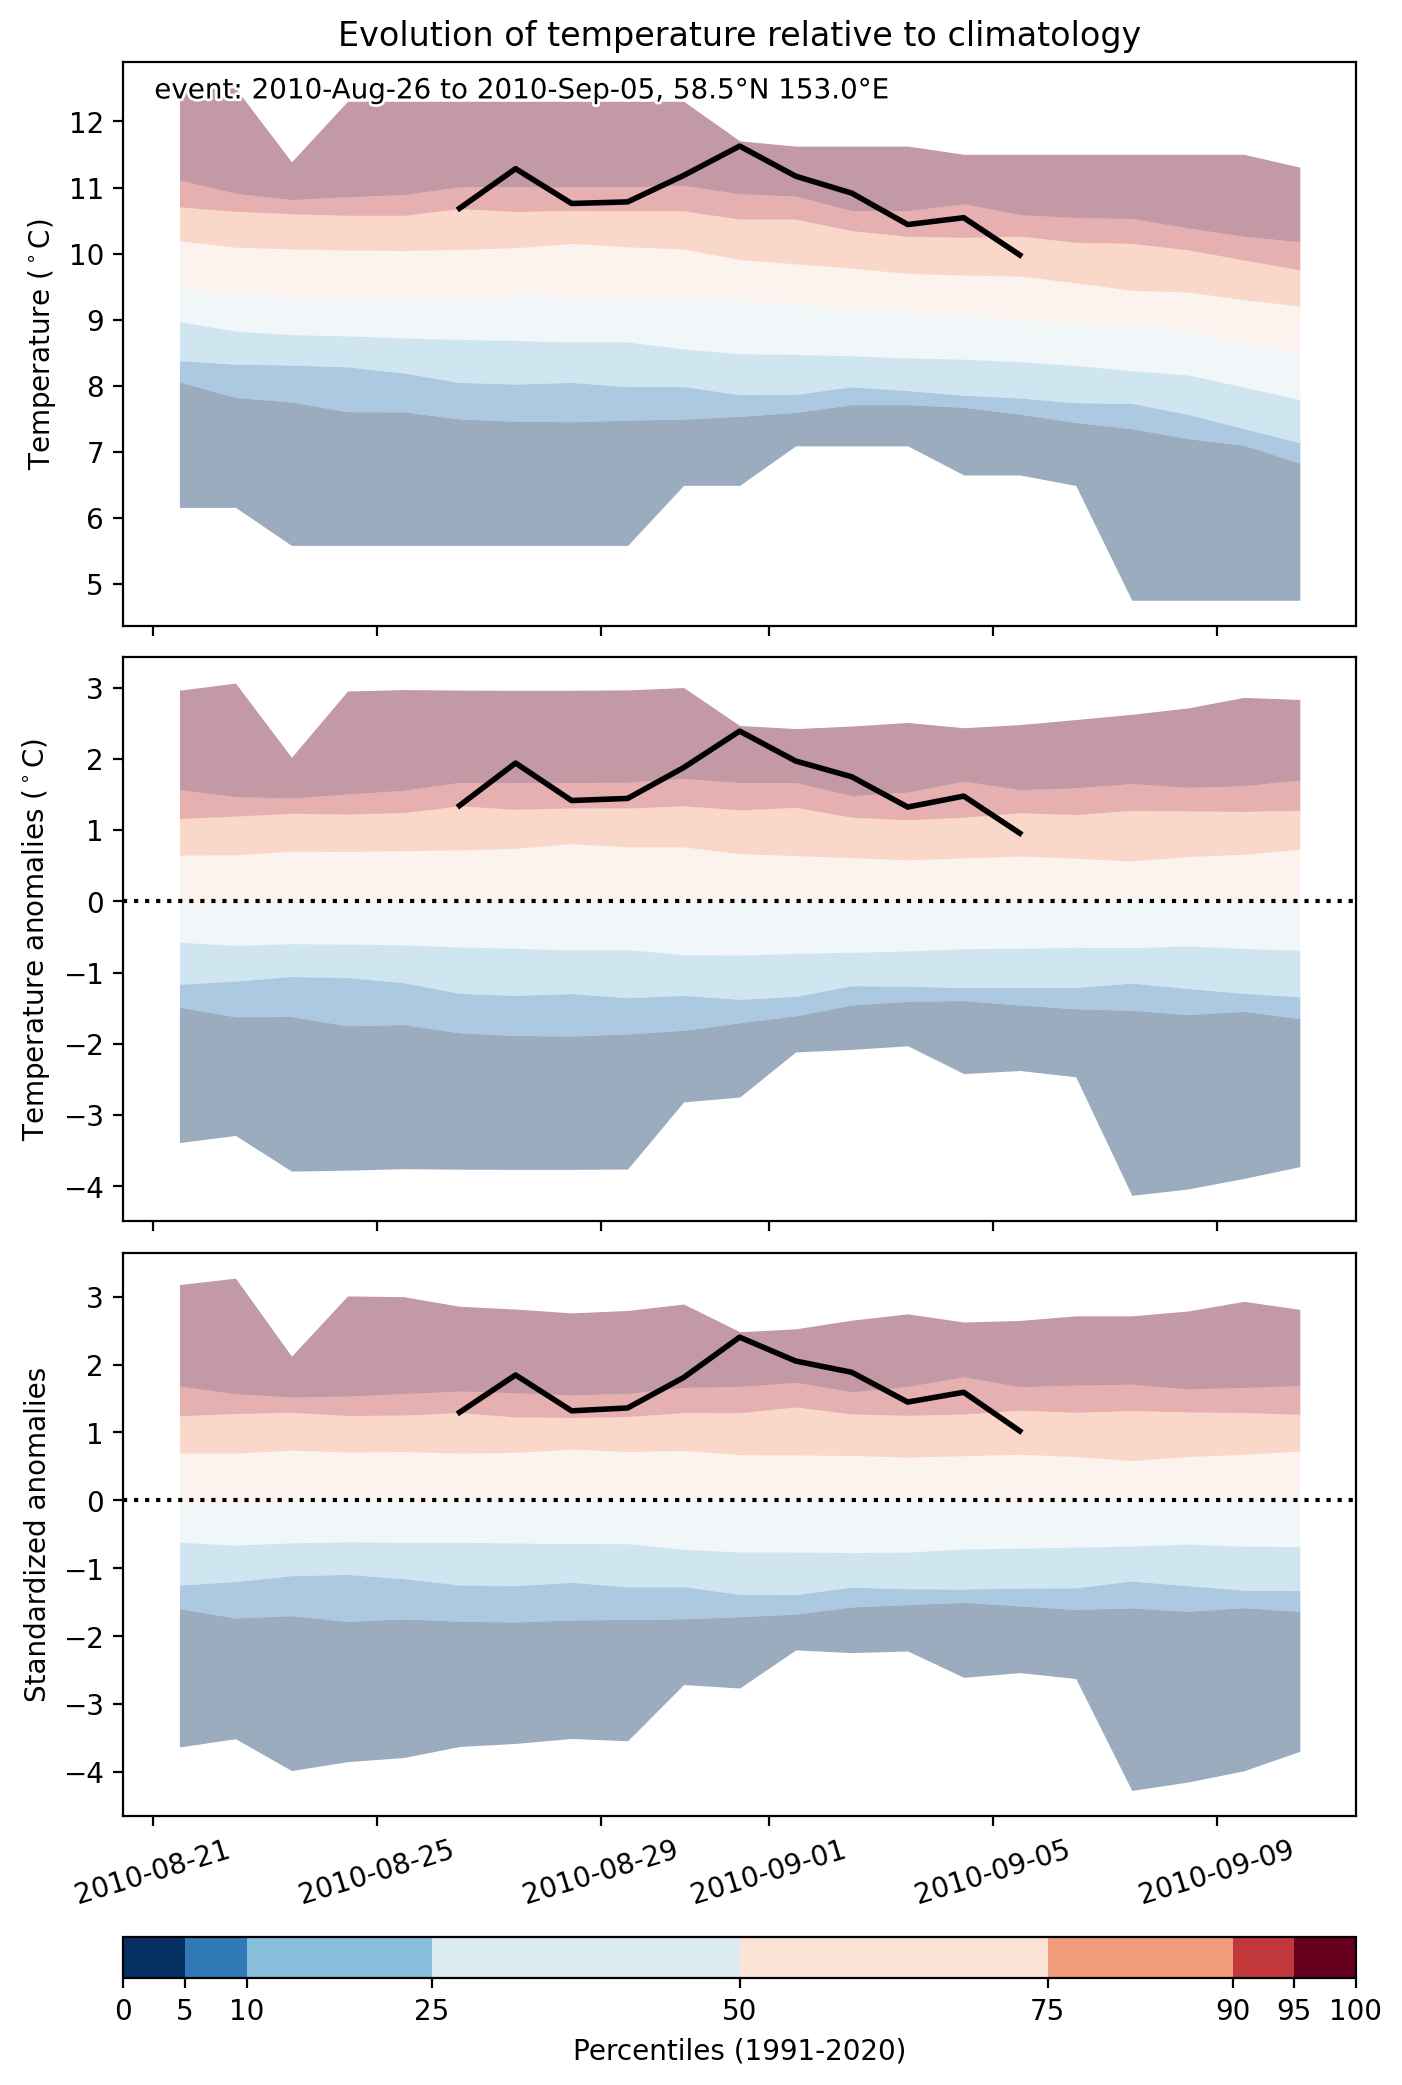
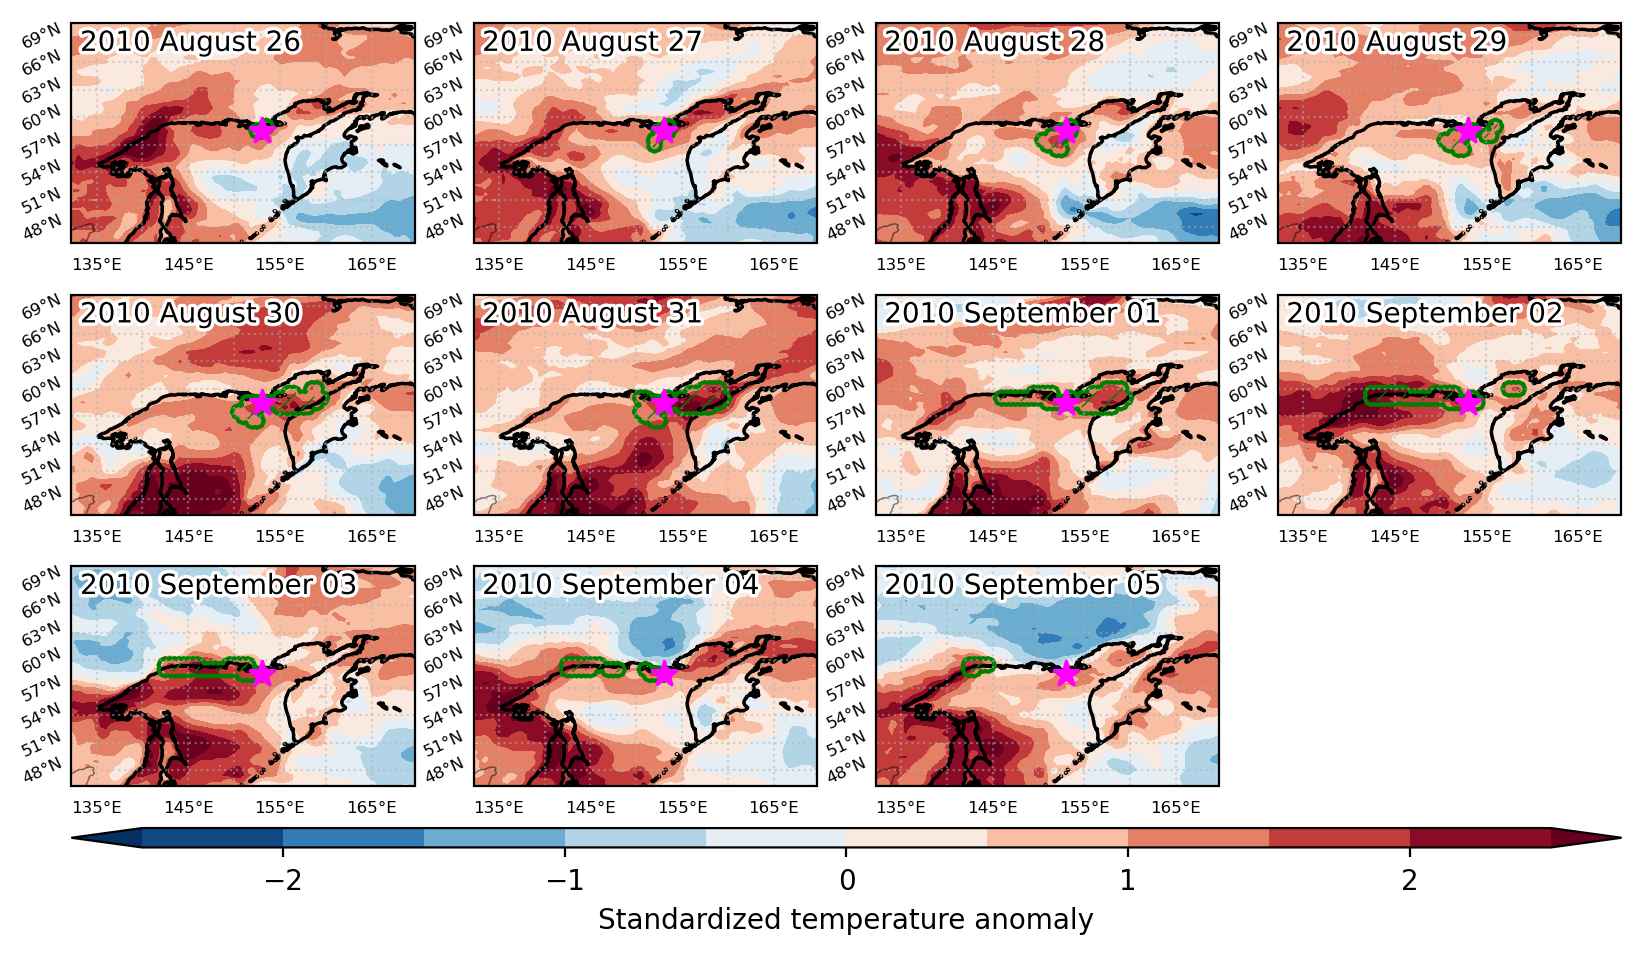
Heat wave occuring from August 26 2010 to September 05 2010 at 58.5°N 153.0°E

Download data: JSON

Event type: Heat wave

Countries affected (identified with ArcGIS Online; provided only for geographical reference):

  • Russian Federation

Duration: 11 days

Time span: August 26 2010 to September 05 2010

Statistics over entire affected area:

  • Mean temperature anomaly: 2.1 °C
  • Mean temperature: 12.8 °C
  • Maximum temperature anomaly: 6.1 °C
  • Maximum temperature: 18.1 °C

Event center: 58.5°N 153.0°E

Area affected: 133210 km$^2$


Fig. 1: Map of most extreme temperature anomalies (standardized) experienced during the event. The purple star indicates the center of the extreme event. Green hatching illustrates all areas under the effect of extremes at some time during the event.


Fig. 2: Evolution of temperature at the center of the event. The climatological percentile distribution is illustrated with color shadings.


Fig. 3: Maps illustrating the evolution of standardized temperature anomalies during the event.

Event ID: Heat_wave_2010-Aug-26_to_2010-Sep-05_153.0_58.5

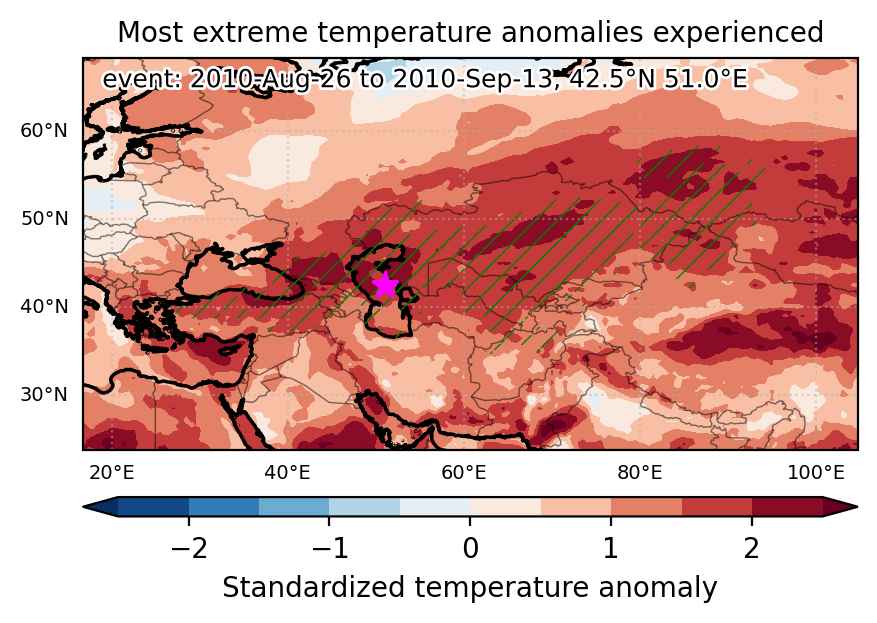
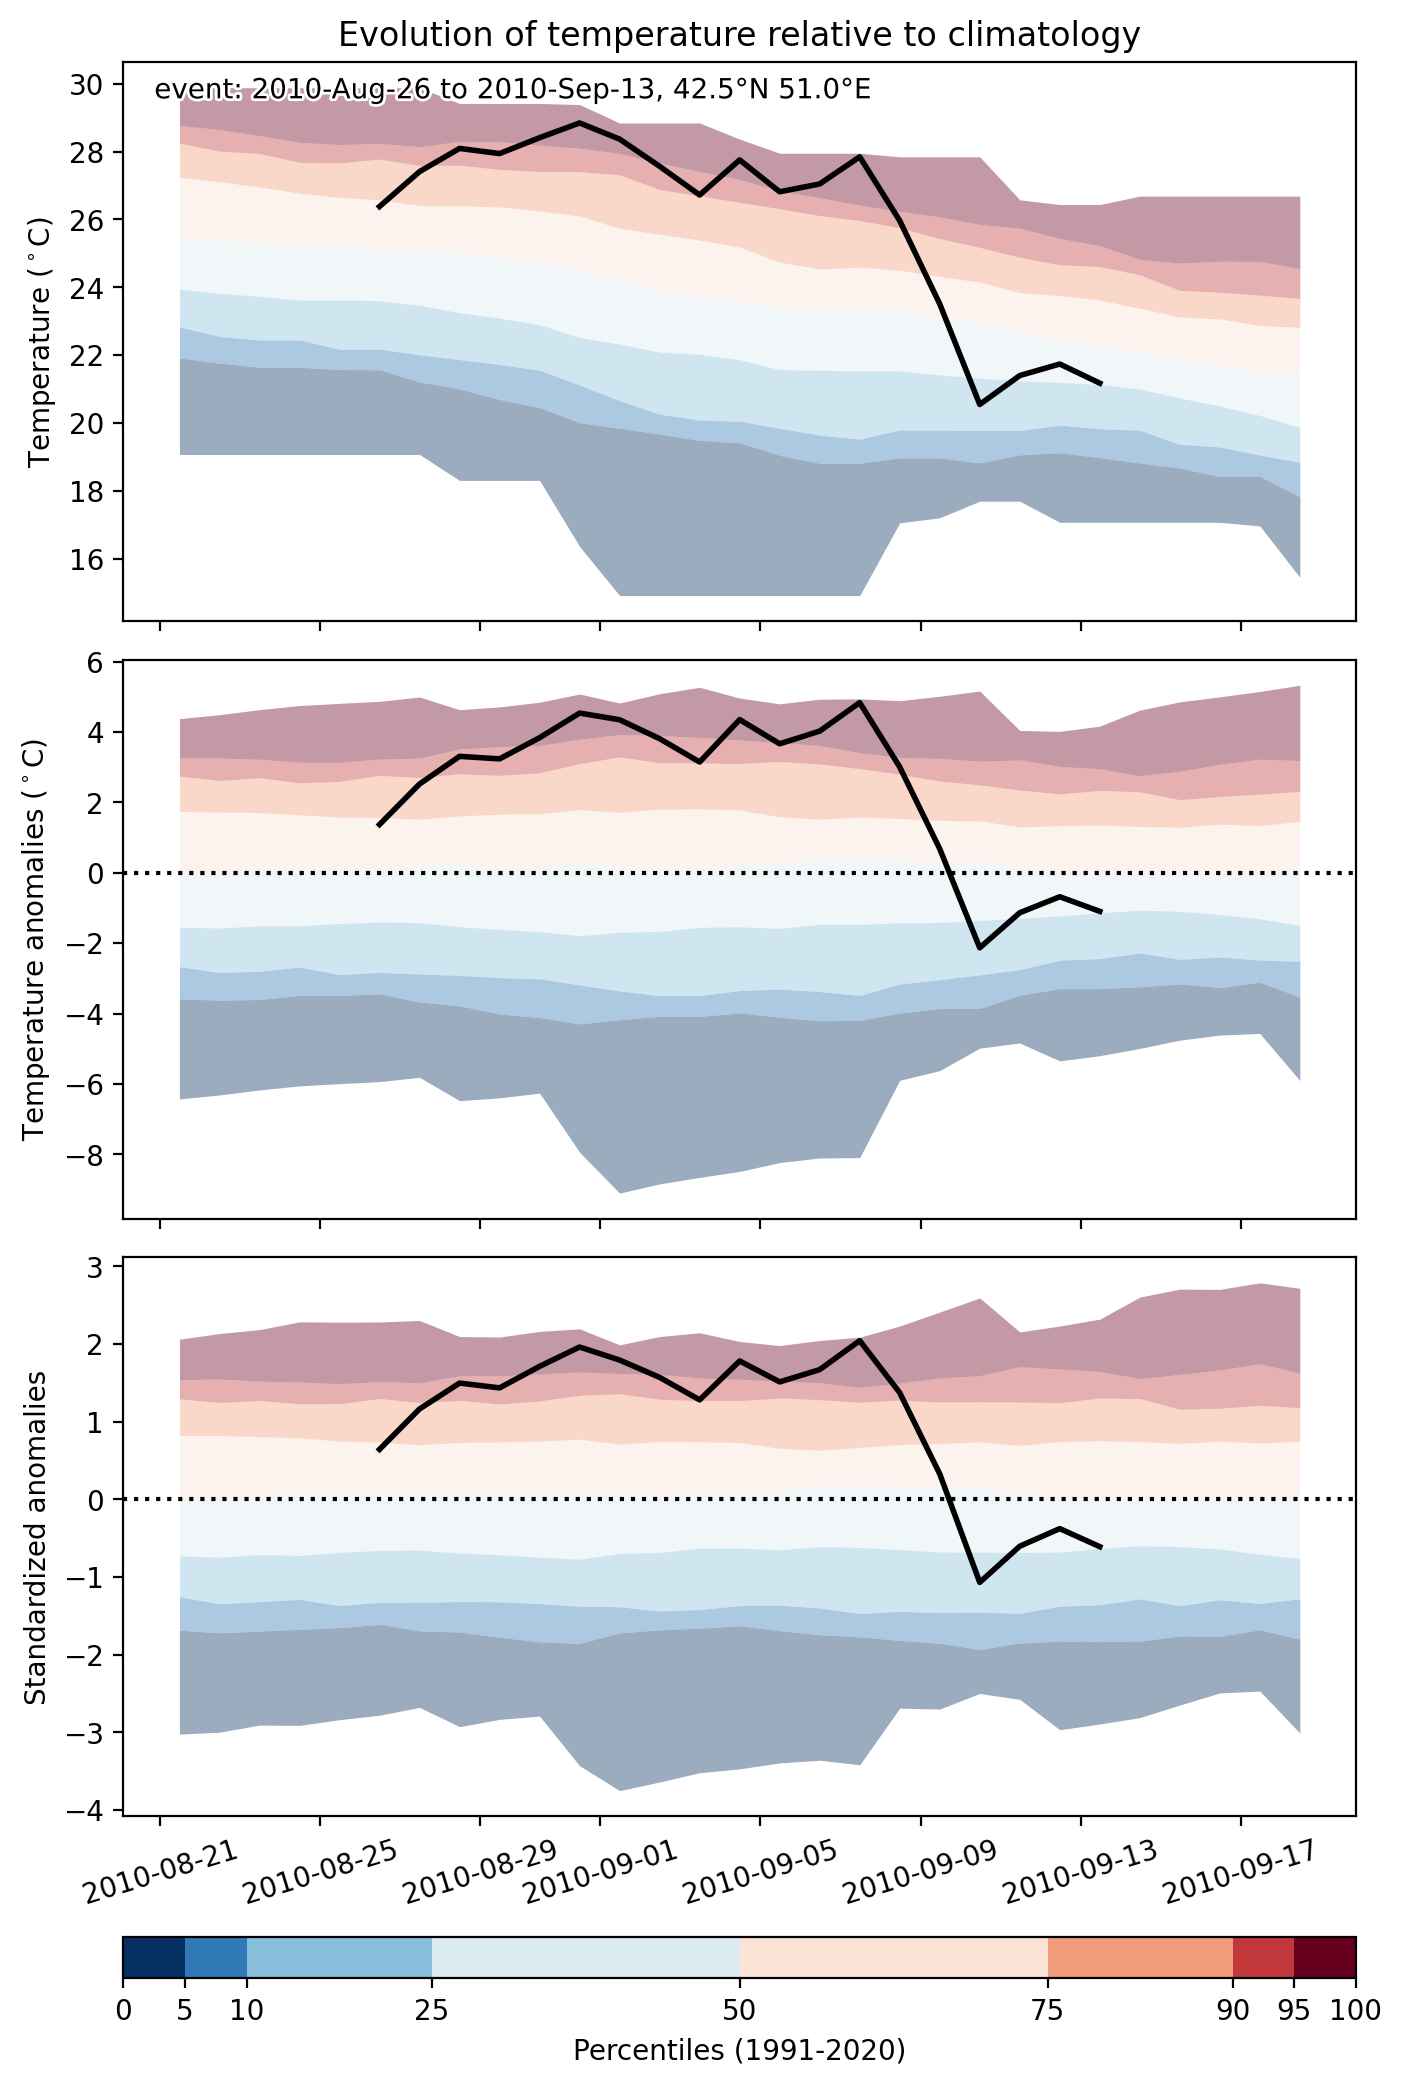
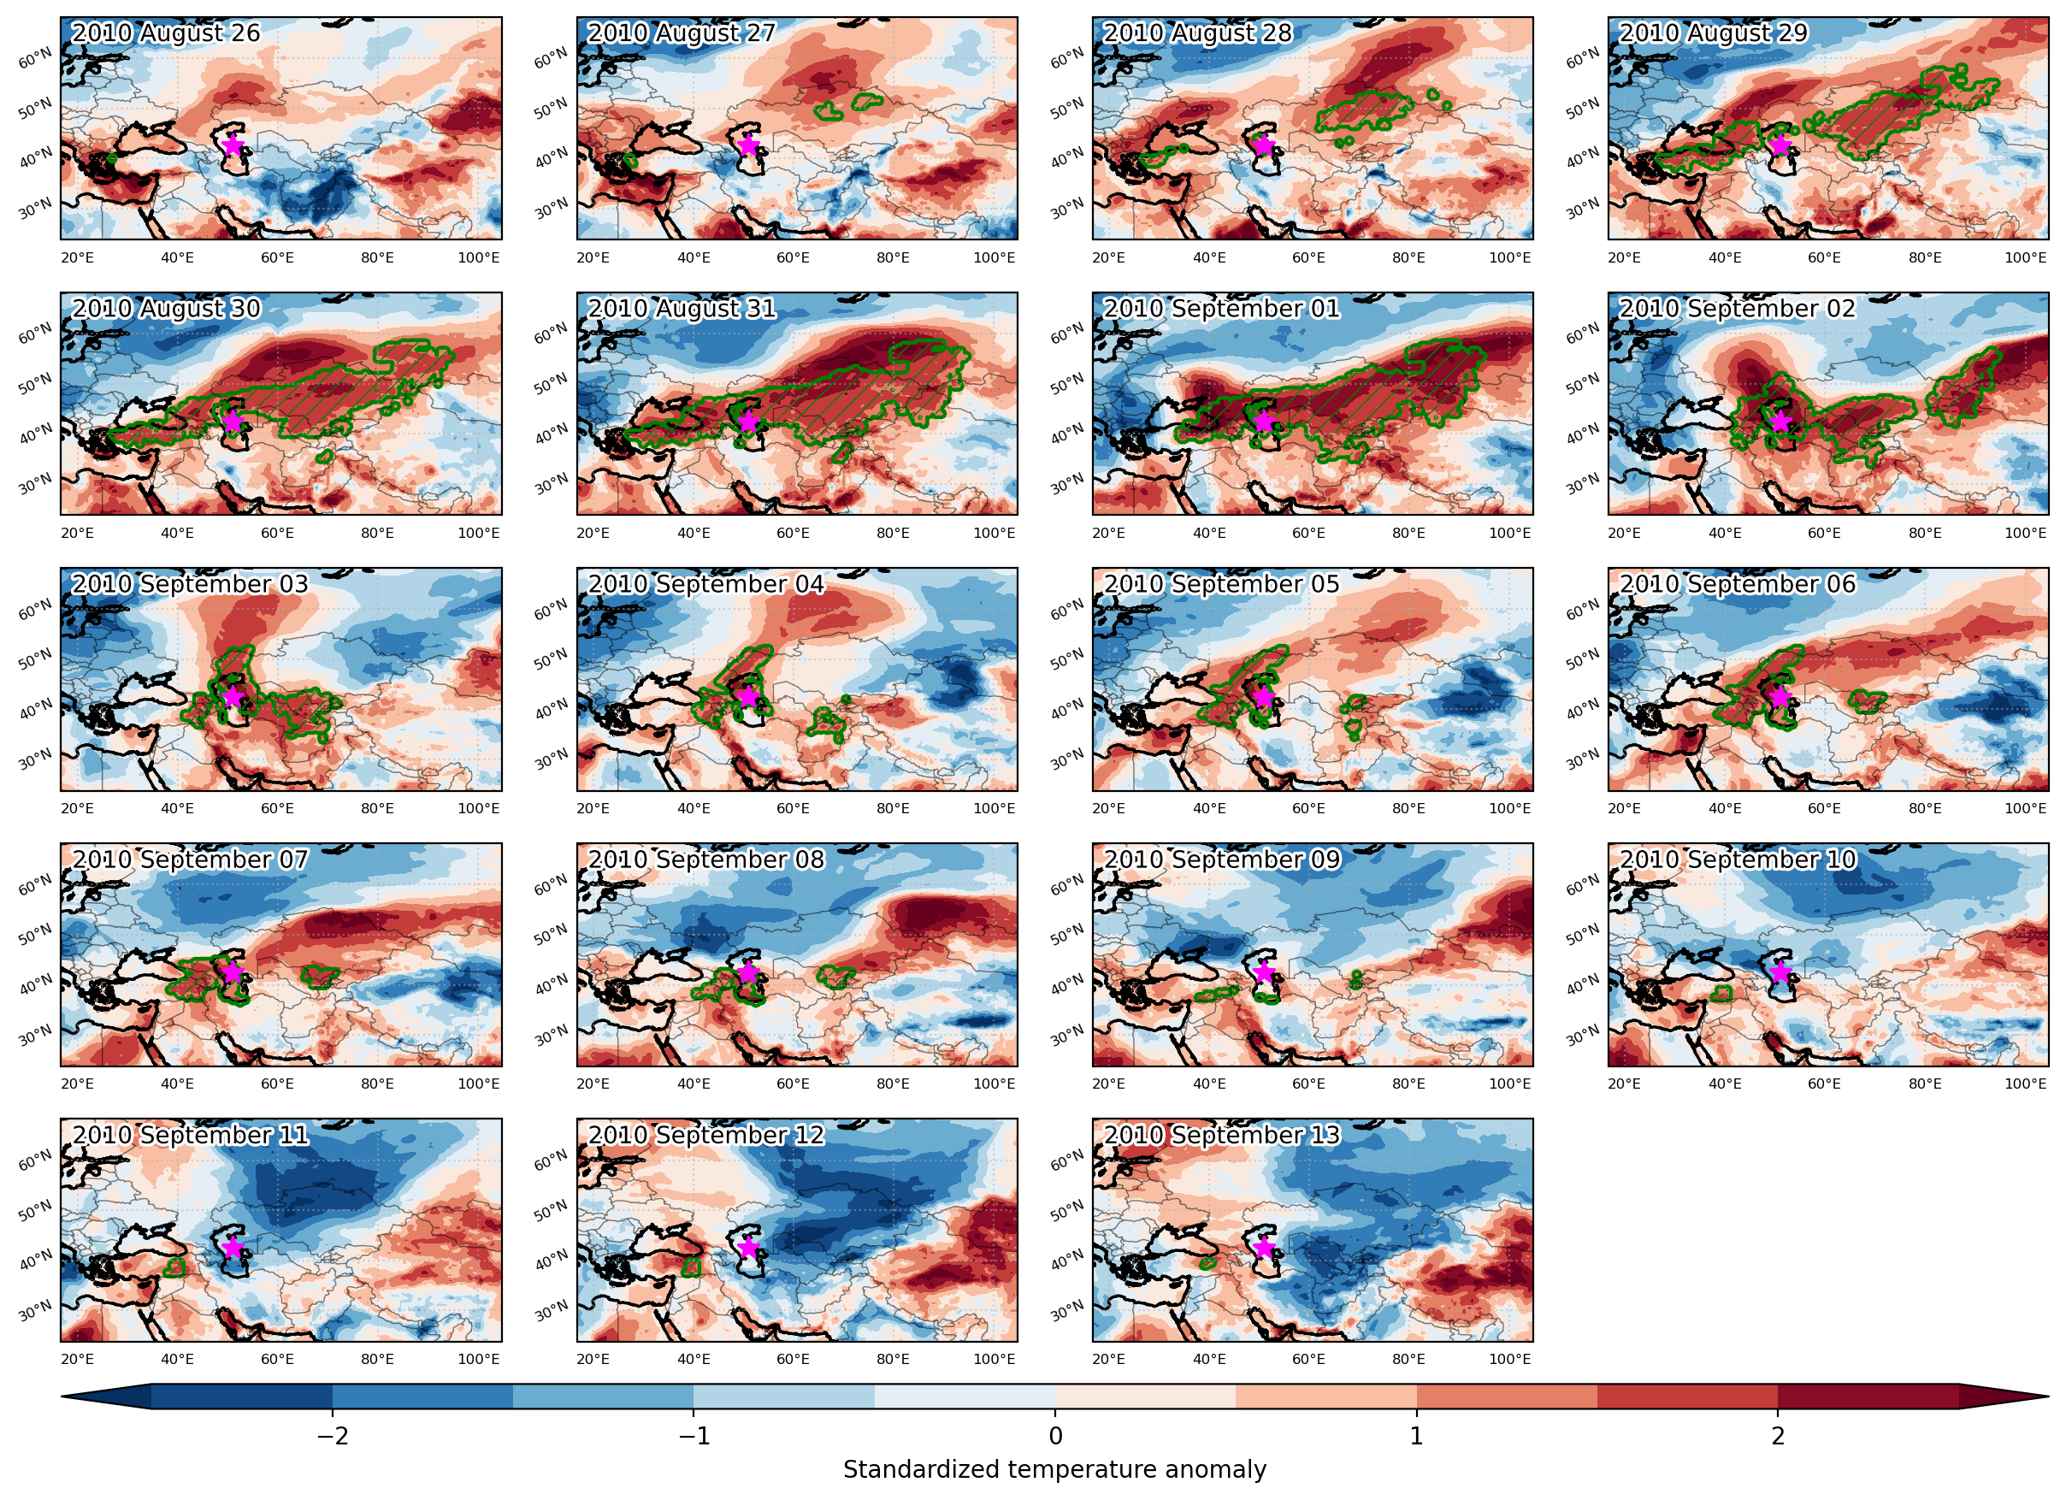
Heat wave occuring from August 26 2010 to September 13 2010 at 42.5°N 51.0°E

Download data: JSON

Event type: Heat wave

Countries affected (identified with ArcGIS Online; provided only for geographical reference):

  • Afghanistan
  • Armenia
  • Azerbaijan
  • China
  • Georgia
  • Iran
  • Iraq
  • Kazakhstan
  • Kyrgyzstan
  • Mongolia
  • Russian Federation
  • Tajikistan
  • Turkiye
  • Turkmenistan
  • Uzbekistan

Duration: 19 days

Time span: August 26 2010 to September 13 2010

Statistics over entire affected area:

  • Mean temperature anomaly: 6.2 °C
  • Mean temperature: 25.7 °C
  • Maximum temperature anomaly: 11.7 °C
  • Maximum temperature: 34.7 °C

Event center: 42.5°N 51.0°E

Area affected: 4742410 km$^2$


Fig. 1: Map of most extreme temperature anomalies (standardized) experienced during the event. The purple star indicates the center of the extreme event. Green hatching illustrates all areas under the effect of extremes at some time during the event.


Fig. 2: Evolution of temperature at the center of the event. The climatological percentile distribution is illustrated with color shadings.


Fig. 3: Maps illustrating the evolution of standardized temperature anomalies during the event.

Event ID: Heat_wave_2010-Aug-26_to_2010-Sep-13_51.0_42.5

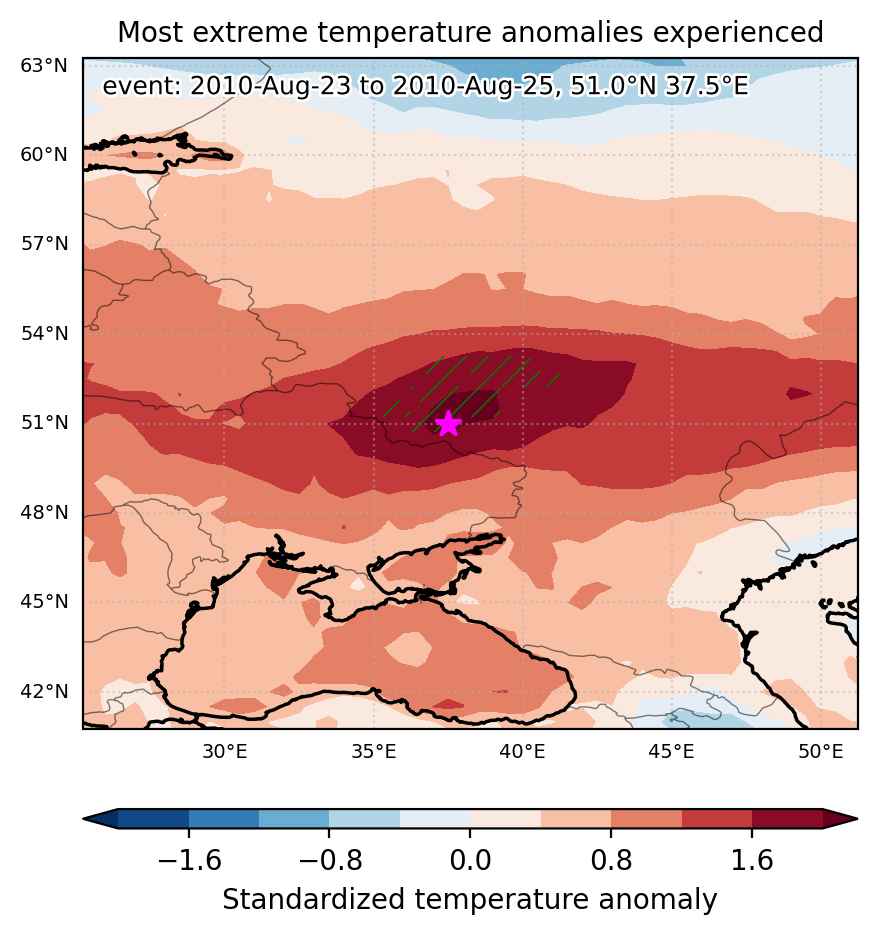
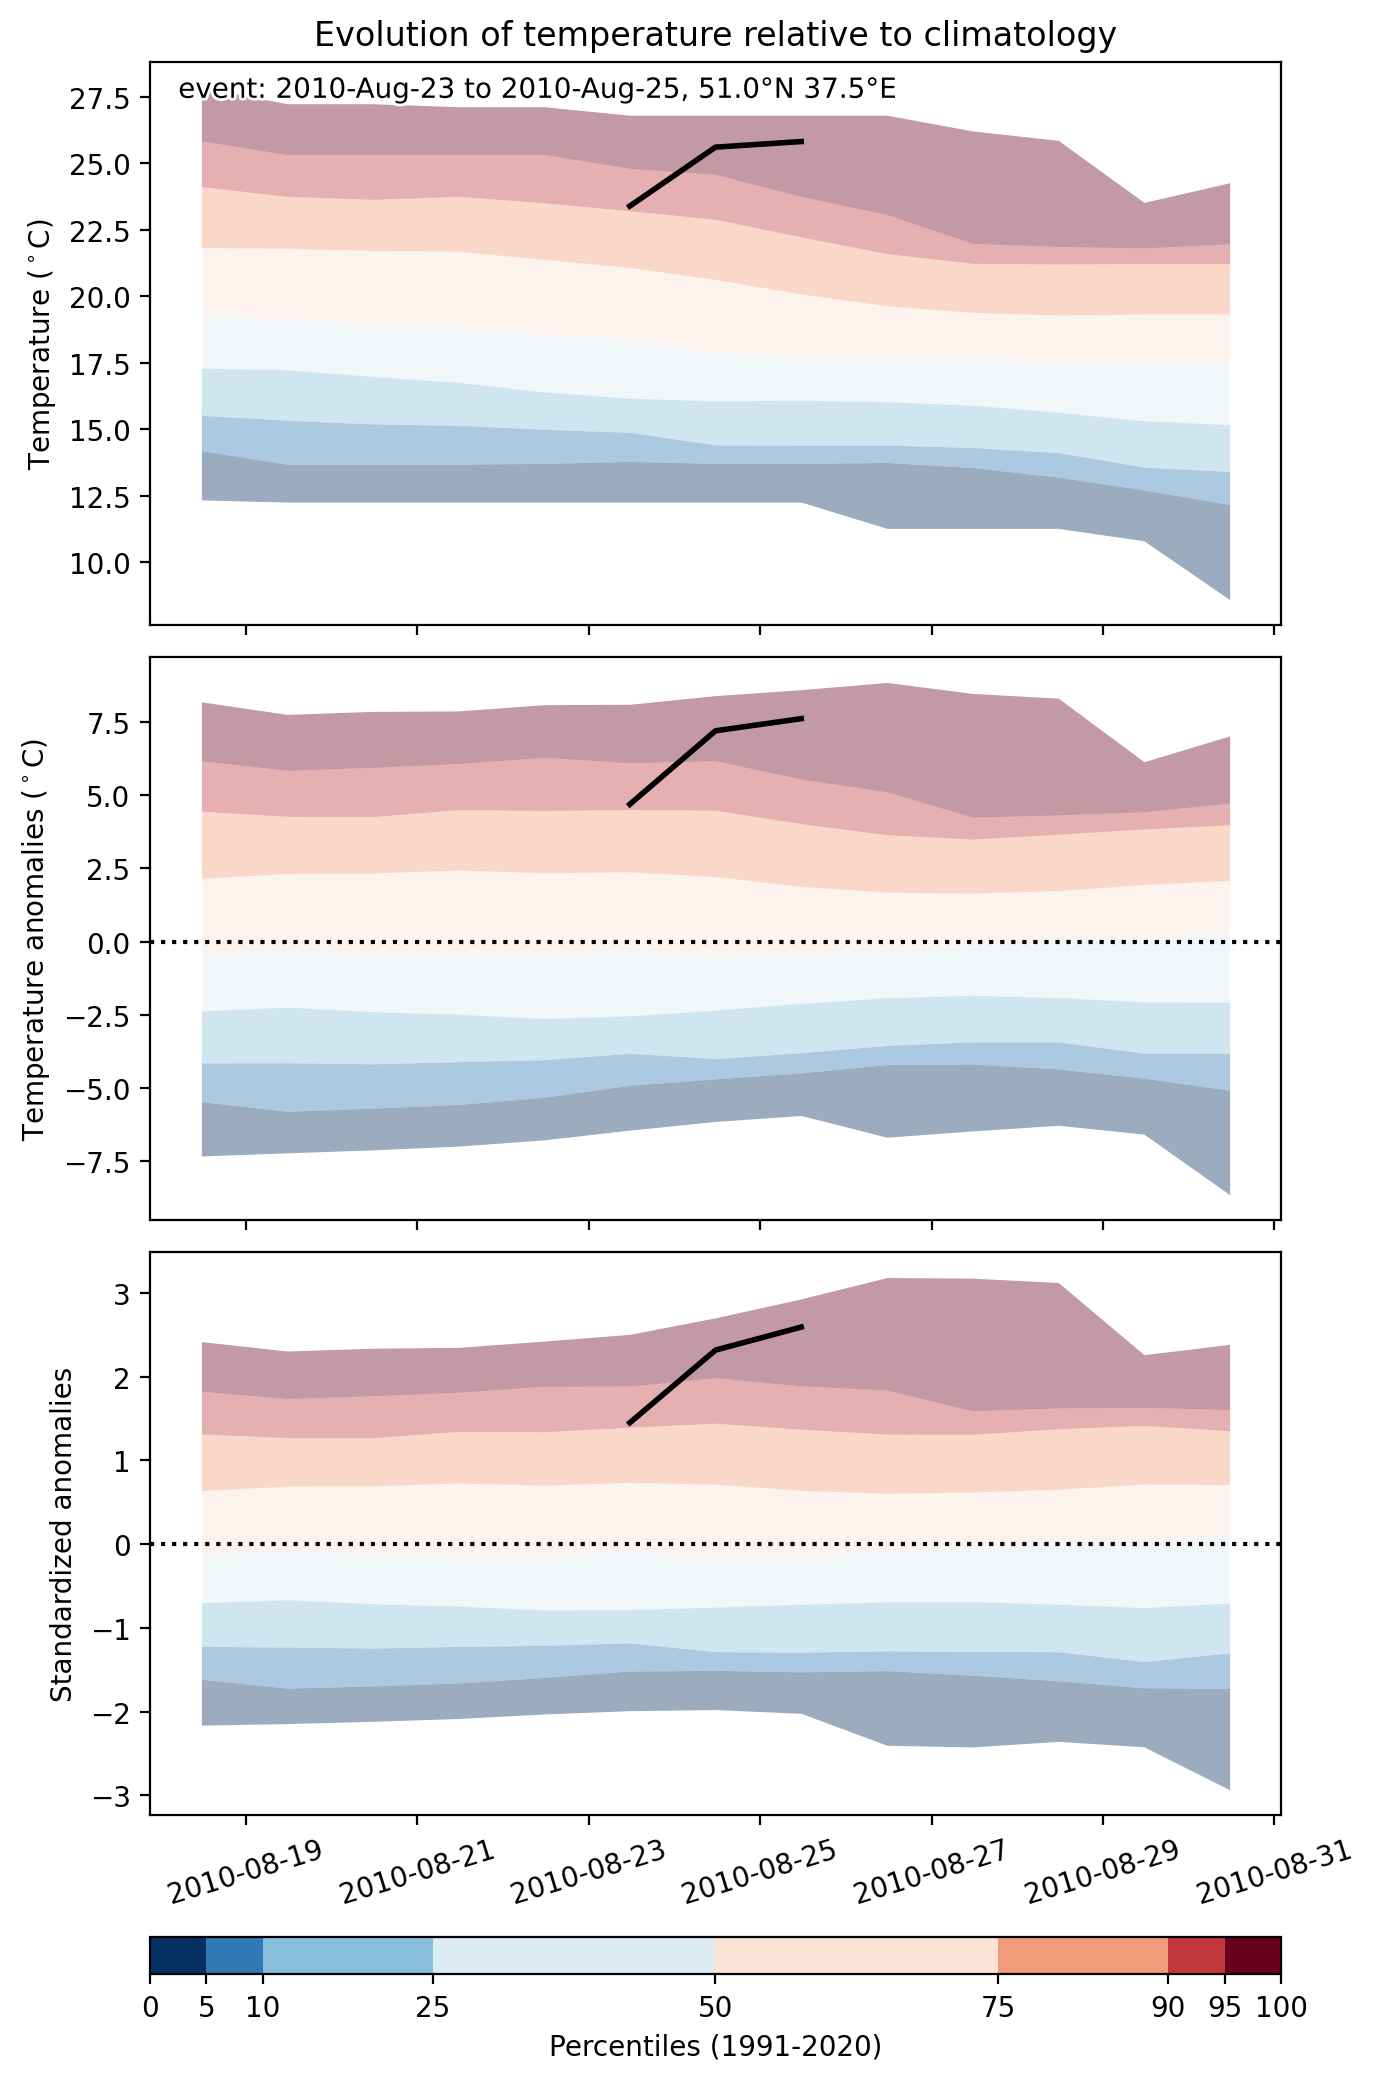
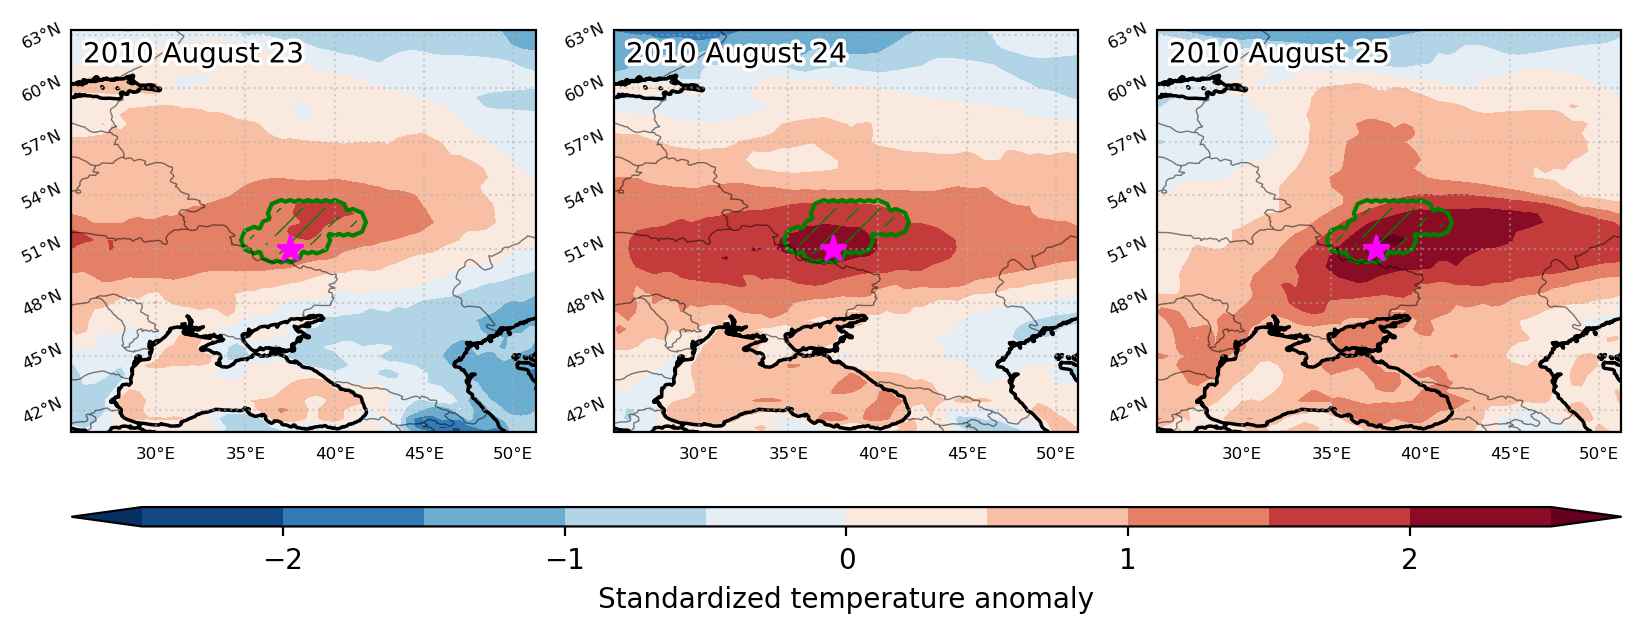
Heat wave occuring from August 23 2010 to August 25 2010 at 51.0°N 37.5°E

Download data: JSON

Event type: Heat wave

Countries affected (identified with ArcGIS Online; provided only for geographical reference):

  • Russian Federation

Duration: 3 days

Time span: August 23 2010 to August 25 2010

Statistics over entire affected area:

  • Mean temperature anomaly: 6.1 °C
  • Mean temperature: 23.9 °C
  • Maximum temperature anomaly: 8.0 °C
  • Maximum temperature: 26.2 °C

Event center: 51.0°N 37.5°E

Area affected: 58799 km$^2$


Fig. 1: Map of most extreme temperature anomalies (standardized) experienced during the event. The purple star indicates the center of the extreme event. Green hatching illustrates all areas under the effect of extremes at some time during the event.


Fig. 2: Evolution of temperature at the center of the event. The climatological percentile distribution is illustrated with color shadings.


Fig. 3: Maps illustrating the evolution of standardized temperature anomalies during the event.

Event ID: Heat_wave_2010-Aug-23_to_2010-Aug-25_37.5_51.0

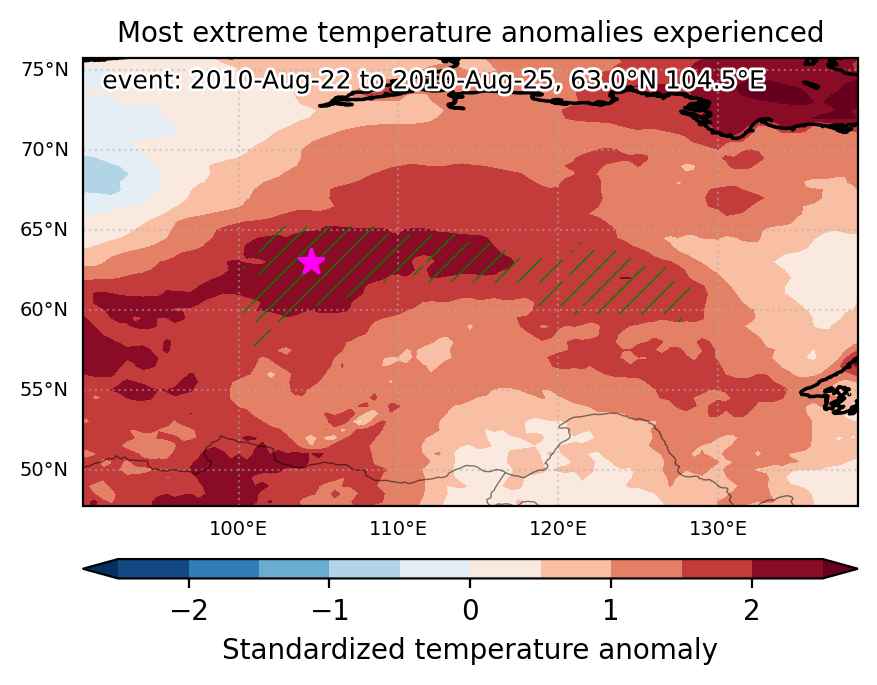
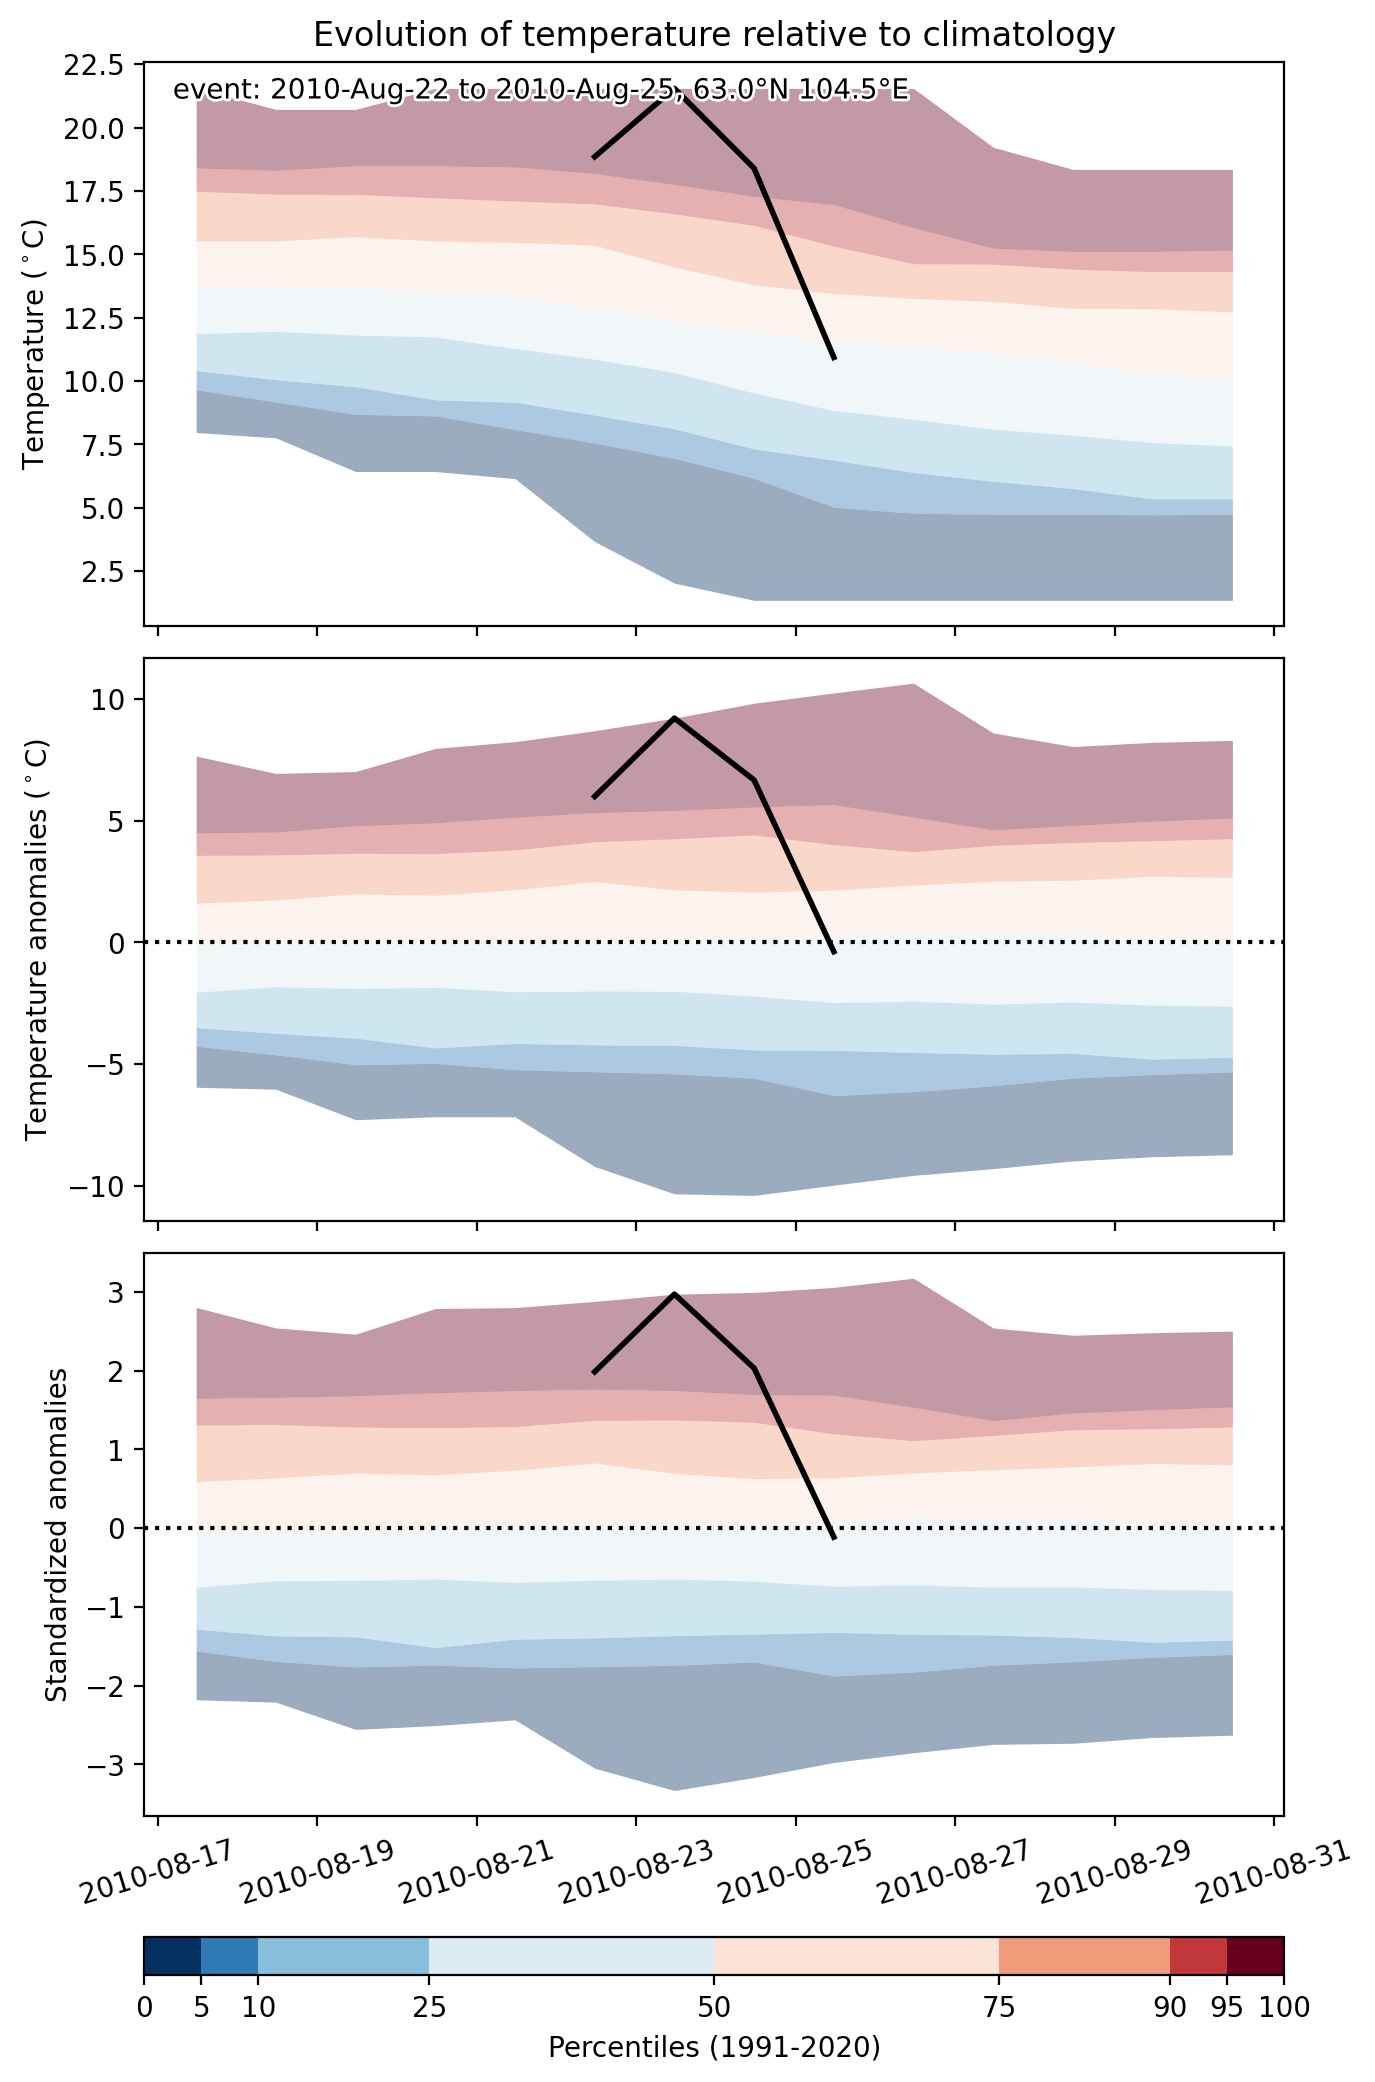
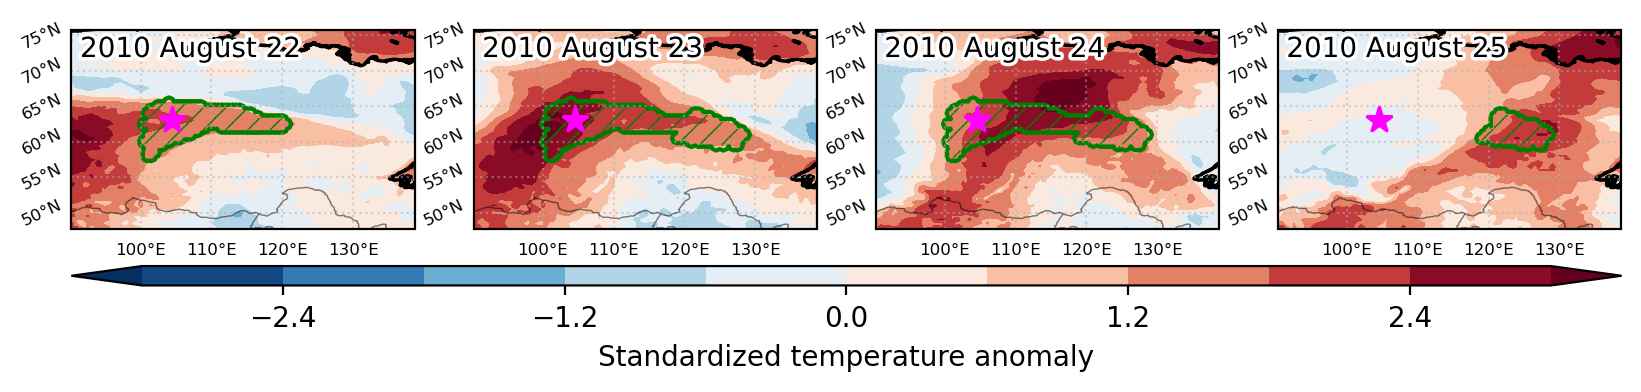
Heat wave occuring from August 22 2010 to August 25 2010 at 63.0°N 104.5°E

Download data: JSON

Event type: Heat wave

Countries affected (identified with ArcGIS Online; provided only for geographical reference):

  • Russian Federation

Duration: 4 days

Time span: August 22 2010 to August 25 2010

Statistics over entire affected area:

  • Mean temperature anomaly: 6.8 °C
  • Mean temperature: 19.1 °C
  • Maximum temperature anomaly: 11.6 °C
  • Maximum temperature: 23.3 °C

Event center: 63.0°N 104.5°E

Area affected: 546963 km$^2$


Fig. 1: Map of most extreme temperature anomalies (standardized) experienced during the event. The purple star indicates the center of the extreme event. Green hatching illustrates all areas under the effect of extremes at some time during the event.


Fig. 2: Evolution of temperature at the center of the event. The climatological percentile distribution is illustrated with color shadings.


Fig. 3: Maps illustrating the evolution of standardized temperature anomalies during the event.

Event ID: Heat_wave_2010-Aug-22_to_2010-Aug-25_104.5_63.0

Heat wave occuring from August 21 2010 to August 23 2010 at 57.5°N 90.0°E

Download data: JSON

Event type: Heat wave

Countries affected (identified with ArcGIS Online; provided only for geographical reference):

  • Russian Federation

Duration: 3 days

Time span: August 21 2010 to August 23 2010

Statistics over entire affected area:

  • Mean temperature anomaly: 6.3 °C
  • Mean temperature: 20.6 °C
  • Maximum temperature anomaly: 10.2 °C
  • Maximum temperature: 25.0 °C

Event center: 57.5°N 90.0°E

Area affected: 99082 km$^2$


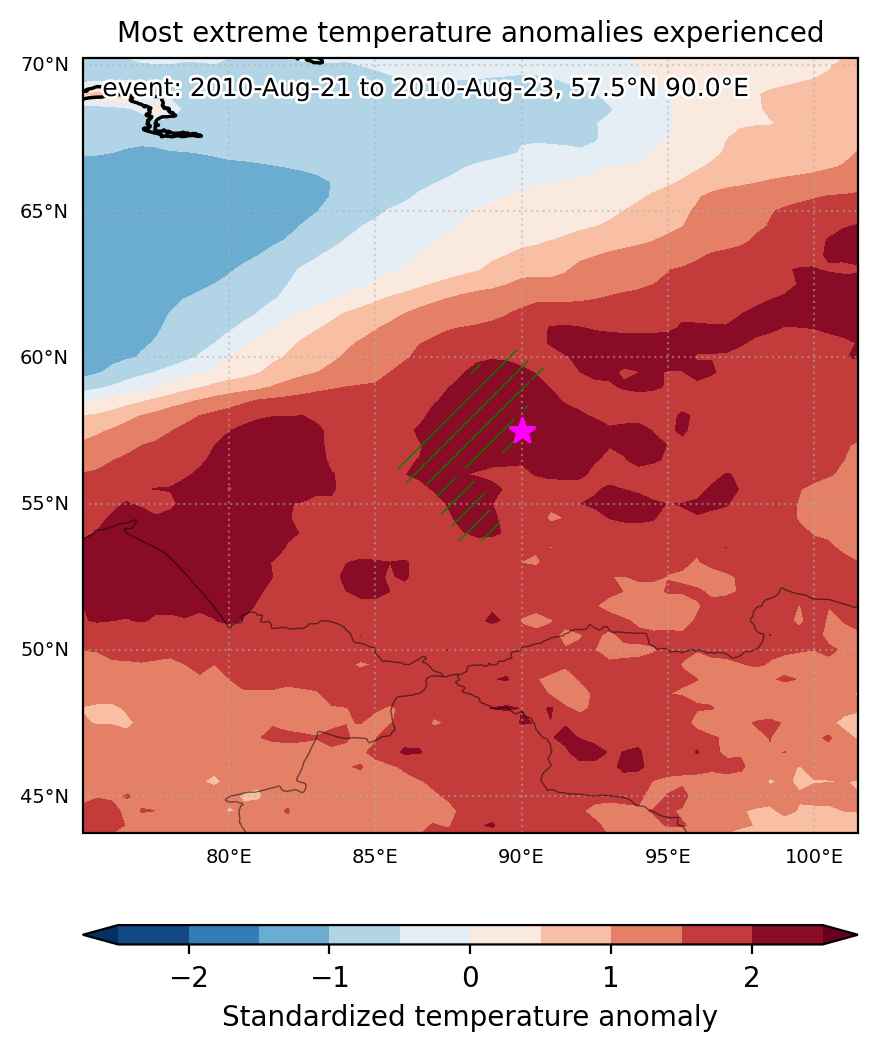
Fig. 1: Map of most extreme temperature anomalies (standardized) experienced during the event. The purple star indicates the center of the extreme event. Green hatching illustrates all areas under the effect of extremes at some time during the event.


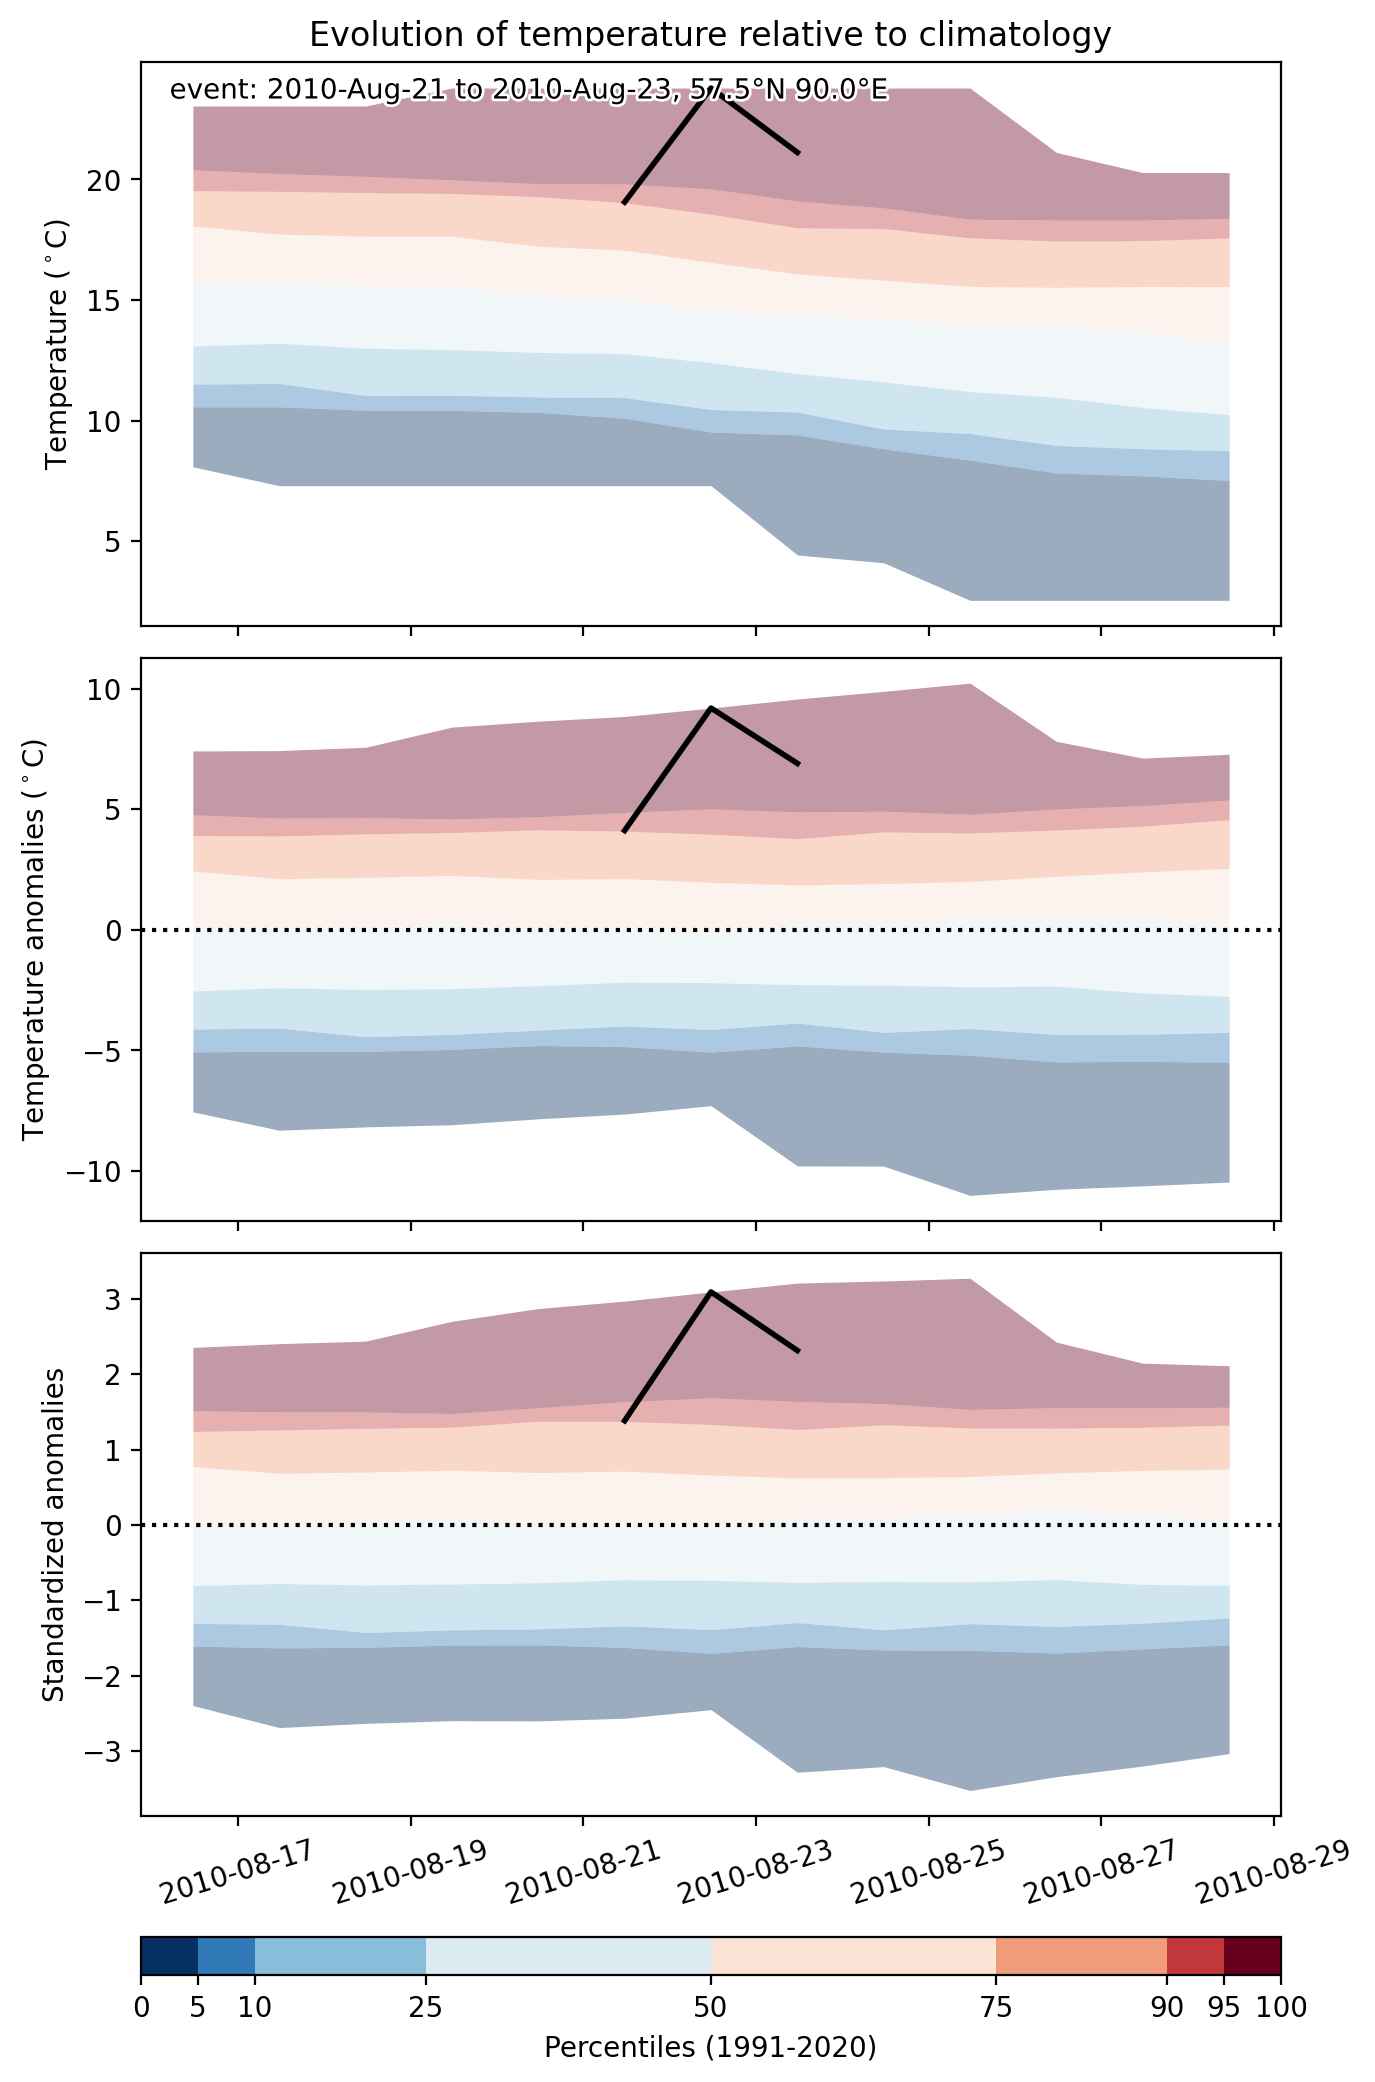
Fig. 2: Evolution of temperature at the center of the event. The climatological percentile distribution is illustrated with color shadings.


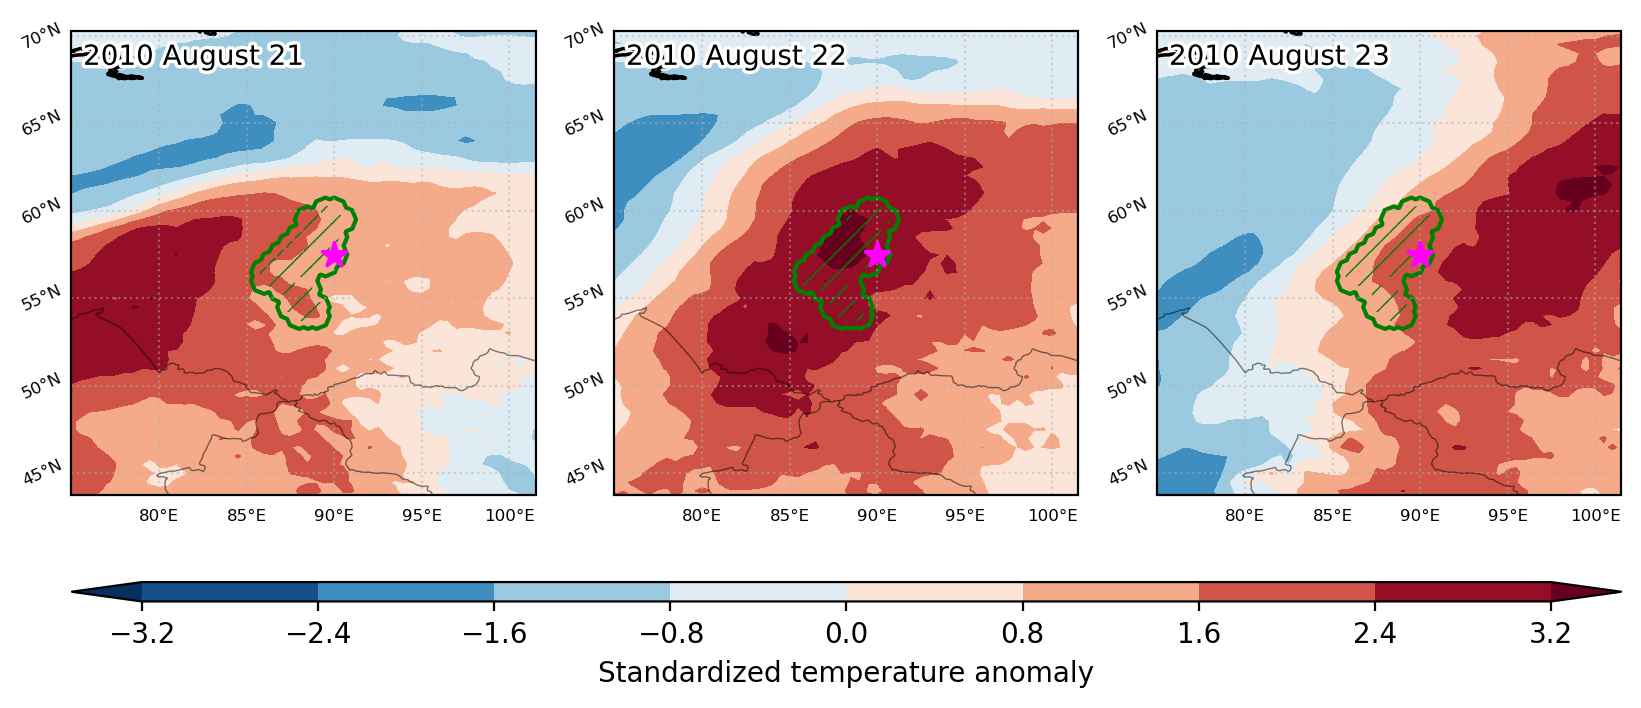
Fig. 3: Maps illustrating the evolution of standardized temperature anomalies during the event.

Event ID: Heat_wave_2010-Aug-21_to_2010-Aug-23_90.0_57.5

Heat wave occuring from August 20 2010 to August 28 2010 at 46.5°N 92.0°E

Download data: JSON

Event type: Heat wave

Countries affected (identified with ArcGIS Online; provided only for geographical reference):

  • China
  • Kazakhstan
  • Mongolia
  • Russian Federation

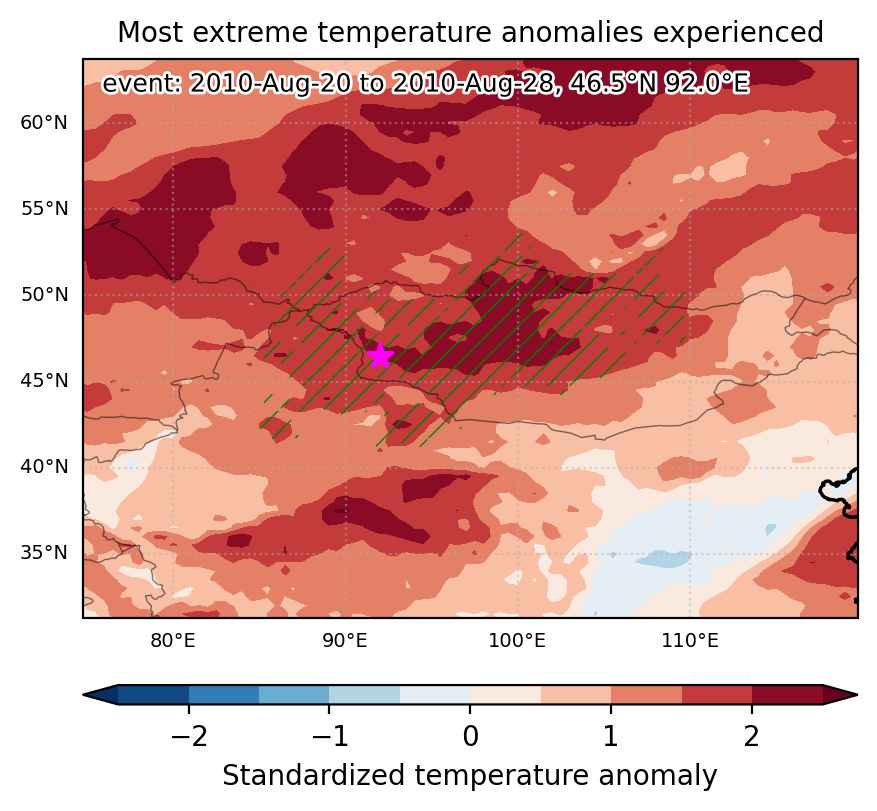
Duration: 9 days

Time span: August 20 2010 to August 28 2010

Statistics over entire affected area:

  • Mean temperature anomaly: 5.6 °C
  • Mean temperature: 20.2 °C
  • Maximum temperature anomaly: 9.1 °C
  • Maximum temperature: 34.5 °C

Event center: 46.5°N 92.0°E

Area affected: 1261477 km$^2$


Fig. 1: Map of most extreme temperature anomalies (standardized) experienced during the event. The purple star indicates the center of the extreme event. Green hatching illustrates all areas under the effect of extremes at some time during the event.


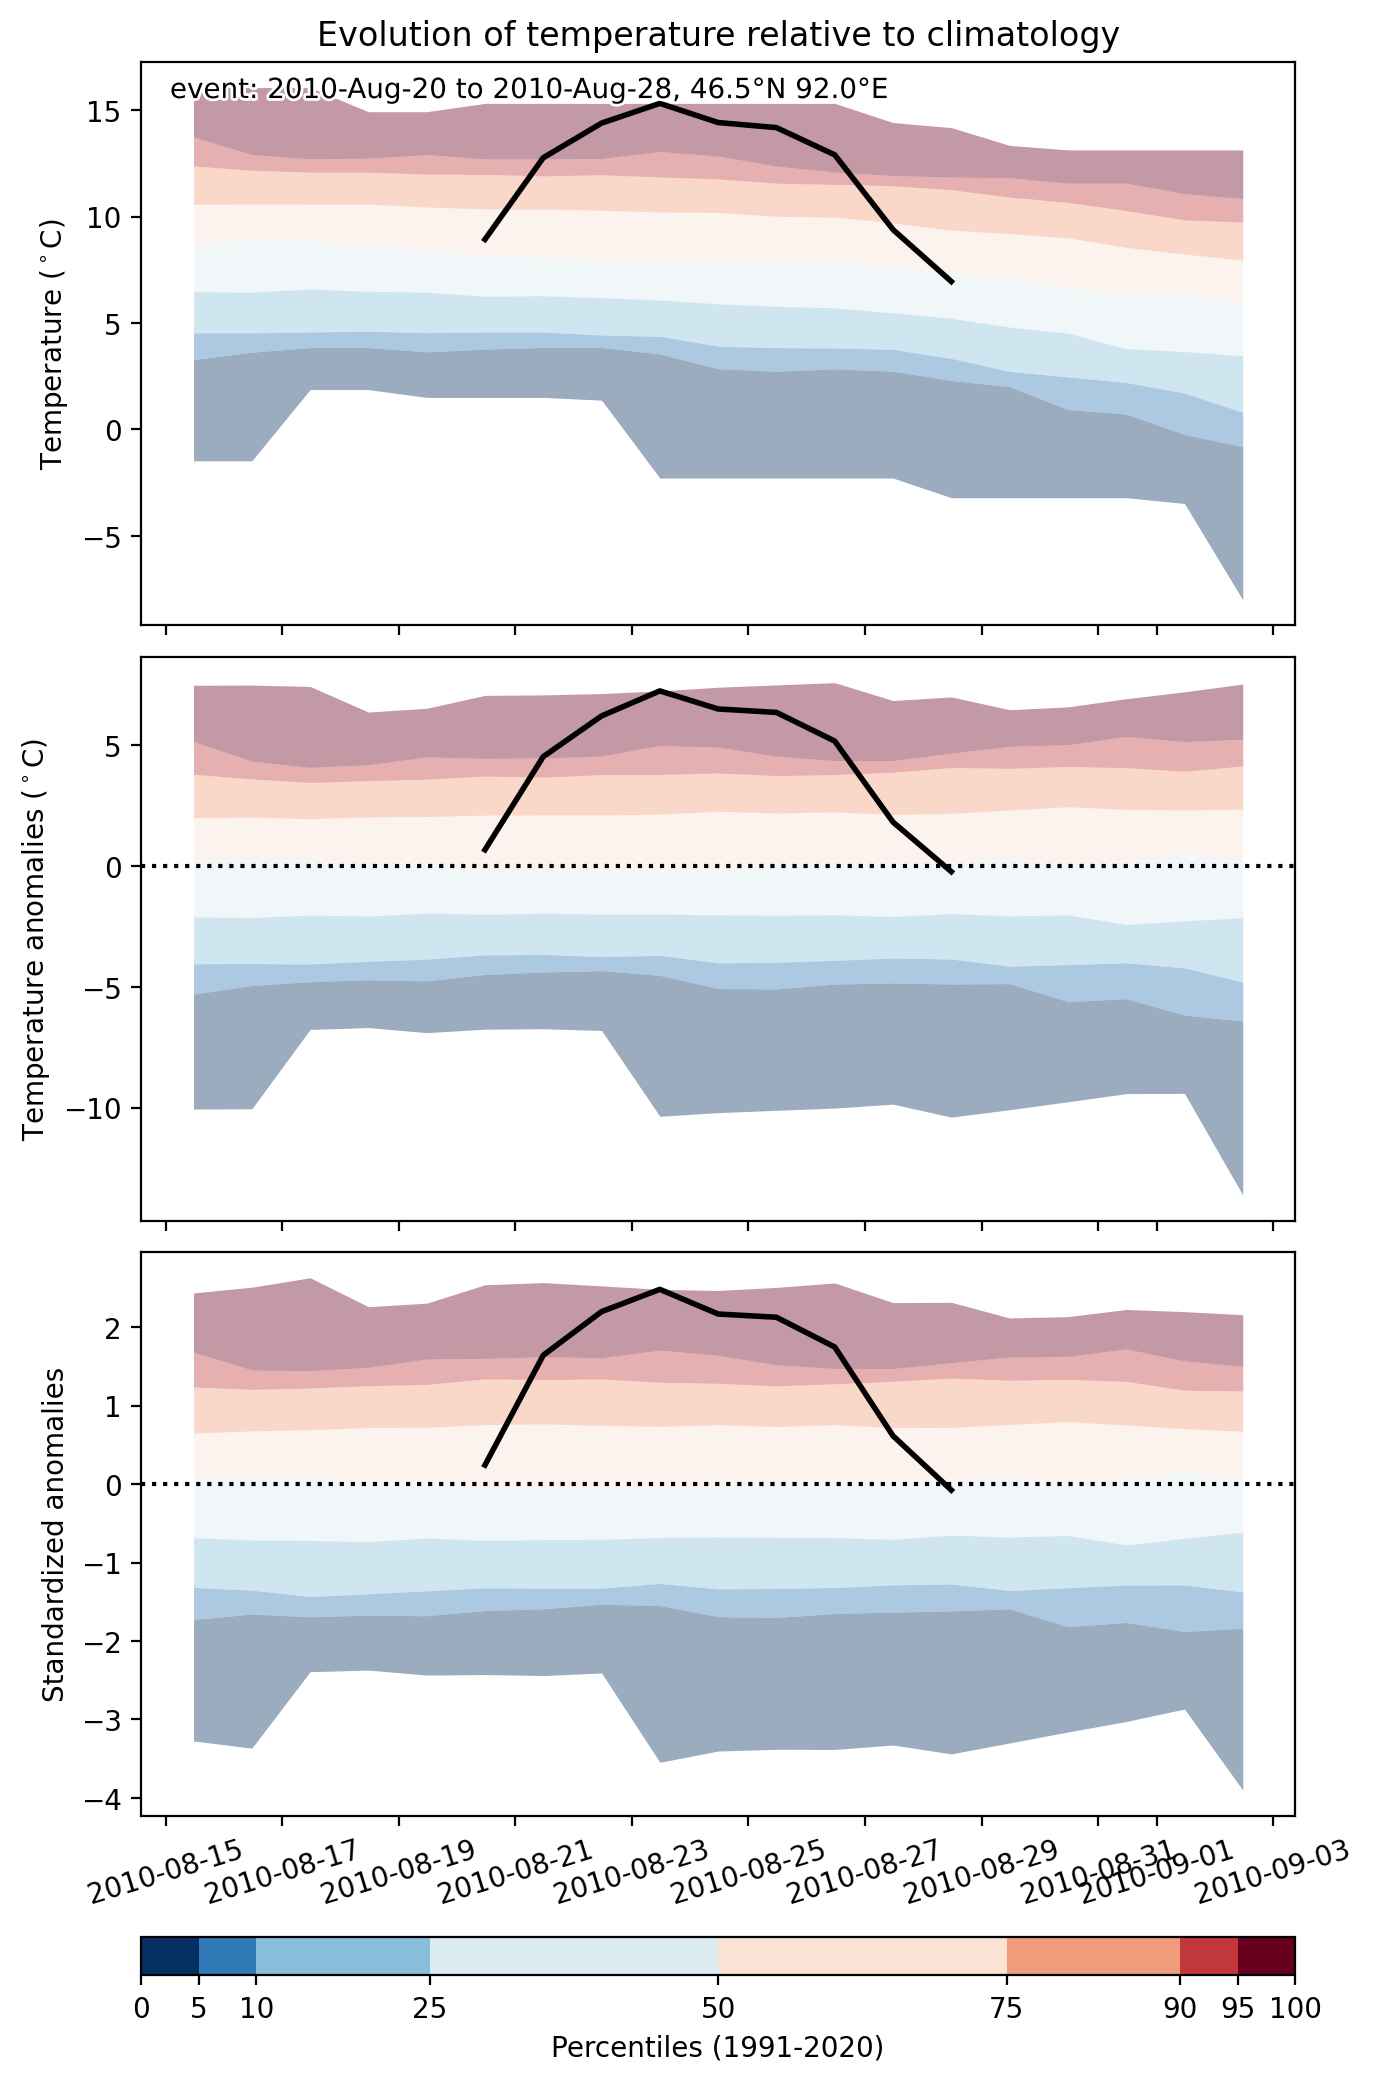
Fig. 2: Evolution of temperature at the center of the event. The climatological percentile distribution is illustrated with color shadings.


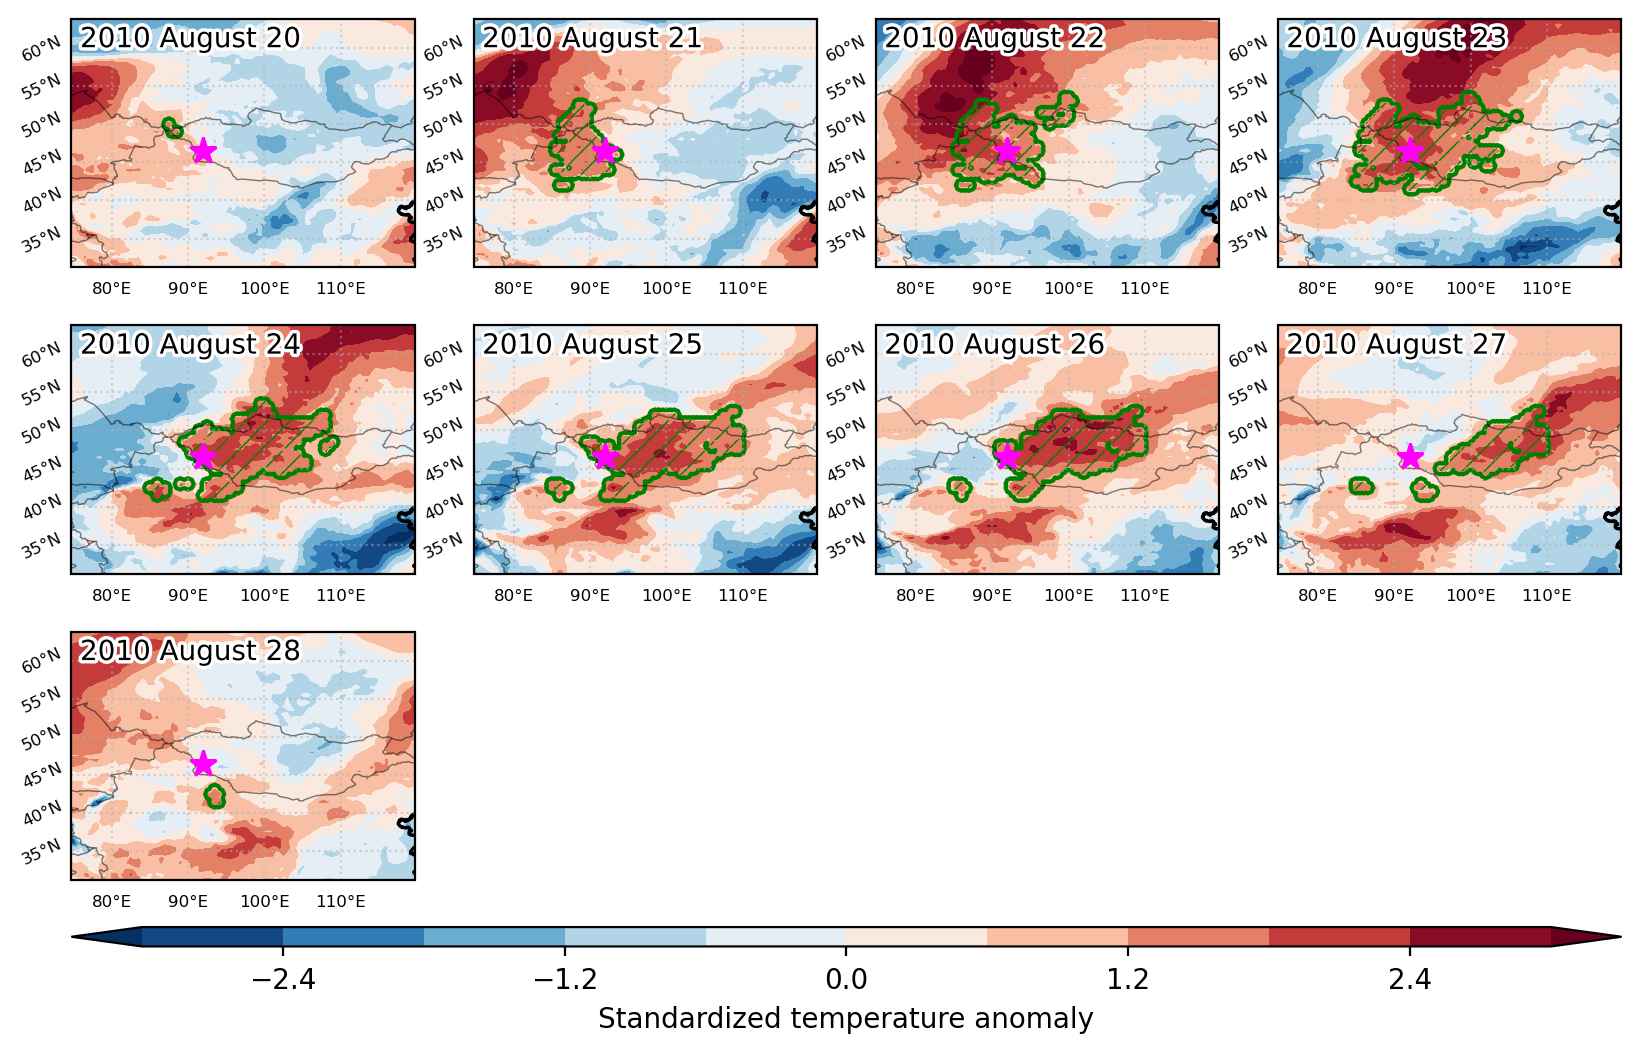
Fig. 3: Maps illustrating the evolution of standardized temperature anomalies during the event.

Event ID: Heat_wave_2010-Aug-20_to_2010-Aug-28_92.0_46.5

Heat wave occuring from August 20 2010 to August 22 2010 at 54.0°N 80.0°E

Download data: JSON

Event type: Heat wave

Countries affected (identified with ArcGIS Online; provided only for geographical reference):

  • Kazakhstan
  • Russian Federation

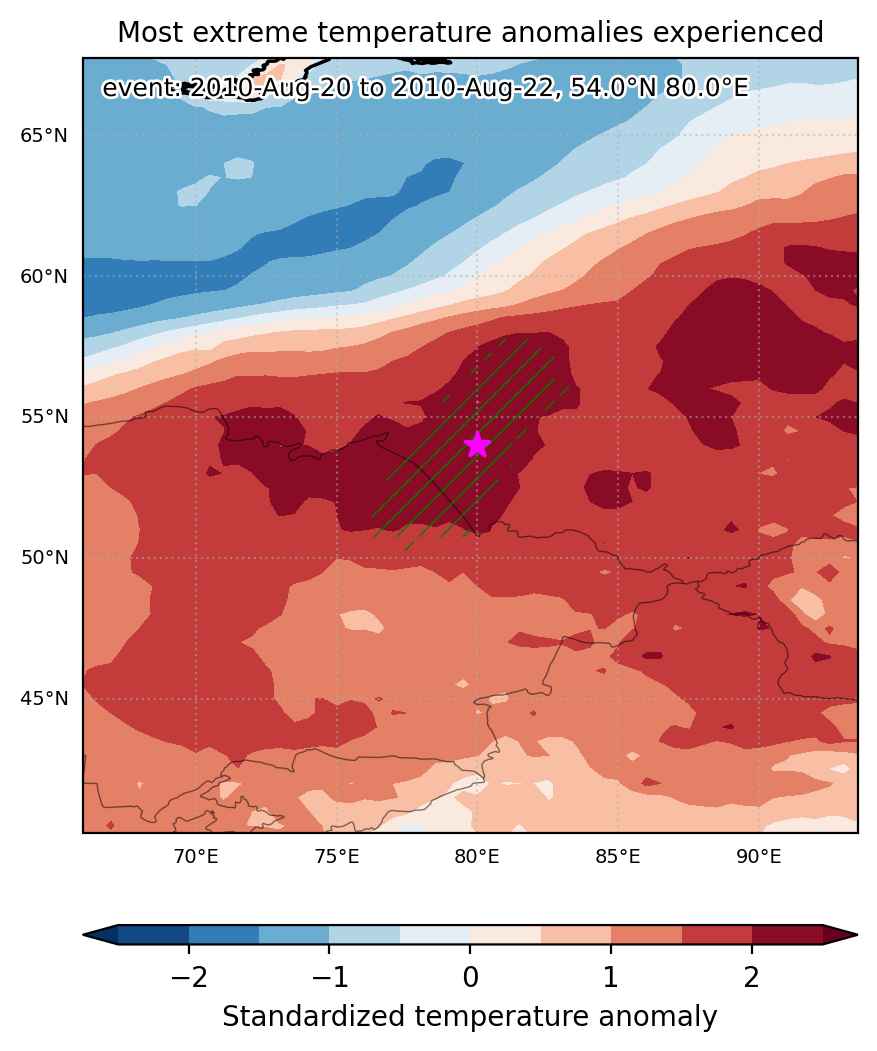
Duration: 3 days

Time span: August 20 2010 to August 22 2010

Statistics over entire affected area:

  • Mean temperature anomaly: 7.1 °C
  • Mean temperature: 24.1 °C
  • Maximum temperature anomaly: 10.4 °C
  • Maximum temperature: 28.9 °C

Event center: 54.0°N 80.0°E

Area affected: 174585 km$^2$


Fig. 1: Map of most extreme temperature anomalies (standardized) experienced during the event. The purple star indicates the center of the extreme event. Green hatching illustrates all areas under the effect of extremes at some time during the event.


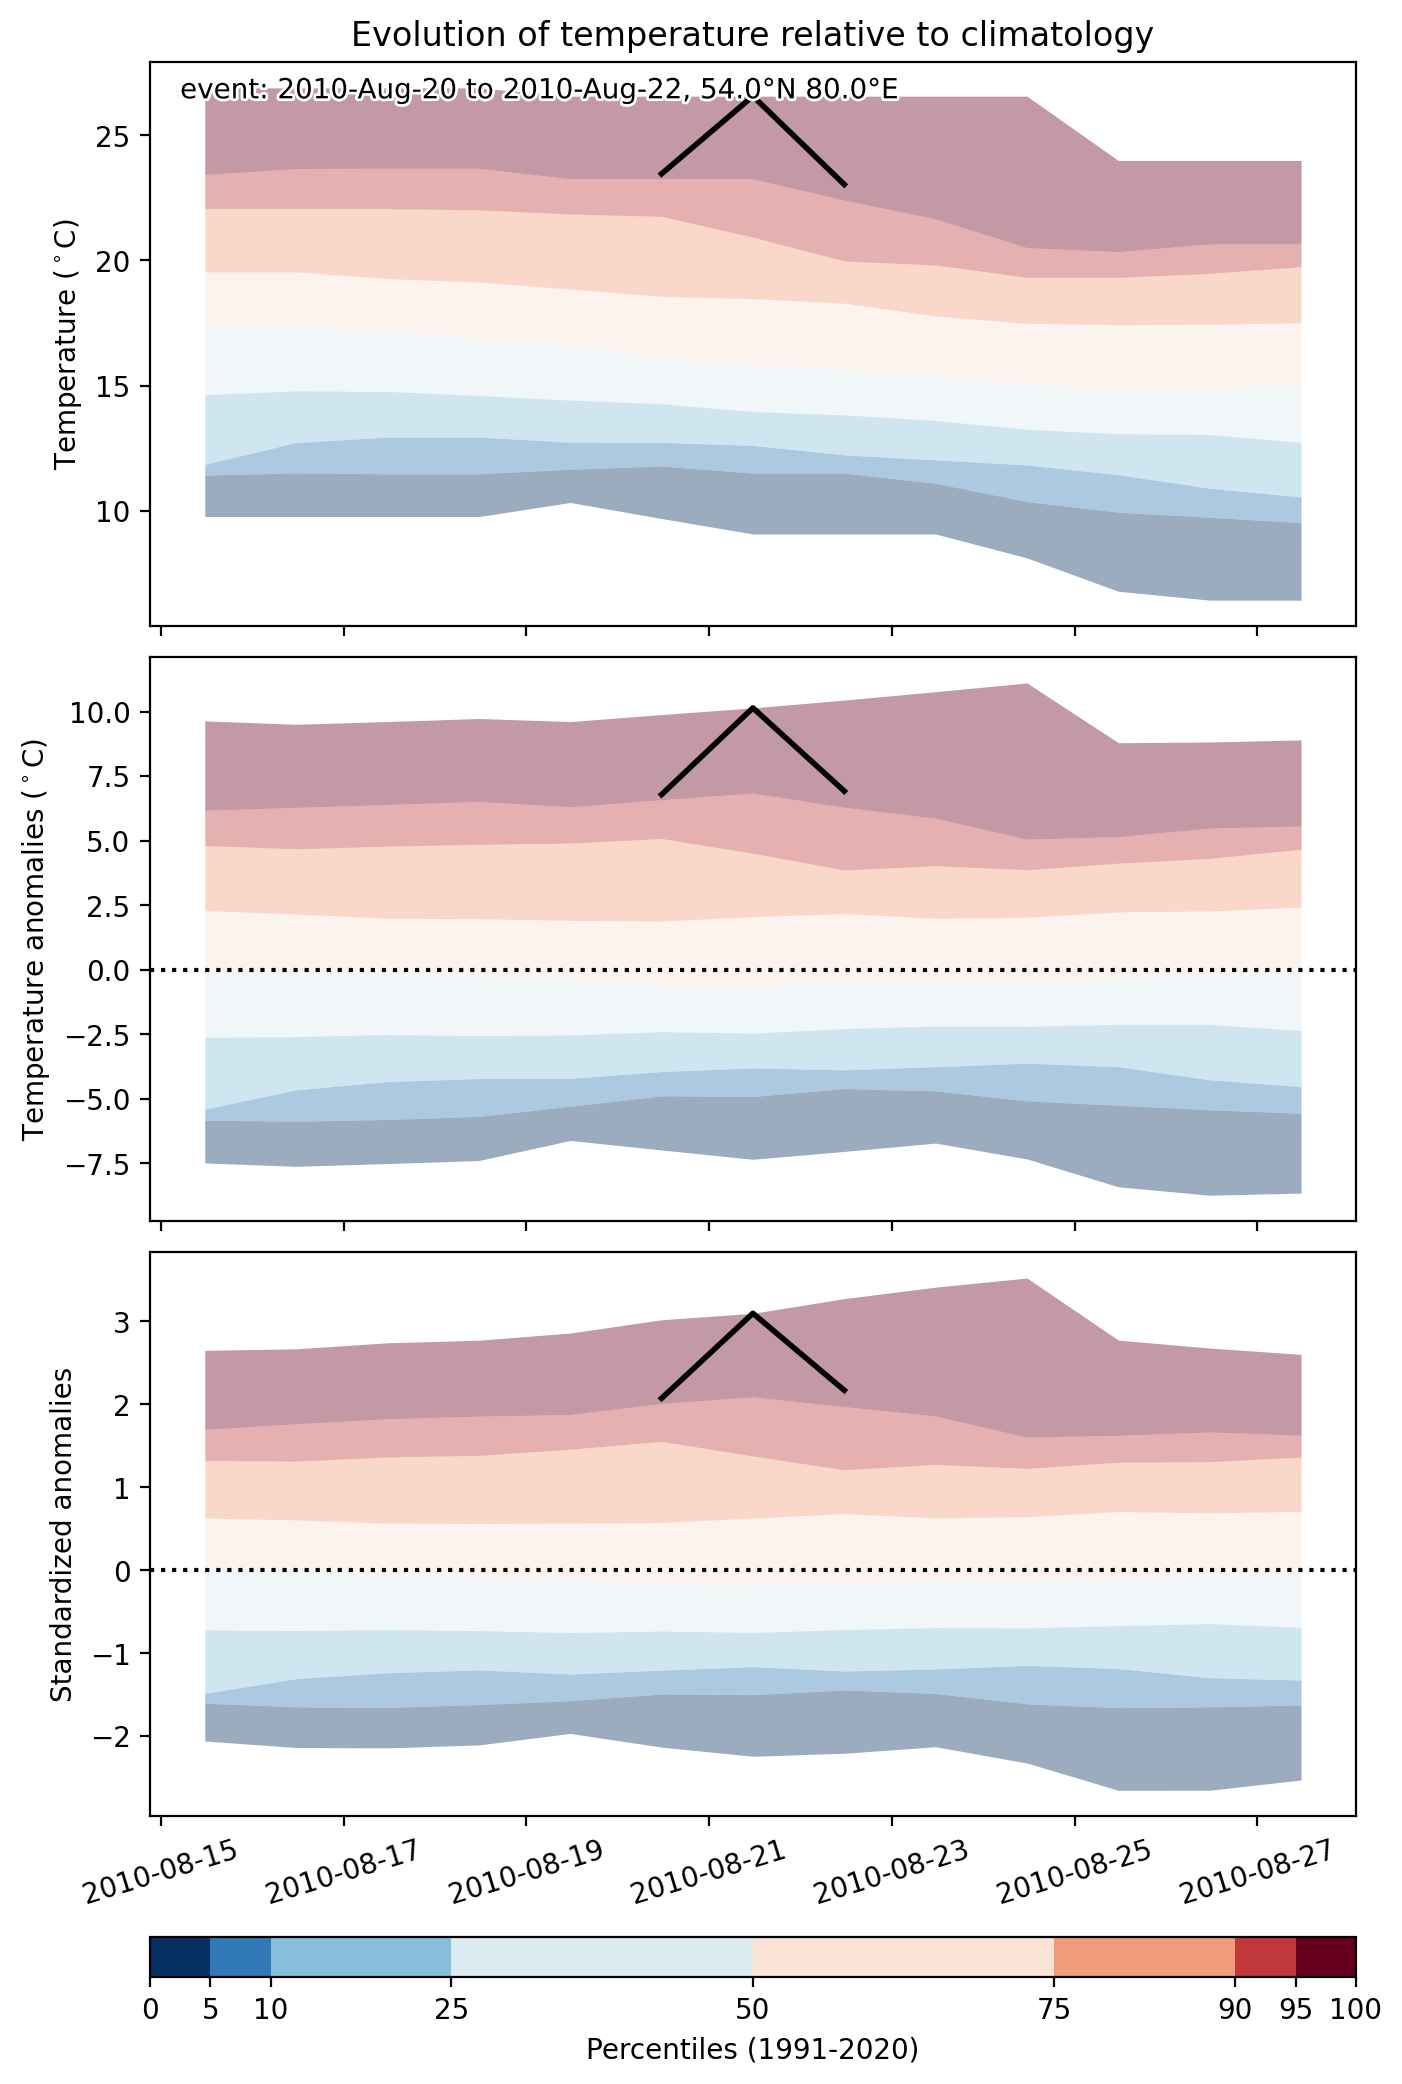
Fig. 2: Evolution of temperature at the center of the event. The climatological percentile distribution is illustrated with color shadings.


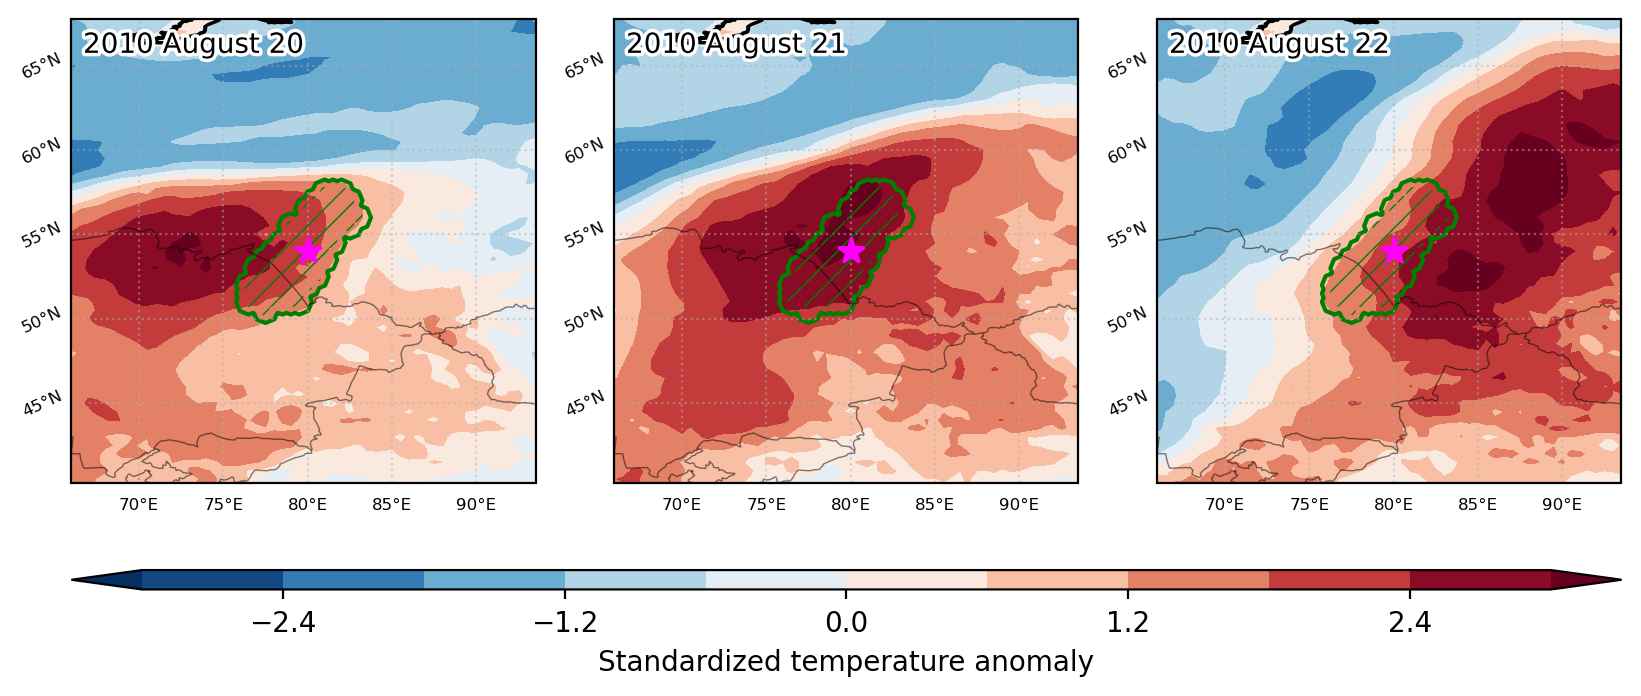
Fig. 3: Maps illustrating the evolution of standardized temperature anomalies during the event.

Event ID: Heat_wave_2010-Aug-20_to_2010-Aug-22_80.0_54.0