Cold spell occuring from July 06 2010 to July 13 2010 at 52.0°N 77.0°E

Download data: JSON

Event type: Cold spell

Countries affected (identified with ArcGIS Online; provided only for geographical reference):

  • China
  • Kazakhstan
  • Mongolia
  • Russian Federation

Duration: 8 days

Time span: July 06 2010 to July 13 2010

Statistics over entire affected area:

  • Mean temperature anomaly: -5.8 °C
  • Mean temperature: 13.3 °C
  • Minimum temperature anomaly: -8.9 °C
  • Minimum temperature: 2.0 °C

Event center: 52.0°N 77.0°E

Area affected: 1093739 km$^2$
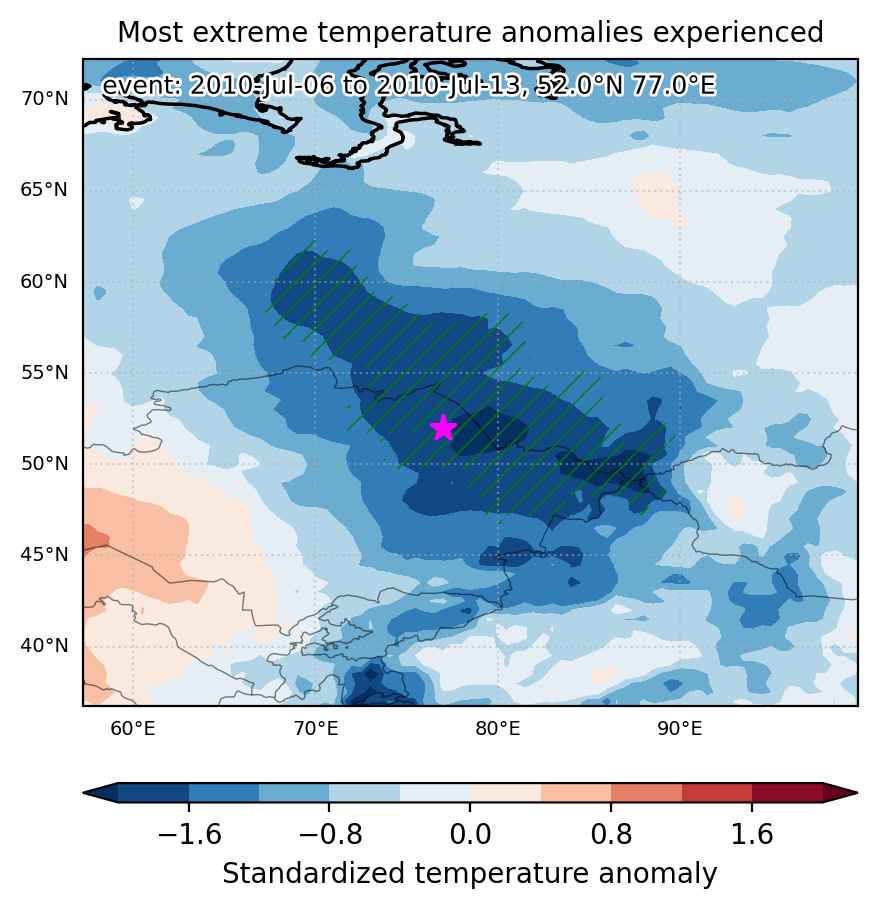

Fig. 1: Map of most extreme temperature anomalies (standardized) experienced during the event. The purple star indicates the center of the extreme event. Green hatching illustrates all areas under the effect of extremes at some time during the event.
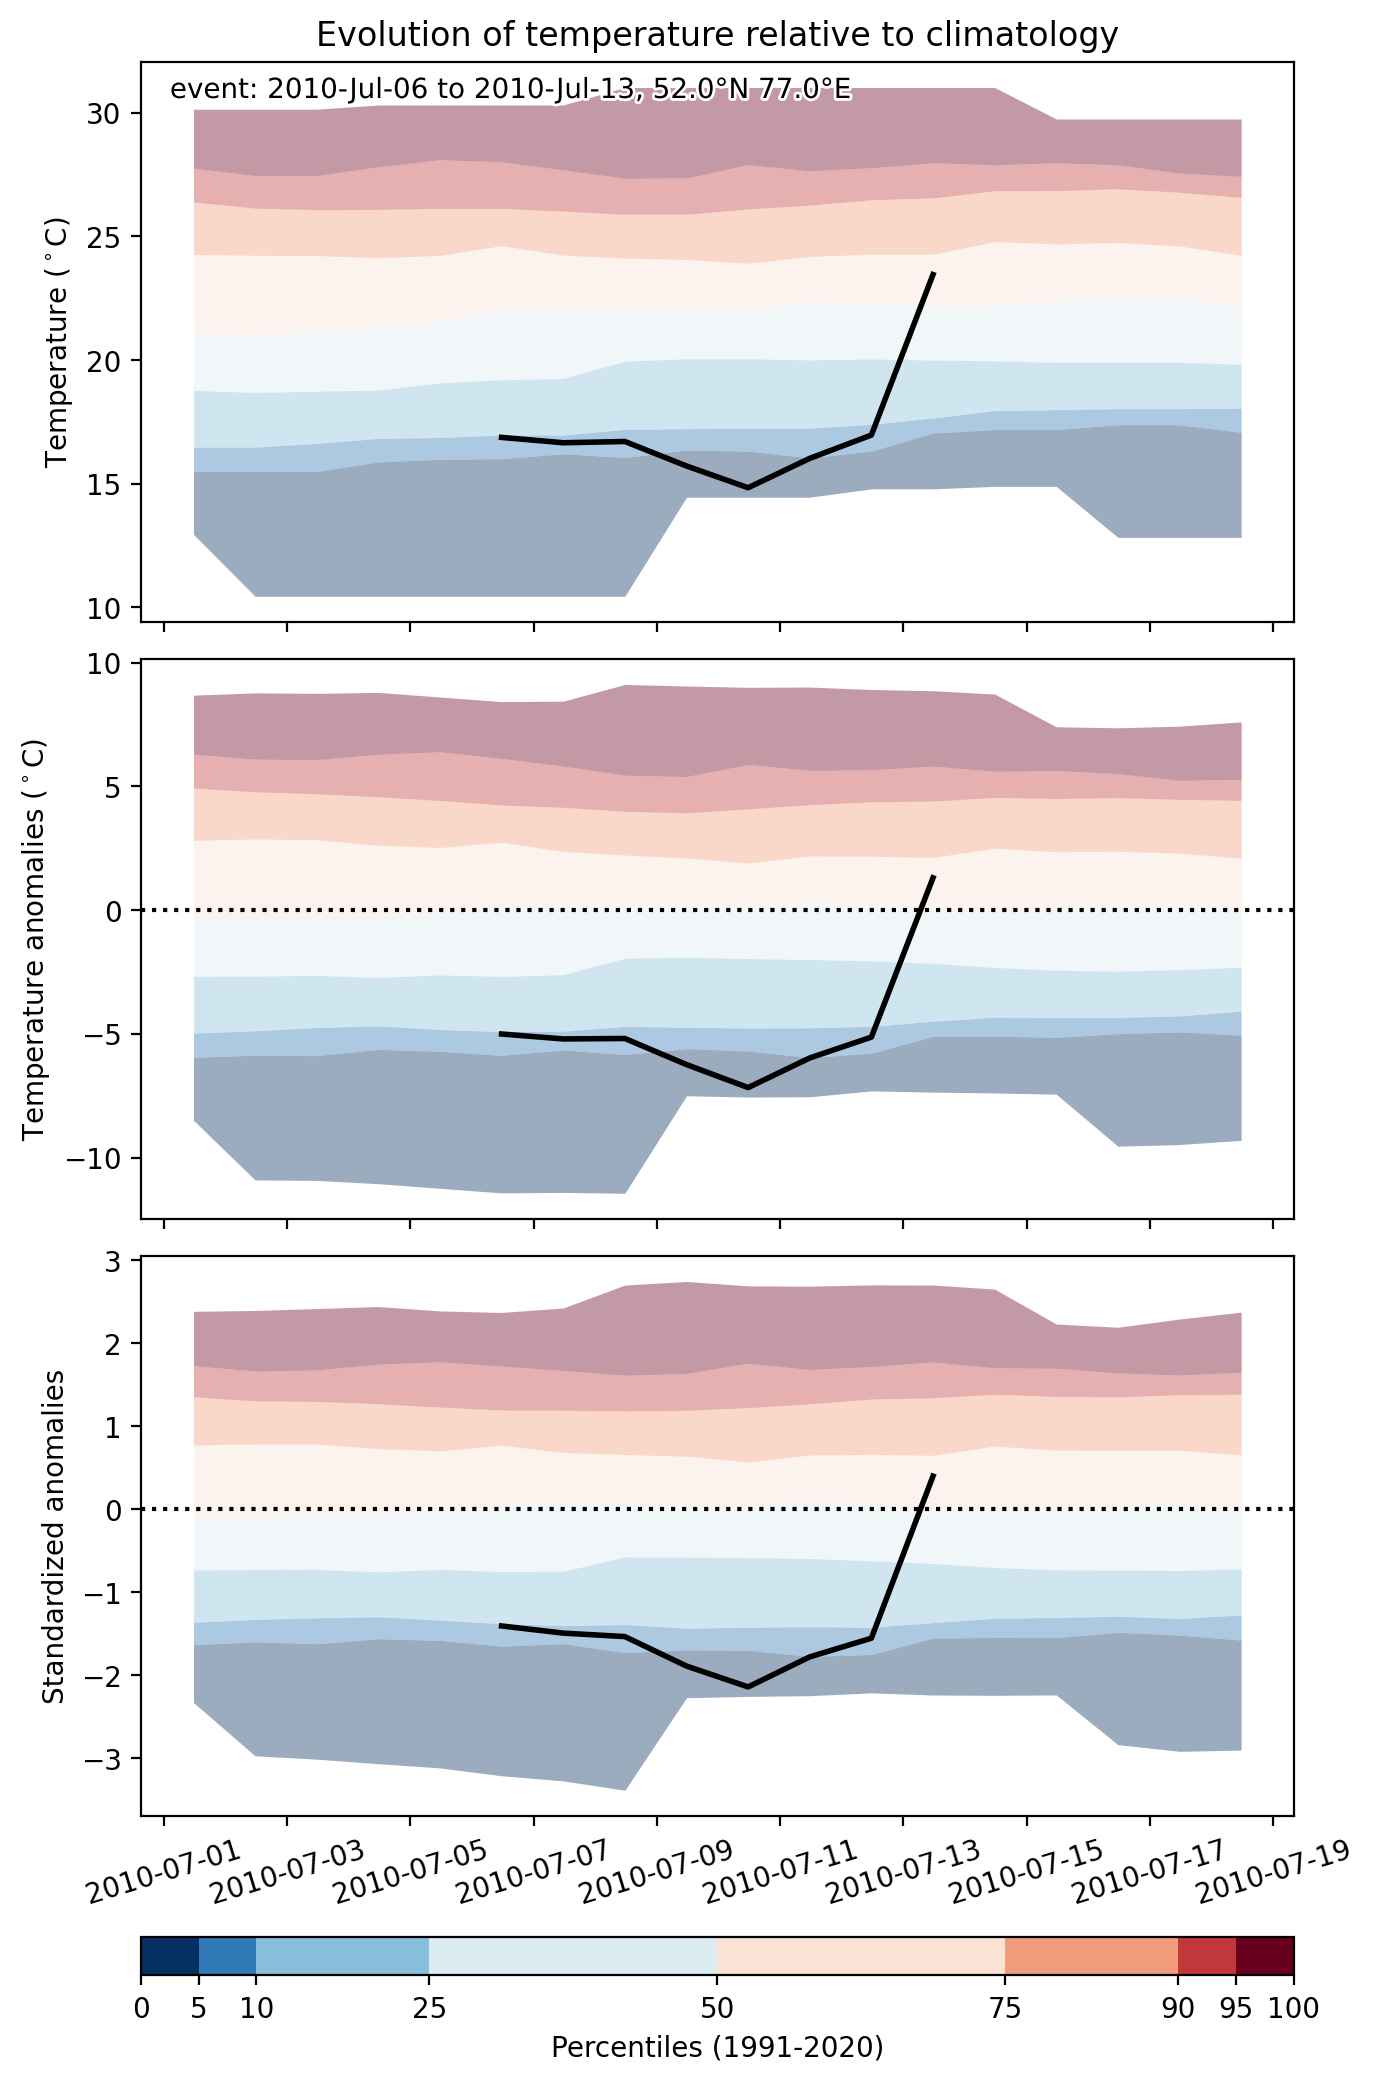


Fig. 2: Evolution of temperature at the center of the event. The climatological percentile distribution is illustrated with color shadings.
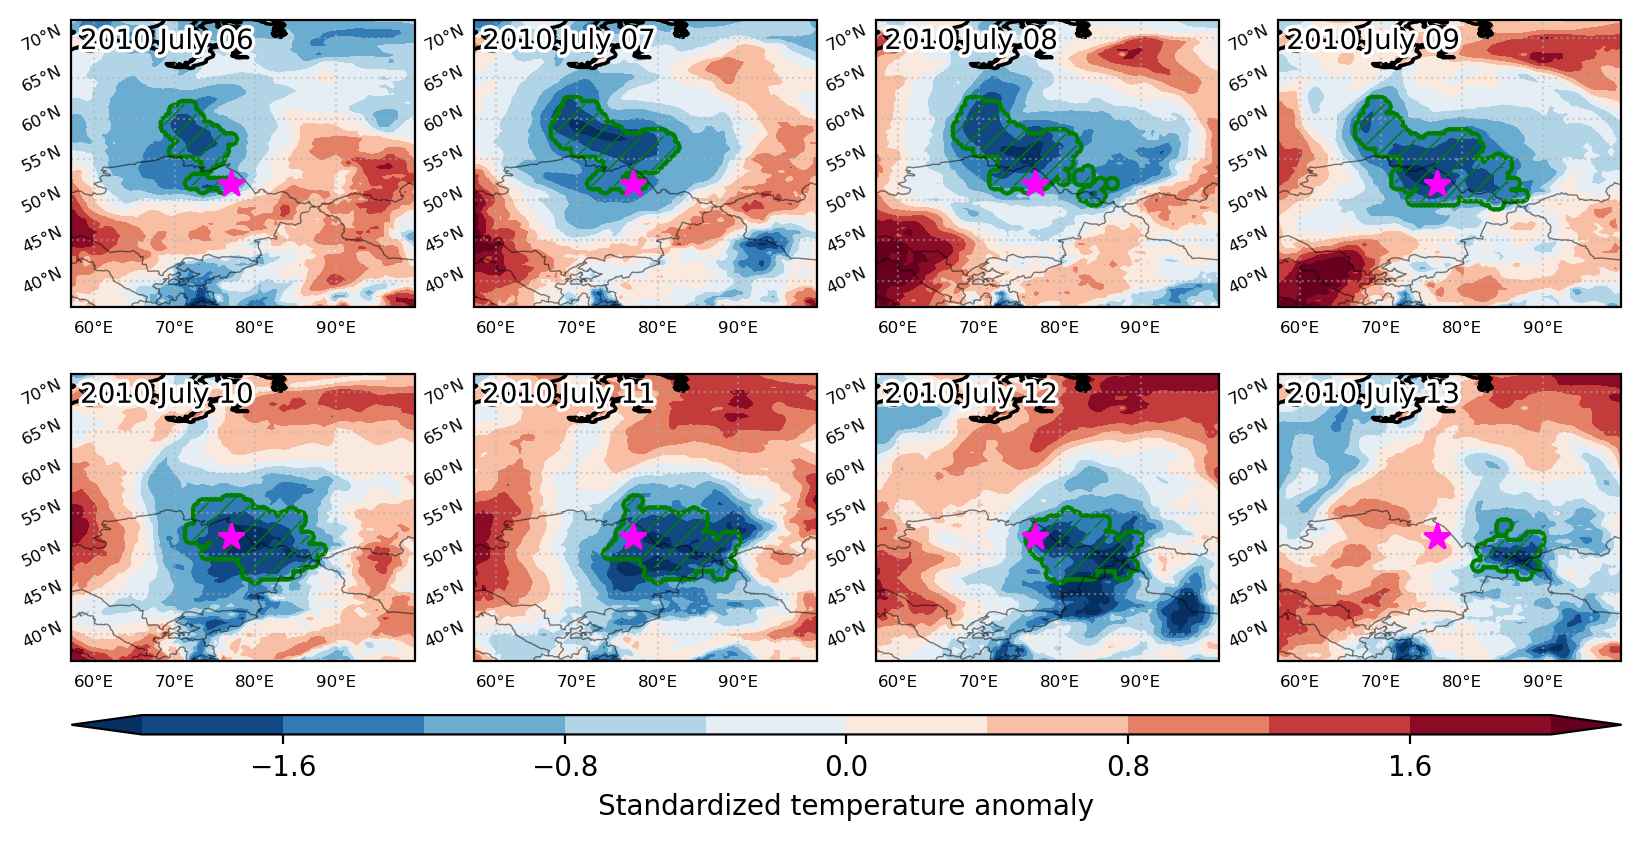


Fig. 3: Maps illustrating the evolution of standardized temperature anomalies during the event.

Event ID: Cold_spell_2010-Jul-06_to_2010-Jul-13_77.0_52.0
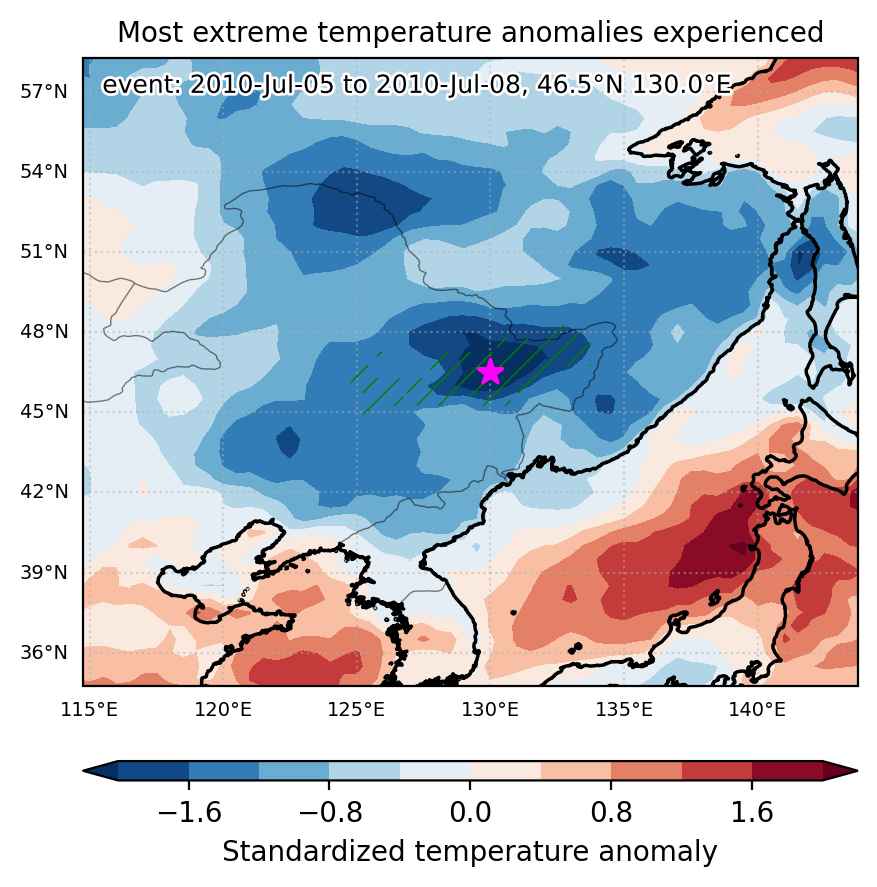
Cold spell occuring from July 05 2010 to July 08 2010 at 46.5°N 130.0°E

Download data: JSON

Event type: Cold spell

Countries affected (identified with ArcGIS Online; provided only for geographical reference):

  • China
  • Russian Federation

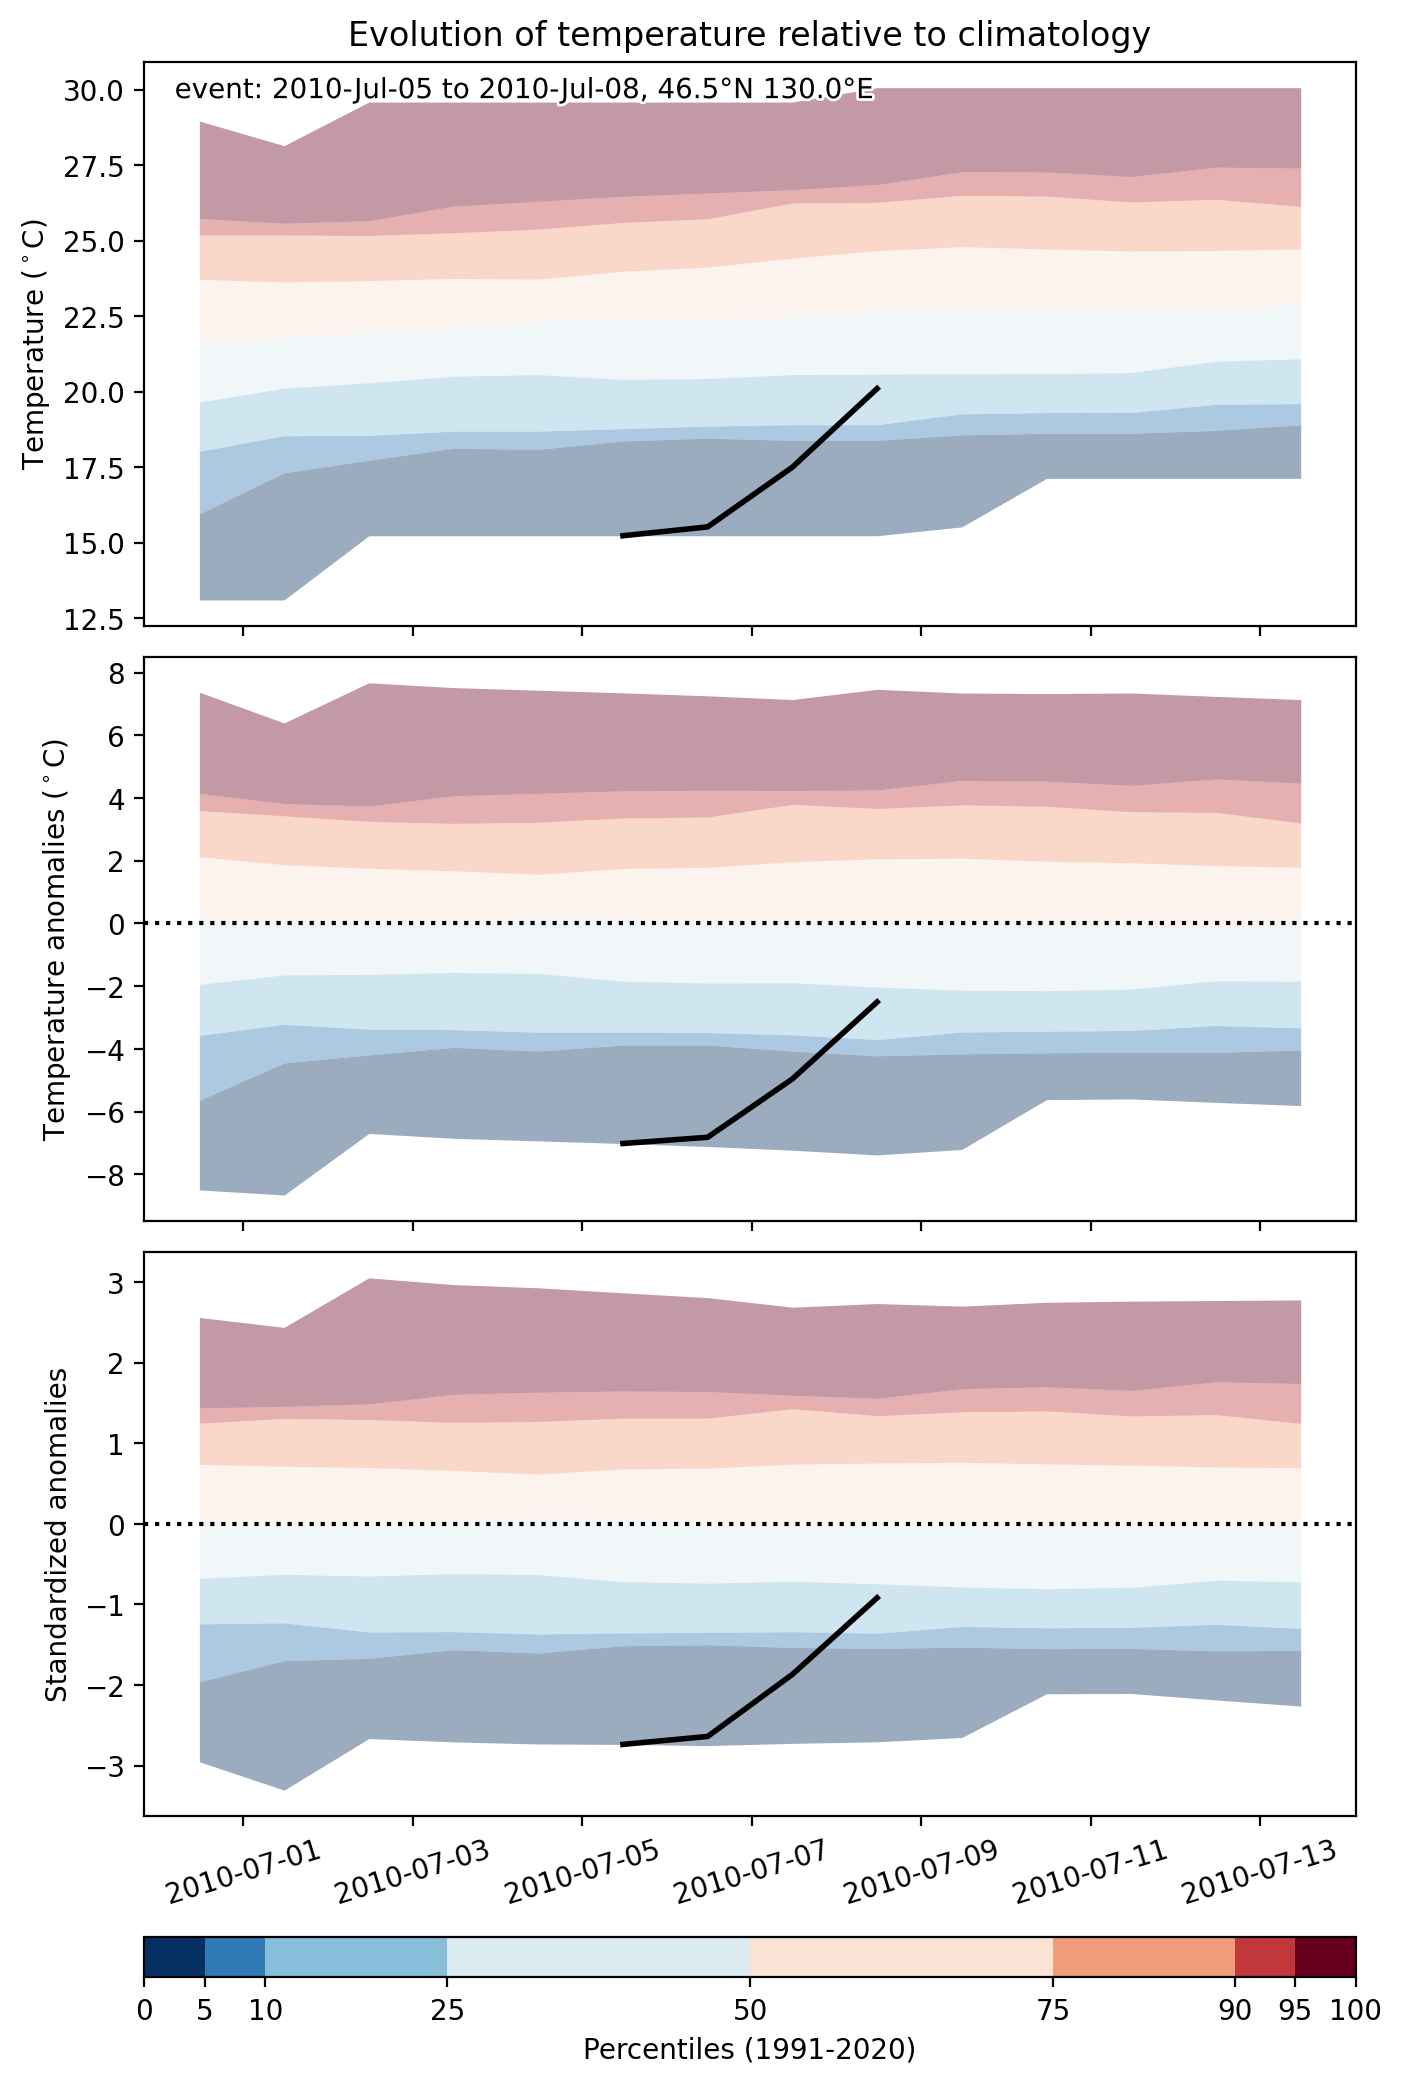
Duration: 4 days

Time span: July 05 2010 to July 08 2010

Statistics over entire affected area:

  • Mean temperature anomaly: -4.6 °C
  • Mean temperature: 17.4 °C
  • Minimum temperature anomaly: -7.3 °C
  • Minimum temperature: 13.5 °C

Event center: 46.5°N 130.0°E

Area affected: 121311 km$^2$


Fig. 1: Map of most extreme temperature anomalies (standardized) experienced during the event. The purple star indicates the center of the extreme event. Green hatching illustrates all areas under the effect of extremes at some time during the event.


Fig. 2: Evolution of temperature at the center of the event. The climatological percentile distribution is illustrated with color shadings.


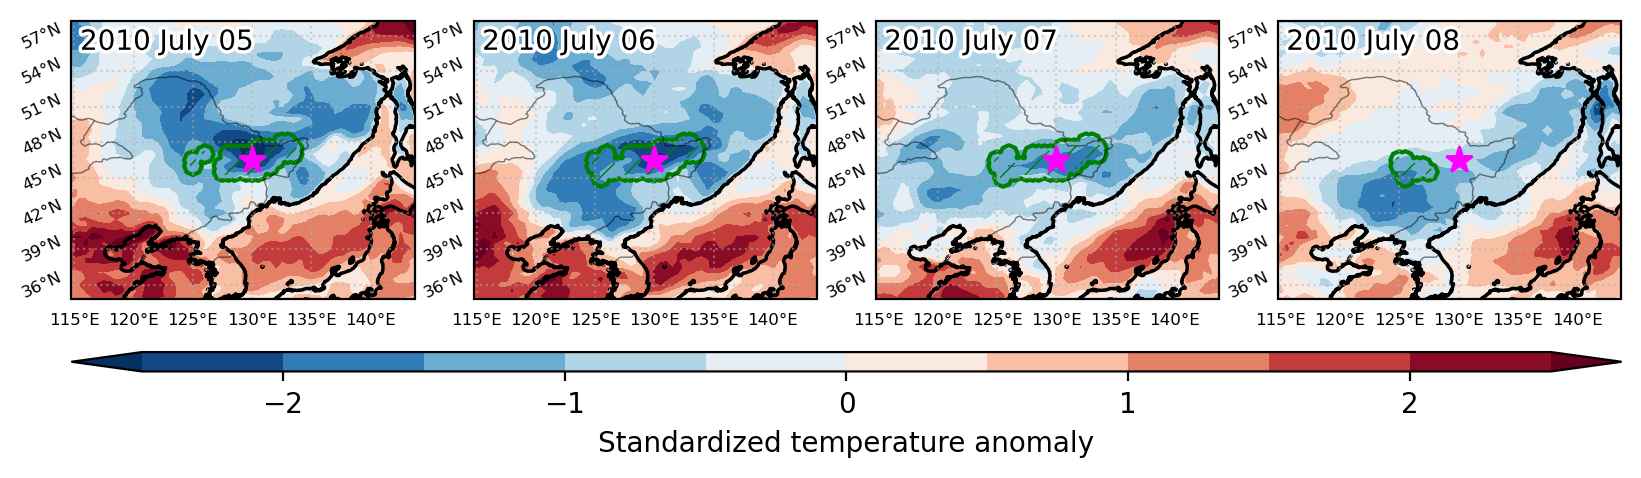
Fig. 3: Maps illustrating the evolution of standardized temperature anomalies during the event.

Event ID: Cold_spell_2010-Jul-05_to_2010-Jul-08_130.0_46.5

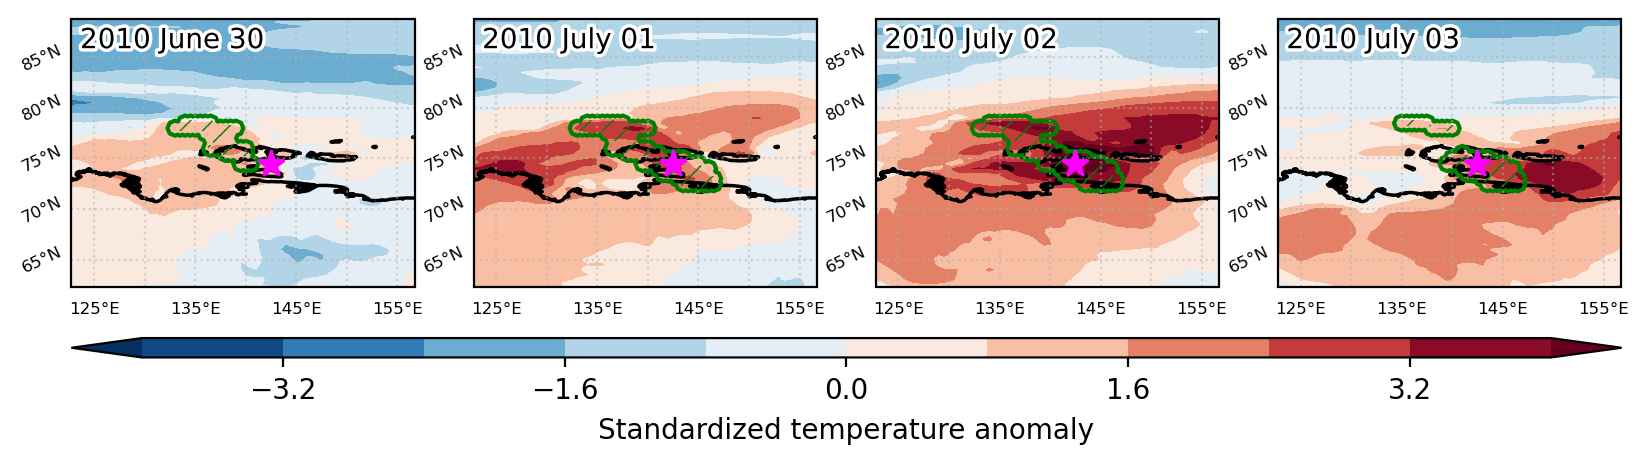
Heat wave occuring from June 30 2010 to July 03 2010 at 74.5°N 142.5°E

Download data: JSON

Event type: Heat wave

Countries affected (identified with ArcGIS Online; provided only for geographical reference):

  • Russian Federation

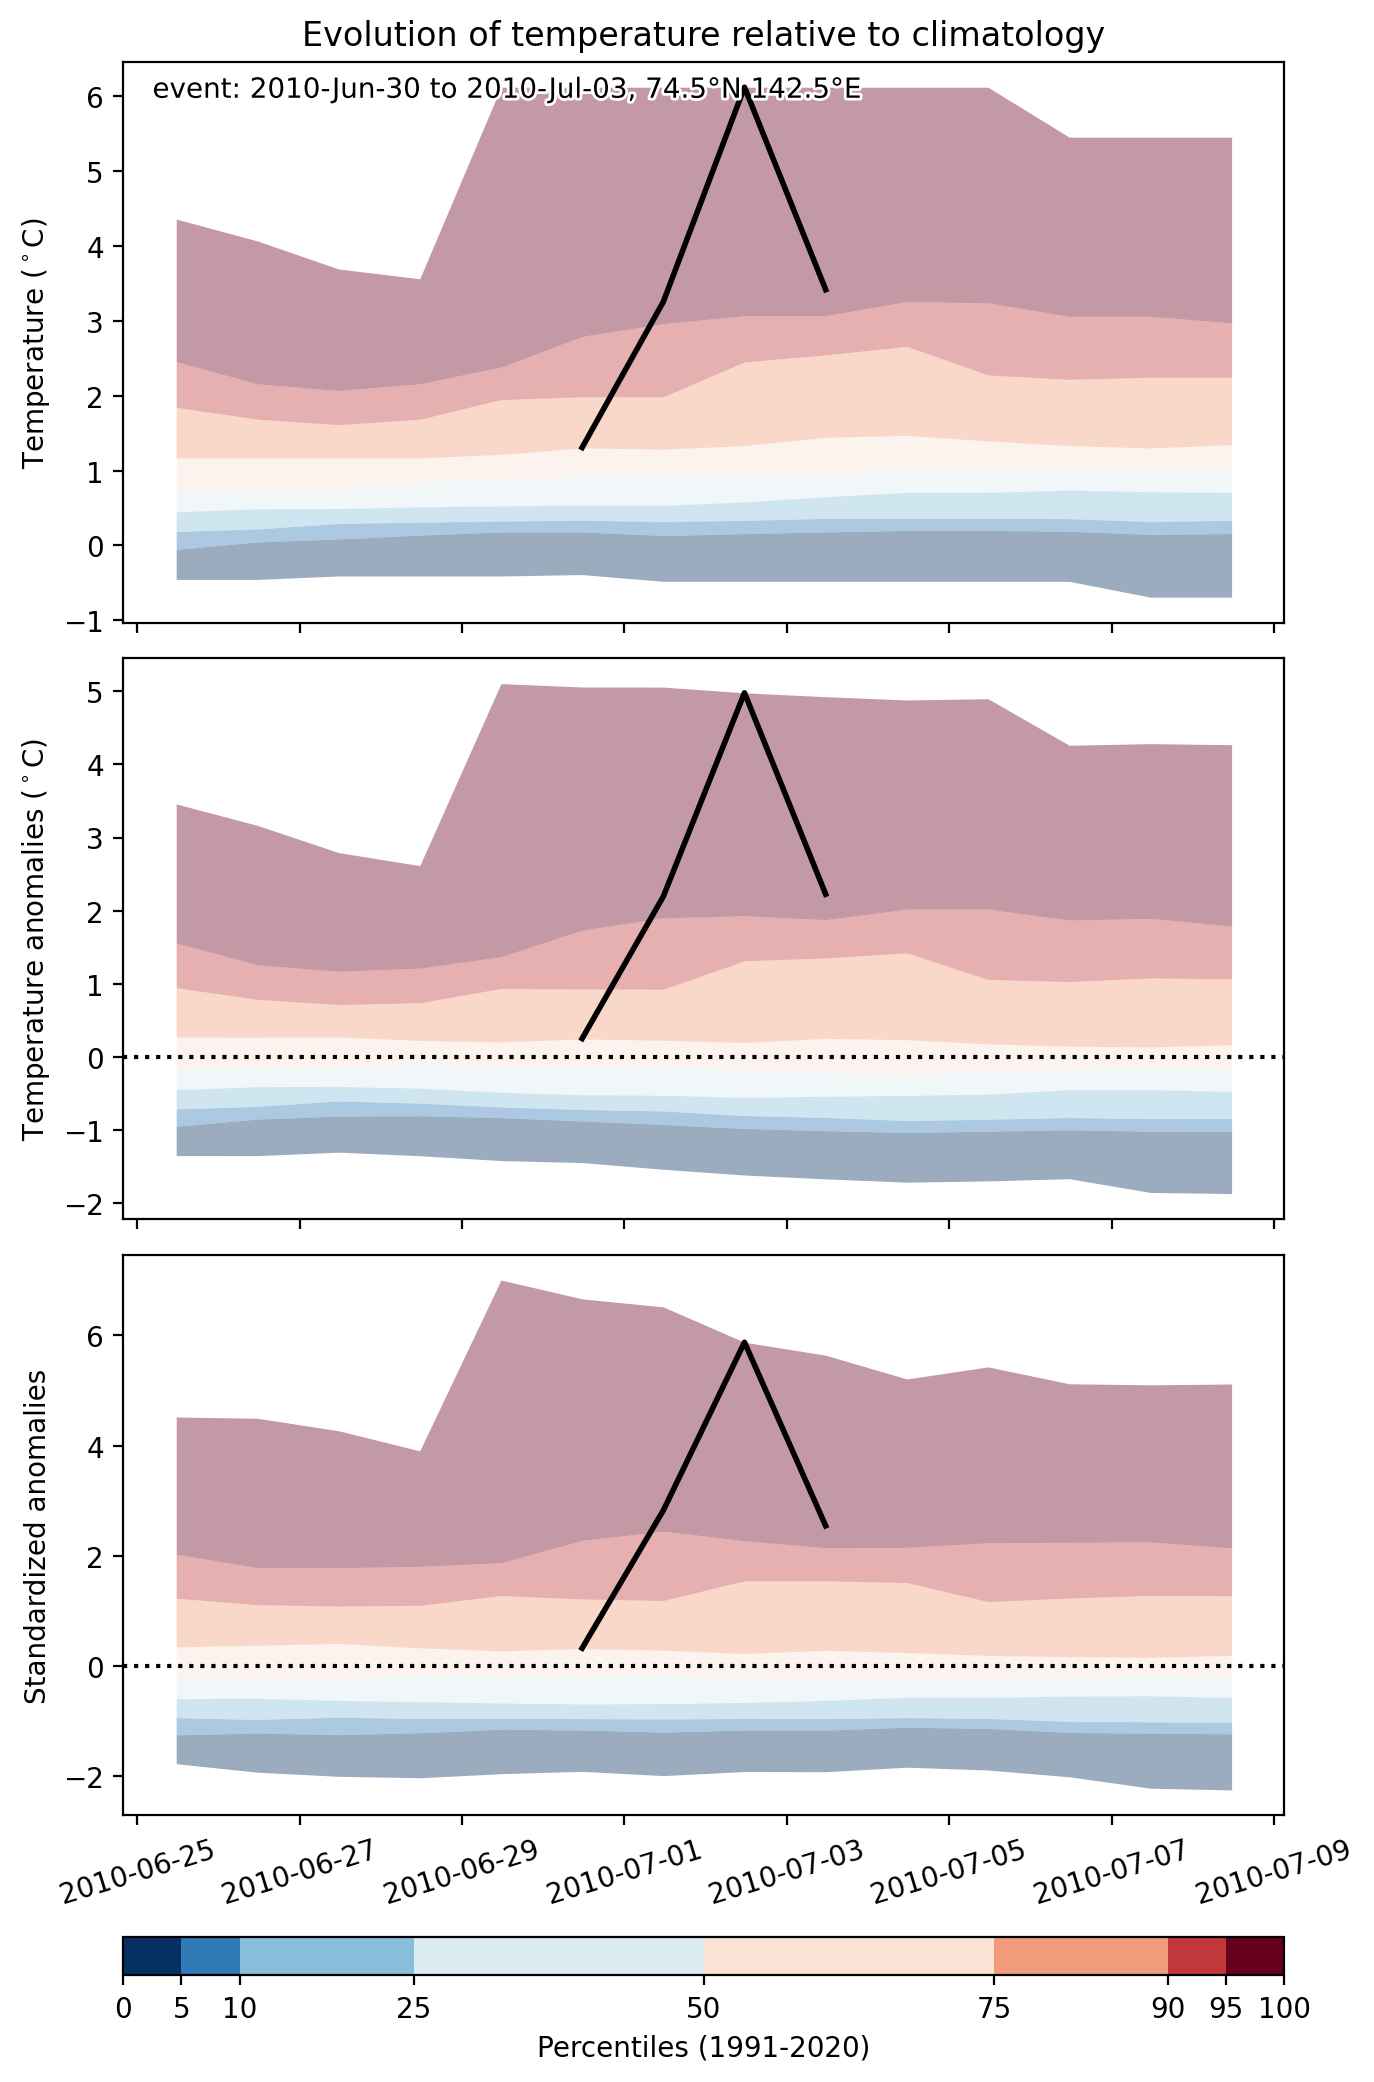
Duration: 4 days

Time span: June 30 2010 to July 03 2010

Statistics over entire affected area:

  • Mean temperature anomaly: 3.3 °C
  • Mean temperature: 5.1 °C
  • Maximum temperature anomaly: 13.1 °C
  • Maximum temperature: 20.3 °C

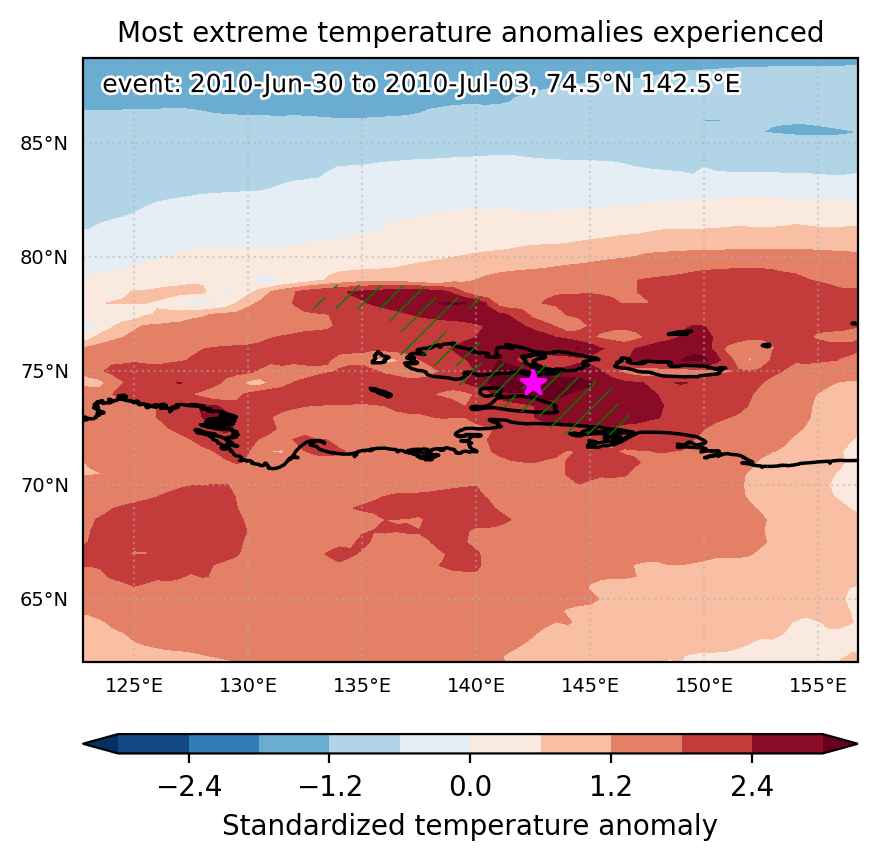
Event center: 74.5°N 142.5°E

Area affected: 82226 km$^2$


Fig. 1: Map of most extreme temperature anomalies (standardized) experienced during the event. The purple star indicates the center of the extreme event. Green hatching illustrates all areas under the effect of extremes at some time during the event.


Fig. 2: Evolution of temperature at the center of the event. The climatological percentile distribution is illustrated with color shadings.


Fig. 3: Maps illustrating the evolution of standardized temperature anomalies during the event.

Event ID: Heat_wave_2010-Jun-30_to_2010-Jul-03_142.5_74.5

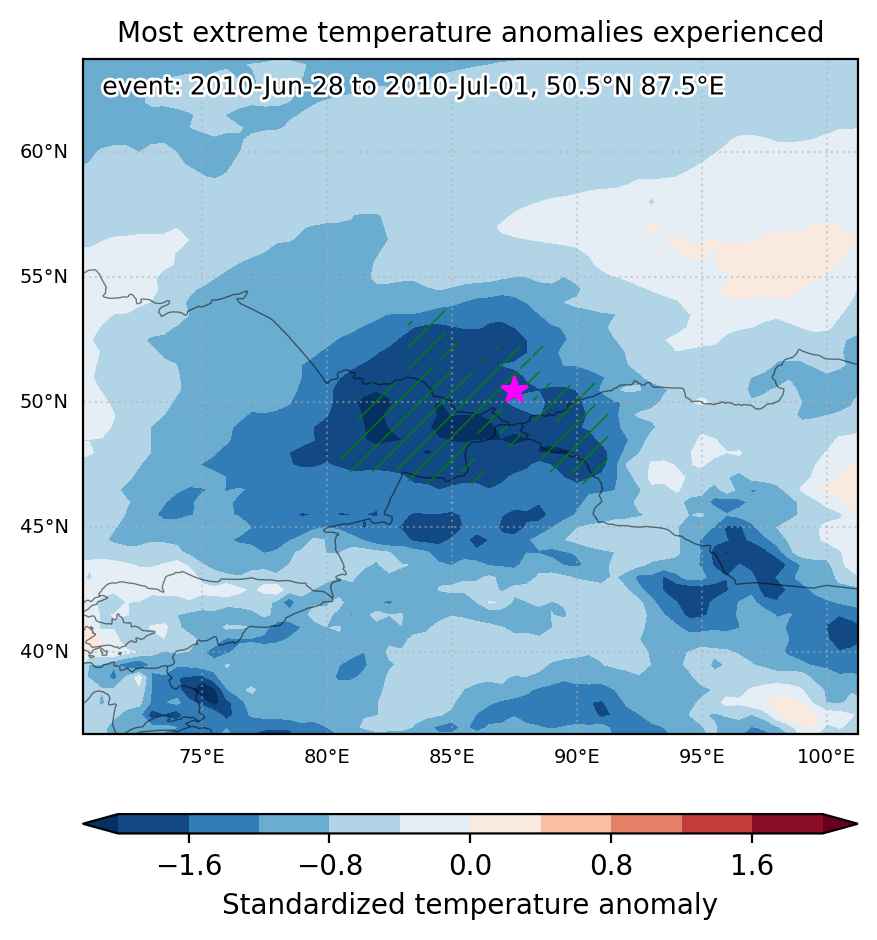
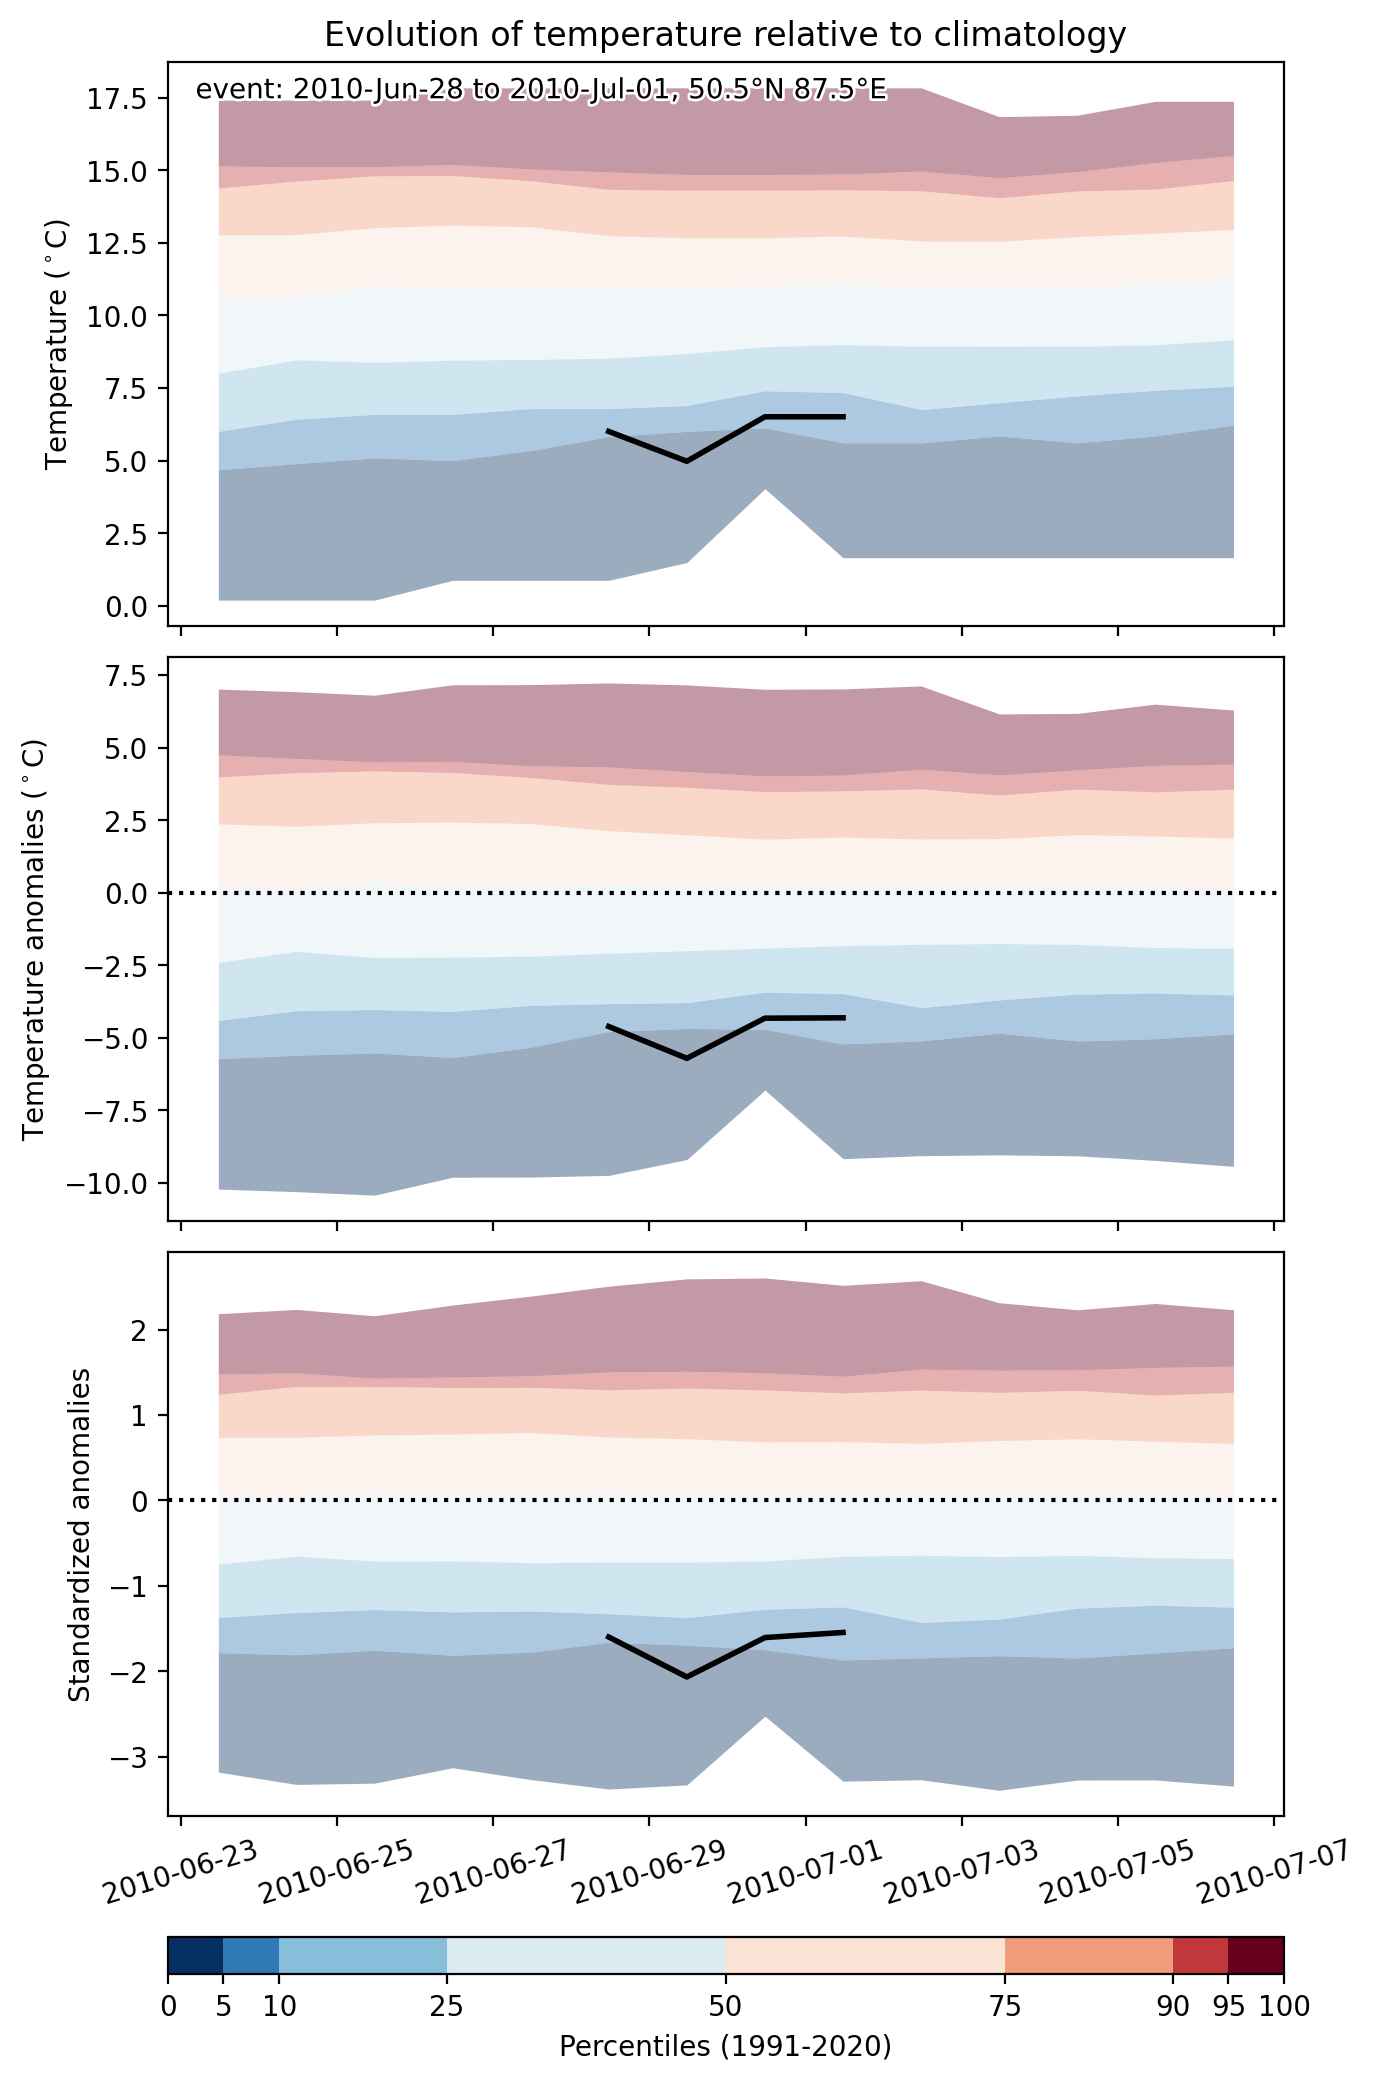
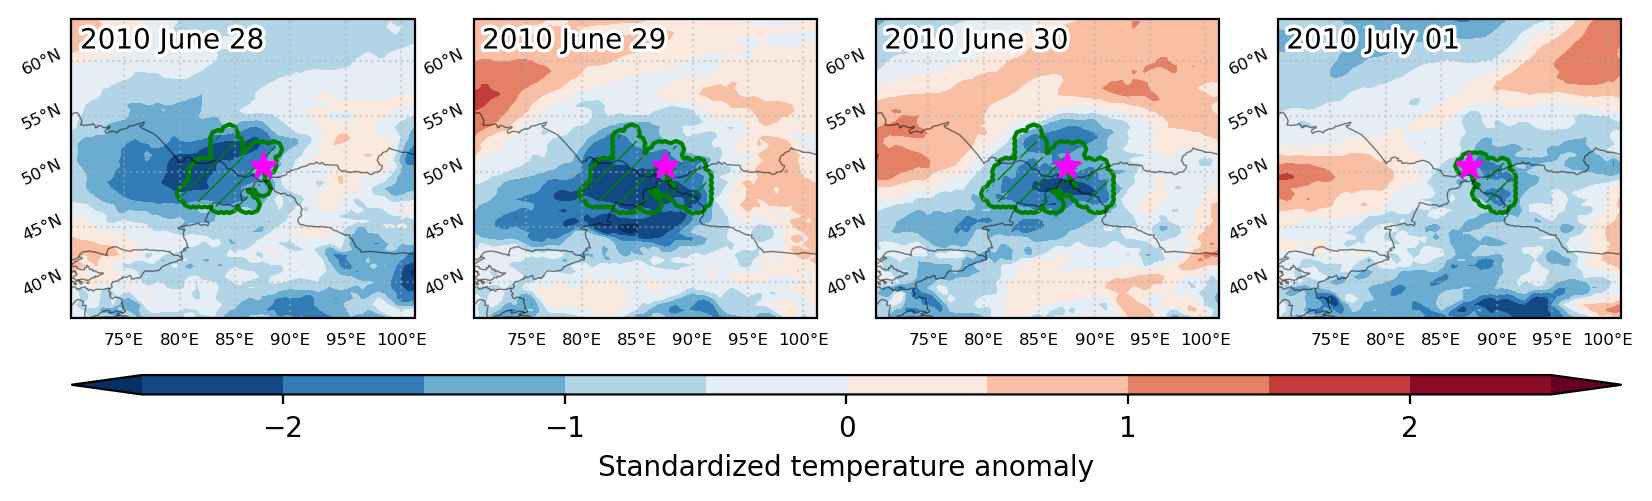
Cold spell occuring from June 28 2010 to July 01 2010 at 50.5°N 87.5°E

Download data: JSON

Event type: Cold spell

Countries affected (identified with ArcGIS Online; provided only for geographical reference):

  • China
  • Kazakhstan
  • Mongolia
  • Russian Federation

Duration: 4 days

Time span: June 28 2010 to July 01 2010

Statistics over entire affected area:

  • Mean temperature anomaly: -5.2 °C
  • Mean temperature: 10.5 °C
  • Minimum temperature anomaly: -7.6 °C
  • Minimum temperature: 1.5 °C

Event center: 50.5°N 87.5°E

Area affected: 305360 km$^2$


Fig. 1: Map of most extreme temperature anomalies (standardized) experienced during the event. The purple star indicates the center of the extreme event. Green hatching illustrates all areas under the effect of extremes at some time during the event.


Fig. 2: Evolution of temperature at the center of the event. The climatological percentile distribution is illustrated with color shadings.


Fig. 3: Maps illustrating the evolution of standardized temperature anomalies during the event.

Event ID: Cold_spell_2010-Jun-28_to_2010-Jul-01_87.5_50.5

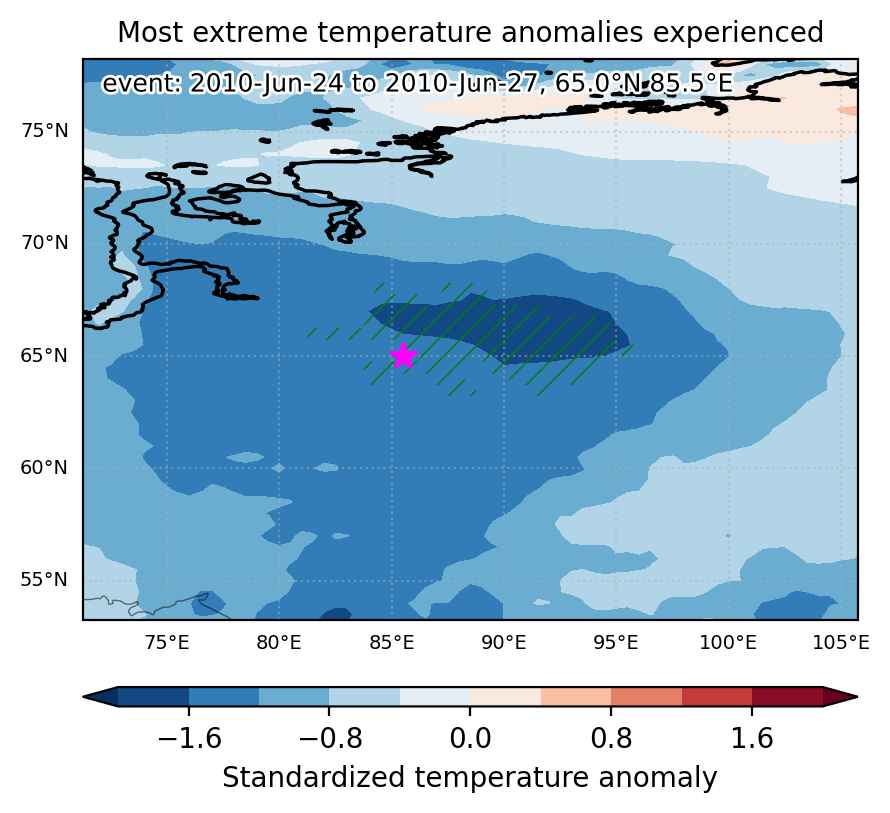
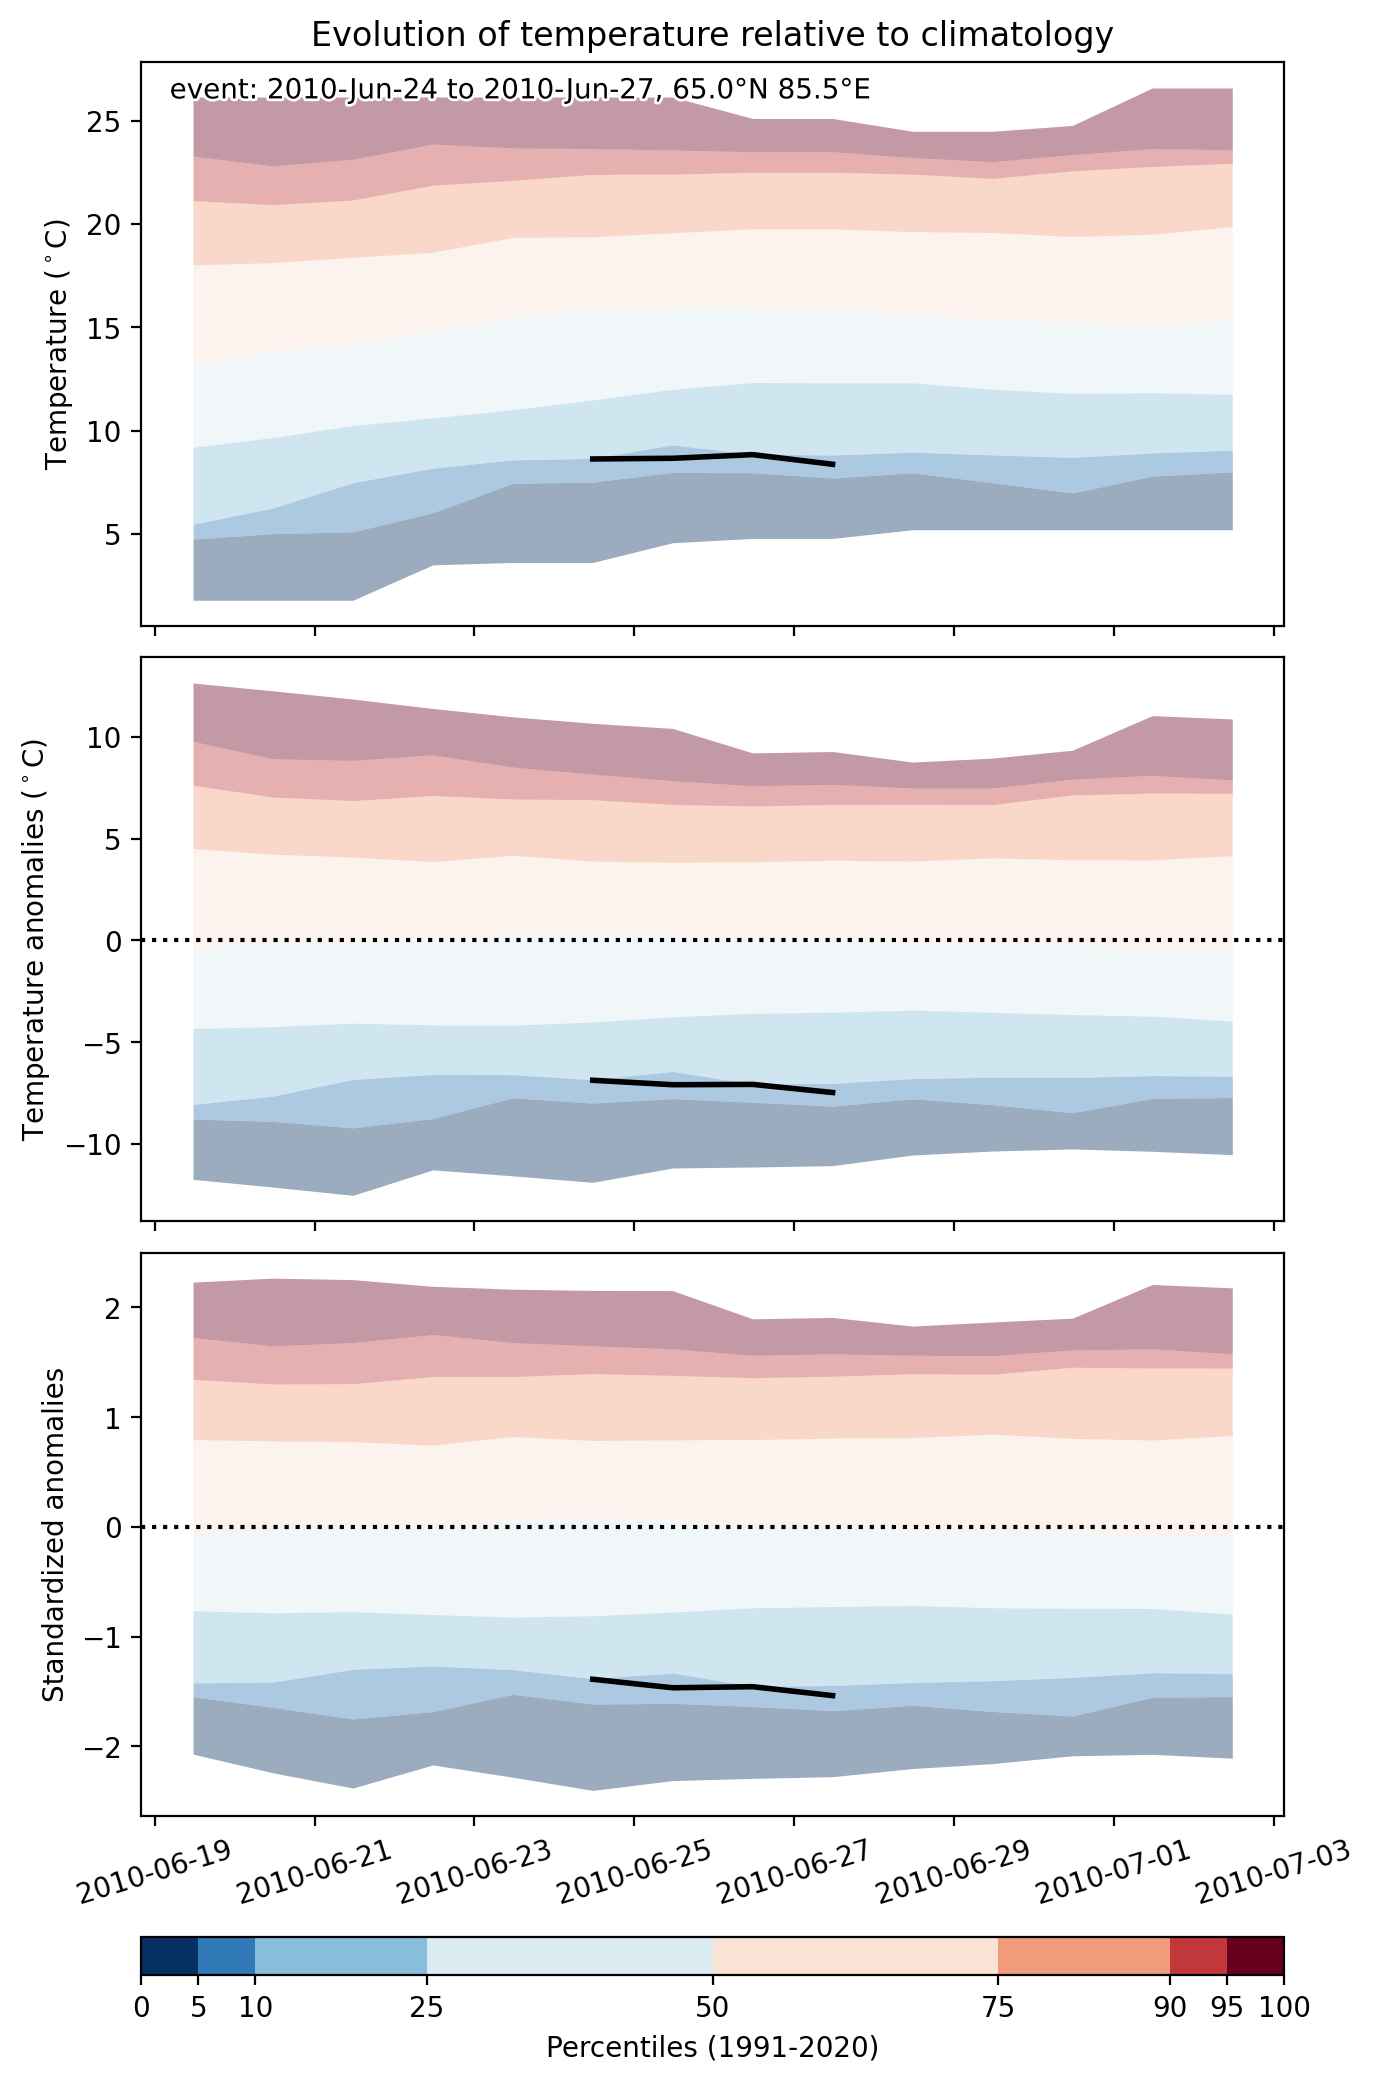
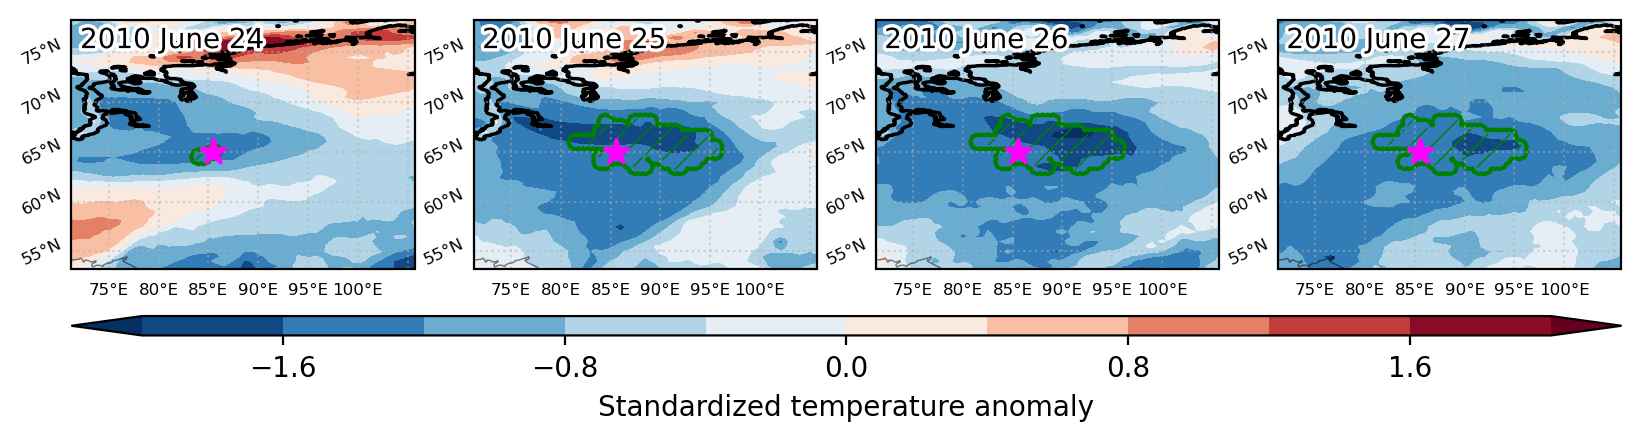
Cold spell occuring from June 24 2010 to June 27 2010 at 65.0°N 85.5°E

Download data: JSON

Event type: Cold spell

Countries affected (identified with ArcGIS Online; provided only for geographical reference):

  • Russian Federation

Duration: 4 days

Time span: June 24 2010 to June 27 2010

Statistics over entire affected area:

  • Mean temperature anomaly: -7.6 °C
  • Mean temperature: 7.4 °C
  • Minimum temperature anomaly: -10.6 °C
  • Minimum temperature: 2.9 °C

Event center: 65.0°N 85.5°E

Area affected: 195819 km$^2$


Fig. 1: Map of most extreme temperature anomalies (standardized) experienced during the event. The purple star indicates the center of the extreme event. Green hatching illustrates all areas under the effect of extremes at some time during the event.


Fig. 2: Evolution of temperature at the center of the event. The climatological percentile distribution is illustrated with color shadings.


Fig. 3: Maps illustrating the evolution of standardized temperature anomalies during the event.

Event ID: Cold_spell_2010-Jun-24_to_2010-Jun-27_85.5_65.0

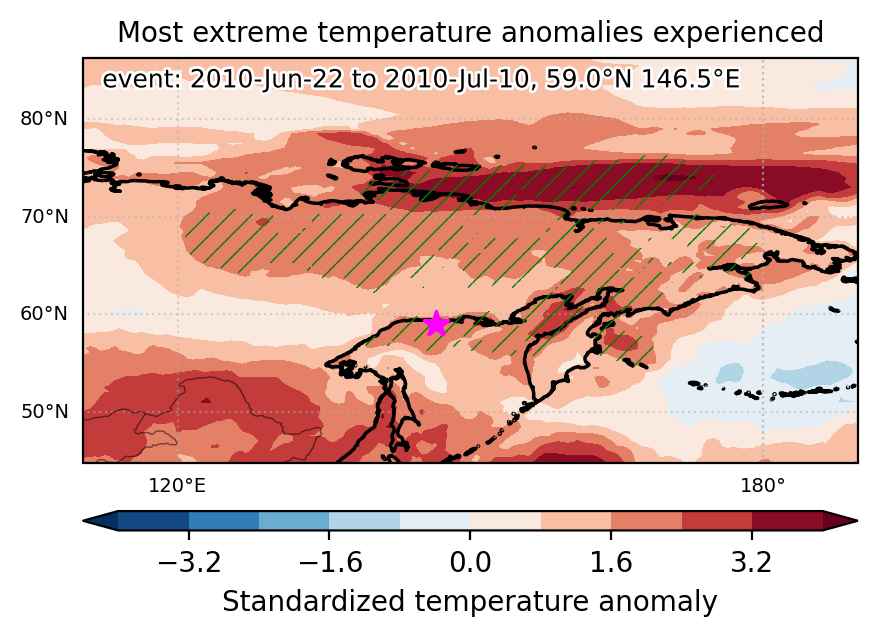
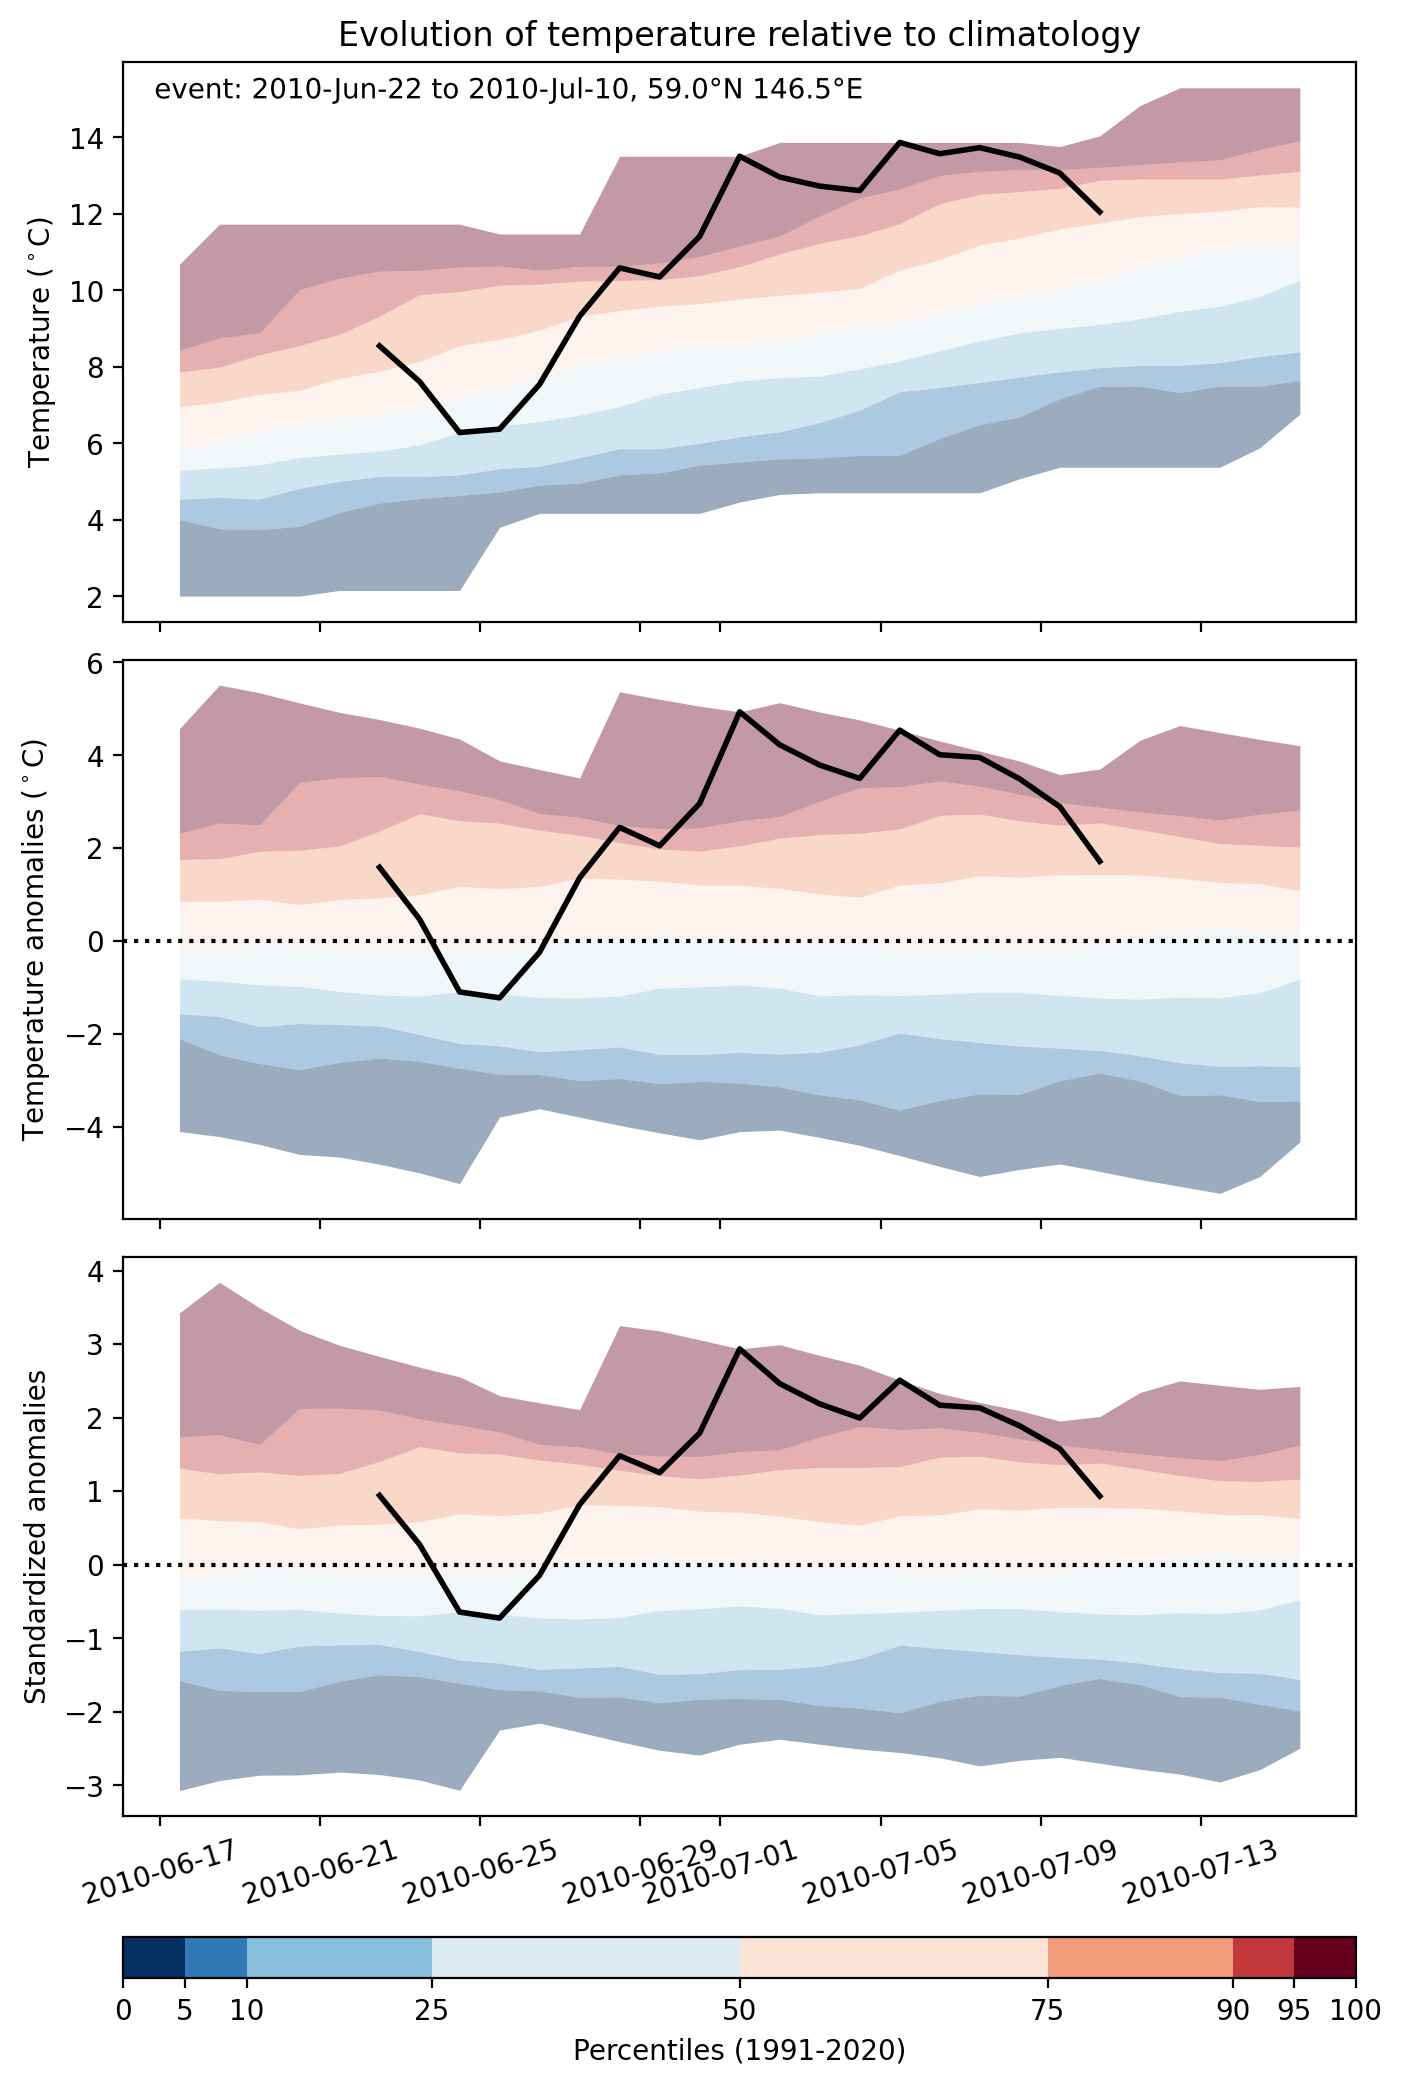
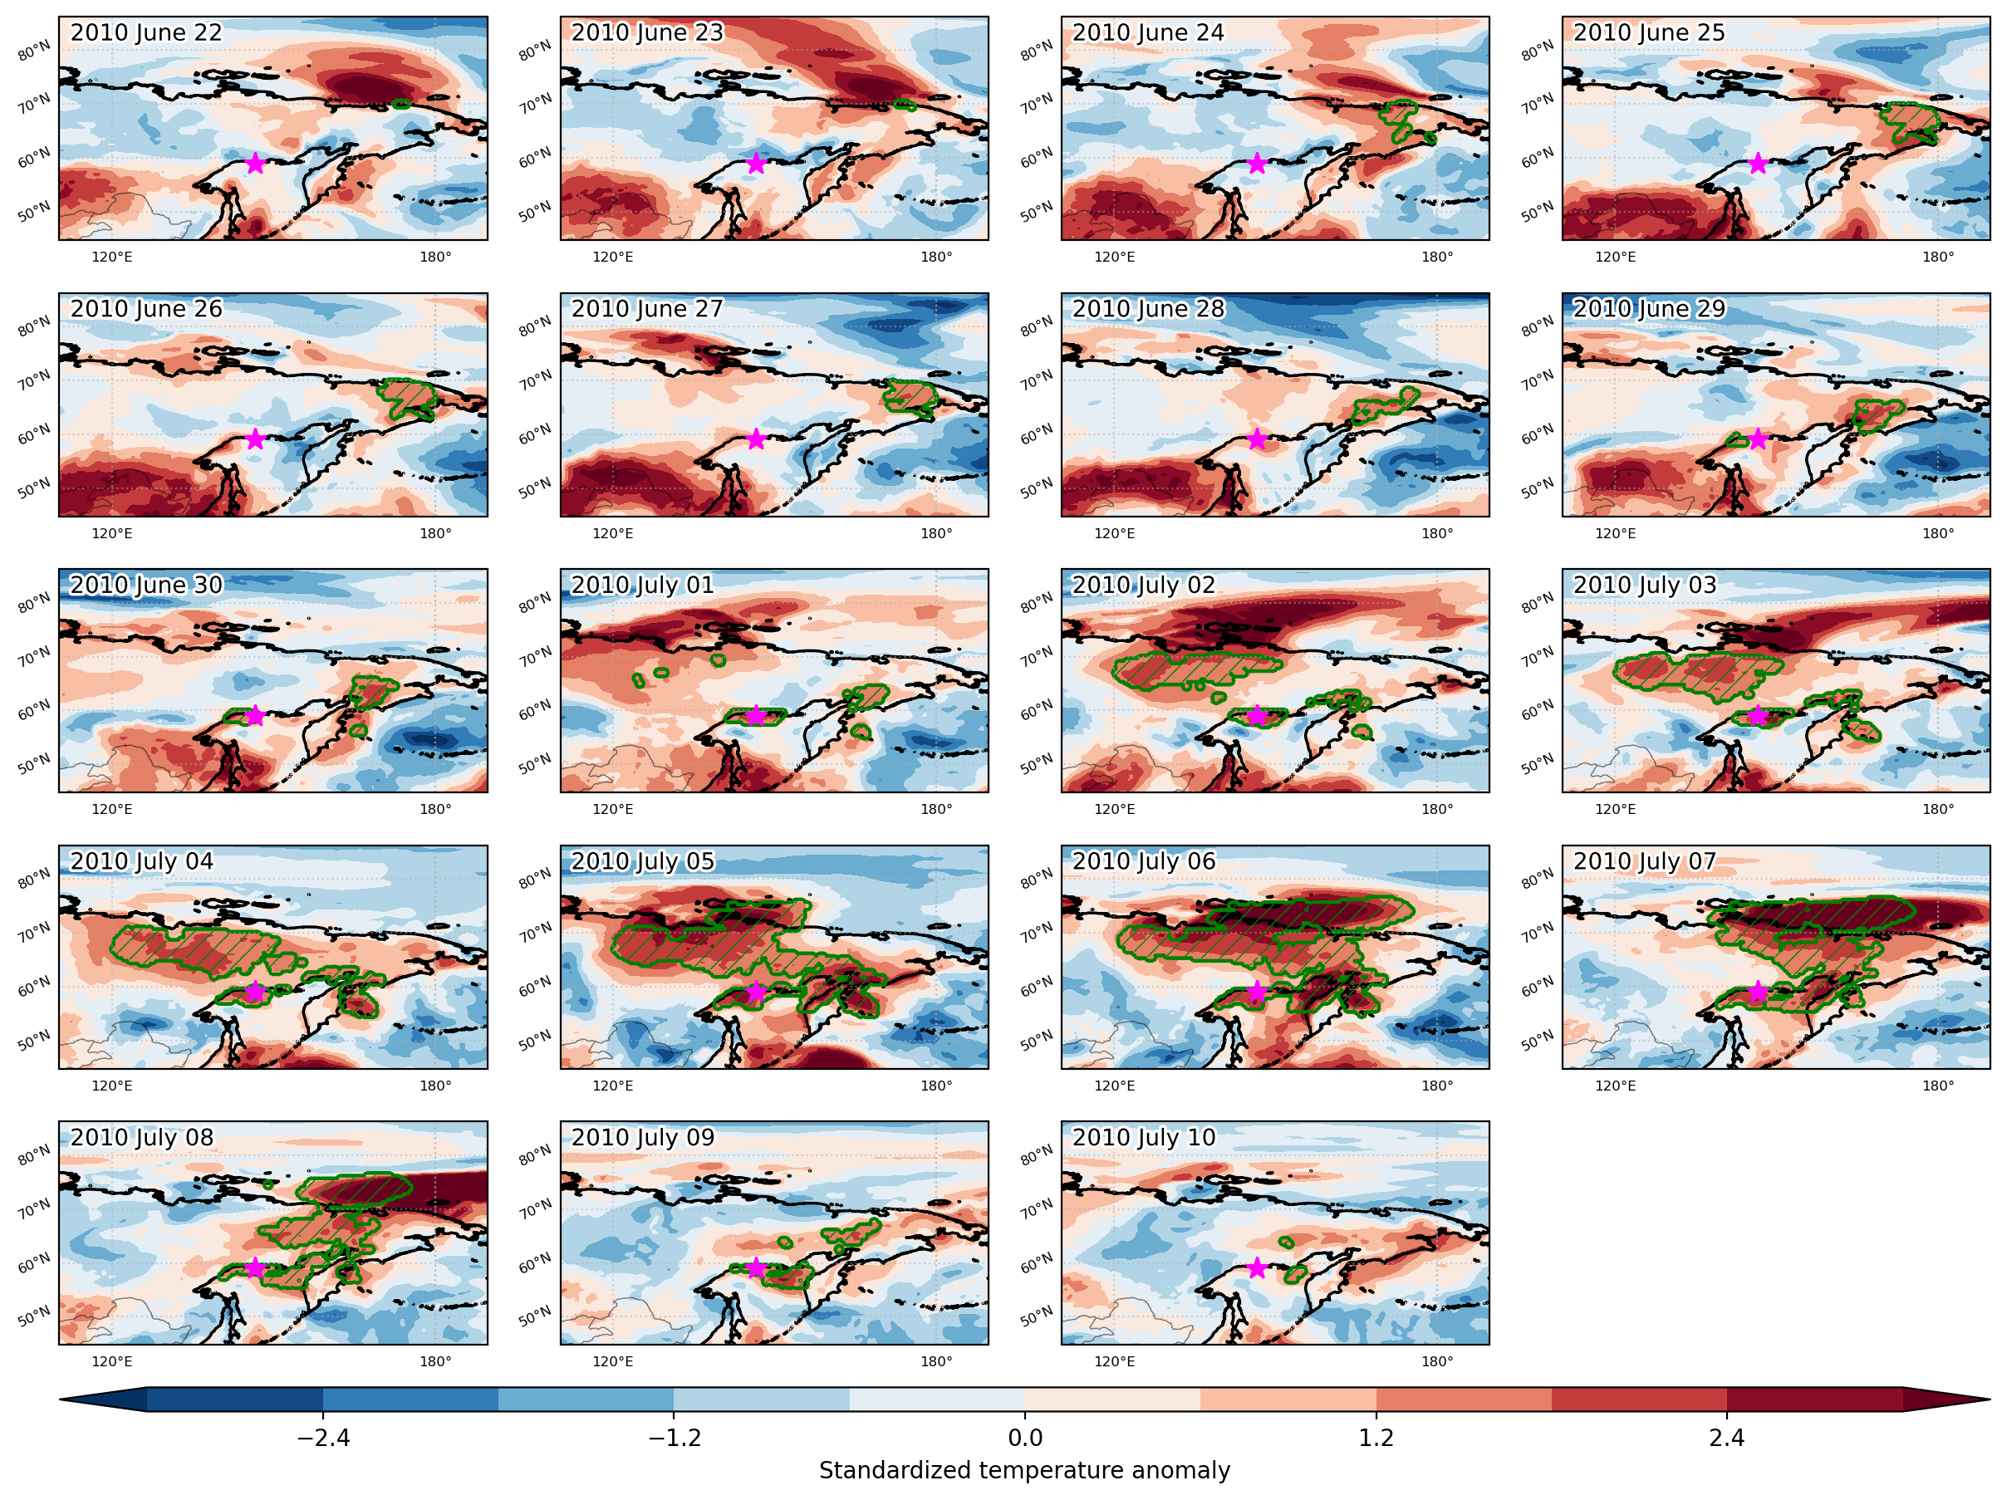
Heat wave occuring from June 22 2010 to July 10 2010 at 59.0°N 146.5°E

Download data: JSON

Event type: Heat wave

Countries affected (identified with ArcGIS Online; provided only for geographical reference):

  • Russian Federation

Duration: 19 days

Time span: June 22 2010 to July 10 2010

Statistics over entire affected area:

  • Mean temperature anomaly: 6.3 °C
  • Mean temperature: 16.4 °C
  • Maximum temperature anomaly: 18.2 °C
  • Maximum temperature: 29.0 °C

Event center: 59.0°N 146.5°E

Area affected: 2657209 km$^2$


Fig. 1: Map of most extreme temperature anomalies (standardized) experienced during the event. The purple star indicates the center of the extreme event. Green hatching illustrates all areas under the effect of extremes at some time during the event.


Fig. 2: Evolution of temperature at the center of the event. The climatological percentile distribution is illustrated with color shadings.


Fig. 3: Maps illustrating the evolution of standardized temperature anomalies during the event.

Event ID: Heat_wave_2010-Jun-22_to_2010-Jul-10_146.5_59.0

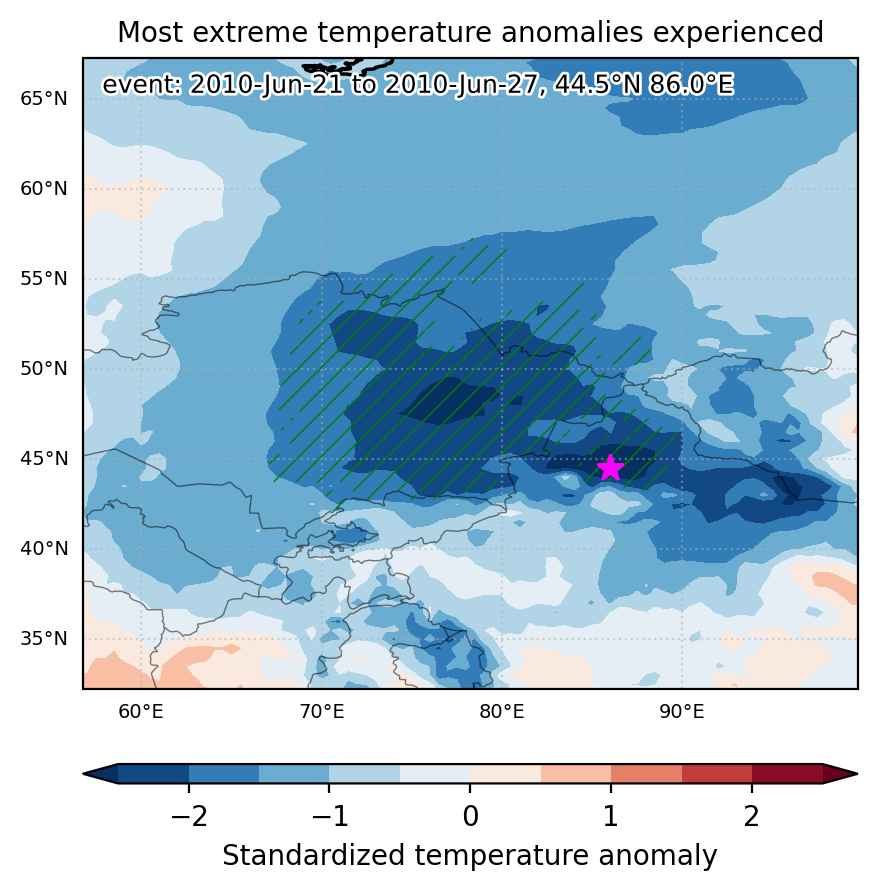
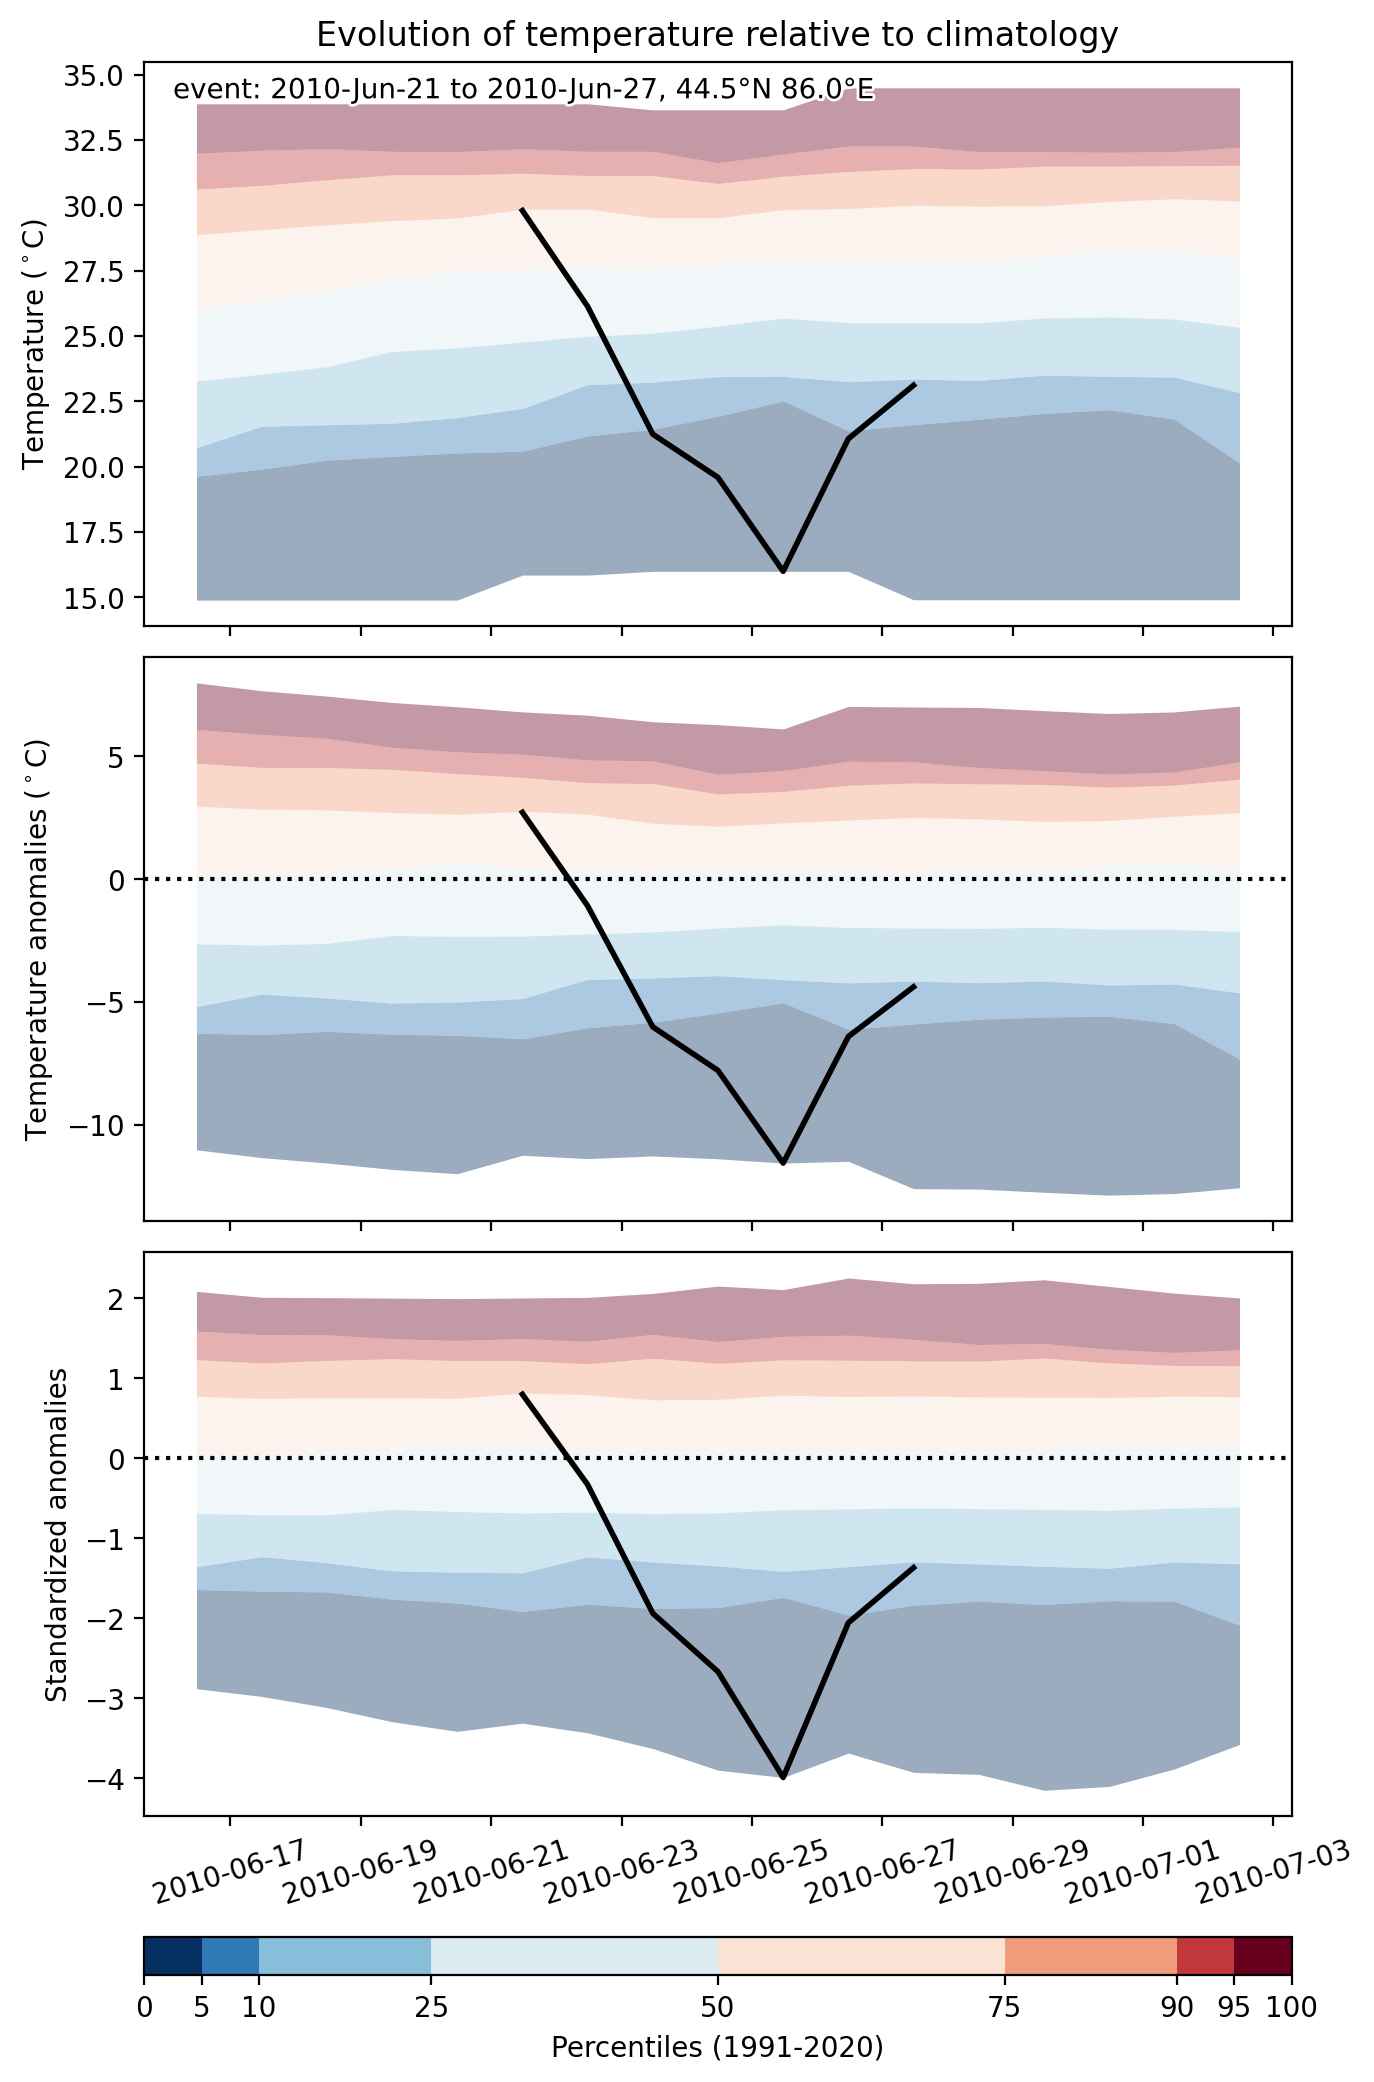
Cold spell occuring from June 21 2010 to June 27 2010 at 44.5°N 86.0°E

Download data: JSON

Event type: Cold spell

Countries affected (identified with ArcGIS Online; provided only for geographical reference):

  • China
  • Kazakhstan
  • Russian Federation

Duration: 7 days

Time span: June 21 2010 to June 27 2010

Statistics over entire affected area:

  • Mean temperature anomaly: -6.7 °C
  • Mean temperature: 15.2 °C
  • Minimum temperature anomaly: -13.2 °C
  • Minimum temperature: 4.3 °C

Event center: 44.5°N 86.0°E

Area affected: 1543305 km$^2$


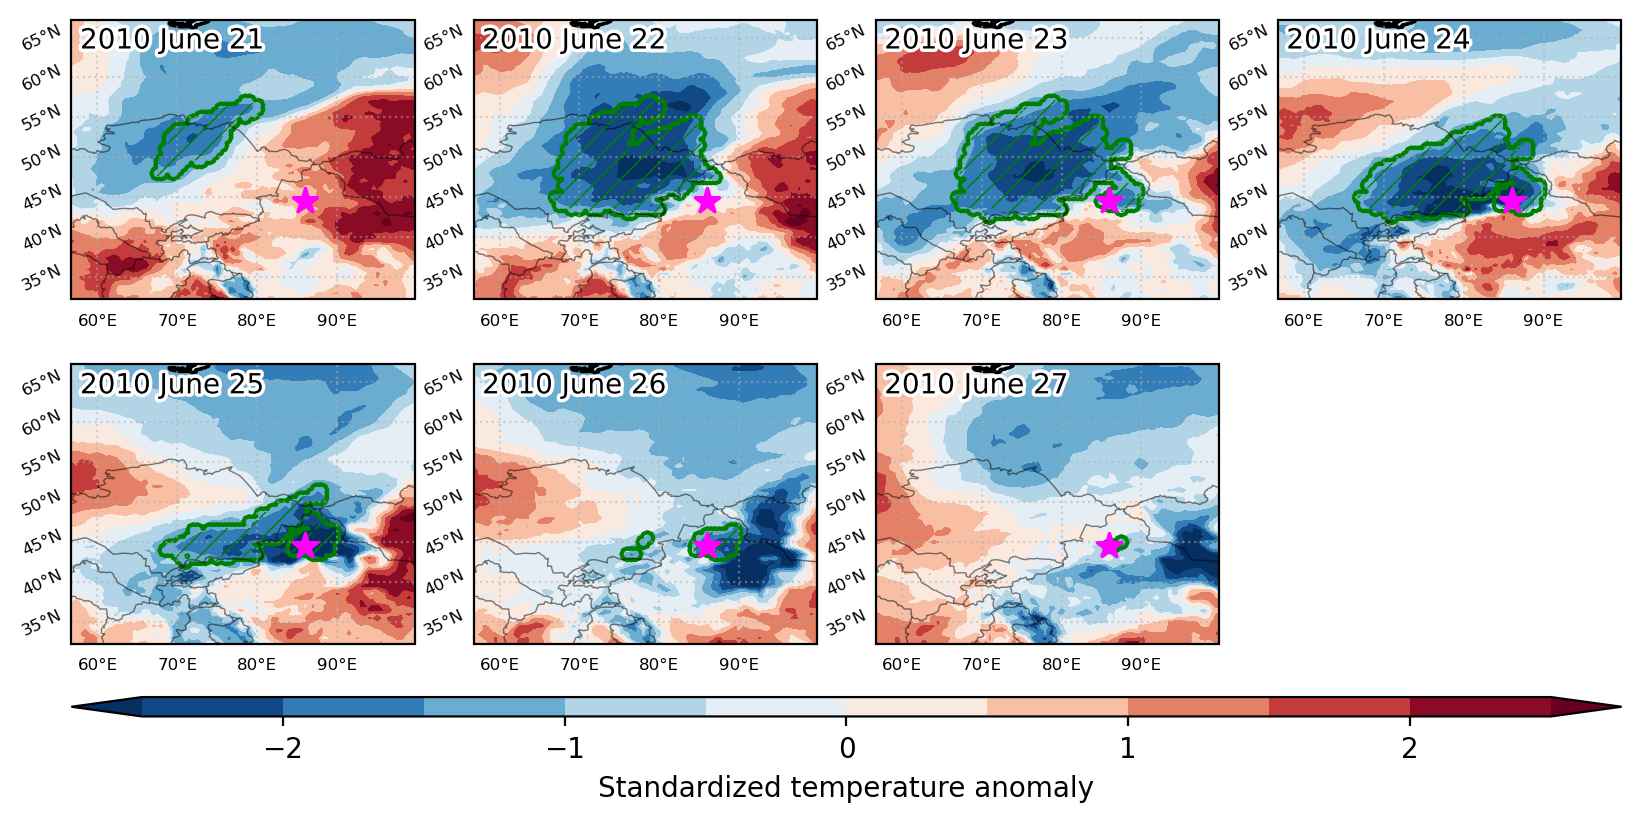
Fig. 1: Map of most extreme temperature anomalies (standardized) experienced during the event. The purple star indicates the center of the extreme event. Green hatching illustrates all areas under the effect of extremes at some time during the event.


Fig. 2: Evolution of temperature at the center of the event. The climatological percentile distribution is illustrated with color shadings.


Fig. 3: Maps illustrating the evolution of standardized temperature anomalies during the event.

Event ID: Cold_spell_2010-Jun-21_to_2010-Jun-27_86.0_44.5

Heat wave occuring from June 20 2010 to September 17 2010 at 55.5°N 37.5°E

Download data: JSON

Event type: Heat wave

Countries affected (identified with ArcGIS Online; provided only for geographical reference):

  • Afghanistan
  • Albania
  • Algeria
  • Andorra
  • Armenia
  • Austria
  • Azerbaijan
  • Bahrain
  • Belarus
  • Belgium
  • Bosnia and Herzegovina
  • Bulgaria
  • Chad
  • Croatia
  • Cyprus
  • Czech Republic
  • Denmark
  • Egypt
  • Eritrea
  • Estonia
  • Ethiopia
  • Finland
  • France
  • Georgia
  • Germany
  • Greece
  • Hungary
  • Iran
  • Iraq
  • Israel
  • Italy
  • Jordan
  • Kazakhstan
  • Kenya
  • Kuwait
  • Latvia
  • Lebanon
  • Libya
  • Lithuania
  • Luxembourg
  • Mali
  • Moldova
  • Montenegro
  • Netherlands
  • Niger
  • North Macedonia
  • Oman
  • Palestinian Territory
  • Poland
  • Qatar
  • Romania
  • Russian Federation
  • Saudi Arabia
  • Serbia
  • Slovakia
  • Slovenia
  • Somalia
  • Spain
  • Sudan
  • Sweden
  • Switzerland
  • Syria
  • Turkiye
  • Turkmenistan
  • Ukraine
  • United Arab Emirates
  • United Kingdom
  • Uzbekistan
  • Yemen

Duration: 90 days

Time span: June 20 2010 to September 17 2010

Statistics over entire affected area:

  • Mean temperature anomaly: 5.6 °C
  • Mean temperature: 28.2 °C
  • Maximum temperature anomaly: 13.2 °C
  • Maximum temperature: 44.2 °C

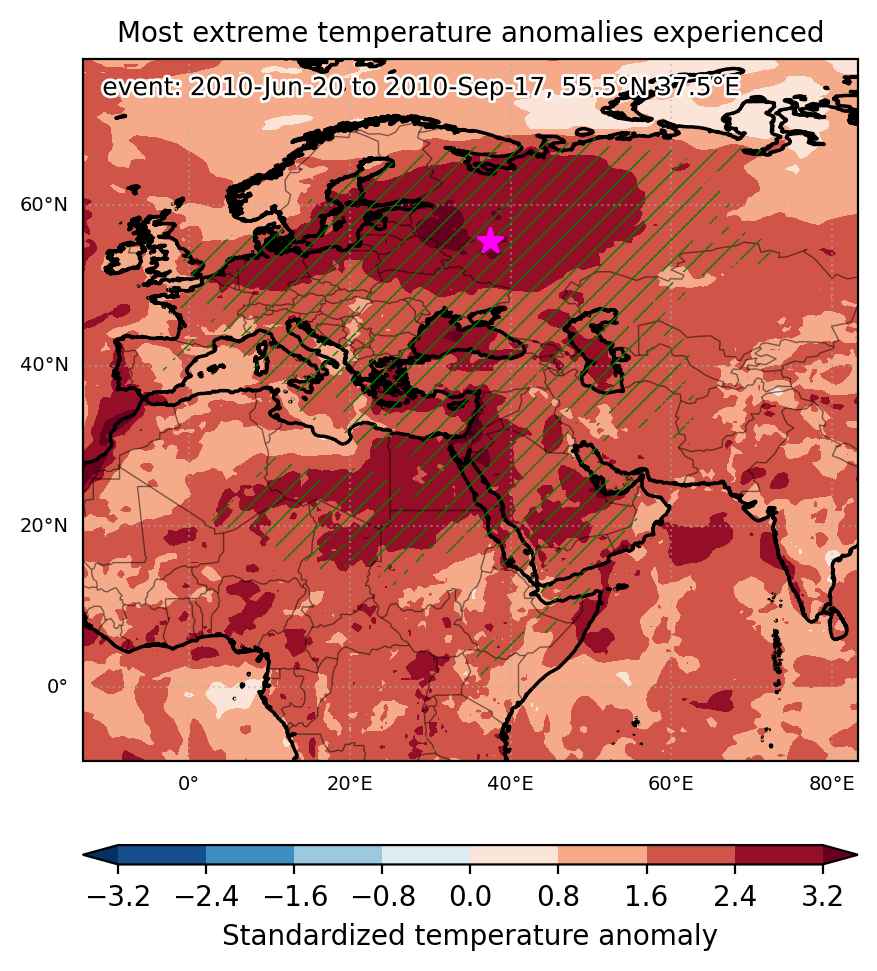
Event center: 55.5°N 37.5°E

Area affected: 22235143 km$^2$


Fig. 1: Map of most extreme temperature anomalies (standardized) experienced during the event. The purple star indicates the center of the extreme event. Green hatching illustrates all areas under the effect of extremes at some time during the event.


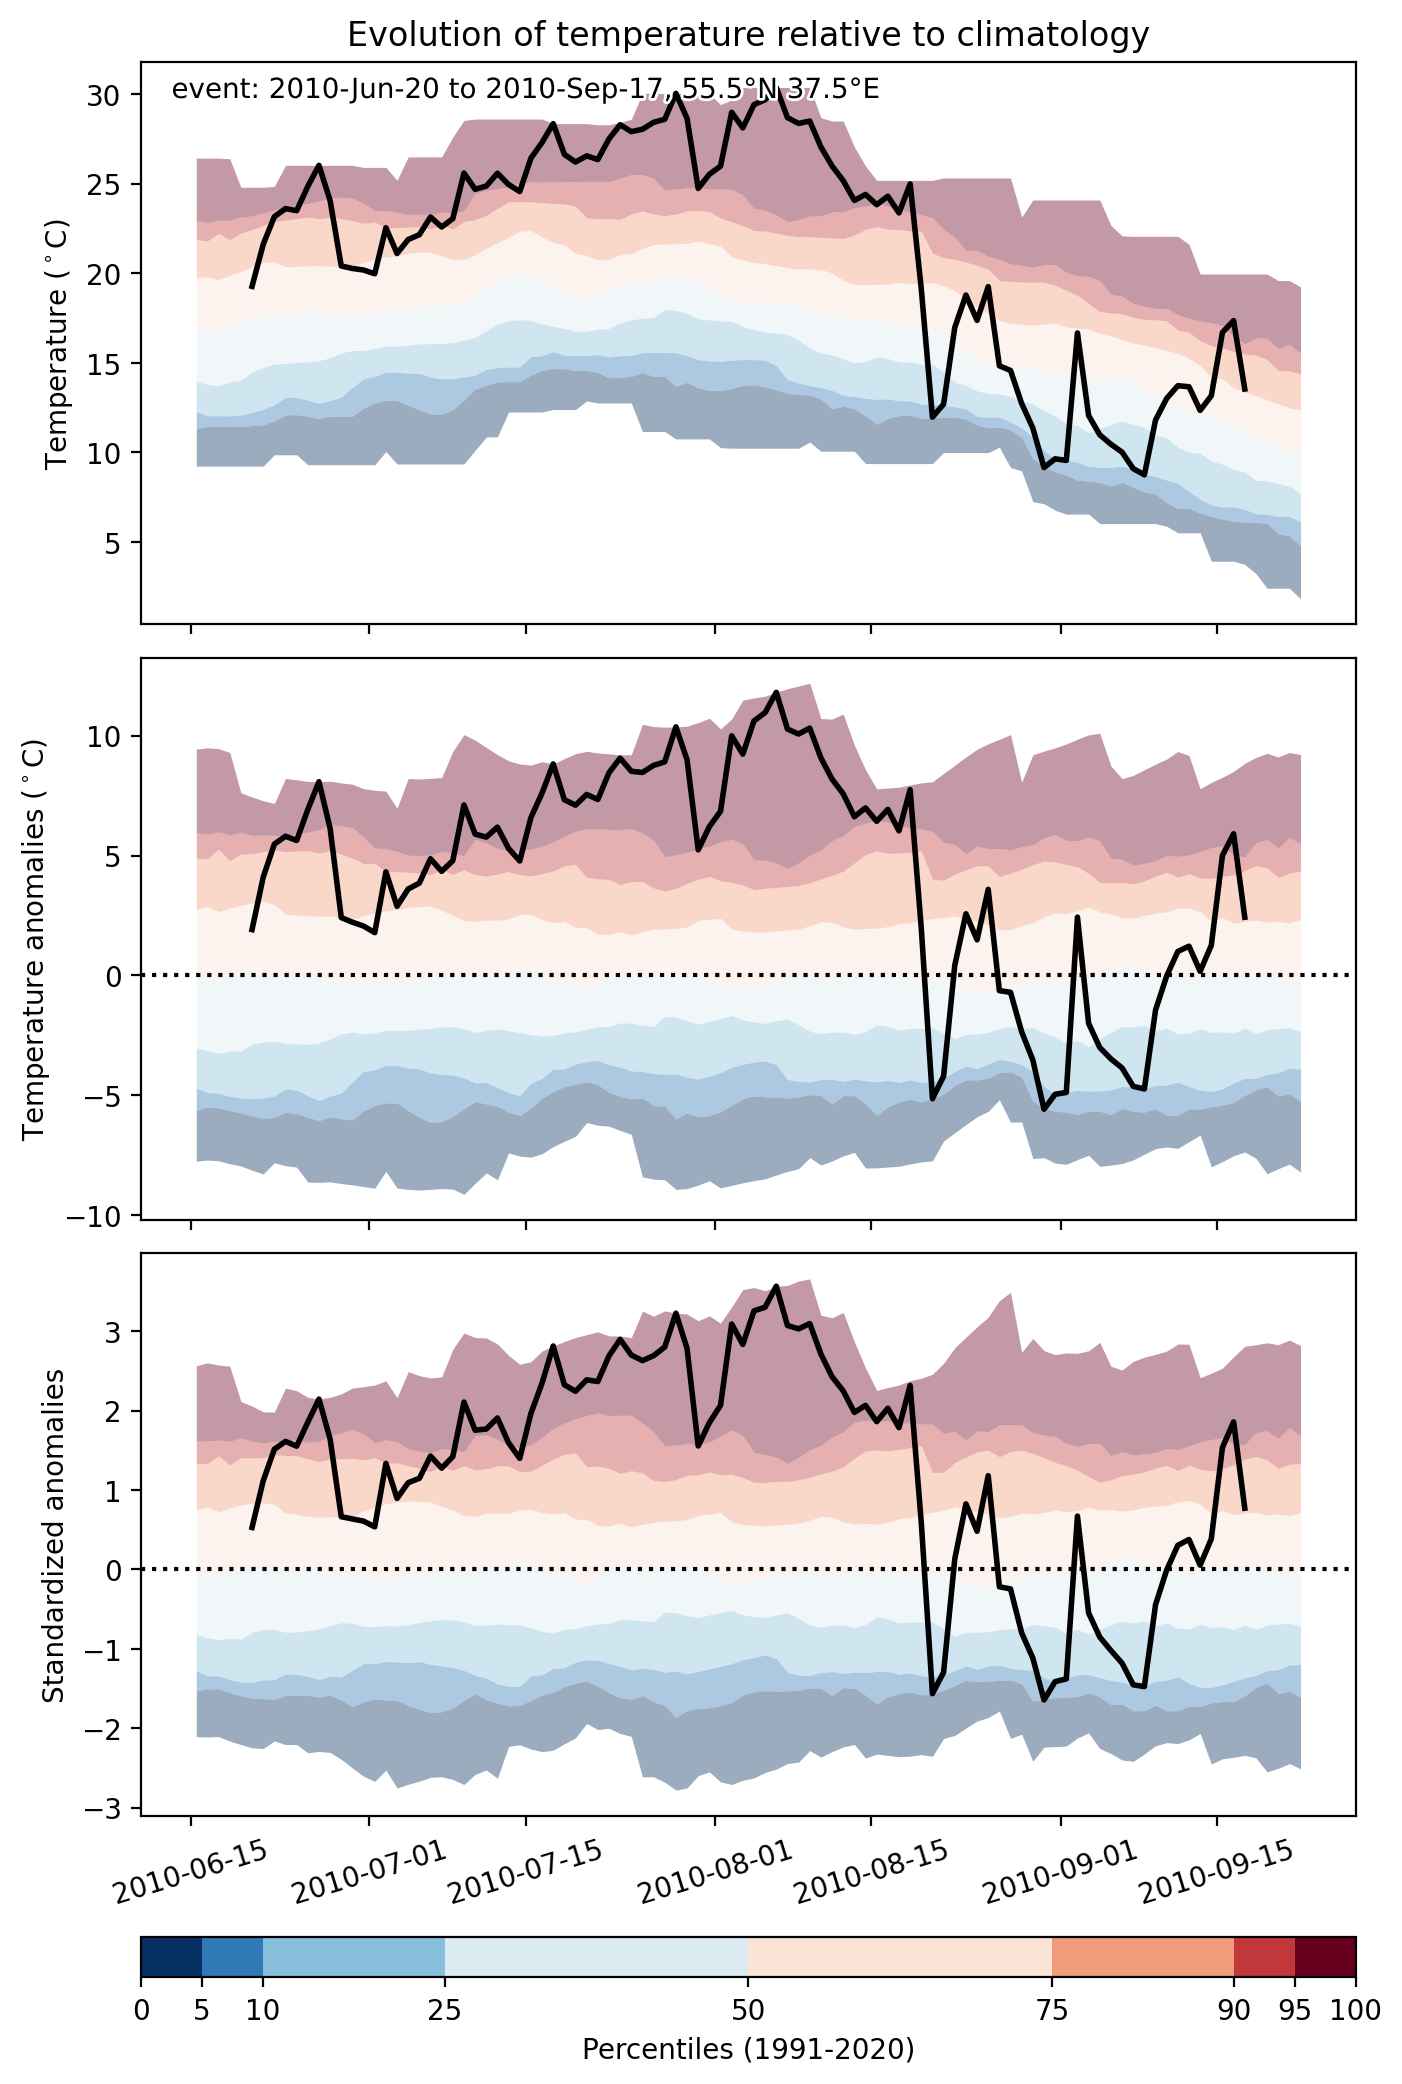
Fig. 2: Evolution of temperature at the center of the event. The climatological percentile distribution is illustrated with color shadings.


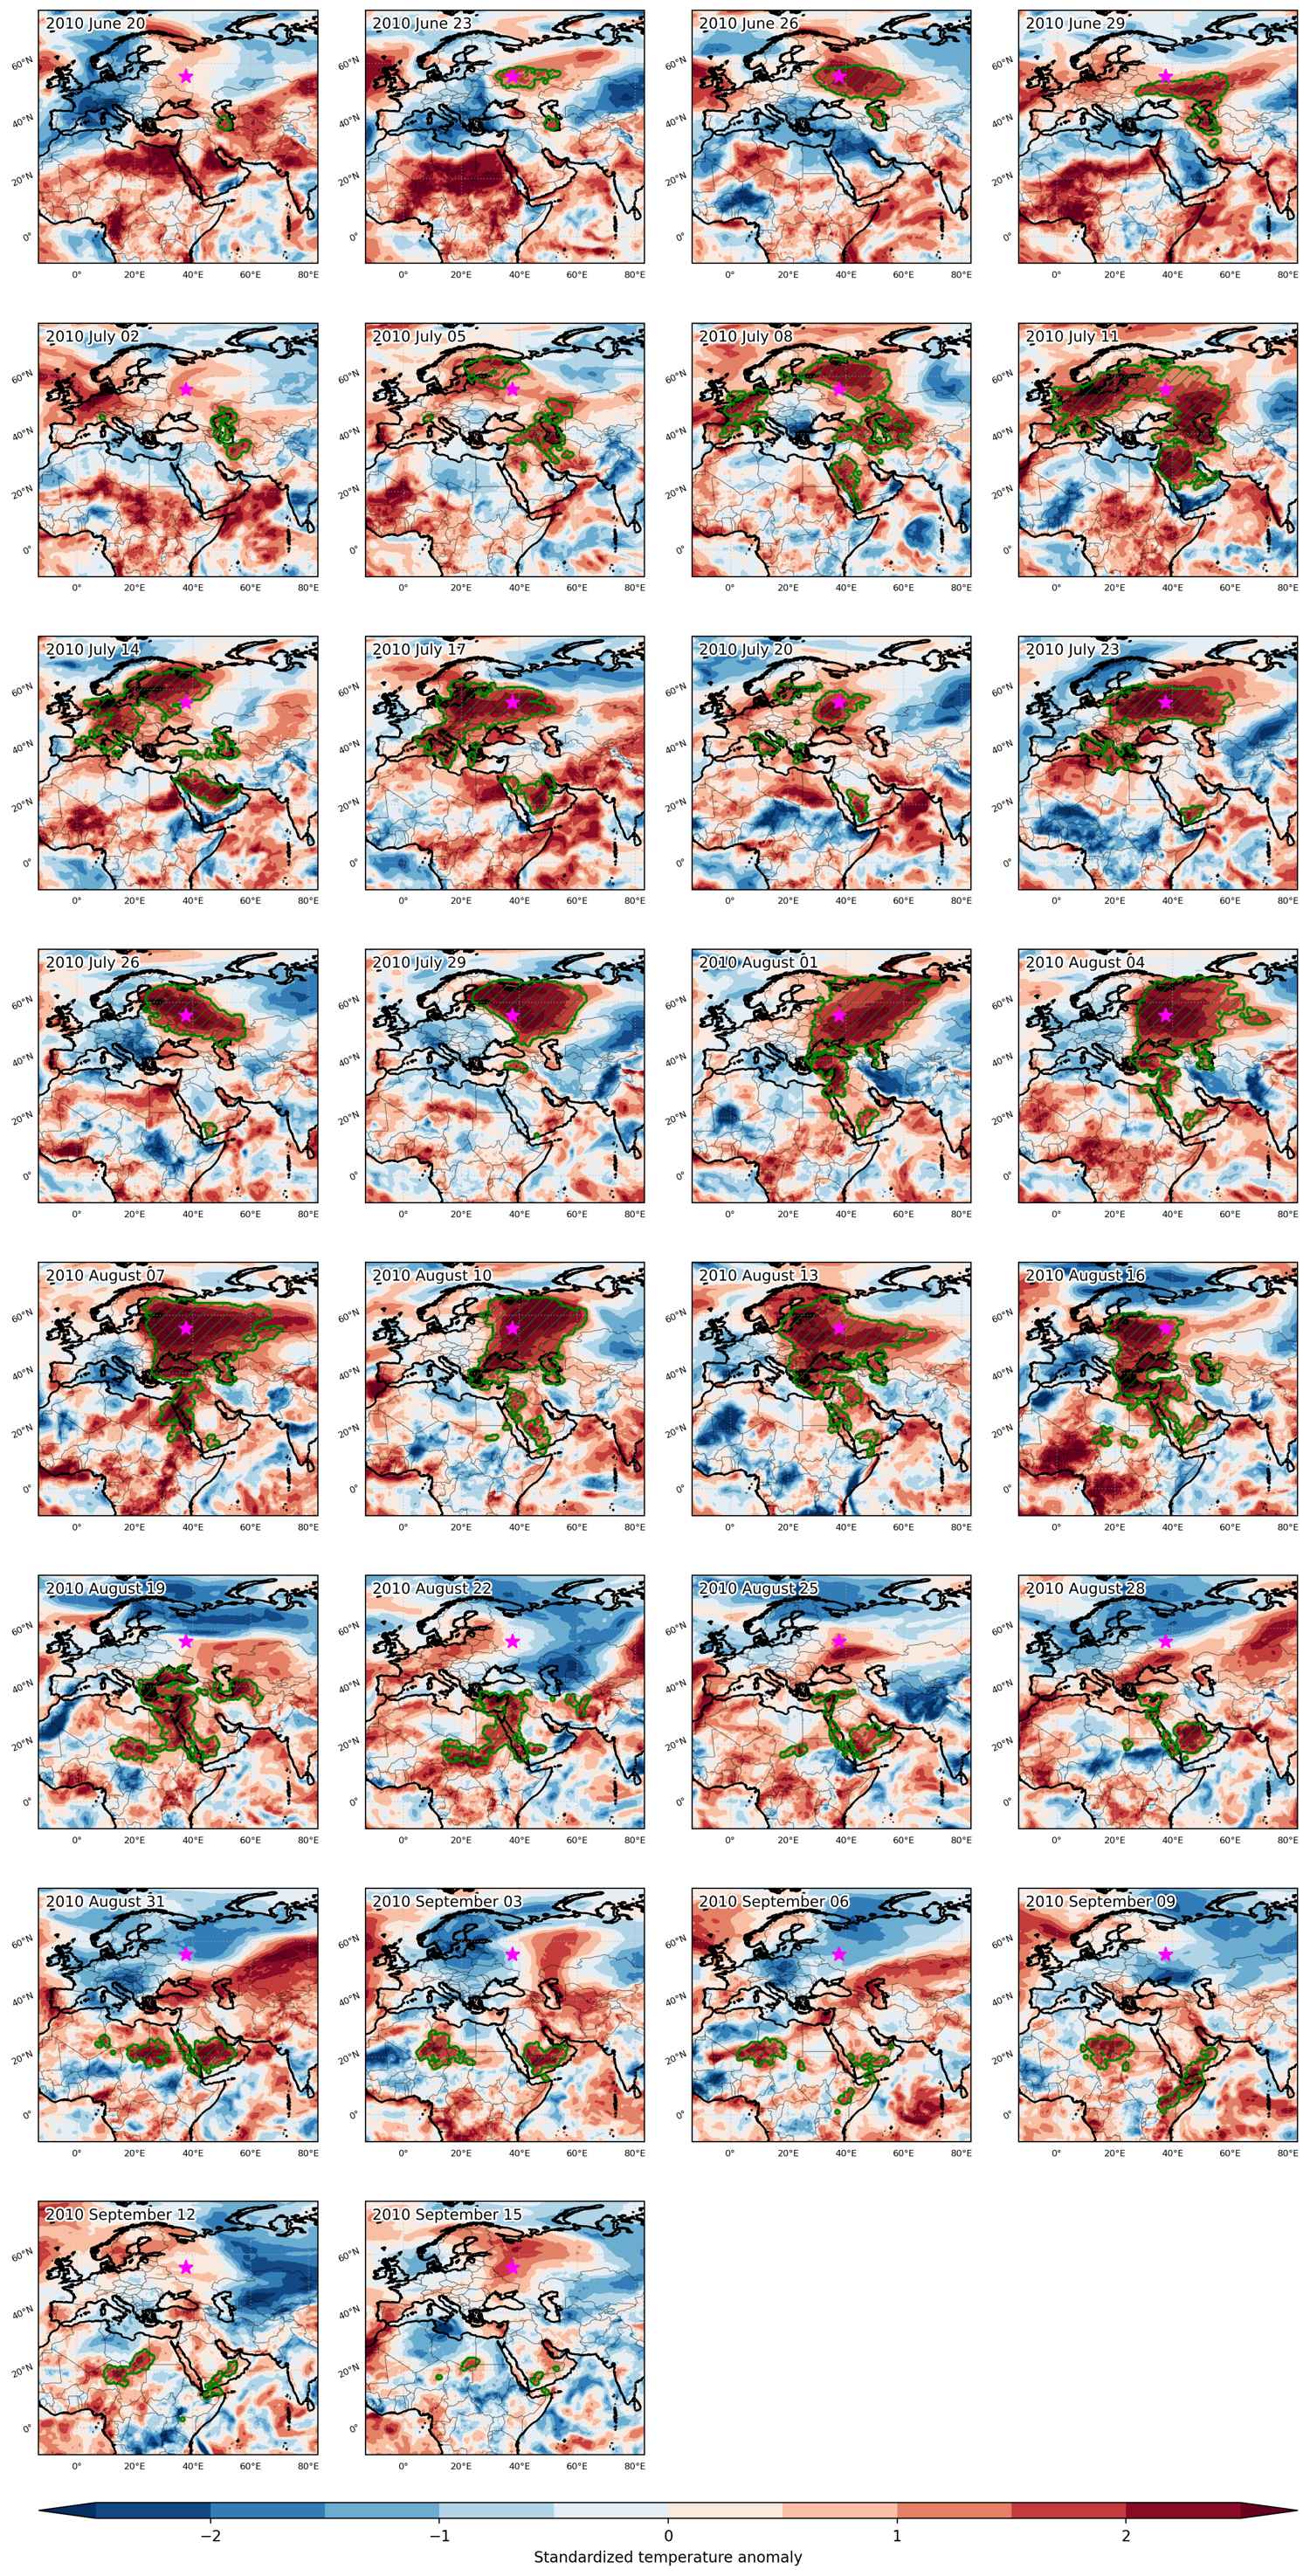
Fig. 3: Maps illustrating the evolution of standardized temperature anomalies during the event.

Event ID: Heat_wave_2010-Jun-20_to_2010-Sep-17_37.5_55.5

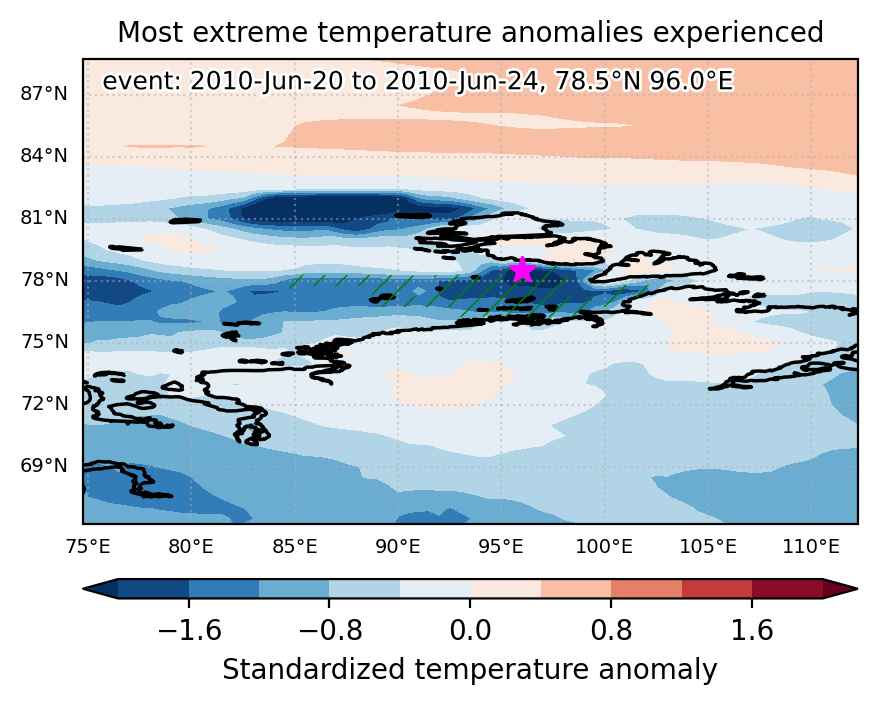
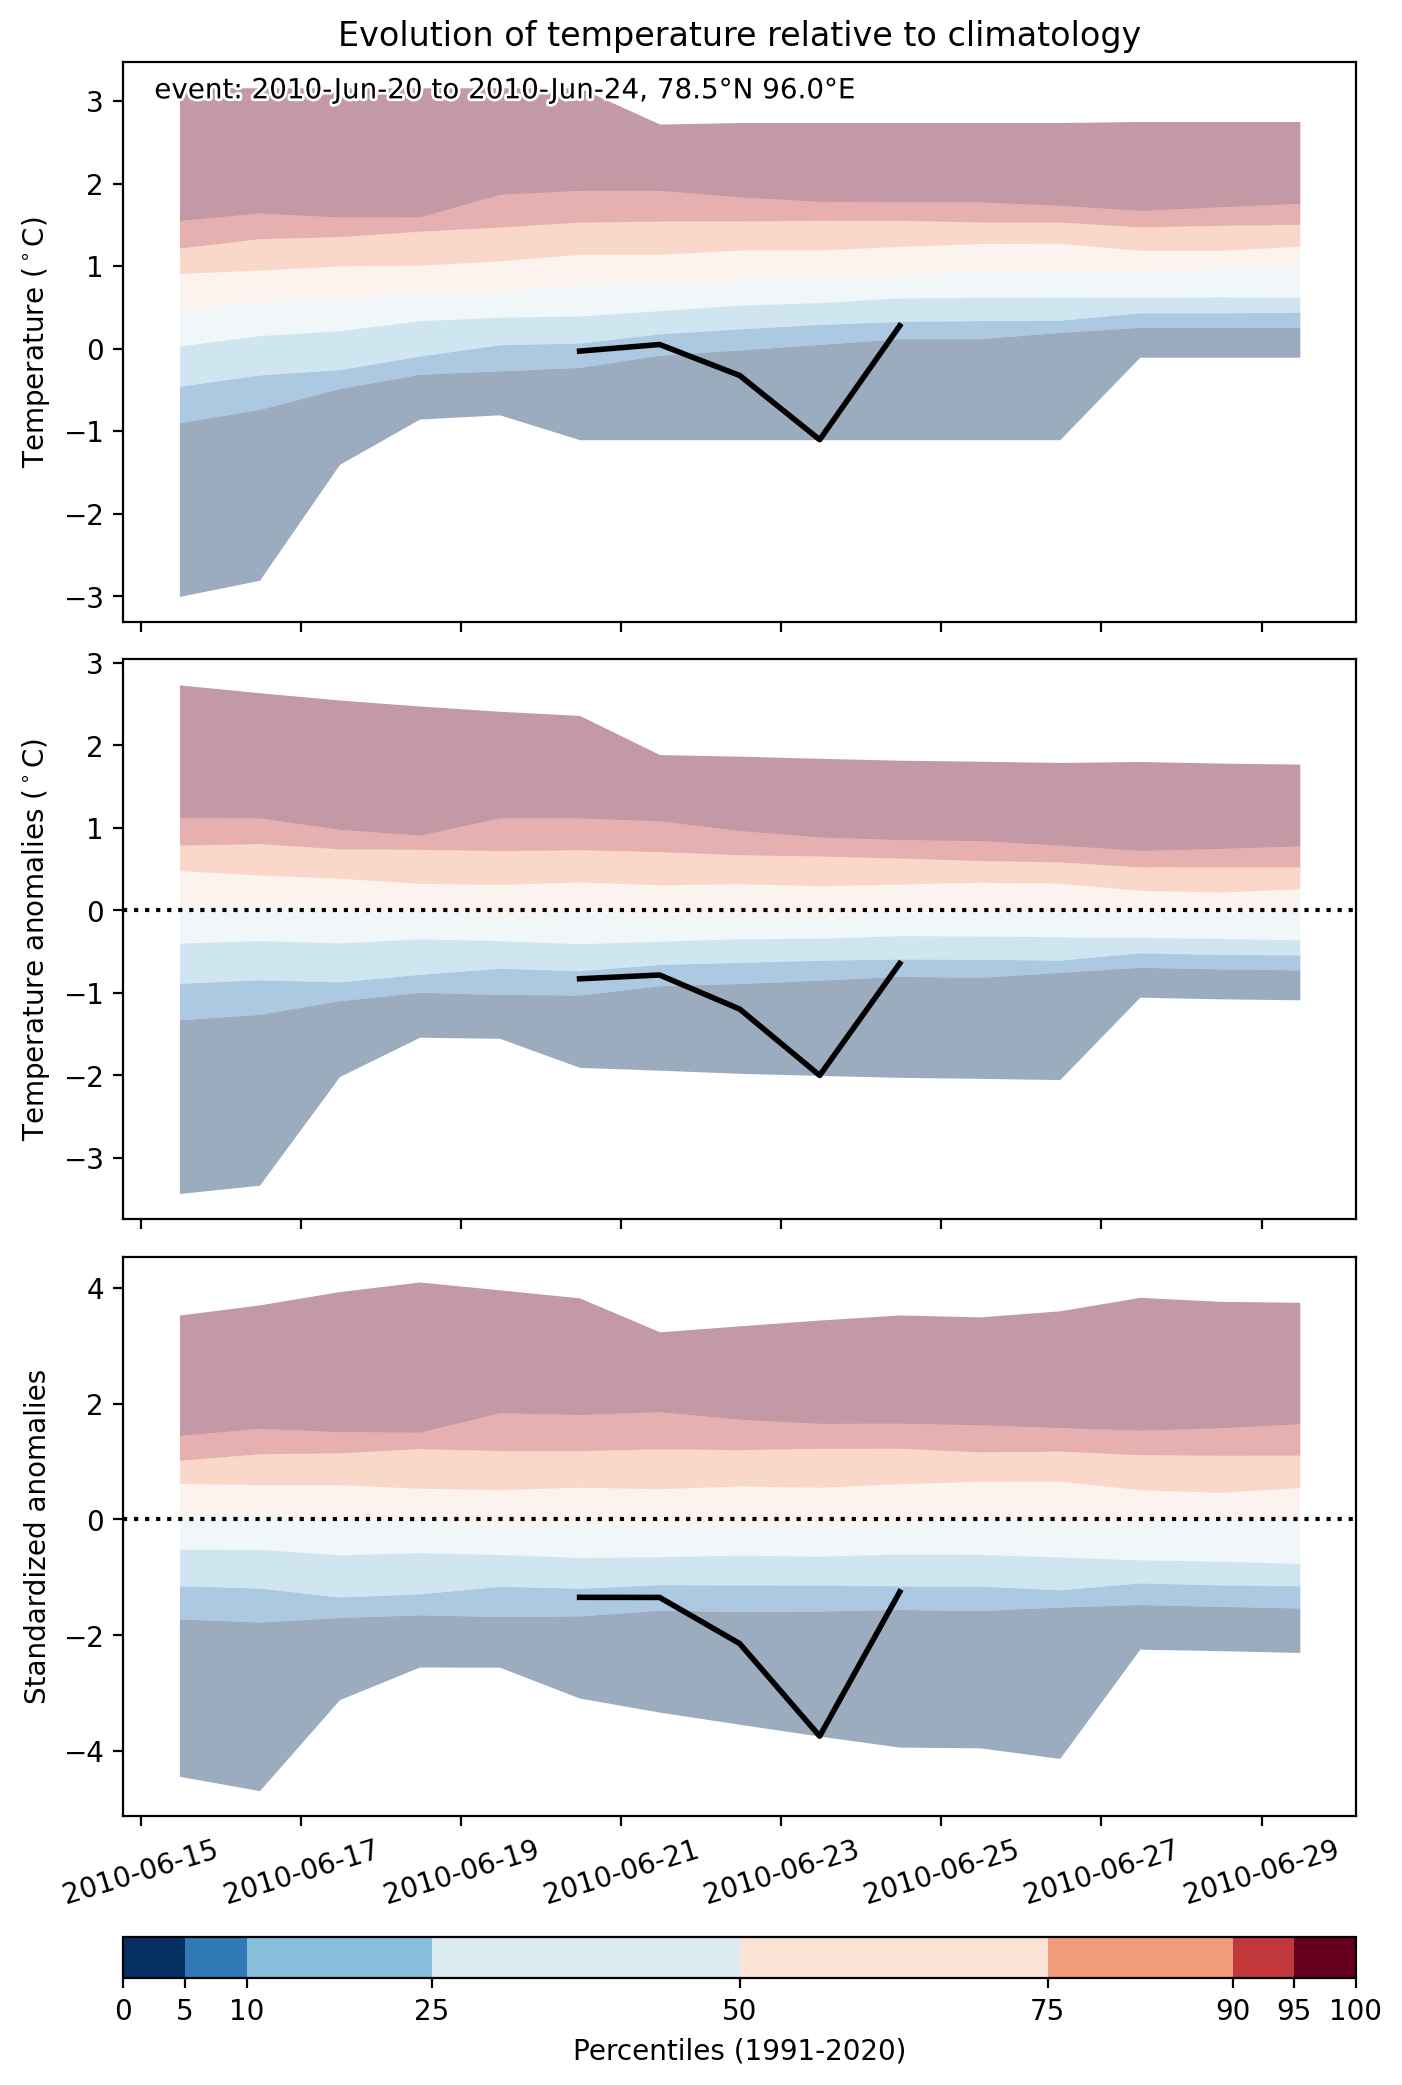
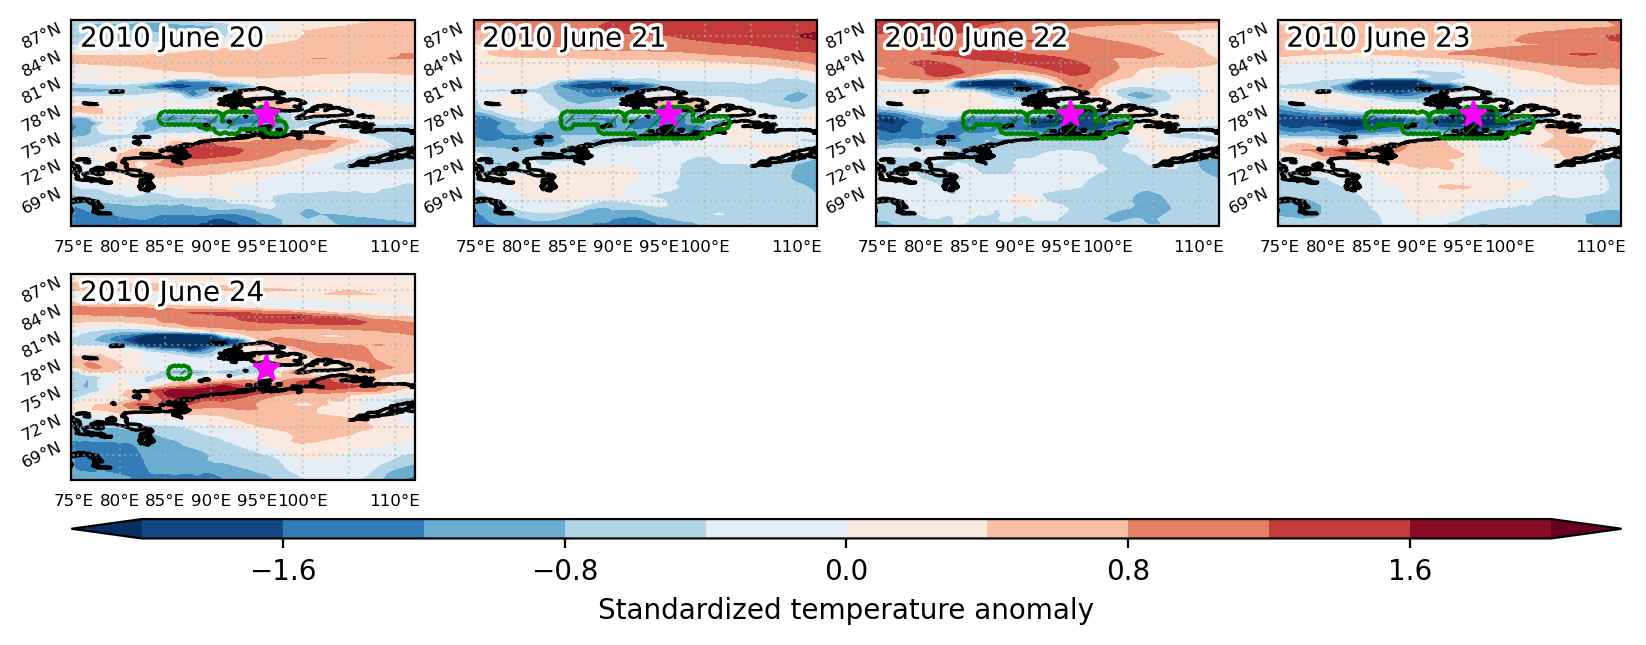
Cold spell occuring from June 20 2010 to June 24 2010 at 78.5°N 96.0°E

Download data: JSON

Event type: Cold spell

Countries affected (identified with ArcGIS Online; provided only for geographical reference):

  • Russian Federation

Duration: 5 days

Time span: June 20 2010 to June 24 2010

Statistics over entire affected area:

  • Mean temperature anomaly: -1.1 °C
  • Mean temperature: -0.3 °C
  • Minimum temperature anomaly: -2.1 °C
  • Minimum temperature: -1.3 °C

Event center: 78.5°N 96.0°E

Area affected: 60552 km$^2$


Fig. 1: Map of most extreme temperature anomalies (standardized) experienced during the event. The purple star indicates the center of the extreme event. Green hatching illustrates all areas under the effect of extremes at some time during the event.


Fig. 2: Evolution of temperature at the center of the event. The climatological percentile distribution is illustrated with color shadings.


Fig. 3: Maps illustrating the evolution of standardized temperature anomalies during the event.

Event ID: Cold_spell_2010-Jun-20_to_2010-Jun-24_96.0_78.5

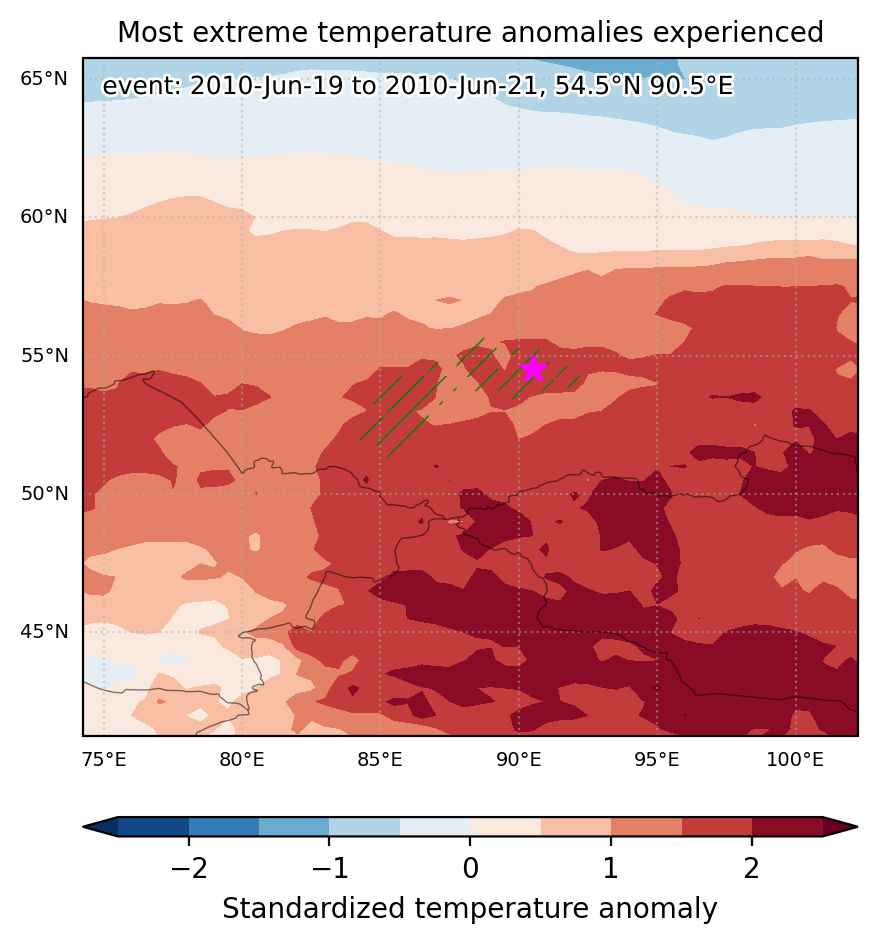
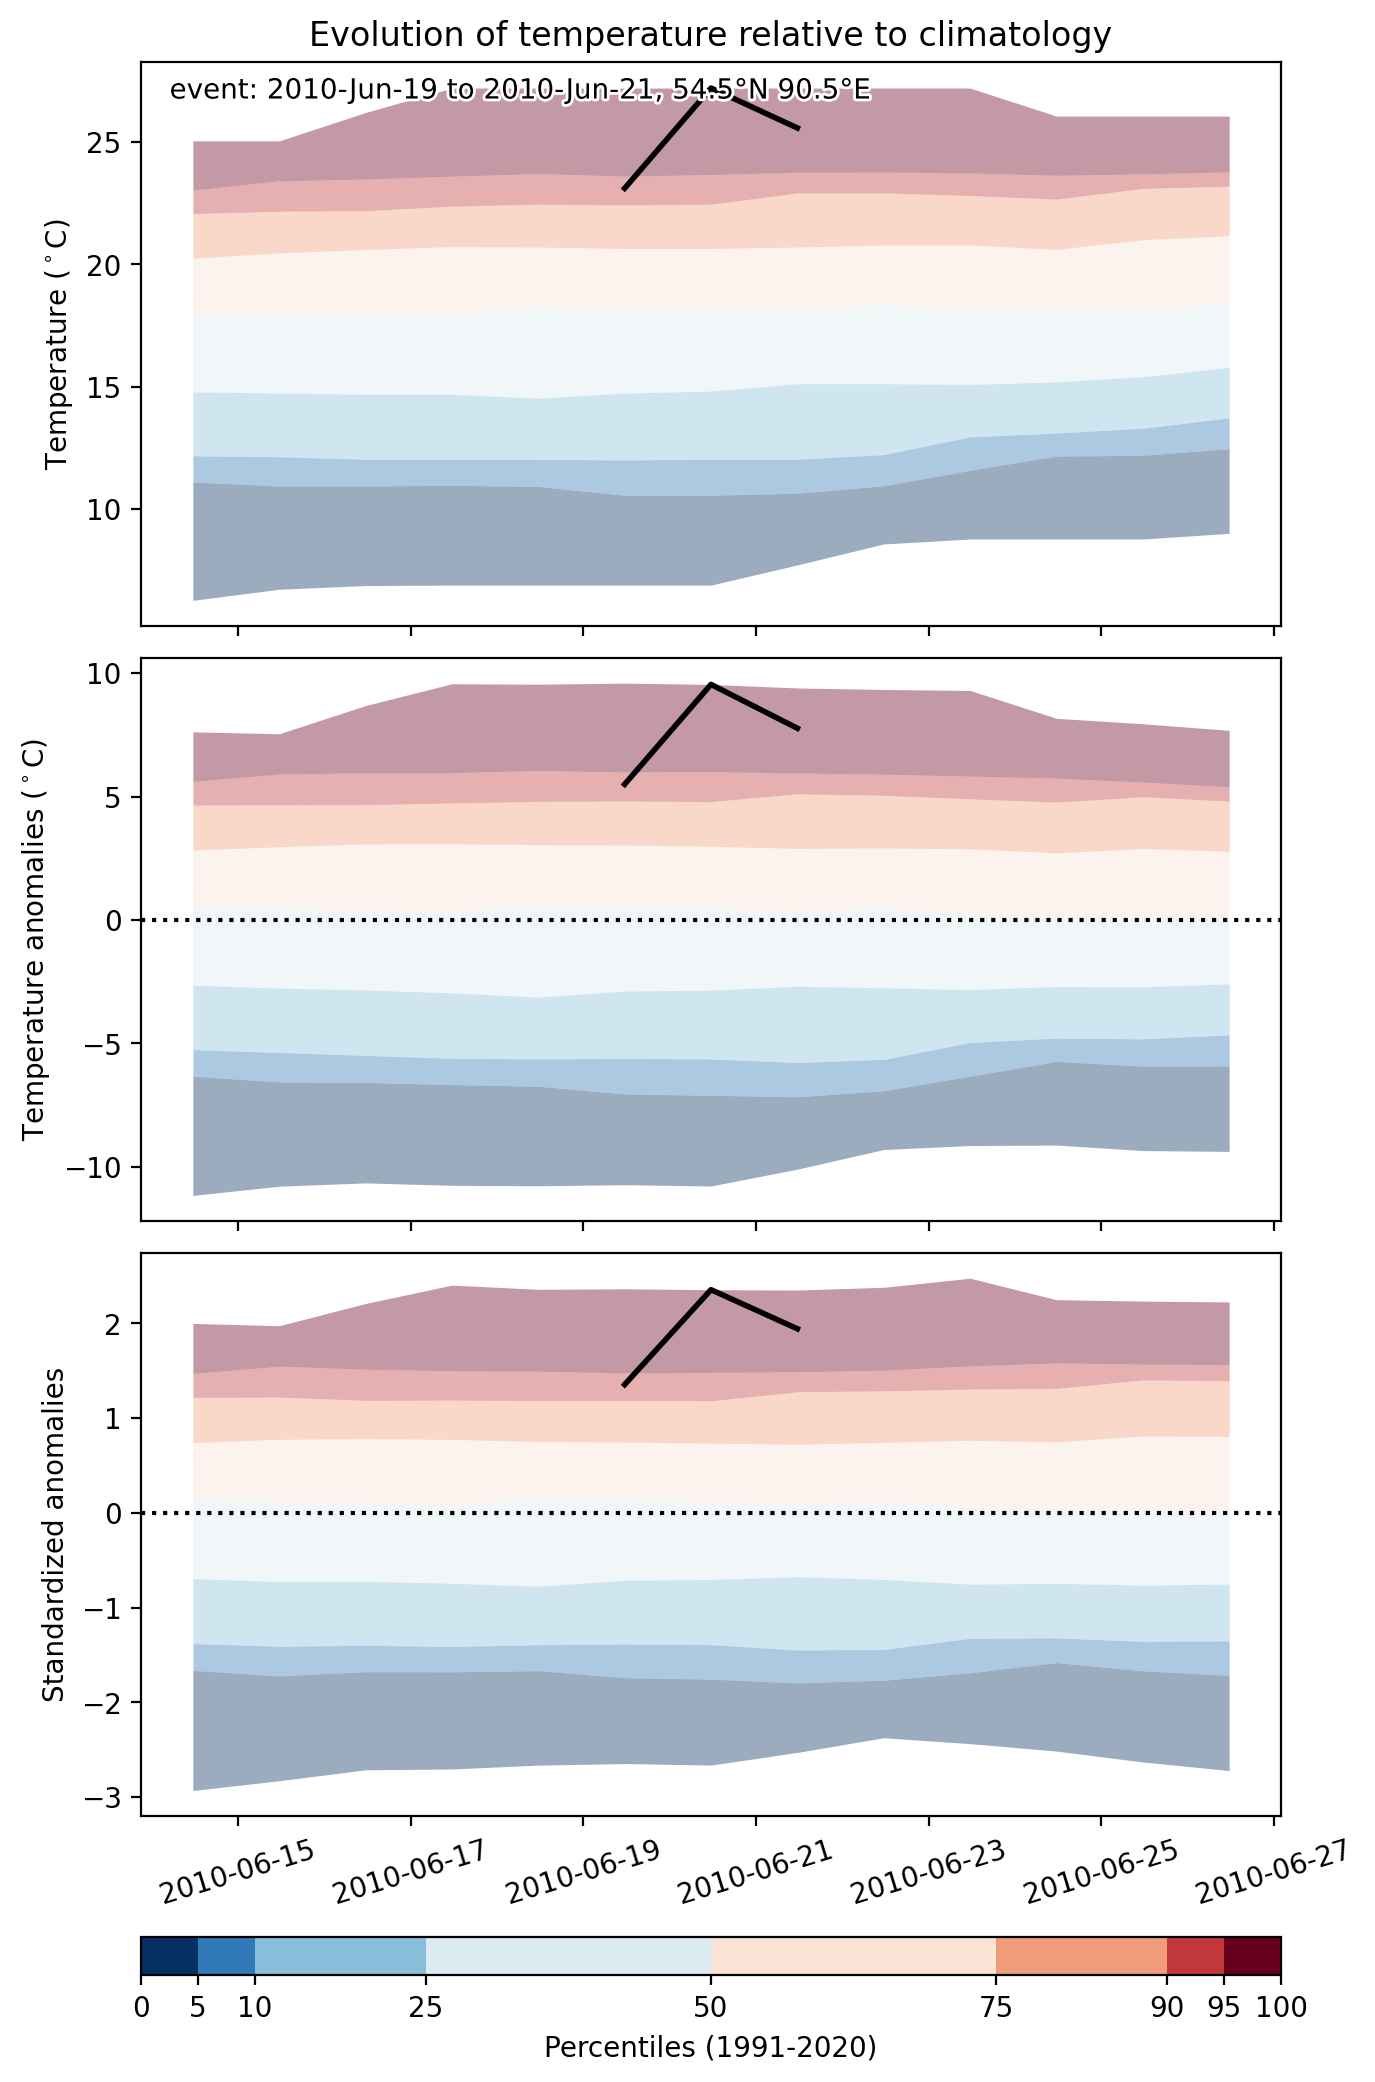
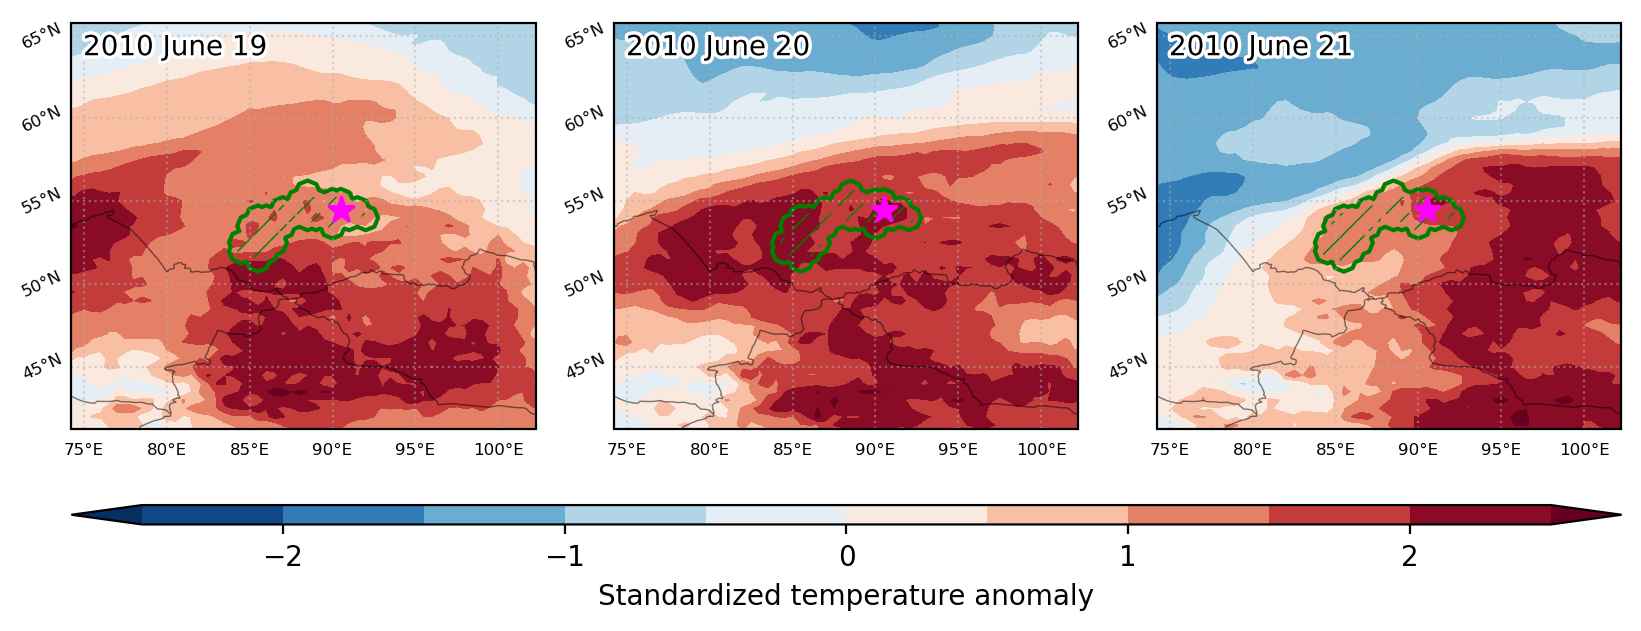
Heat wave occuring from June 19 2010 to June 21 2010 at 54.5°N 90.5°E

Download data: JSON

Event type: Heat wave

Countries affected (identified with ArcGIS Online; provided only for geographical reference):

  • Russian Federation

Duration: 3 days

Time span: June 19 2010 to June 21 2010

Statistics over entire affected area:

  • Mean temperature anomaly: 6.3 °C
  • Mean temperature: 23.1 °C
  • Maximum temperature anomaly: 9.8 °C
  • Maximum temperature: 28.3 °C

Event center: 54.5°N 90.5°E

Area affected: 82336 km$^2$


Fig. 1: Map of most extreme temperature anomalies (standardized) experienced during the event. The purple star indicates the center of the extreme event. Green hatching illustrates all areas under the effect of extremes at some time during the event.


Fig. 2: Evolution of temperature at the center of the event. The climatological percentile distribution is illustrated with color shadings.


Fig. 3: Maps illustrating the evolution of standardized temperature anomalies during the event.

Event ID: Heat_wave_2010-Jun-19_to_2010-Jun-21_90.5_54.5