Cold spell occuring from February 03 2020 to February 06 2020 at 37.5°N 241.0°E

Download data: JSON

Event type: Cold spell

Countries affected (identified with ArcGIS Online; provided only for geographical reference):

  • United States

Duration: 4 days

Time span: February 03 2020 to February 06 2020

Statistics over entire affected area:

  • Mean temperature anomaly: -4.7 °C
  • Mean temperature: 4.1 °C
  • Minimum temperature anomaly: -11.7 °C
  • Minimum temperature: -16.8 °C

Event center: 37.5°N 241.0°E

Area affected: 64769 km$^2$
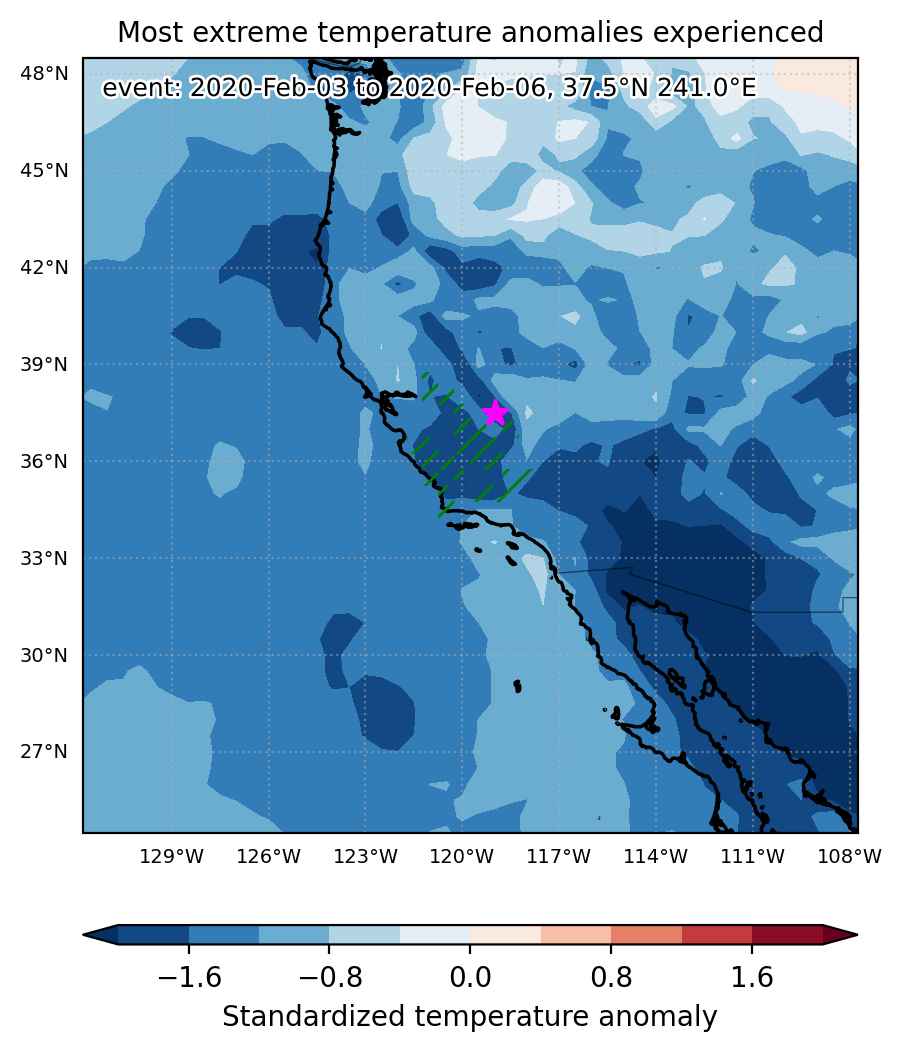

Fig. 1: Map of most extreme temperature anomalies (standardized) experienced during the event. The purple star indicates the center of the extreme event. Green hatching illustrates all areas under the effect of extremes at some time during the event.
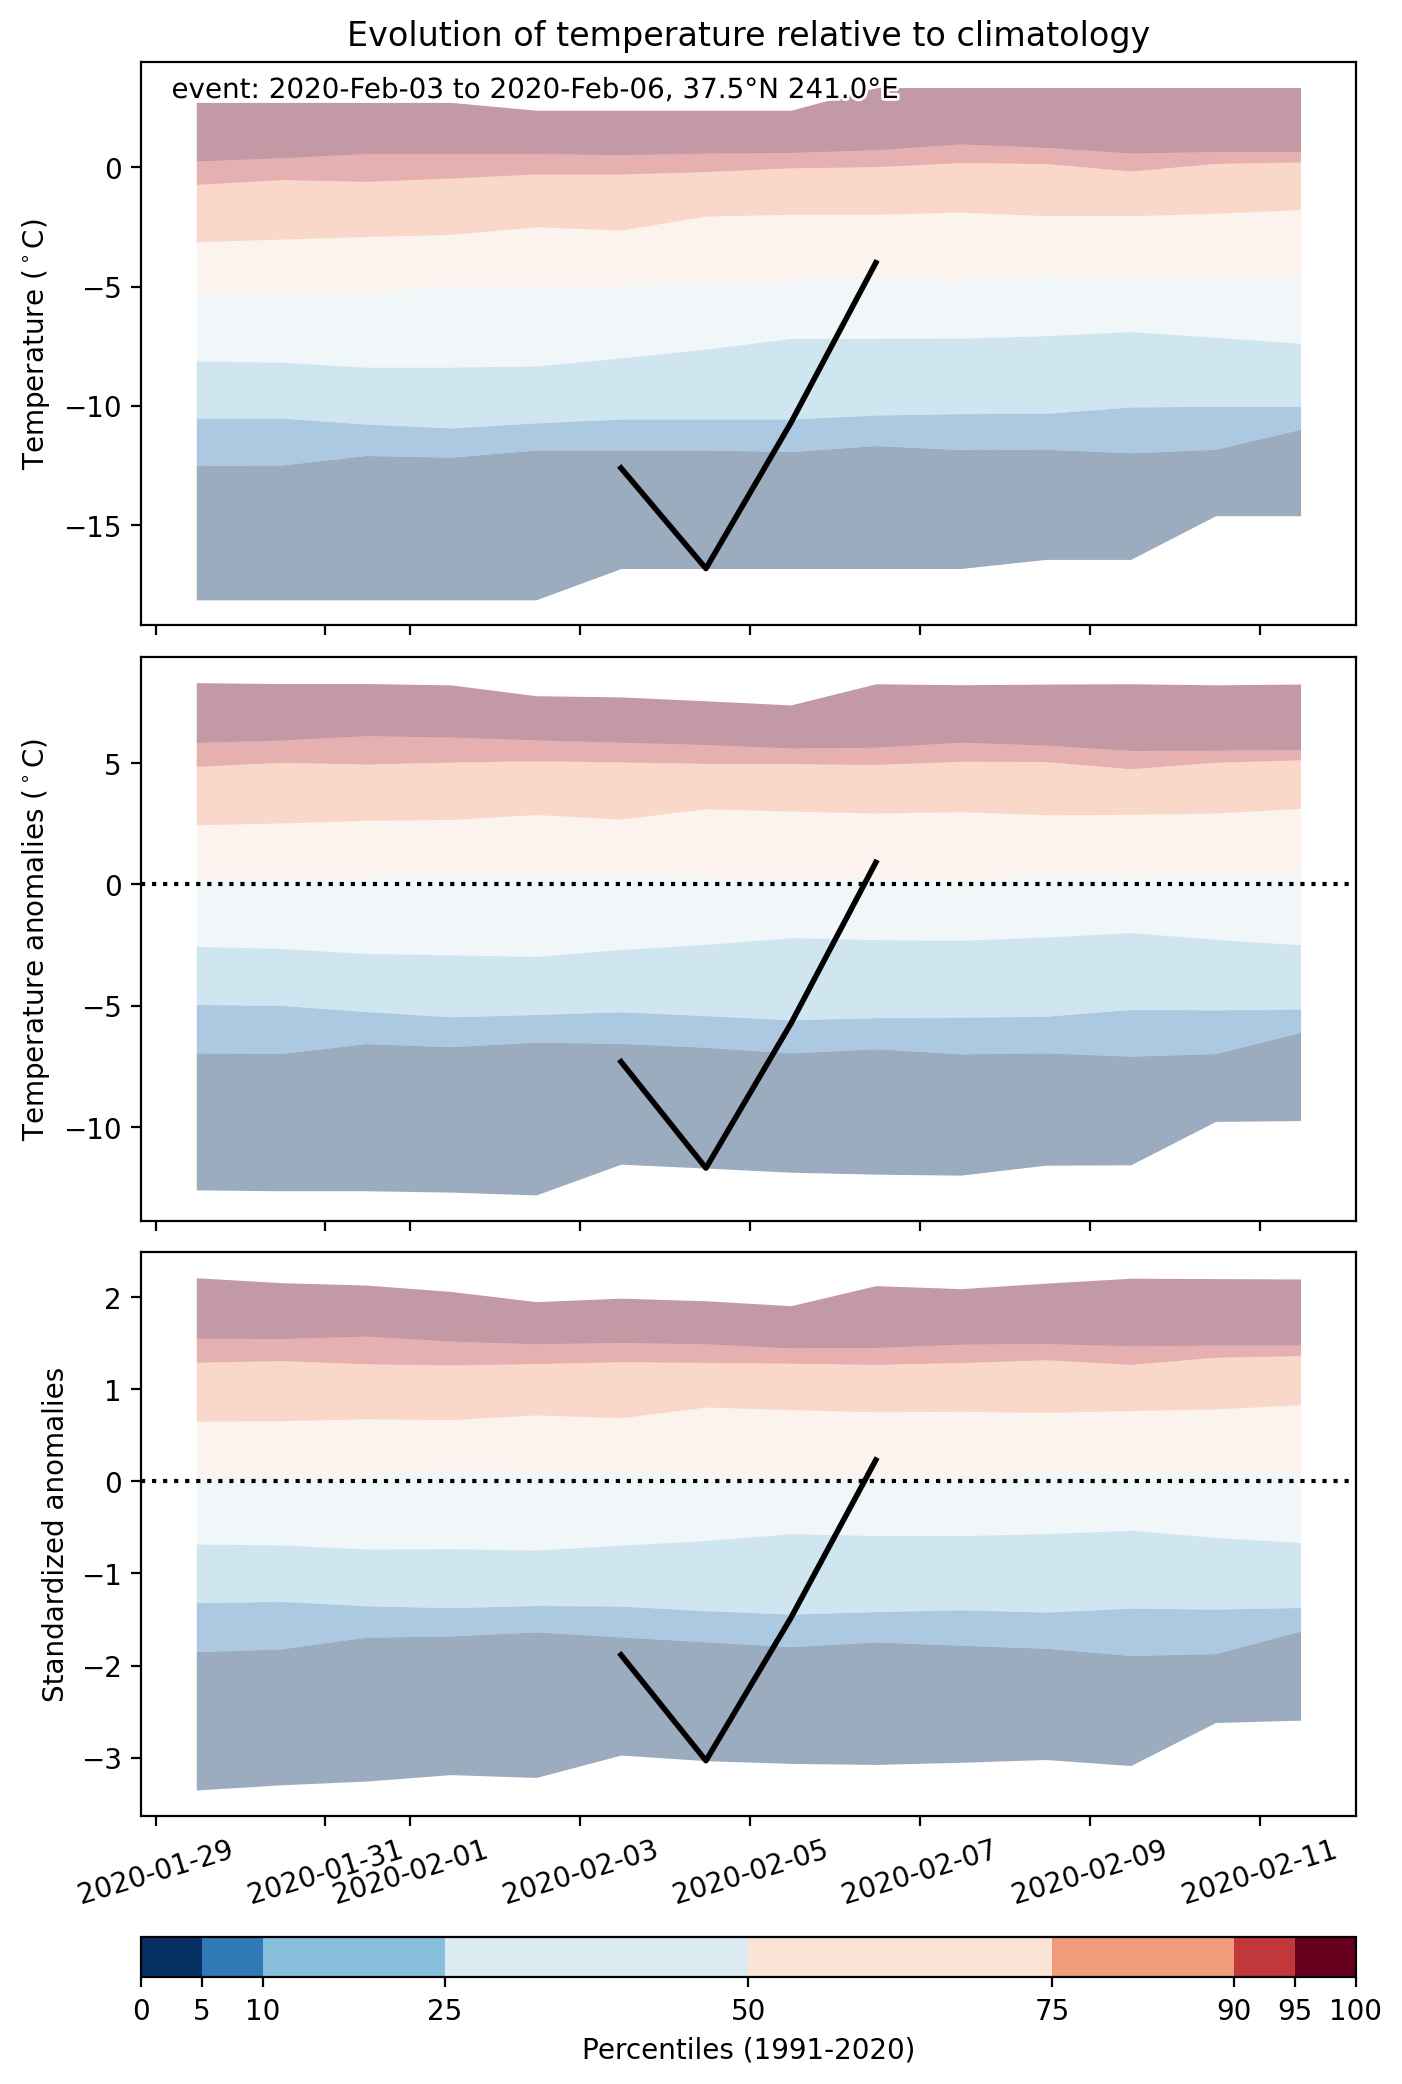


Fig. 2: Evolution of temperature at the center of the event. The climatological percentile distribution is illustrated with color shadings.
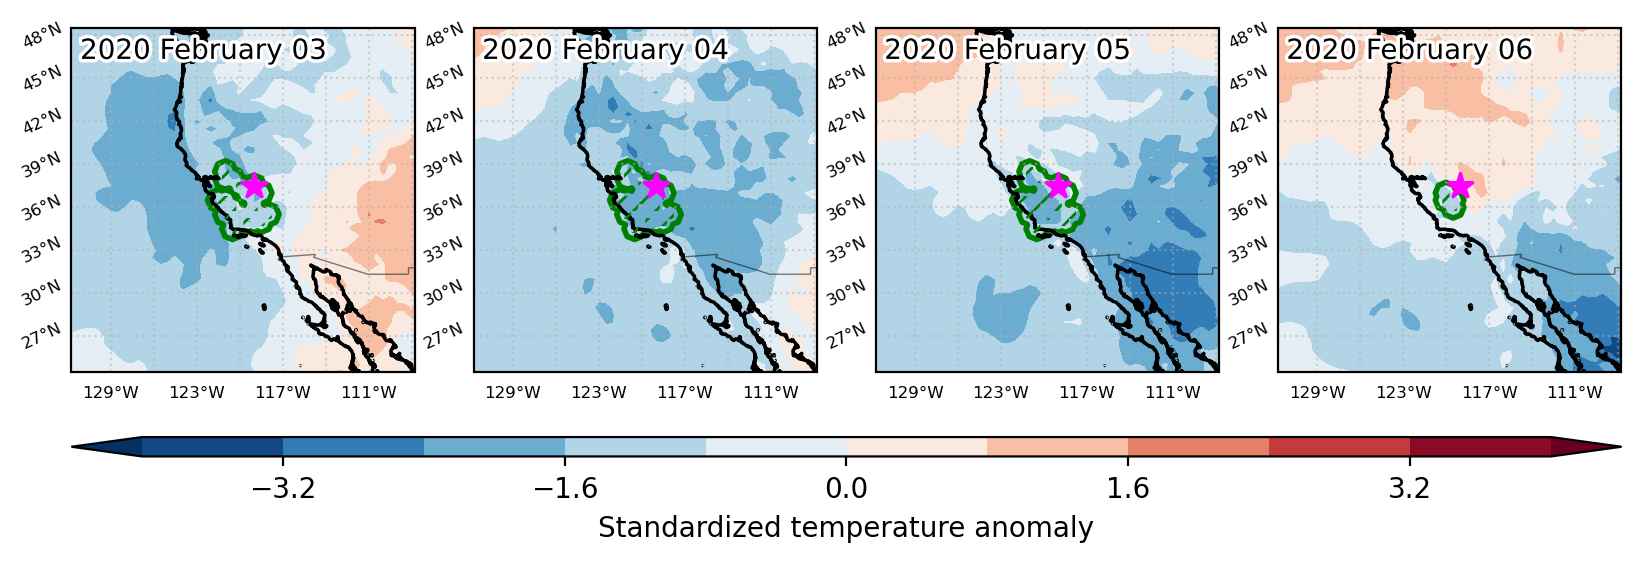


Fig. 3: Maps illustrating the evolution of standardized temperature anomalies during the event.

Event ID: Cold_spell_2020-Feb-03_to_2020-Feb-06_241.0_37.5
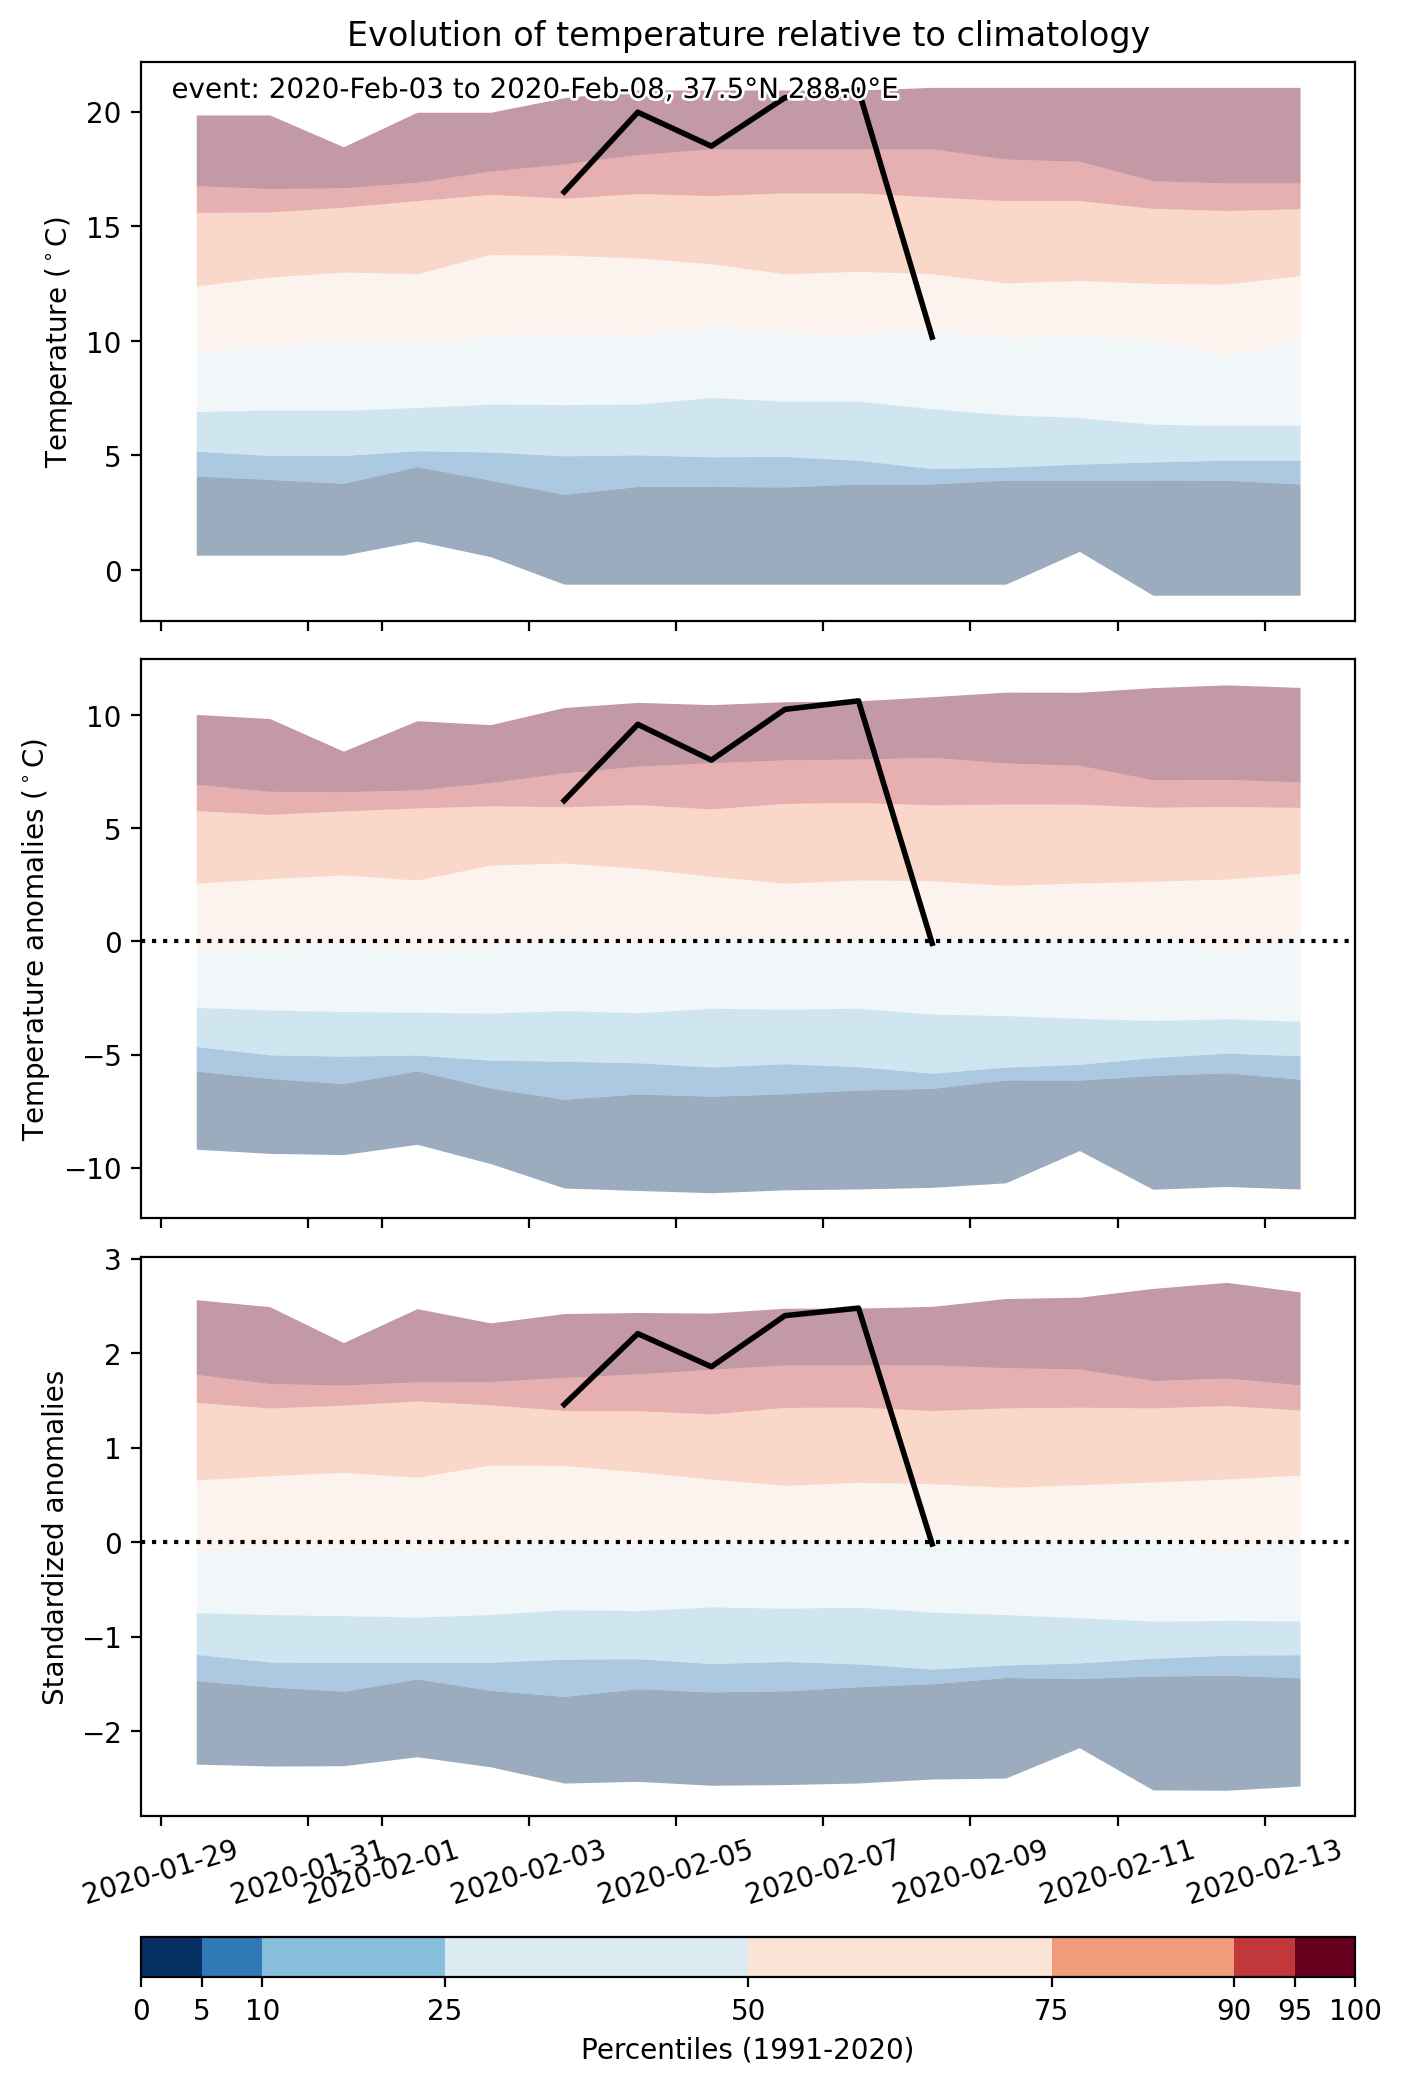
Heat wave occuring from February 03 2020 to February 08 2020 at 37.5°N 288.0°E

Download data: JSON

Event type: Heat wave

Countries affected (identified with ArcGIS Online; provided only for geographical reference):

  • United States

Duration: 6 days

Time span: February 03 2020 to February 08 2020

Statistics over entire affected area:

  • Mean temperature anomaly: 6.7 °C
  • Mean temperature: 18.2 °C
  • Maximum temperature anomaly: 13.7 °C
  • Maximum temperature: 23.6 °C

Event center: 37.5°N 288.0°E

Area affected: 1618779 km$^2$


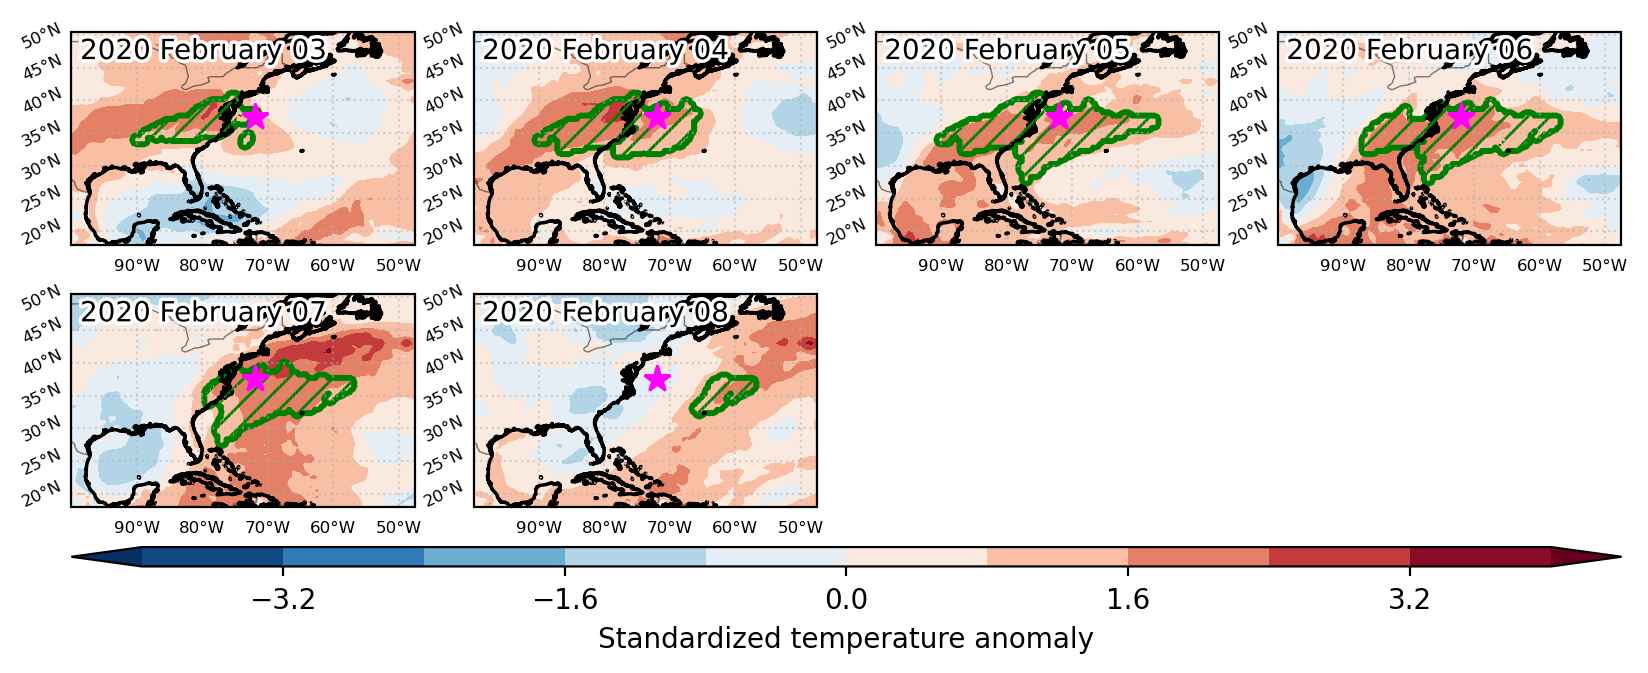
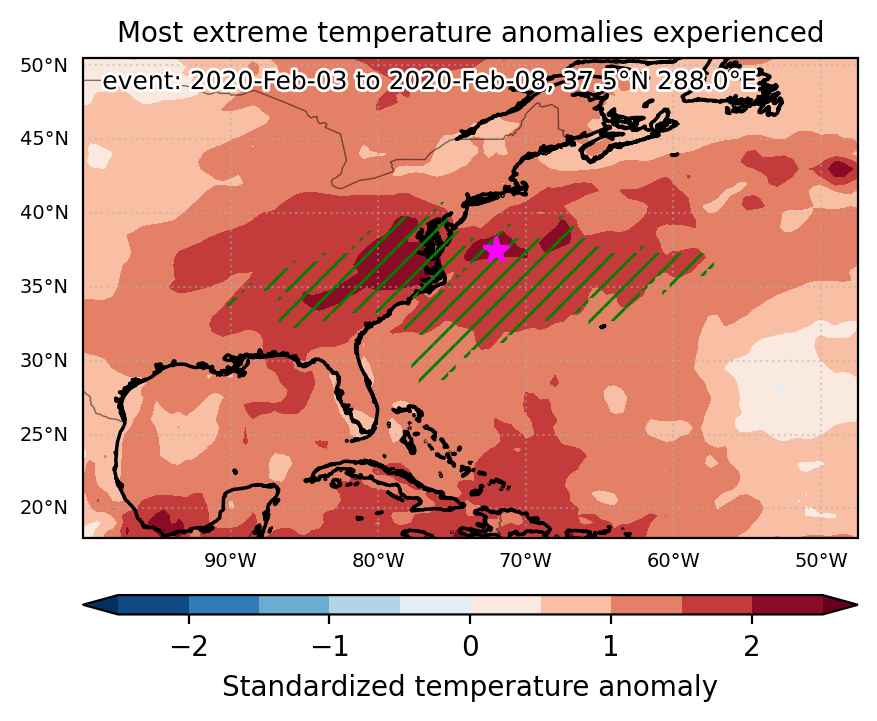
Fig. 1: Map of most extreme temperature anomalies (standardized) experienced during the event. The purple star indicates the center of the extreme event. Green hatching illustrates all areas under the effect of extremes at some time during the event.


Fig. 2: Evolution of temperature at the center of the event. The climatological percentile distribution is illustrated with color shadings.


Fig. 3: Maps illustrating the evolution of standardized temperature anomalies during the event.

Event ID: Heat_wave_2020-Feb-03_to_2020-Feb-08_288.0_37.5

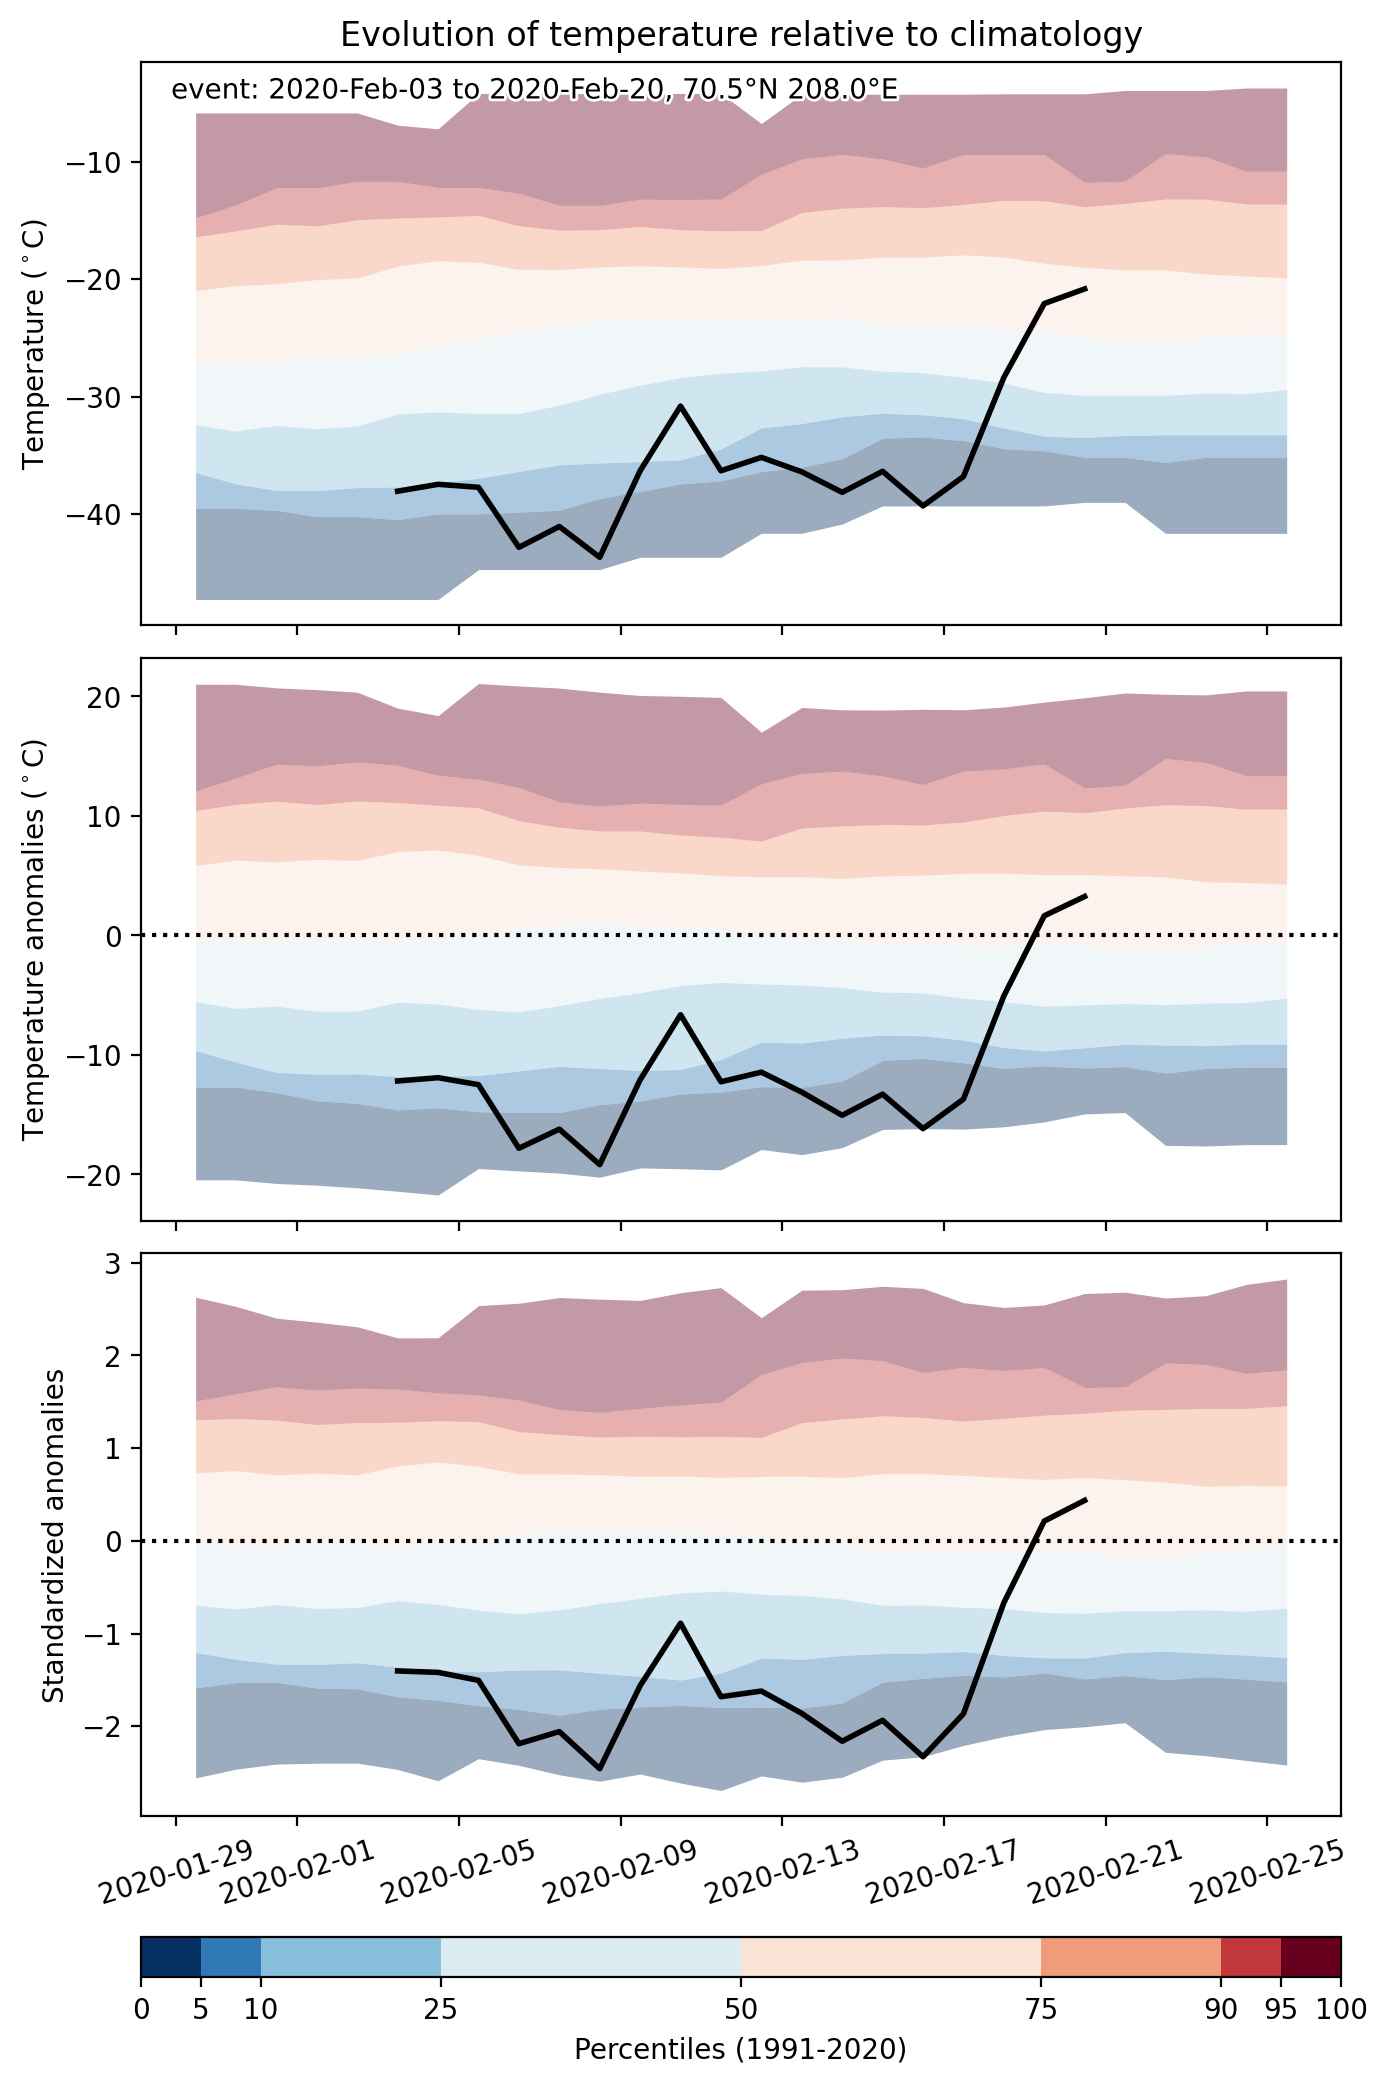
Cold spell occuring from February 03 2020 to February 20 2020 at 70.5°N 208.0°E

Download data: JSON

Event type: Cold spell

Countries affected (identified with ArcGIS Online; provided only for geographical reference):

  • Canada
  • Russian Federation
  • United States

Duration: 18 days

Time span: February 03 2020 to February 20 2020

Statistics over entire affected area:

  • Mean temperature anomaly: -12.0 °C
  • Mean temperature: -32.3 °C
  • Minimum temperature anomaly: -25.2 °C
  • Minimum temperature: -48.1 °C

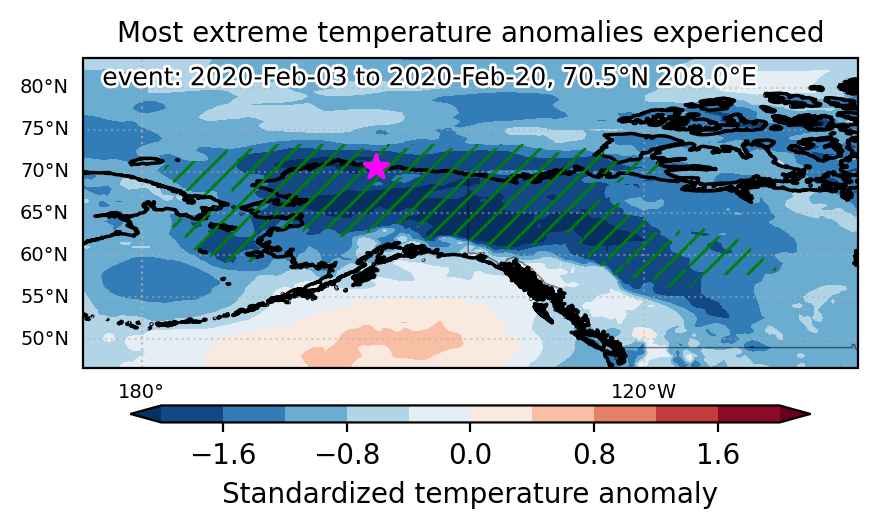
Event center: 70.5°N 208.0°E

Area affected: 3227151 km$^2$


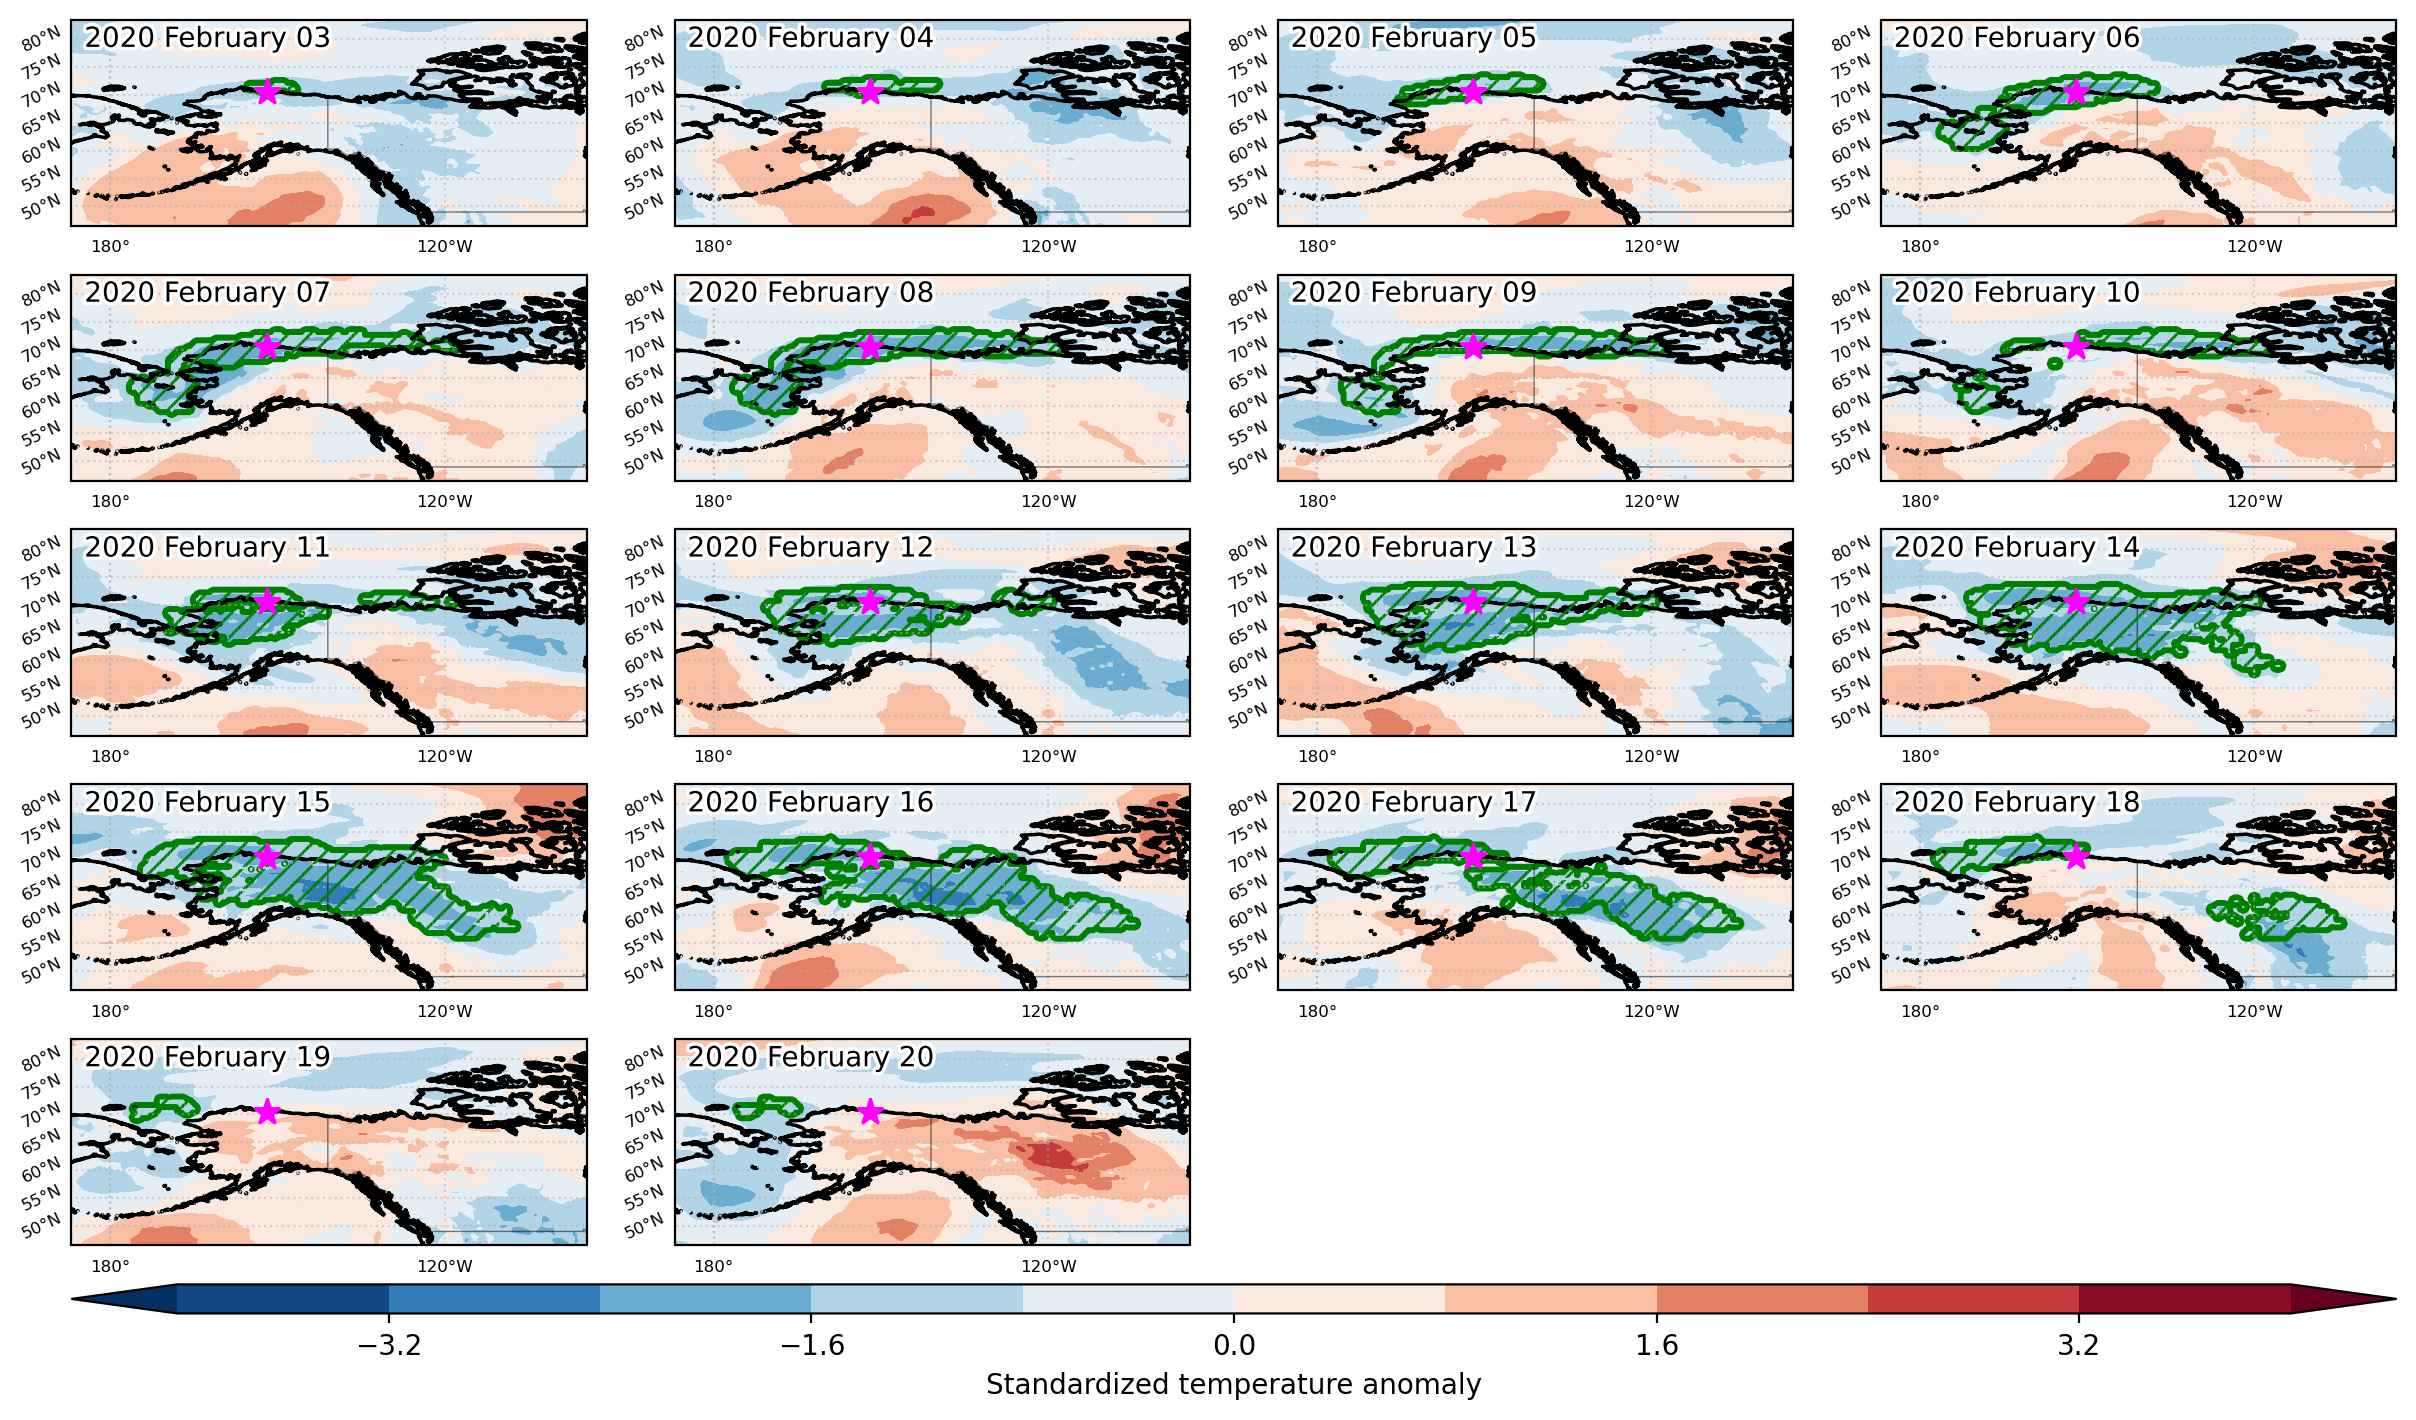
Fig. 1: Map of most extreme temperature anomalies (standardized) experienced during the event. The purple star indicates the center of the extreme event. Green hatching illustrates all areas under the effect of extremes at some time during the event.


Fig. 2: Evolution of temperature at the center of the event. The climatological percentile distribution is illustrated with color shadings.


Fig. 3: Maps illustrating the evolution of standardized temperature anomalies during the event.

Event ID: Cold_spell_2020-Feb-03_to_2020-Feb-20_208.0_70.5

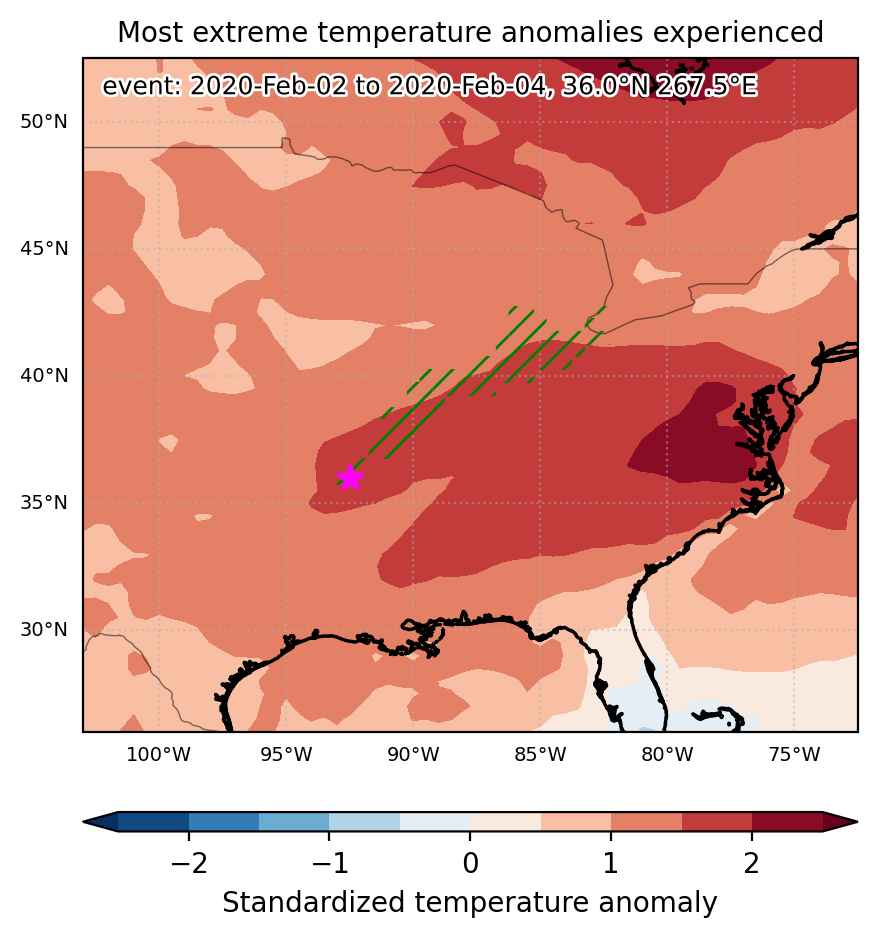
Heat wave occuring from February 02 2020 to February 04 2020 at 36.0°N 267.5°E

Download data: JSON

Event type: Heat wave

Countries affected (identified with ArcGIS Online; provided only for geographical reference):

  • Canada
  • United States

Duration: 3 days

Time span: February 02 2020 to February 04 2020

Statistics over entire affected area:

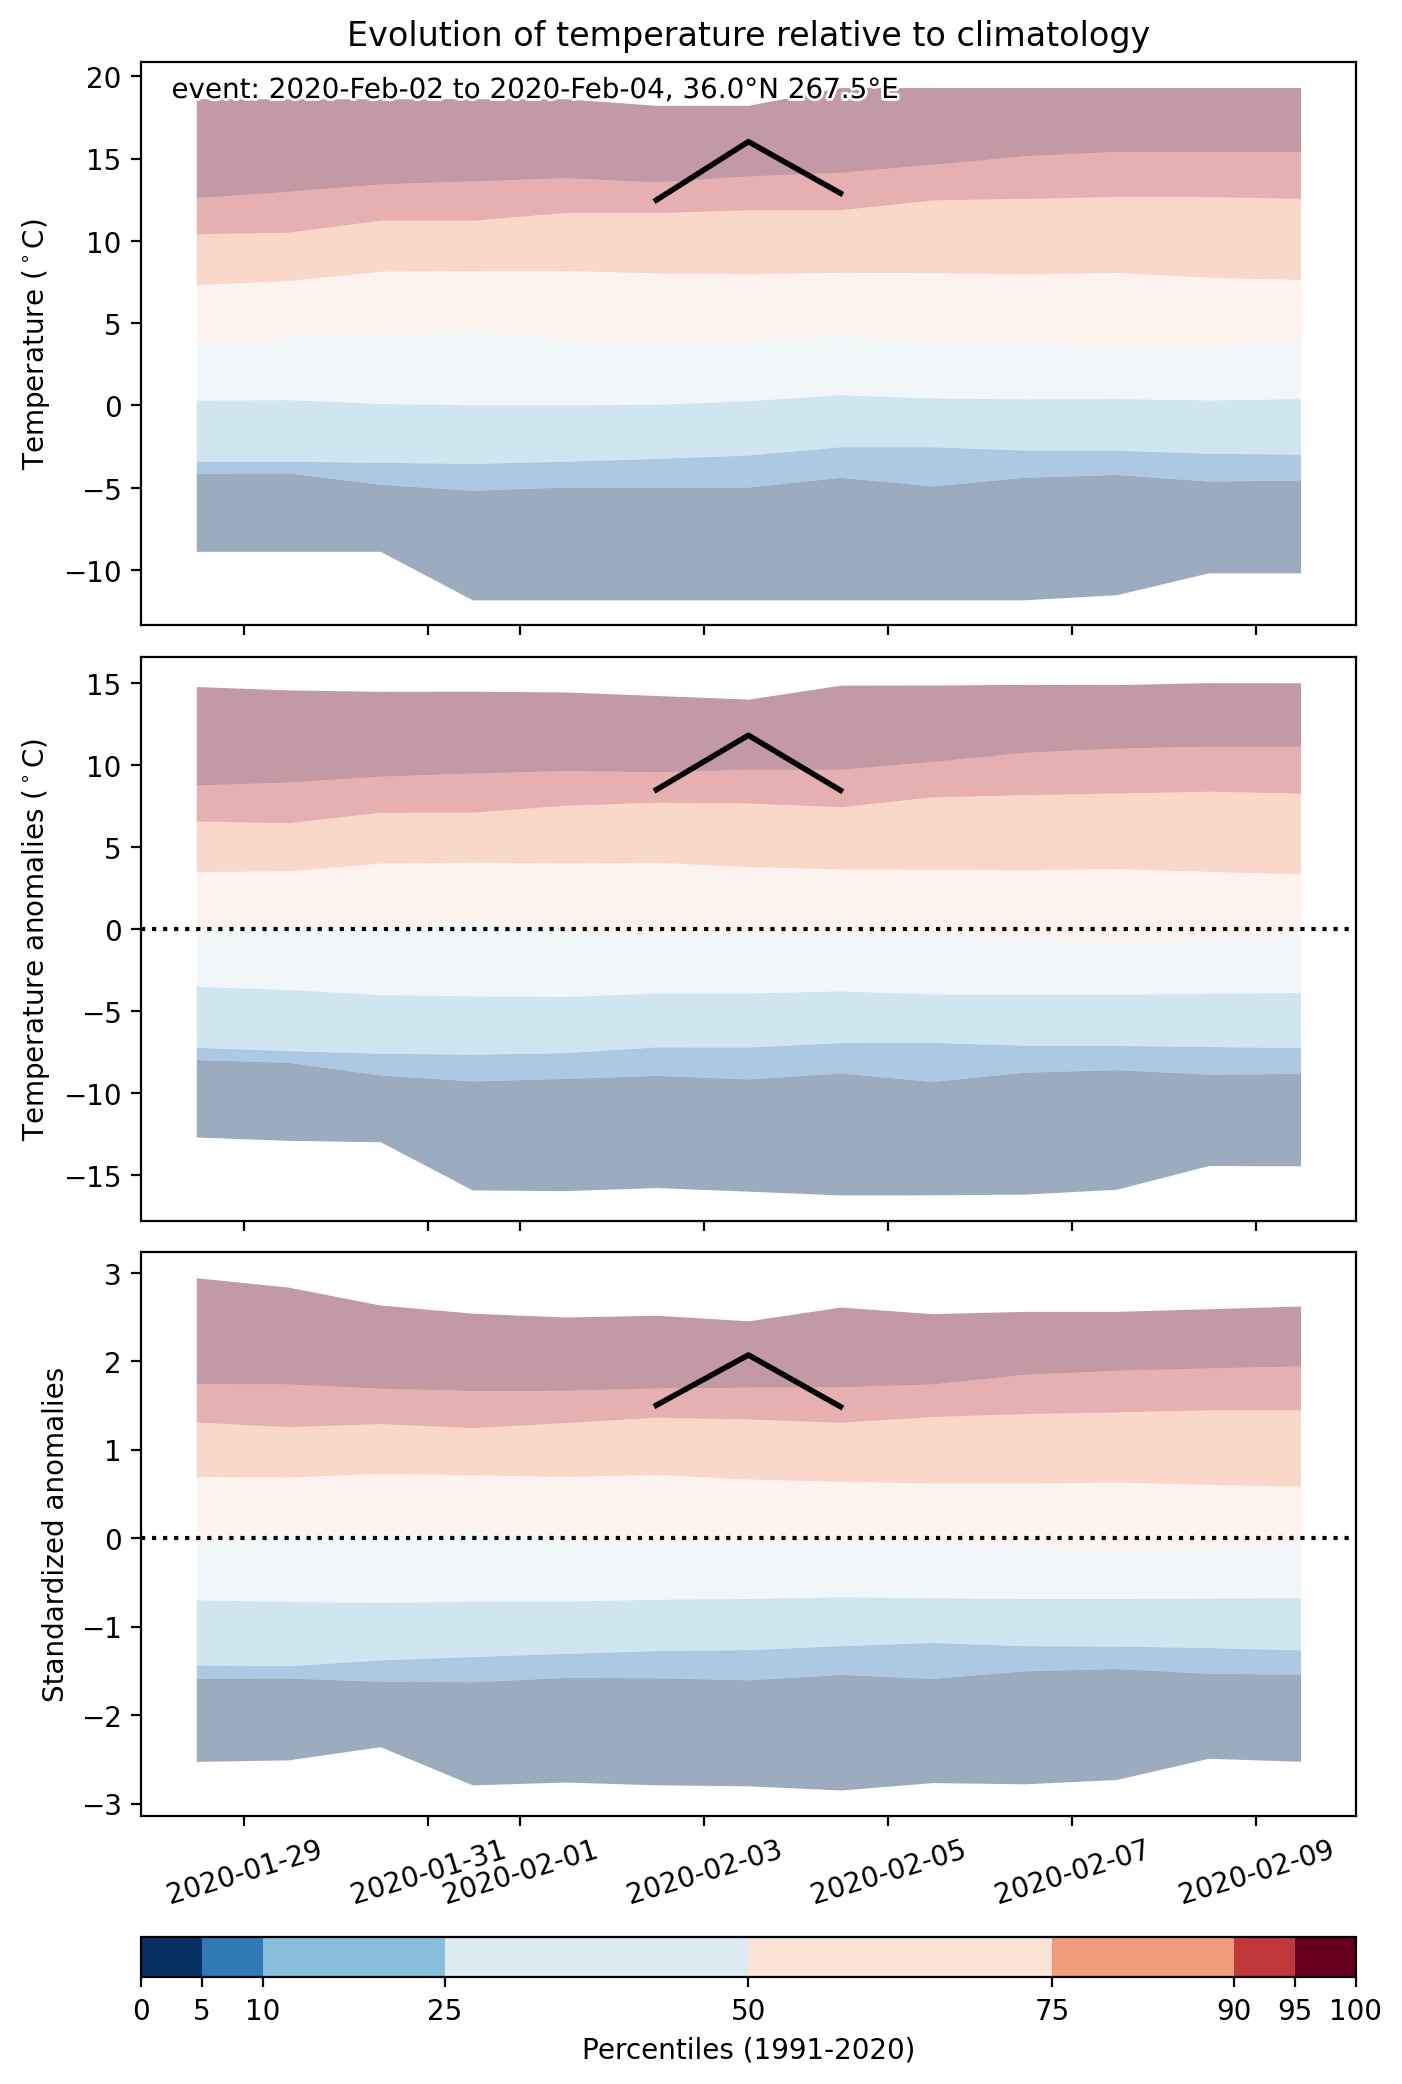
  • Mean temperature anomaly: 9.1 °C
  • Mean temperature: 8.1 °C
  • Maximum temperature anomaly: 12.2 °C
  • Maximum temperature: 16.0 °C

Event center: 36.0°N 267.5°E

Area affected: 166233 km$^2$


Fig. 1: Map of most extreme temperature anomalies (standardized) experienced during the event. The purple star indicates the center of the extreme event. Green hatching illustrates all areas under the effect of extremes at some time during the event.


Fig. 2: Evolution of temperature at the center of the event. The climatological percentile distribution is illustrated with color shadings.


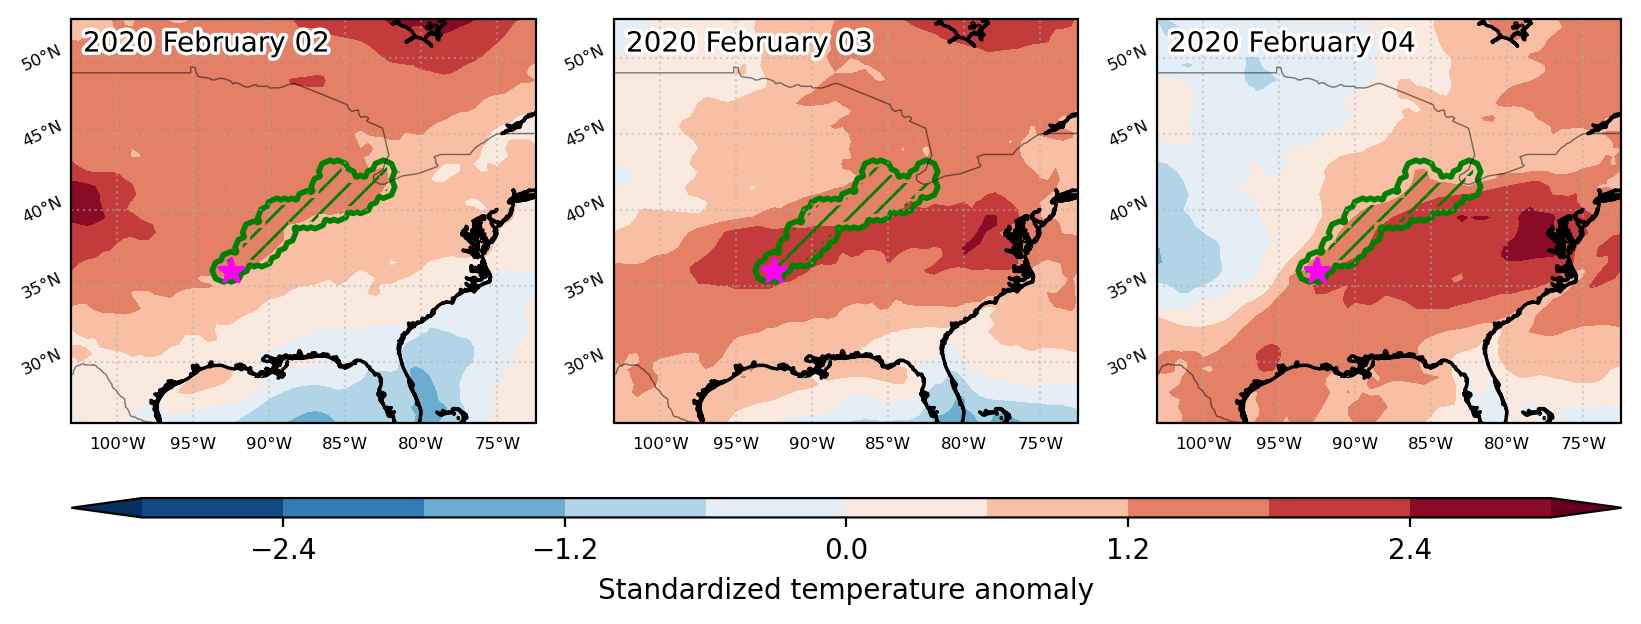
Fig. 3: Maps illustrating the evolution of standardized temperature anomalies during the event.

Event ID: Heat_wave_2020-Feb-02_to_2020-Feb-04_267.5_36.0

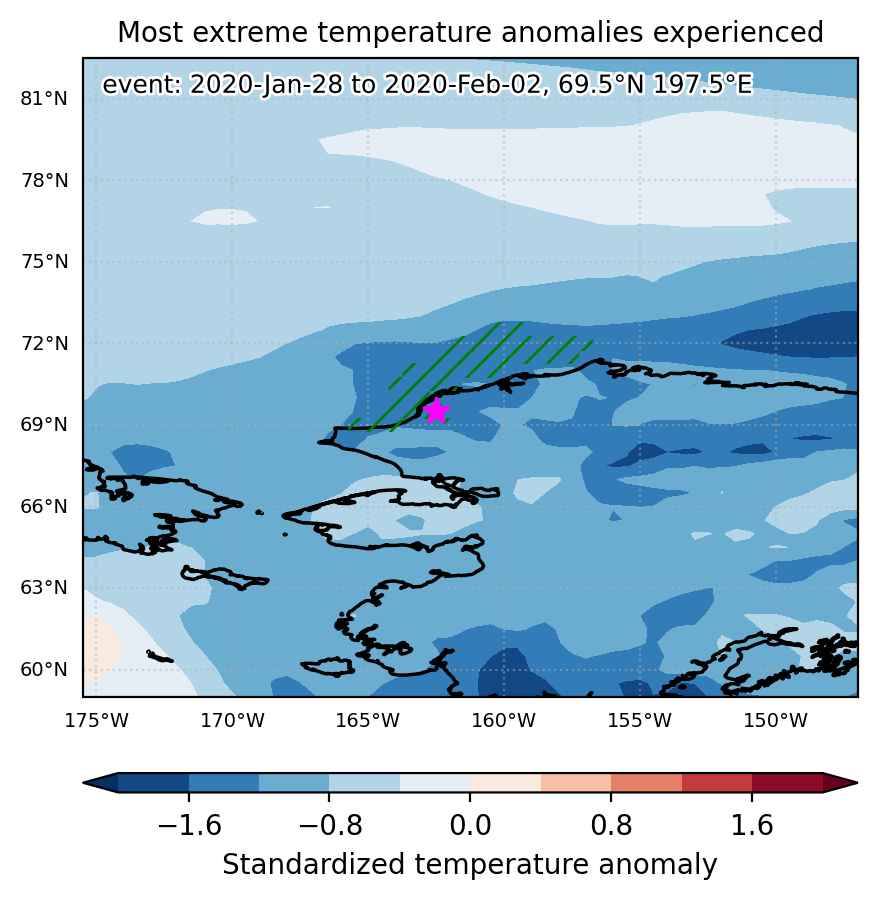
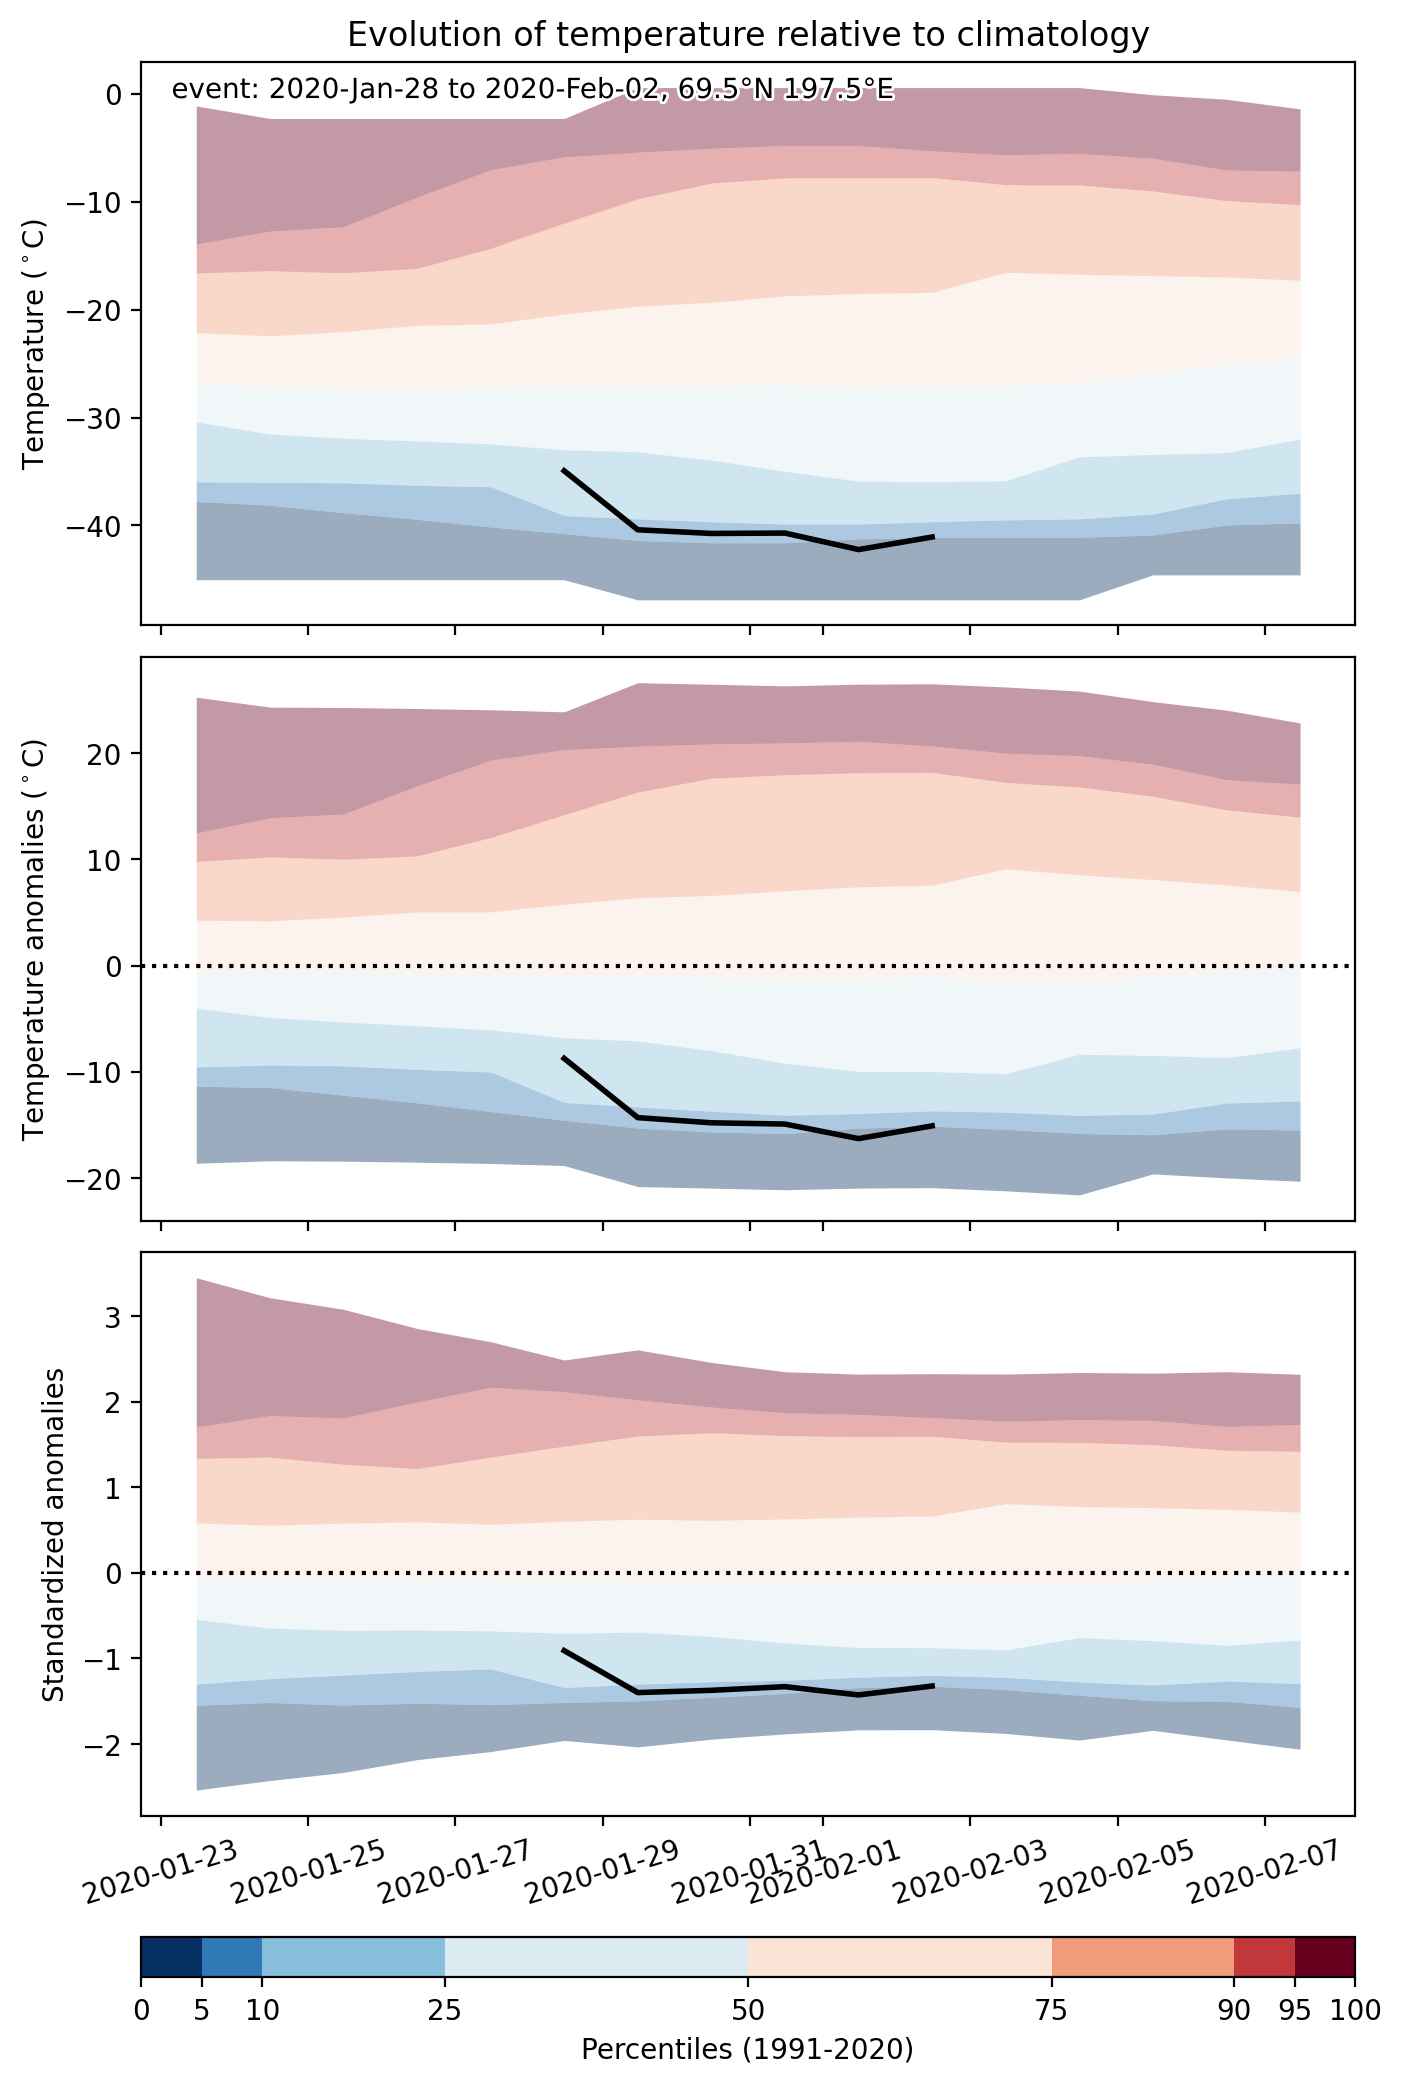
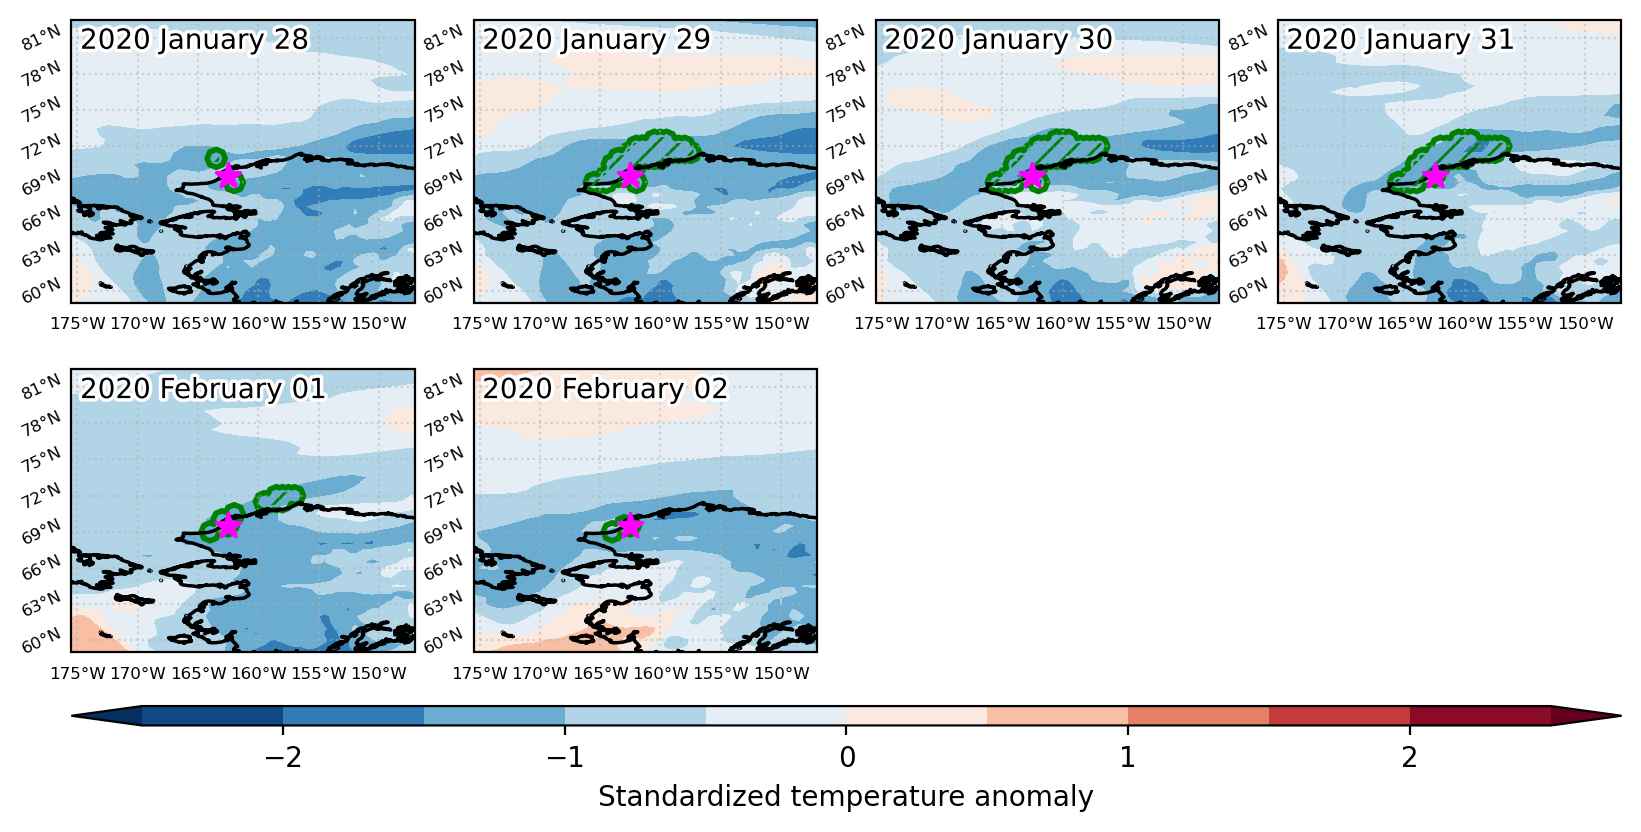
Cold spell occuring from January 28 2020 to February 02 2020 at 69.5°N 197.5°E

Download data: JSON

Event type: Cold spell

Countries affected (identified with ArcGIS Online; provided only for geographical reference):

  • United States

Duration: 6 days

Time span: January 28 2020 to February 02 2020

Statistics over entire affected area:

  • Mean temperature anomaly: -9.9 °C
  • Mean temperature: -32.4 °C
  • Minimum temperature anomaly: -16.3 °C
  • Minimum temperature: -42.2 °C

Event center: 69.5°N 197.5°E

Area affected: 51417 km$^2$


Fig. 1: Map of most extreme temperature anomalies (standardized) experienced during the event. The purple star indicates the center of the extreme event. Green hatching illustrates all areas under the effect of extremes at some time during the event.


Fig. 2: Evolution of temperature at the center of the event. The climatological percentile distribution is illustrated with color shadings.


Fig. 3: Maps illustrating the evolution of standardized temperature anomalies during the event.

Event ID: Cold_spell_2020-Jan-28_to_2020-Feb-02_197.5_69.5

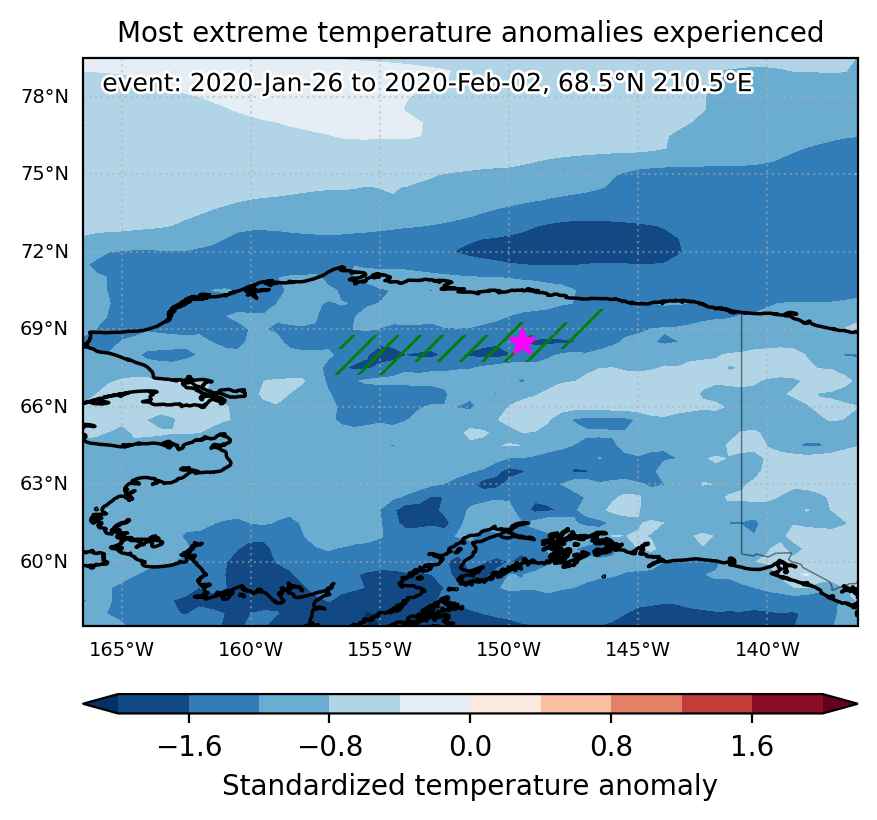
Cold spell occuring from January 26 2020 to February 02 2020 at 68.5°N 210.5°E

Download data: JSON

Event type: Cold spell

Countries affected (identified with ArcGIS Online; provided only for geographical reference):

  • United States

Duration: 8 days

Time span: January 26 2020 to February 02 2020

Statistics over entire affected area:

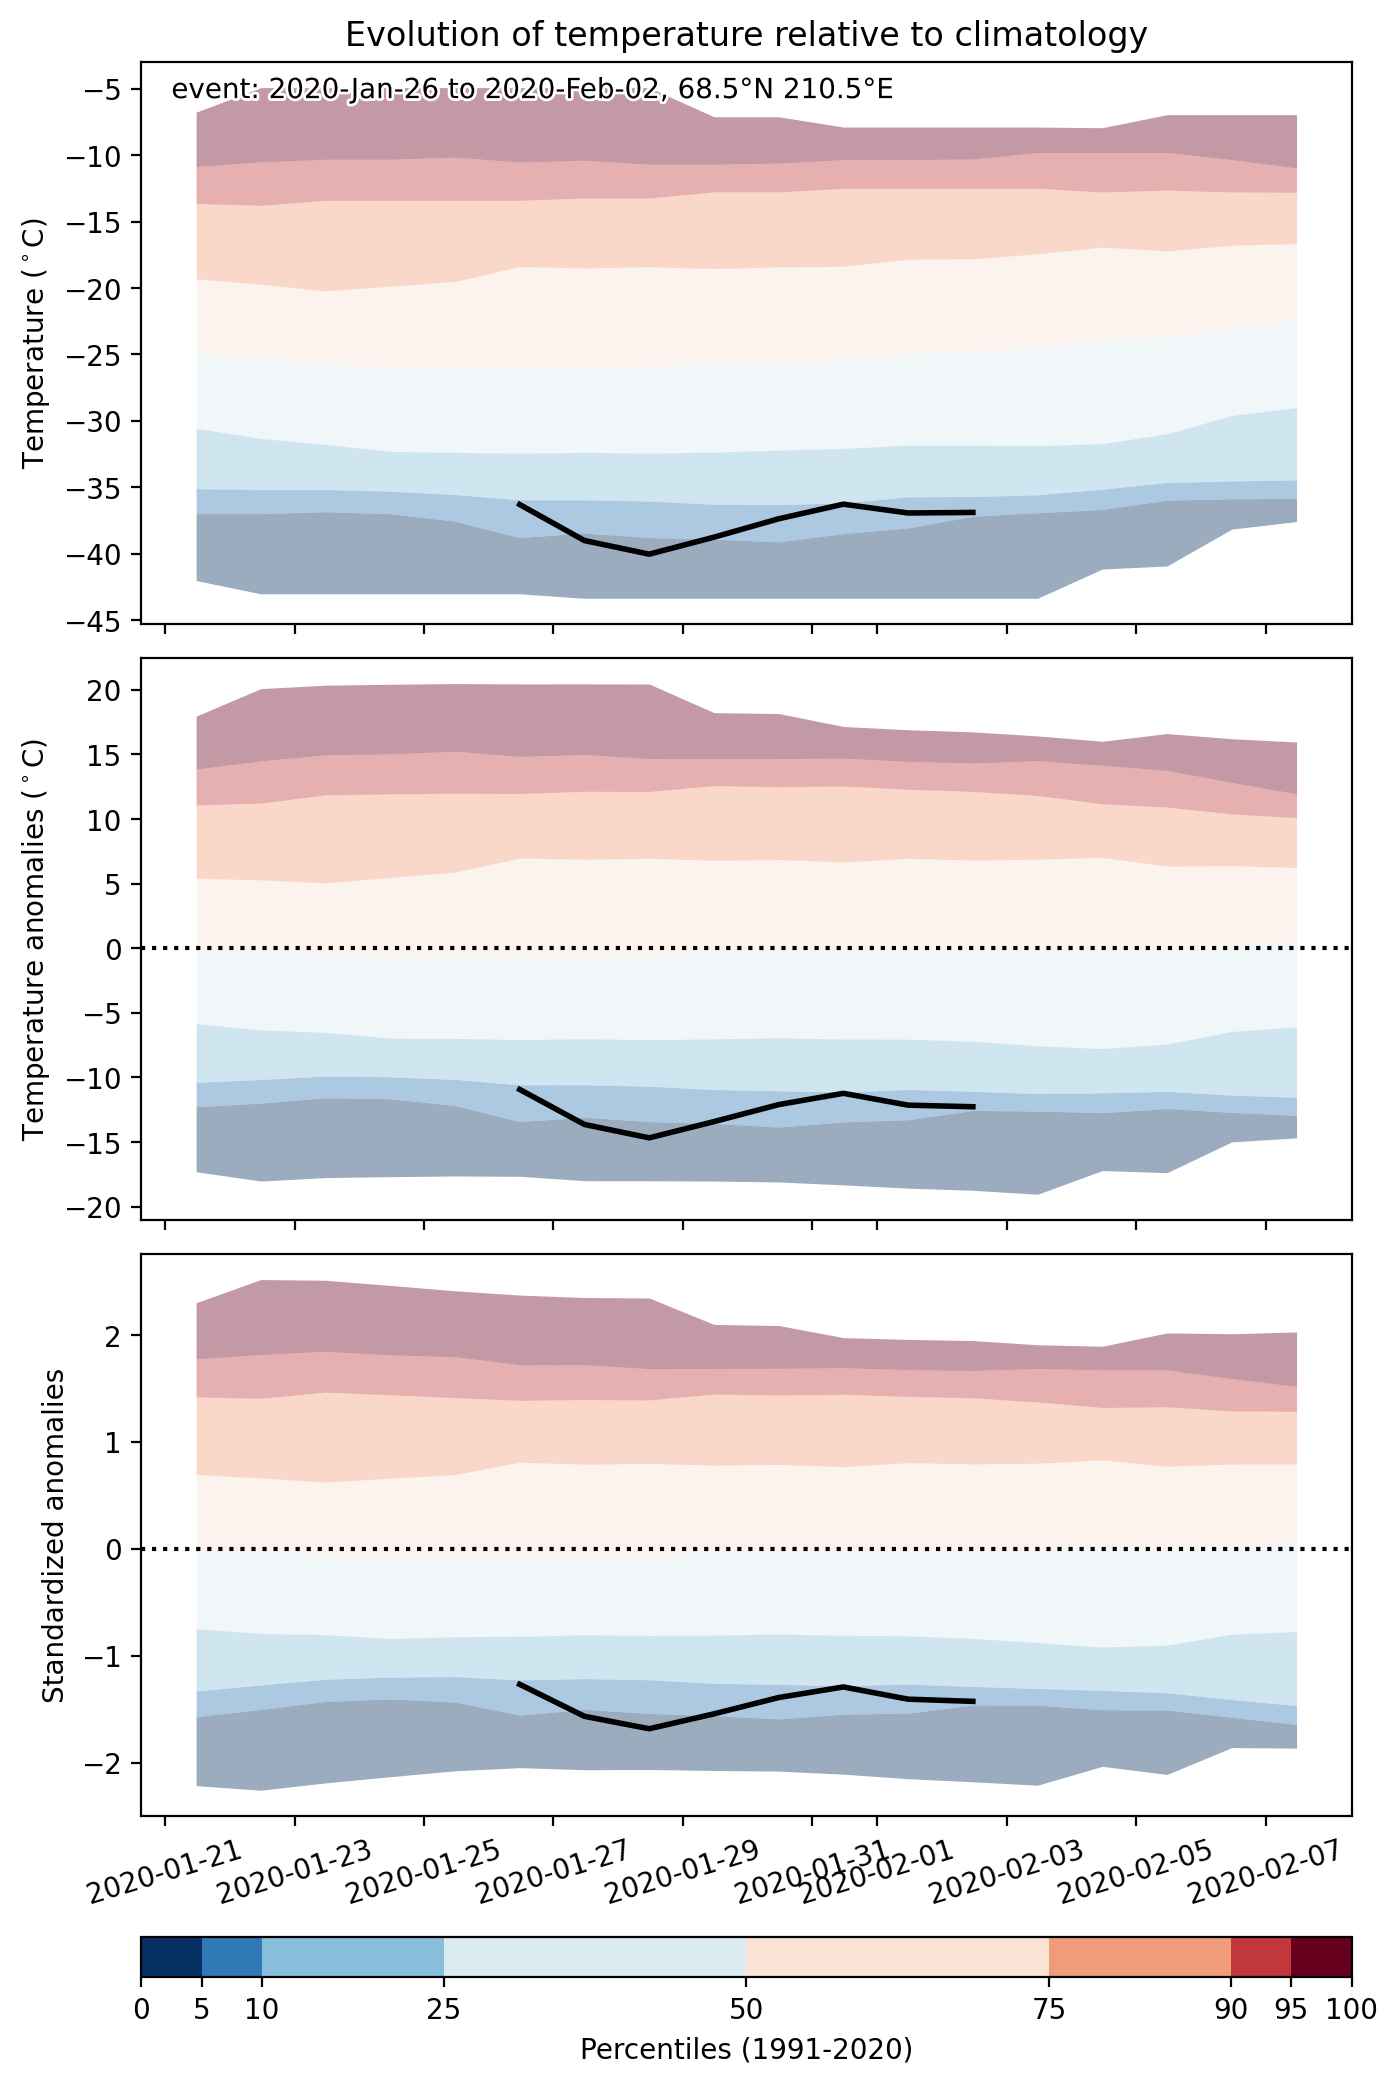
  • Mean temperature anomaly: -13.8 °C
  • Mean temperature: -39.2 °C
  • Minimum temperature anomaly: -18.2 °C
  • Minimum temperature: -44.0 °C

Event center: 68.5°N 210.5°E

Area affected: 52512 km$^2$


Fig. 1: Map of most extreme temperature anomalies (standardized) experienced during the event. The purple star indicates the center of the extreme event. Green hatching illustrates all areas under the effect of extremes at some time during the event.


Fig. 2: Evolution of temperature at the center of the event. The climatological percentile distribution is illustrated with color shadings.


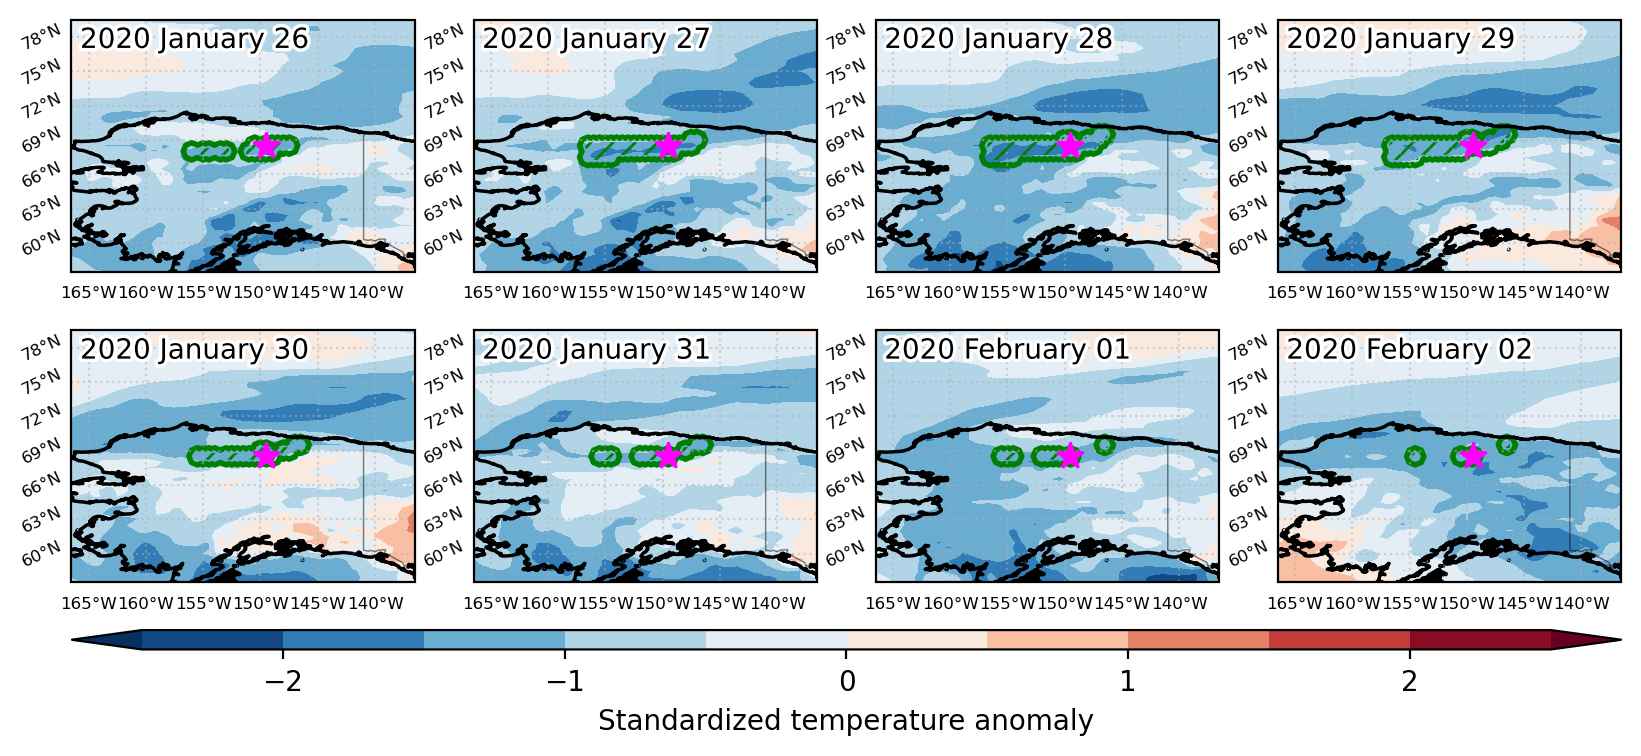
Fig. 3: Maps illustrating the evolution of standardized temperature anomalies during the event.

Event ID: Cold_spell_2020-Jan-26_to_2020-Feb-02_210.5_68.5

Cold spell occuring from January 24 2020 to February 01 2020 at 53.5°N 203.5°E

Download data: JSON

Event type: Cold spell

Countries affected (identified with ArcGIS Online; provided only for geographical reference):

  • United States

Duration: 9 days

Time span: January 24 2020 to February 01 2020

Statistics over entire affected area:

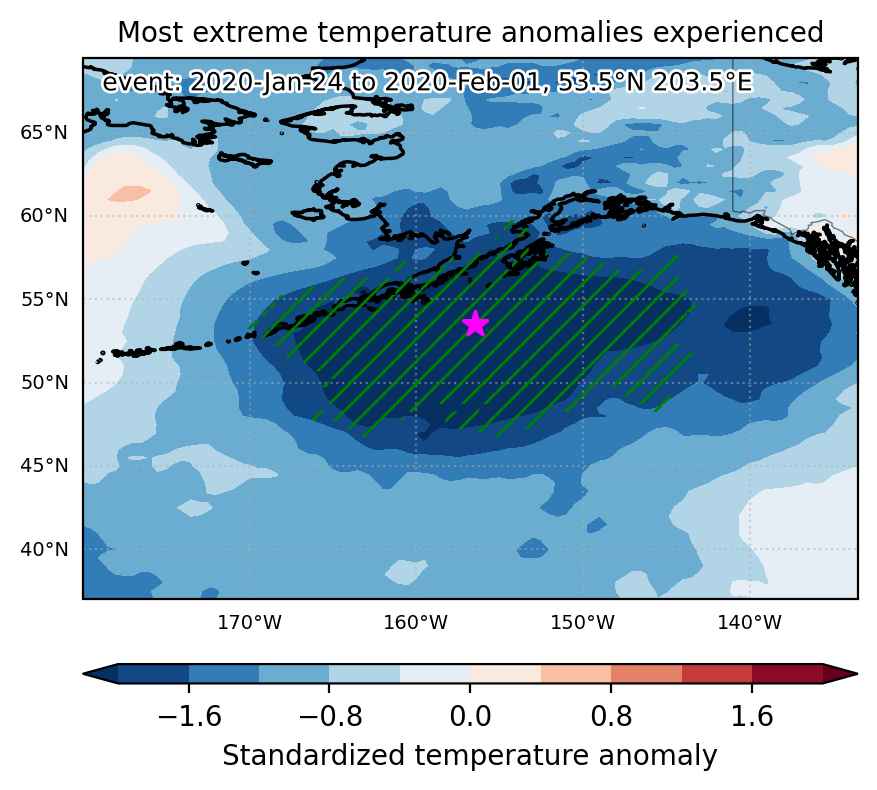
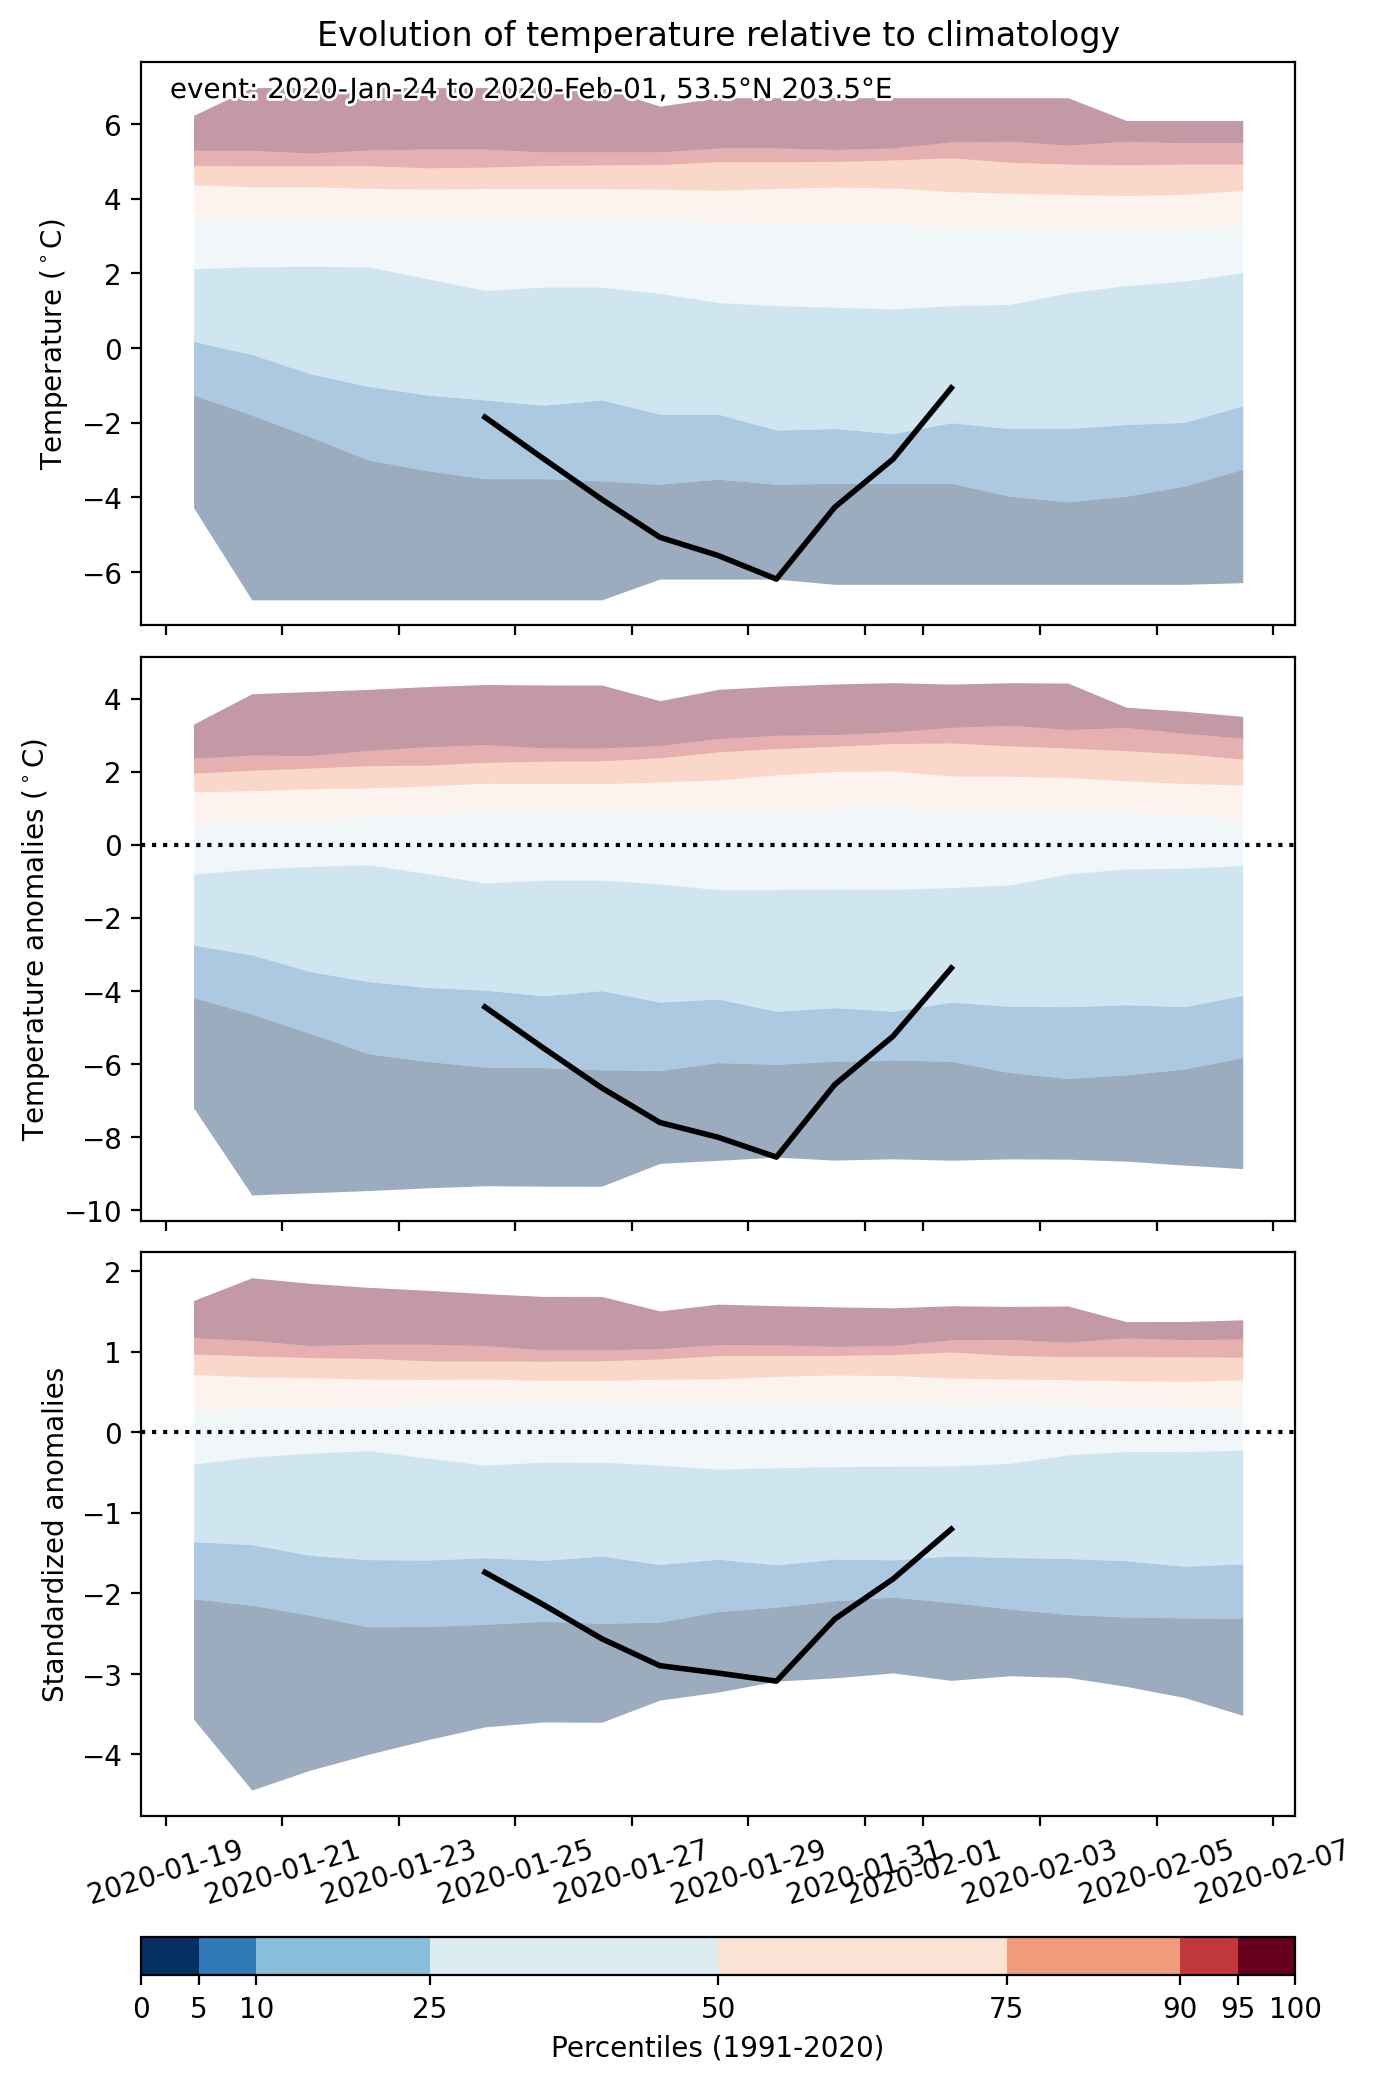
  • Mean temperature anomaly: -5.5 °C
  • Mean temperature: -2.9 °C
  • Minimum temperature anomaly: -20.8 °C
  • Minimum temperature: -28.2 °C

Event center: 53.5°N 203.5°E

Area affected: 1594103 km$^2$


Fig. 1: Map of most extreme temperature anomalies (standardized) experienced during the event. The purple star indicates the center of the extreme event. Green hatching illustrates all areas under the effect of extremes at some time during the event.


Fig. 2: Evolution of temperature at the center of the event. The climatological percentile distribution is illustrated with color shadings.


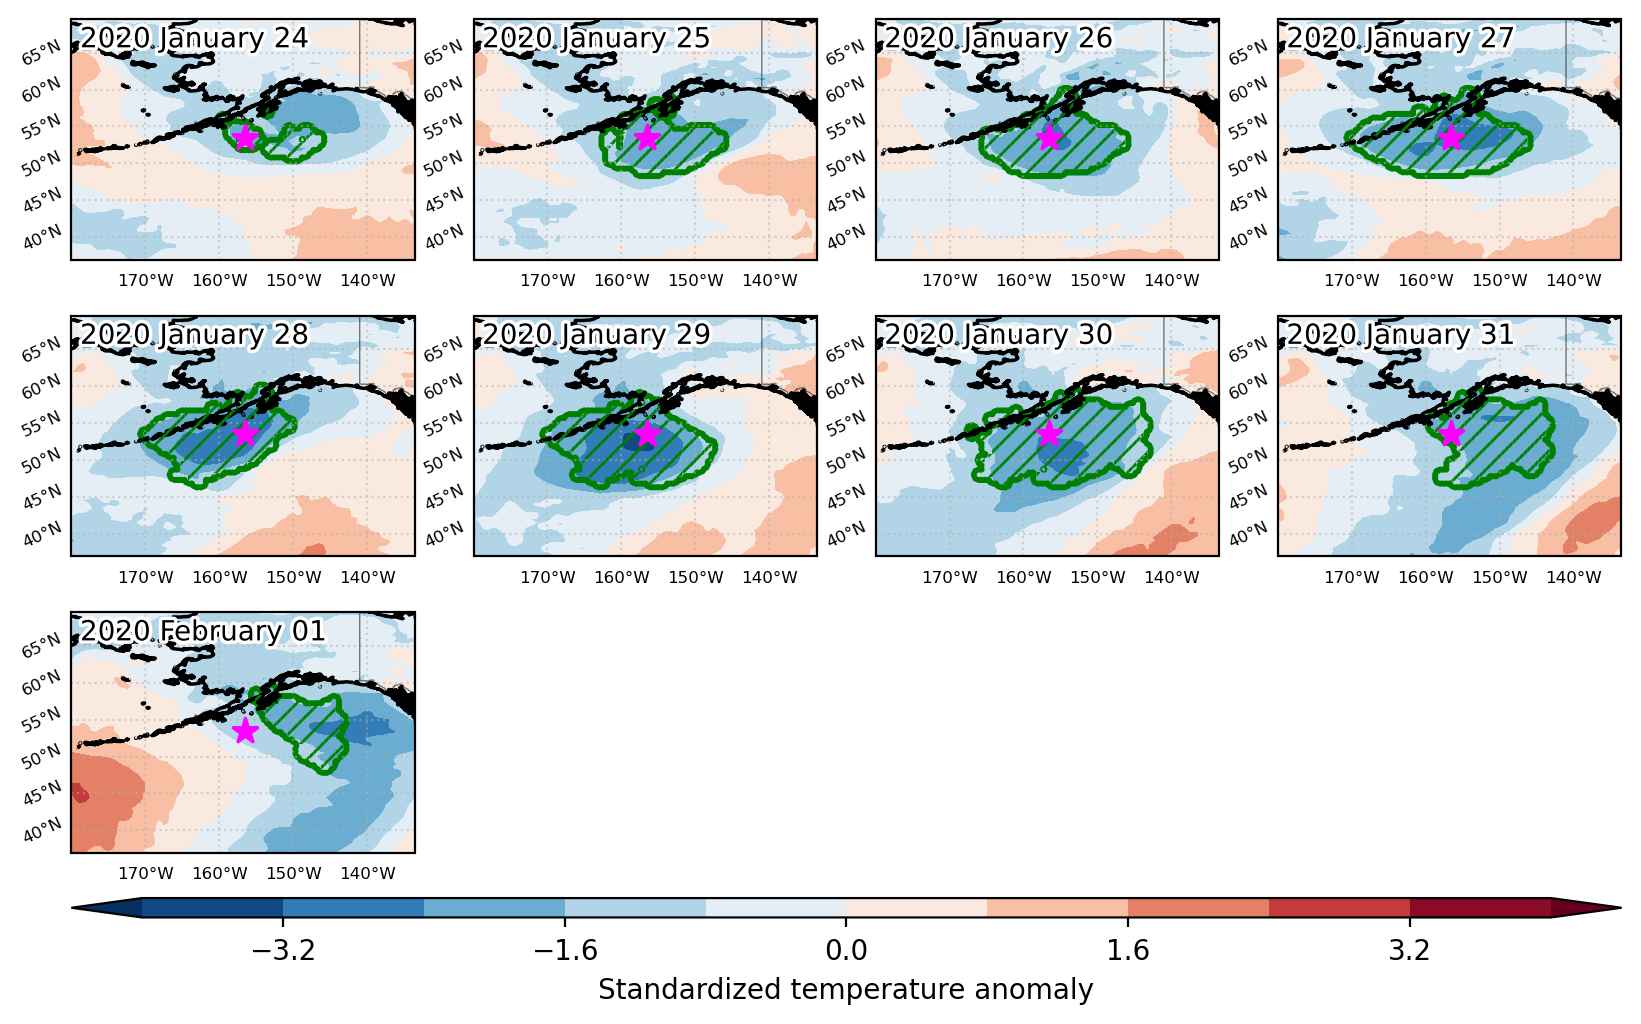
Fig. 3: Maps illustrating the evolution of standardized temperature anomalies during the event.

Event ID: Cold_spell_2020-Jan-24_to_2020-Feb-01_203.5_53.5

Heat wave occuring from January 24 2020 to January 27 2020 at 43.5°N 249.5°E

Download data: JSON

Event type: Heat wave

Countries affected (identified with ArcGIS Online; provided only for geographical reference):

  • United States

Duration: 4 days

Time span: January 24 2020 to January 27 2020

Statistics over entire affected area:

  • Mean temperature anomaly: 5.9 °C
  • Mean temperature: -1.8 °C
  • Maximum temperature anomaly: 7.8 °C
  • Maximum temperature: 2.2 °C

Event center: 43.5°N 249.5°E

Area affected: 64736 km$^2$


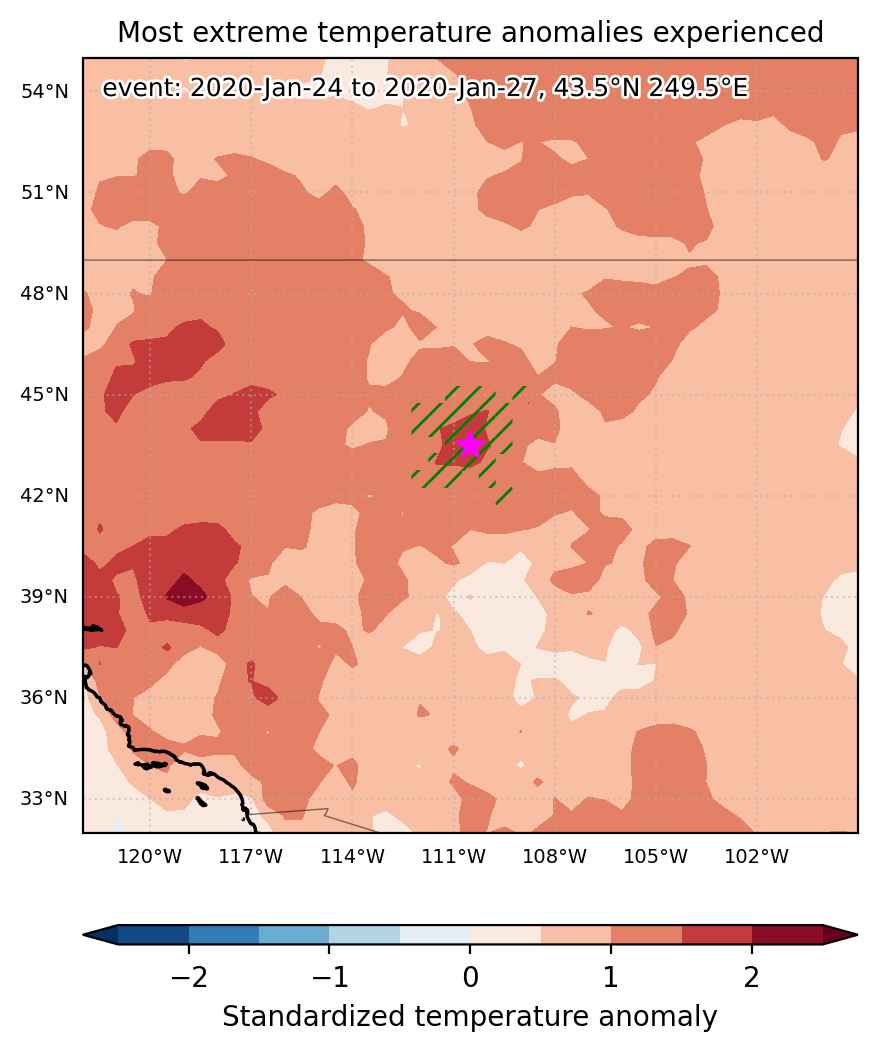
Fig. 1: Map of most extreme temperature anomalies (standardized) experienced during the event. The purple star indicates the center of the extreme event. Green hatching illustrates all areas under the effect of extremes at some time during the event.


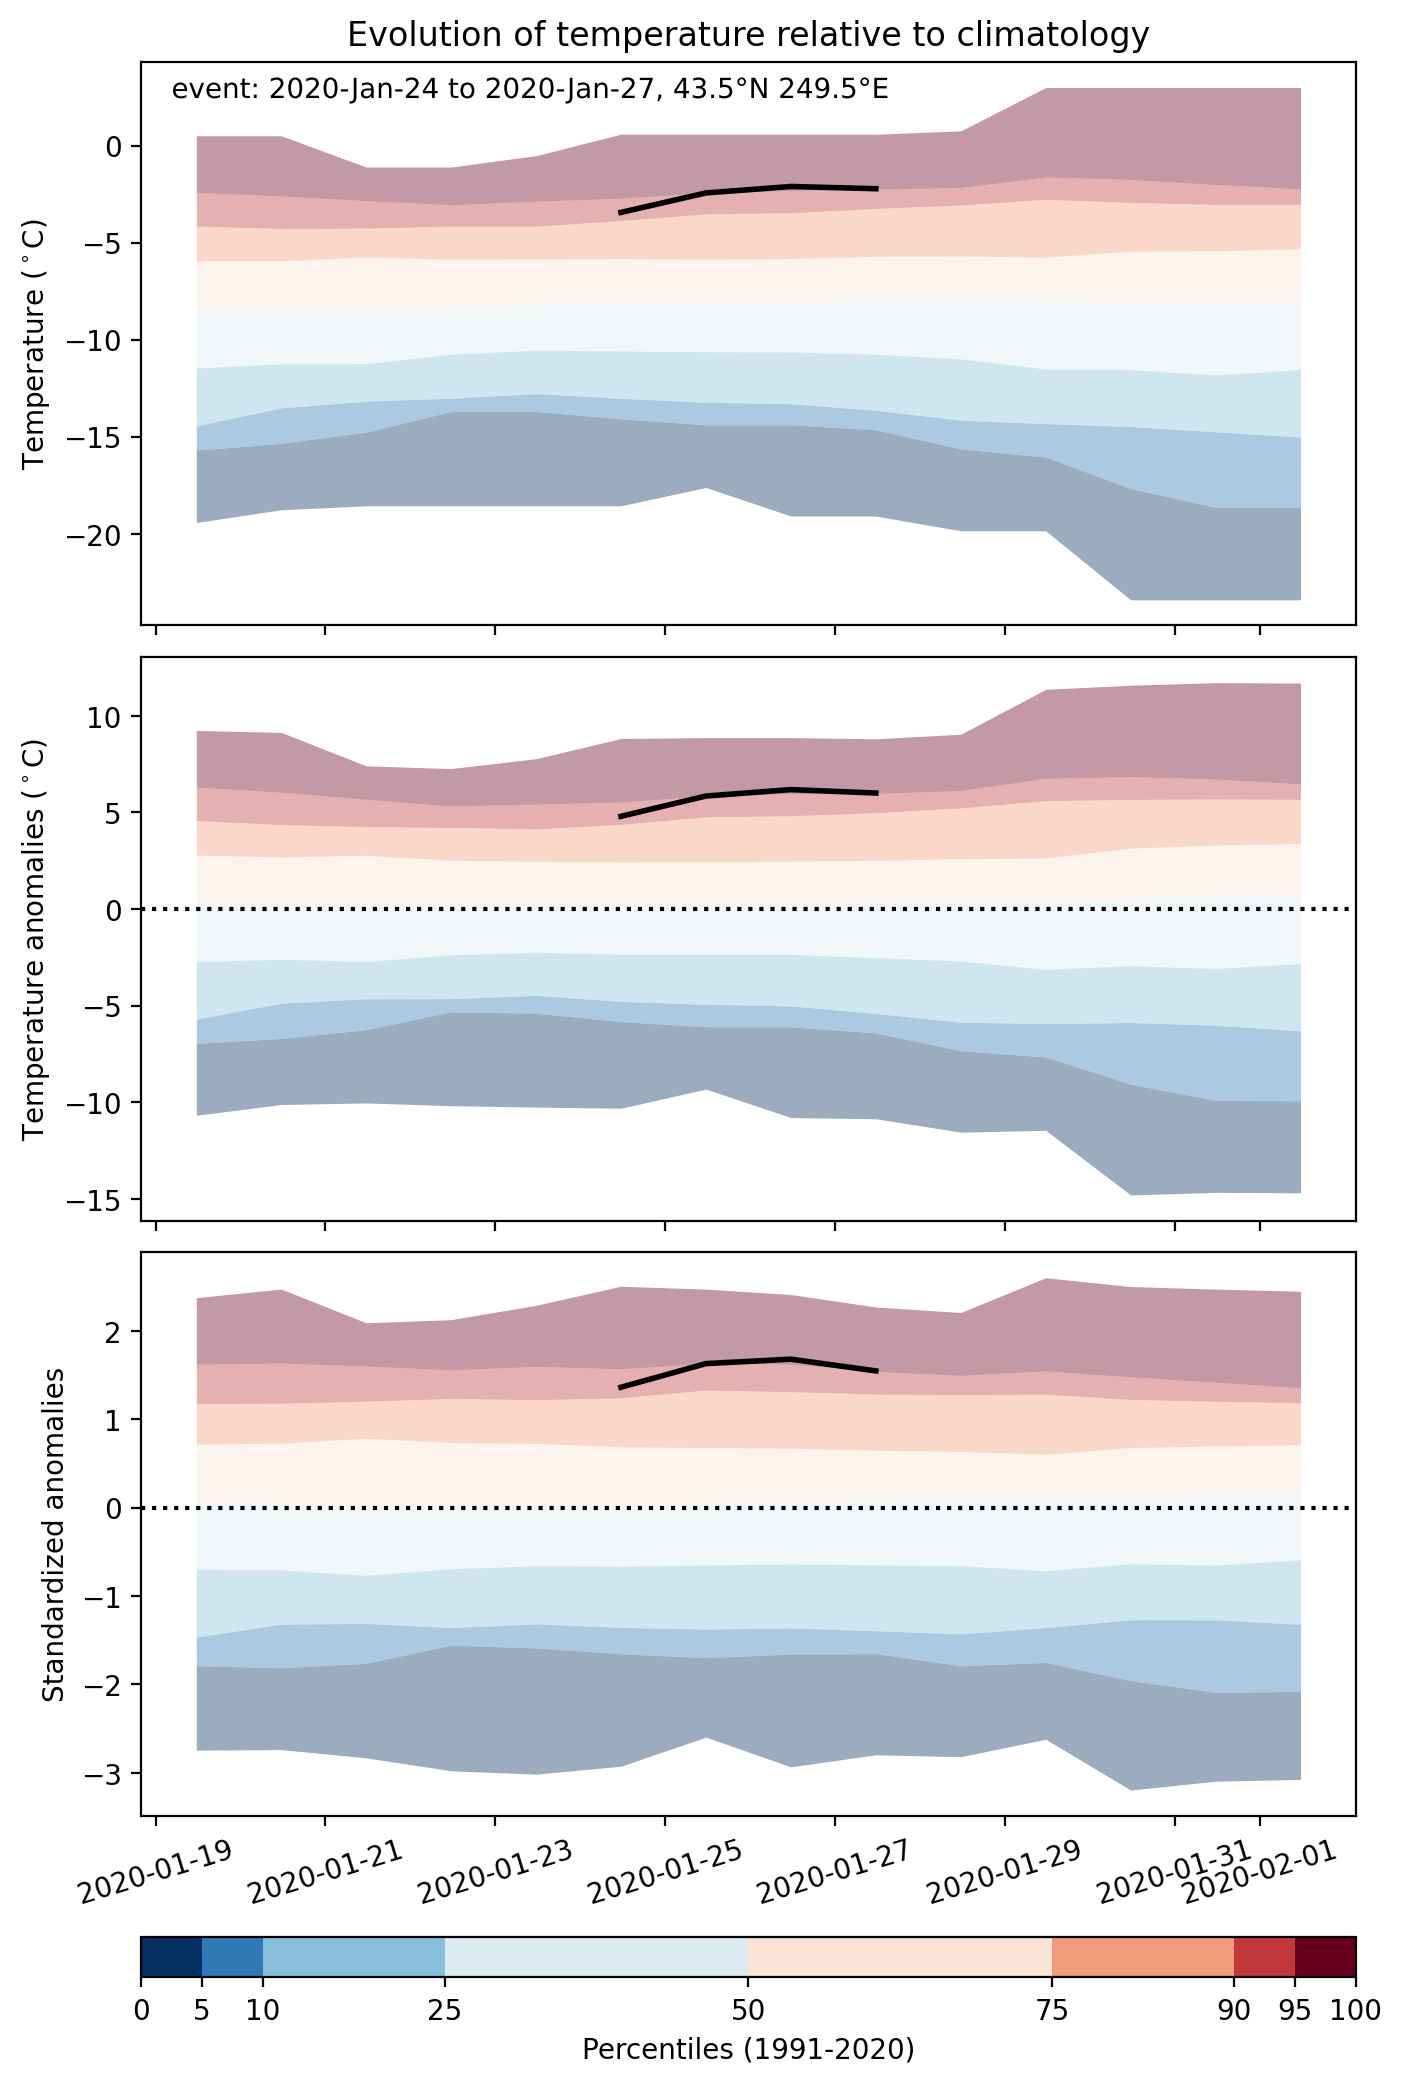
Fig. 2: Evolution of temperature at the center of the event. The climatological percentile distribution is illustrated with color shadings.


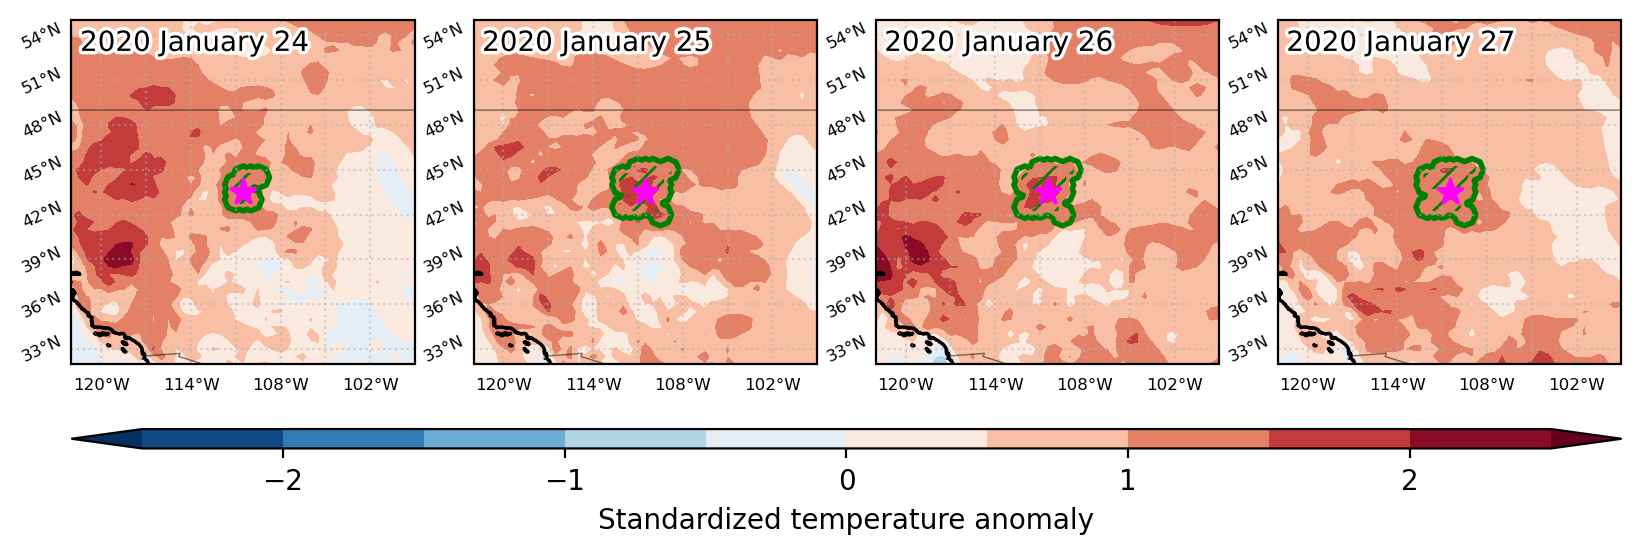
Fig. 3: Maps illustrating the evolution of standardized temperature anomalies during the event.

Event ID: Heat_wave_2020-Jan-24_to_2020-Jan-27_249.5_43.5

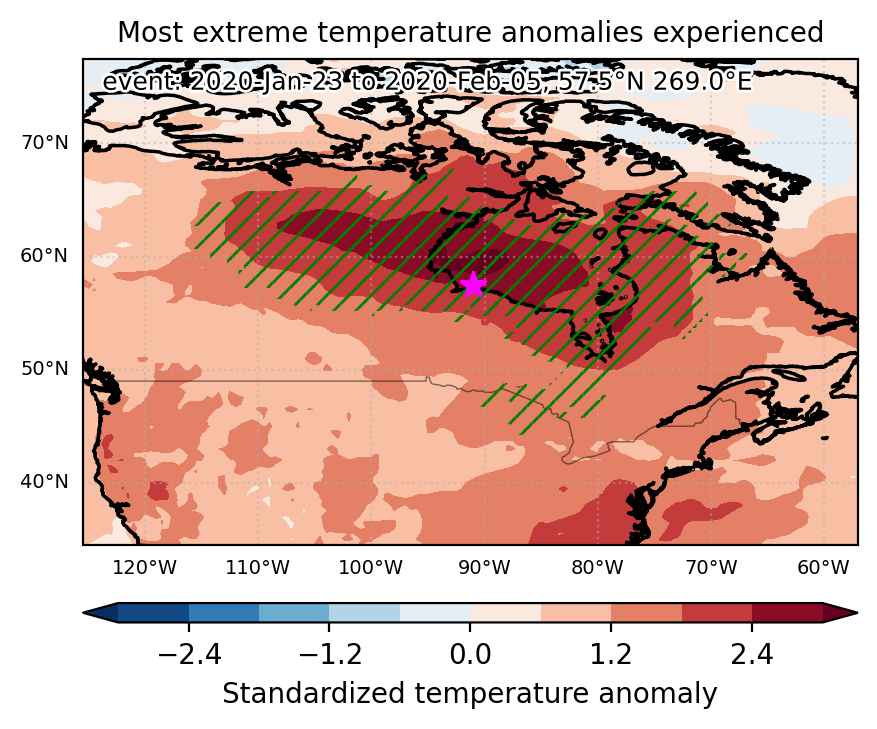
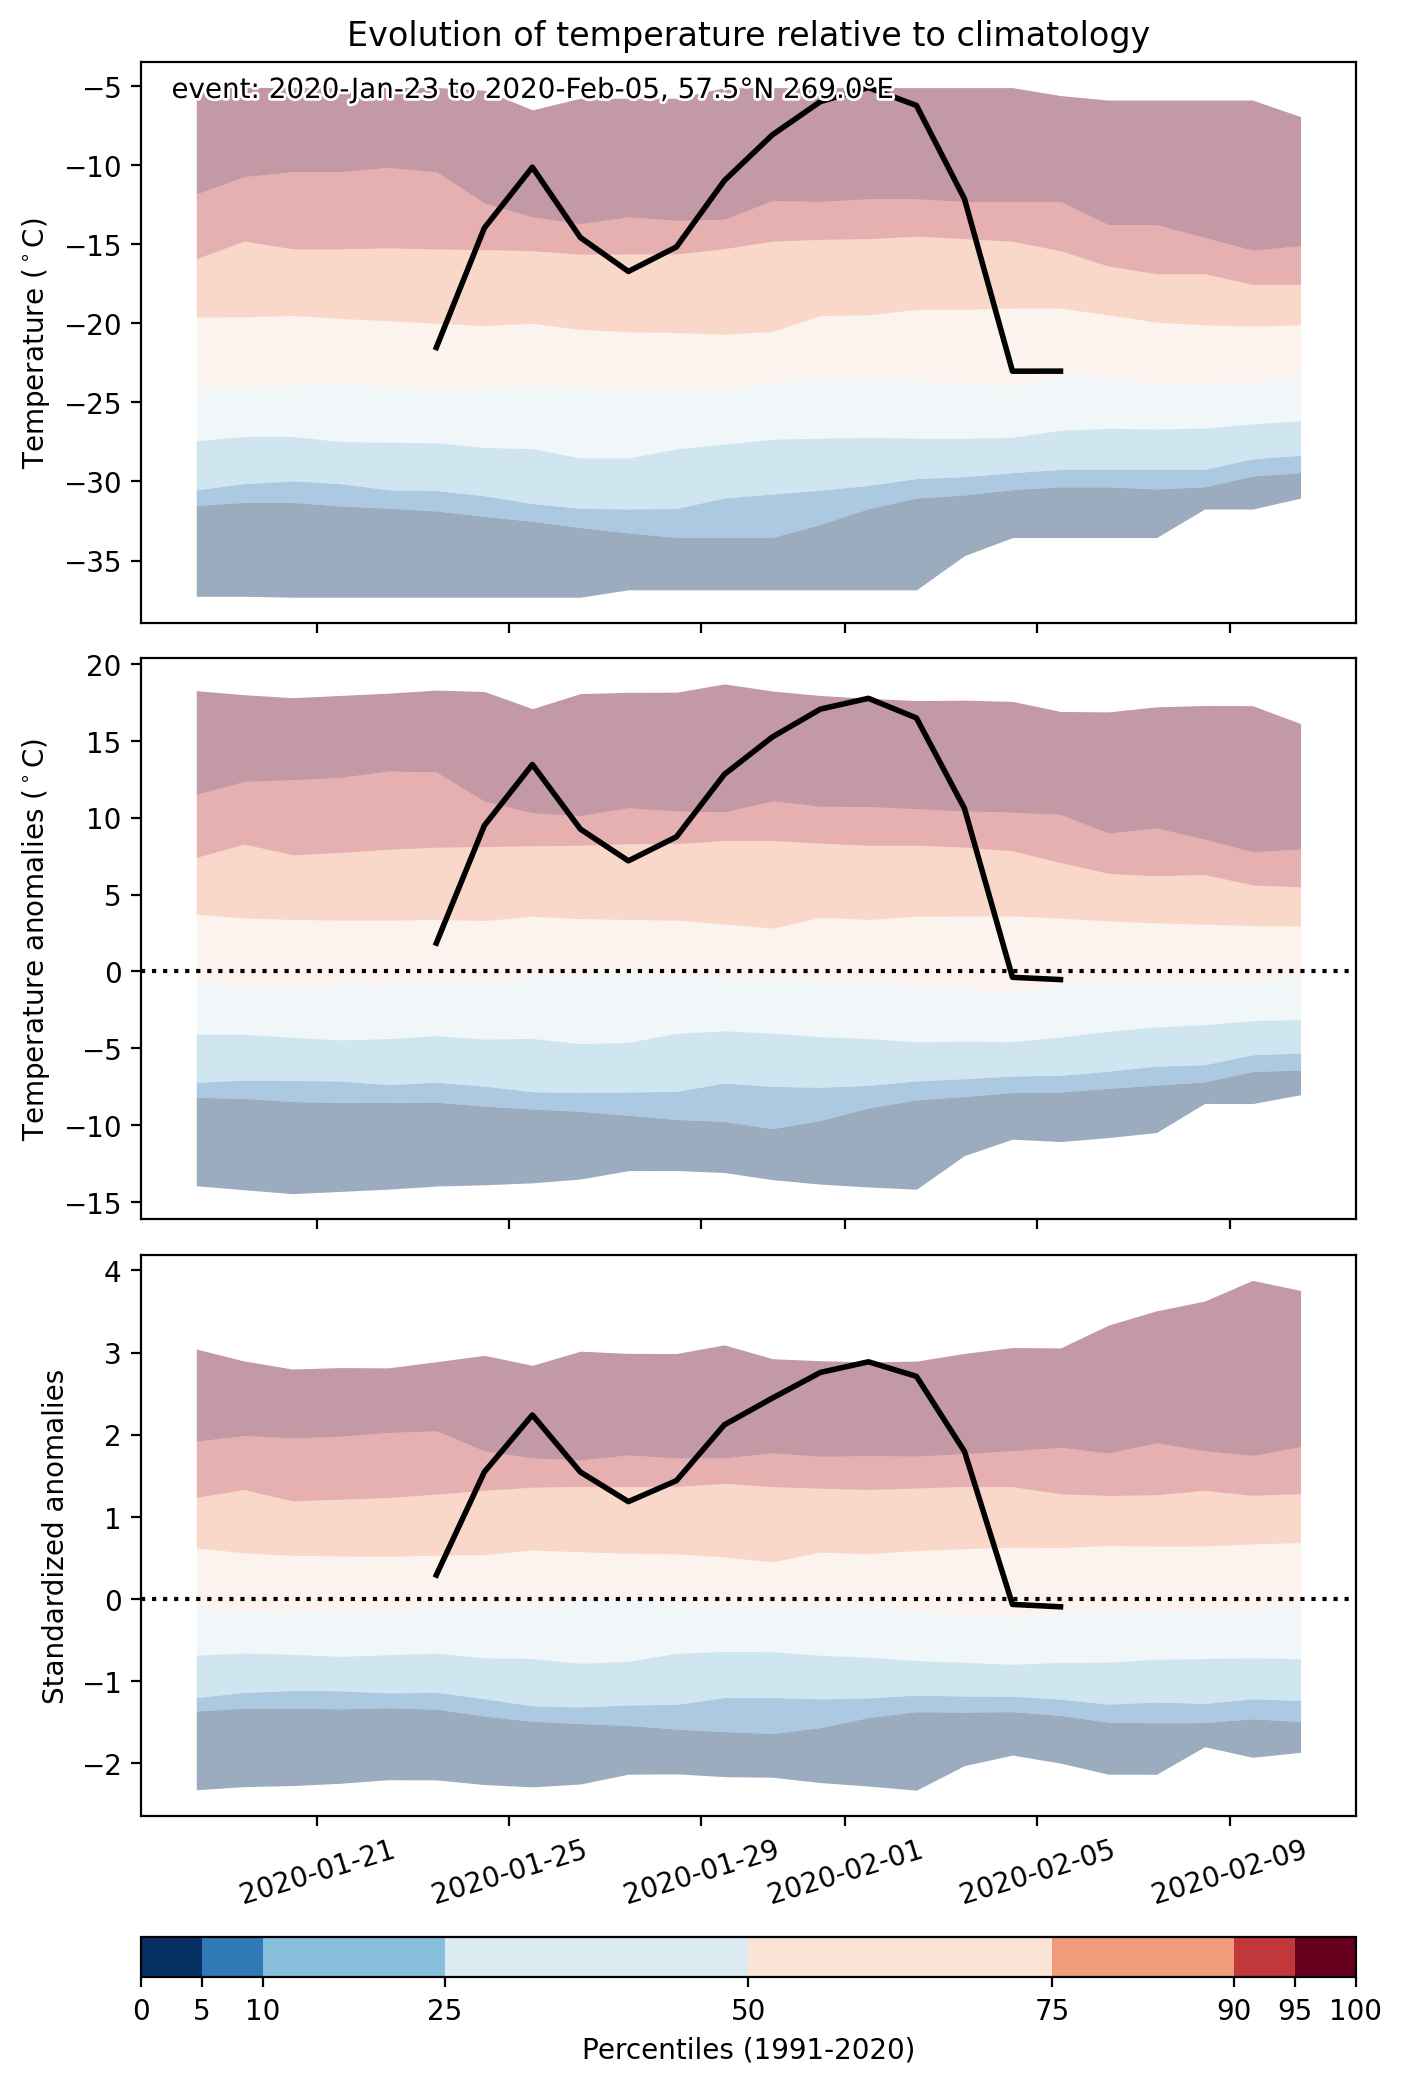
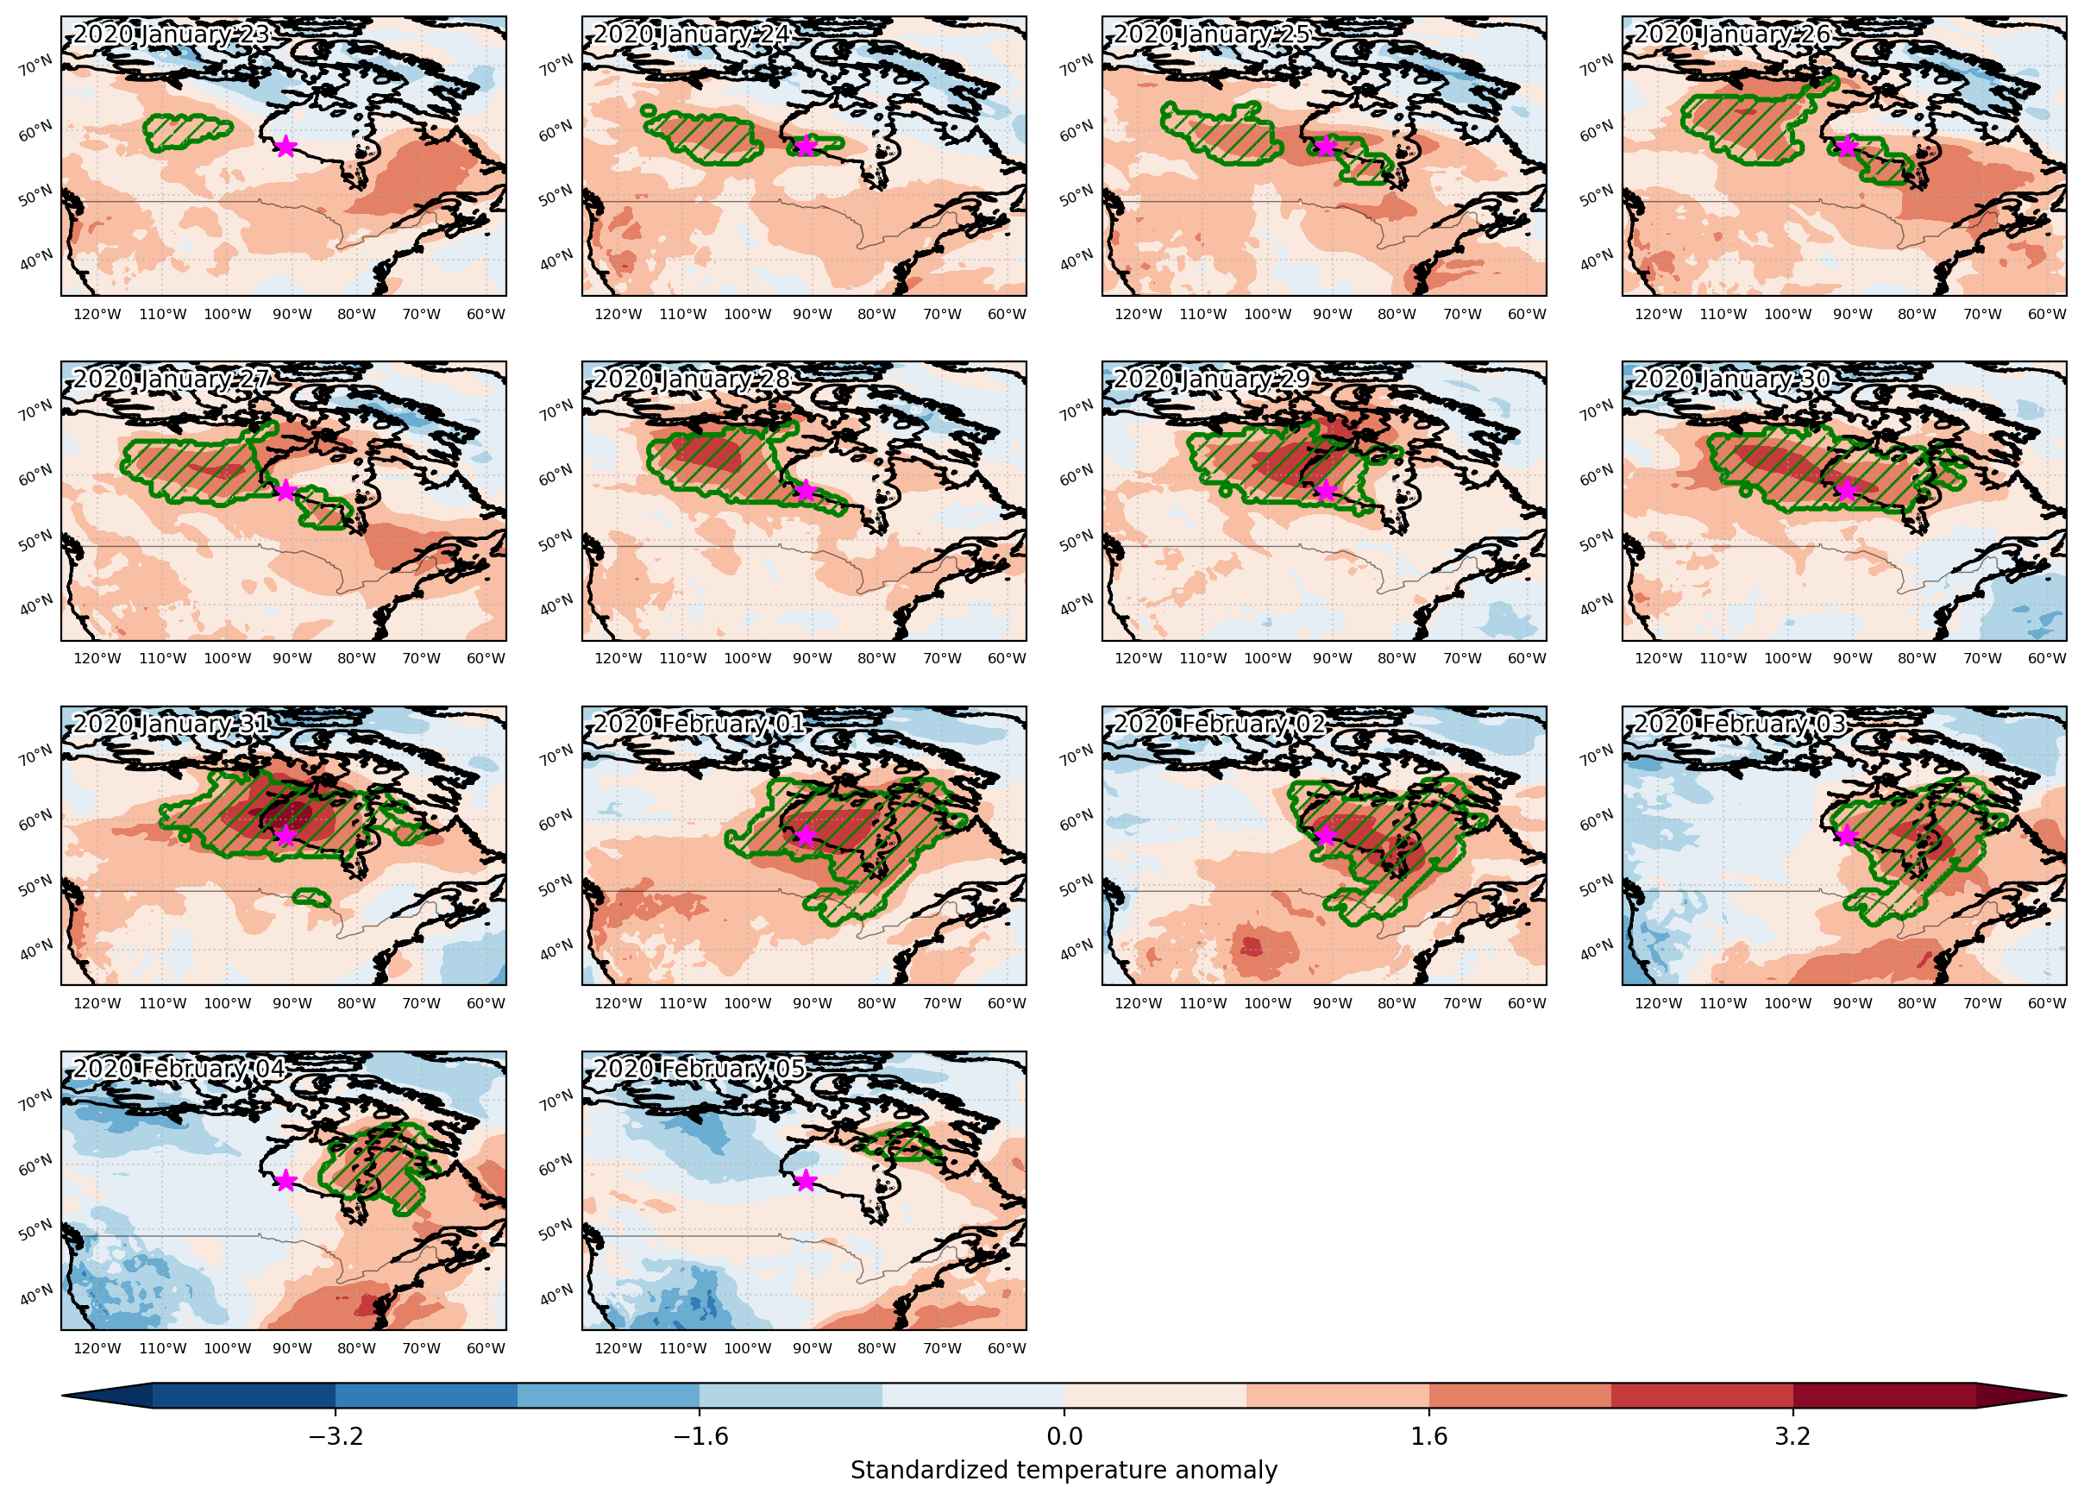
Heat wave occuring from January 23 2020 to February 05 2020 at 57.5°N 269.0°E

Download data: JSON

Event type: Heat wave

Countries affected (identified with ArcGIS Online; provided only for geographical reference):

  • Canada
  • United States

Duration: 14 days

Time span: January 23 2020 to February 05 2020

Statistics over entire affected area:

  • Mean temperature anomaly: 13.6 °C
  • Mean temperature: -11.0 °C
  • Maximum temperature anomaly: 23.5 °C
  • Maximum temperature: 3.3 °C

Event center: 57.5°N 269.0°E

Area affected: 3295699 km$^2$


Fig. 1: Map of most extreme temperature anomalies (standardized) experienced during the event. The purple star indicates the center of the extreme event. Green hatching illustrates all areas under the effect of extremes at some time during the event.


Fig. 2: Evolution of temperature at the center of the event. The climatological percentile distribution is illustrated with color shadings.


Fig. 3: Maps illustrating the evolution of standardized temperature anomalies during the event.

Event ID: Heat_wave_2020-Jan-23_to_2020-Feb-05_269.0_57.5

Heat wave occuring from January 23 2020 to January 28 2020 at 41.5°N 237.5°E

Download data: JSON

Event type: Heat wave

Countries affected (identified with ArcGIS Online; provided only for geographical reference):

  • United States

Duration: 6 days

Time span: January 23 2020 to January 28 2020

Statistics over entire affected area:

  • Mean temperature anomaly: 4.7 °C
  • Mean temperature: 8.1 °C
  • Maximum temperature anomaly: 6.2 °C
  • Maximum temperature: 11.5 °C

Event center: 41.5°N 237.5°E

Area affected: 60792 km$^2$


Fig. 1: Map of most extreme temperature anomalies (standardized) experienced during the event. The purple star indicates the center of the extreme event. Green hatching illustrates all areas under the effect of extremes at some time during the event.


Fig. 2: Evolution of temperature at the center of the event. The climatological percentile distribution is illustrated with color shadings.


Fig. 3: Maps illustrating the evolution of standardized temperature anomalies during the event.

Event ID: Heat_wave_2020-Jan-23_to_2020-Jan-28_237.5_41.5