Heat wave occuring from October 13 2021 to October 17 2021 at 74.0°N 48.0°E

Download data: JSON

Event type: Heat wave

Countries affected (identified with ArcGIS Online; provided only for geographical reference):

  • Russian Federation

Duration: 5 days

Time span: October 13 2021 to October 17 2021

Statistics over entire affected area:

  • Mean temperature anomaly: 3.6 °C
  • Mean temperature: 2.9 °C
  • Maximum temperature anomaly: 5.3 °C
  • Maximum temperature: 5.3 °C

Event center: 74.0°N 48.0°E

Area affected: 105509 km$^2$
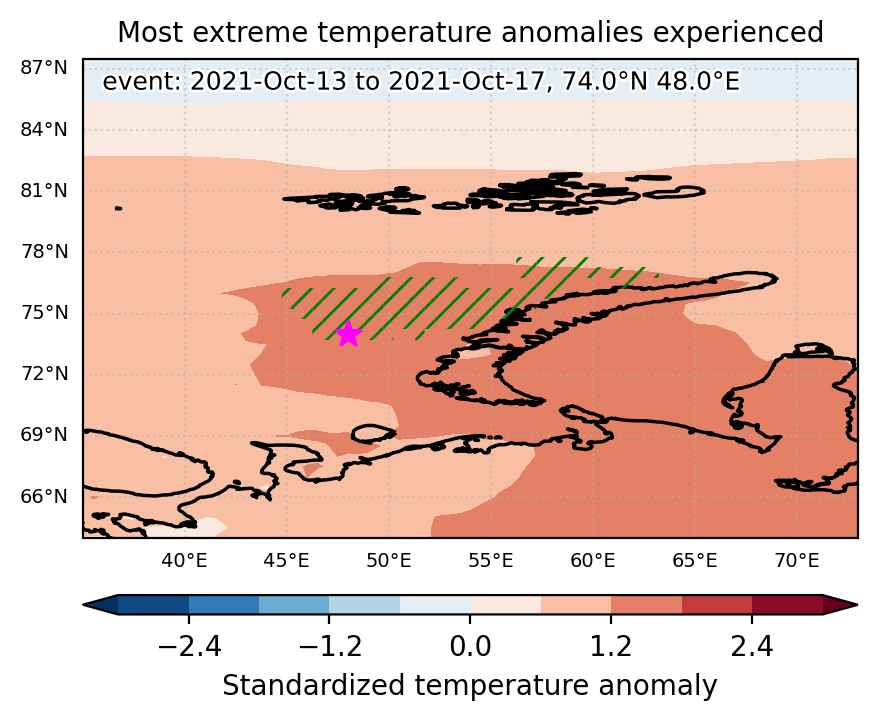

Fig. 1: Map of most extreme temperature anomalies (standardized) experienced during the event. The purple star indicates the center of the extreme event. Green hatching illustrates all areas under the effect of extremes at some time during the event.
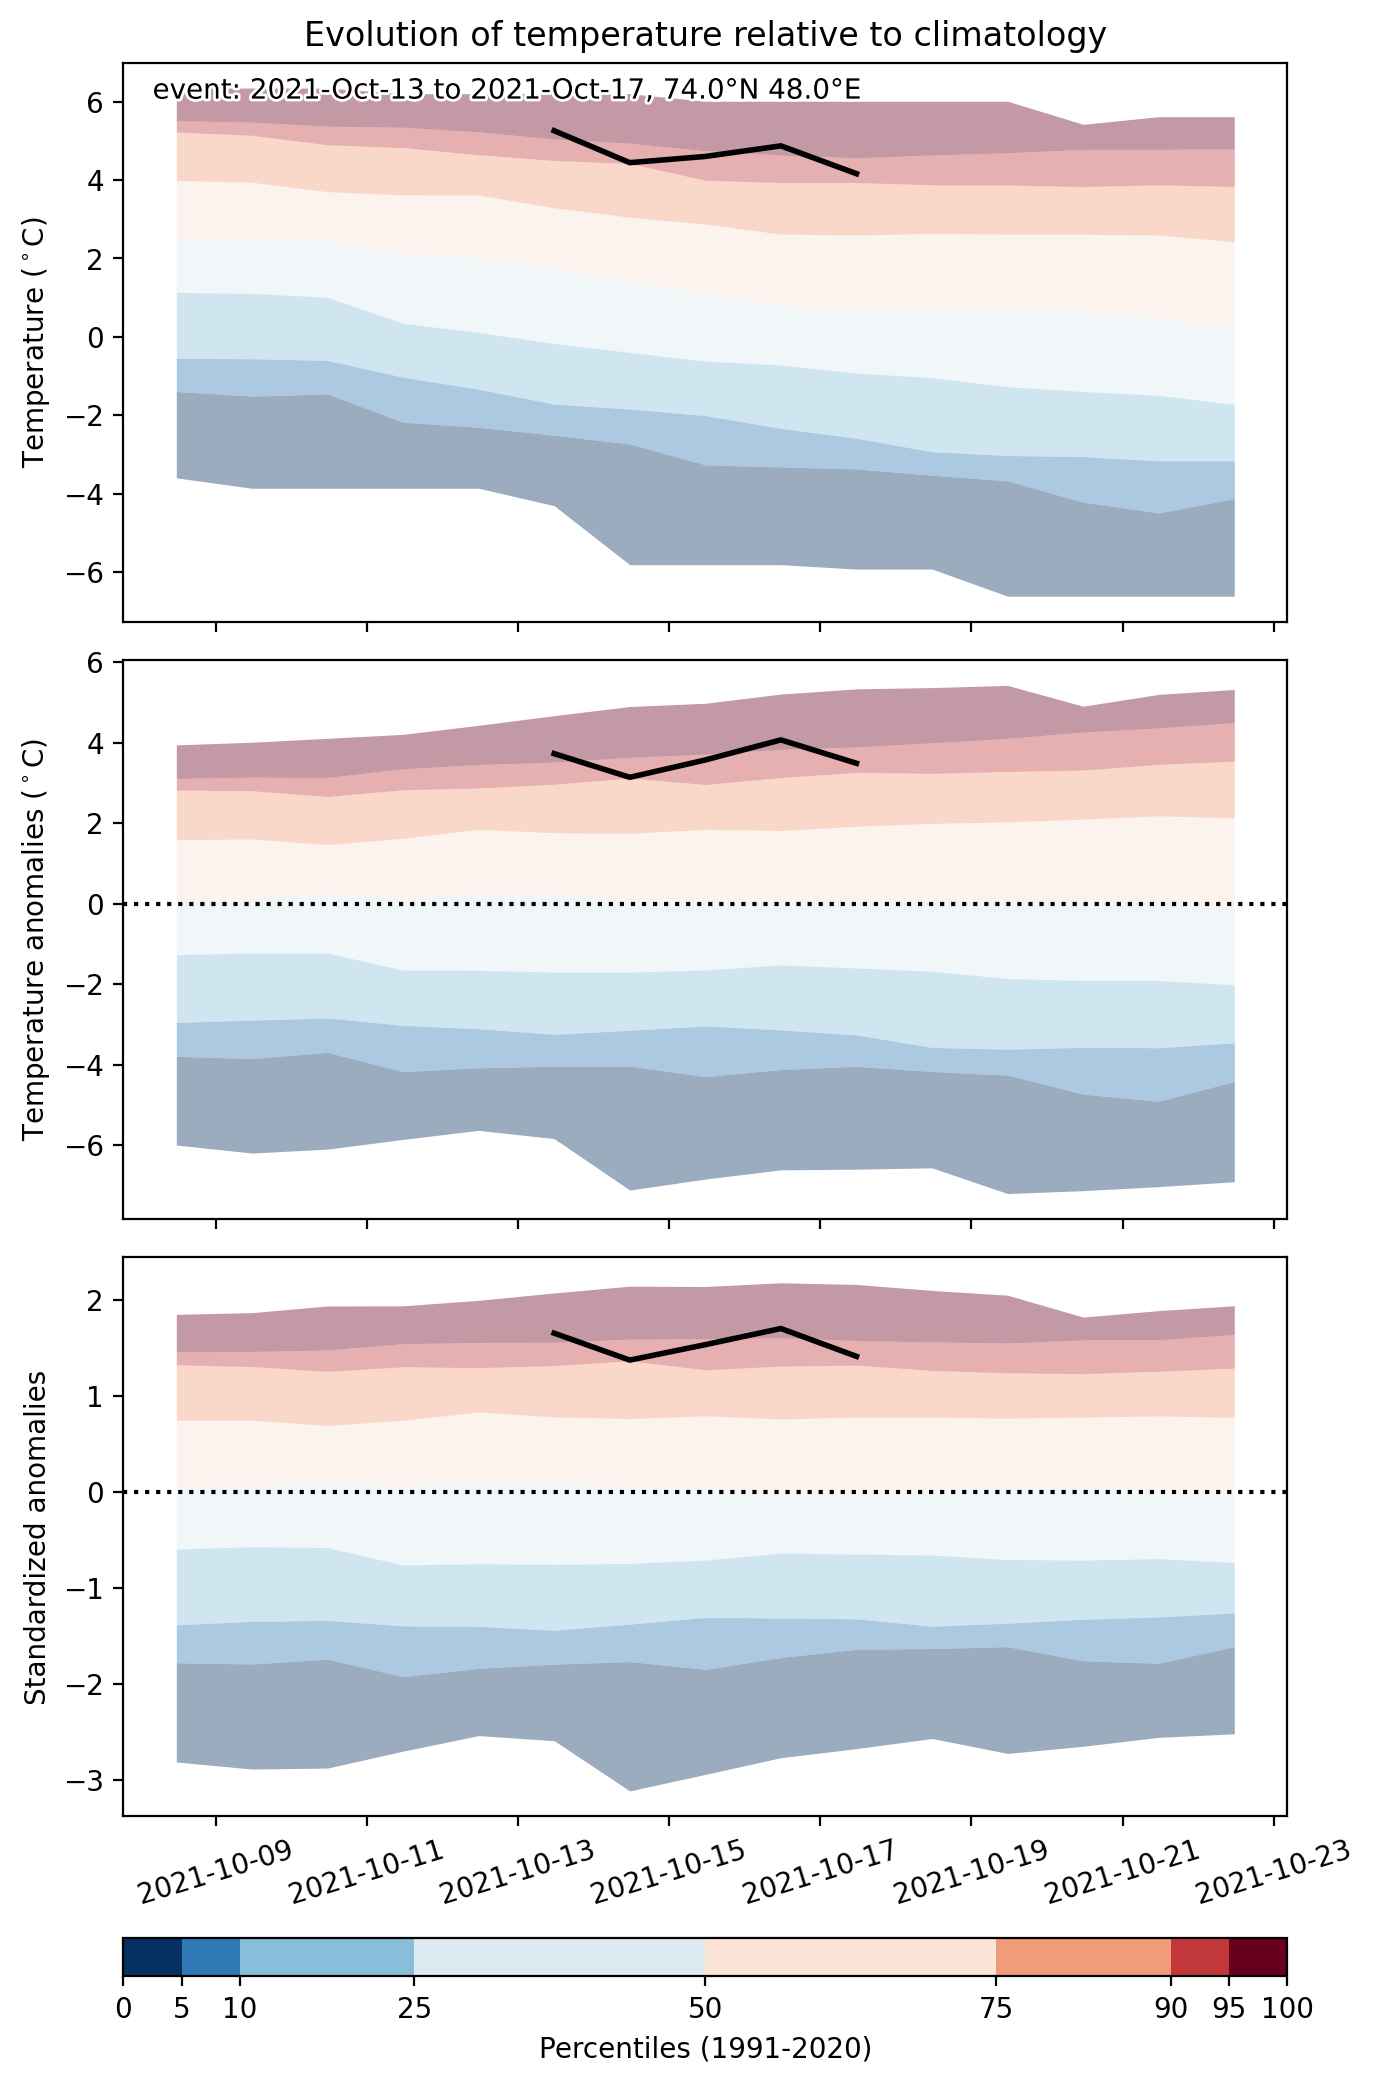


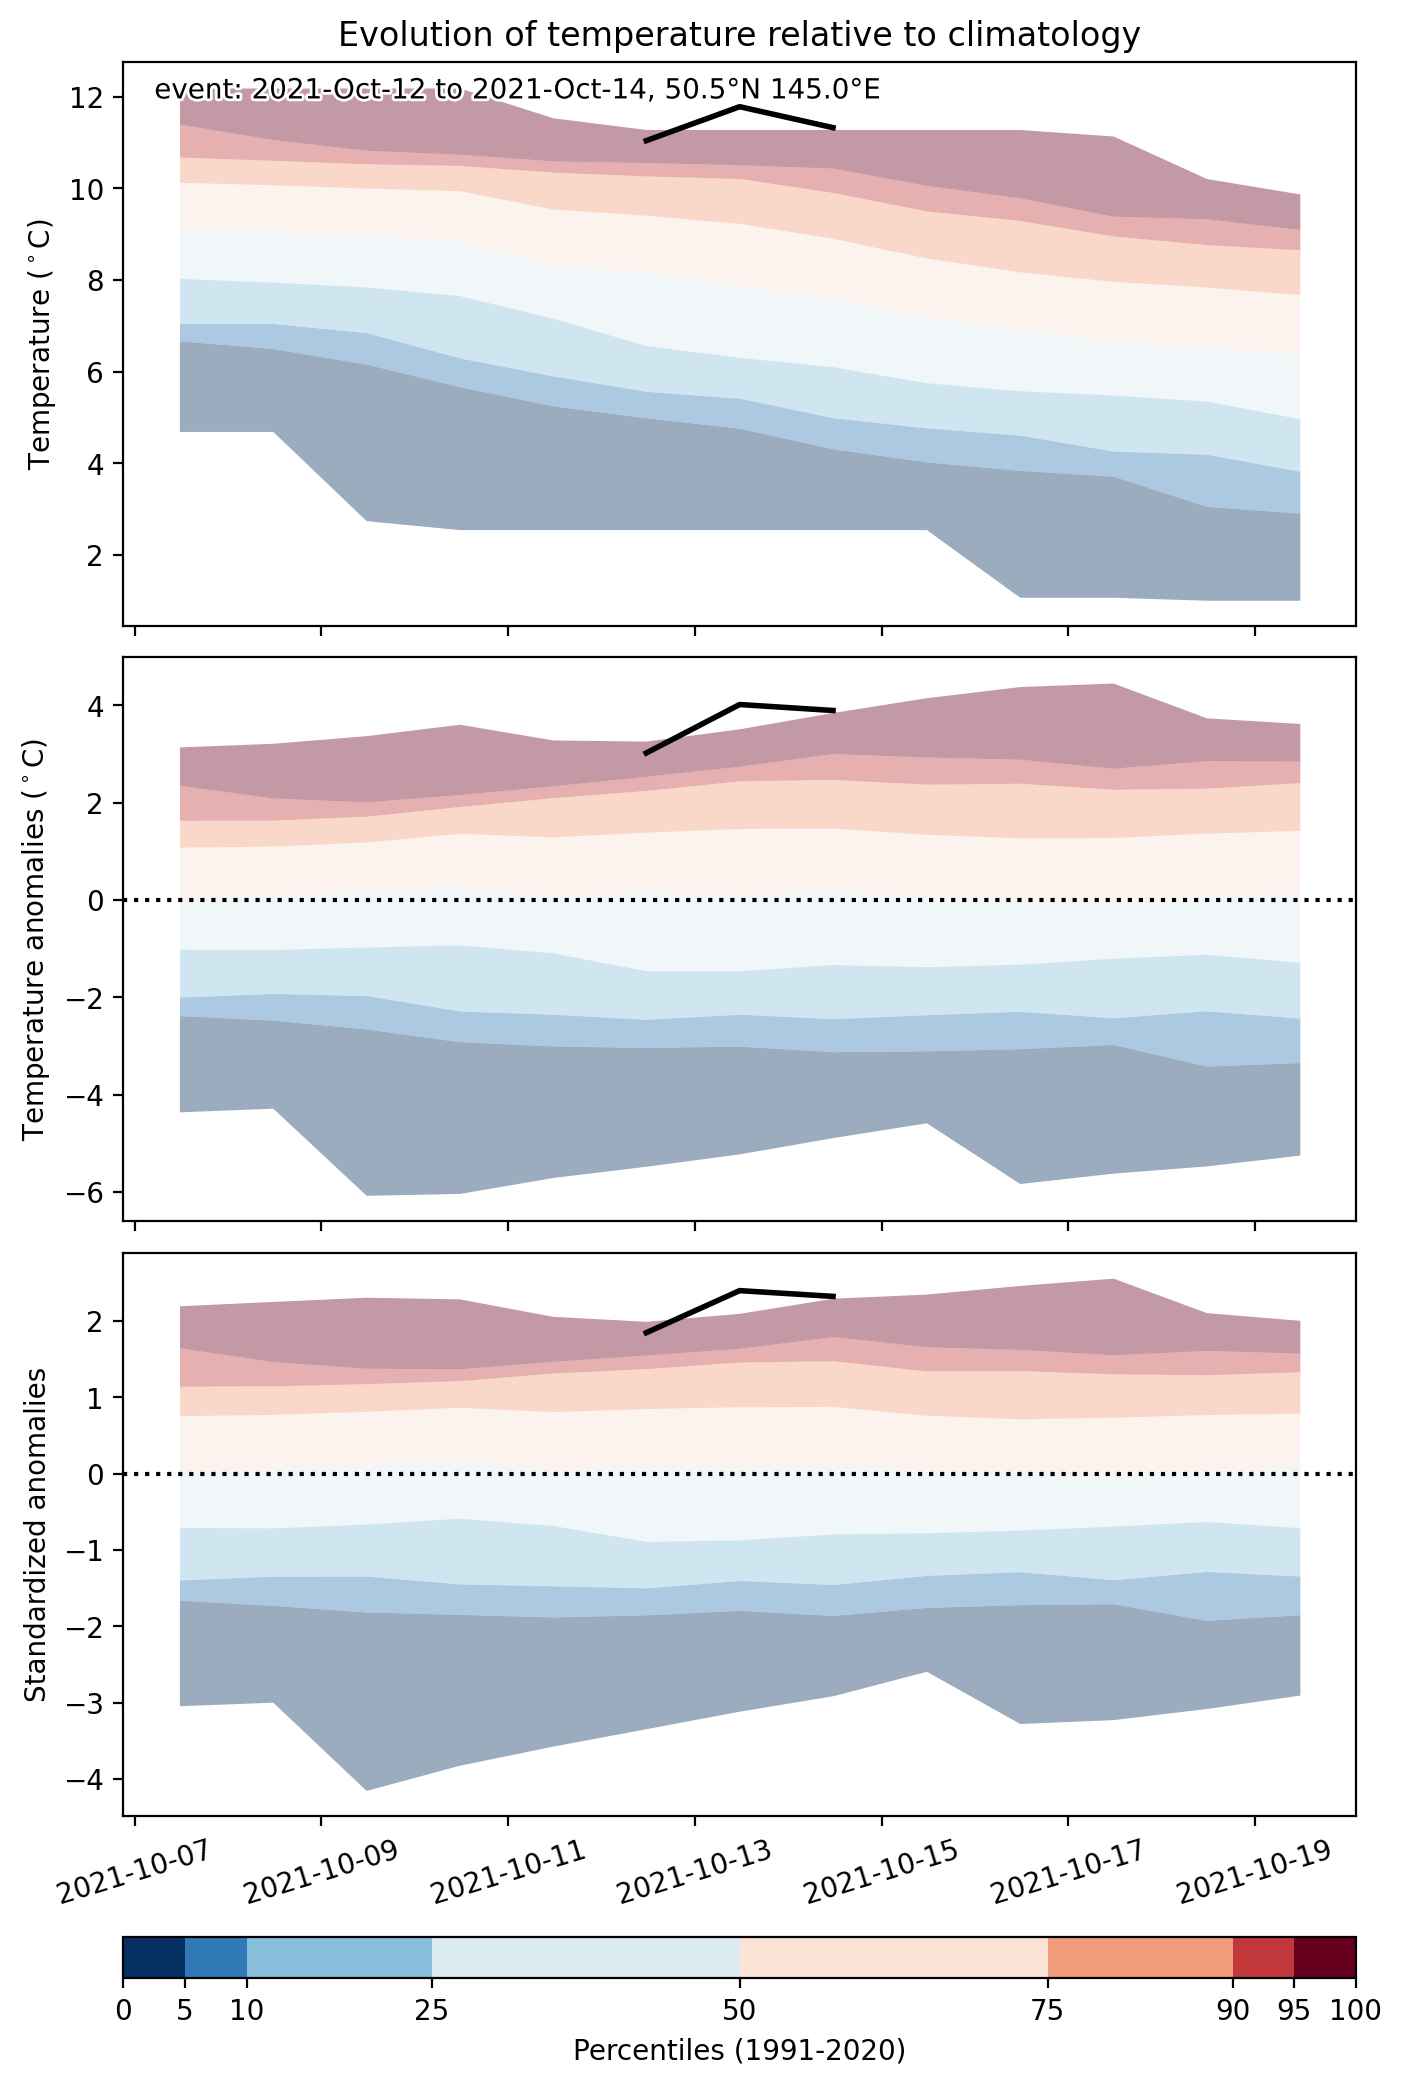
Fig. 2: Evolution of temperature at the center of the event. The climatological percentile distribution is illustrated with color shadings.
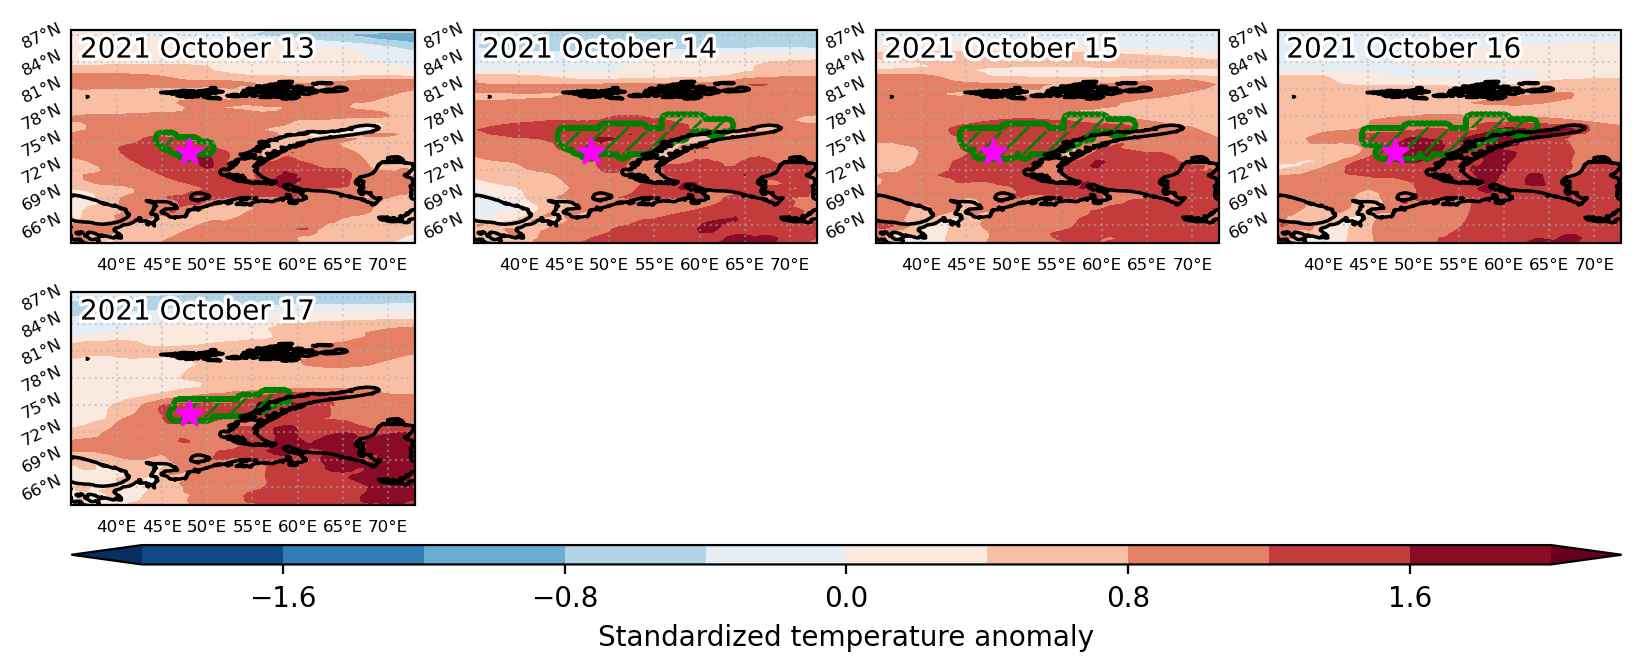


Fig. 3: Maps illustrating the evolution of standardized temperature anomalies during the event.

Event ID: Heat_wave_2021-Oct-13_to_2021-Oct-17_48.0_74.0
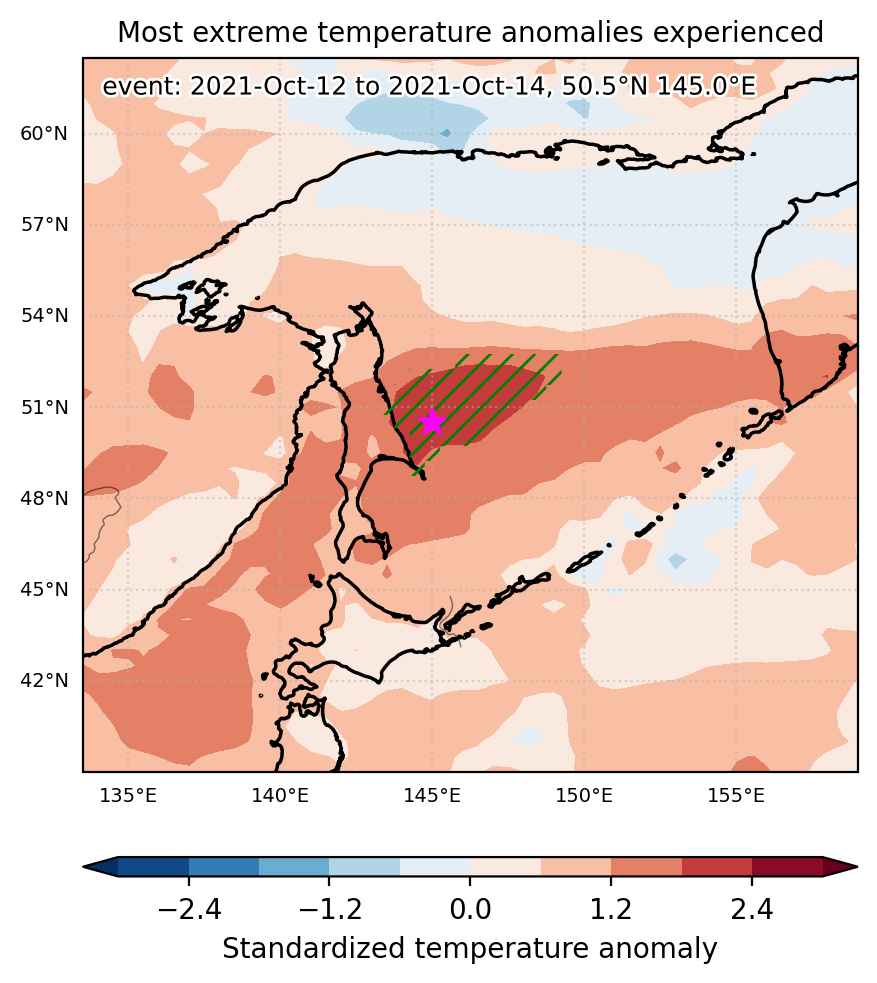
Heat wave occuring from October 12 2021 to October 14 2021 at 50.5°N 145.0°E

Download data: JSON

Event type: Heat wave

Countries affected (identified with ArcGIS Online; provided only for geographical reference):

  • Russian Federation

Duration: 3 days

Time span: October 12 2021 to October 14 2021

Statistics over entire affected area:

  • Mean temperature anomaly: 3.2 °C
  • Mean temperature: 10.6 °C
  • Maximum temperature anomaly: 4.8 °C
  • Maximum temperature: 11.8 °C

Event center: 50.5°N 145.0°E

Area affected: 98693 km$^2$


Fig. 1: Map of most extreme temperature anomalies (standardized) experienced during the event. The purple star indicates the center of the extreme event. Green hatching illustrates all areas under the effect of extremes at some time during the event.


Fig. 2: Evolution of temperature at the center of the event. The climatological percentile distribution is illustrated with color shadings.


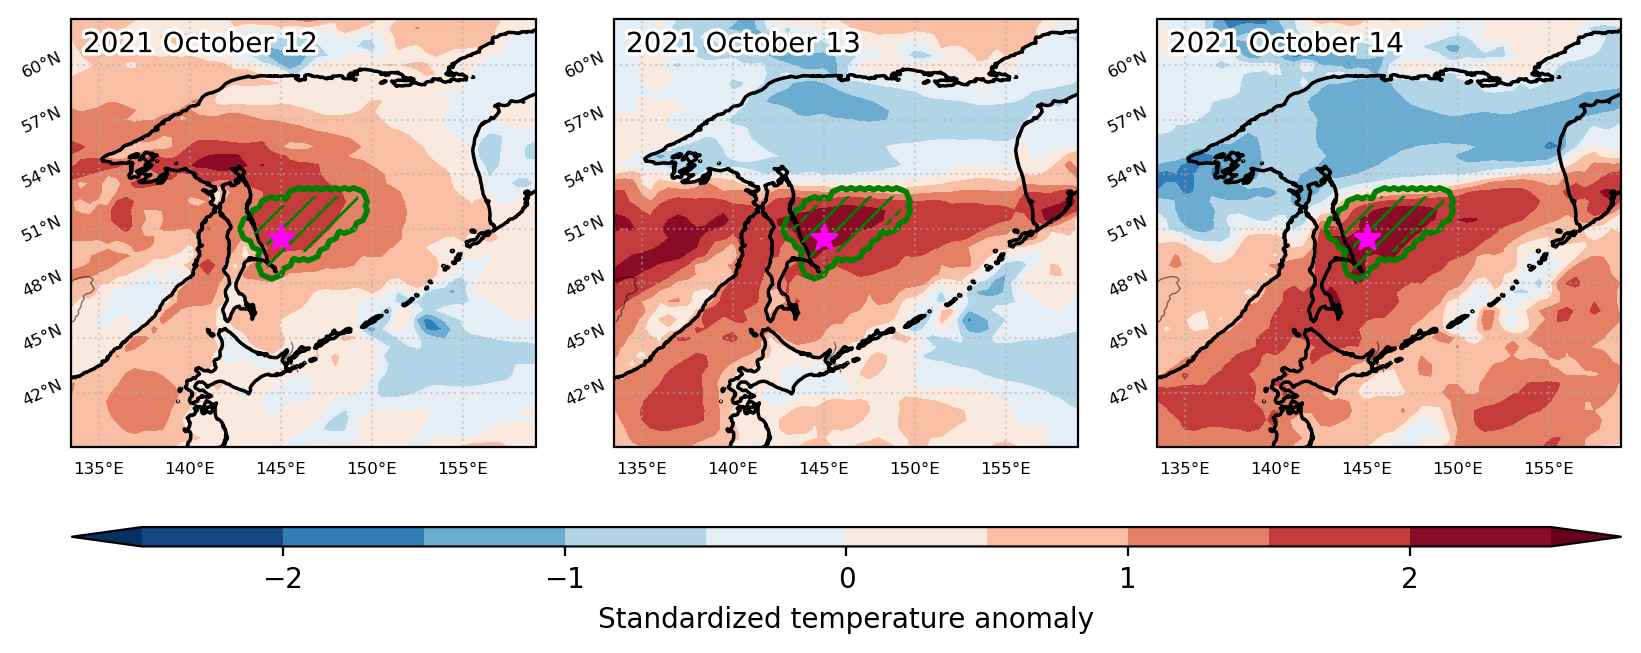
Fig. 3: Maps illustrating the evolution of standardized temperature anomalies during the event.

Event ID: Heat_wave_2021-Oct-12_to_2021-Oct-14_145.0_50.5

Heat wave occuring from October 09 2021 to October 11 2021 at 69.5°N 127.0°E

Download data: JSON

Event type: Heat wave

Countries affected (identified with ArcGIS Online; provided only for geographical reference):

  • Russian Federation

Duration: 3 days

Time span: October 09 2021 to October 11 2021

Statistics over entire affected area:

  • Mean temperature anomaly: 5.6 °C
  • Mean temperature: 0.8 °C
  • Maximum temperature anomaly: 10.0 °C
  • Maximum temperature: 4.5 °C

Event center: 69.5°N 127.0°E

Area affected: 263219 km$^2$


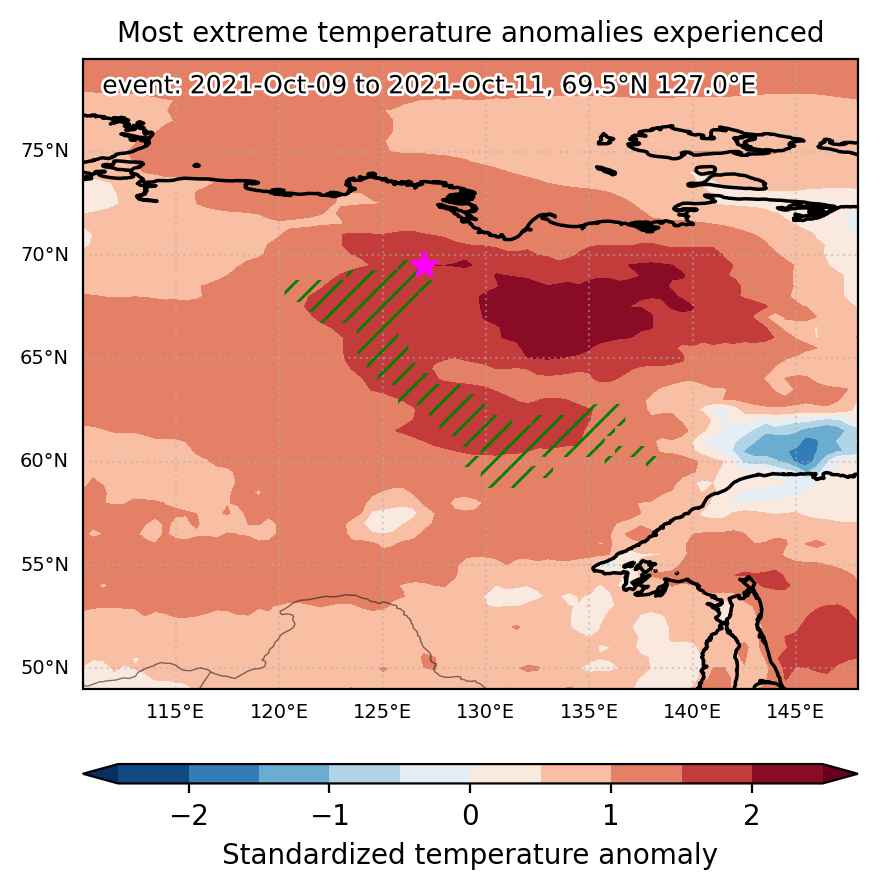
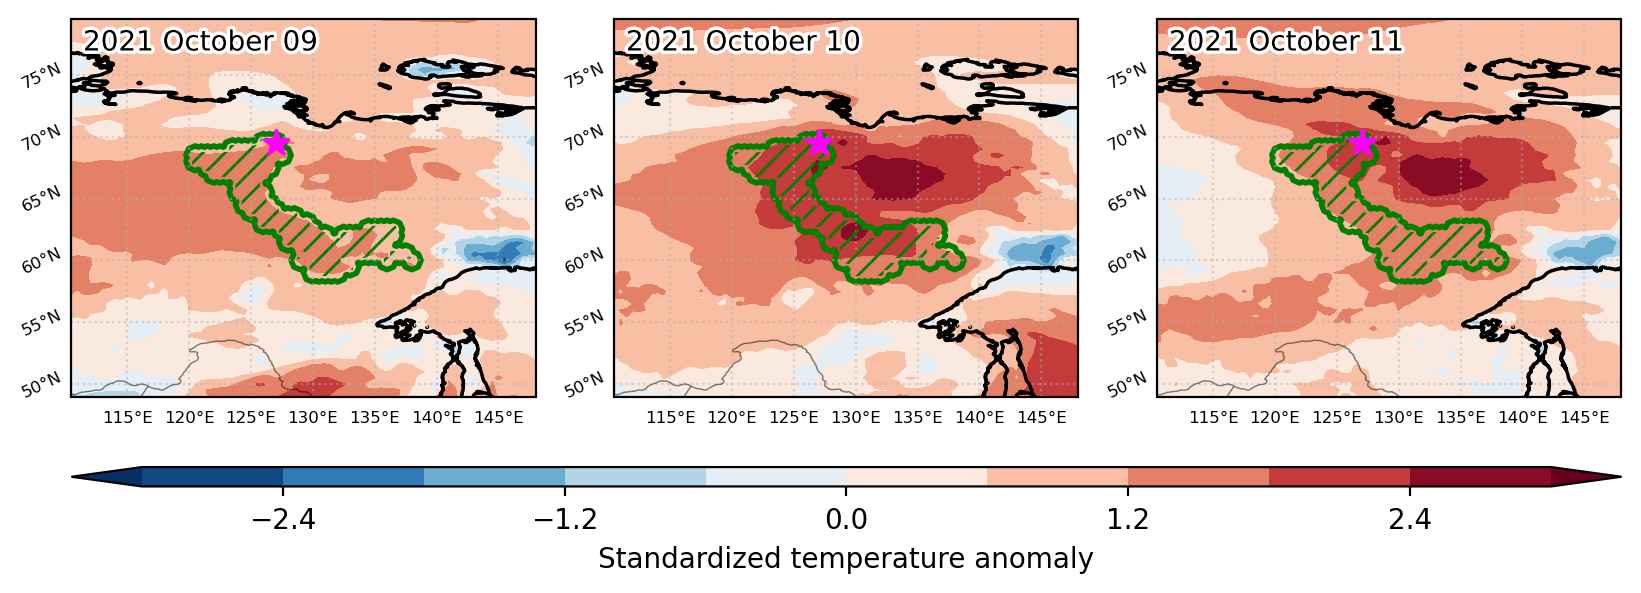
Fig. 1: Map of most extreme temperature anomalies (standardized) experienced during the event. The purple star indicates the center of the extreme event. Green hatching illustrates all areas under the effect of extremes at some time during the event.


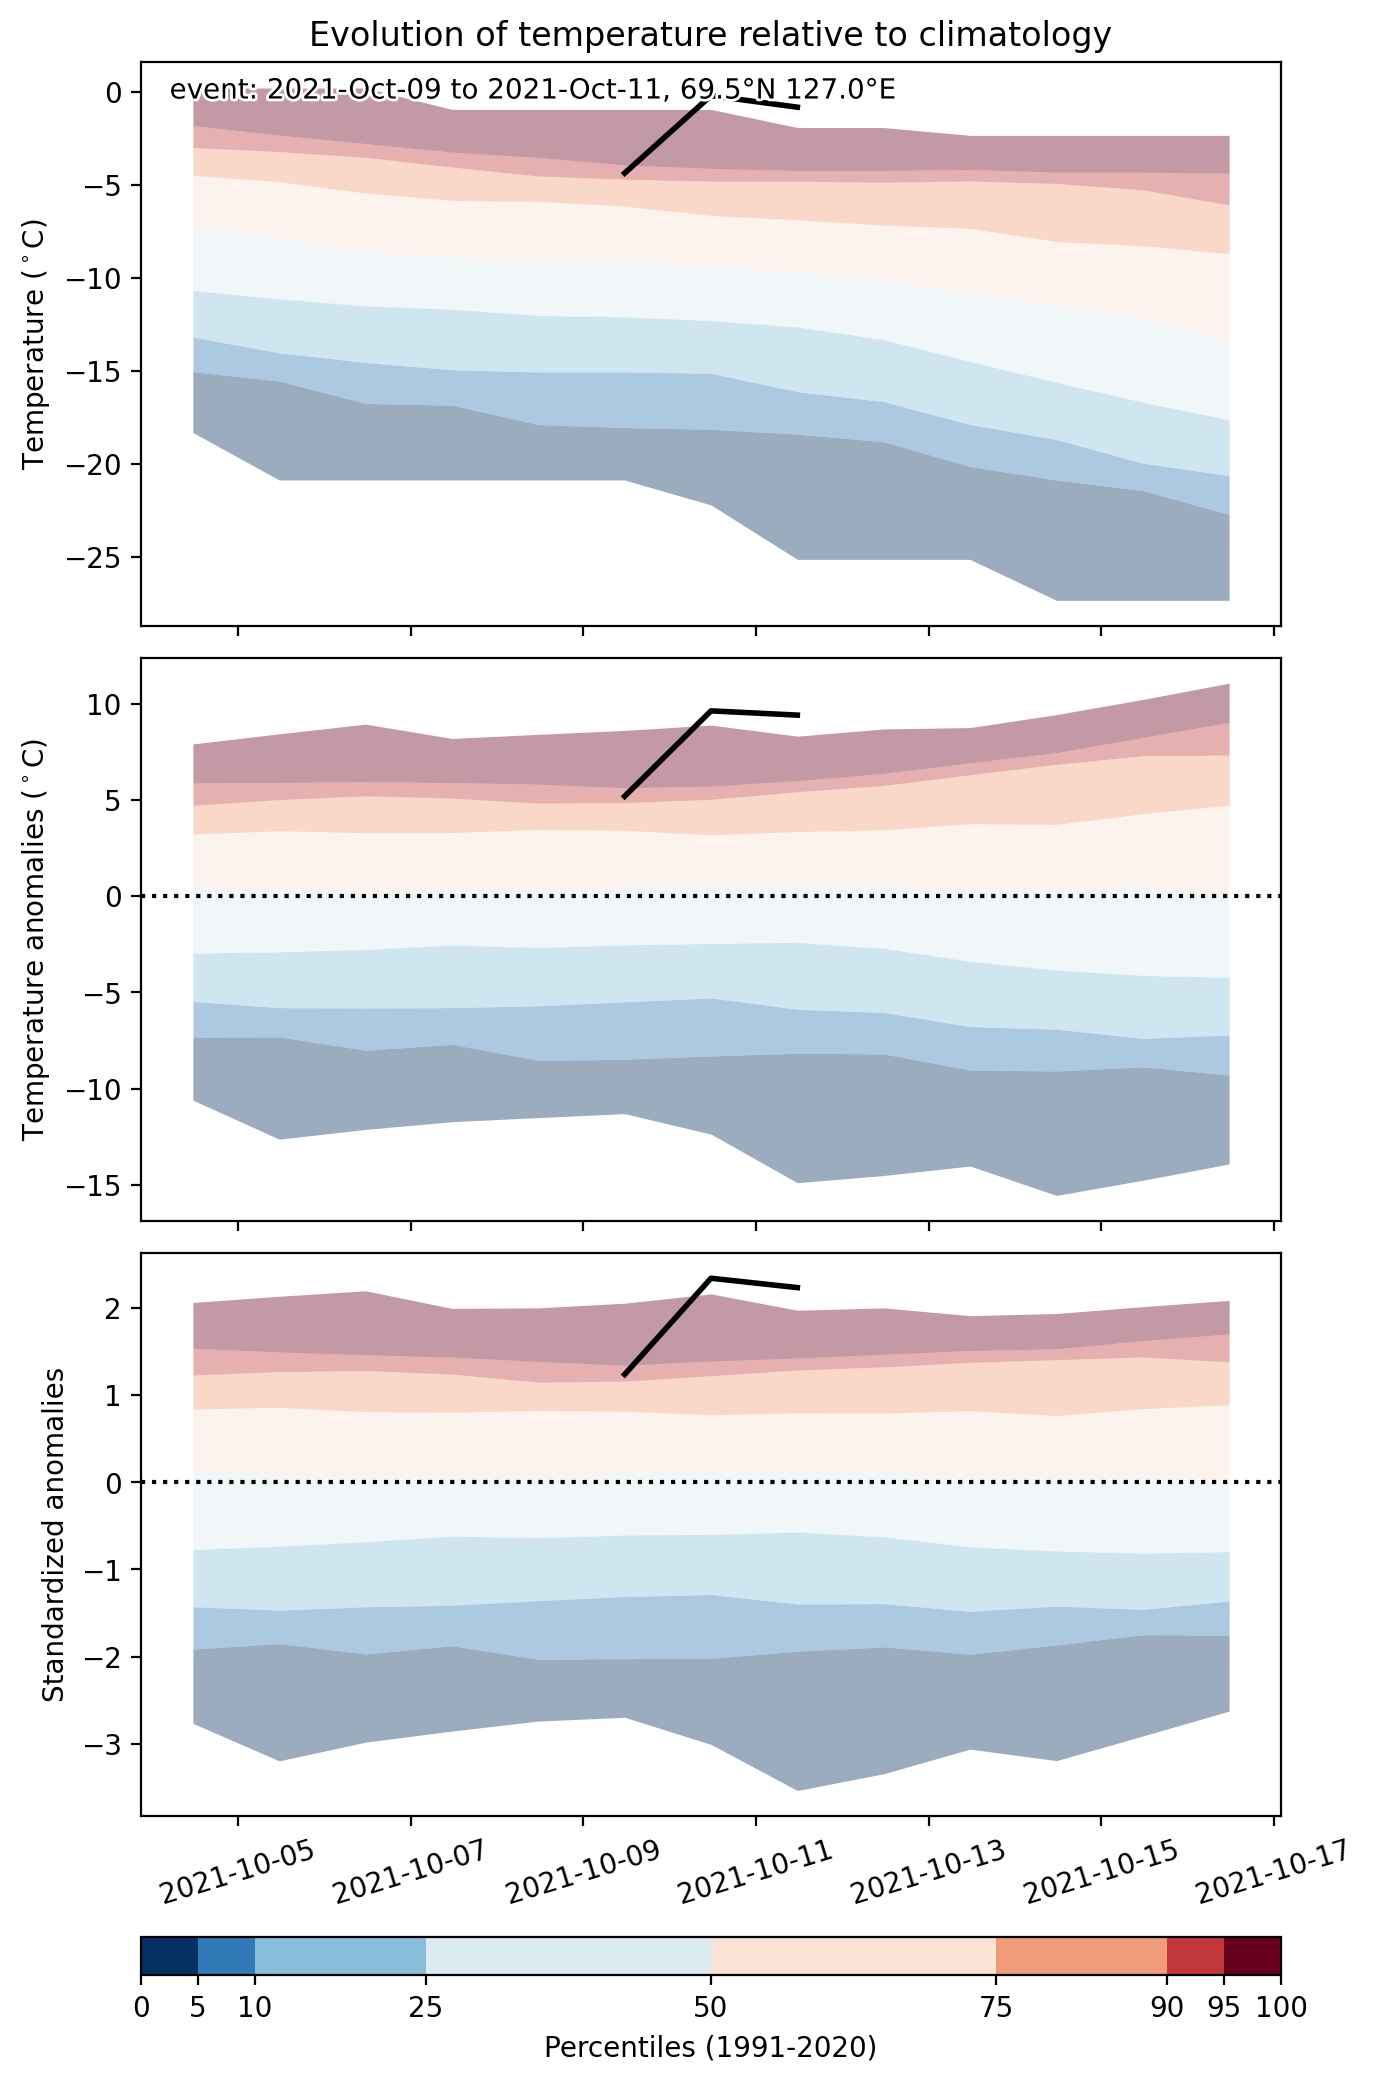
Fig. 2: Evolution of temperature at the center of the event. The climatological percentile distribution is illustrated with color shadings.


Fig. 3: Maps illustrating the evolution of standardized temperature anomalies during the event.

Event ID: Heat_wave_2021-Oct-09_to_2021-Oct-11_127.0_69.5

Heat wave occuring from October 07 2021 to October 09 2021 at 65.0°N 99.5°E

Download data: JSON

Event type: Heat wave

Countries affected (identified with ArcGIS Online; provided only for geographical reference):

  • Russian Federation

Duration: 3 days

Time span: October 07 2021 to October 09 2021

Statistics over entire affected area:

  • Mean temperature anomaly: 6.8 °C
  • Mean temperature: 1.3 °C
  • Maximum temperature anomaly: 7.9 °C
  • Maximum temperature: 2.8 °C

Event center: 65.0°N 99.5°E

Area affected: 71187 km$^2$


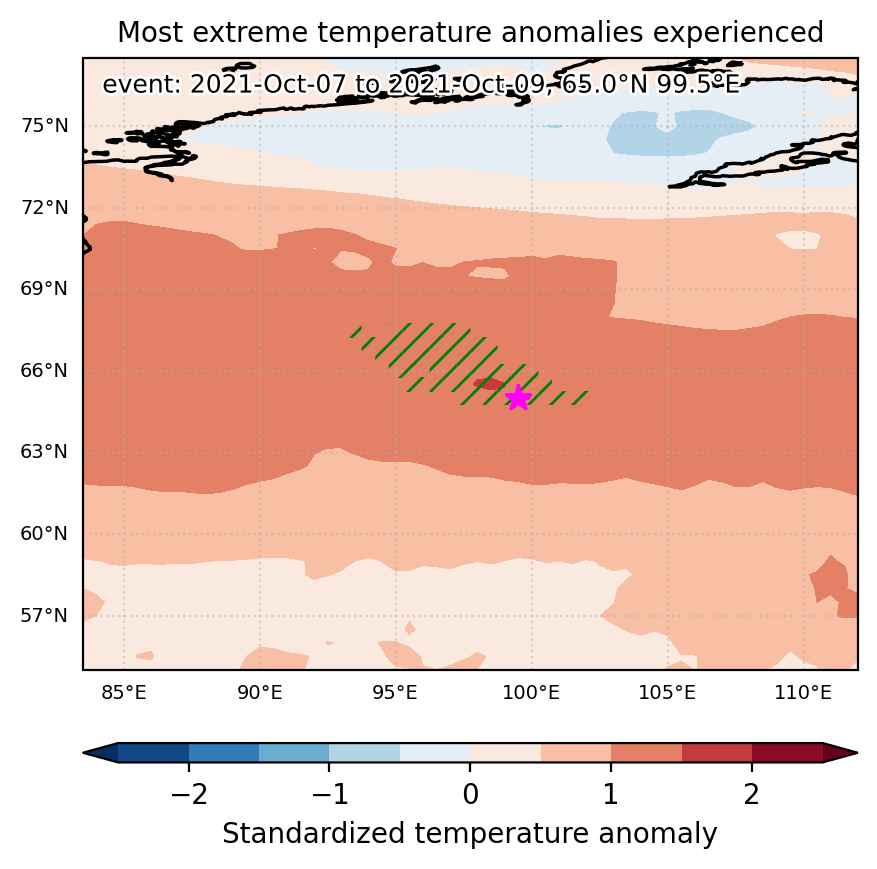
Fig. 1: Map of most extreme temperature anomalies (standardized) experienced during the event. The purple star indicates the center of the extreme event. Green hatching illustrates all areas under the effect of extremes at some time during the event.


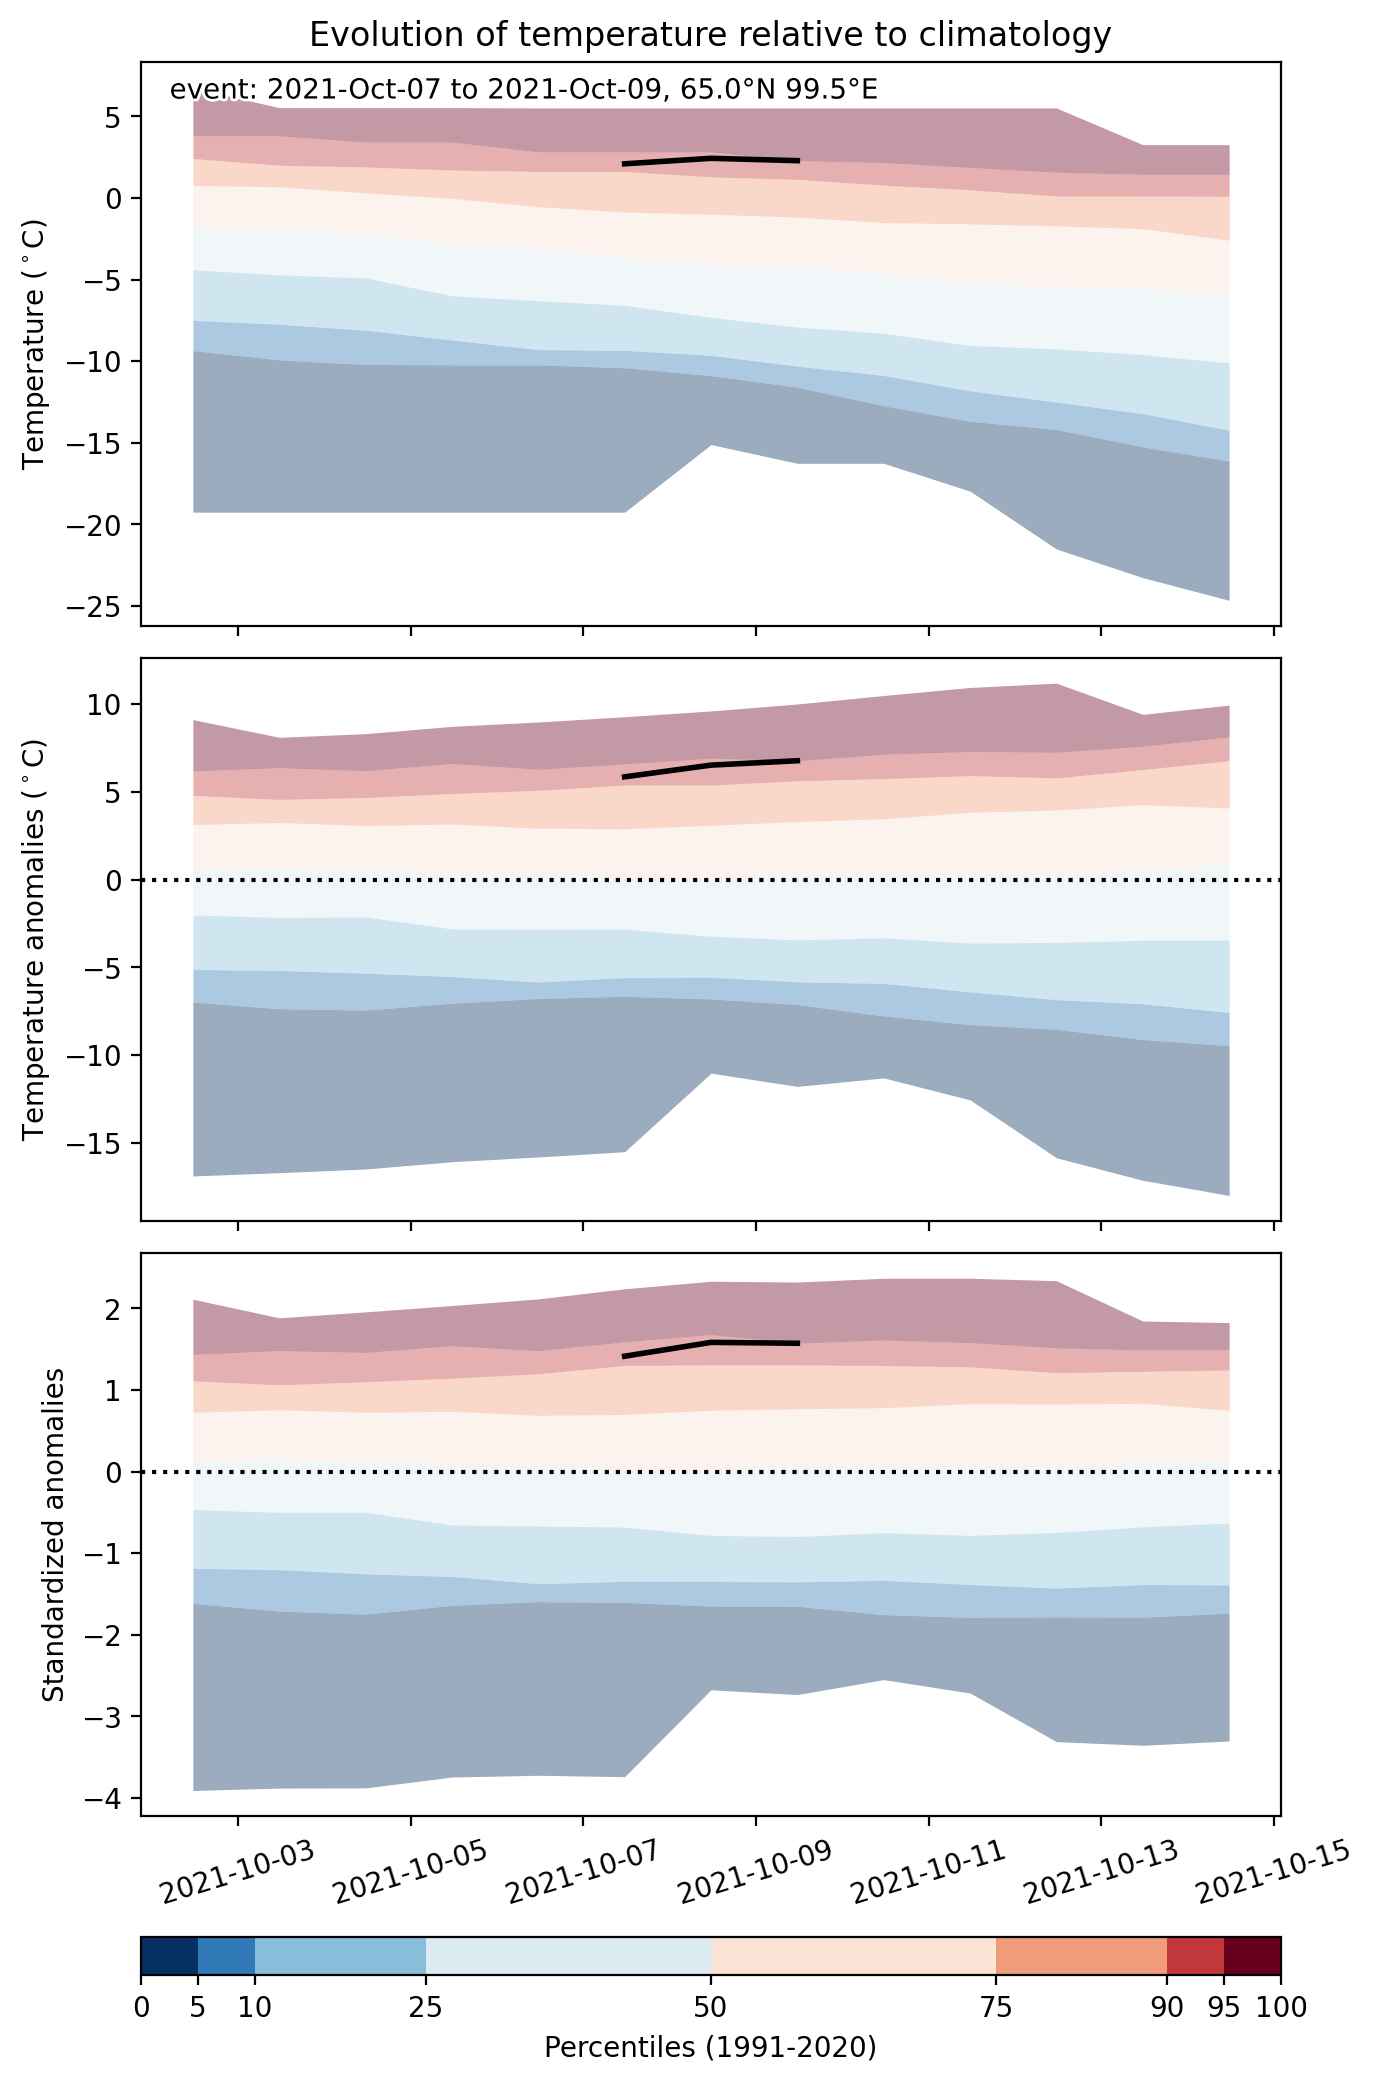
Fig. 2: Evolution of temperature at the center of the event. The climatological percentile distribution is illustrated with color shadings.


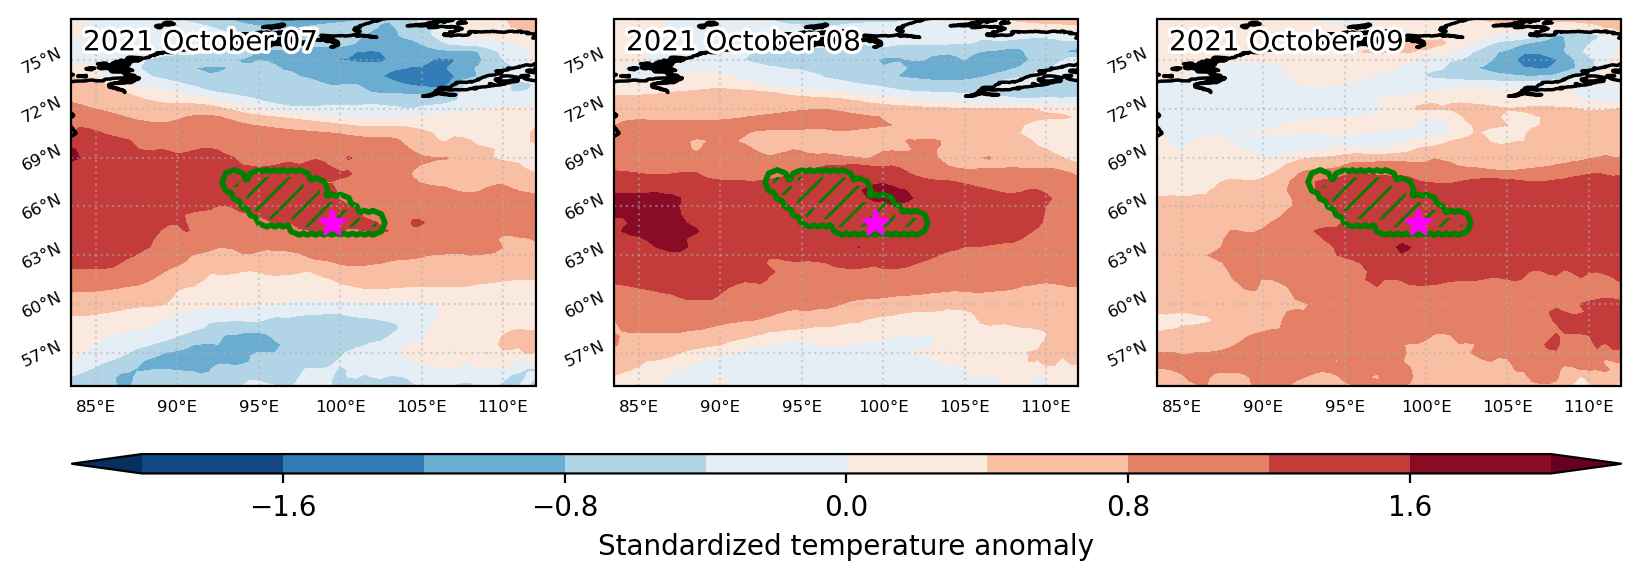
Fig. 3: Maps illustrating the evolution of standardized temperature anomalies during the event.

Event ID: Heat_wave_2021-Oct-07_to_2021-Oct-09_99.5_65.0

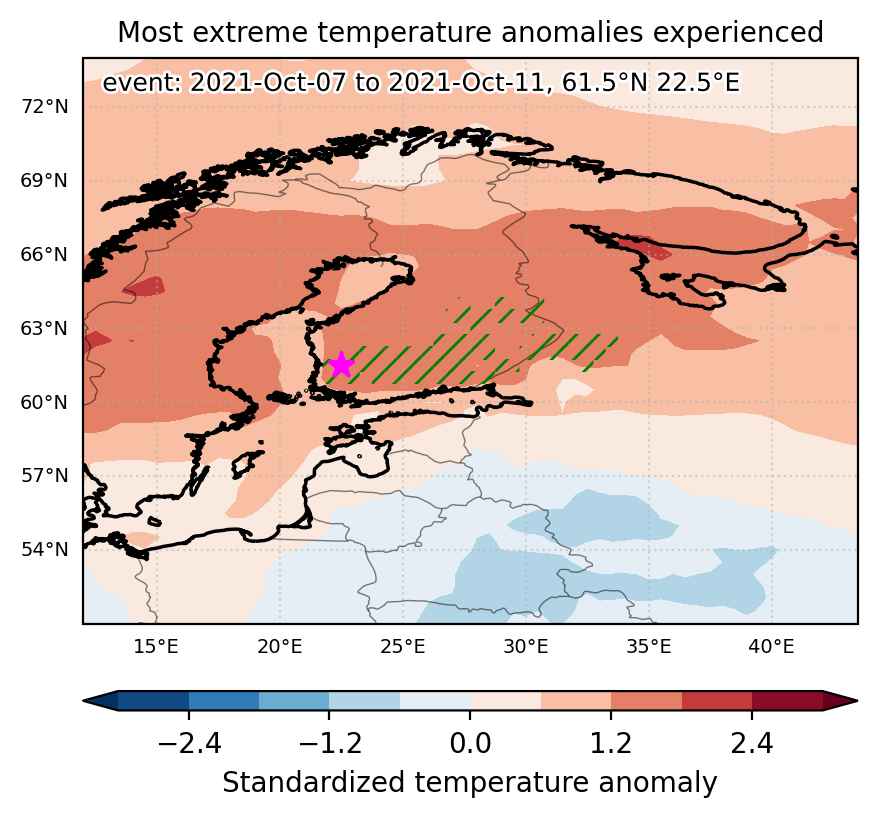
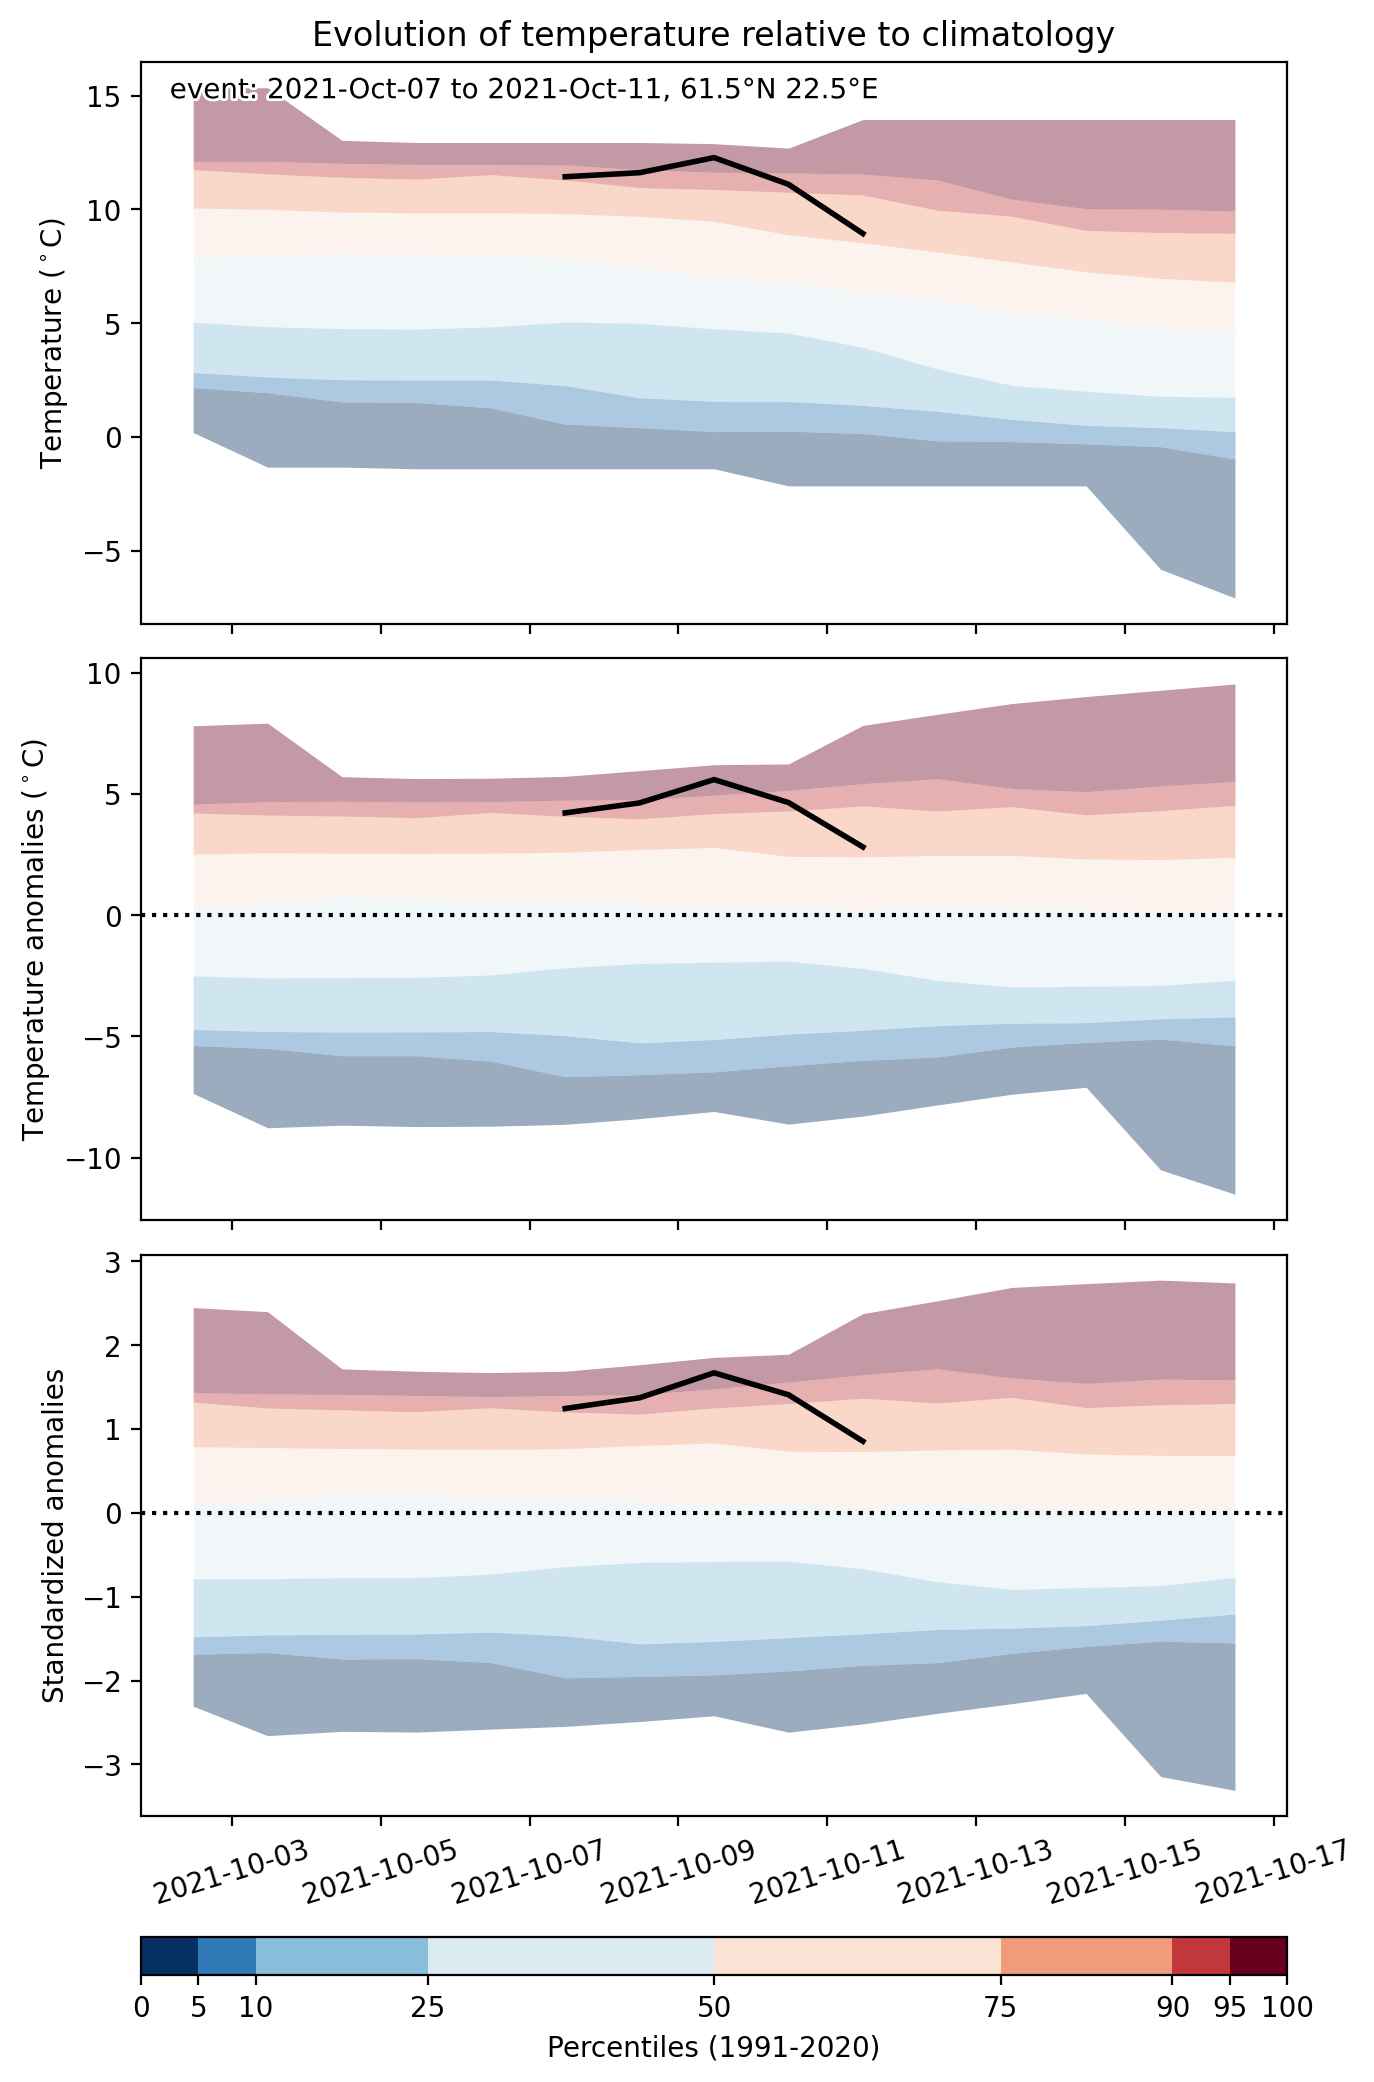
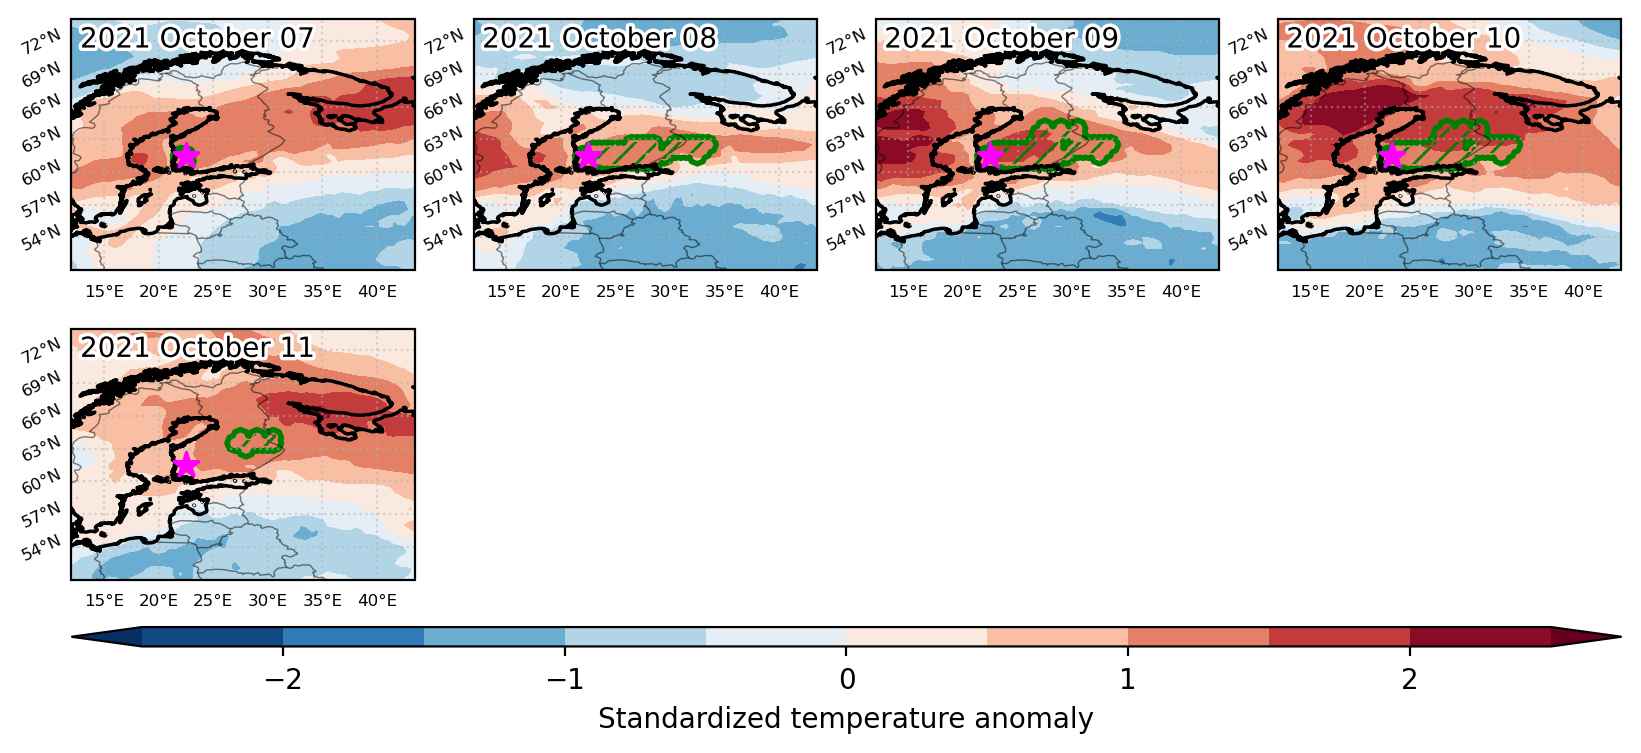
Heat wave occuring from October 07 2021 to October 11 2021 at 61.5°N 22.5°E

Download data: JSON

Event type: Heat wave

Countries affected (identified with ArcGIS Online; provided only for geographical reference):

  • Finland
  • Russian Federation

Duration: 5 days

Time span: October 07 2021 to October 11 2021

Statistics over entire affected area:

  • Mean temperature anomaly: 4.5 °C
  • Mean temperature: 10.6 °C
  • Maximum temperature anomaly: 5.7 °C
  • Maximum temperature: 12.3 °C

Event center: 61.5°N 22.5°E

Area affected: 102807 km$^2$


Fig. 1: Map of most extreme temperature anomalies (standardized) experienced during the event. The purple star indicates the center of the extreme event. Green hatching illustrates all areas under the effect of extremes at some time during the event.


Fig. 2: Evolution of temperature at the center of the event. The climatological percentile distribution is illustrated with color shadings.


Fig. 3: Maps illustrating the evolution of standardized temperature anomalies during the event.

Event ID: Heat_wave_2021-Oct-07_to_2021-Oct-11_22.5_61.5

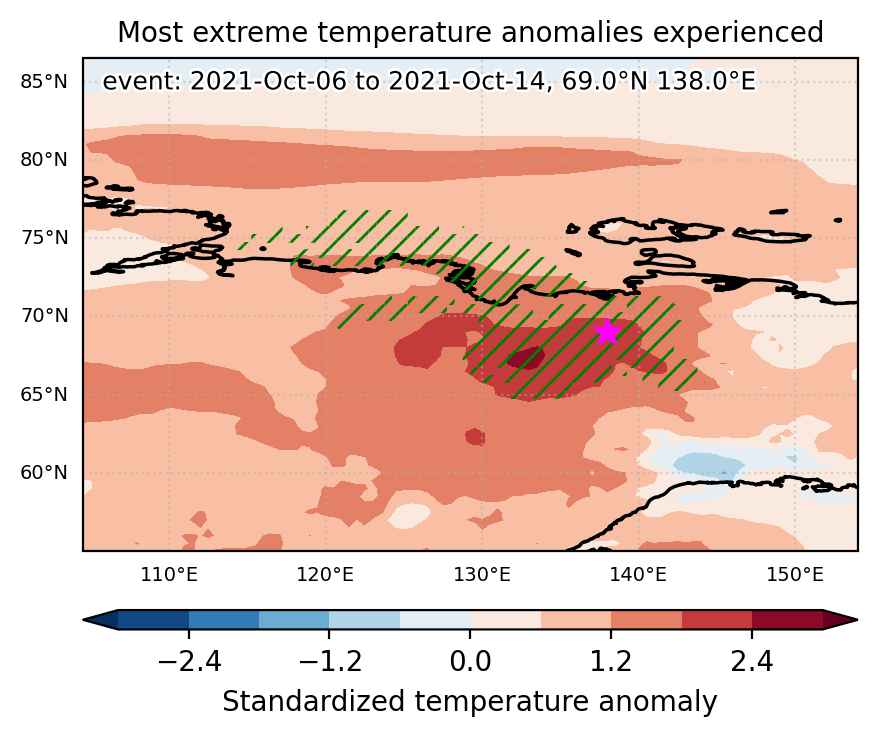
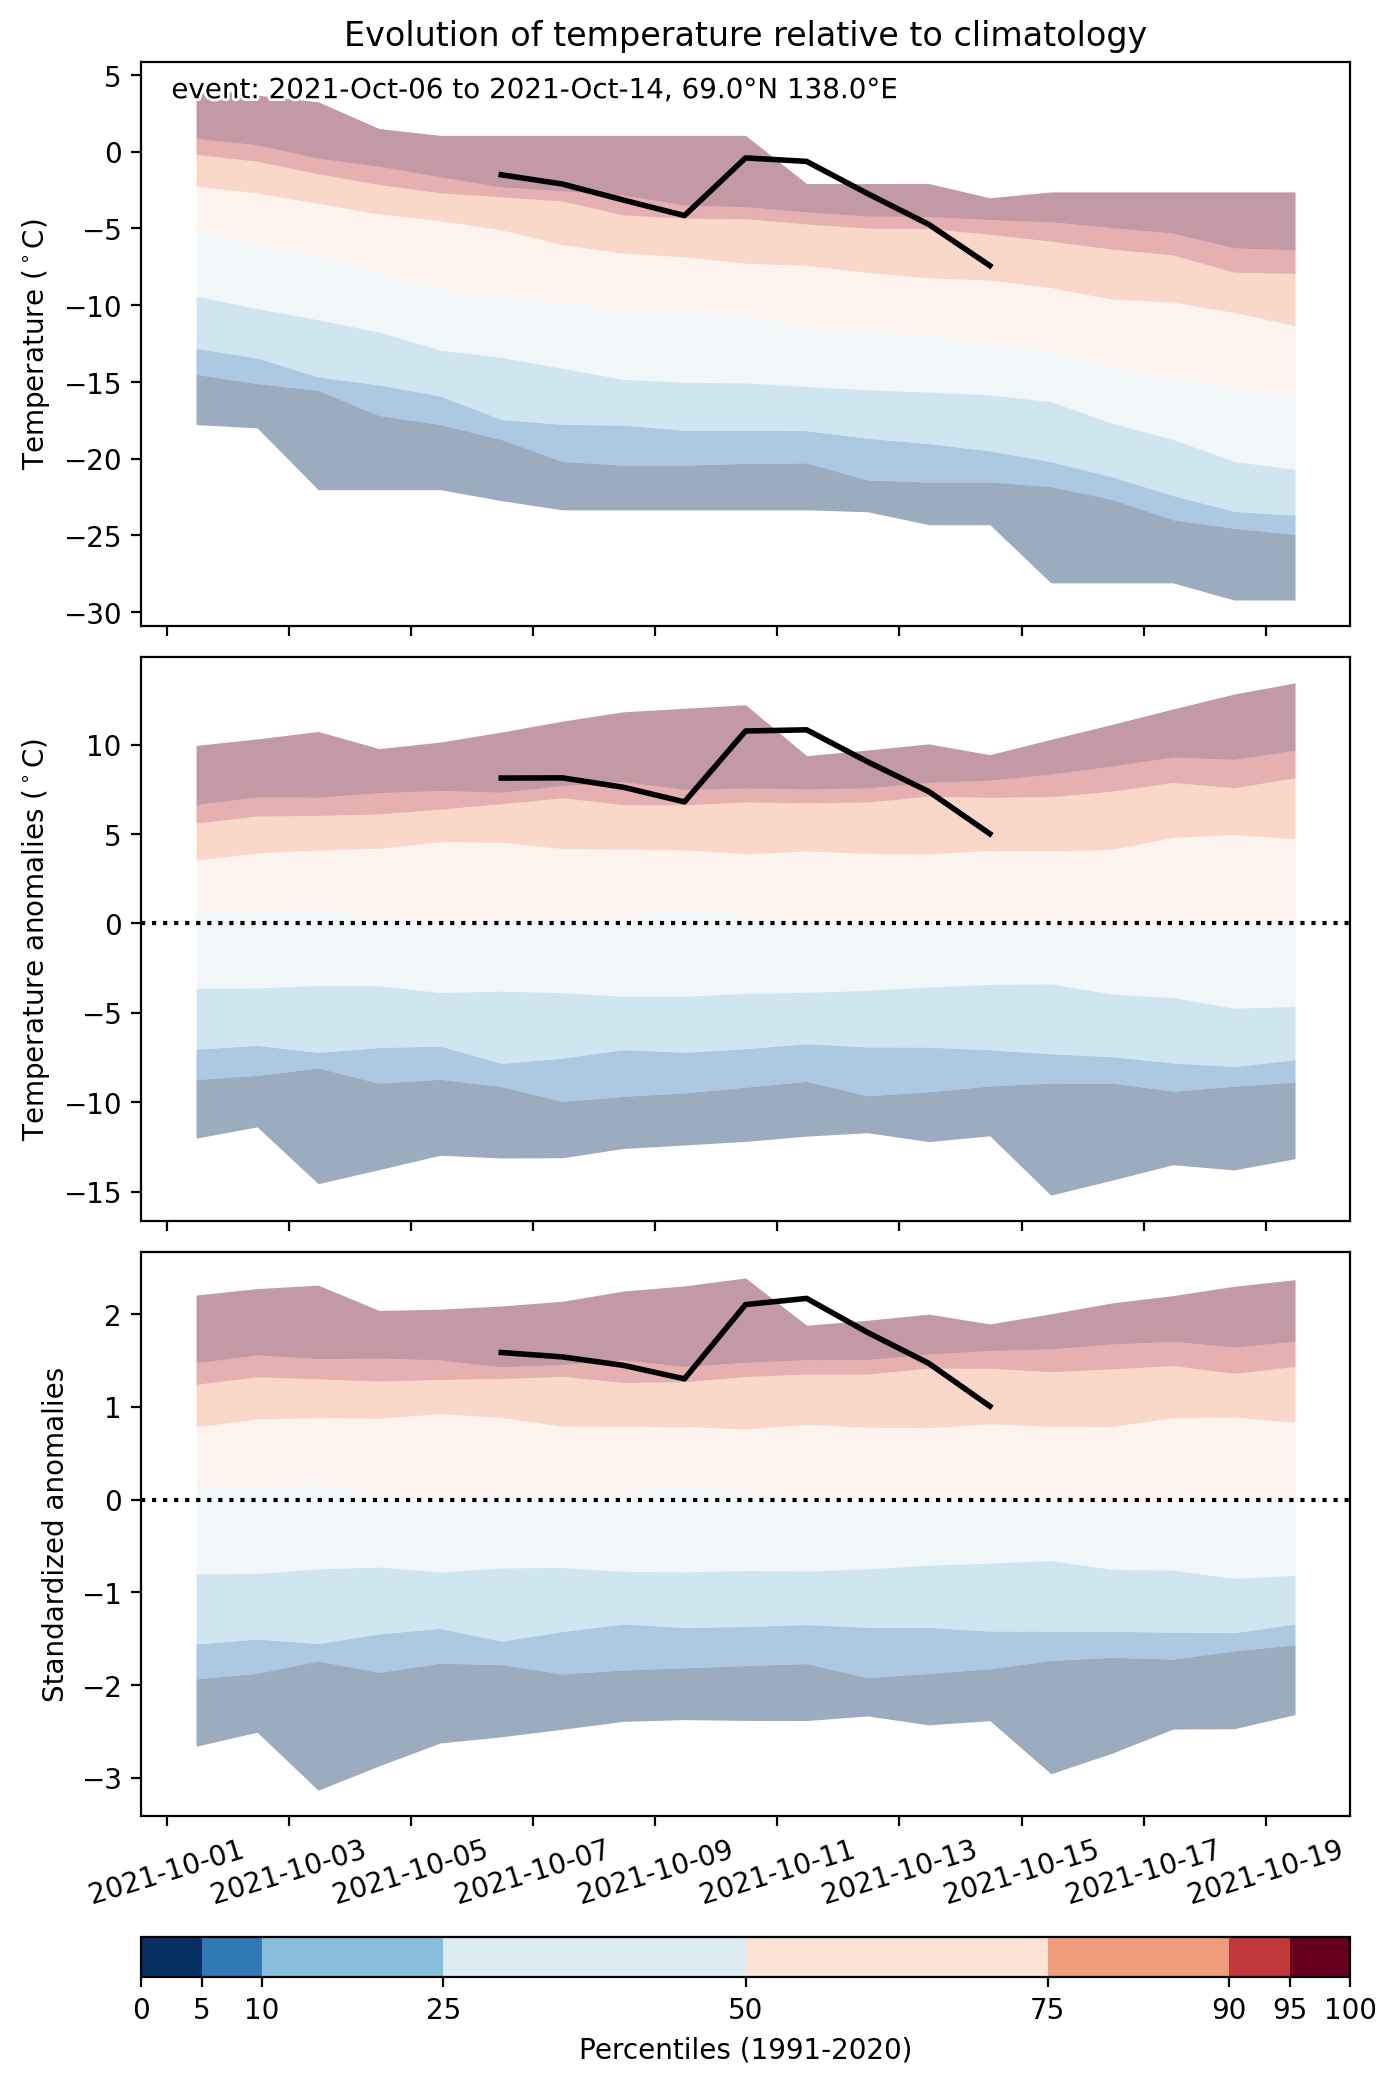
Heat wave occuring from October 06 2021 to October 14 2021 at 69.0°N 138.0°E

Download data: JSON

Event type: Heat wave

Countries affected (identified with ArcGIS Online; provided only for geographical reference):

  • Russian Federation

Duration: 9 days

Time span: October 06 2021 to October 14 2021

Statistics over entire affected area:

  • Mean temperature anomaly: 6.4 °C
  • Mean temperature: -2.0 °C
  • Maximum temperature anomaly: 10.8 °C
  • Maximum temperature: 2.4 °C

Event center: 69.0°N 138.0°E

Area affected: 535031 km$^2$


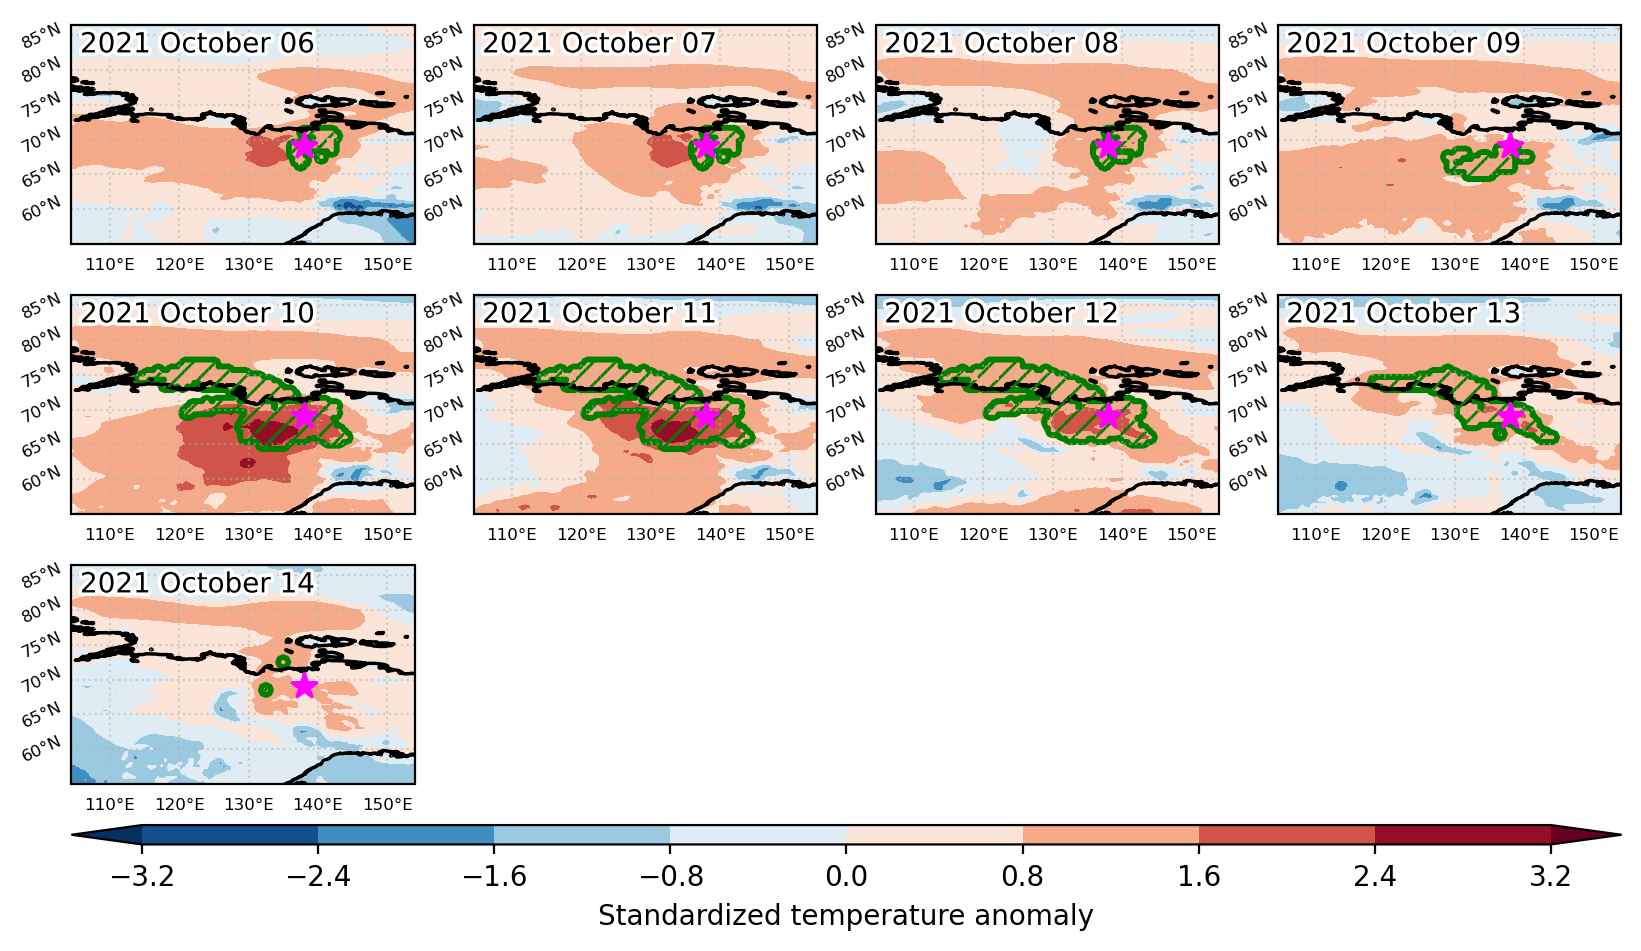
Fig. 1: Map of most extreme temperature anomalies (standardized) experienced during the event. The purple star indicates the center of the extreme event. Green hatching illustrates all areas under the effect of extremes at some time during the event.


Fig. 2: Evolution of temperature at the center of the event. The climatological percentile distribution is illustrated with color shadings.


Fig. 3: Maps illustrating the evolution of standardized temperature anomalies during the event.

Event ID: Heat_wave_2021-Oct-06_to_2021-Oct-14_138.0_69.0

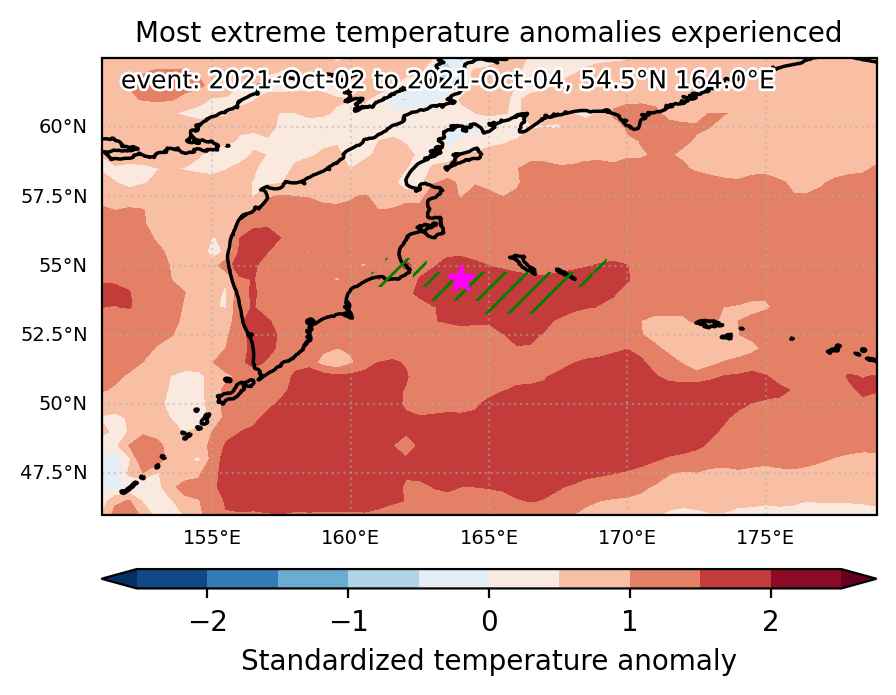
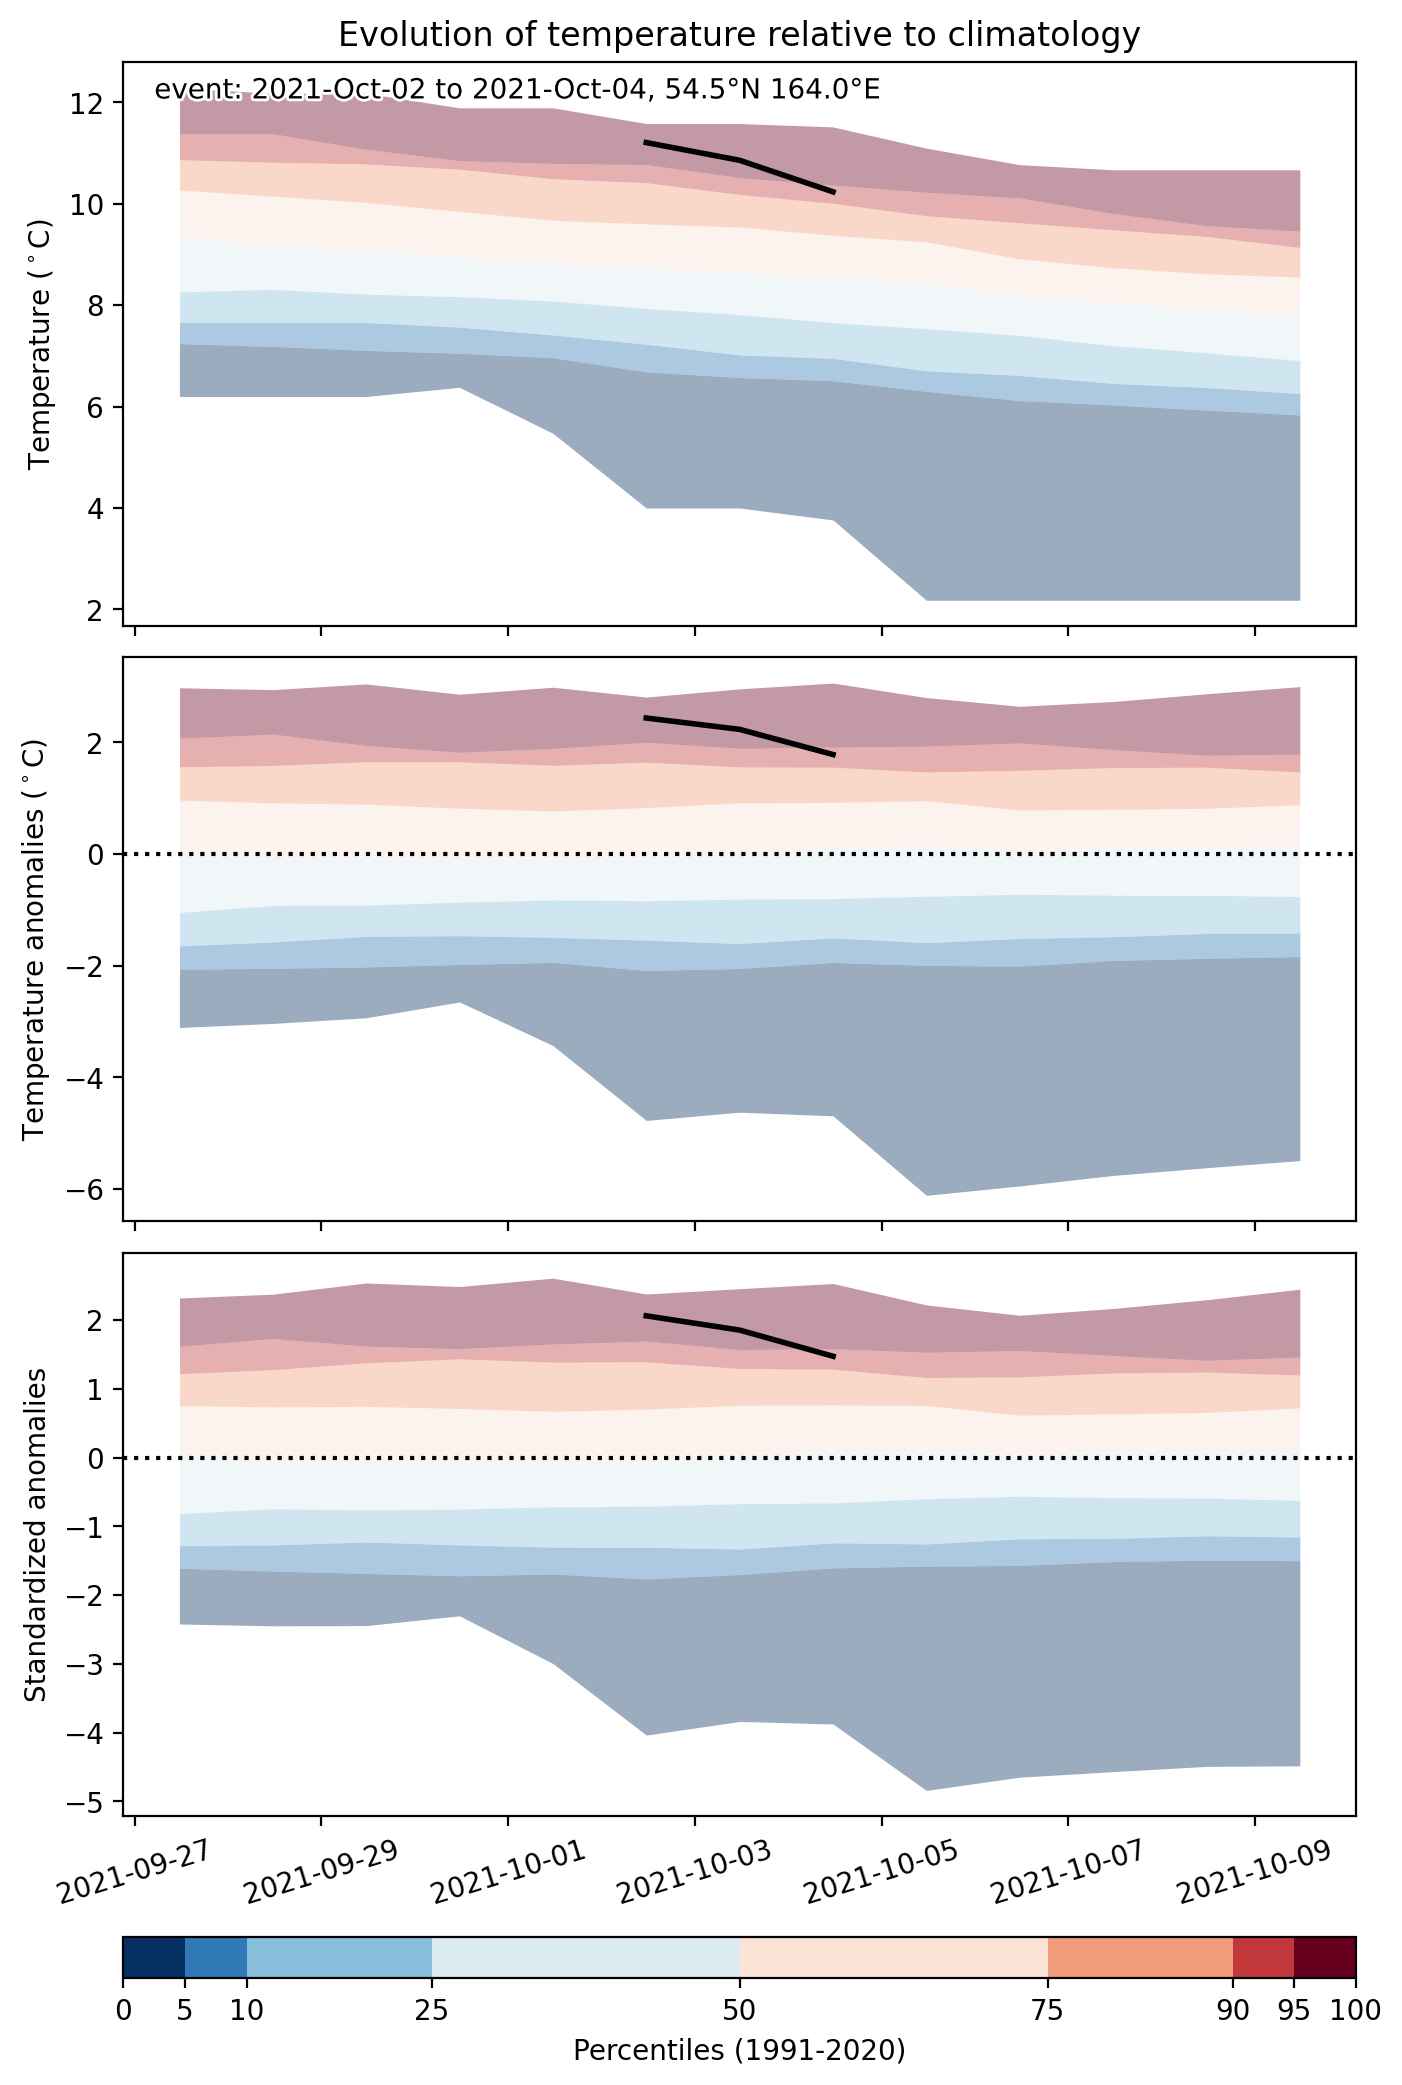
Heat wave occuring from October 02 2021 to October 04 2021 at 54.5°N 164.0°E

Download data: JSON

Event type: Heat wave

Countries affected (identified with ArcGIS Online; provided only for geographical reference):

  • Russian Federation

Duration: 3 days

Time span: October 02 2021 to October 04 2021

Statistics over entire affected area:

  • Mean temperature anomaly: 2.0 °C
  • Mean temperature: 10.3 °C
  • Maximum temperature anomaly: 3.5 °C
  • Maximum temperature: 11.3 °C

Event center: 54.5°N 164.0°E

Area affected: 61378 km$^2$


Fig. 1: Map of most extreme temperature anomalies (standardized) experienced during the event. The purple star indicates the center of the extreme event. Green hatching illustrates all areas under the effect of extremes at some time during the event.


Fig. 2: Evolution of temperature at the center of the event. The climatological percentile distribution is illustrated with color shadings.


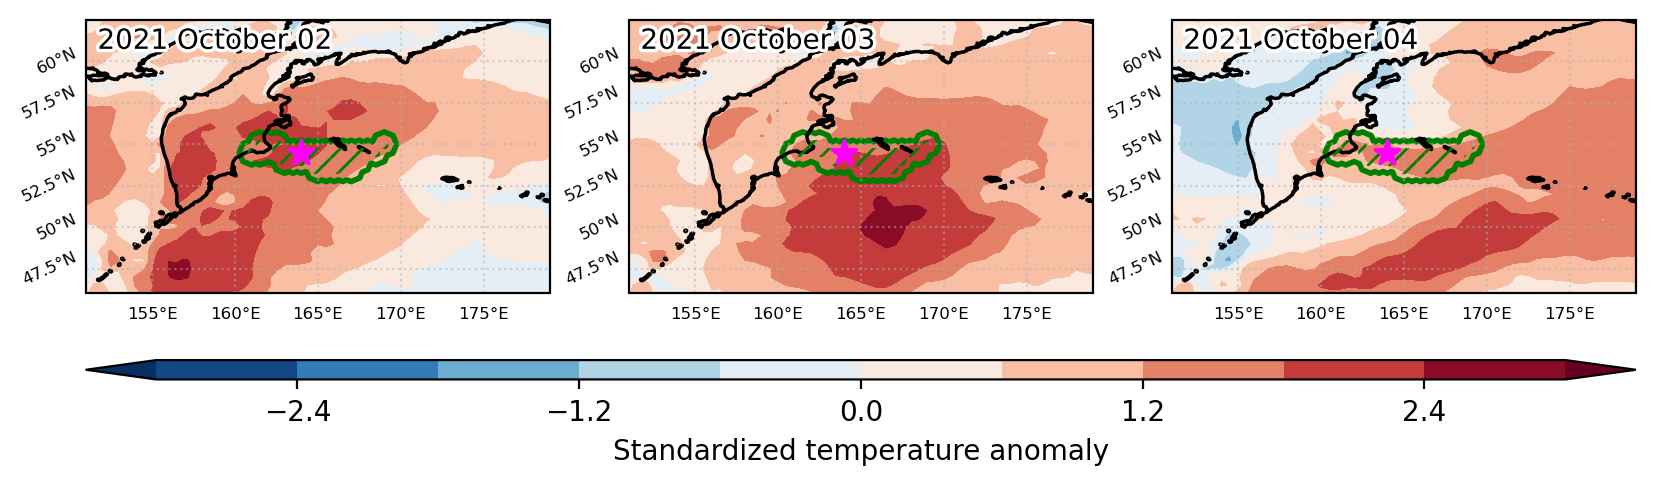
Fig. 3: Maps illustrating the evolution of standardized temperature anomalies during the event.

Event ID: Heat_wave_2021-Oct-02_to_2021-Oct-04_164.0_54.5

Heat wave occuring from September 28 2021 to October 03 2021 at 53.0°N 156.5°E

Download data: JSON

Event type: Heat wave

Countries affected (identified with ArcGIS Online; provided only for geographical reference):

  • Russian Federation

Duration: 6 days

Time span: September 28 2021 to October 03 2021

Statistics over entire affected area:

  • Mean temperature anomaly: 2.9 °C
  • Mean temperature: 9.6 °C
  • Maximum temperature anomaly: 4.8 °C
  • Maximum temperature: 11.5 °C

Event center: 53.0°N 156.5°E

Area affected: 52581 km$^2$


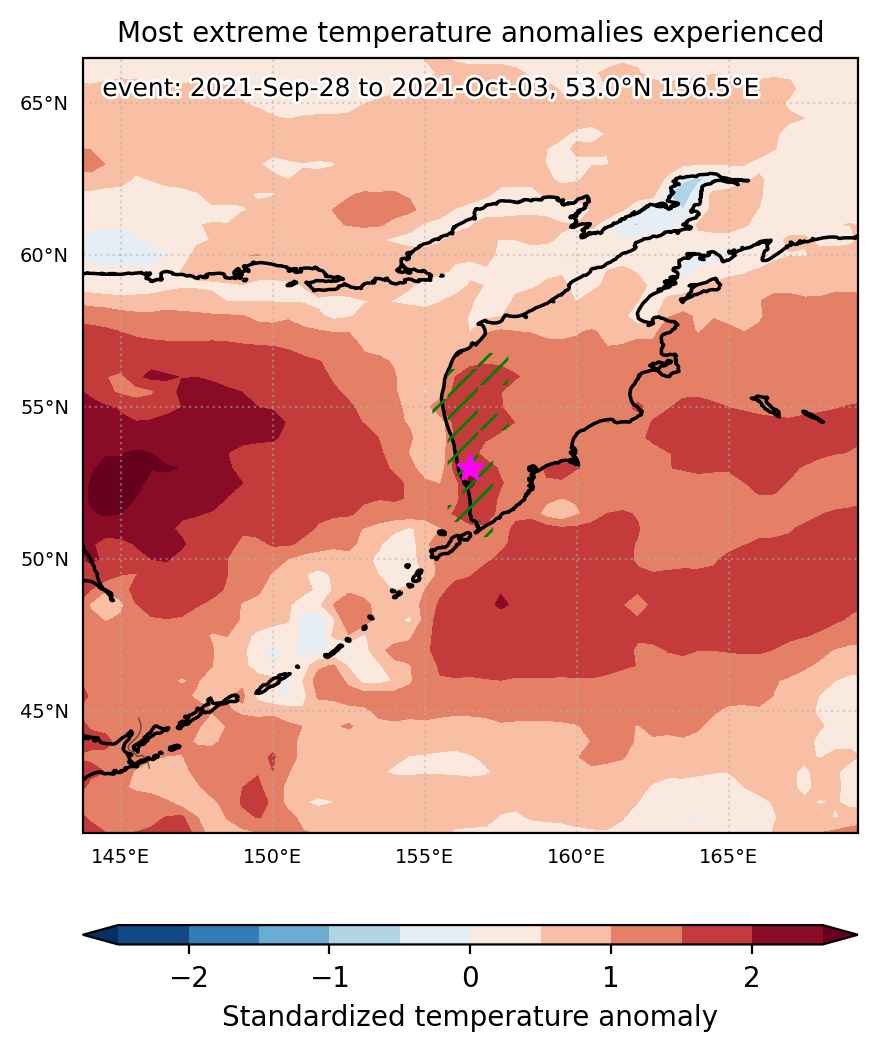
Fig. 1: Map of most extreme temperature anomalies (standardized) experienced during the event. The purple star indicates the center of the extreme event. Green hatching illustrates all areas under the effect of extremes at some time during the event.


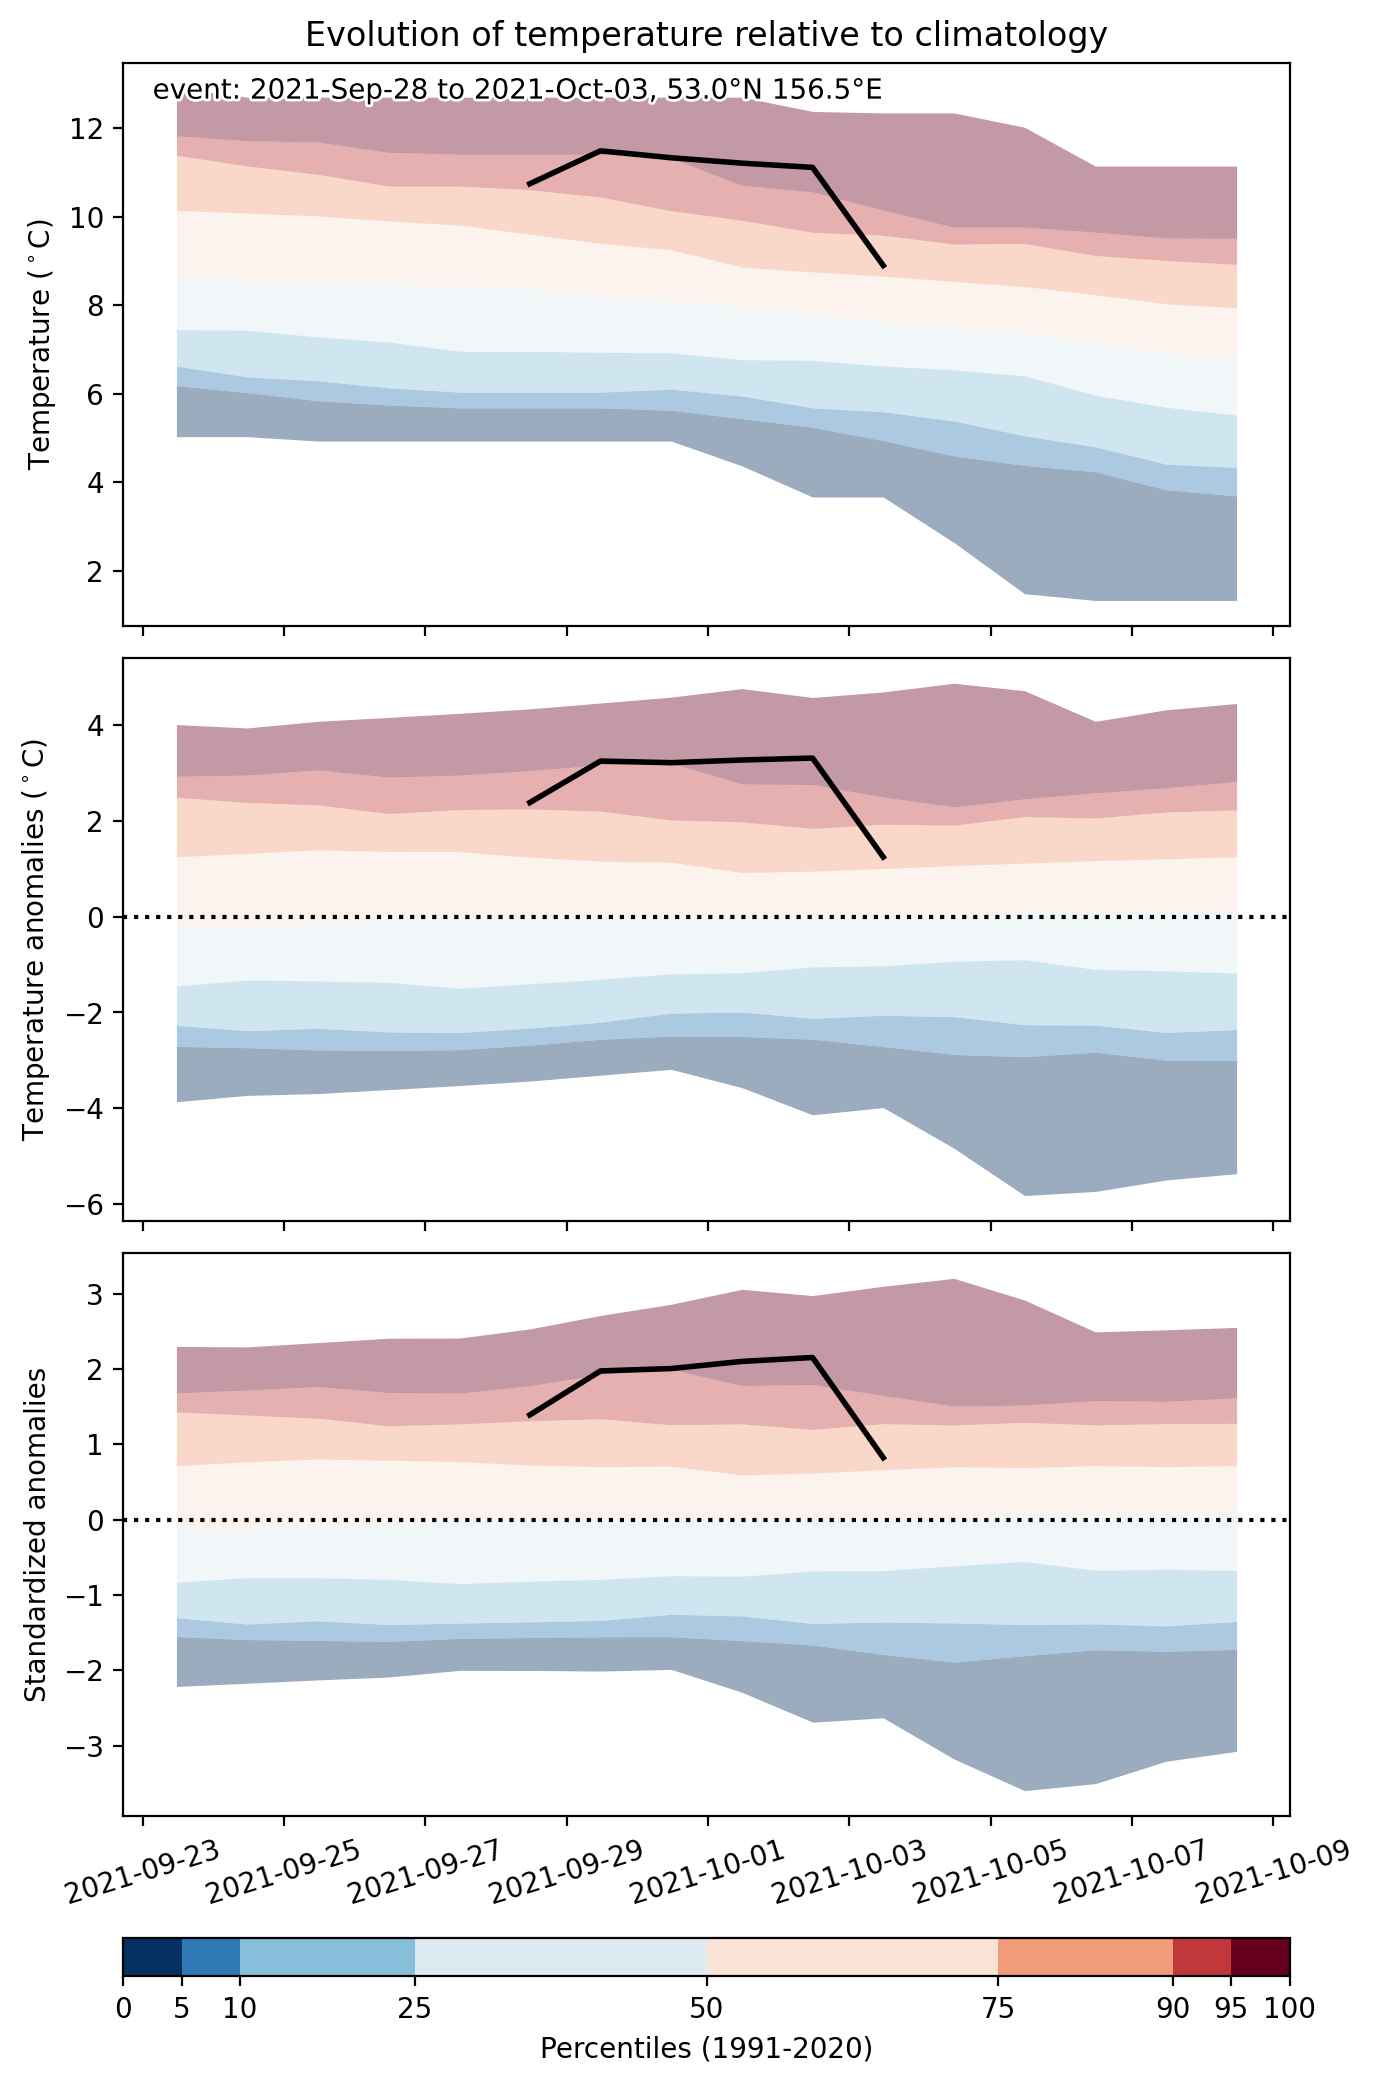
Fig. 2: Evolution of temperature at the center of the event. The climatological percentile distribution is illustrated with color shadings.


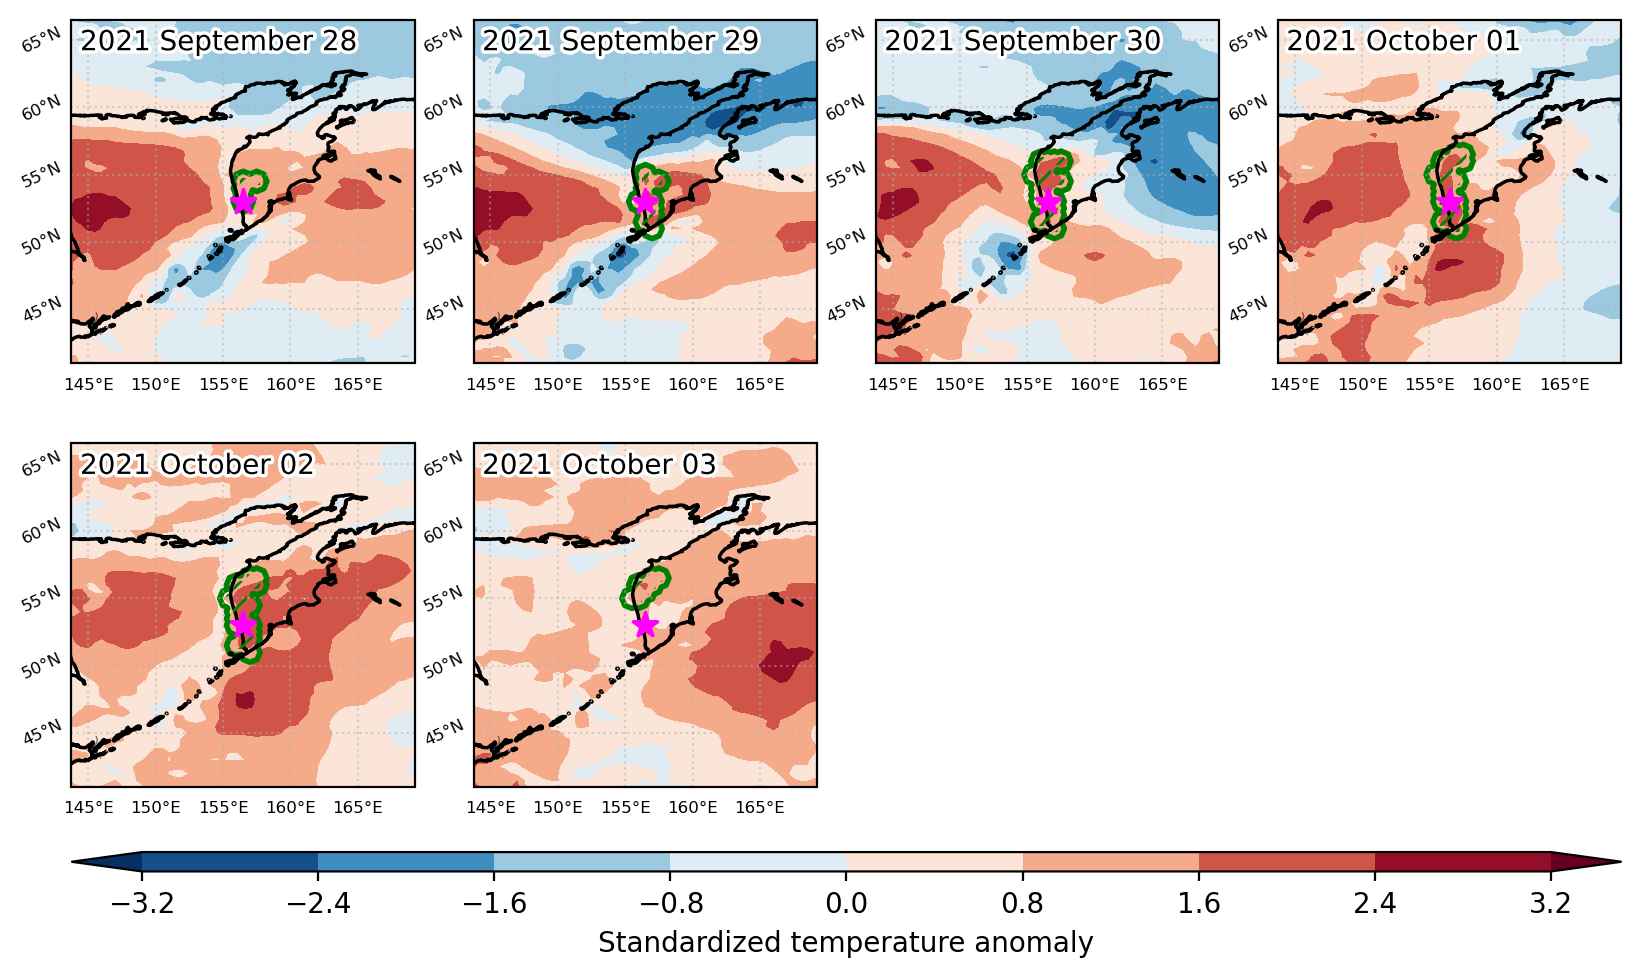
Fig. 3: Maps illustrating the evolution of standardized temperature anomalies during the event.

Event ID: Heat_wave_2021-Sep-28_to_2021-Oct-03_156.5_53.0

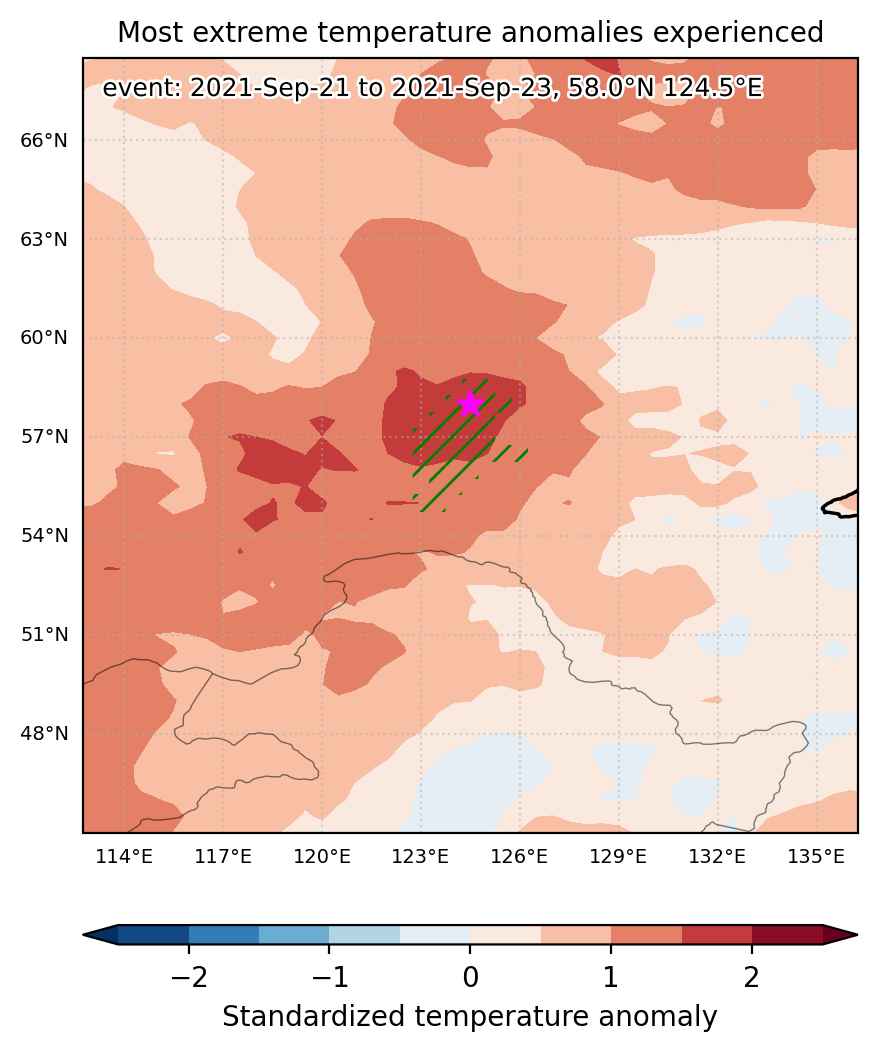
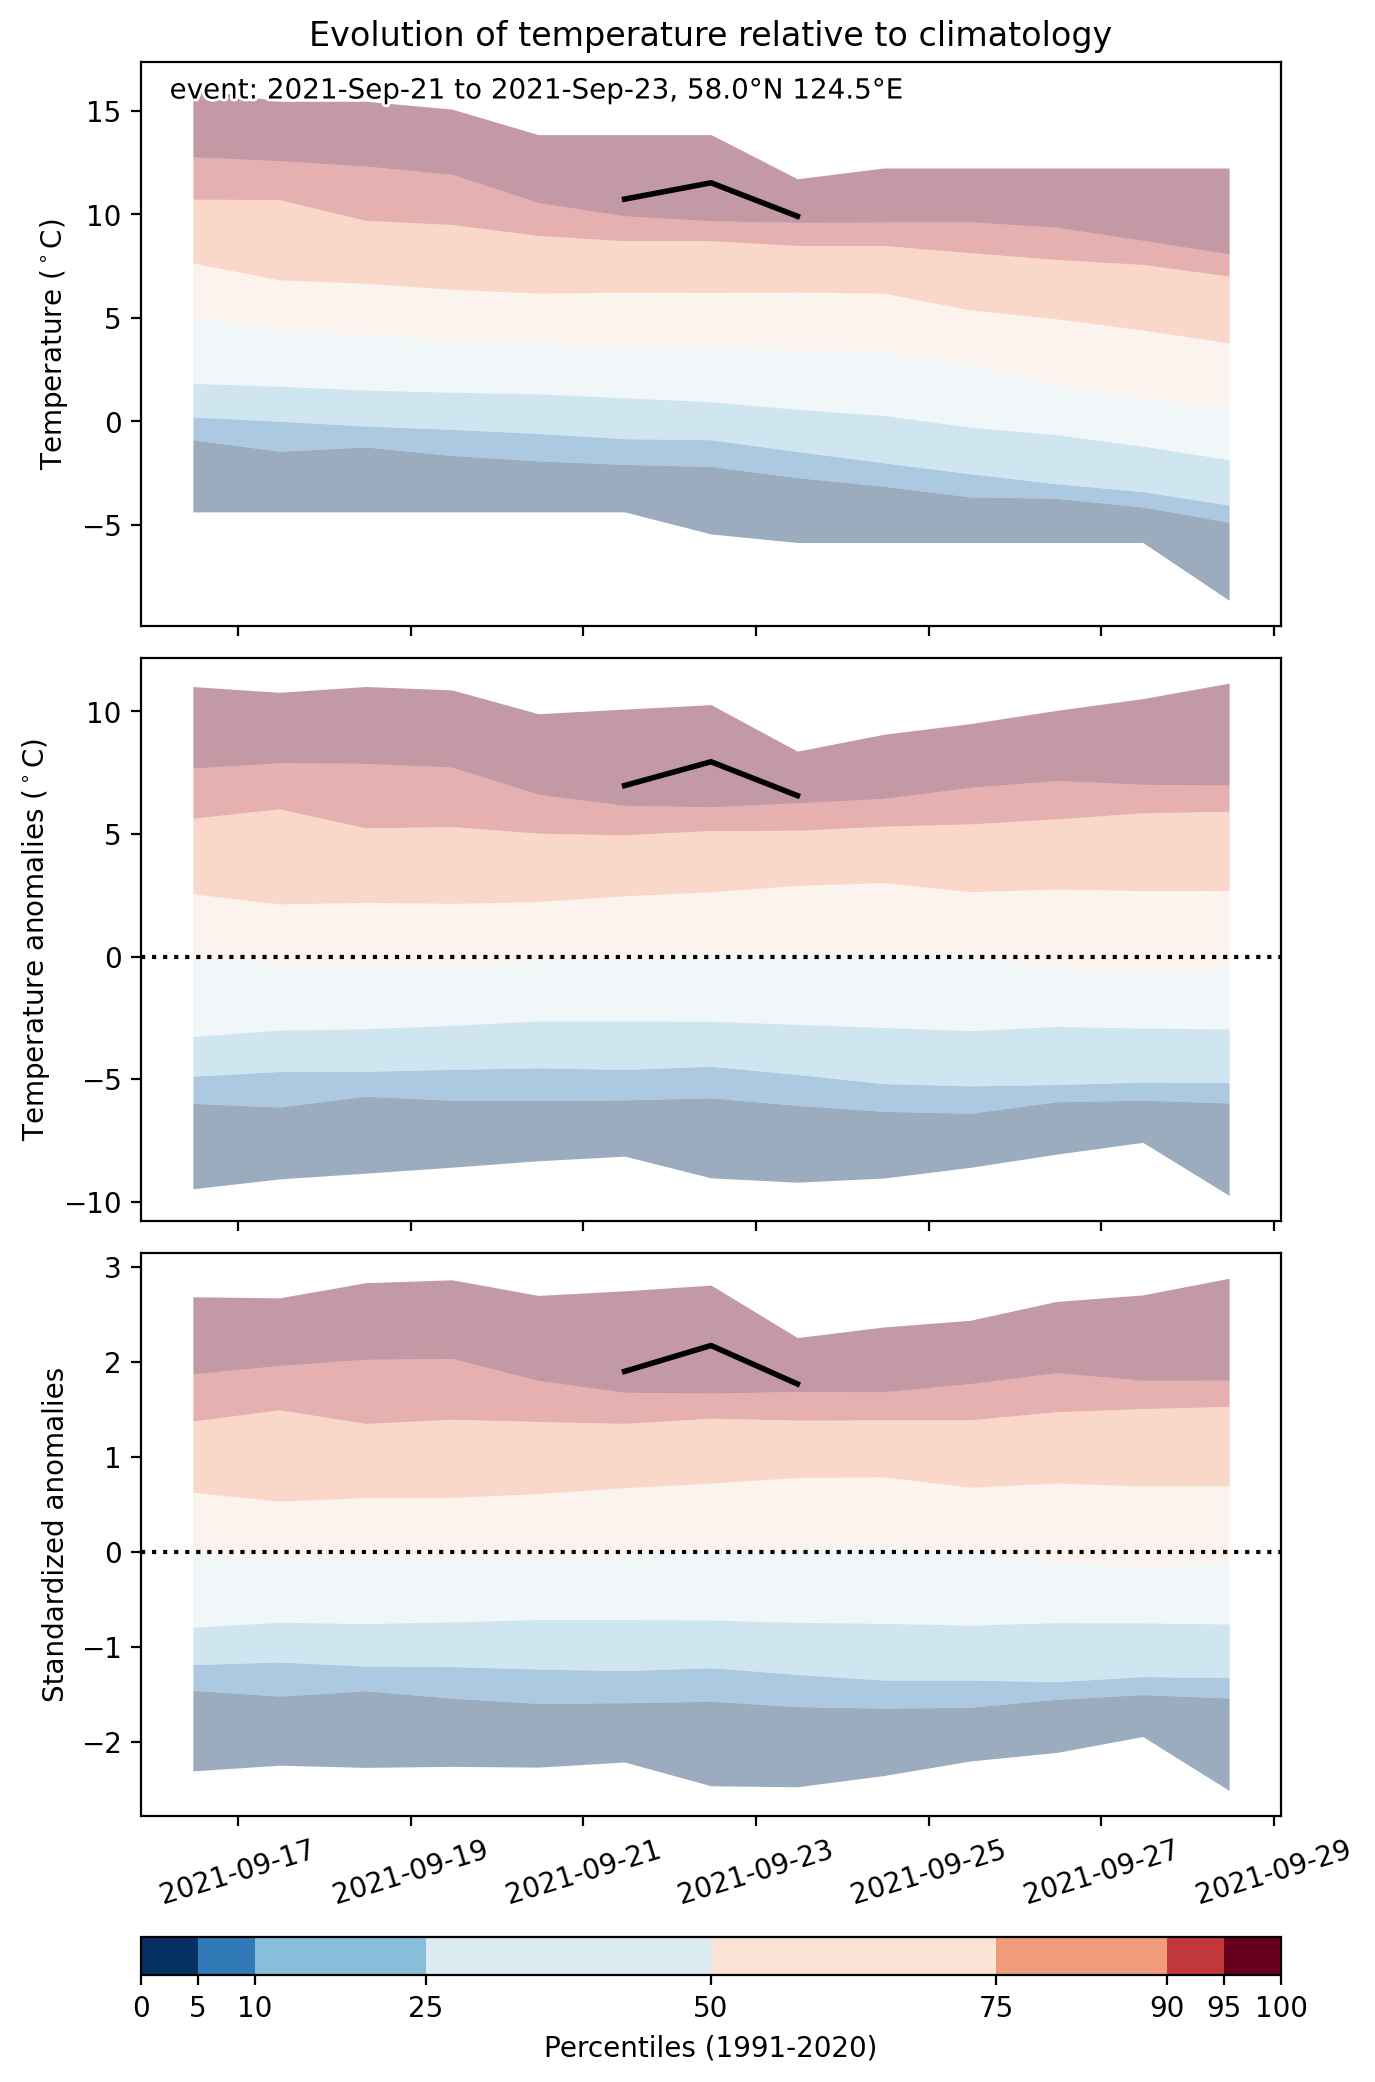
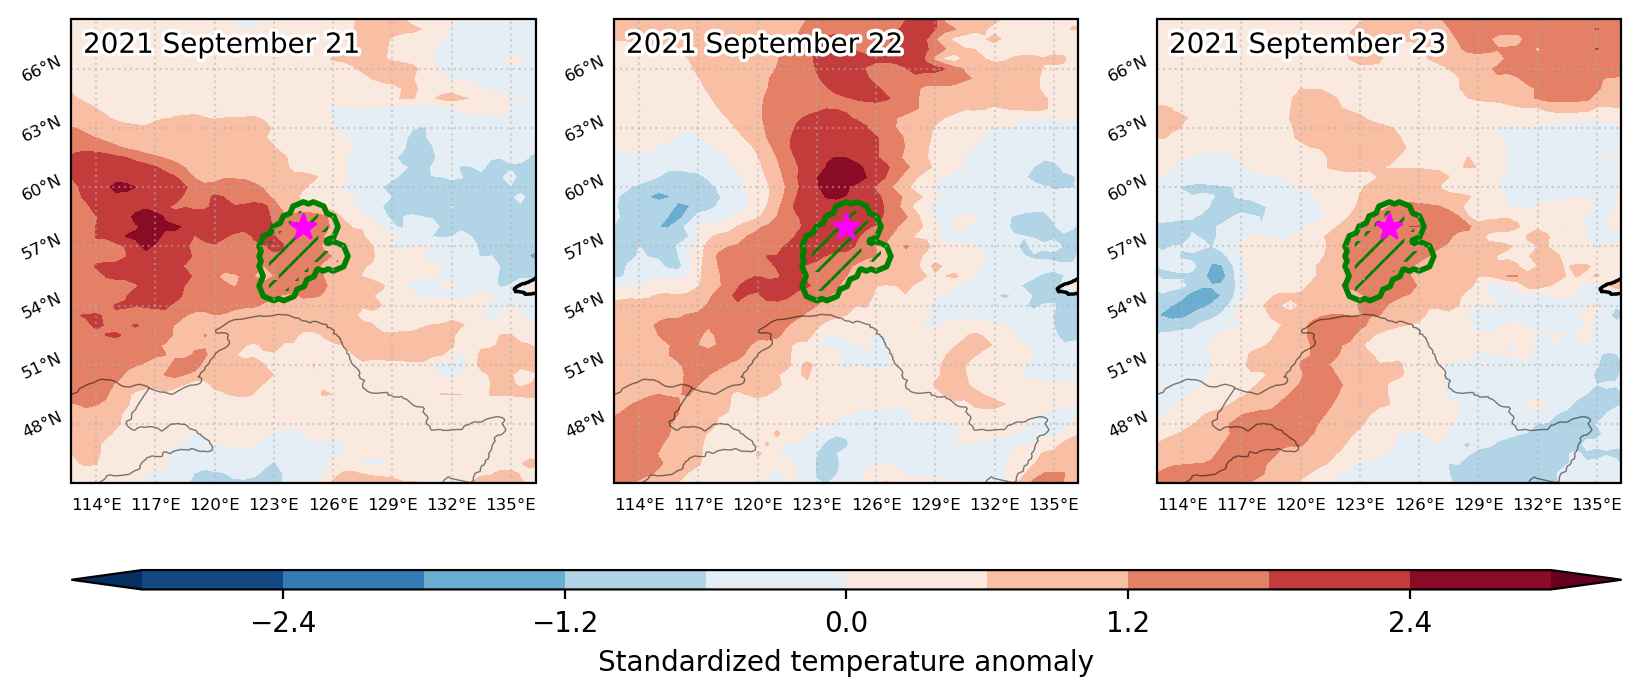
Heat wave occuring from September 21 2021 to September 23 2021 at 58.0°N 124.5°E

Download data: JSON

Event type: Heat wave

Countries affected (identified with ArcGIS Online; provided only for geographical reference):

  • Russian Federation

Duration: 3 days

Time span: September 21 2021 to September 23 2021

Statistics over entire affected area:

  • Mean temperature anomaly: 5.7 °C
  • Mean temperature: 8.6 °C
  • Maximum temperature anomaly: 8.3 °C
  • Maximum temperature: 12.3 °C

Event center: 58.0°N 124.5°E

Area affected: 50747 km$^2$


Fig. 1: Map of most extreme temperature anomalies (standardized) experienced during the event. The purple star indicates the center of the extreme event. Green hatching illustrates all areas under the effect of extremes at some time during the event.


Fig. 2: Evolution of temperature at the center of the event. The climatological percentile distribution is illustrated with color shadings.


Fig. 3: Maps illustrating the evolution of standardized temperature anomalies during the event.

Event ID: Heat_wave_2021-Sep-21_to_2021-Sep-23_124.5_58.0

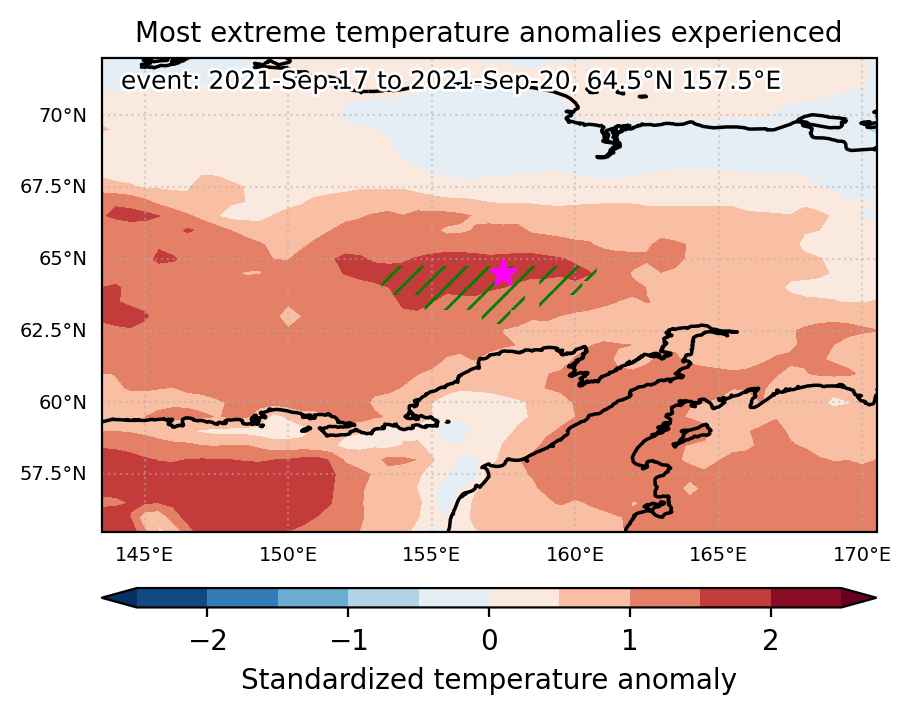
Heat wave occuring from September 17 2021 to September 20 2021 at 64.5°N 157.5°E

Download data: JSON

Event type: Heat wave

Countries affected (identified with ArcGIS Online; provided only for geographical reference):

  • Russian Federation

Duration: 4 days

Time span: September 17 2021 to September 20 2021

Statistics over entire affected area:

  • Mean temperature anomaly: 5.1 °C
  • Mean temperature: 6.6 °C
  • Maximum temperature anomaly: 6.3 °C
  • Maximum temperature: 9.7 °C

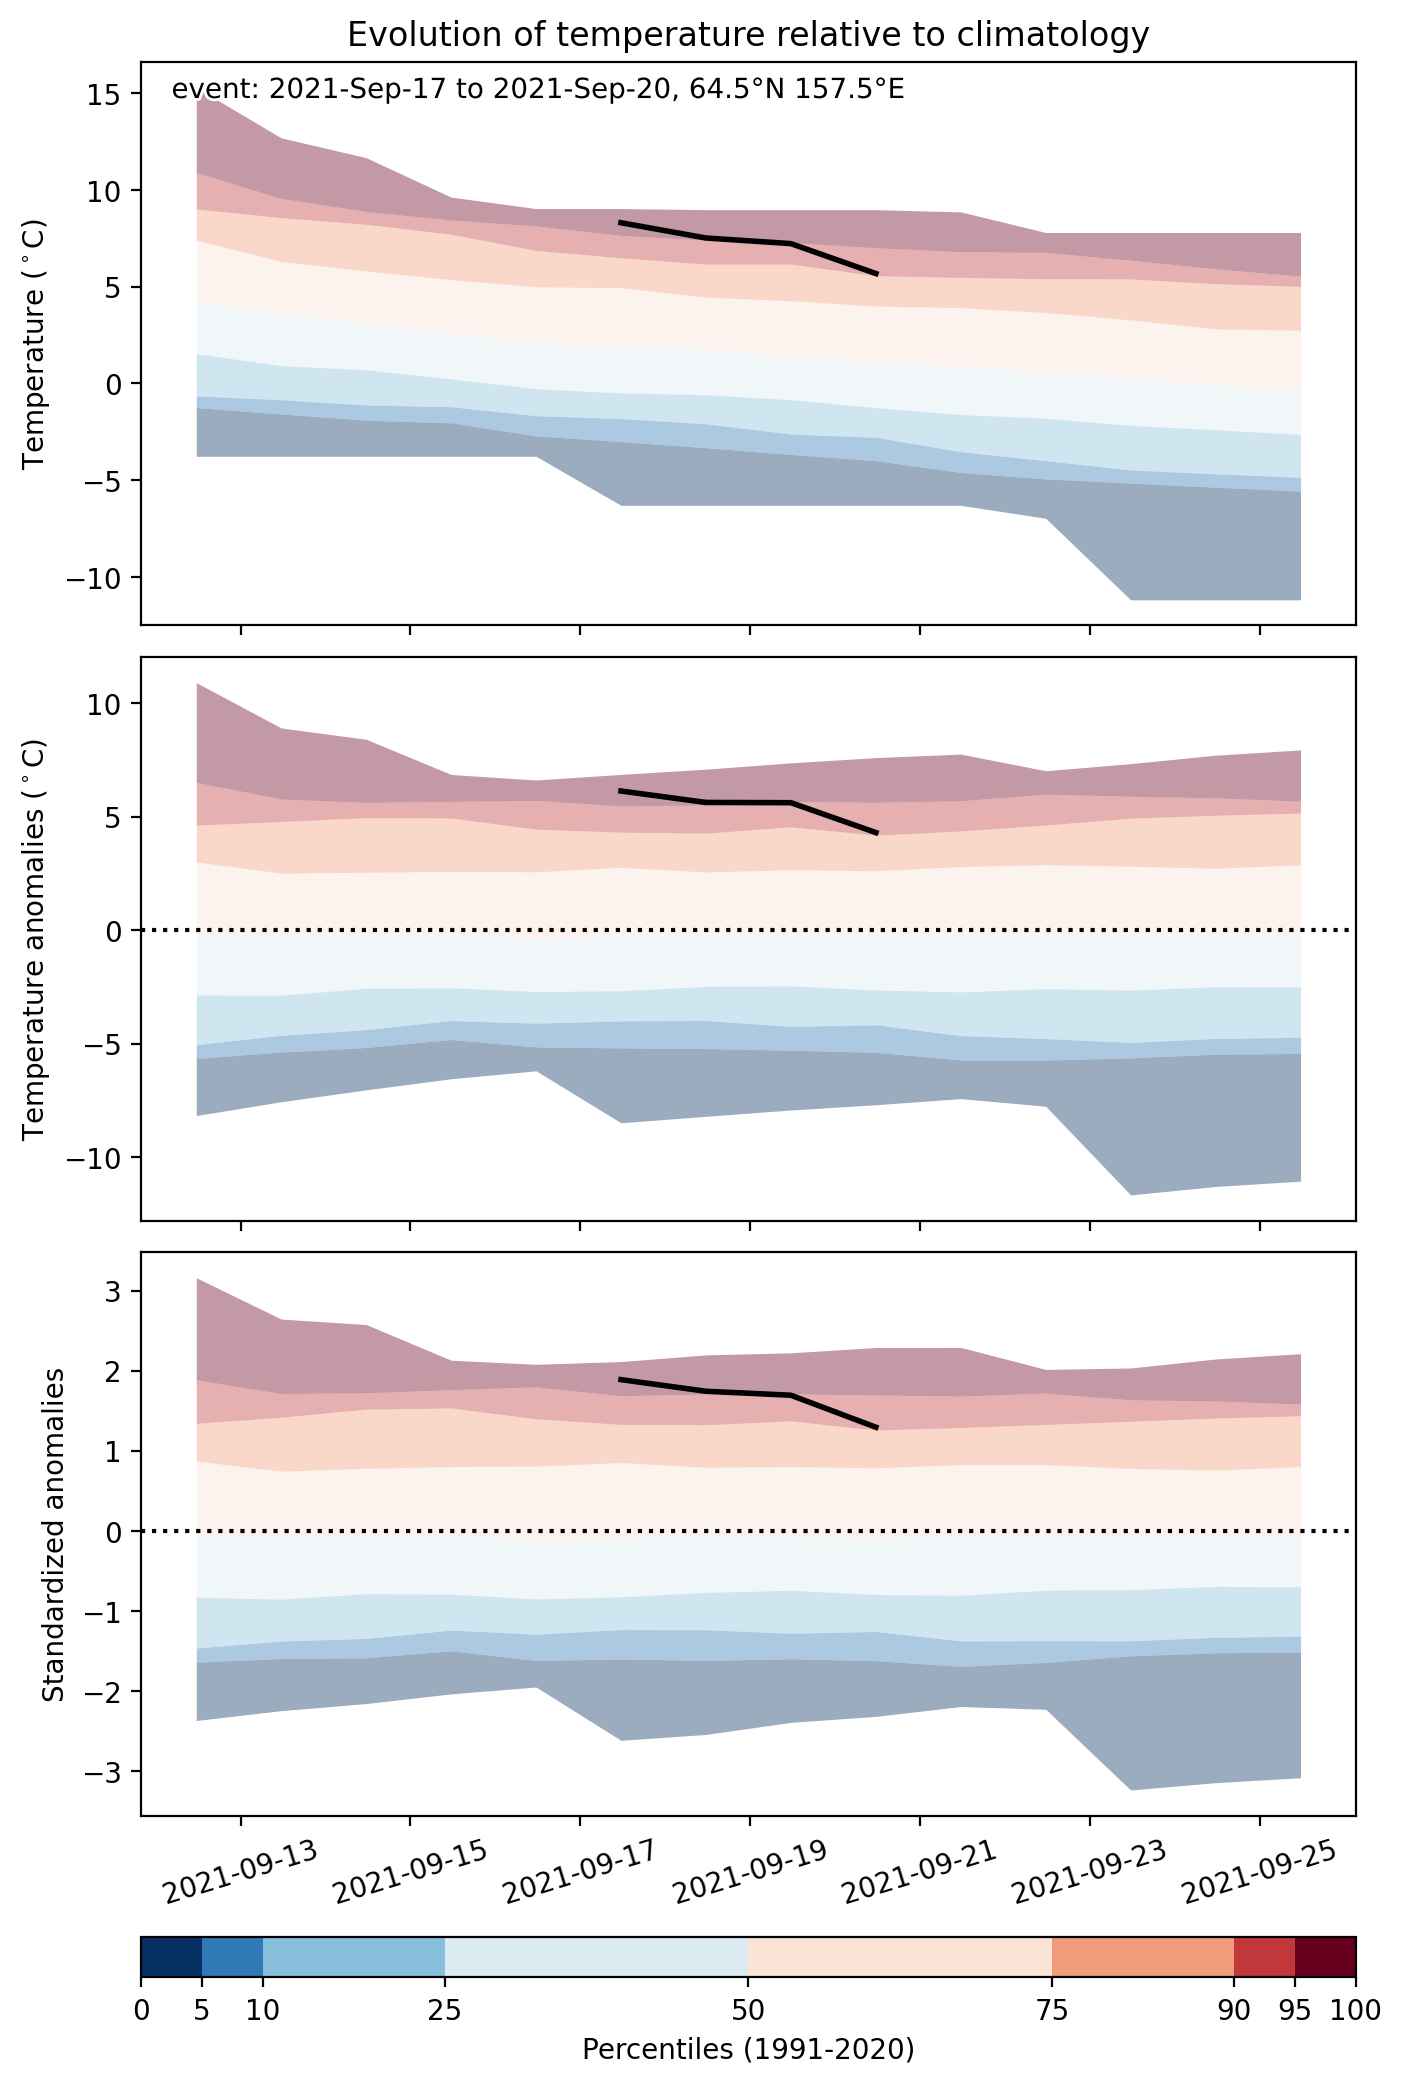
Event center: 64.5°N 157.5°E

Area affected: 51417 km$^2$


Fig. 1: Map of most extreme temperature anomalies (standardized) experienced during the event. The purple star indicates the center of the extreme event. Green hatching illustrates all areas under the effect of extremes at some time during the event.


Fig. 2: Evolution of temperature at the center of the event. The climatological percentile distribution is illustrated with color shadings.


Fig. 3: Maps illustrating the evolution of standardized temperature anomalies during the event.

Event ID: Heat_wave_2021-Sep-17_to_2021-Sep-20_157.5_64.5