Heat wave occuring from October 11 2015 to October 16 2015 at 32.0°N 263.5°E

Download data: JSON

Event type: Heat wave

Countries affected (identified with ArcGIS Online; provided only for geographical reference):

  • United States

Duration: 6 days

Time span: October 11 2015 to October 16 2015

Statistics over entire affected area:

  • Mean temperature anomaly: 5.4 °C
  • Mean temperature: 26.0 °C
  • Maximum temperature anomaly: 8.5 °C
  • Maximum temperature: 30.6 °C

Event center: 32.0°N 263.5°E

Area affected: 119045 km$^2$
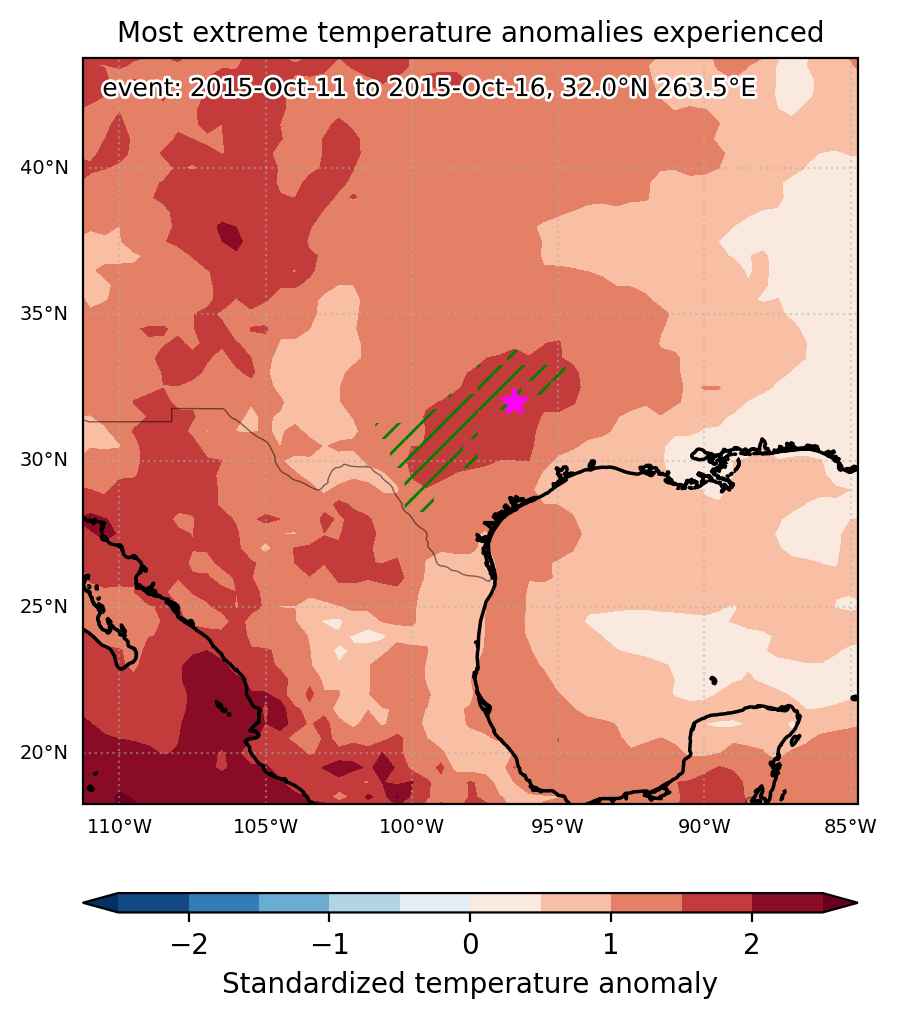

Fig. 1: Map of most extreme temperature anomalies (standardized) experienced during the event. The purple star indicates the center of the extreme event. Green hatching illustrates all areas under the effect of extremes at some time during the event.
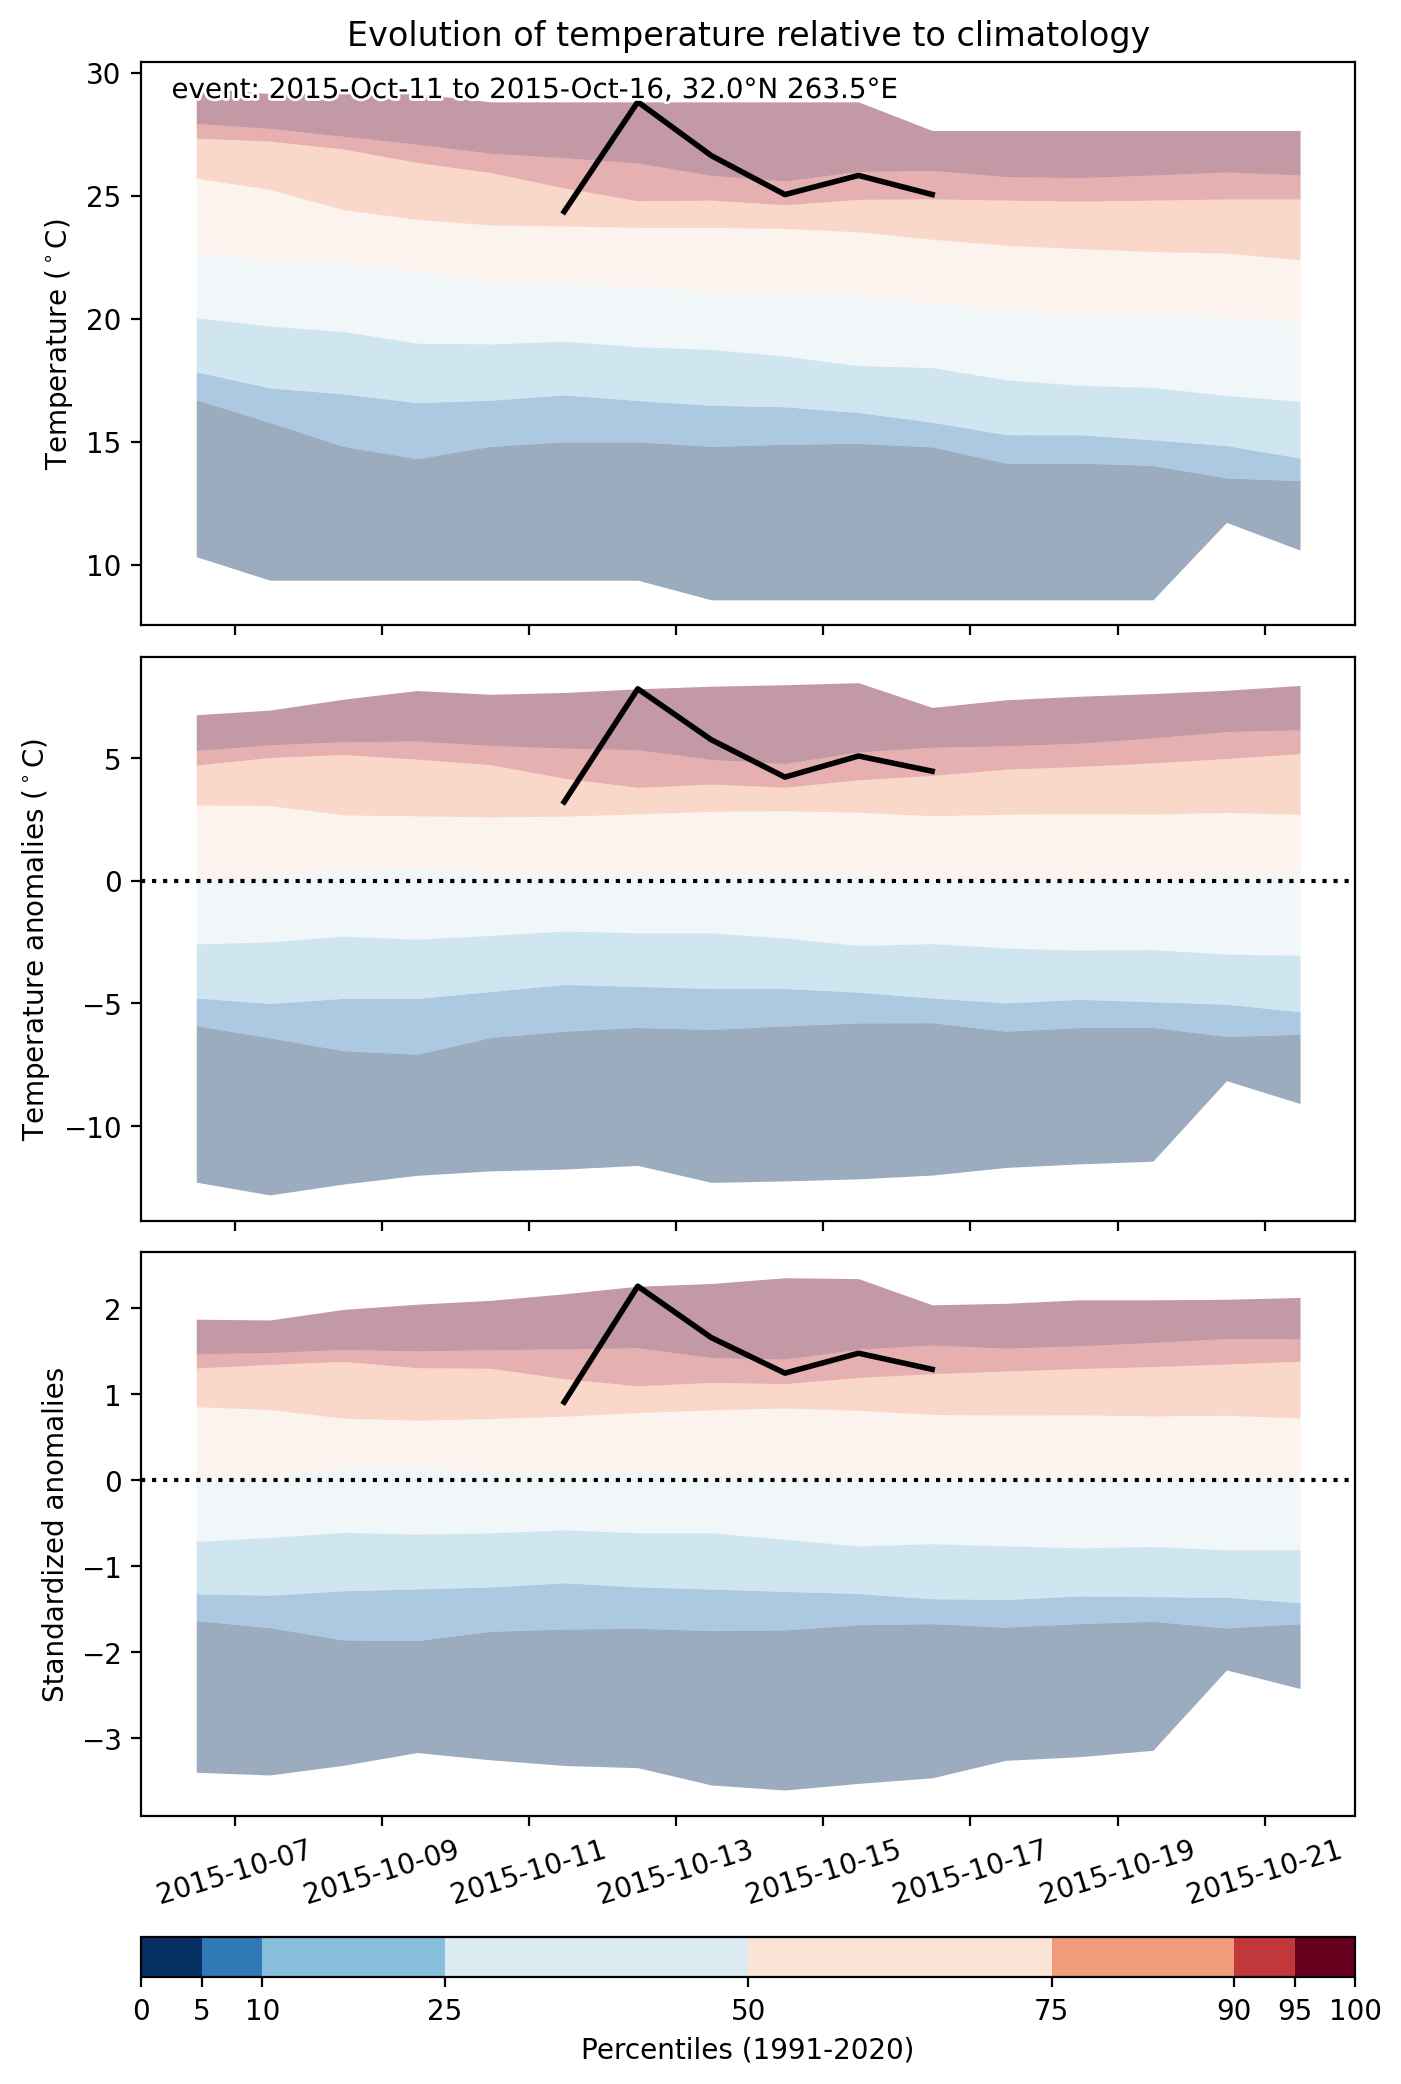


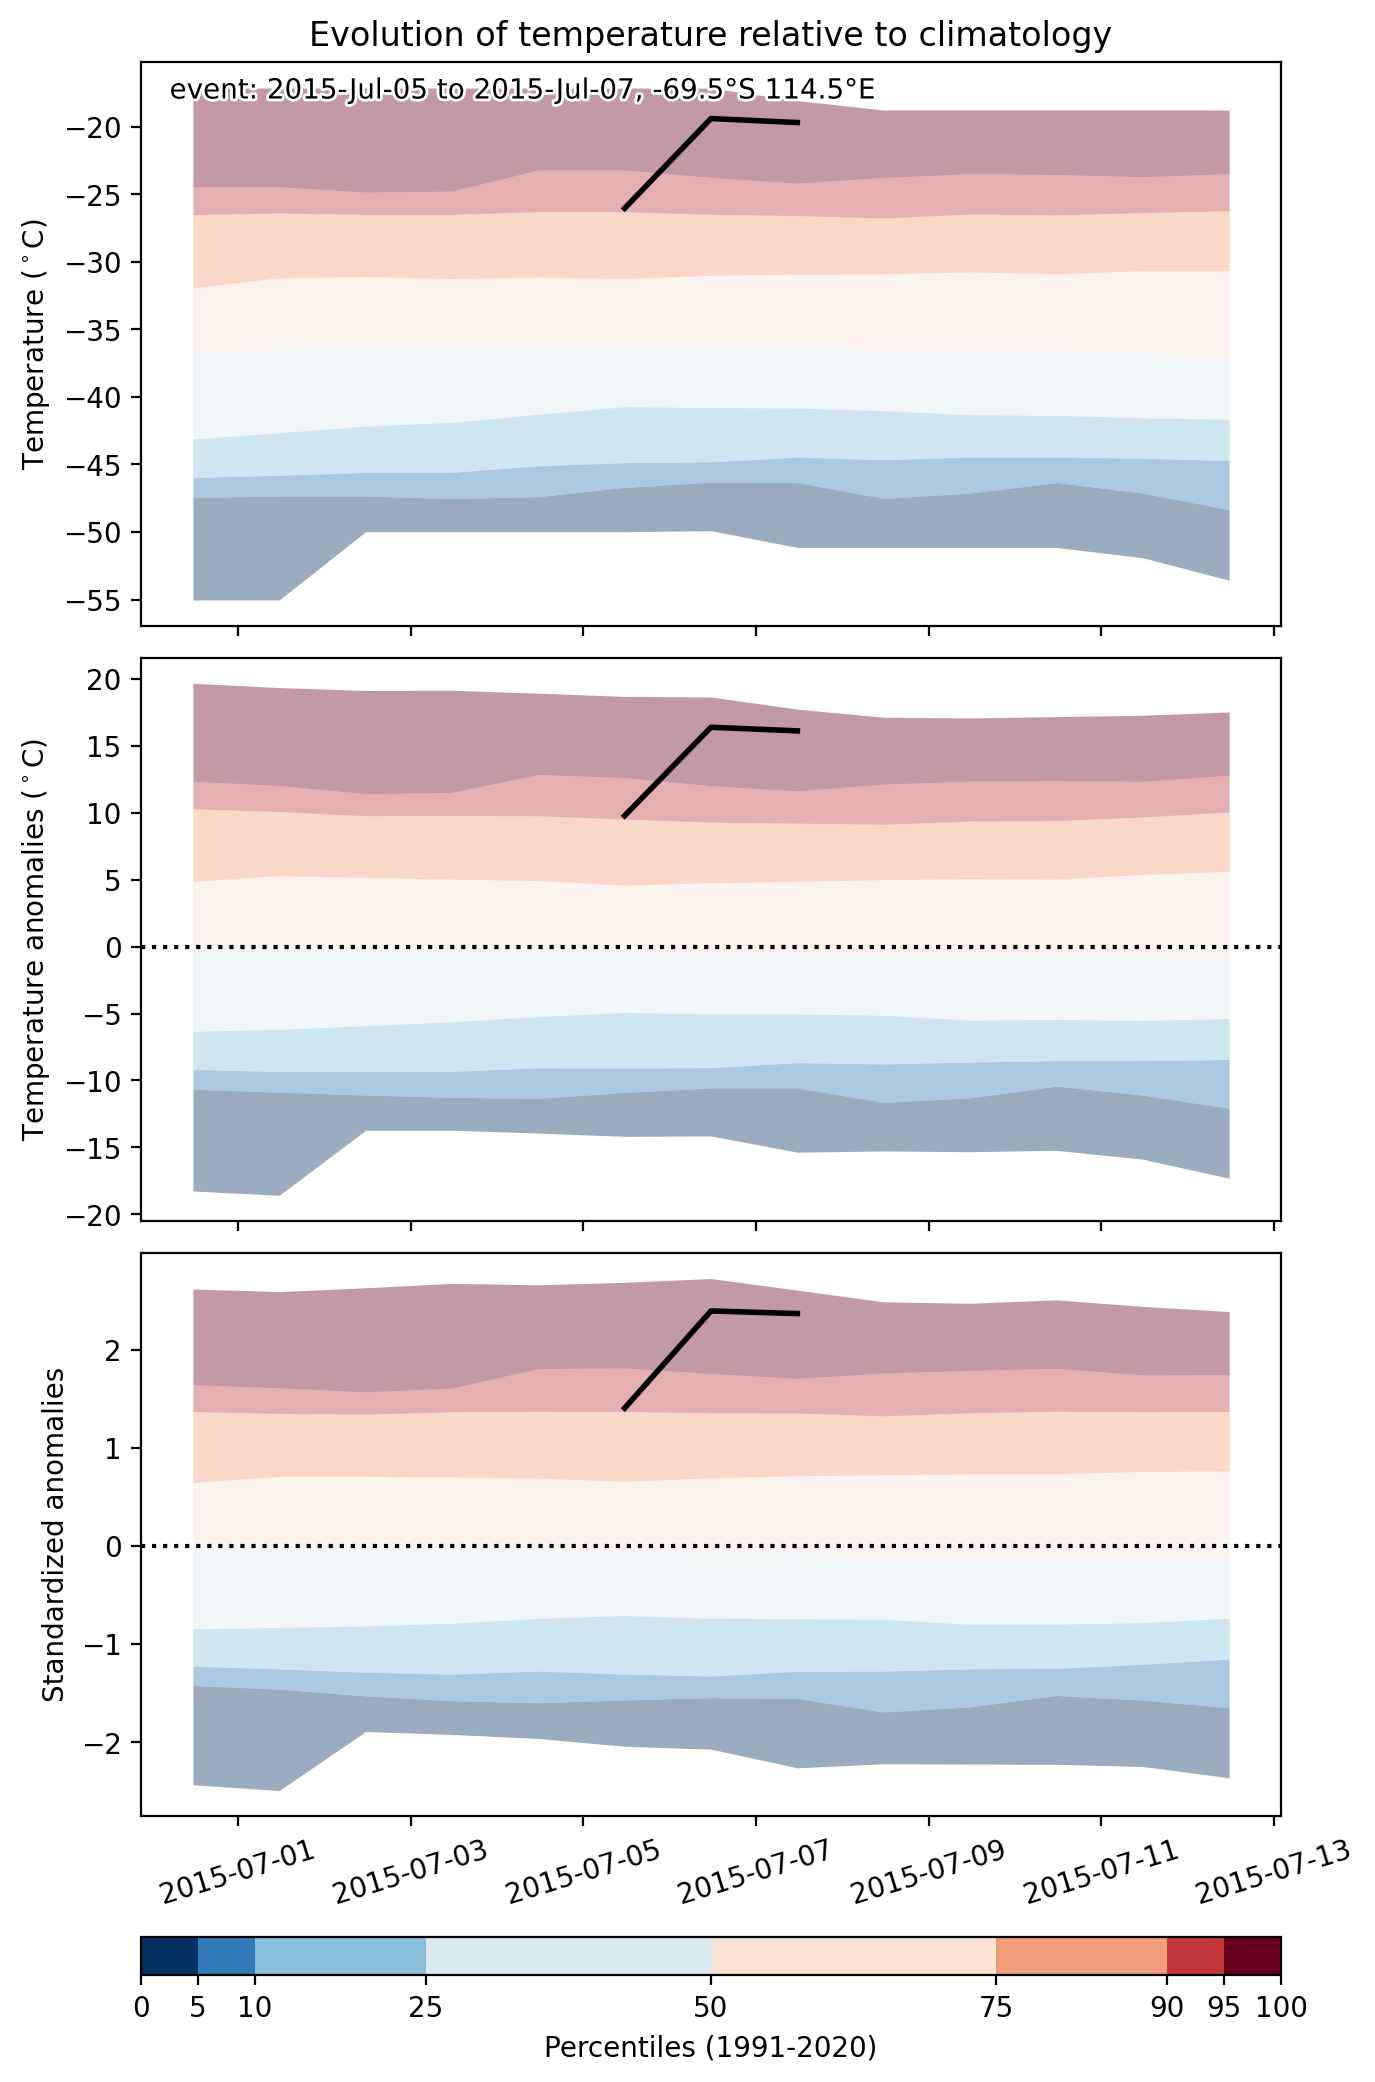
Fig. 2: Evolution of temperature at the center of the event. The climatological percentile distribution is illustrated with color shadings.
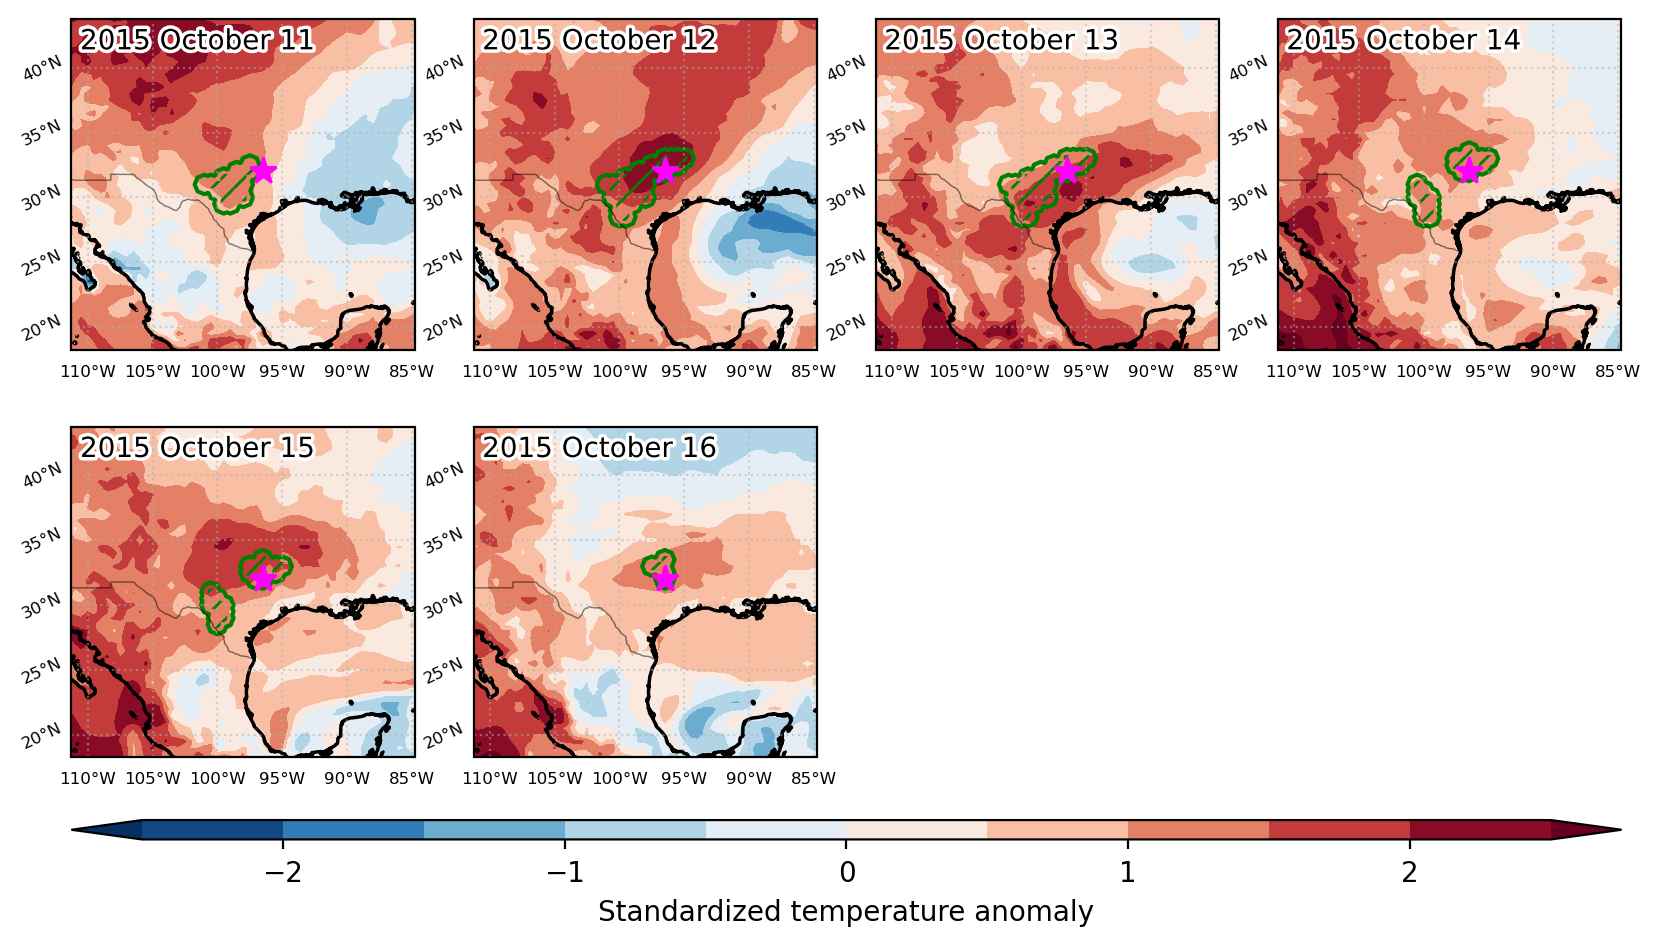


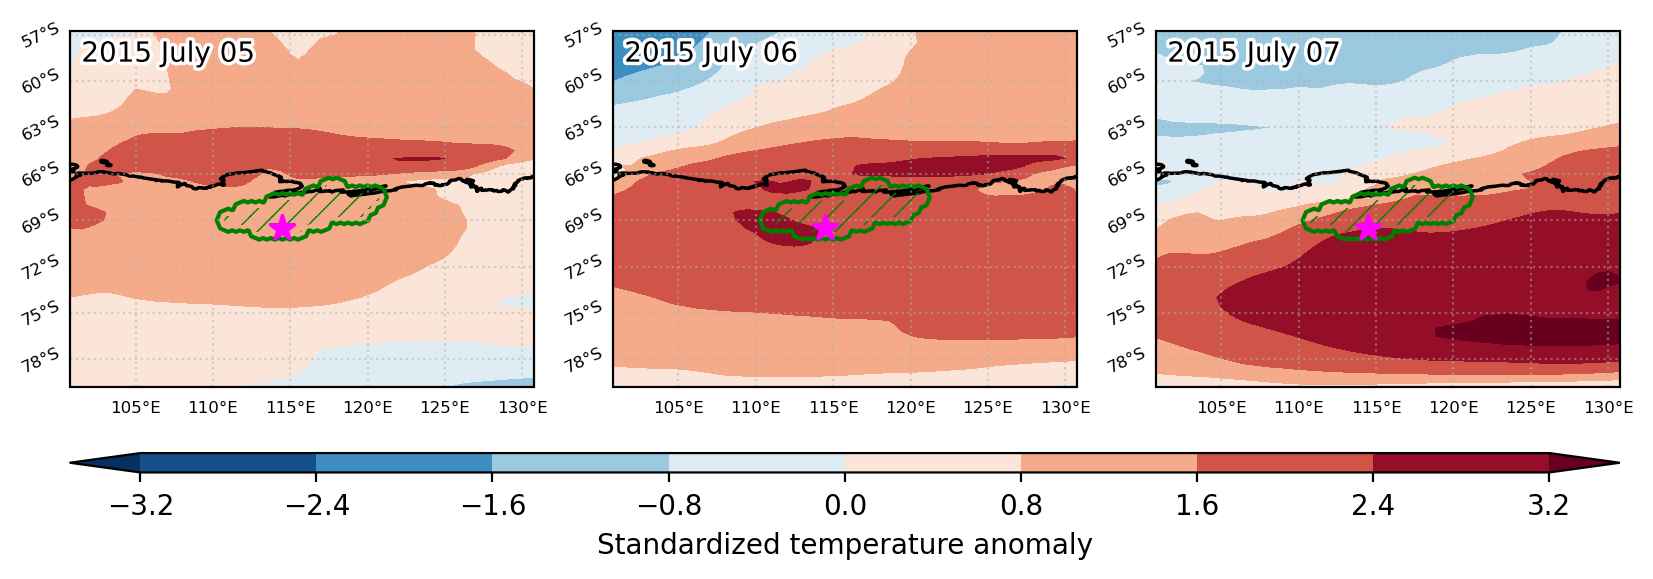
Fig. 3: Maps illustrating the evolution of standardized temperature anomalies during the event.

Event ID: Heat_wave_2015-Oct-11_to_2015-Oct-16_263.5_32.0
Heat wave occuring from July 05 2015 to July 07 2015 at -69.5°S 114.5°E

Download data: JSON

Event type: Heat wave

Countries affected (identified with ArcGIS Online; provided only for geographical reference):

  • Antarctica

Duration: 3 days

Time span: July 05 2015 to July 07 2015

Statistics over entire affected area:

  • Mean temperature anomaly: 11.7 °C
  • Mean temperature: -16.2 °C
  • Maximum temperature anomaly: 16.5 °C
  • Maximum temperature: -4.7 °C

Event center: -69.5°S 114.5°E

Area affected: 67136 km$^2$


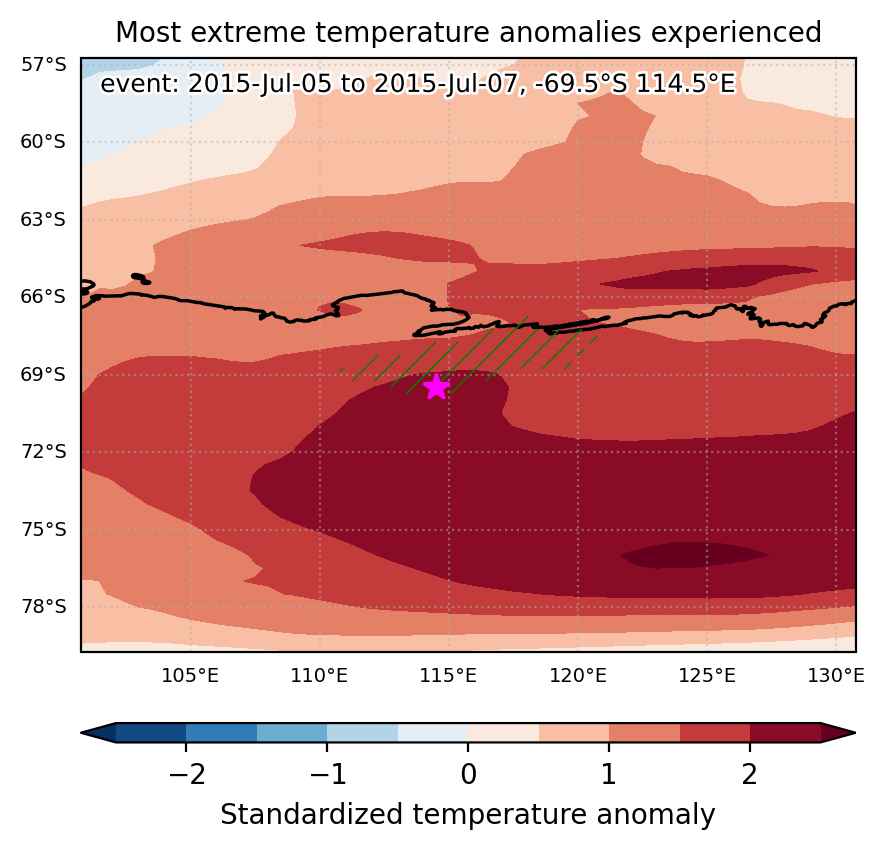
Fig. 1: Map of most extreme temperature anomalies (standardized) experienced during the event. The purple star indicates the center of the extreme event. Green hatching illustrates all areas under the effect of extremes at some time during the event.


Fig. 2: Evolution of temperature at the center of the event. The climatological percentile distribution is illustrated with color shadings.


Fig. 3: Maps illustrating the evolution of standardized temperature anomalies during the event.

Event ID: Heat_wave_2015-Jul-05_to_2015-Jul-07_114.5_-69.5

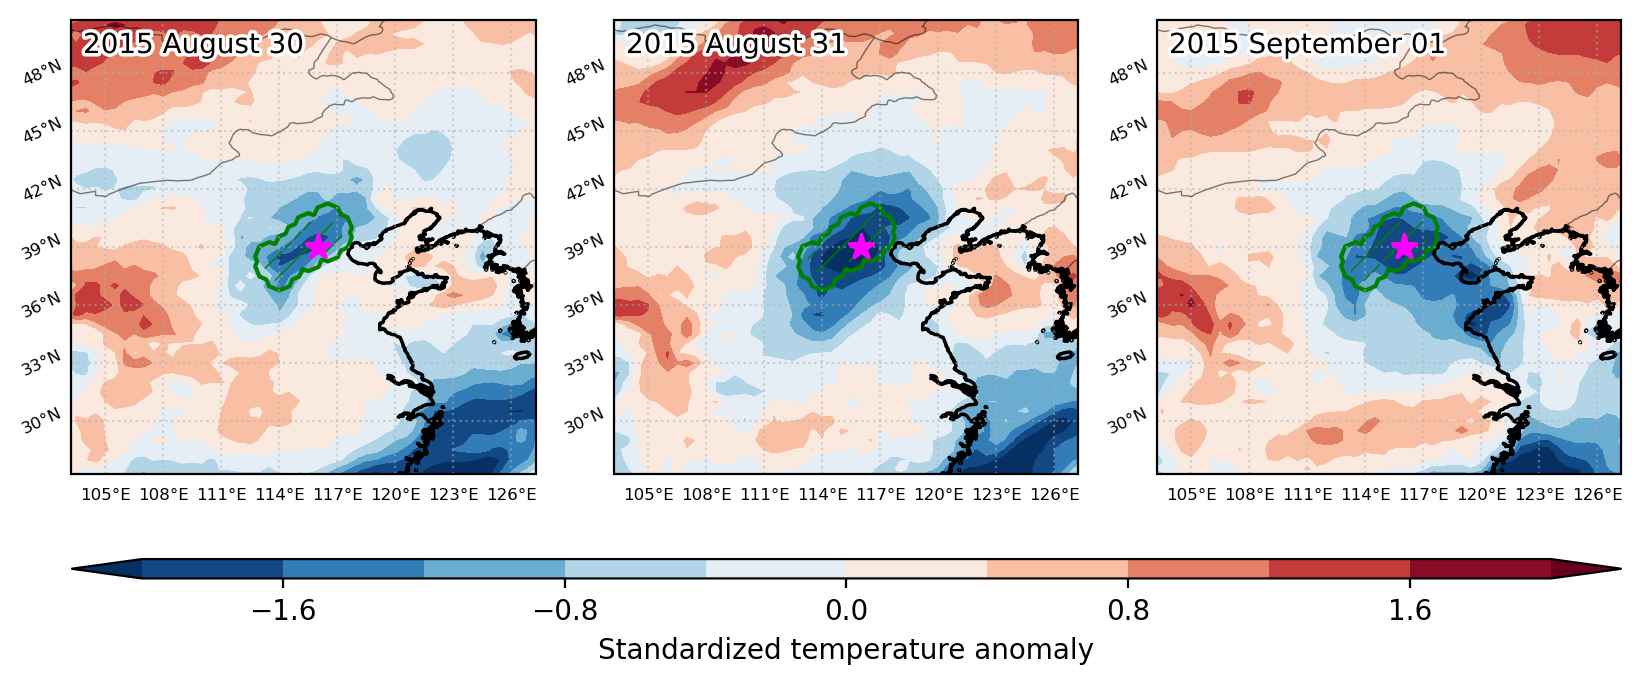
Cold spell occuring from August 30 2015 to September 01 2015 at 39.0°N 116.0°E

Download data: JSON

Event type: Cold spell

Countries affected (identified with ArcGIS Online; provided only for geographical reference):

  • China

Duration: 3 days

Time span: August 30 2015 to September 01 2015

Statistics over entire affected area:

  • Mean temperature anomaly: -3.7 °C
  • Mean temperature: 18.7 °C
  • Minimum temperature anomaly: -5.2 °C
  • Minimum temperature: 14.4 °C

Event center: 39.0°N 116.0°E

Area affected: 57614 km$^2$


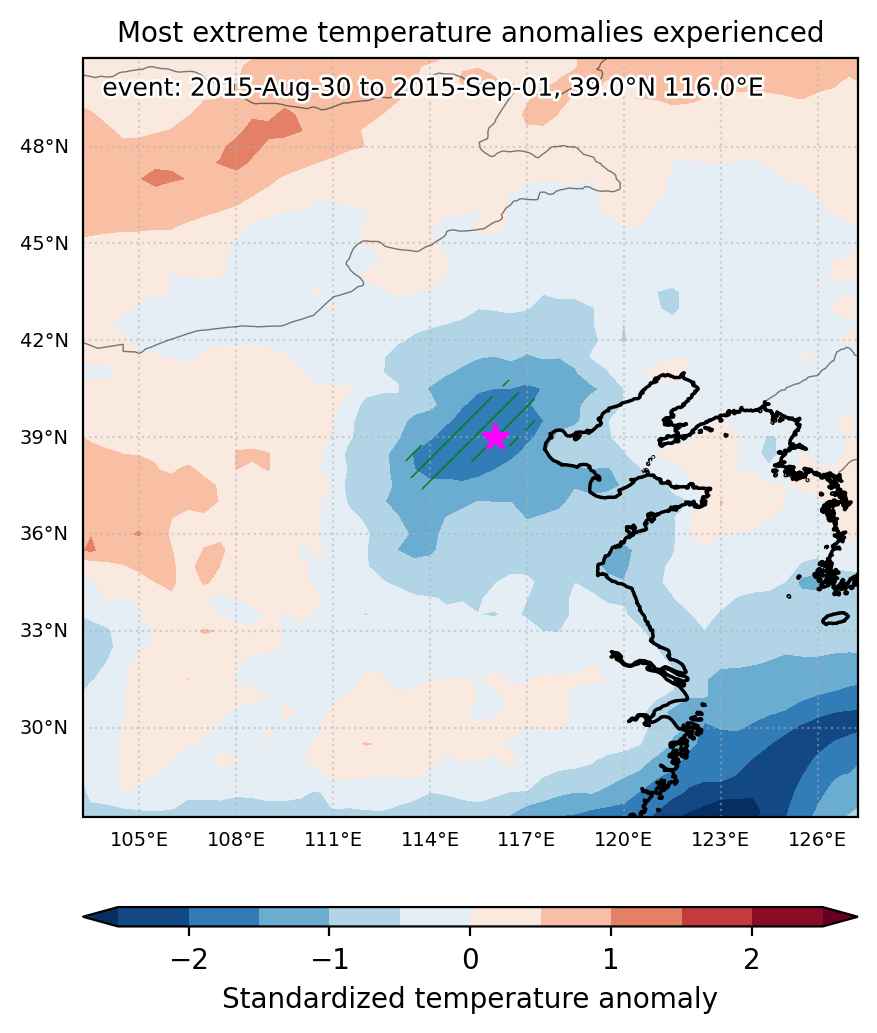
Fig. 1: Map of most extreme temperature anomalies (standardized) experienced during the event. The purple star indicates the center of the extreme event. Green hatching illustrates all areas under the effect of extremes at some time during the event.


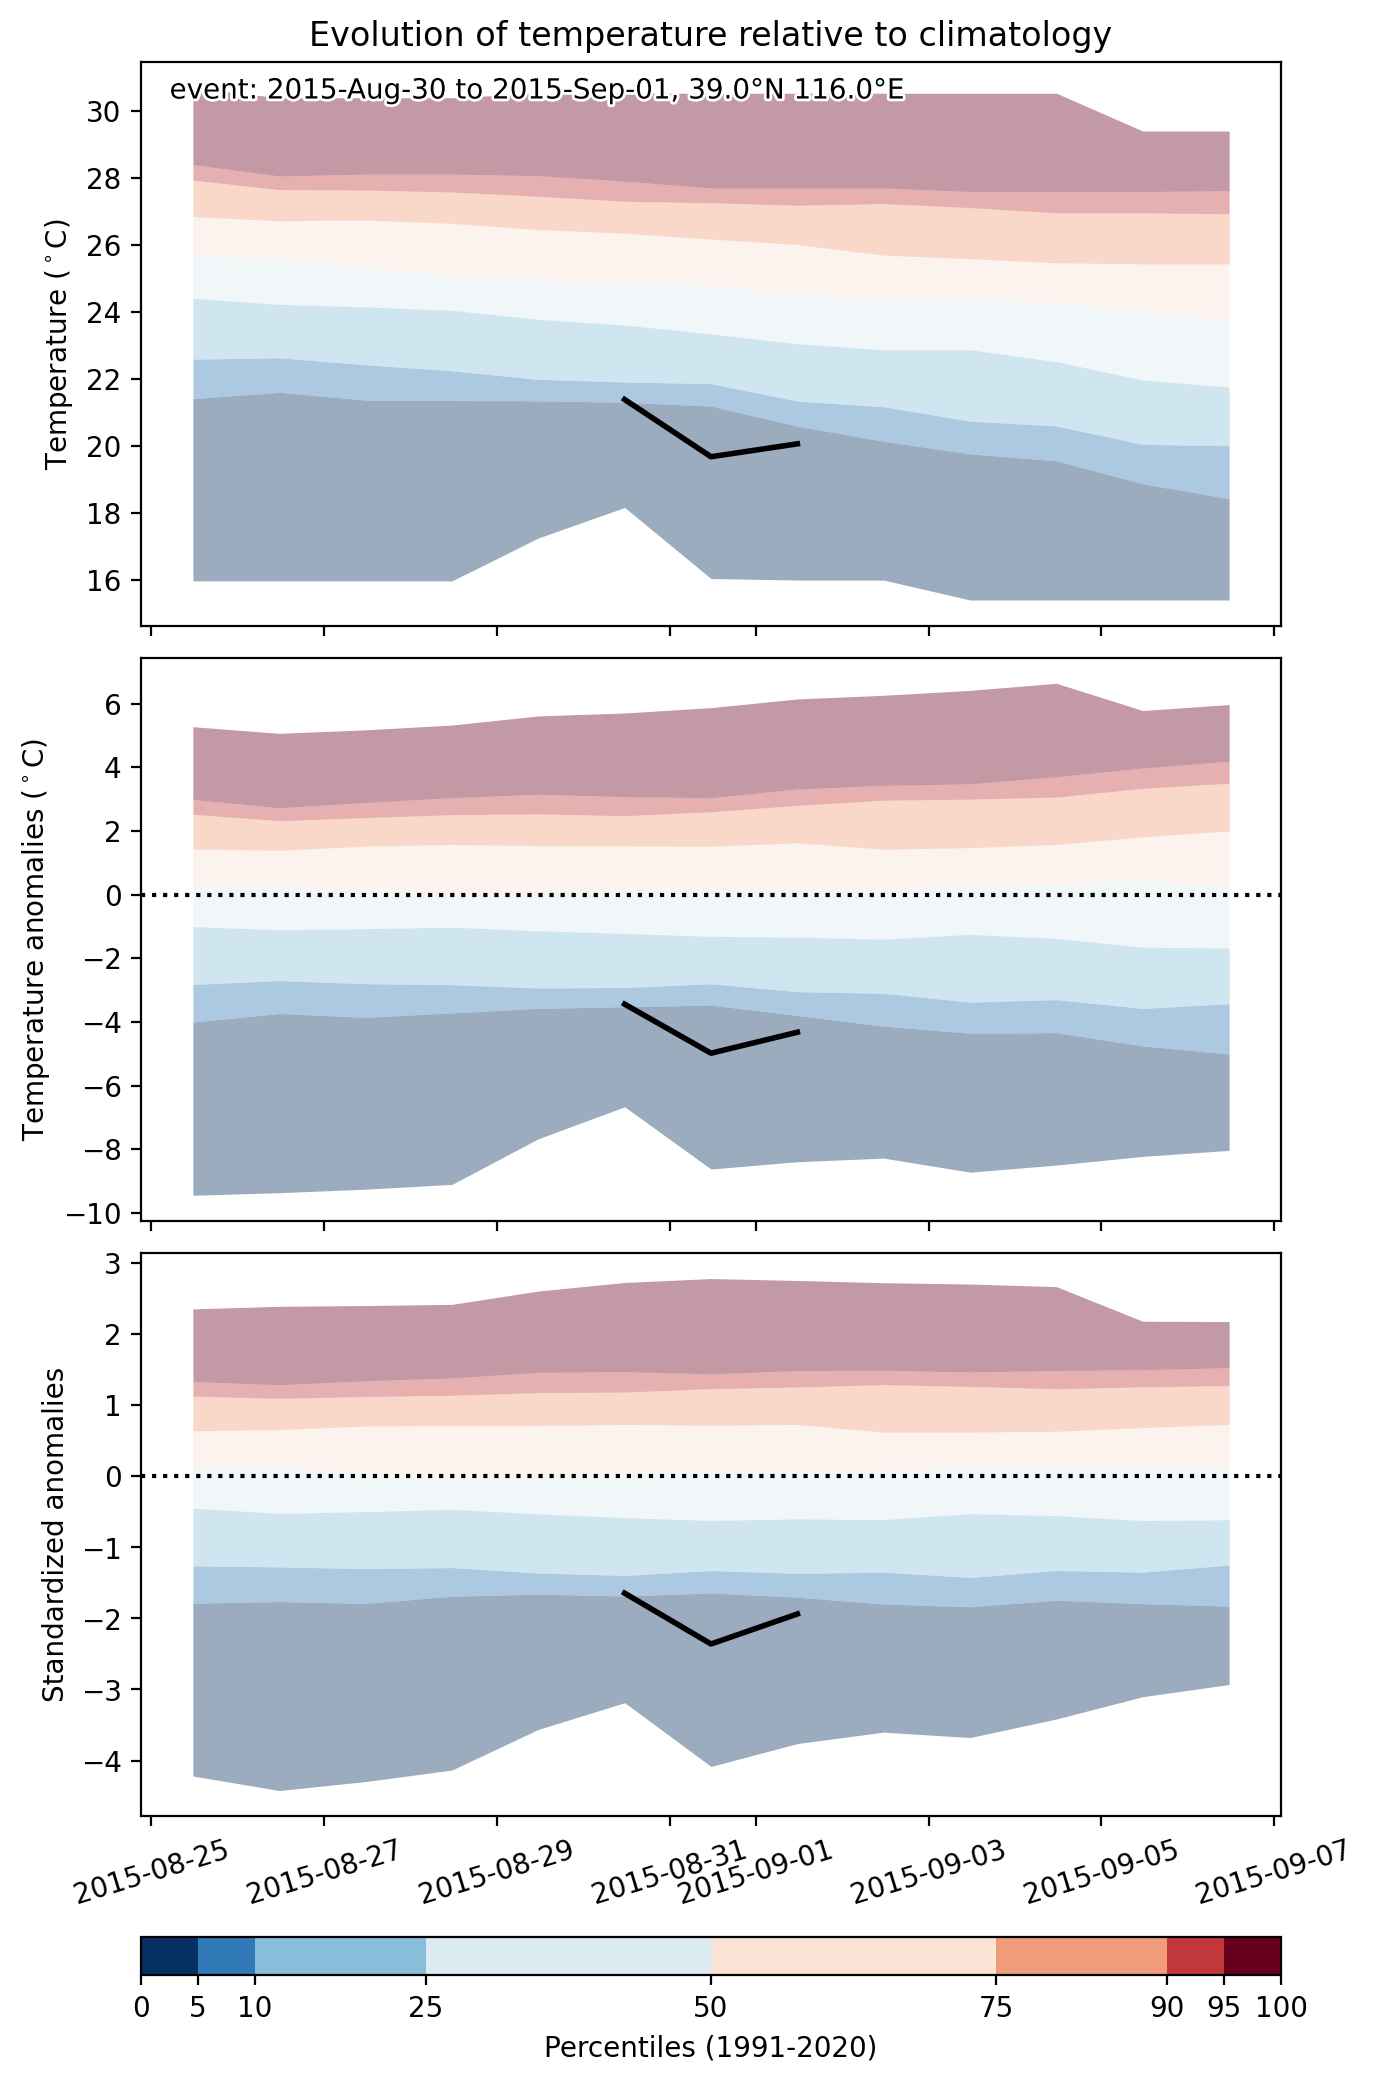
Fig. 2: Evolution of temperature at the center of the event. The climatological percentile distribution is illustrated with color shadings.


Fig. 3: Maps illustrating the evolution of standardized temperature anomalies during the event.

Event ID: Cold_spell_2015-Aug-30_to_2015-Sep-01_116.0_39.0

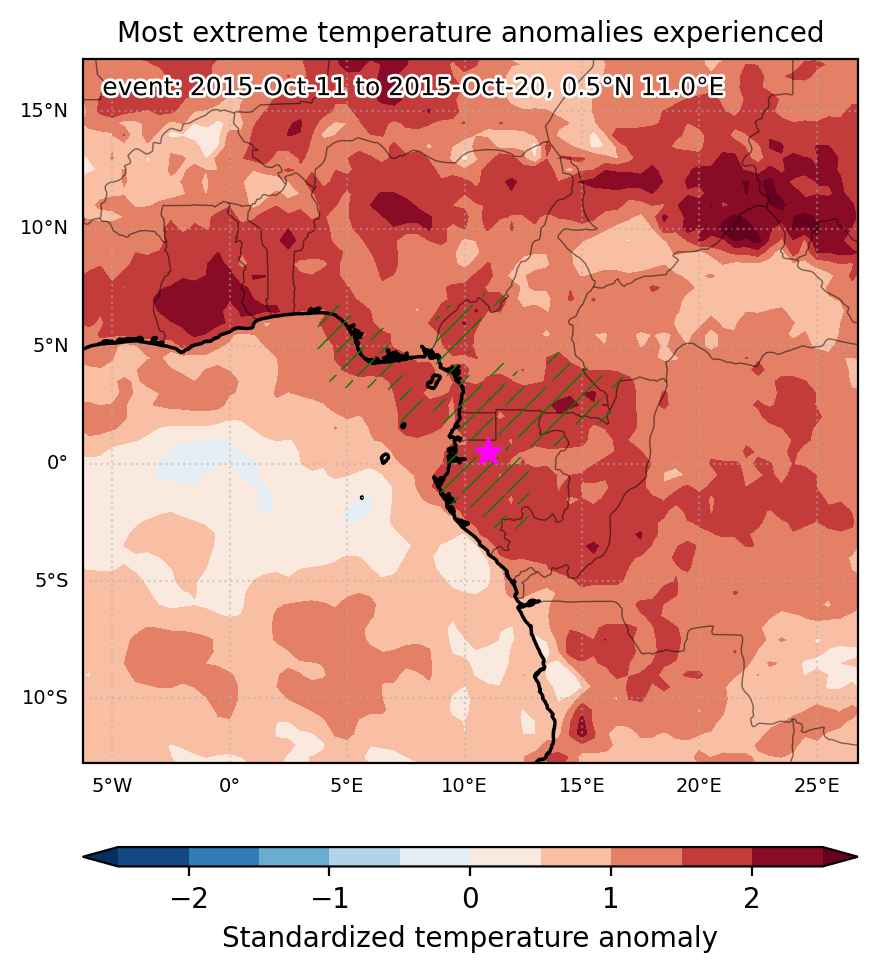
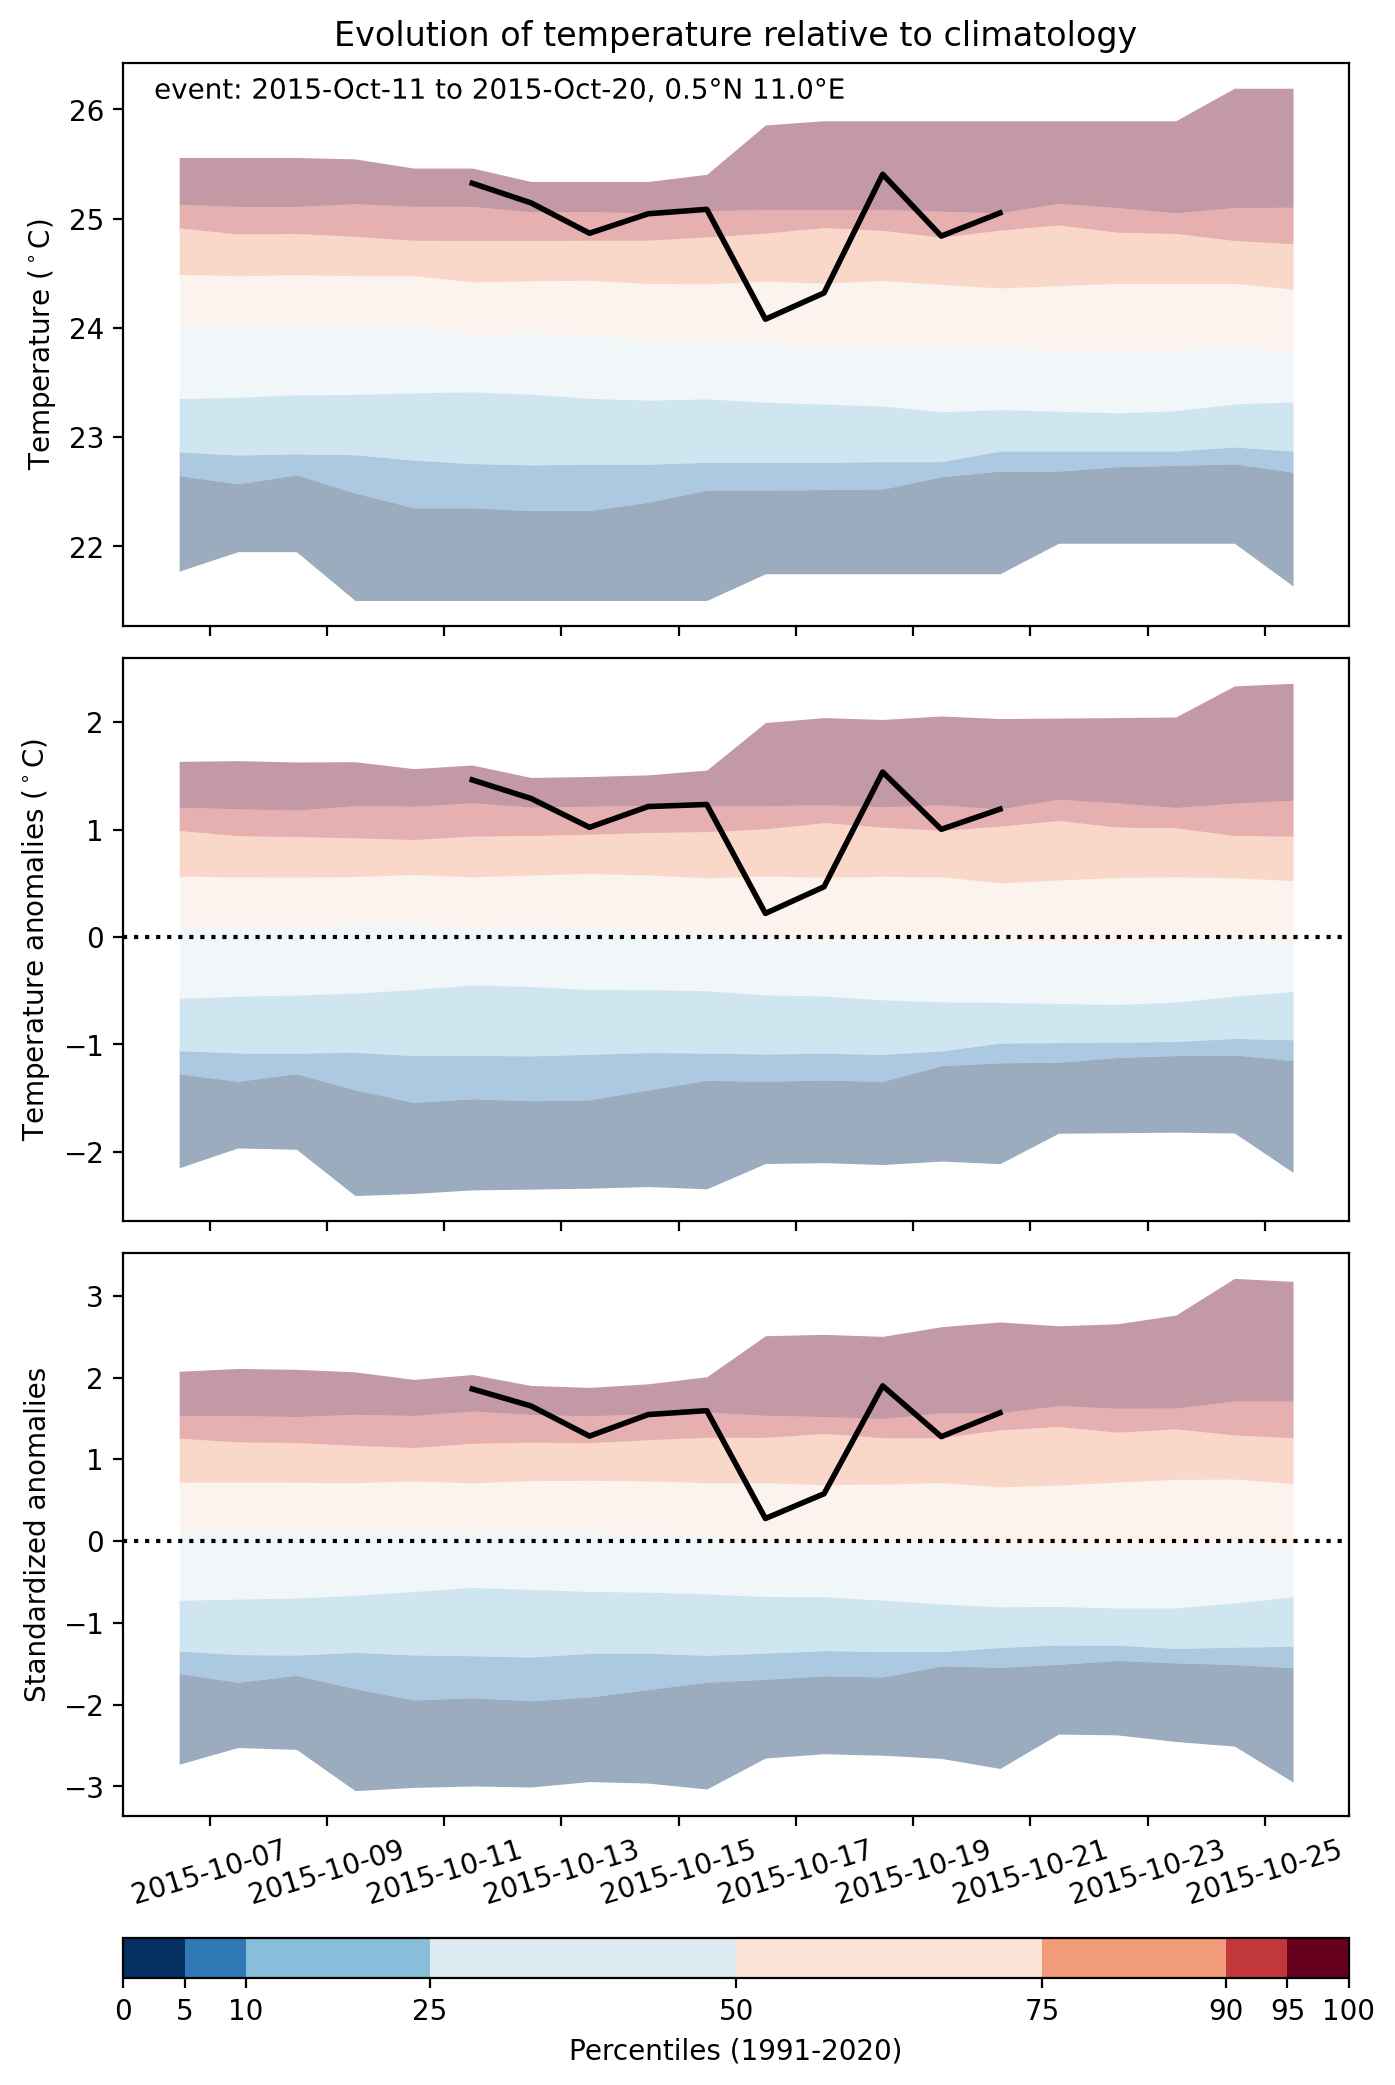
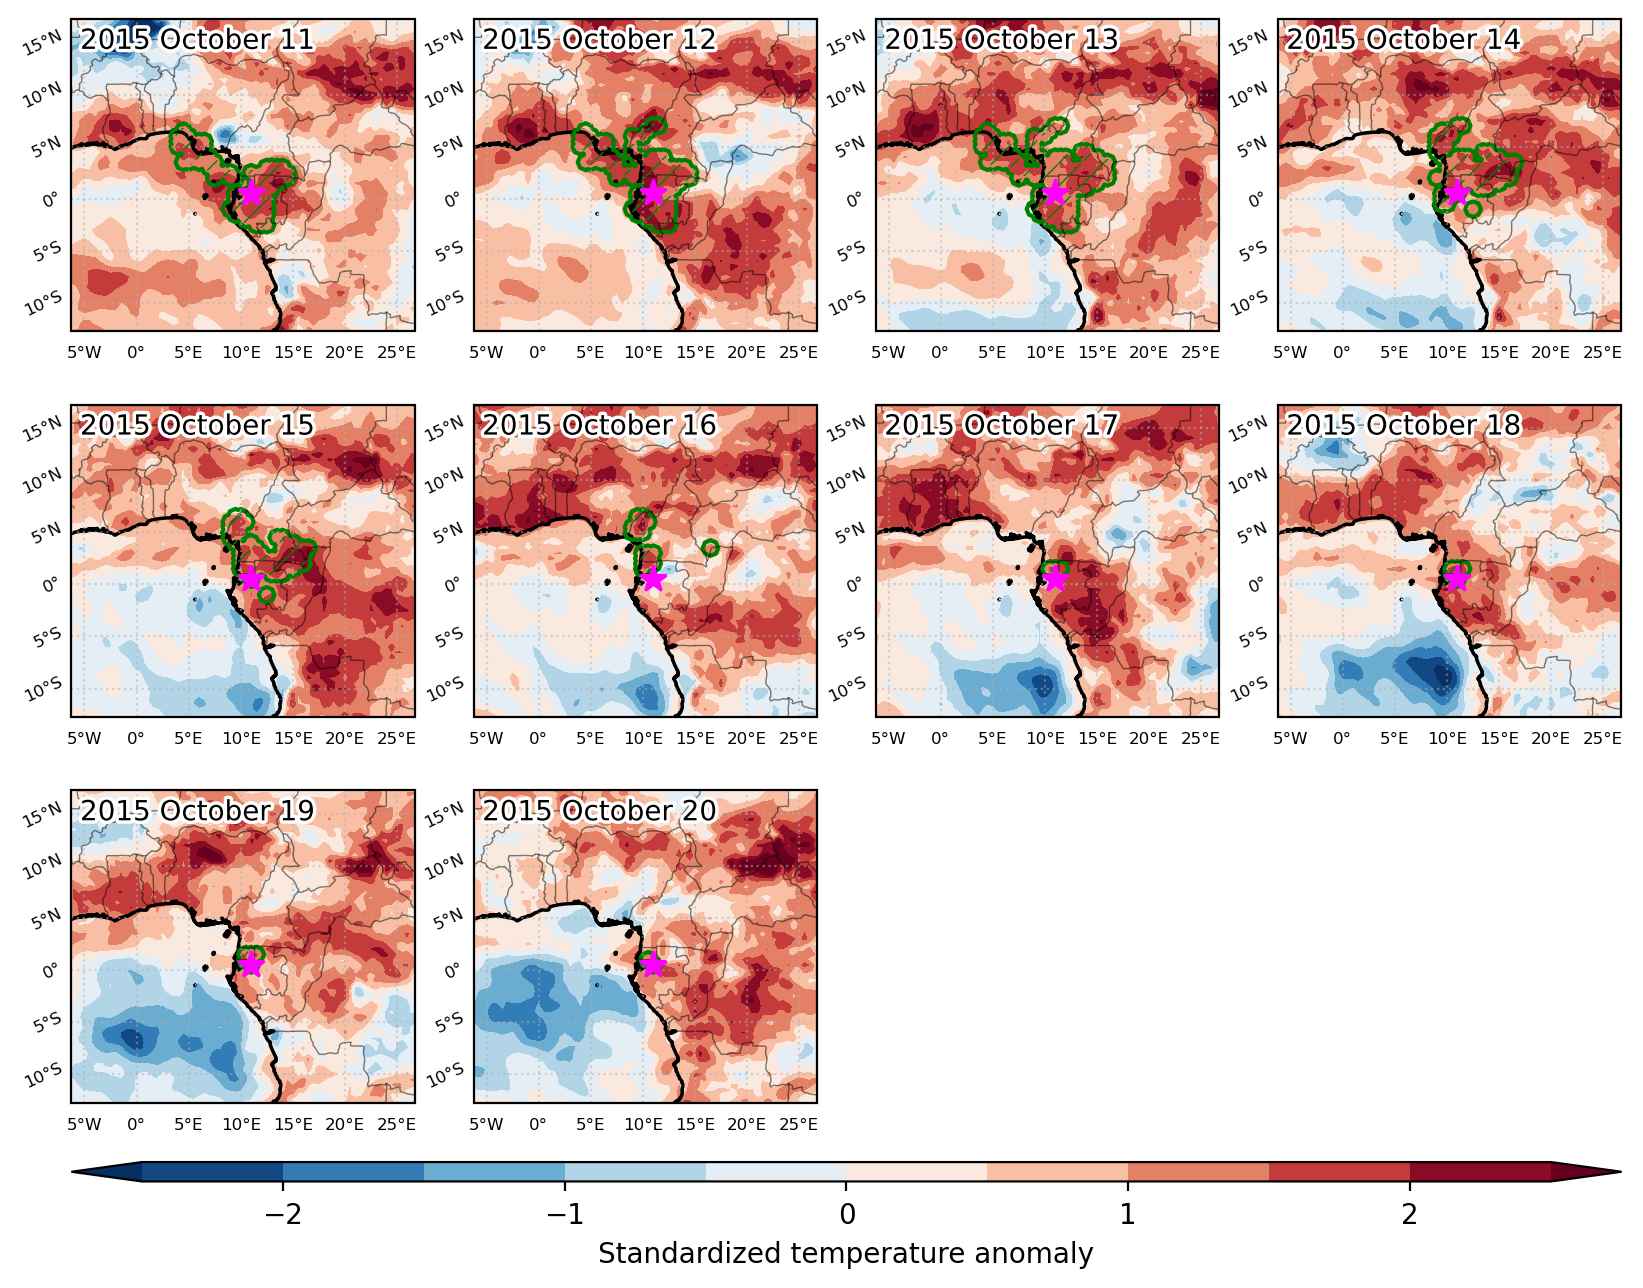
Heat wave occuring from October 11 2015 to October 20 2015 at 0.5°N 11.0°E

Download data: JSON

Event type: Heat wave

Countries affected (identified with ArcGIS Online; provided only for geographical reference):

  • Cameroon
  • Central African Republic
  • Congo
  • Equatorial Guinea
  • Gabon
  • Nigeria

Duration: 10 days

Time span: October 11 2015 to October 20 2015

Statistics over entire affected area:

  • Mean temperature anomaly: 1.2 °C
  • Mean temperature: 25.3 °C
  • Maximum temperature anomaly: 2.2 °C
  • Maximum temperature: 27.3 °C

Event center: 0.5°N 11.0°E

Area affected: 484446 km$^2$


Fig. 1: Map of most extreme temperature anomalies (standardized) experienced during the event. The purple star indicates the center of the extreme event. Green hatching illustrates all areas under the effect of extremes at some time during the event.


Fig. 2: Evolution of temperature at the center of the event. The climatological percentile distribution is illustrated with color shadings.


Fig. 3: Maps illustrating the evolution of standardized temperature anomalies during the event.

Event ID: Heat_wave_2015-Oct-11_to_2015-Oct-20_11.0_0.5

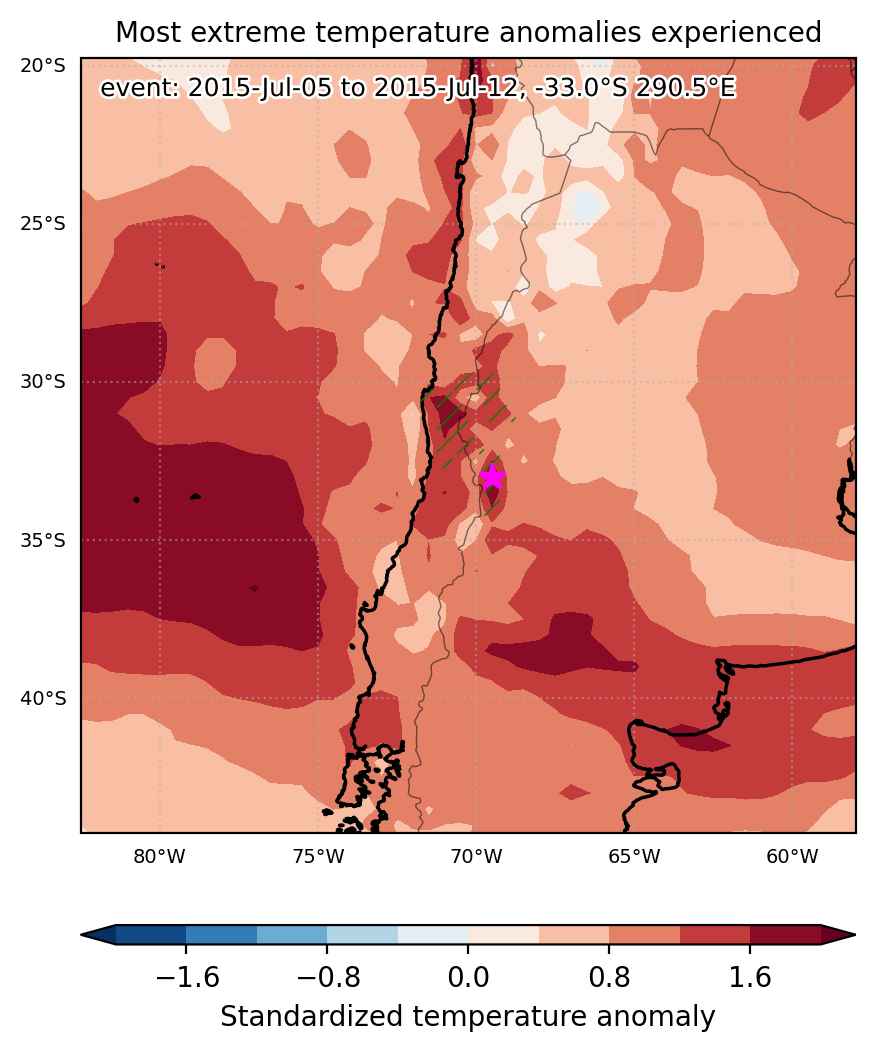
Heat wave occuring from July 05 2015 to July 12 2015 at -33.0°S 290.5°E

Download data: JSON

Event type: Heat wave

Countries affected (identified with ArcGIS Online; provided only for geographical reference):

  • Argentina
  • Chile

Duration: 8 days

Time span: July 05 2015 to July 12 2015

Statistics over entire affected area:

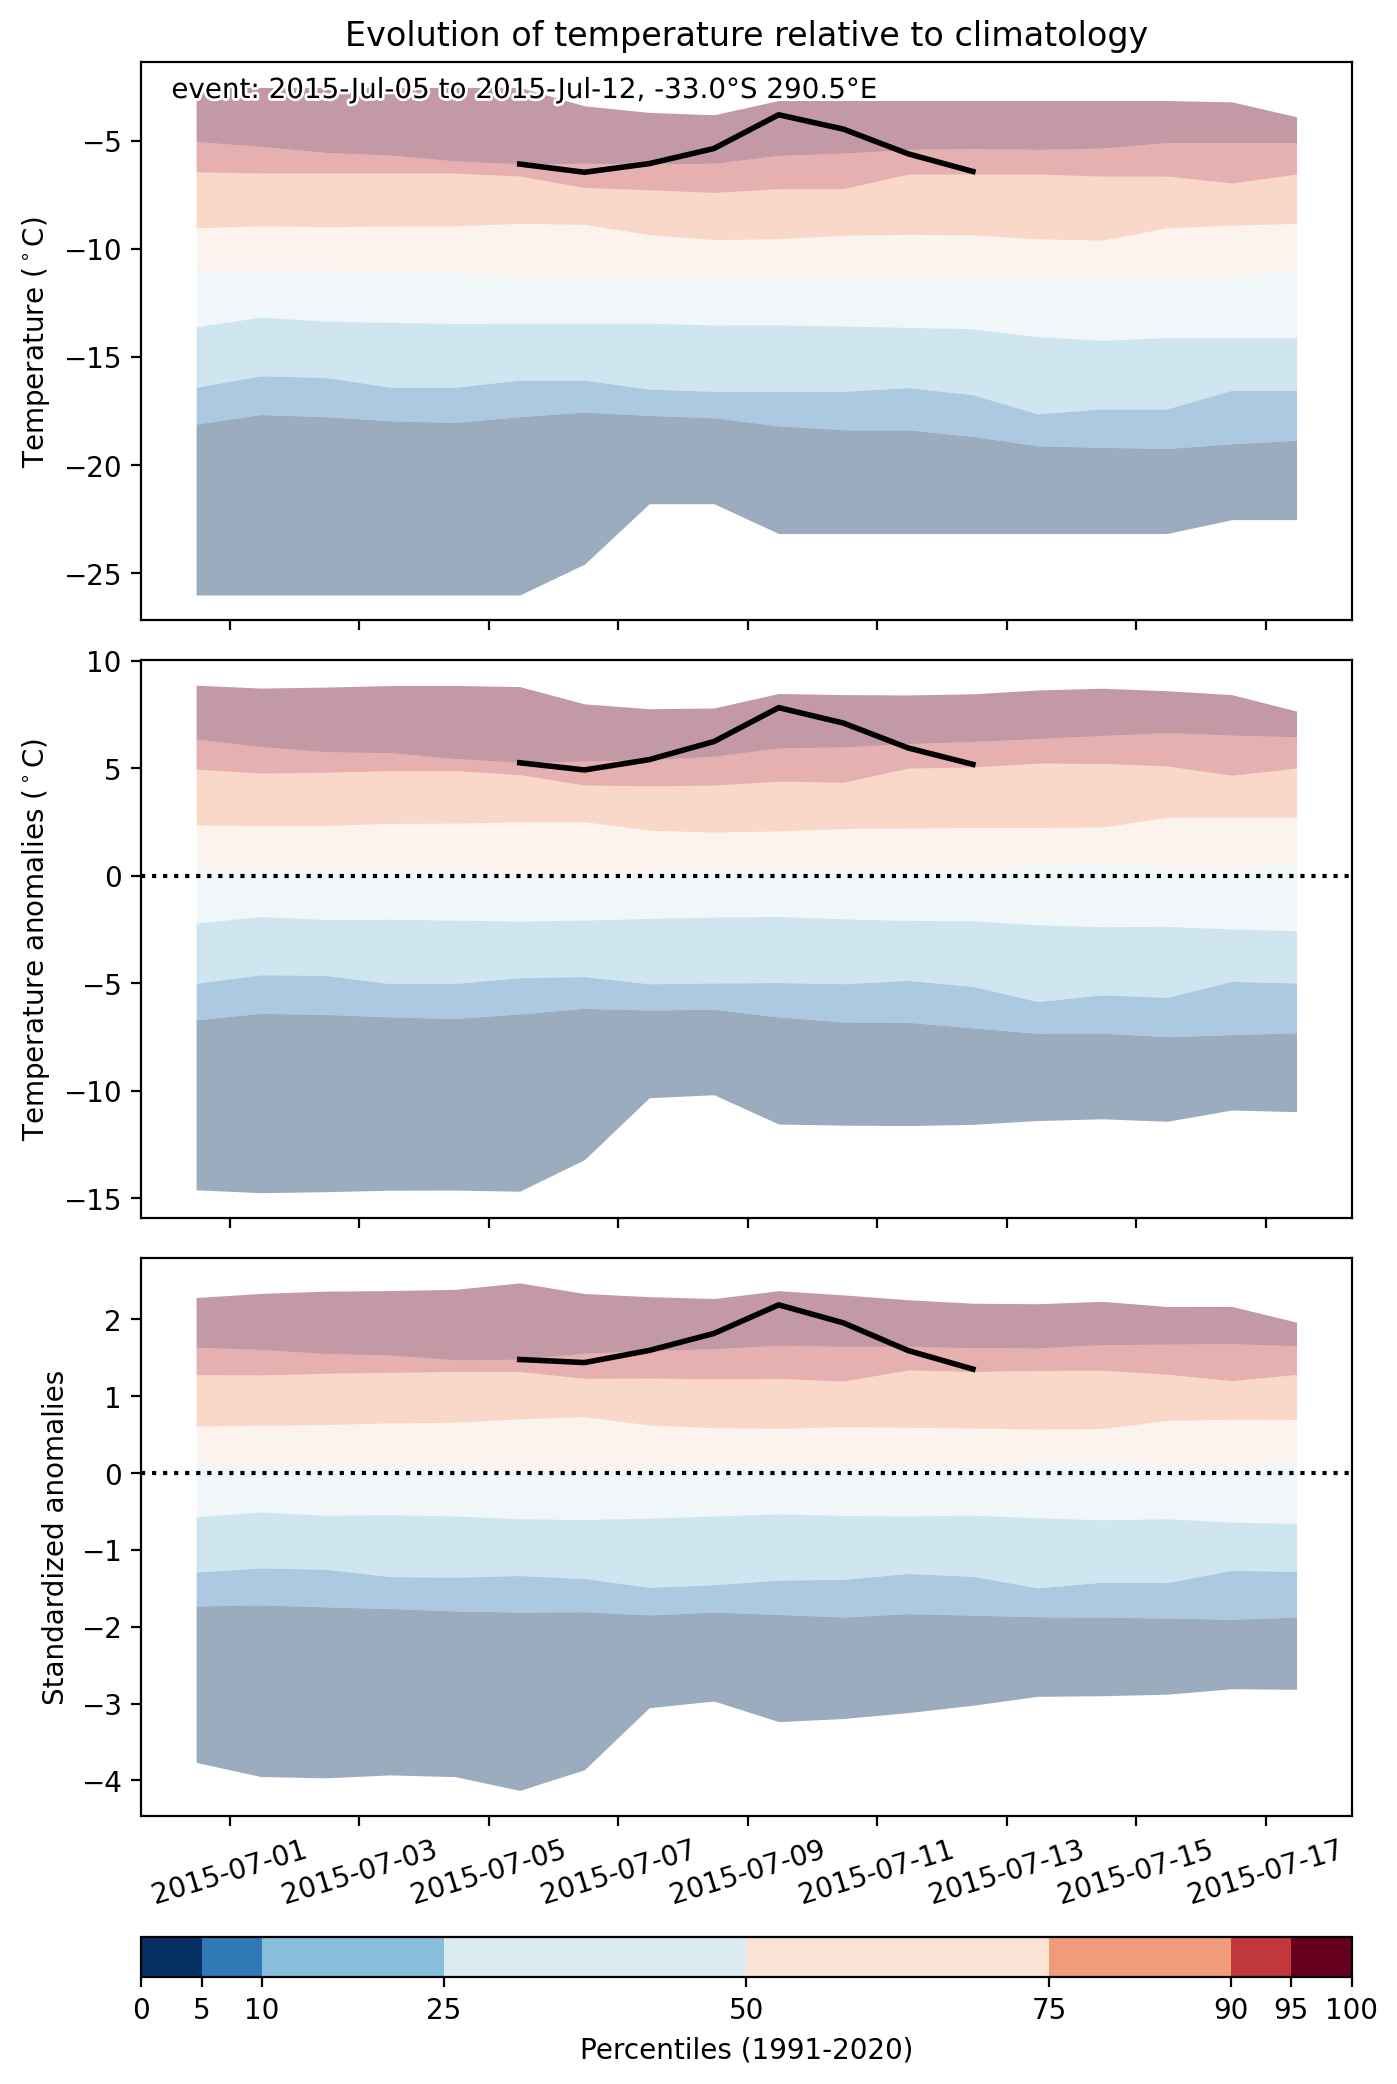
  • Mean temperature anomaly: 4.7 °C
  • Mean temperature: 1.5 °C
  • Maximum temperature anomaly: 8.0 °C
  • Maximum temperature: 14.3 °C

Event center: -33.0°S 290.5°E

Area affected: 52701 km$^2$


Fig. 1: Map of most extreme temperature anomalies (standardized) experienced during the event. The purple star indicates the center of the extreme event. Green hatching illustrates all areas under the effect of extremes at some time during the event.


Fig. 2: Evolution of temperature at the center of the event. The climatological percentile distribution is illustrated with color shadings.


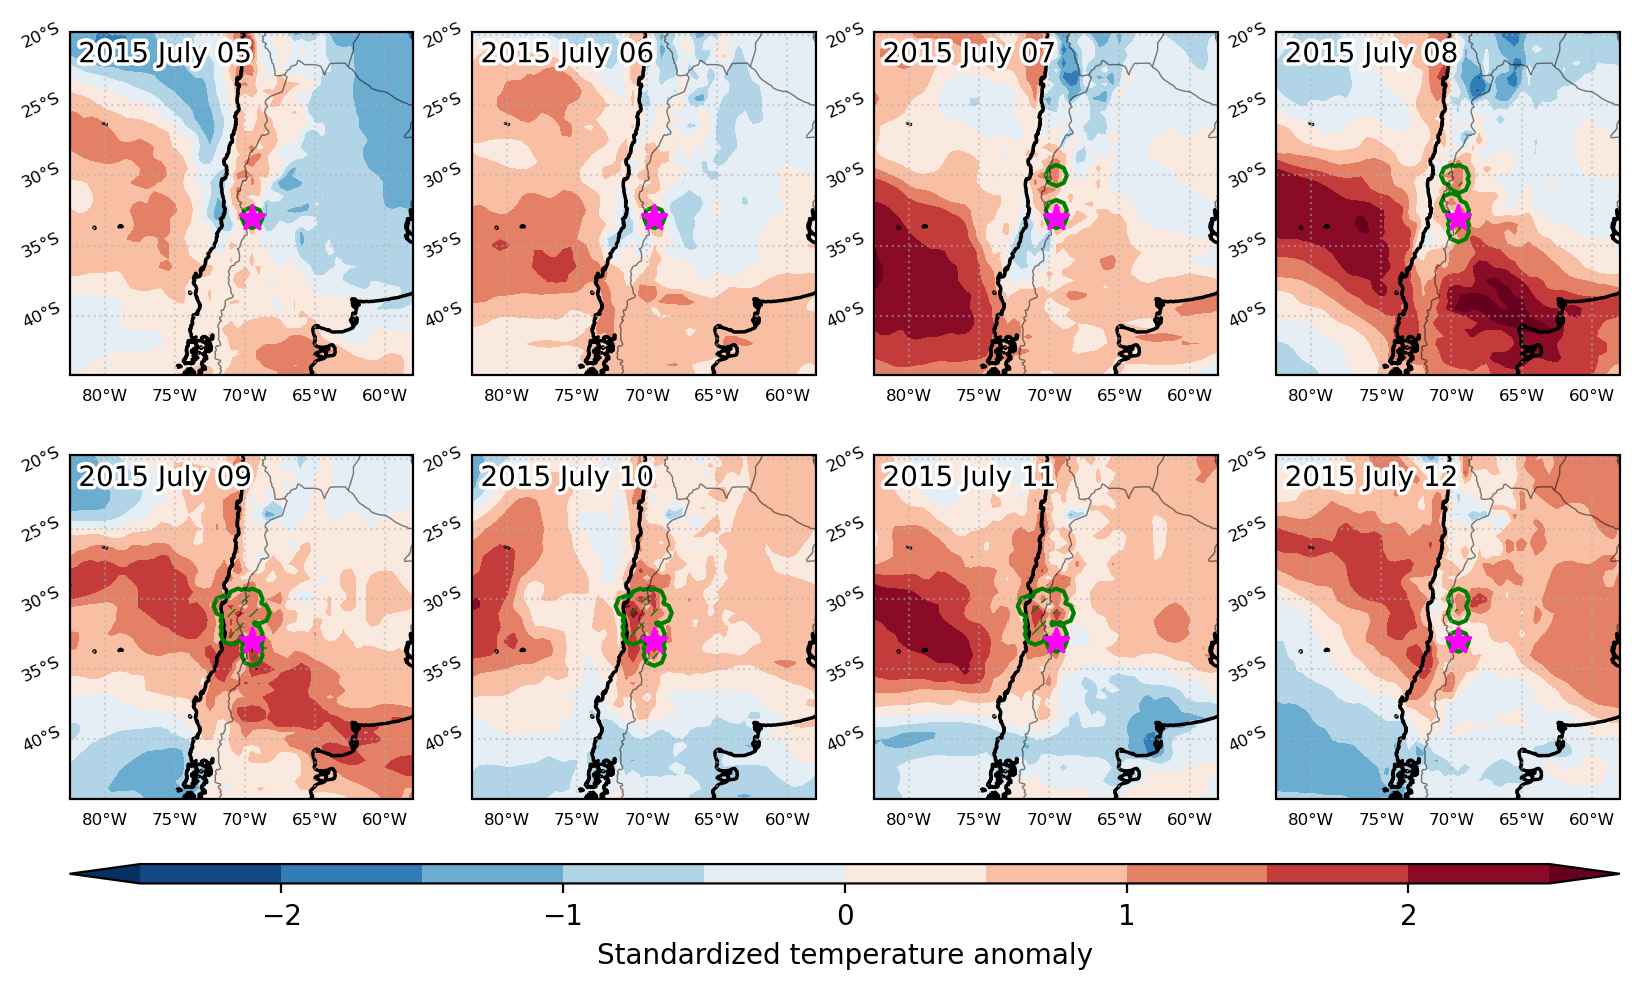
Fig. 3: Maps illustrating the evolution of standardized temperature anomalies during the event.

Event ID: Heat_wave_2015-Jul-05_to_2015-Jul-12_290.5_-33.0

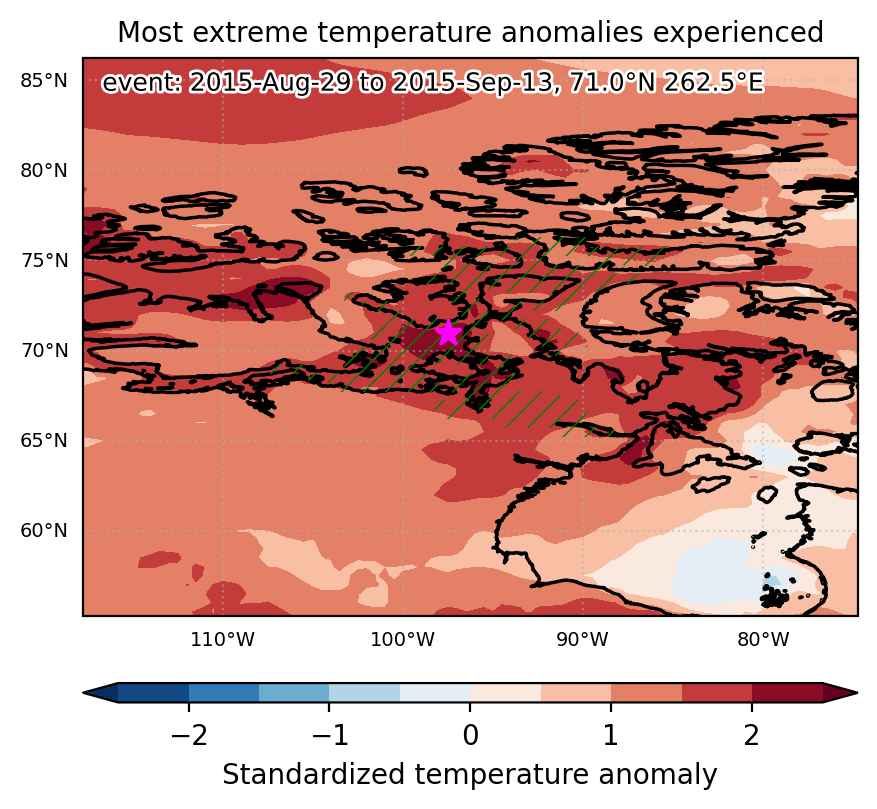
Heat wave occuring from August 29 2015 to September 13 2015 at 71.0°N 262.5°E

Download data: JSON

Event type: Heat wave

Countries affected (identified with ArcGIS Online; provided only for geographical reference):

  • Canada

Duration: 16 days

Time span: August 29 2015 to September 13 2015

Statistics over entire affected area:

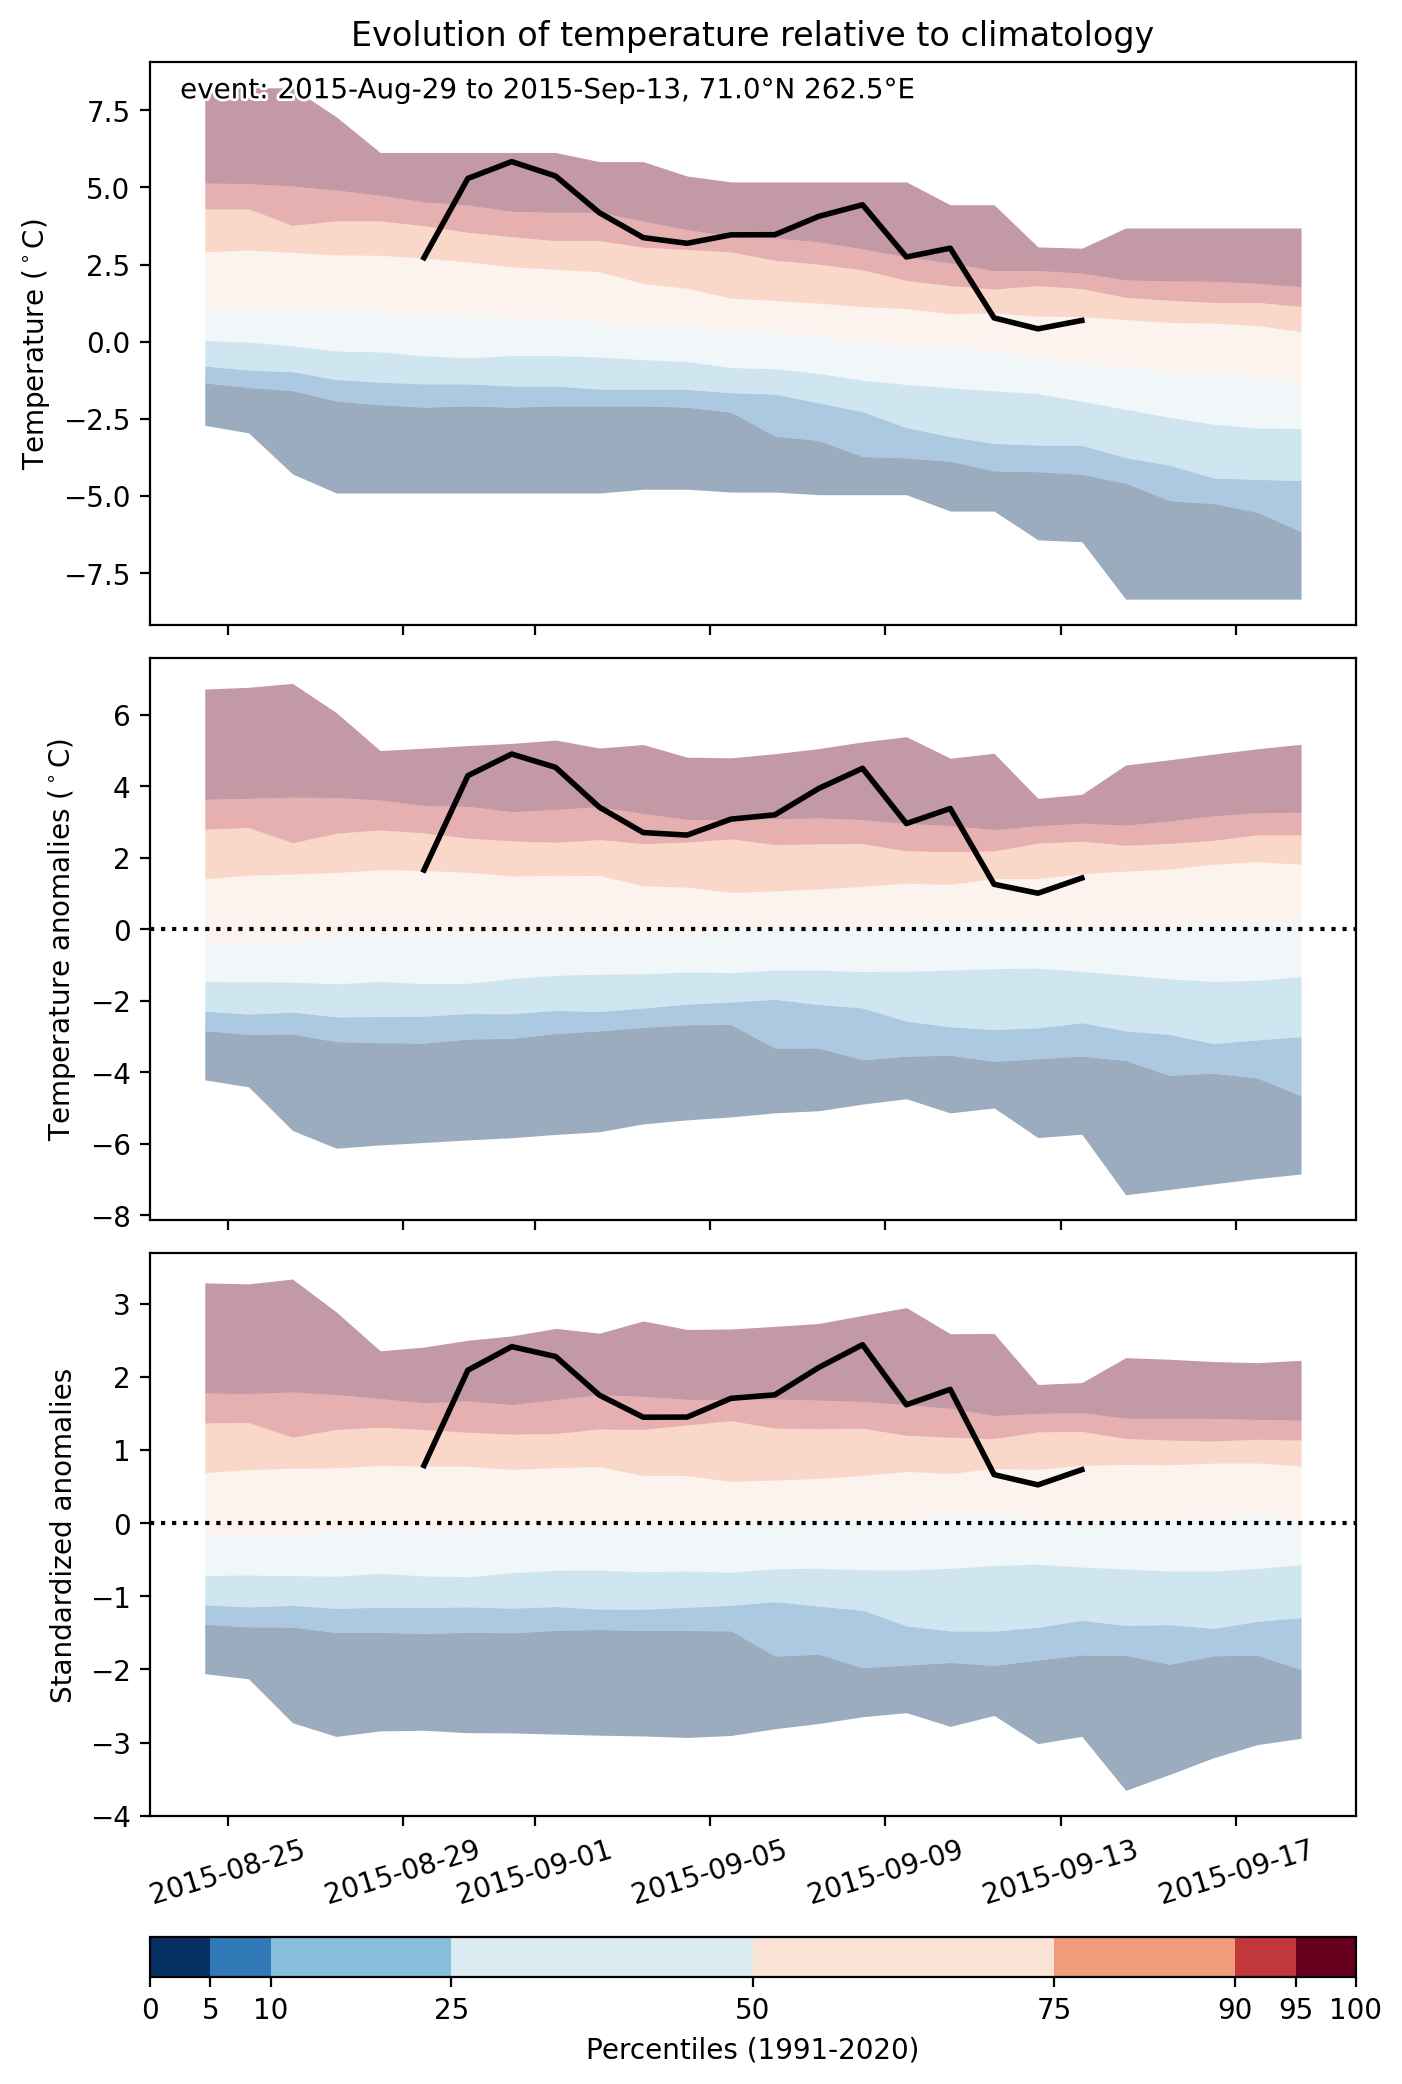
  • Mean temperature anomaly: 3.8 °C
  • Mean temperature: 4.2 °C
  • Maximum temperature anomaly: 6.8 °C
  • Maximum temperature: 10.0 °C

Event center: 71.0°N 262.5°E

Area affected: 348126 km$^2$


Fig. 1: Map of most extreme temperature anomalies (standardized) experienced during the event. The purple star indicates the center of the extreme event. Green hatching illustrates all areas under the effect of extremes at some time during the event.


Fig. 2: Evolution of temperature at the center of the event. The climatological percentile distribution is illustrated with color shadings.


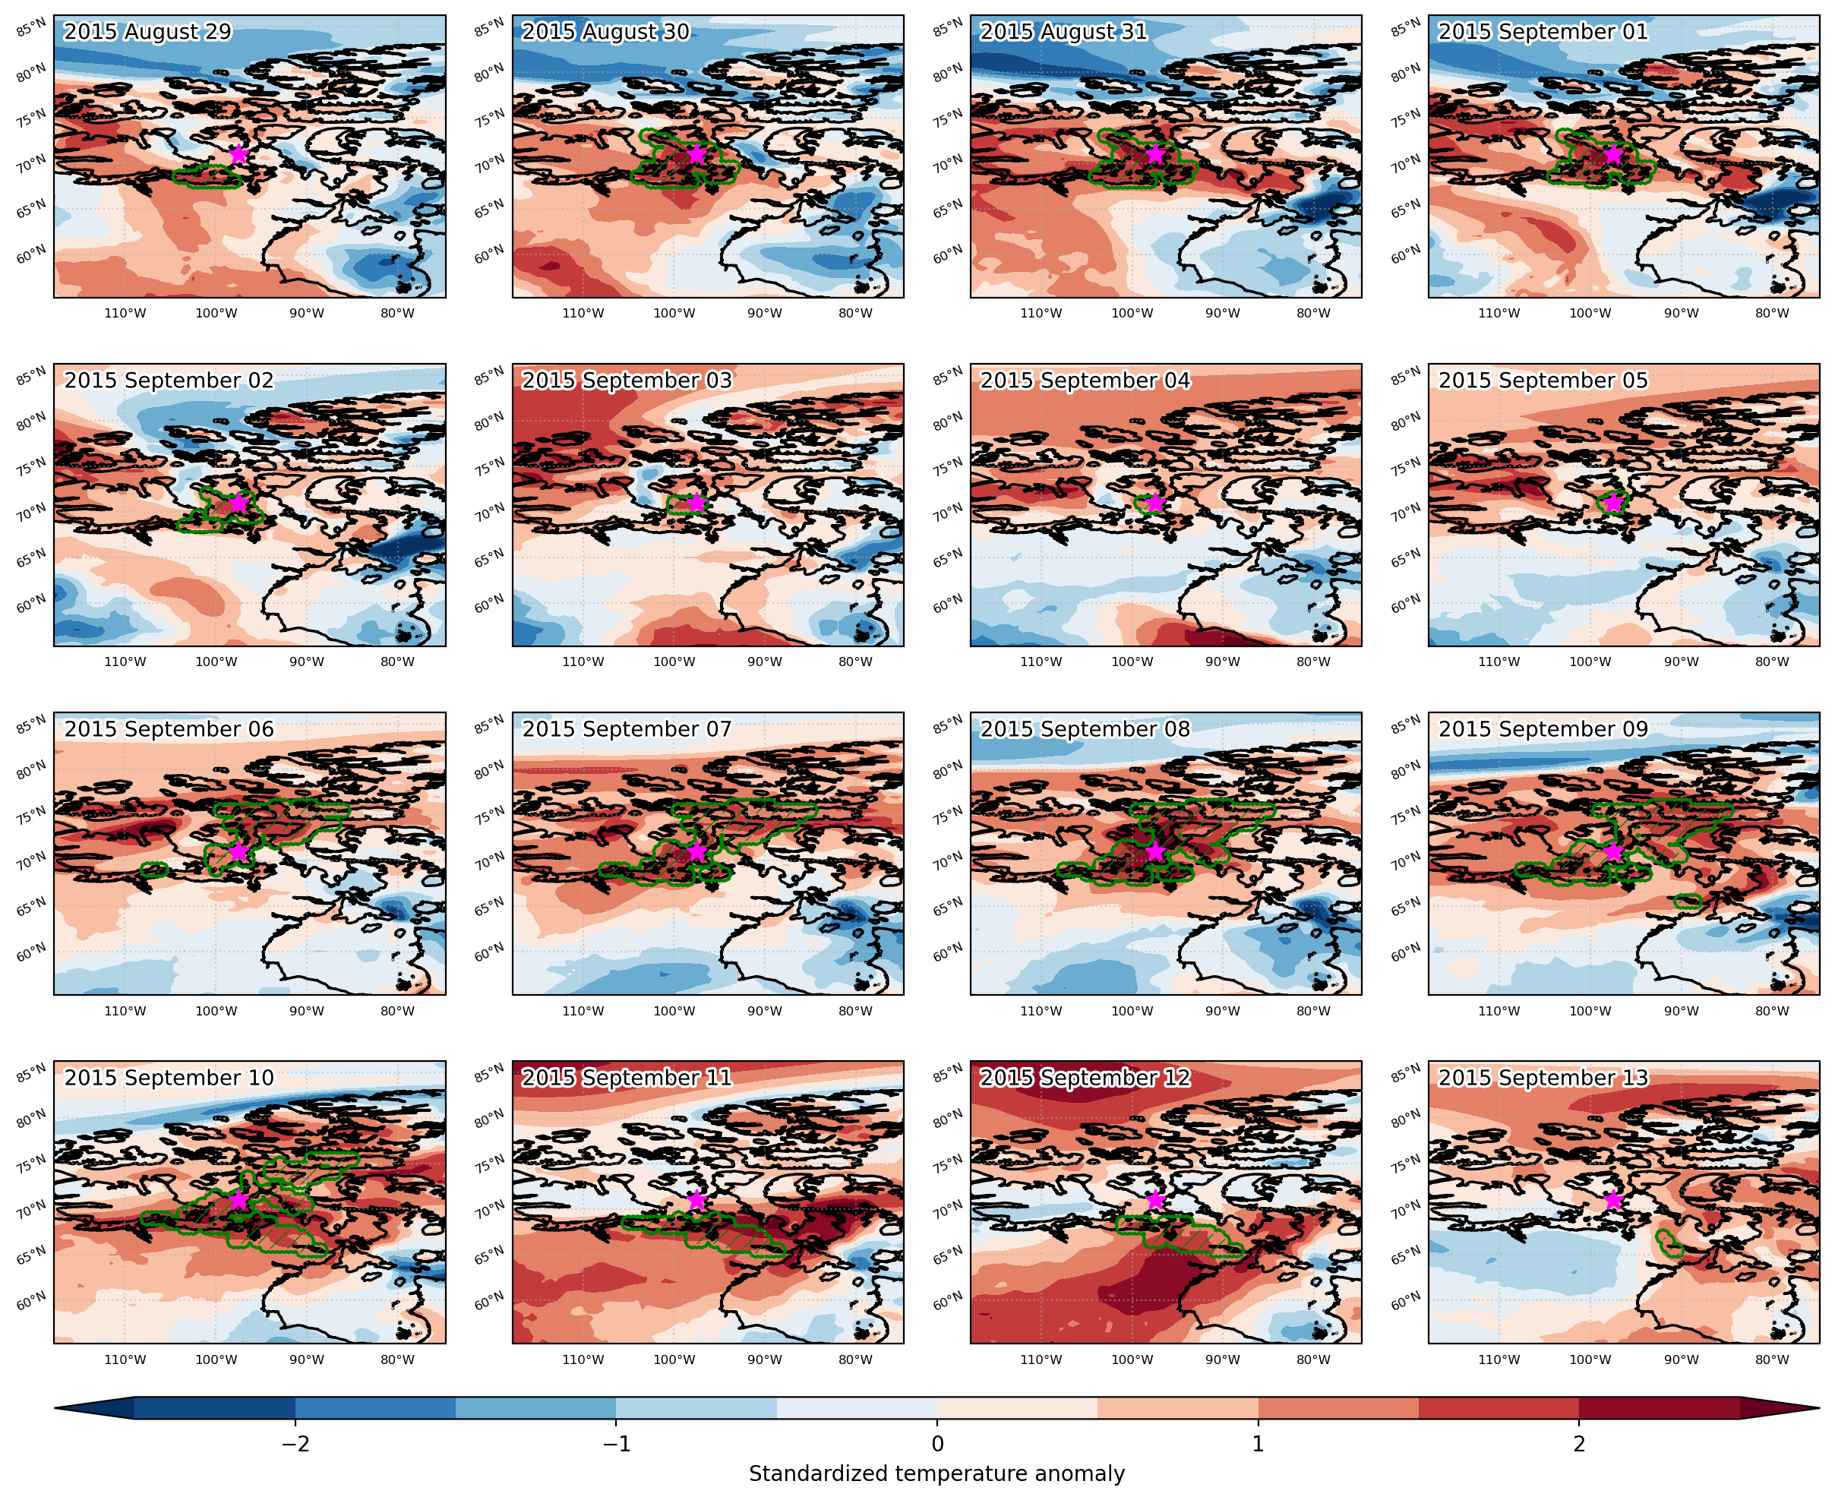
Fig. 3: Maps illustrating the evolution of standardized temperature anomalies during the event.

Event ID: Heat_wave_2015-Aug-29_to_2015-Sep-13_262.5_71.0

Heat wave occuring from October 10 2015 to October 12 2015 at 46.0°N 257.0°E

Download data: JSON

Event type: Heat wave

Countries affected (identified with ArcGIS Online; provided only for geographical reference):

  • United States

Duration: 3 days

Time span: October 10 2015 to October 12 2015

Statistics over entire affected area:

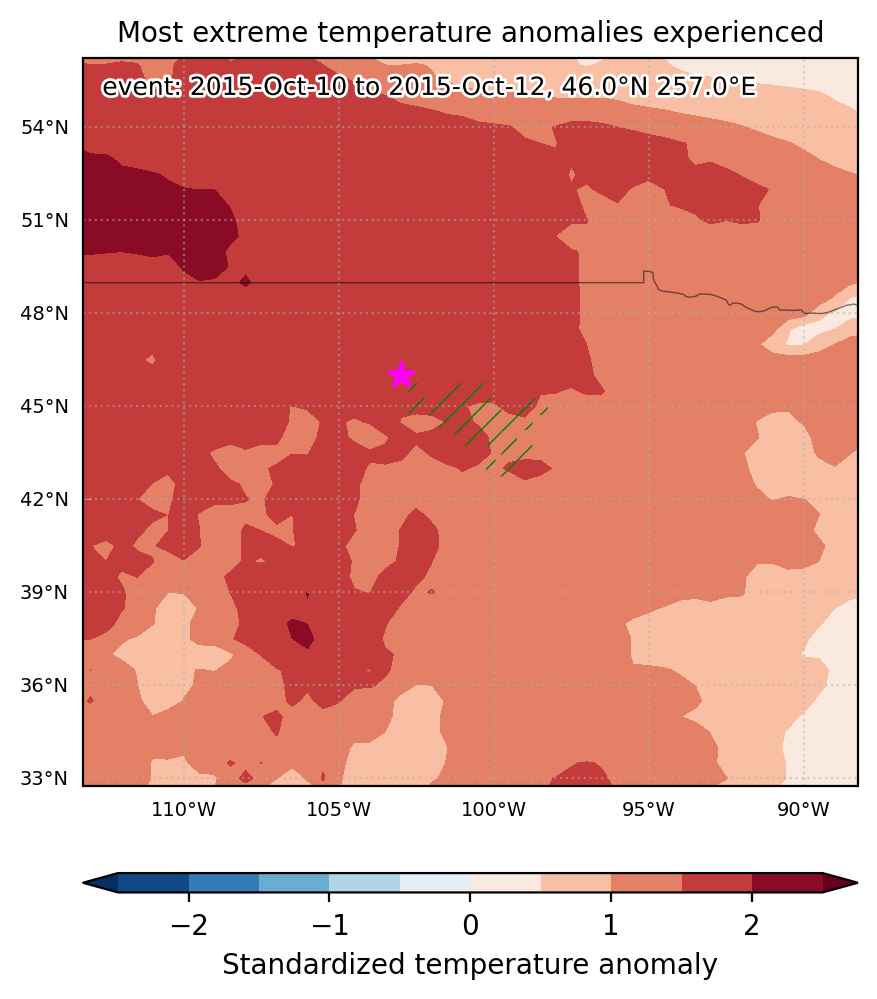
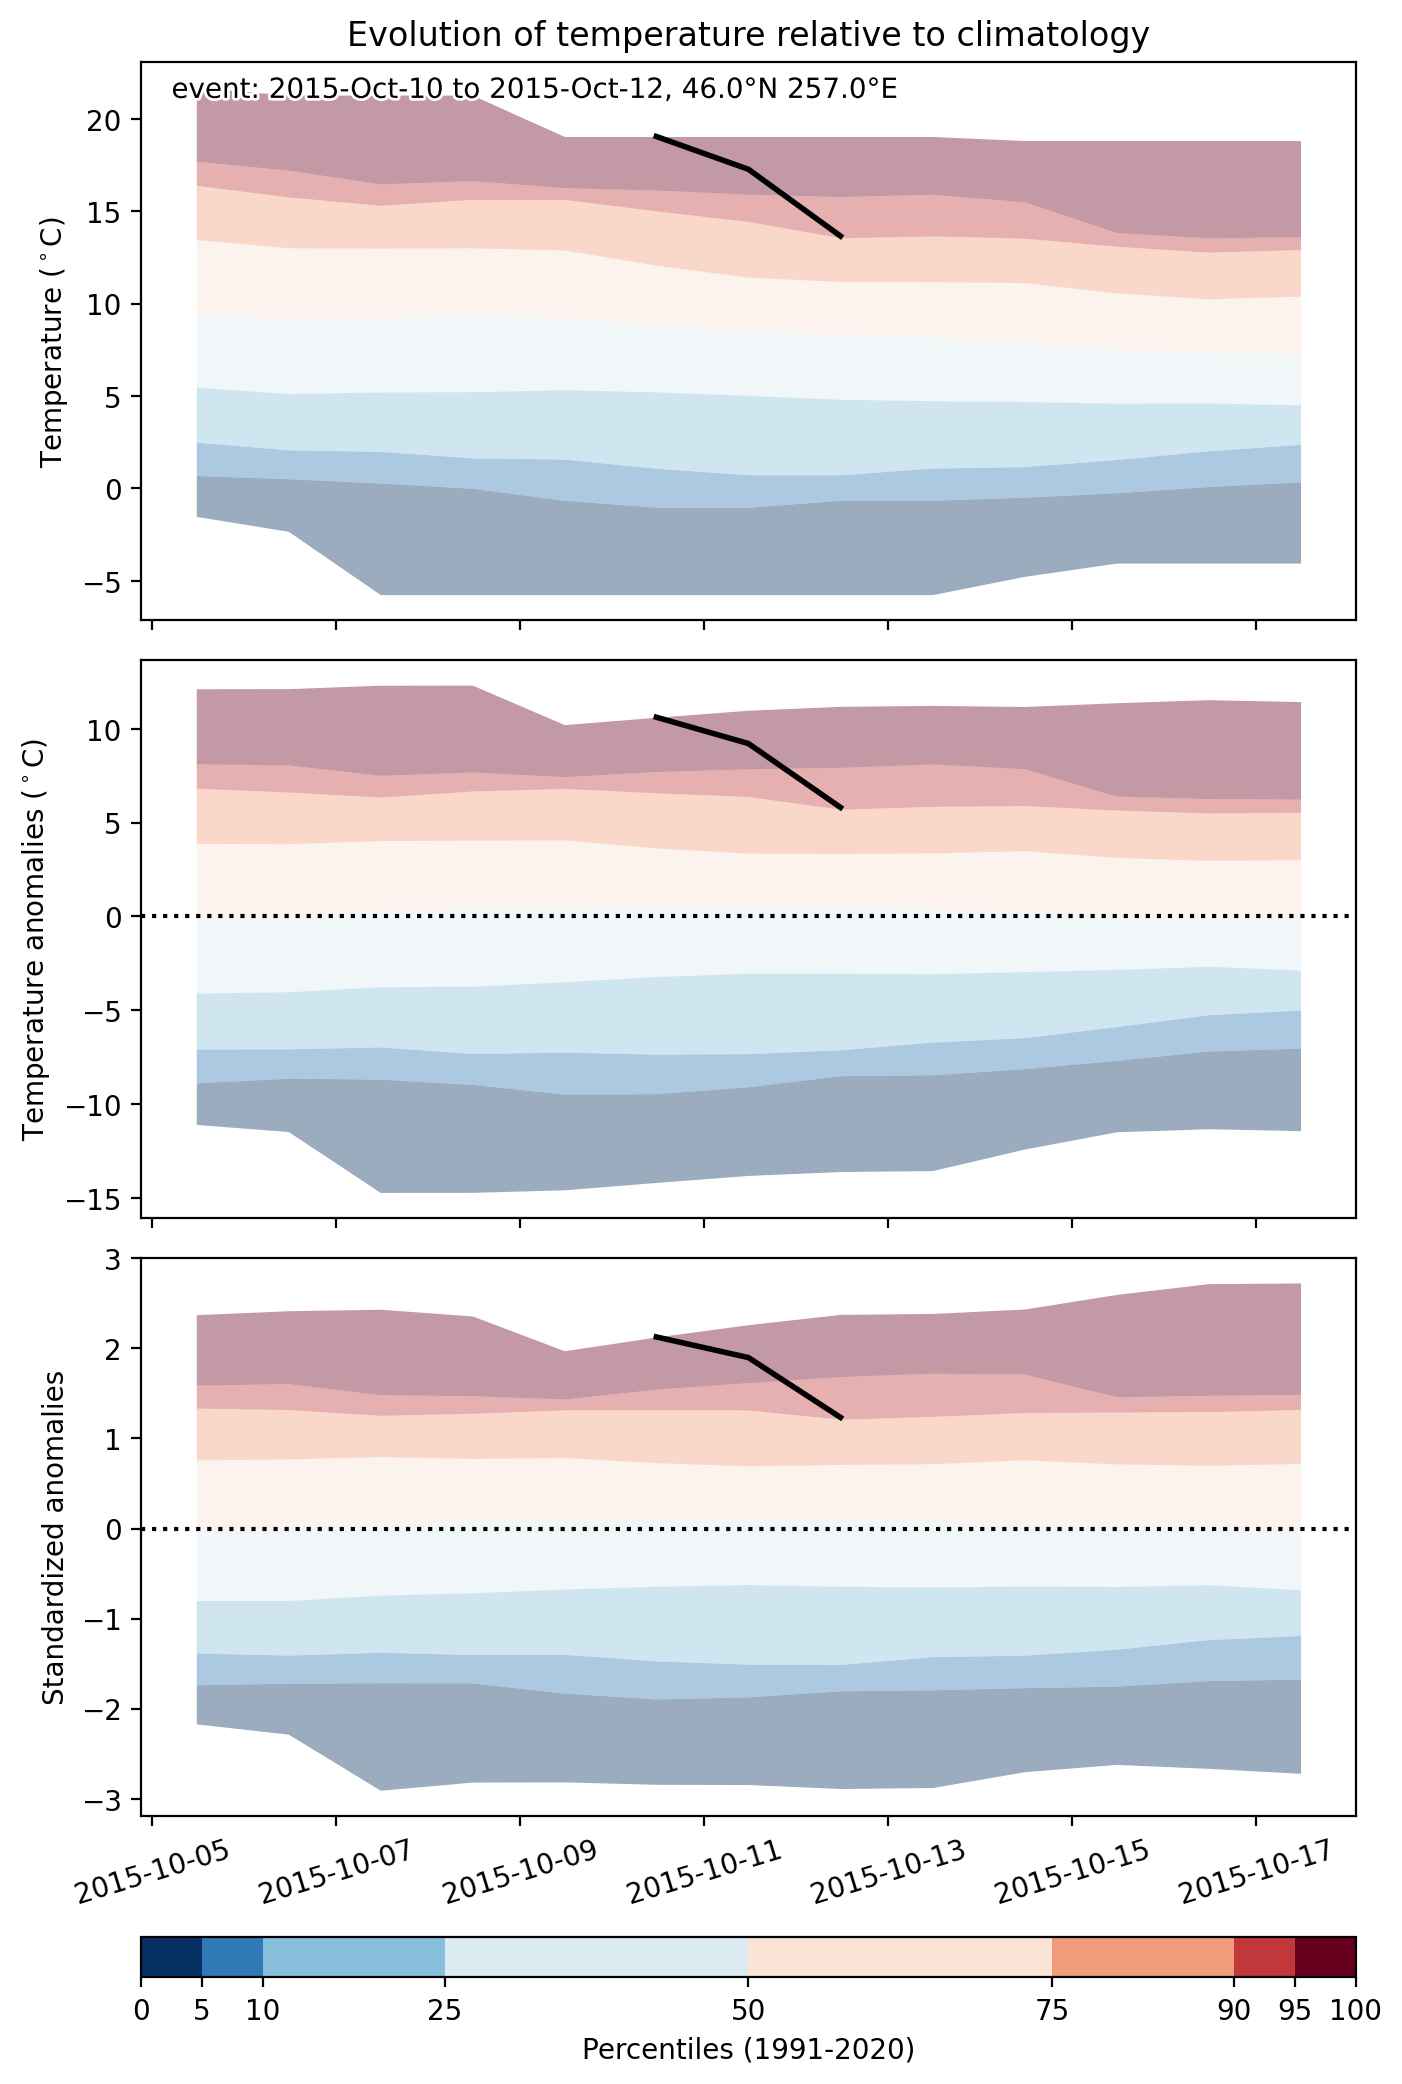
  • Mean temperature anomaly: 7.4 °C
  • Mean temperature: 17.4 °C
  • Maximum temperature anomaly: 10.6 °C
  • Maximum temperature: 20.9 °C

Event center: 46.0°N 257.0°E

Area affected: 59427 km$^2$


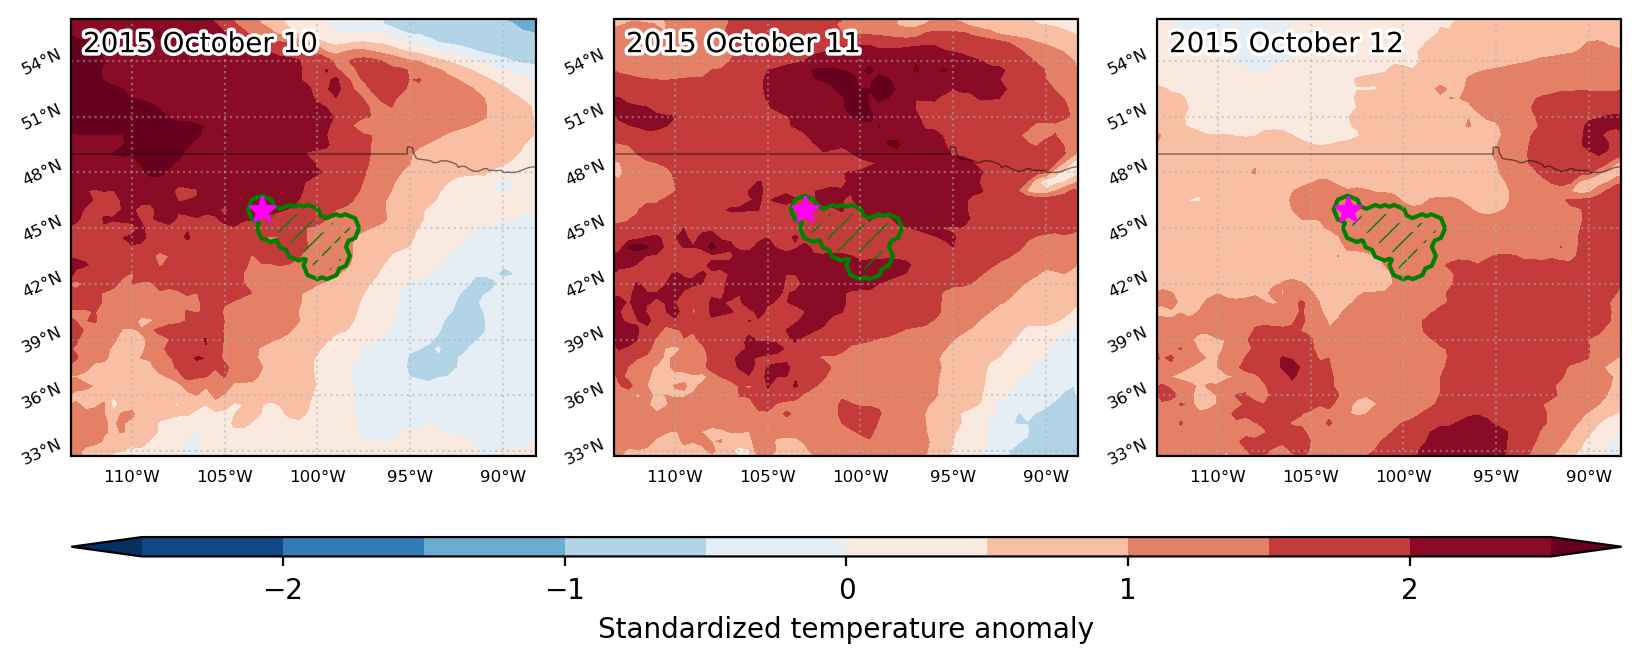
Fig. 1: Map of most extreme temperature anomalies (standardized) experienced during the event. The purple star indicates the center of the extreme event. Green hatching illustrates all areas under the effect of extremes at some time during the event.


Fig. 2: Evolution of temperature at the center of the event. The climatological percentile distribution is illustrated with color shadings.


Fig. 3: Maps illustrating the evolution of standardized temperature anomalies during the event.

Event ID: Heat_wave_2015-Oct-10_to_2015-Oct-12_257.0_46.0

Cold spell occuring from July 05 2015 to July 21 2015 at 77.0°N 22.5°E

Download data: JSON

Event type: Cold spell

Countries affected (identified with ArcGIS Online; provided only for geographical reference):

  • Norway

Duration: 17 days

Time span: July 05 2015 to July 21 2015

Statistics over entire affected area:

  • Mean temperature anomaly: -1.9 °C
  • Mean temperature: 1.4 °C
  • Minimum temperature anomaly: -3.6 °C
  • Minimum temperature: -0.5 °C

Event center: 77.0°N 22.5°E

Area affected: 106263 km$^2$


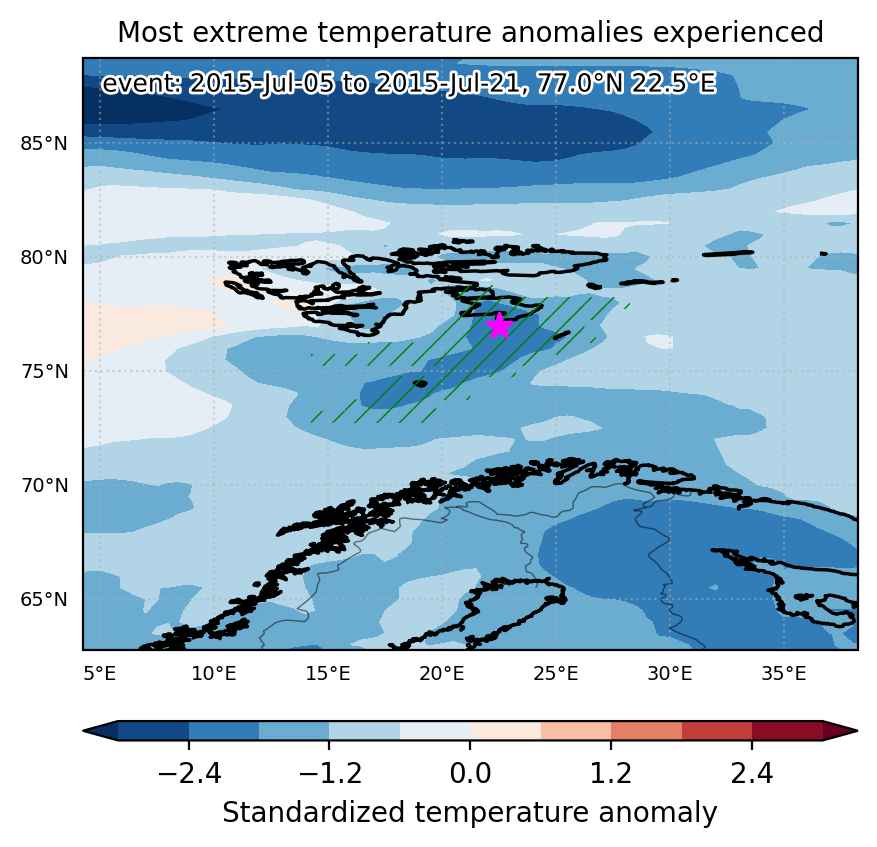
Fig. 1: Map of most extreme temperature anomalies (standardized) experienced during the event. The purple star indicates the center of the extreme event. Green hatching illustrates all areas under the effect of extremes at some time during the event.


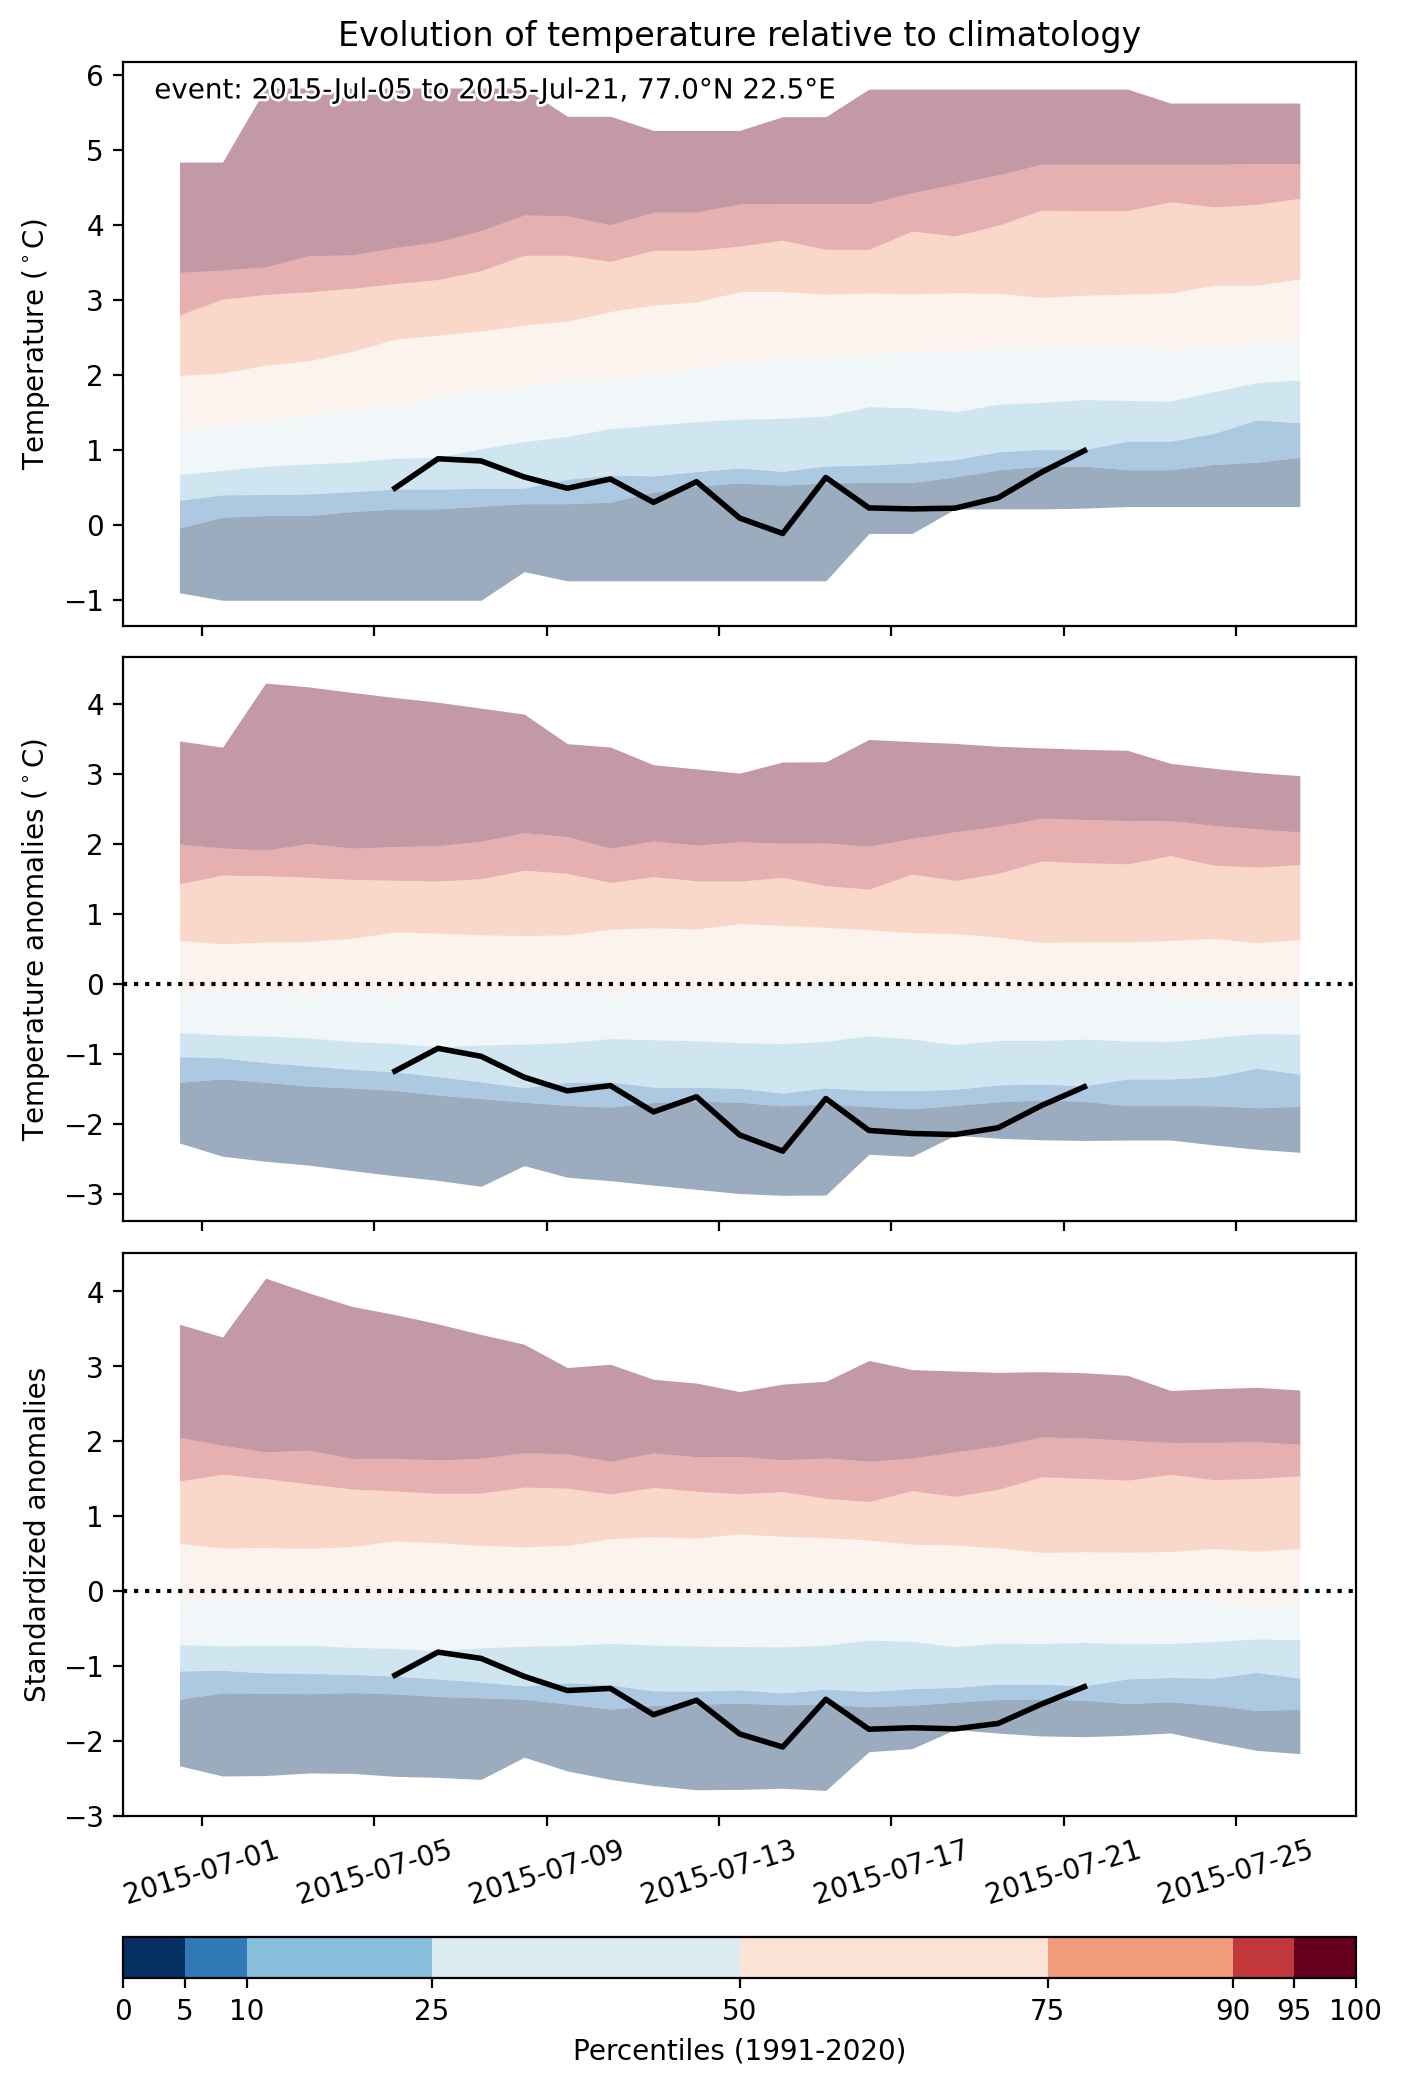
Fig. 2: Evolution of temperature at the center of the event. The climatological percentile distribution is illustrated with color shadings.


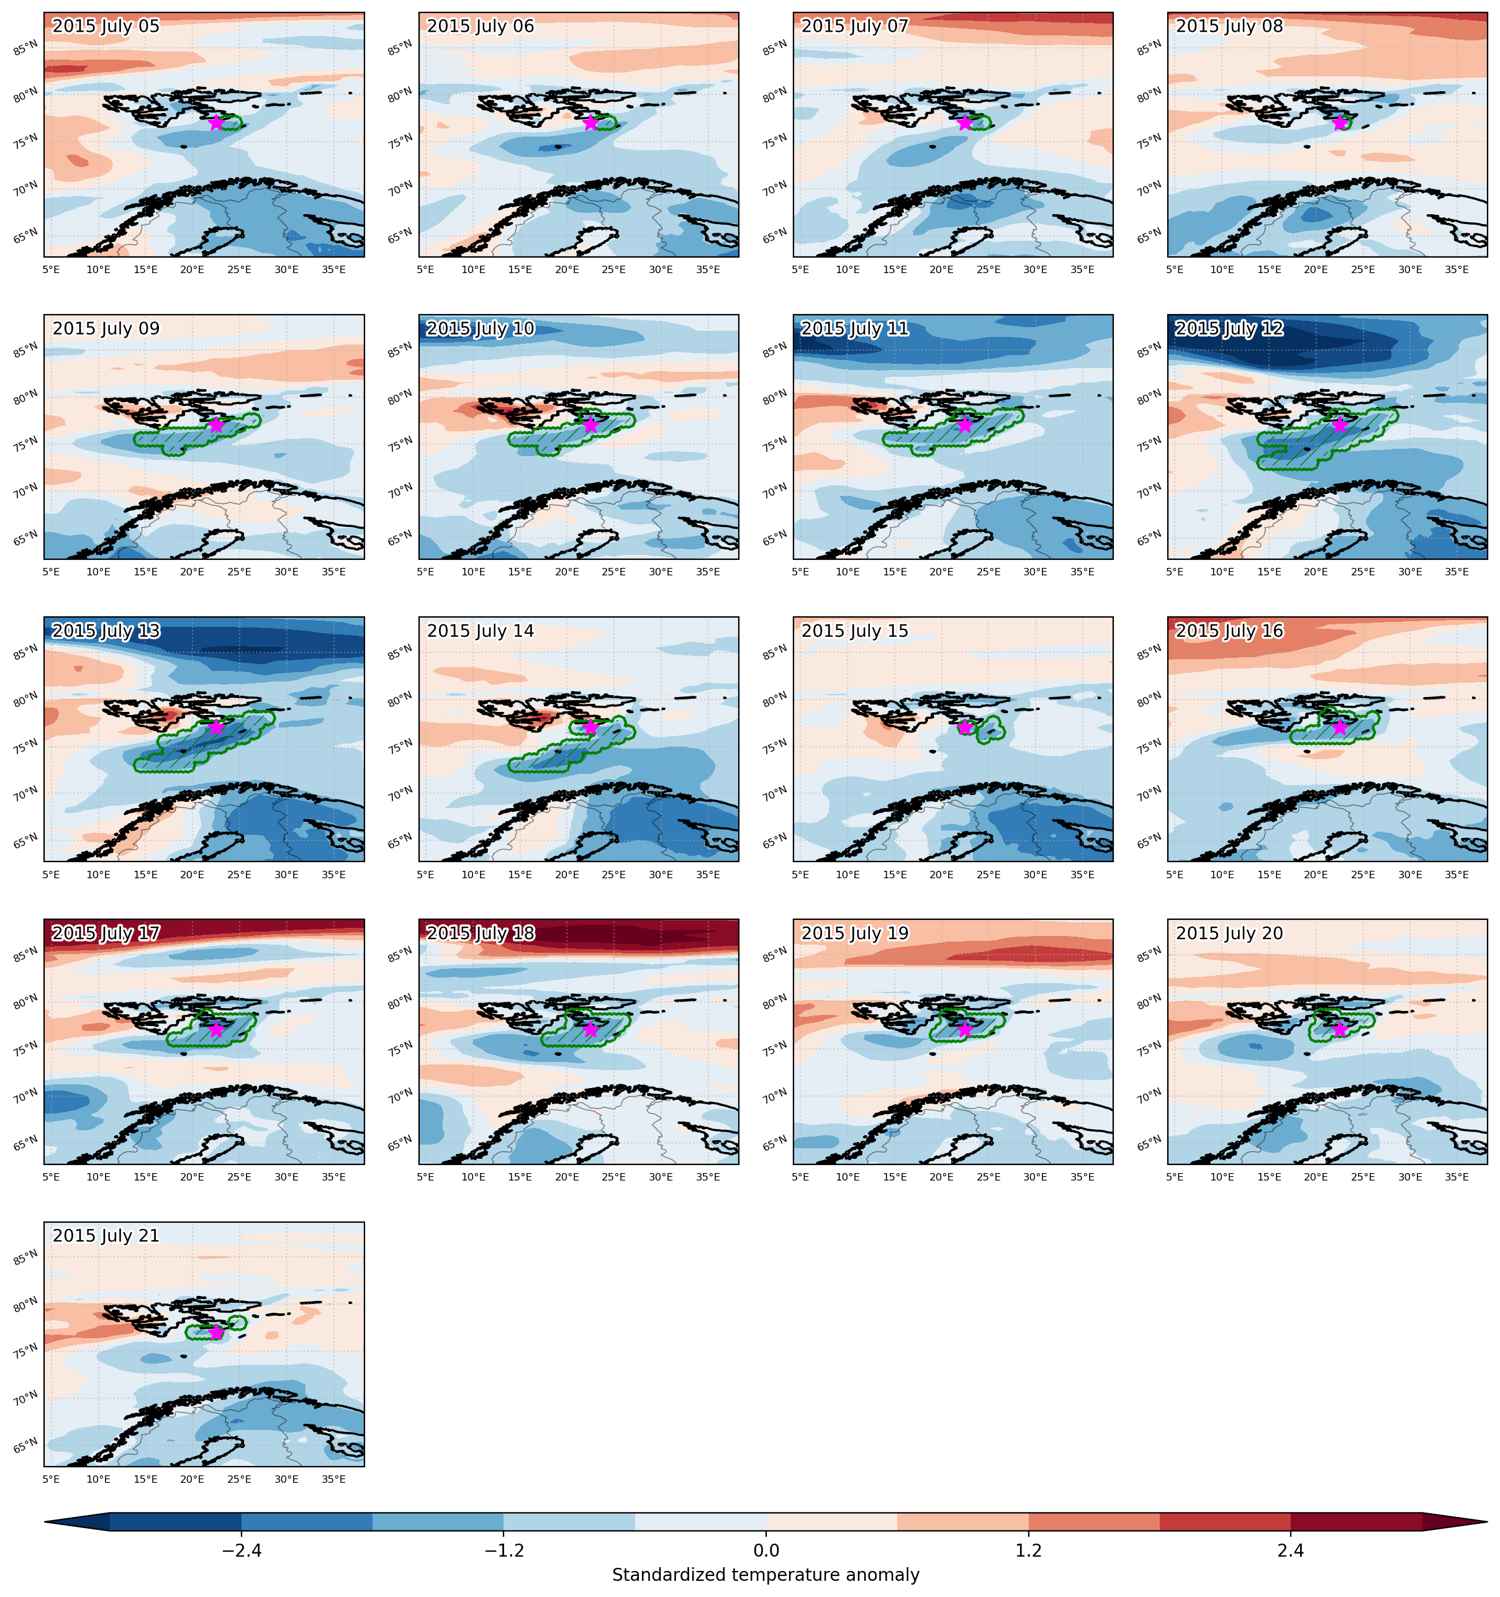
Fig. 3: Maps illustrating the evolution of standardized temperature anomalies during the event.

Event ID: Cold_spell_2015-Jul-05_to_2015-Jul-21_22.5_77.0

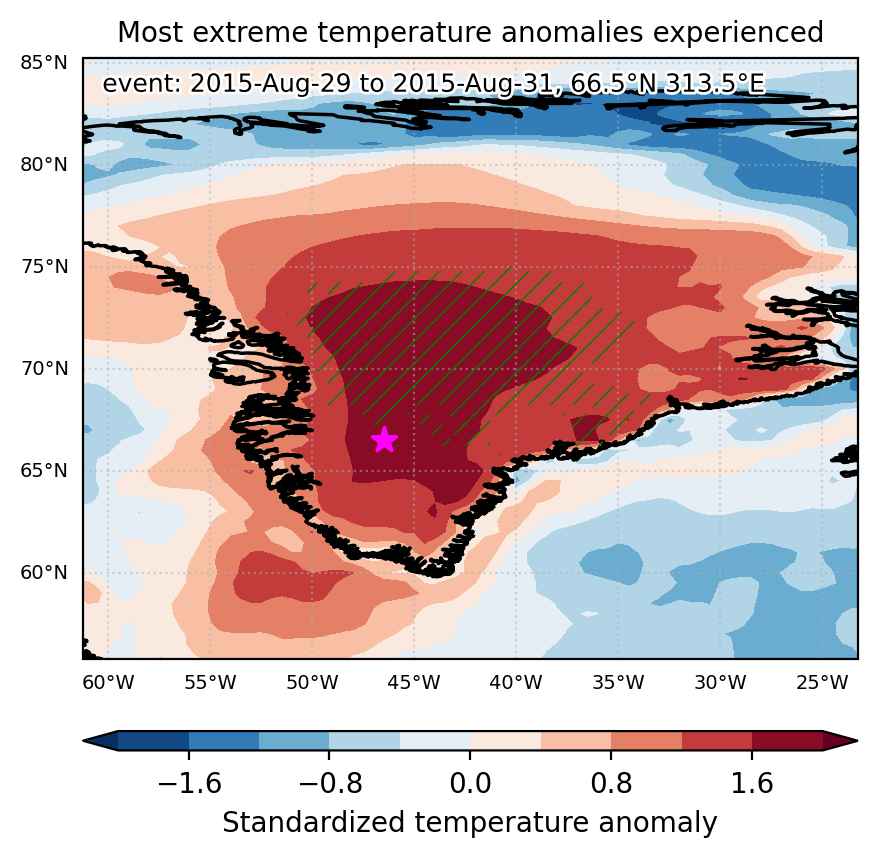
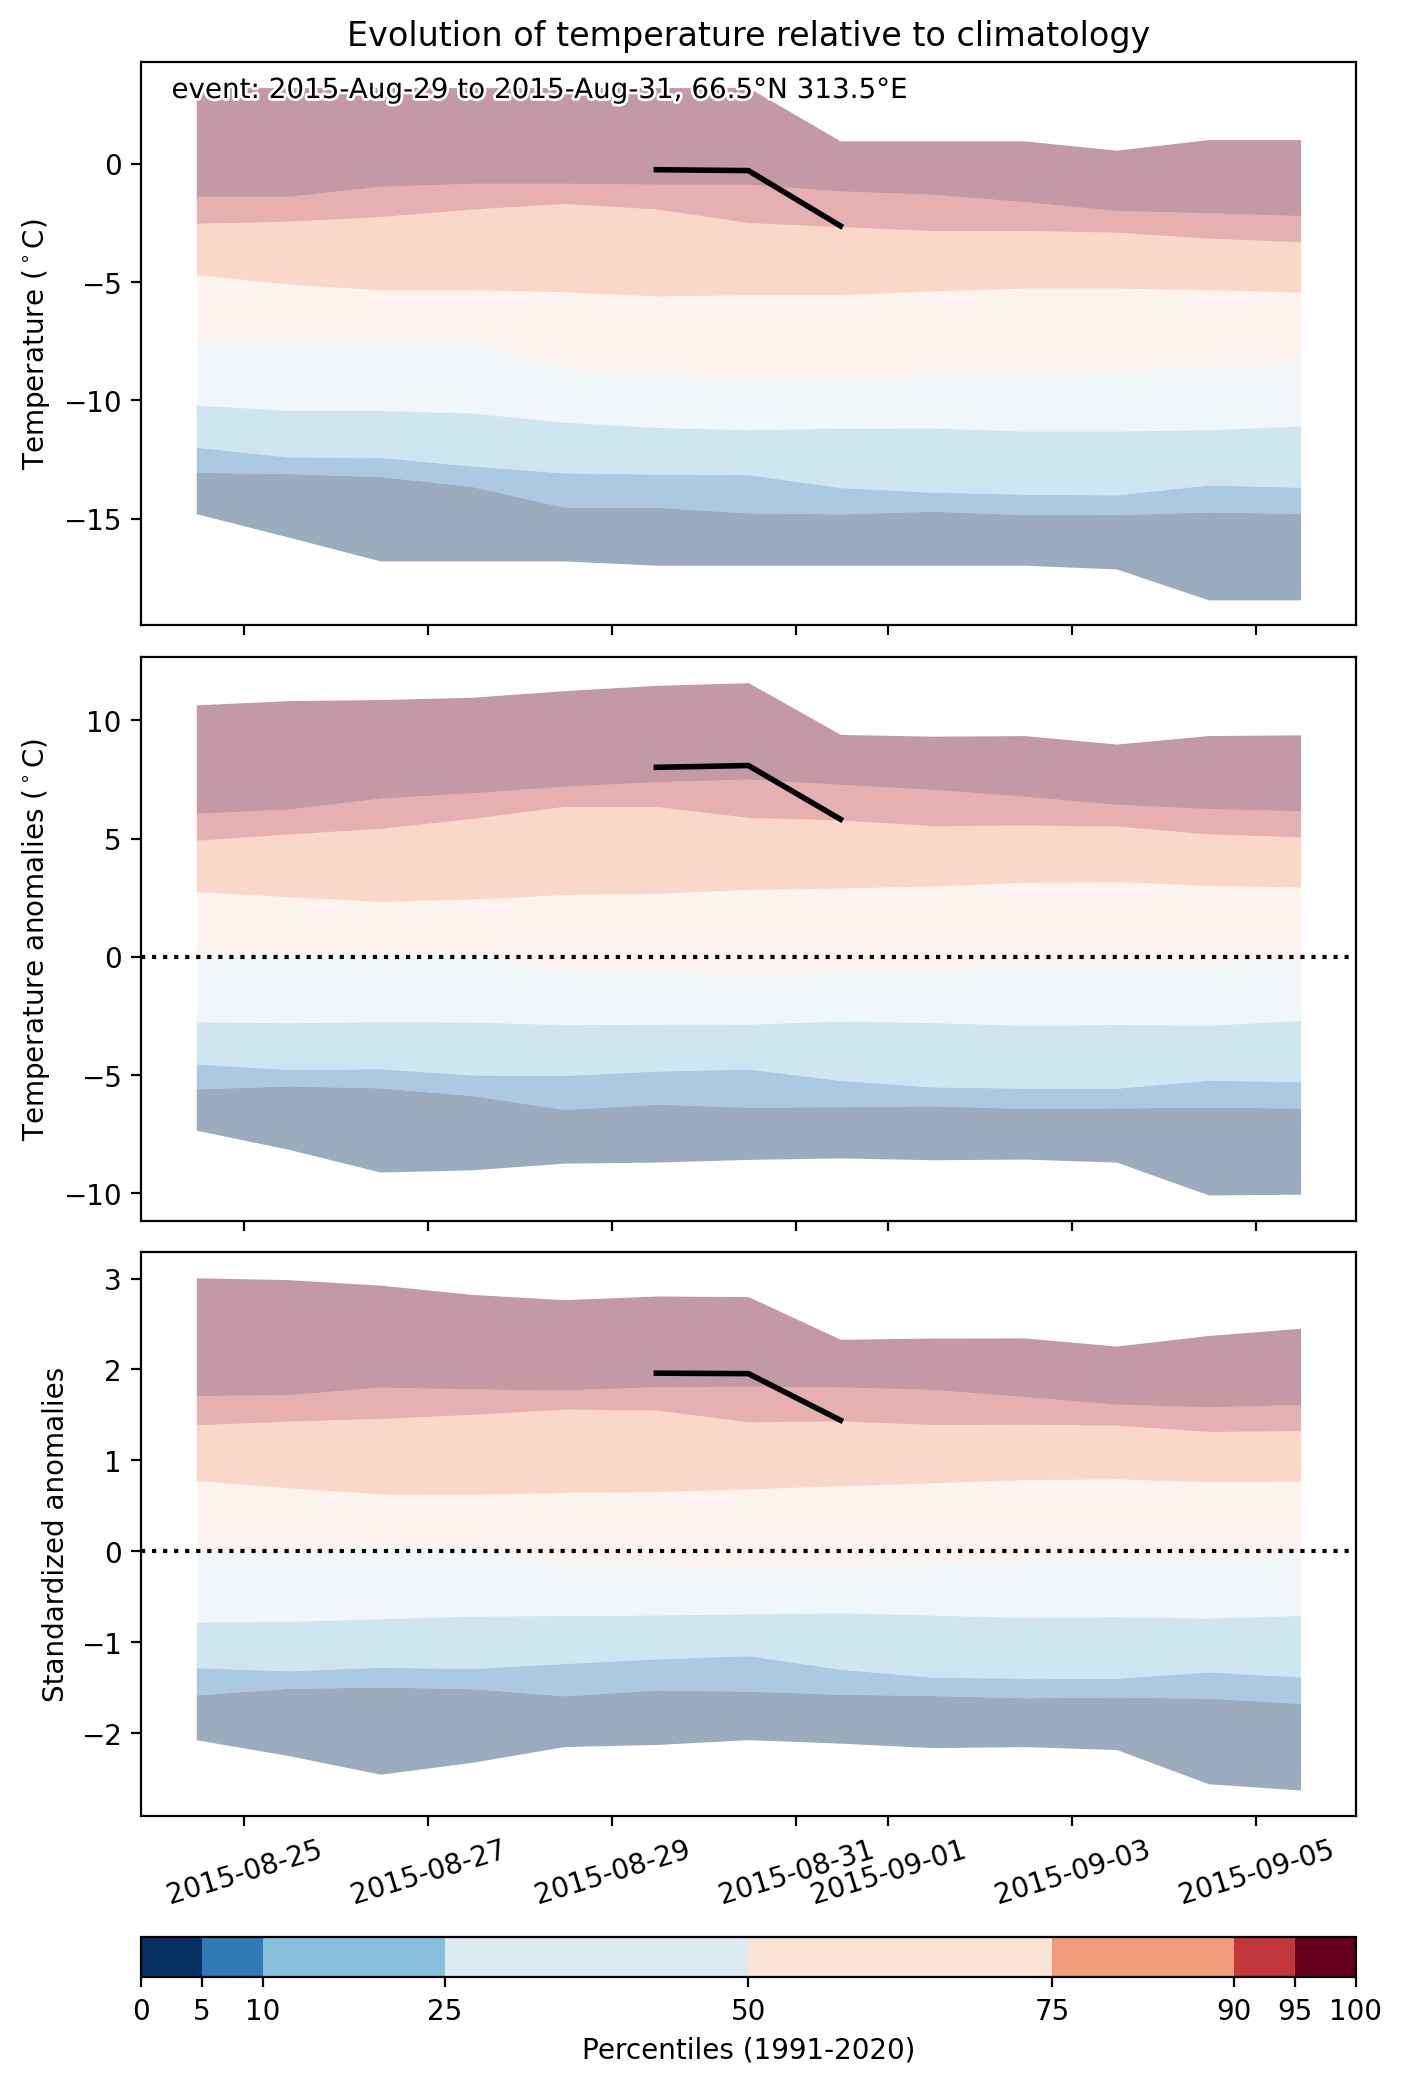
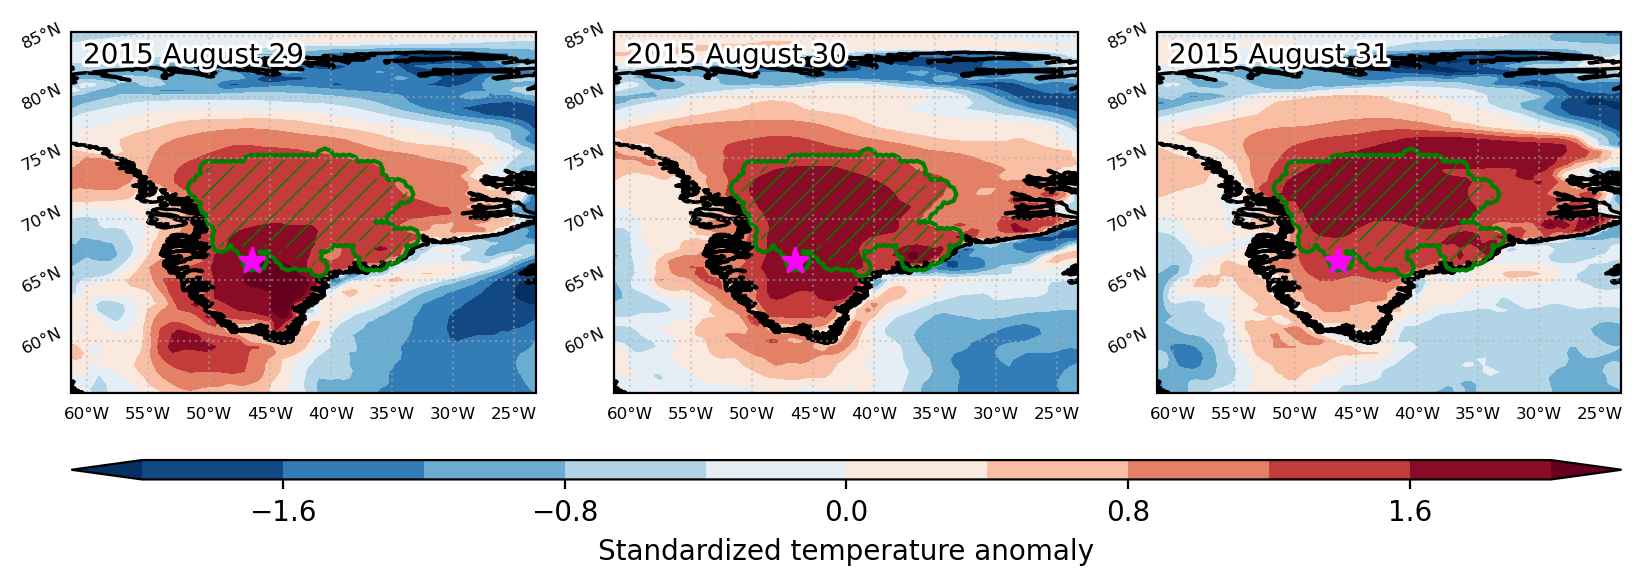
Heat wave occuring from August 29 2015 to August 31 2015 at 66.5°N 313.5°E

Download data: JSON

Event type: Heat wave

Countries affected (identified with ArcGIS Online; provided only for geographical reference):

  • Greenland

Duration: 3 days

Time span: August 29 2015 to August 31 2015

Statistics over entire affected area:

  • Mean temperature anomaly: 7.6 °C
  • Mean temperature: -6.7 °C
  • Maximum temperature anomaly: 10.2 °C
  • Maximum temperature: 4.2 °C

Event center: 66.5°N 313.5°E

Area affected: 428041 km$^2$


Fig. 1: Map of most extreme temperature anomalies (standardized) experienced during the event. The purple star indicates the center of the extreme event. Green hatching illustrates all areas under the effect of extremes at some time during the event.


Fig. 2: Evolution of temperature at the center of the event. The climatological percentile distribution is illustrated with color shadings.


Fig. 3: Maps illustrating the evolution of standardized temperature anomalies during the event.

Event ID: Heat_wave_2015-Aug-29_to_2015-Aug-31_313.5_66.5

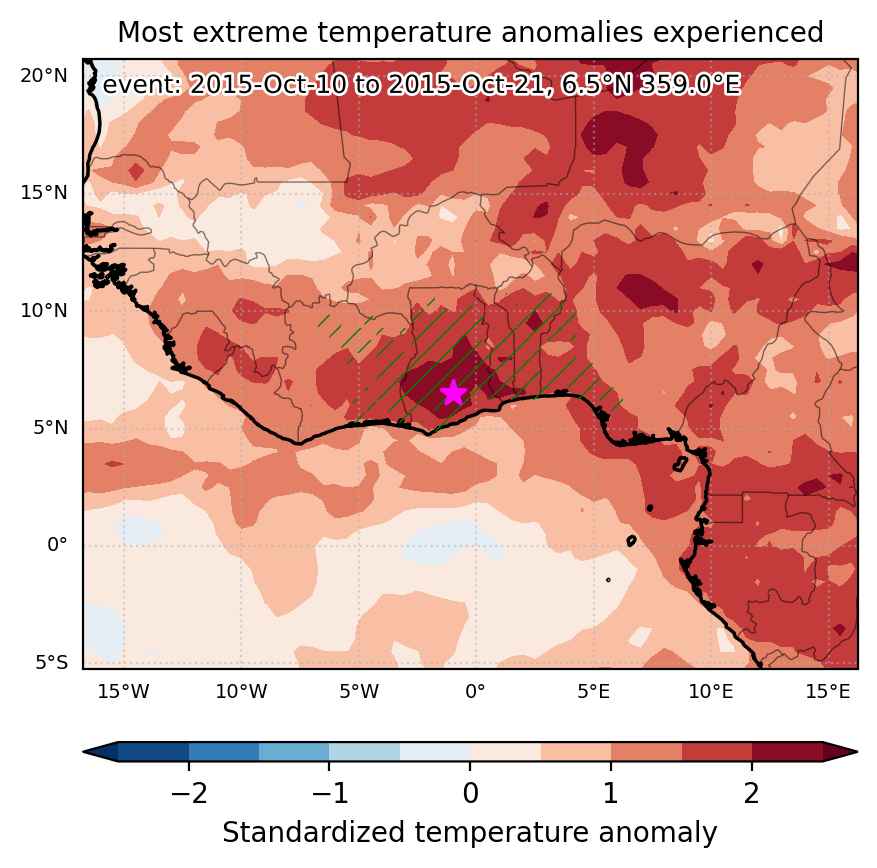
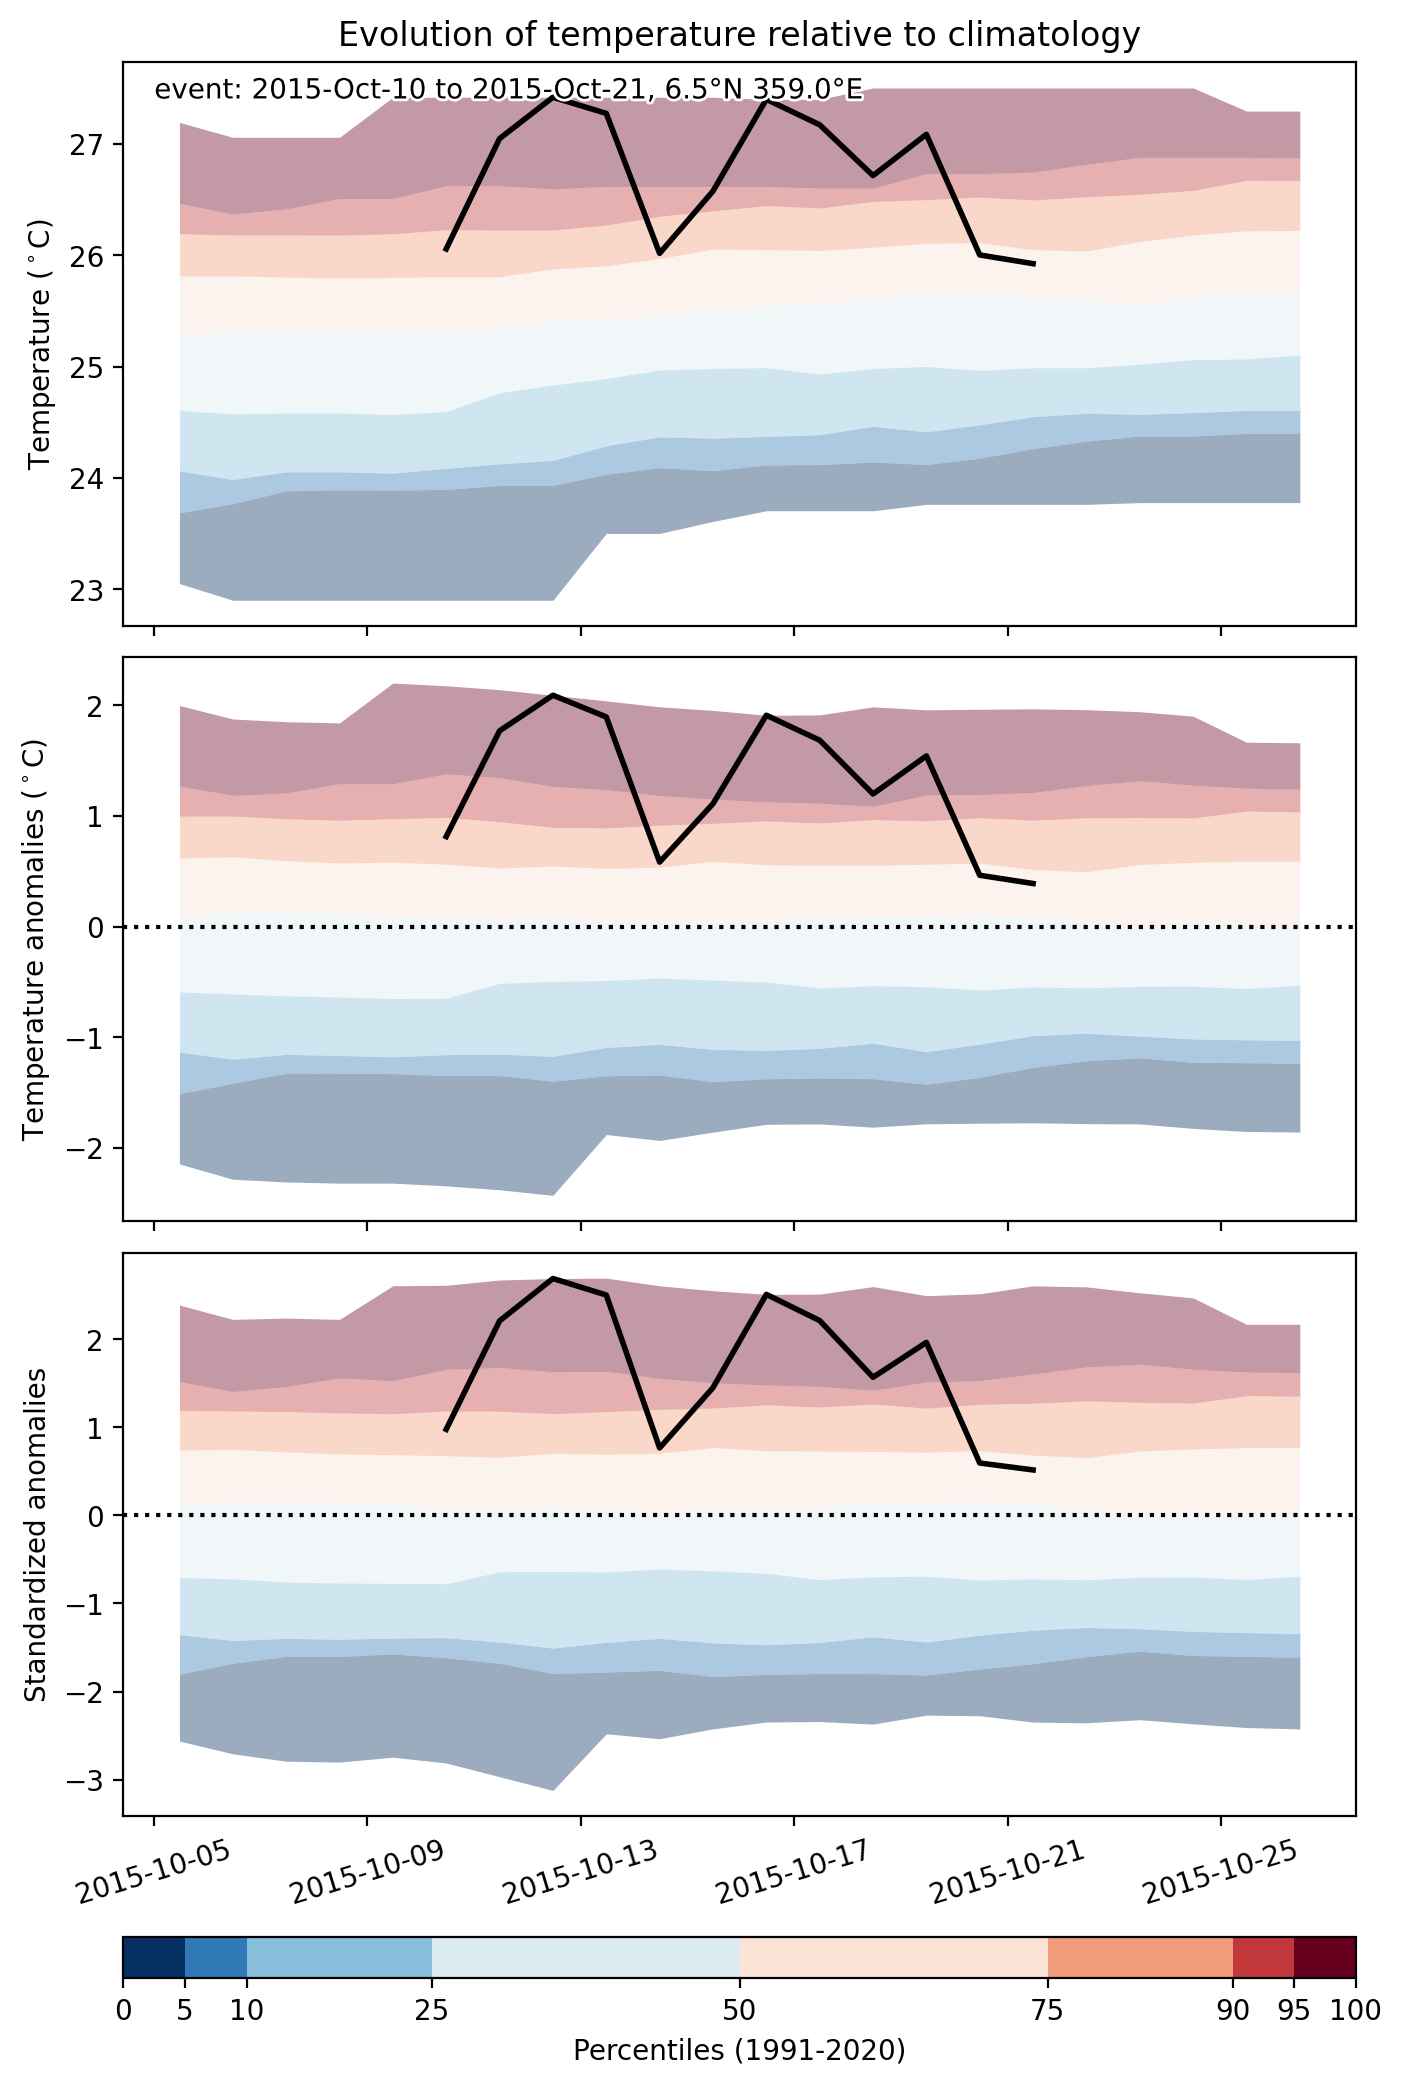
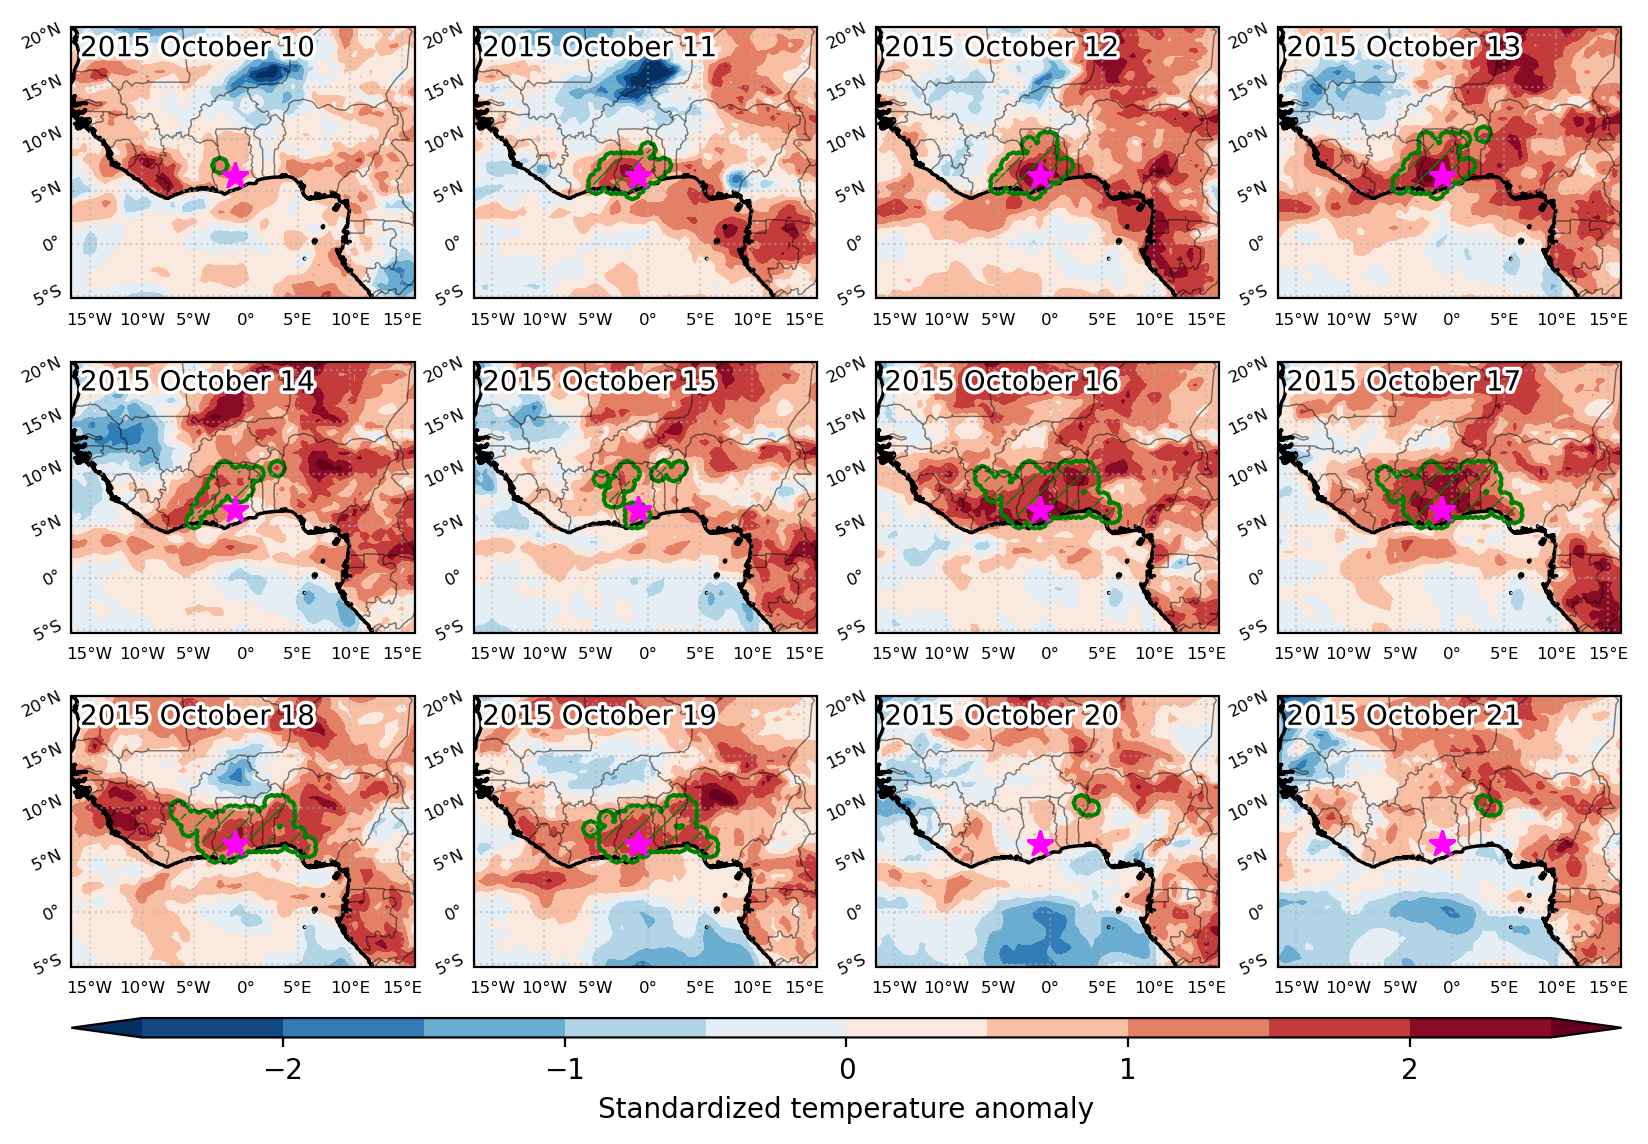
Heat wave occuring from October 10 2015 to October 21 2015 at 6.5°N 359.0°E

Download data: JSON

Event type: Heat wave

Countries affected (identified with ArcGIS Online; provided only for geographical reference):

  • Benin
  • Côte d’Ivoire
  • Ghana
  • Nigeria
  • Togo

Duration: 12 days

Time span: October 10 2015 to October 21 2015

Statistics over entire affected area:

  • Mean temperature anomaly: 1.4 °C
  • Mean temperature: 27.7 °C
  • Maximum temperature anomaly: 2.5 °C
  • Maximum temperature: 30.0 °C

Event center: 6.5°N 359.0°E

Area affected: 471391 km$^2$


Fig. 1: Map of most extreme temperature anomalies (standardized) experienced during the event. The purple star indicates the center of the extreme event. Green hatching illustrates all areas under the effect of extremes at some time during the event.


Fig. 2: Evolution of temperature at the center of the event. The climatological percentile distribution is illustrated with color shadings.


Fig. 3: Maps illustrating the evolution of standardized temperature anomalies during the event.

Event ID: Heat_wave_2015-Oct-10_to_2015-Oct-21_359.0_6.5