Cold spell occuring from November 26 2018 to December 30 2018 at -1.0°S 313.0°E

Download data: JSON

Event type: Cold spell

Countries affected (identified with ArcGIS Online; provided only for geographical reference):

  • Bolivia
  • Brazil
  • French Guiana
  • Guyana
  • Suriname

Duration: 35 days

Time span: November 26 2018 to December 30 2018

Statistics over entire affected area:

  • Mean temperature anomaly: -2.1 °C
  • Mean temperature: 24.8 °C
  • Minimum temperature anomaly: -6.7 °C
  • Minimum temperature: 19.7 °C

Event center: -1.0°S 313.0°E

Area affected: 4758229 km$^2$
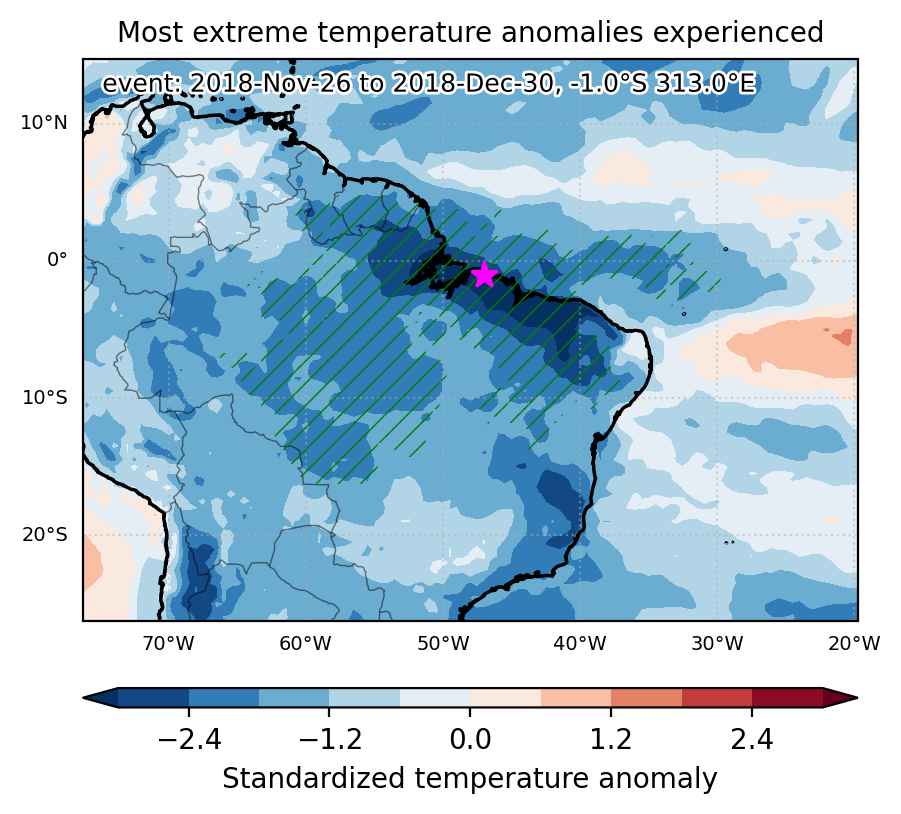

Fig. 1: Map of most extreme temperature anomalies (standardized) experienced during the event. The purple star indicates the center of the extreme event. Green hatching illustrates all areas under the effect of extremes at some time during the event.
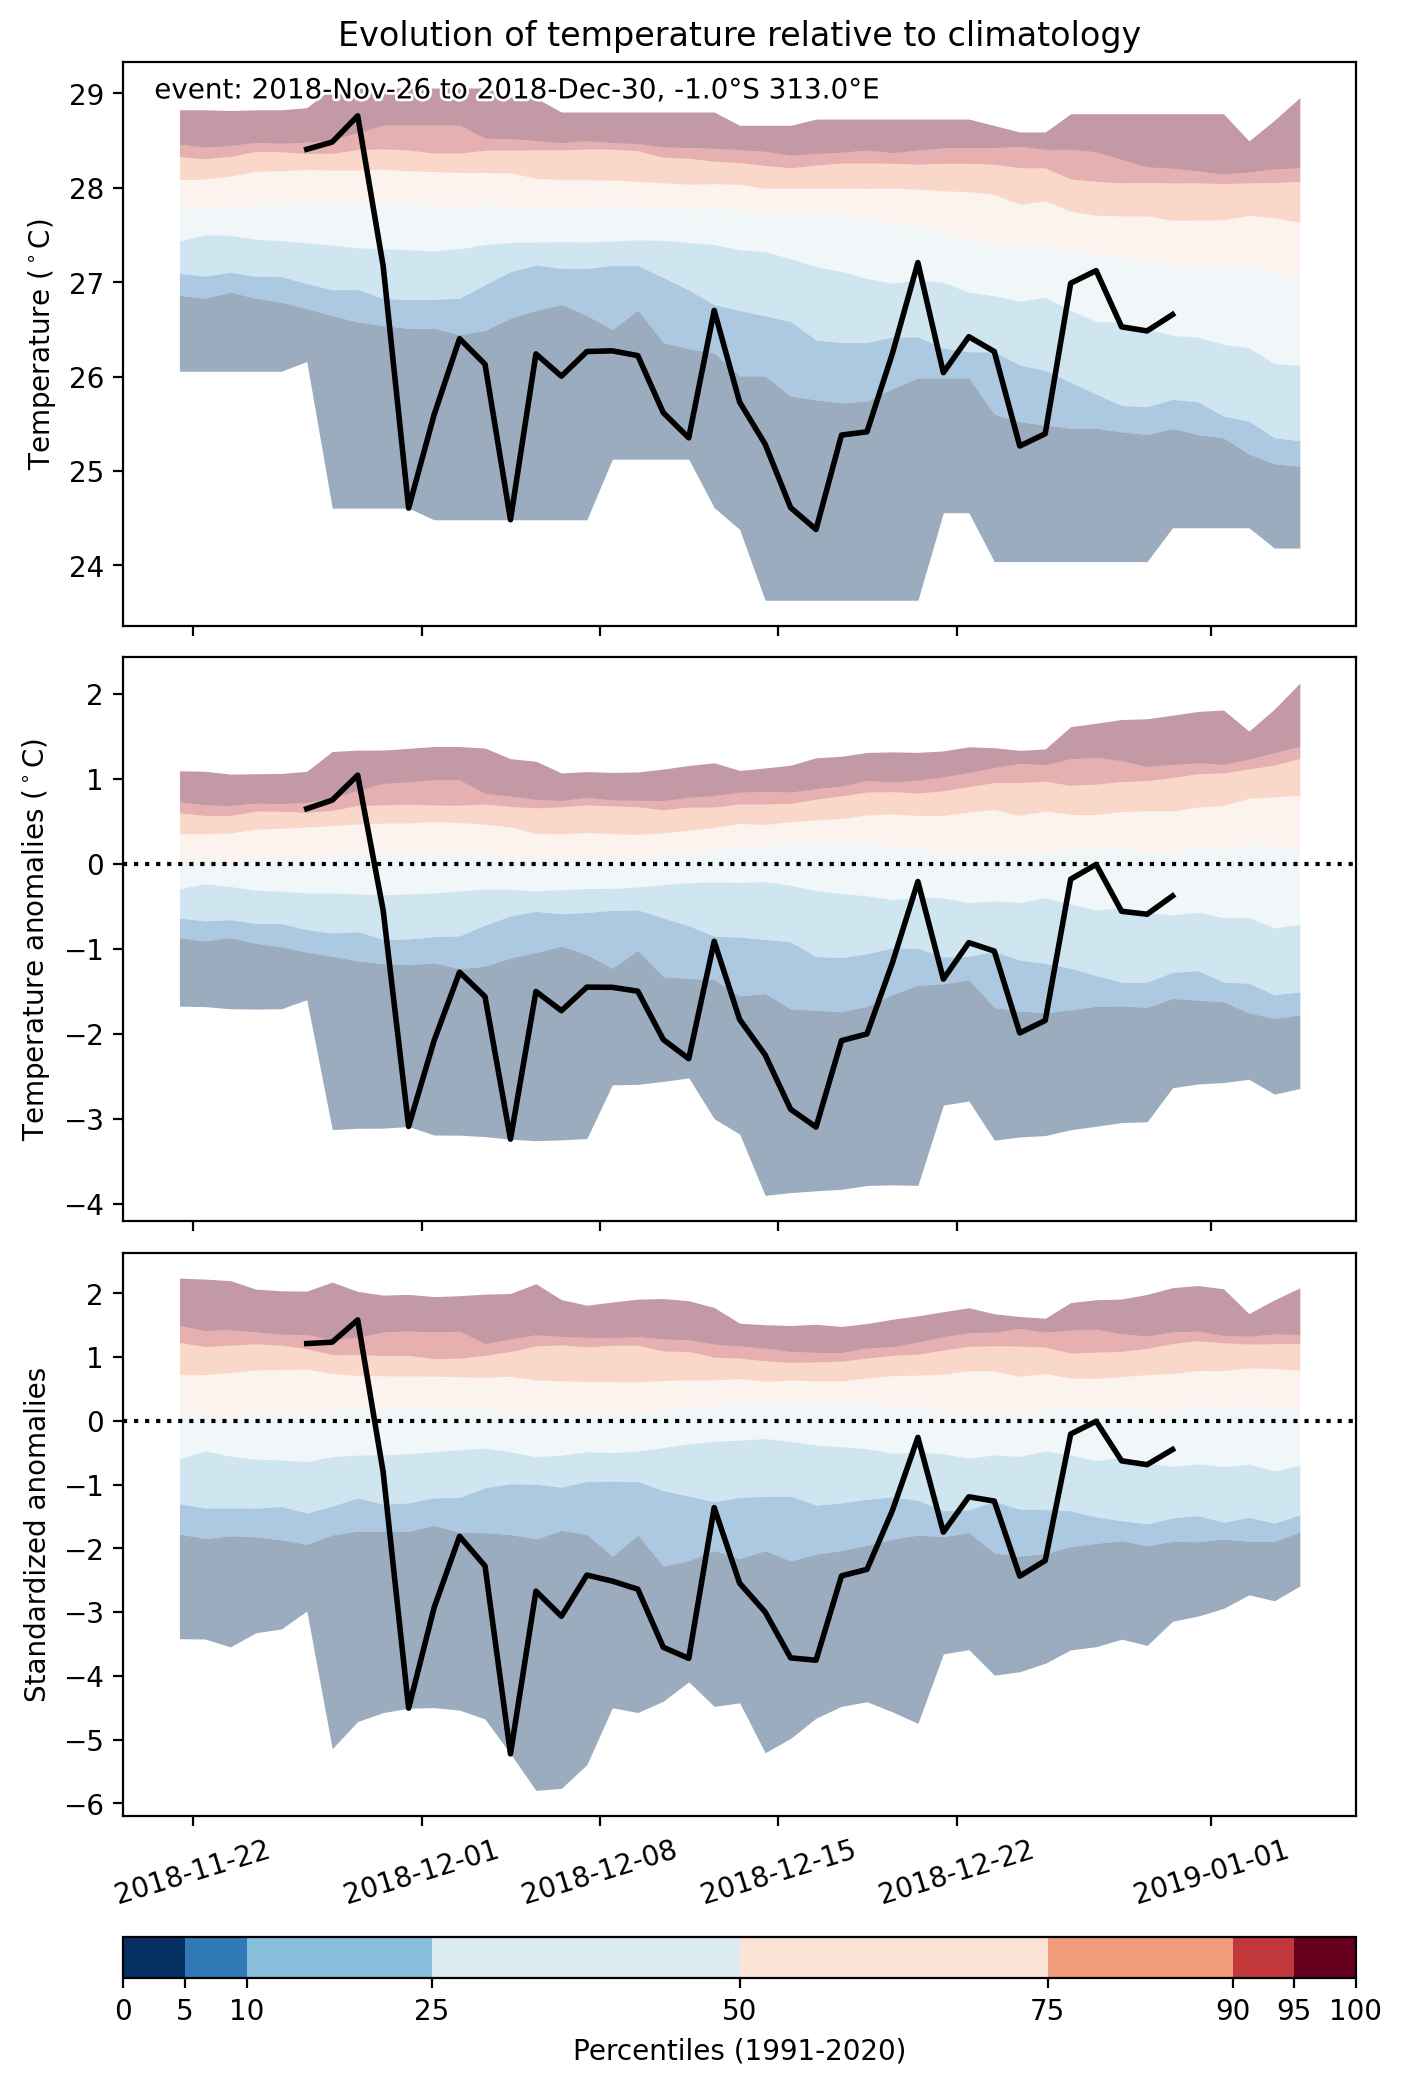


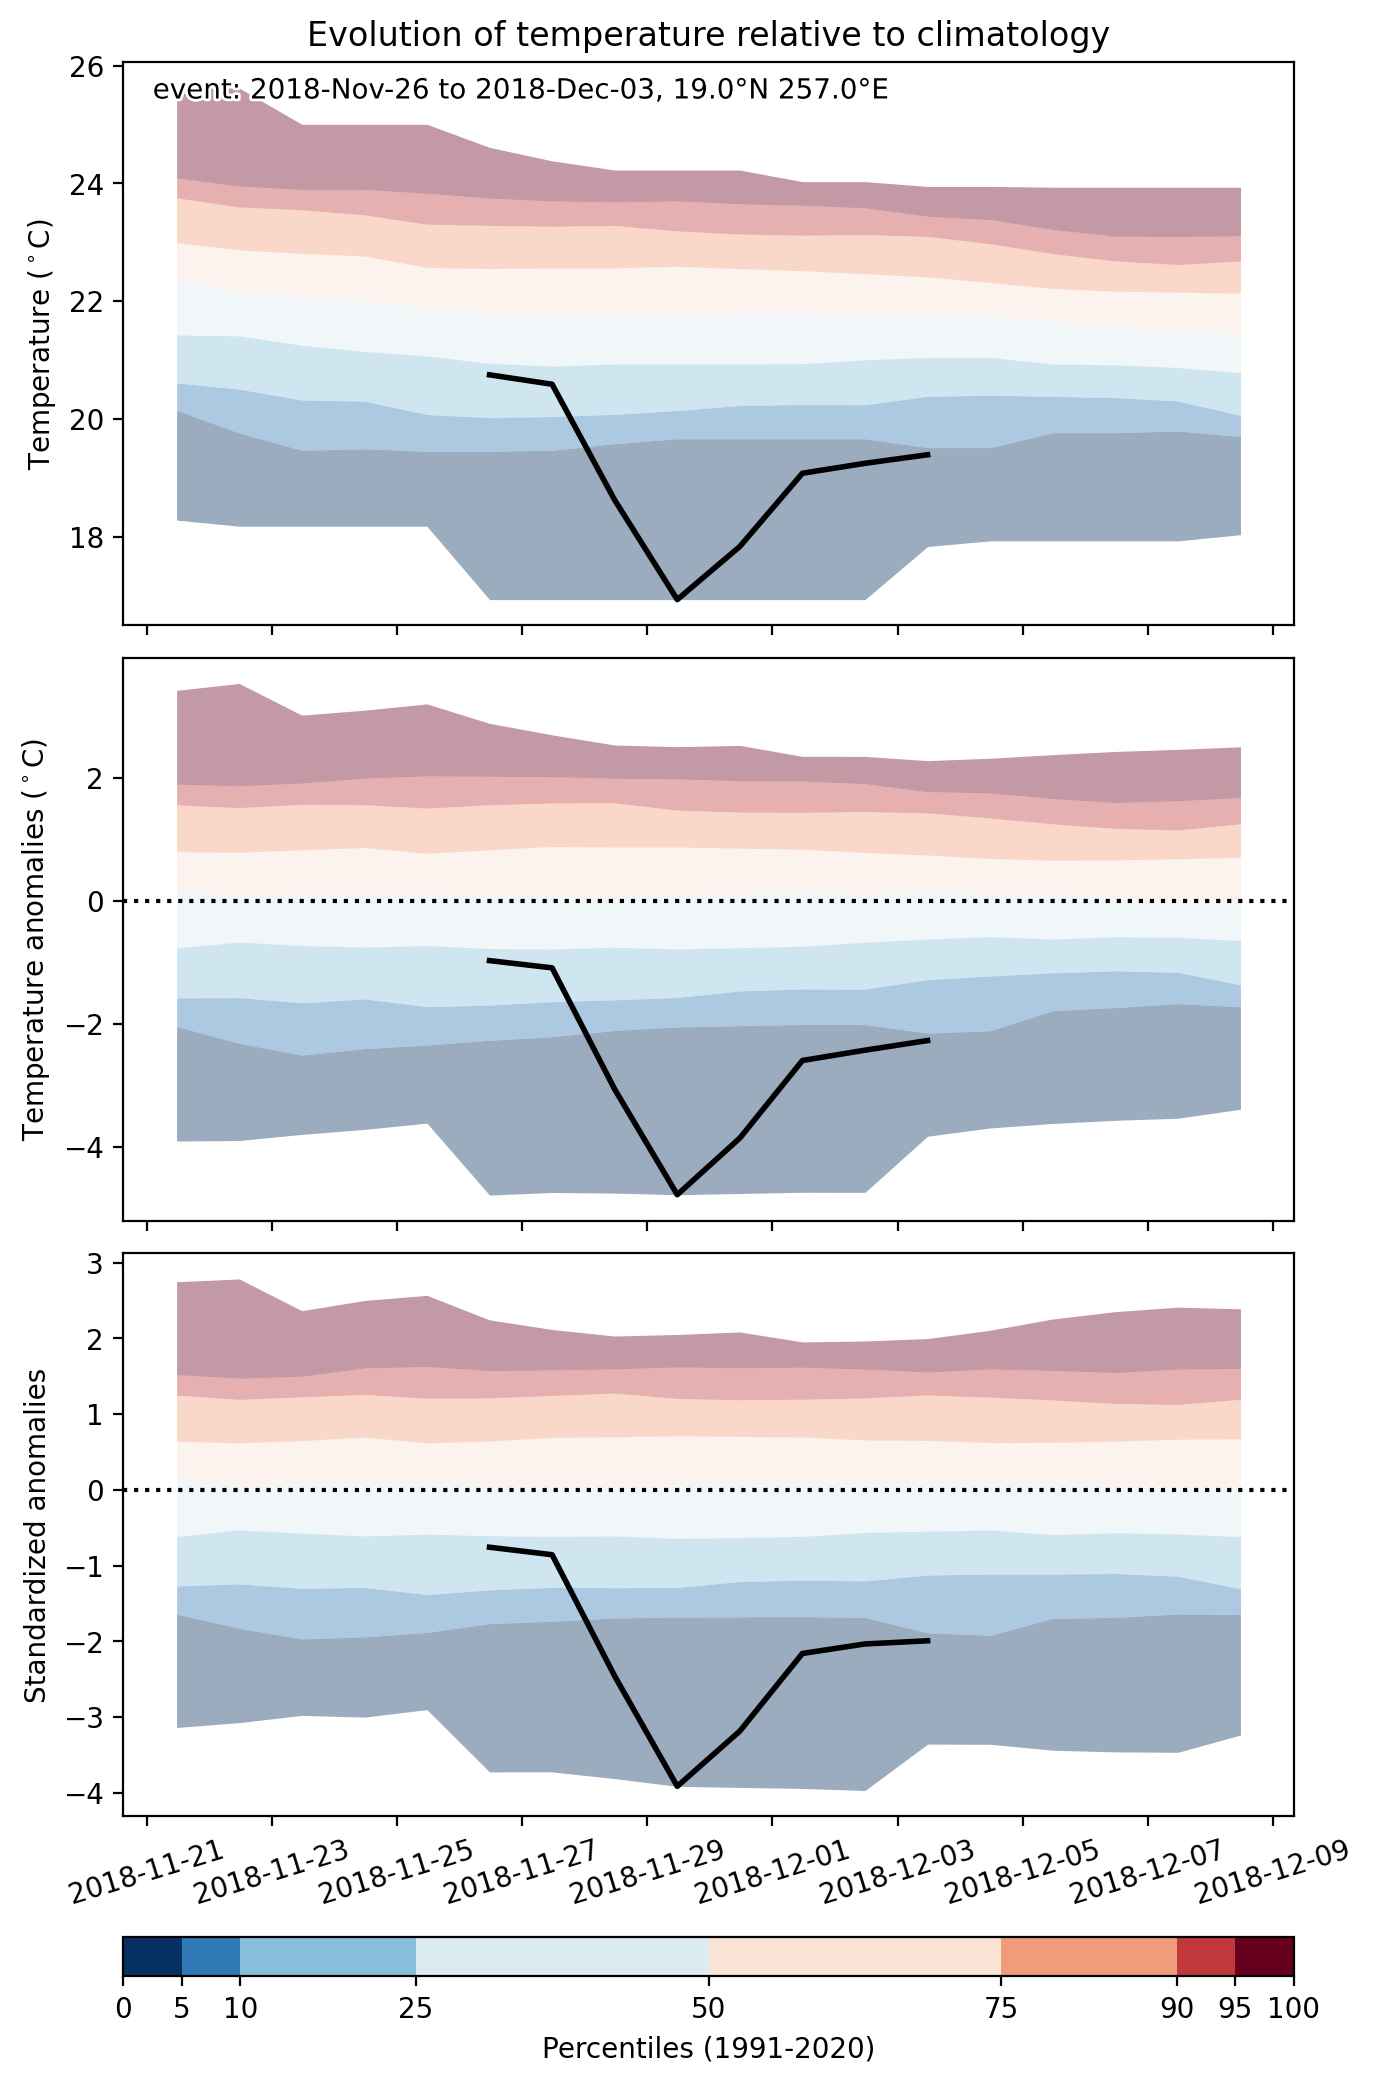
Fig. 2: Evolution of temperature at the center of the event. The climatological percentile distribution is illustrated with color shadings.
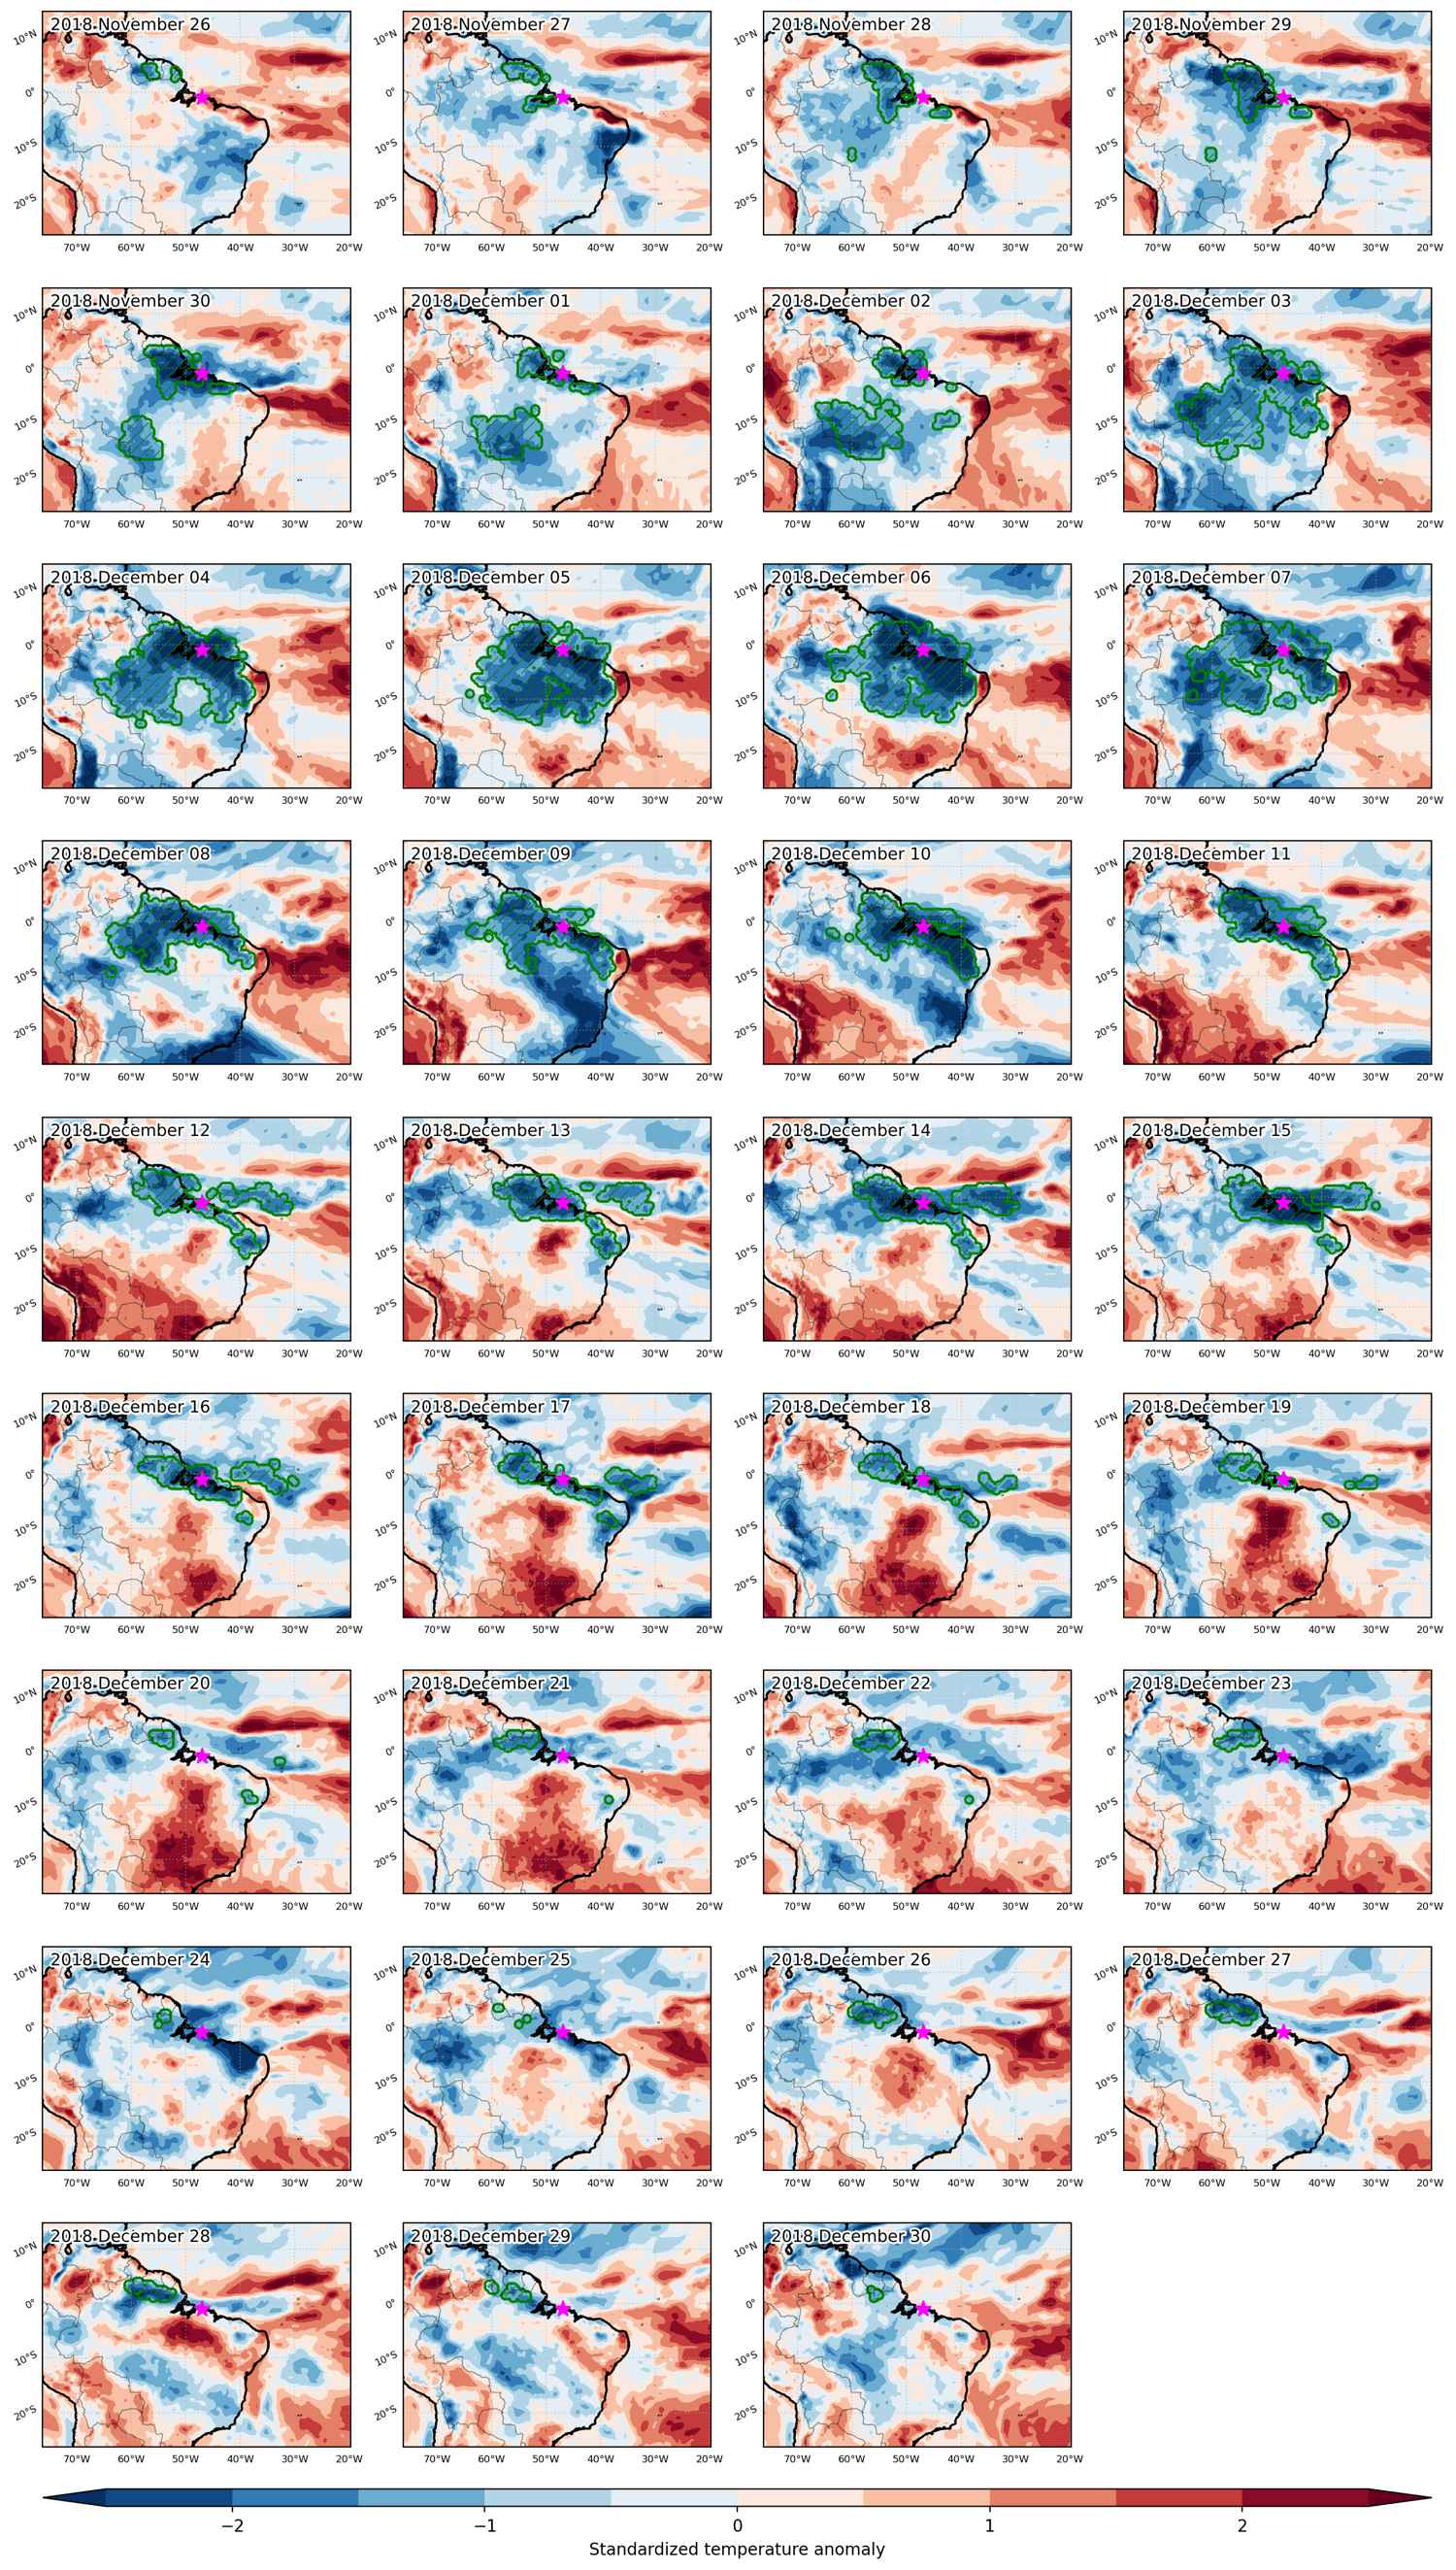


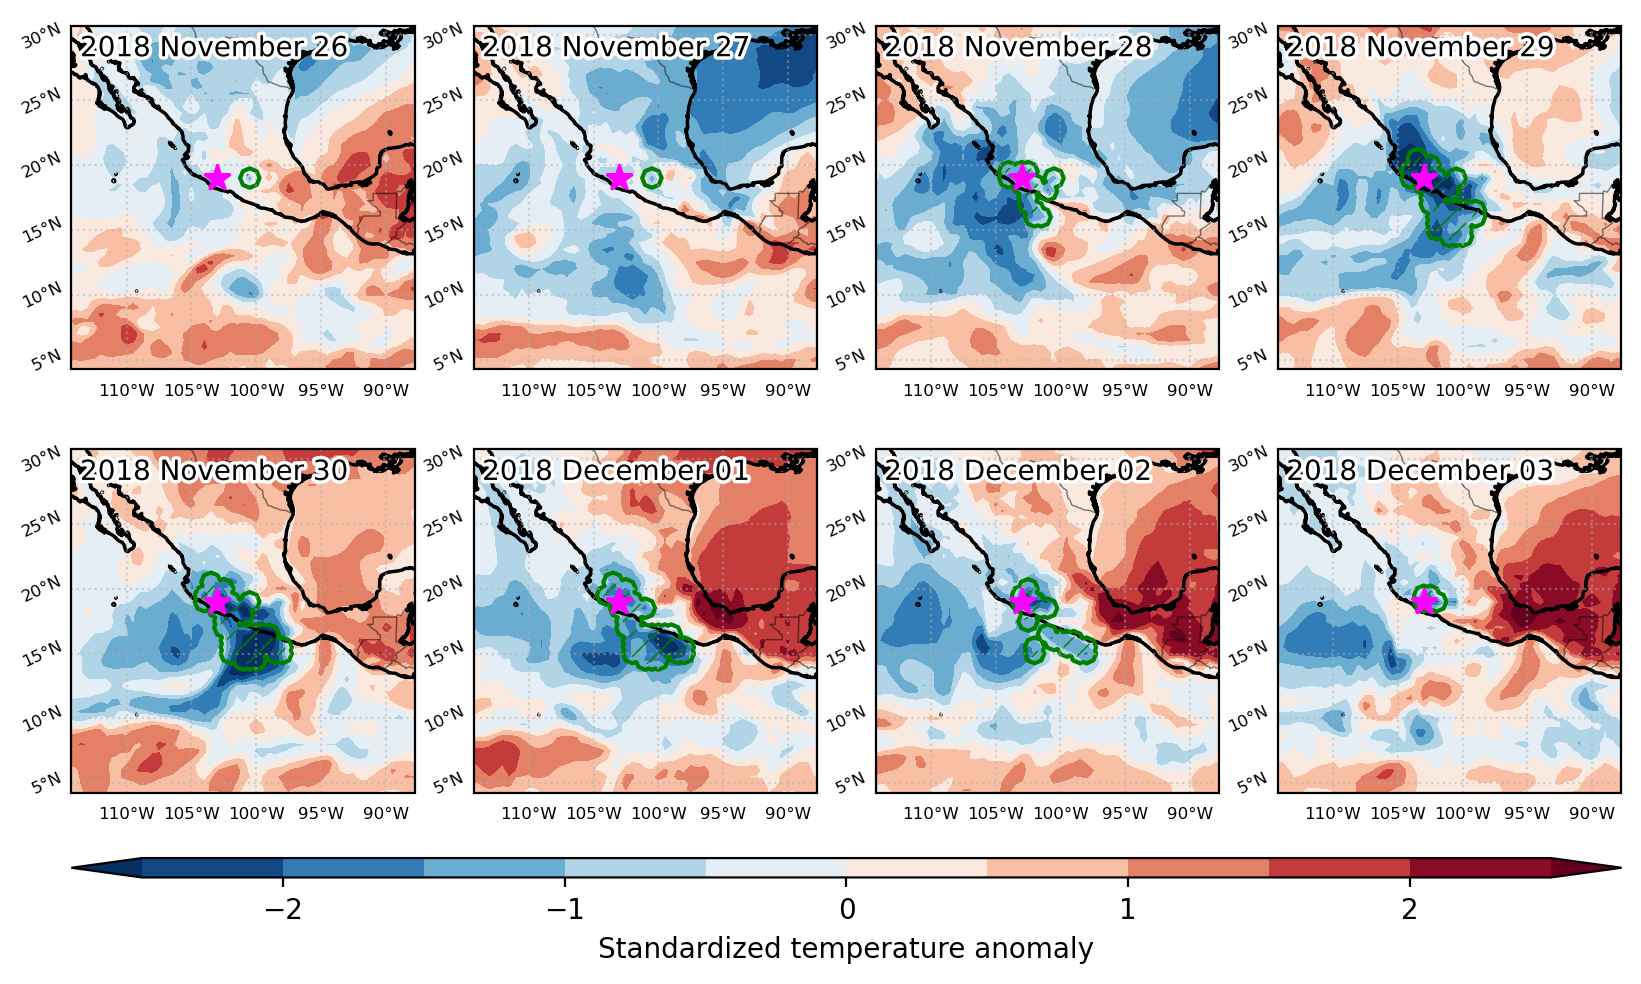
Fig. 3: Maps illustrating the evolution of standardized temperature anomalies during the event.

Event ID: Cold_spell_2018-Nov-26_to_2018-Dec-30_313.0_-1.0
Cold spell occuring from November 26 2018 to December 03 2018 at 19.0°N 257.0°E

Download data: JSON

Event type: Cold spell

Countries affected (identified with ArcGIS Online; provided only for geographical reference):

  • Mexico

Duration: 8 days

Time span: November 26 2018 to December 03 2018

Statistics over entire affected area:

  • Mean temperature anomaly: -1.8 °C
  • Mean temperature: 23.2 °C
  • Minimum temperature anomaly: -5.2 °C
  • Minimum temperature: 12.7 °C

Event center: 19.0°N 257.0°E

Area affected: 168454 km$^2$


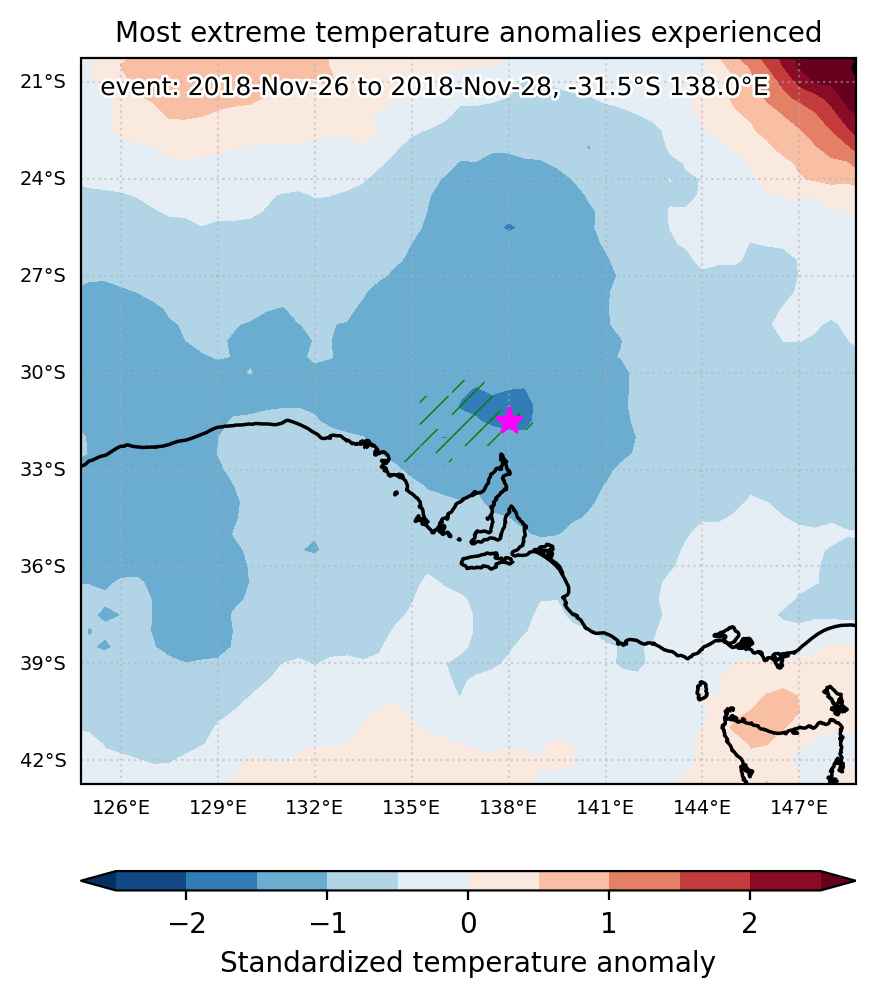
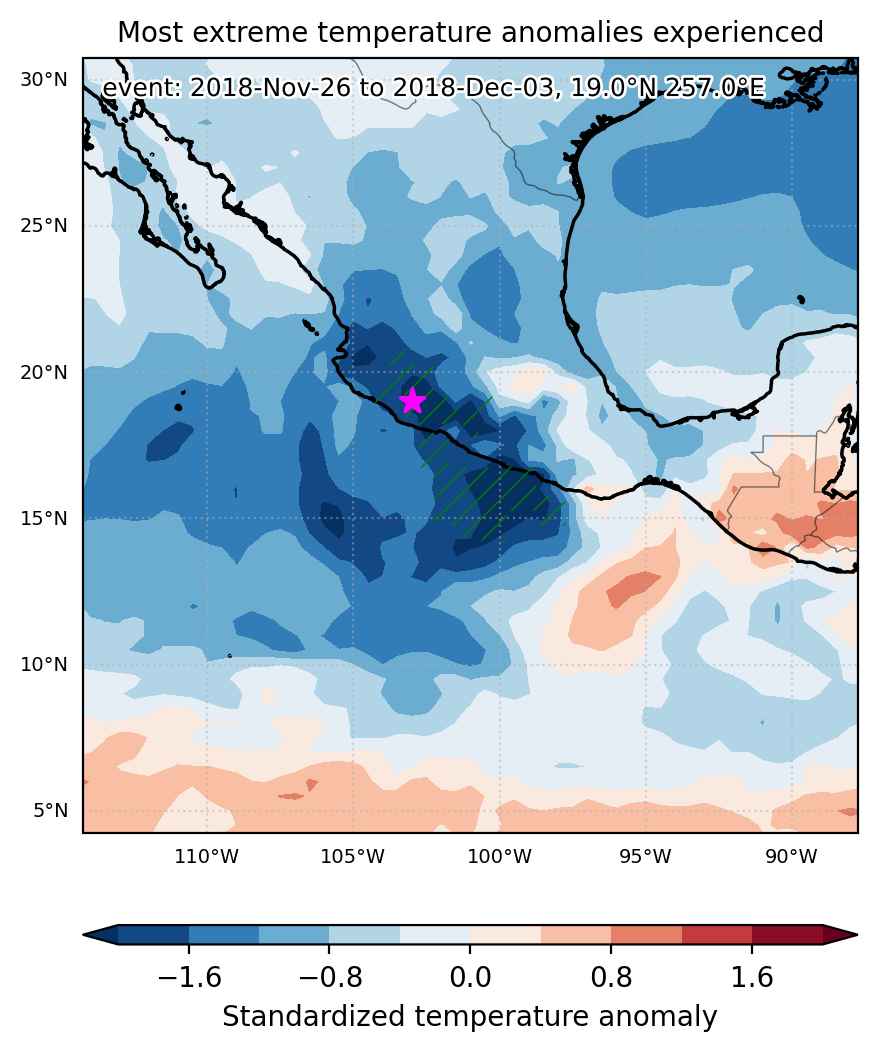
Fig. 1: Map of most extreme temperature anomalies (standardized) experienced during the event. The purple star indicates the center of the extreme event. Green hatching illustrates all areas under the effect of extremes at some time during the event.


Fig. 2: Evolution of temperature at the center of the event. The climatological percentile distribution is illustrated with color shadings.


Fig. 3: Maps illustrating the evolution of standardized temperature anomalies during the event.

Event ID: Cold_spell_2018-Nov-26_to_2018-Dec-03_257.0_19.0

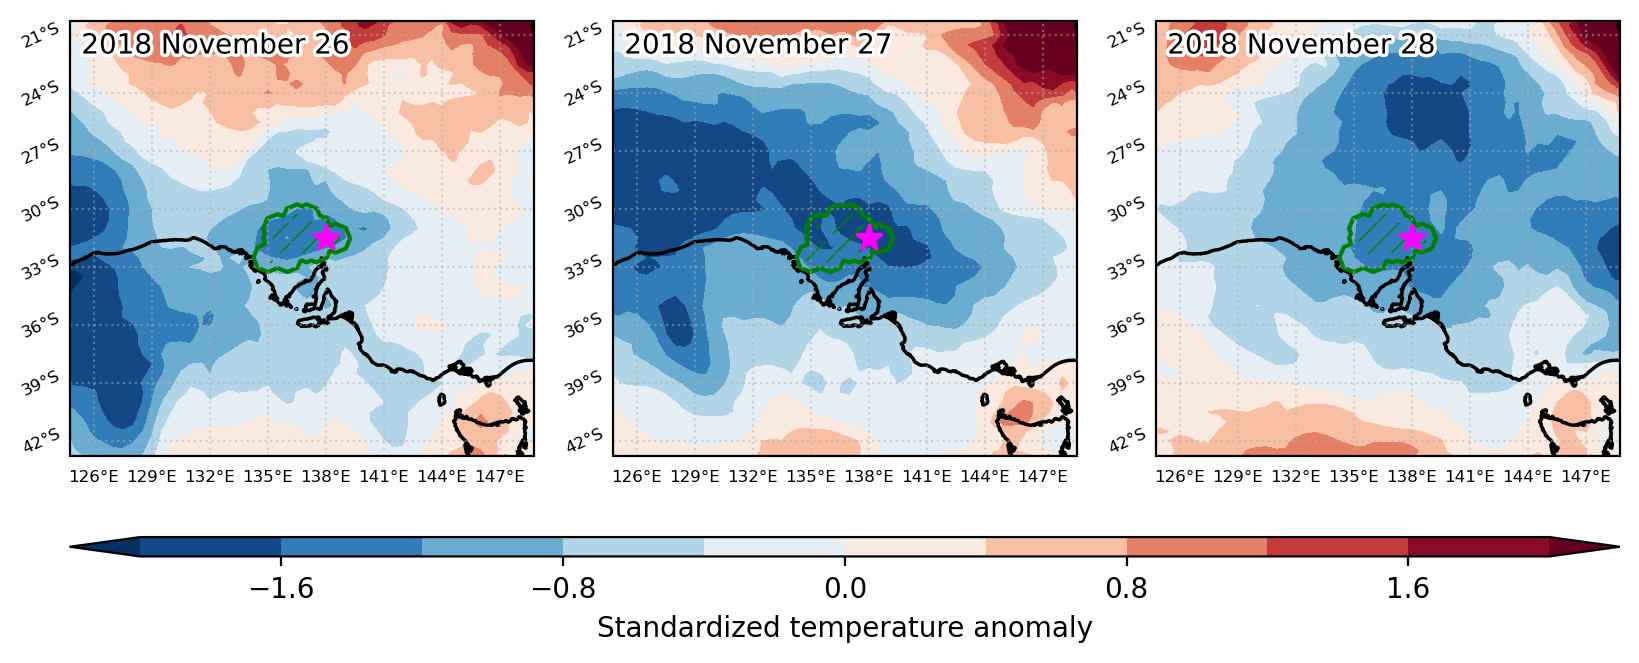
Cold spell occuring from November 26 2018 to November 28 2018 at -31.5°S 138.0°E

Download data: JSON

Event type: Cold spell

Countries affected (identified with ArcGIS Online; provided only for geographical reference):

  • Australia

Duration: 3 days

Time span: November 26 2018 to November 28 2018

Statistics over entire affected area:

  • Mean temperature anomaly: -6.7 °C
  • Mean temperature: 17.6 °C
  • Minimum temperature anomaly: -8.9 °C
  • Minimum temperature: 15.0 °C

Event center: -31.5°S 138.0°E

Area affected: 52708 km$^2$


Fig. 1: Map of most extreme temperature anomalies (standardized) experienced during the event. The purple star indicates the center of the extreme event. Green hatching illustrates all areas under the effect of extremes at some time during the event.


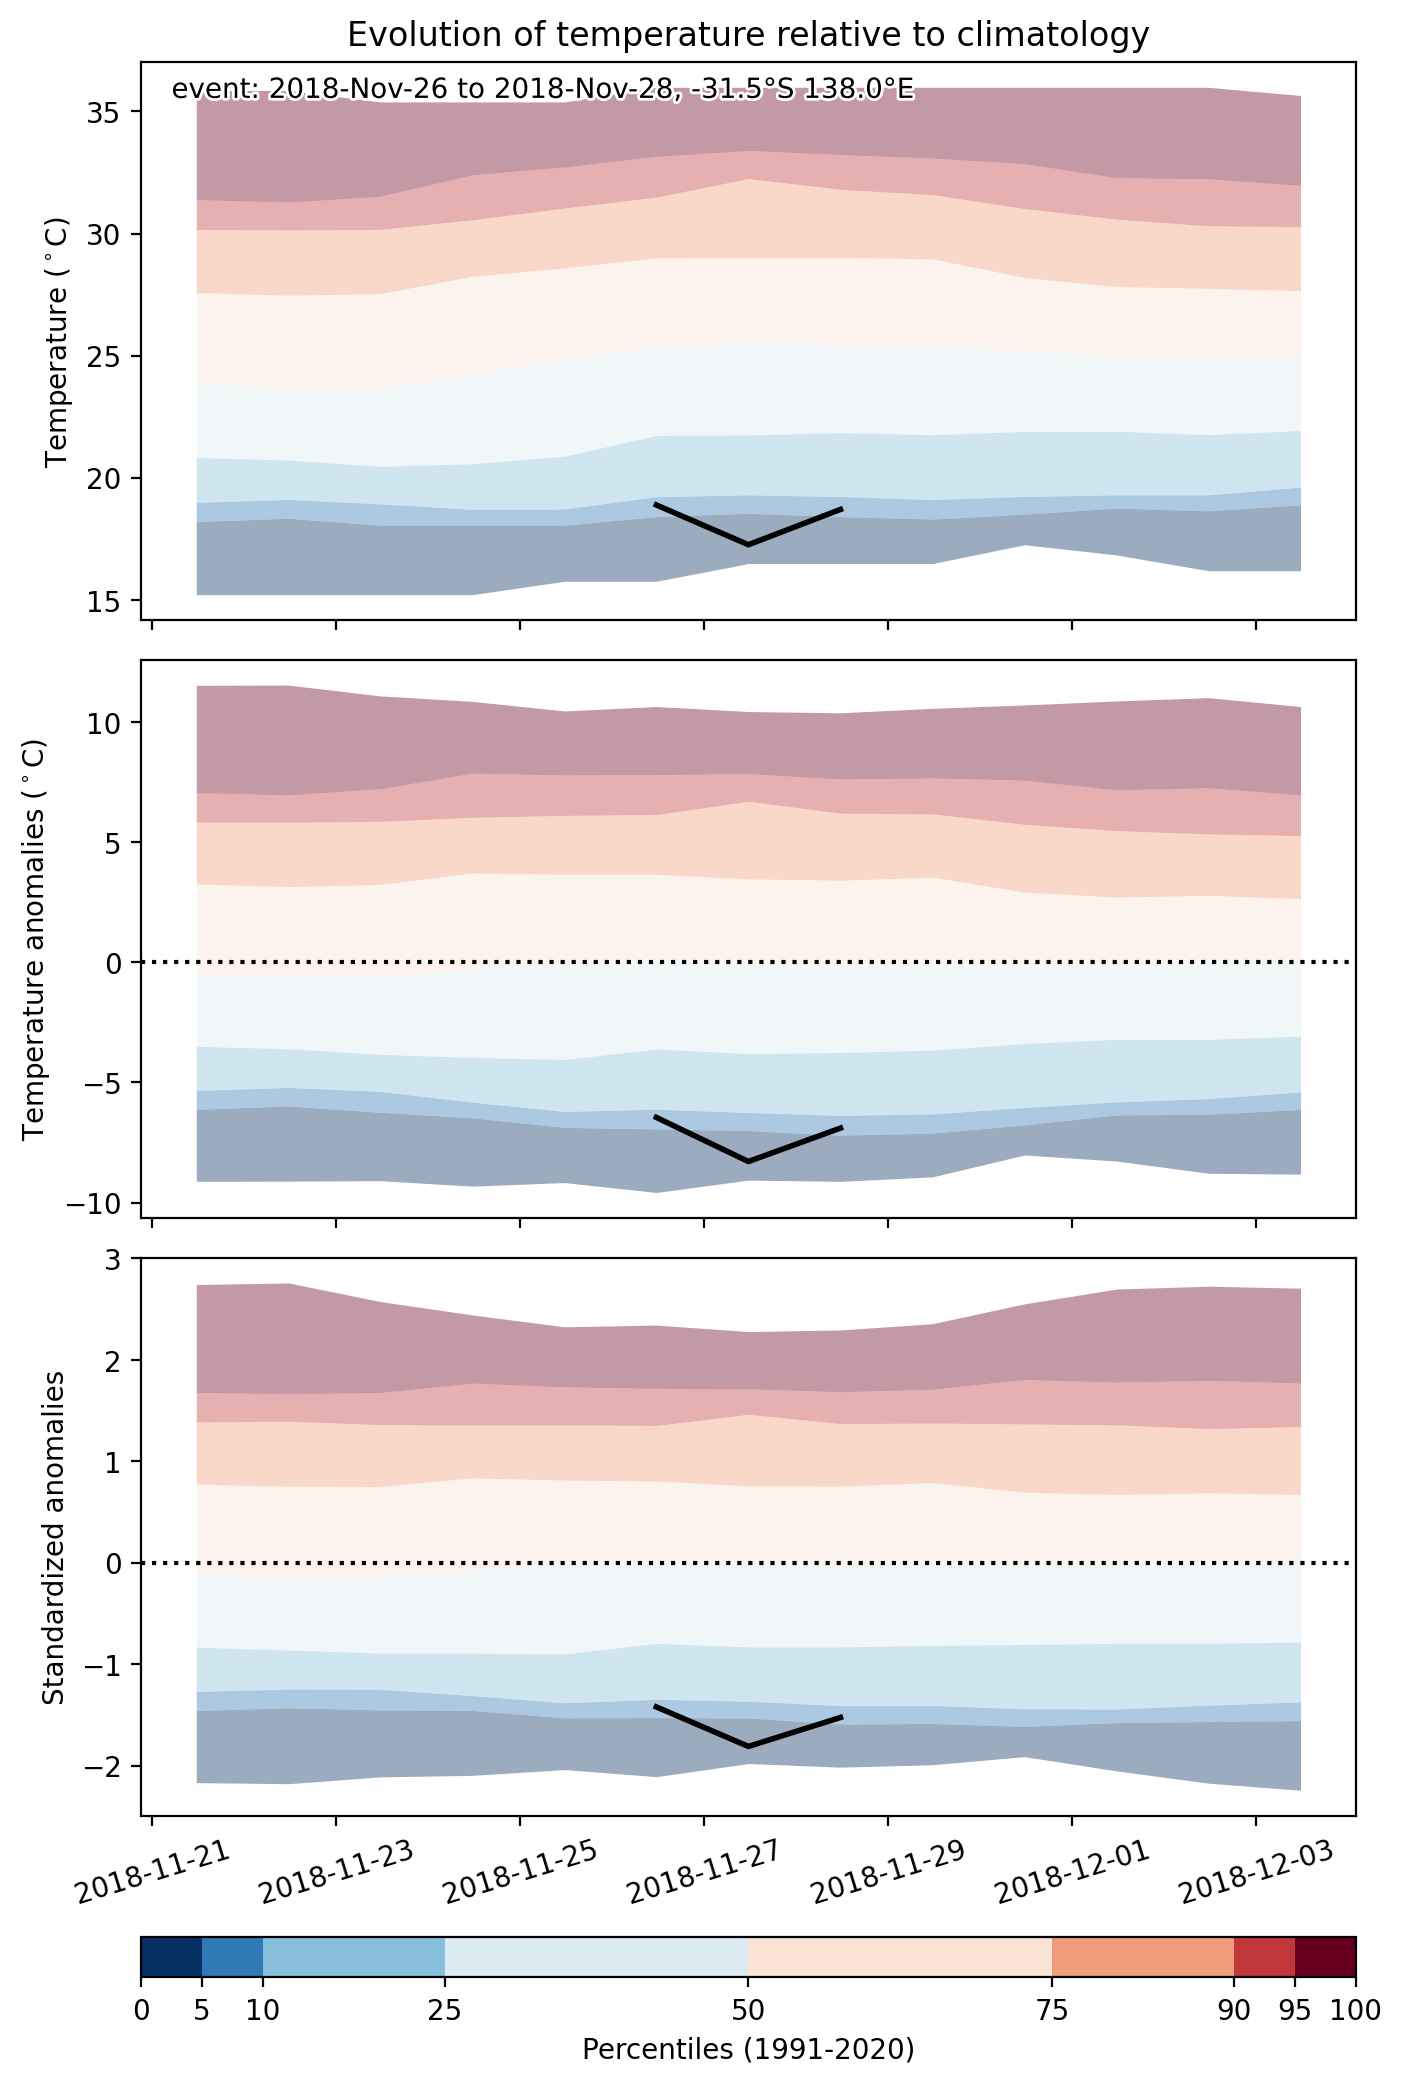
Fig. 2: Evolution of temperature at the center of the event. The climatological percentile distribution is illustrated with color shadings.


Fig. 3: Maps illustrating the evolution of standardized temperature anomalies during the event.

Event ID: Cold_spell_2018-Nov-26_to_2018-Nov-28_138.0_-31.5

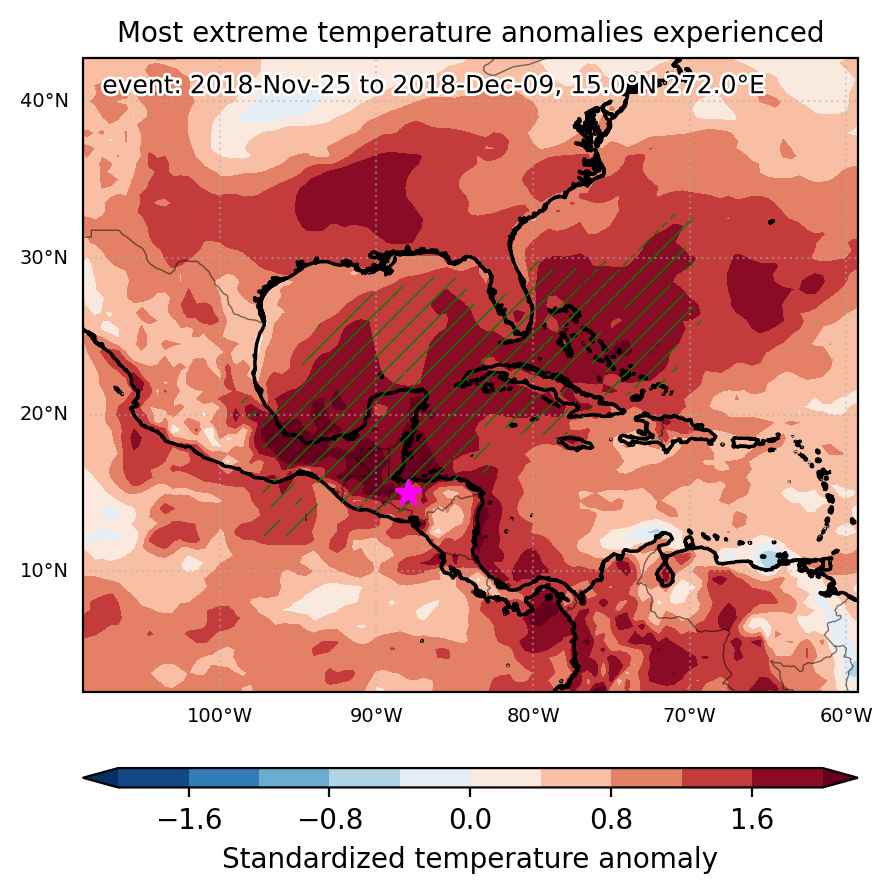
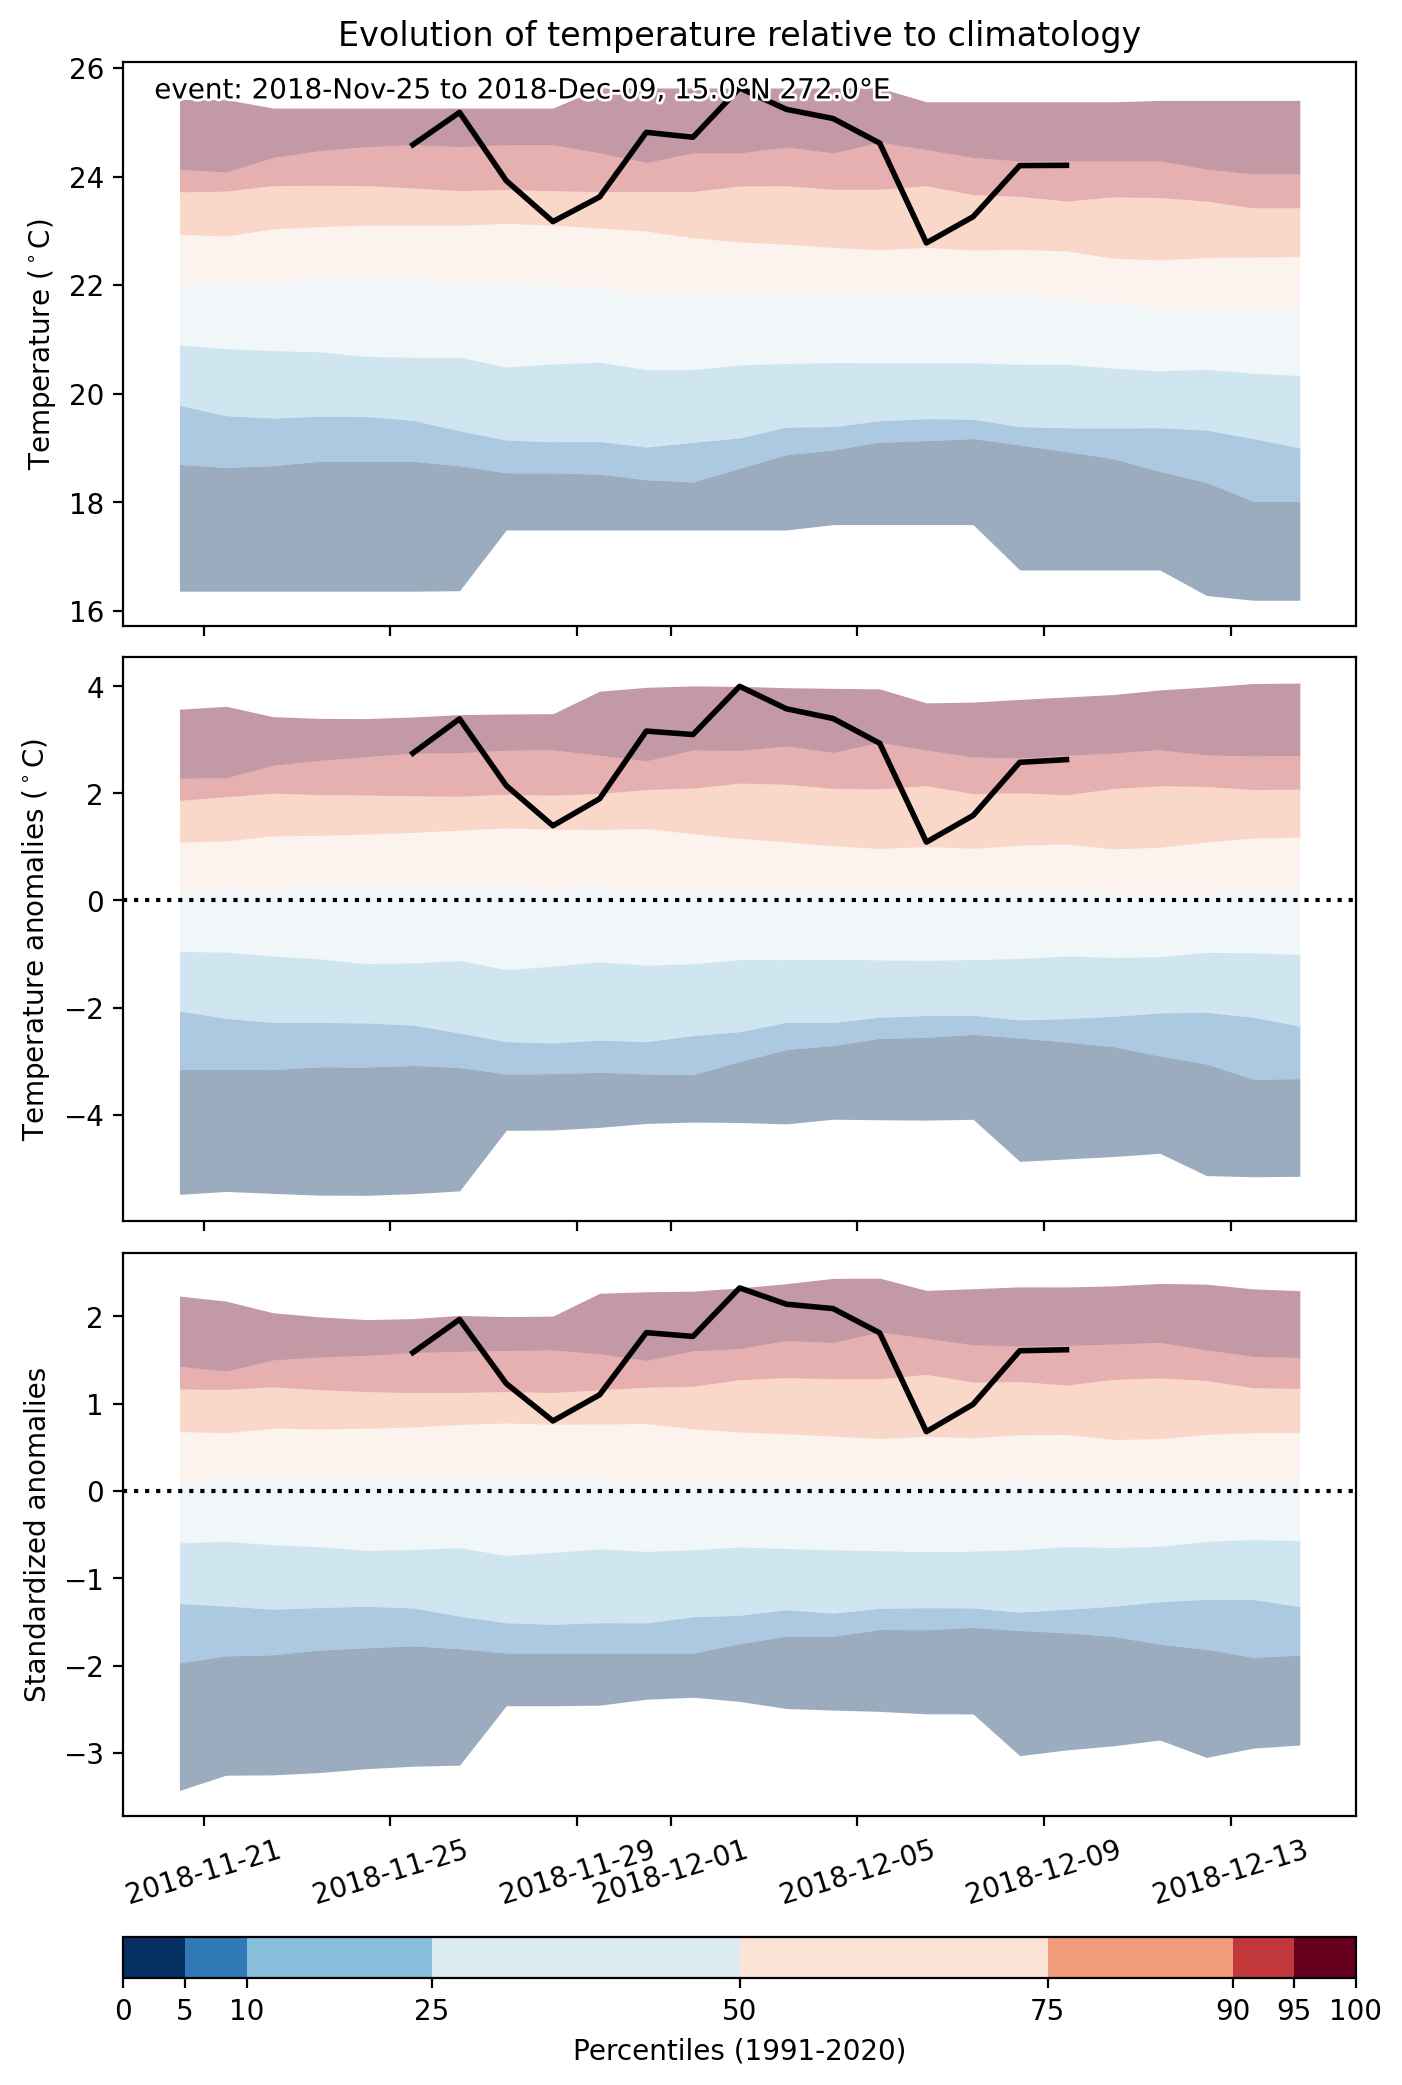
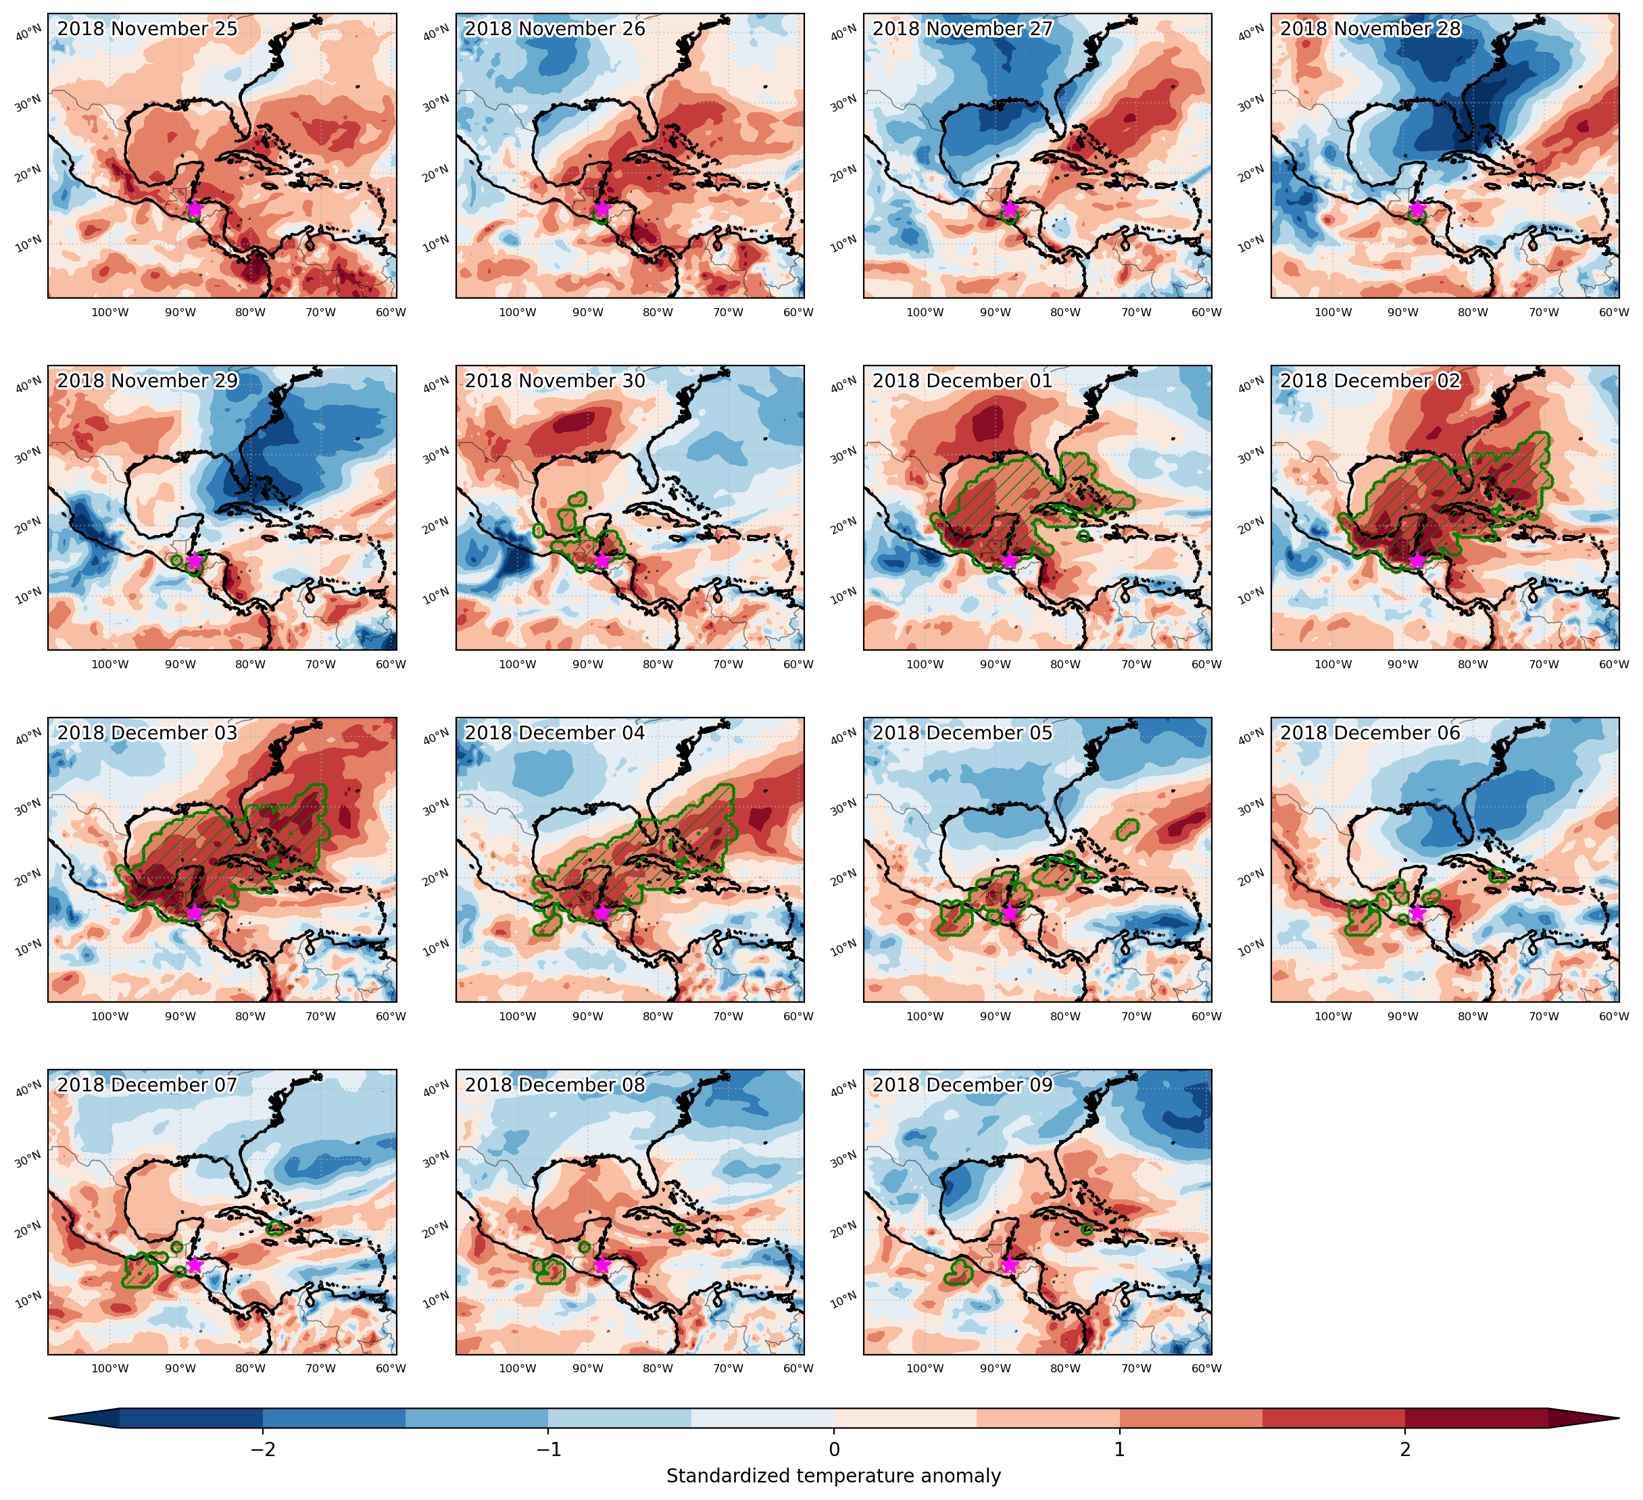
Heat wave occuring from November 25 2018 to December 09 2018 at 15.0°N 272.0°E

Download data: JSON

Event type: Heat wave

Countries affected (identified with ArcGIS Online; provided only for geographical reference):

  • Bahamas
  • Belize
  • Cuba
  • El Salvador
  • Guatemala
  • Honduras
  • Mexico
  • Turks and Caicos Islands
  • United States

Duration: 15 days

Time span: November 25 2018 to December 09 2018

Statistics over entire affected area:

  • Mean temperature anomaly: 2.4 °C
  • Mean temperature: 26.1 °C
  • Maximum temperature anomaly: 6.7 °C
  • Maximum temperature: 29.6 °C

Event center: 15.0°N 272.0°E

Area affected: 3058897 km$^2$


Fig. 1: Map of most extreme temperature anomalies (standardized) experienced during the event. The purple star indicates the center of the extreme event. Green hatching illustrates all areas under the effect of extremes at some time during the event.


Fig. 2: Evolution of temperature at the center of the event. The climatological percentile distribution is illustrated with color shadings.


Fig. 3: Maps illustrating the evolution of standardized temperature anomalies during the event.

Event ID: Heat_wave_2018-Nov-25_to_2018-Dec-09_272.0_15.0

Heat wave occuring from November 25 2018 to November 28 2018 at -24.0°S 30.5°E

Download data: JSON

Event type: Heat wave

Countries affected (identified with ArcGIS Online; provided only for geographical reference):

  • Botswana
  • Eswatini
  • Mozambique
  • South Africa
  • Zimbabwe

Duration: 4 days

Time span: November 25 2018 to November 28 2018

Statistics over entire affected area:

  • Mean temperature anomaly: 5.2 °C
  • Mean temperature: 28.2 °C
  • Maximum temperature anomaly: 8.1 °C
  • Maximum temperature: 33.3 °C

Event center: -24.0°S 30.5°E

Area affected: 312426 km$^2$


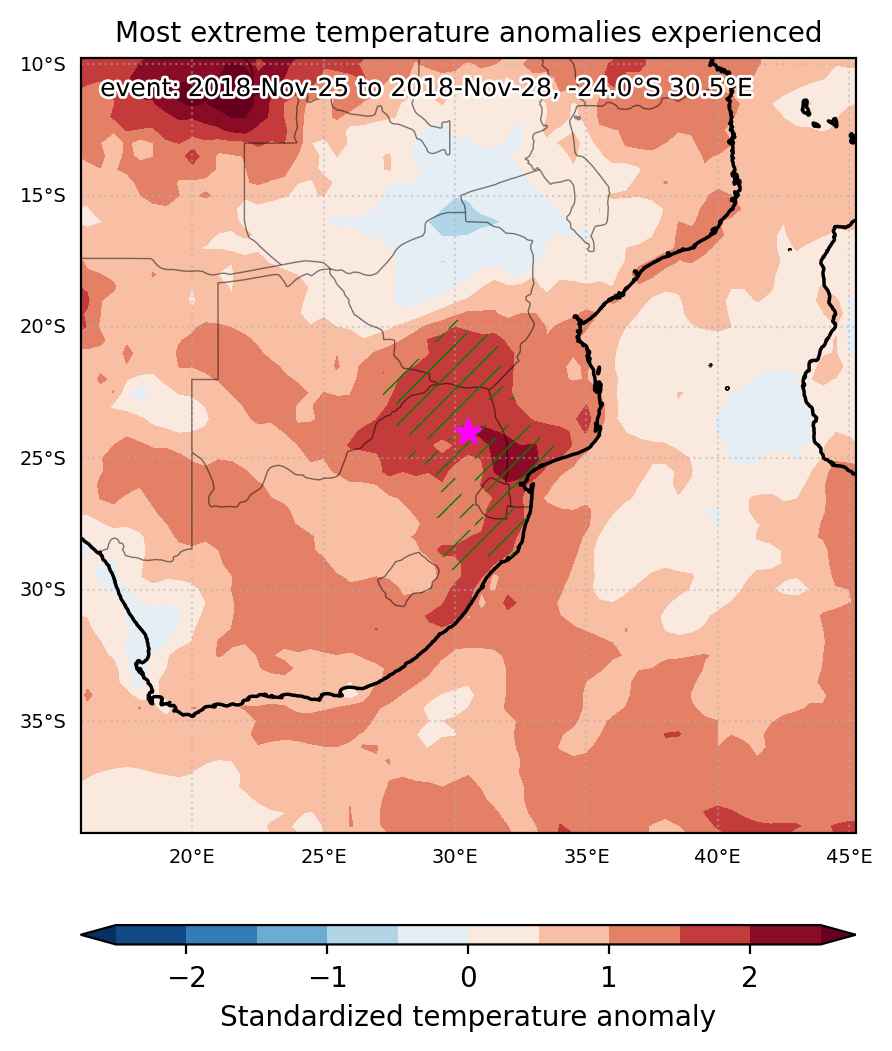
Fig. 1: Map of most extreme temperature anomalies (standardized) experienced during the event. The purple star indicates the center of the extreme event. Green hatching illustrates all areas under the effect of extremes at some time during the event.


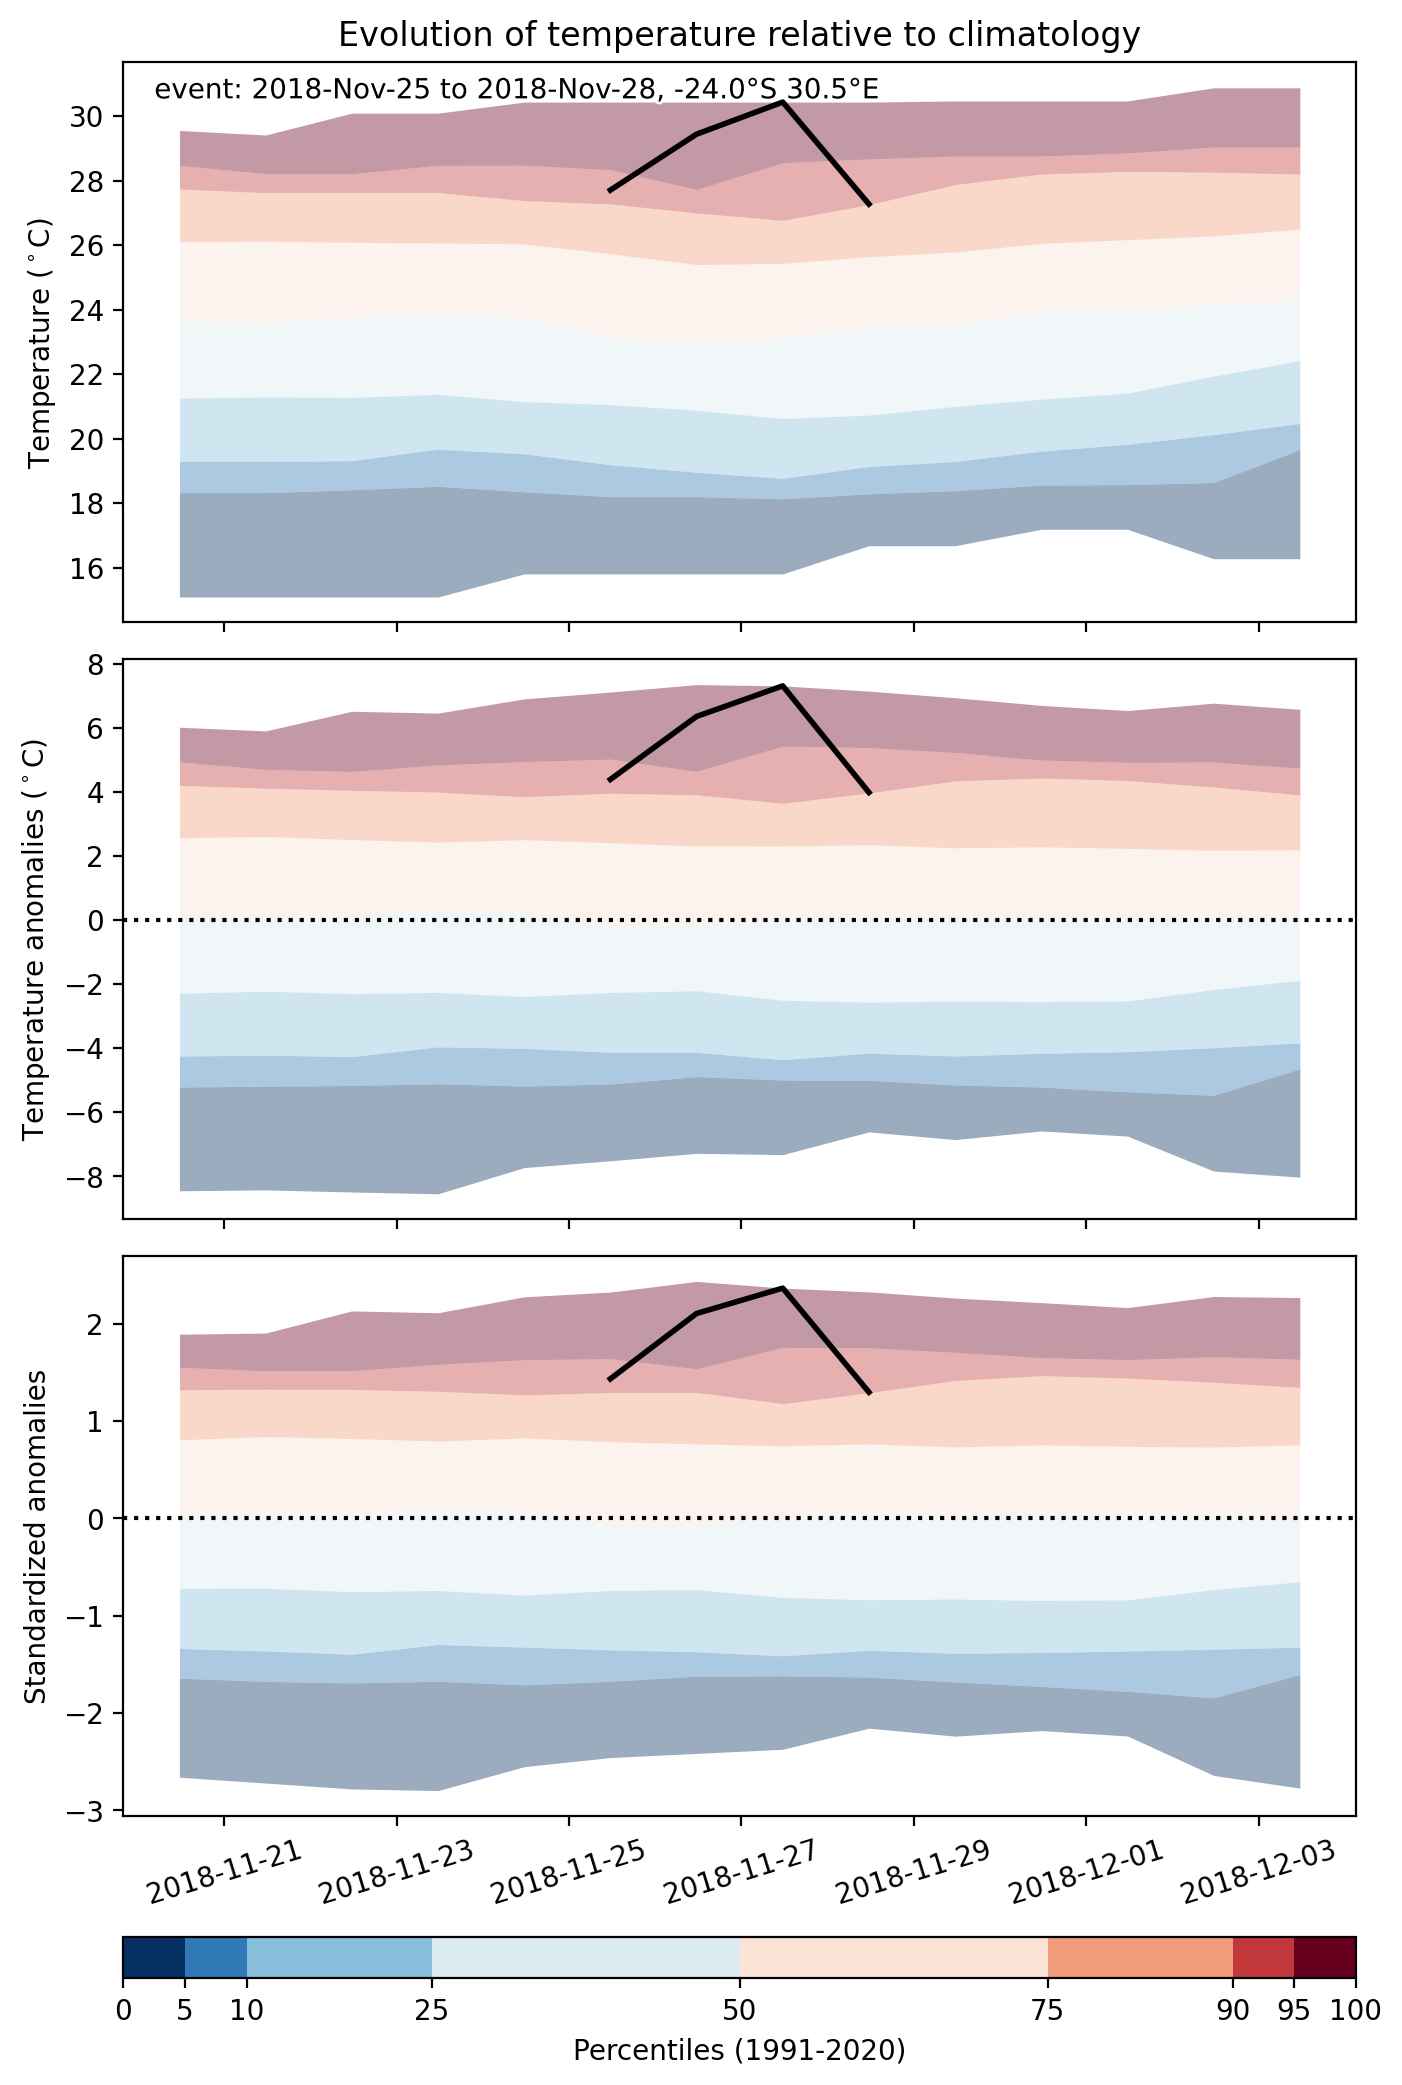
Fig. 2: Evolution of temperature at the center of the event. The climatological percentile distribution is illustrated with color shadings.


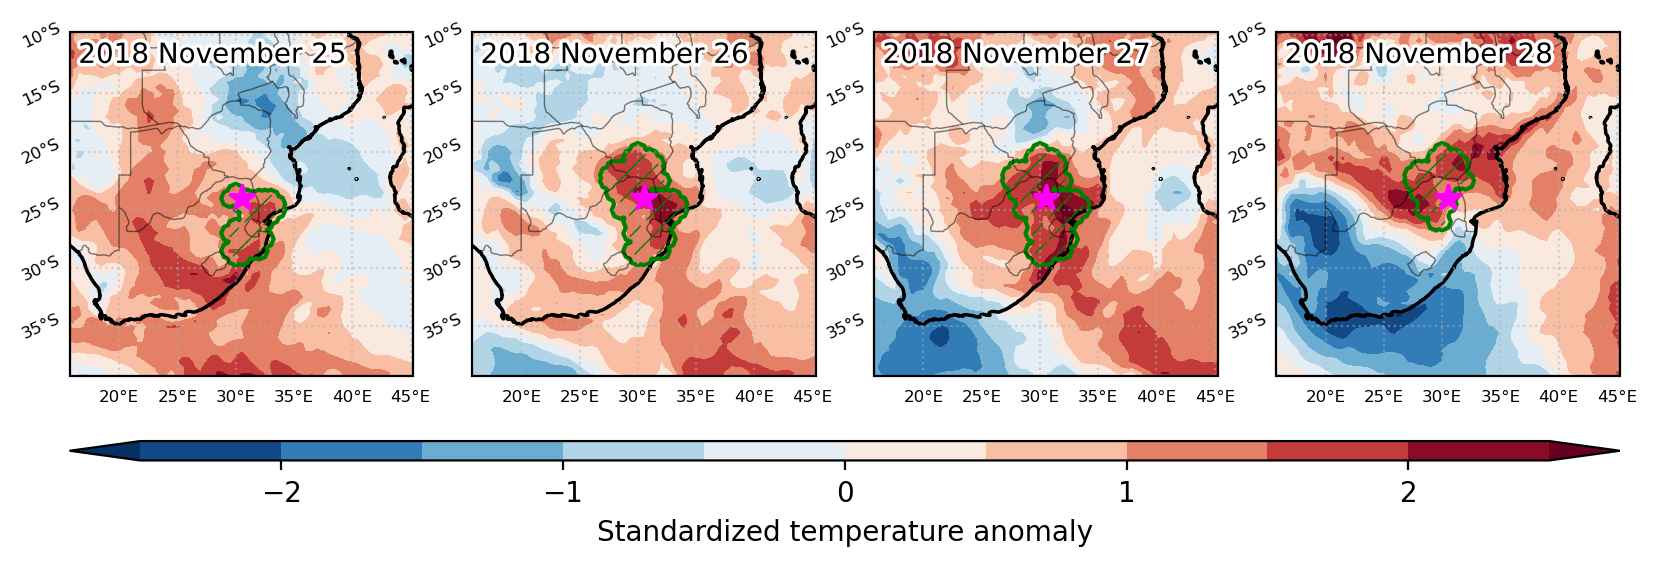
Fig. 3: Maps illustrating the evolution of standardized temperature anomalies during the event.

Event ID: Heat_wave_2018-Nov-25_to_2018-Nov-28_30.5_-24.0

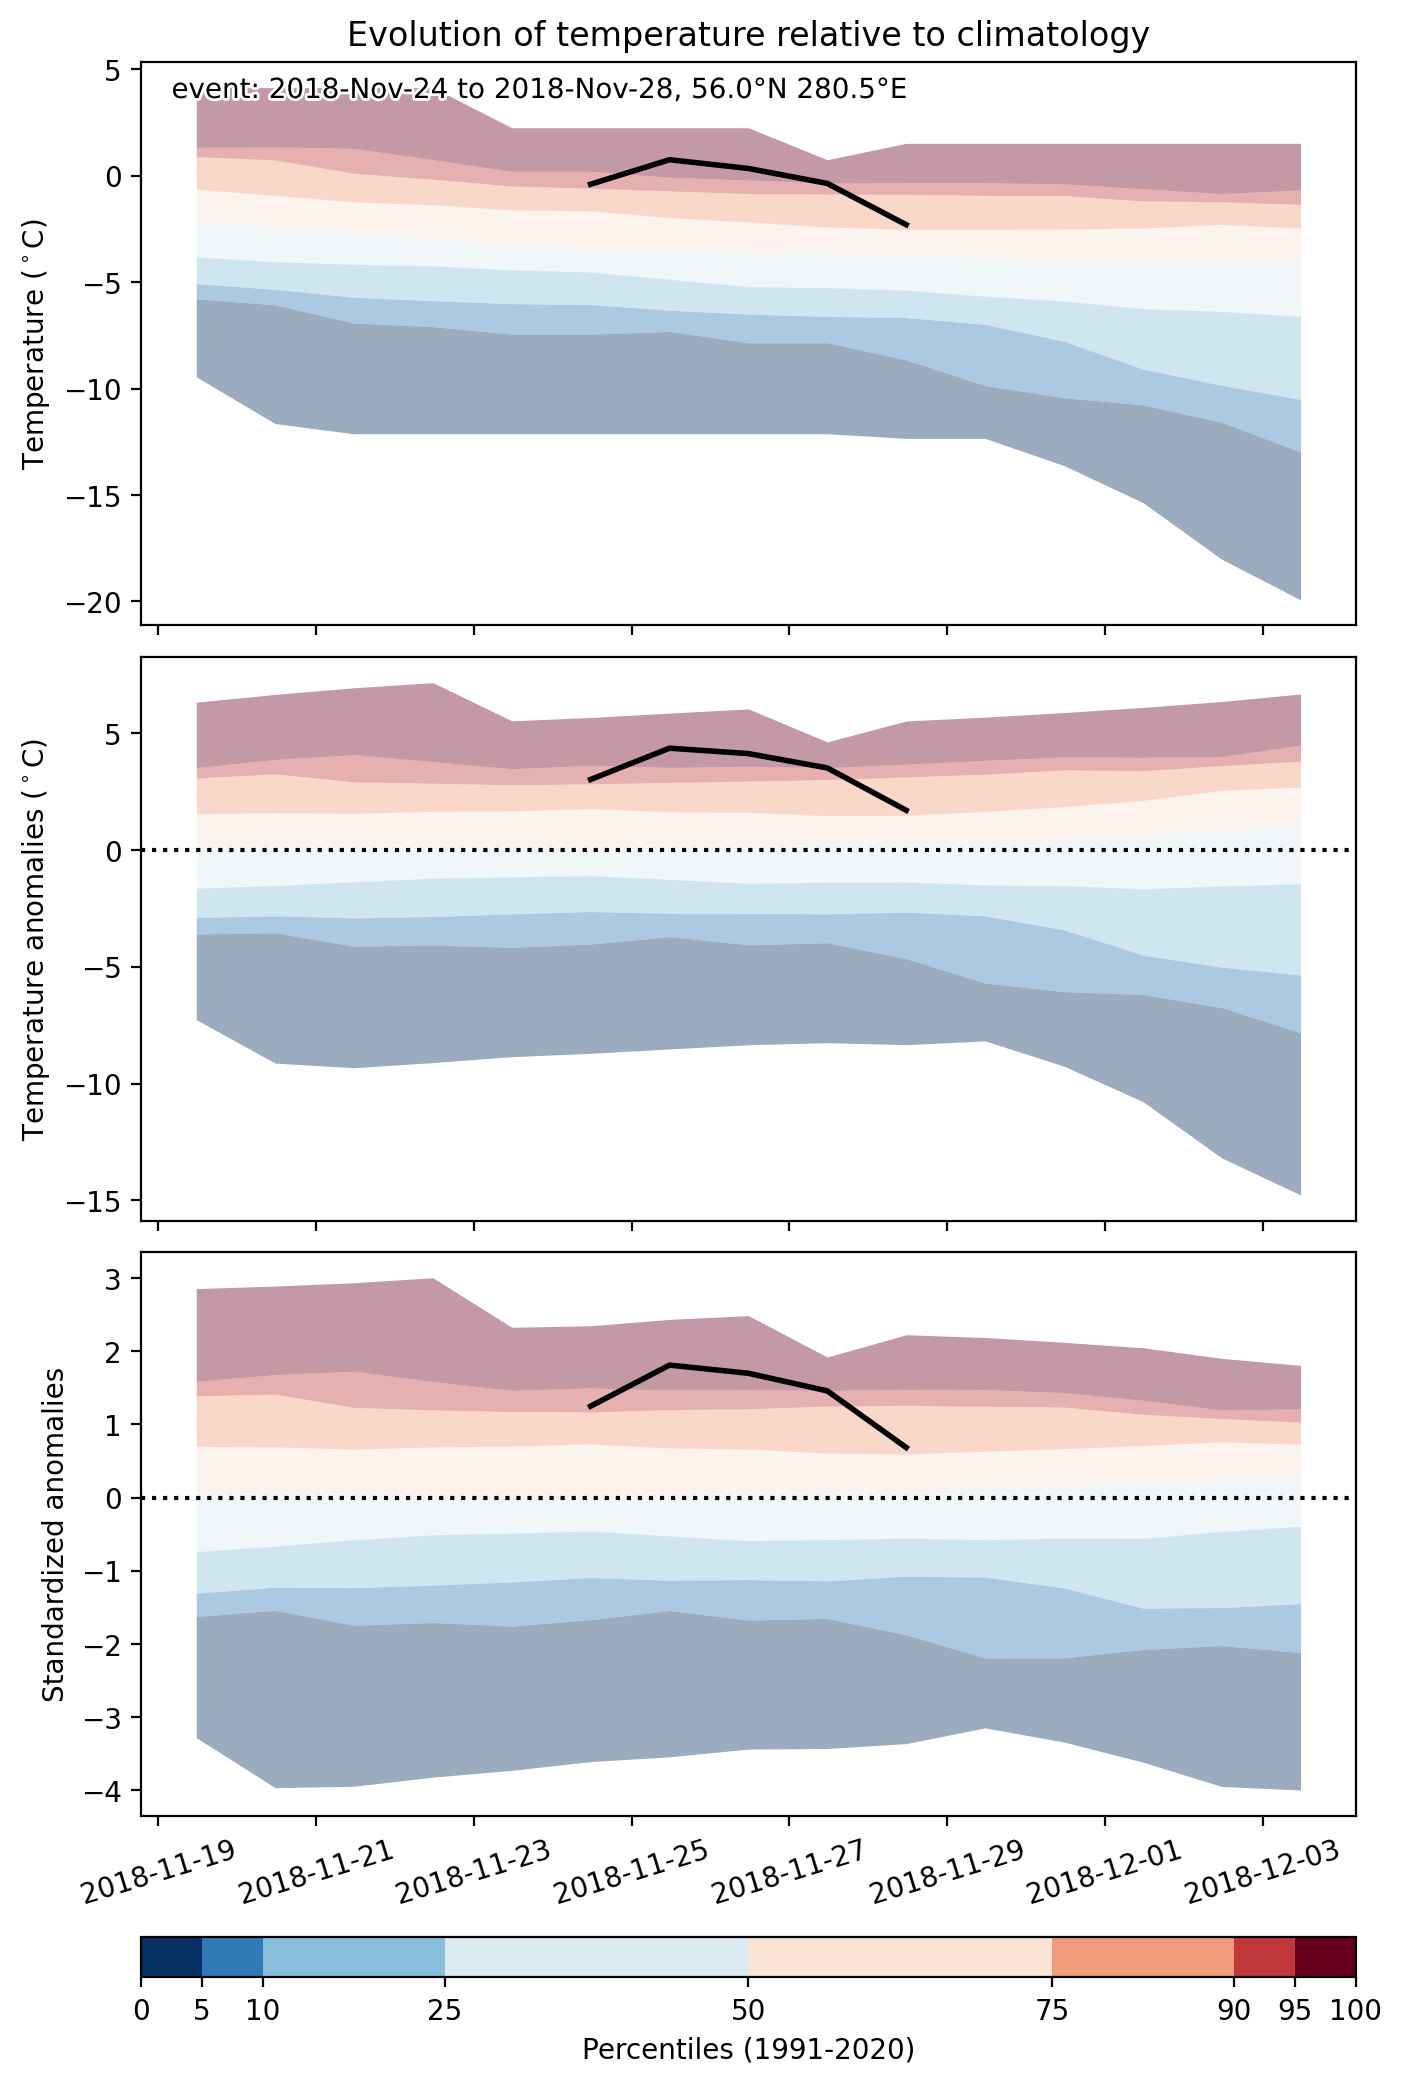
Heat wave occuring from November 24 2018 to November 28 2018 at 56.0°N 280.5°E

Download data: JSON

Event type: Heat wave

Countries affected (identified with ArcGIS Online; provided only for geographical reference):

  • Canada

Duration: 5 days

Time span: November 24 2018 to November 28 2018

Statistics over entire affected area:

  • Mean temperature anomaly: 5.4 °C
  • Mean temperature: -0.4 °C
  • Maximum temperature anomaly: 9.9 °C
  • Maximum temperature: 1.5 °C

Event center: 56.0°N 280.5°E

Area affected: 271783 km$^2$


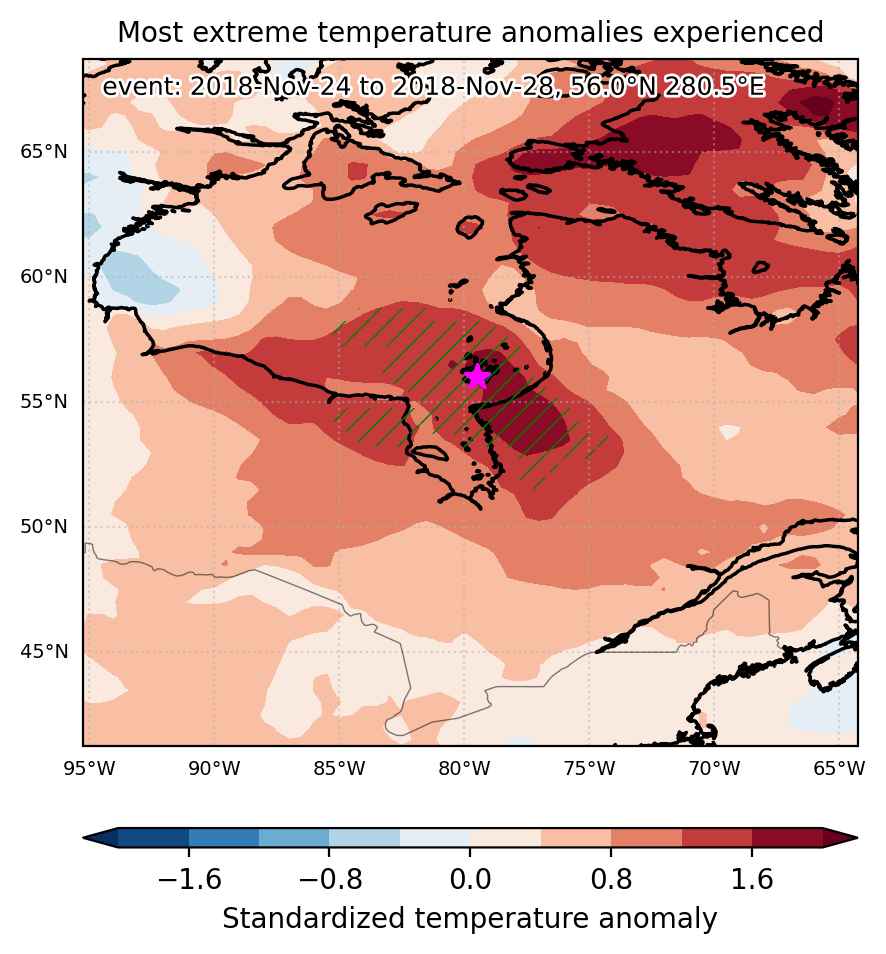
Fig. 1: Map of most extreme temperature anomalies (standardized) experienced during the event. The purple star indicates the center of the extreme event. Green hatching illustrates all areas under the effect of extremes at some time during the event.


Fig. 2: Evolution of temperature at the center of the event. The climatological percentile distribution is illustrated with color shadings.


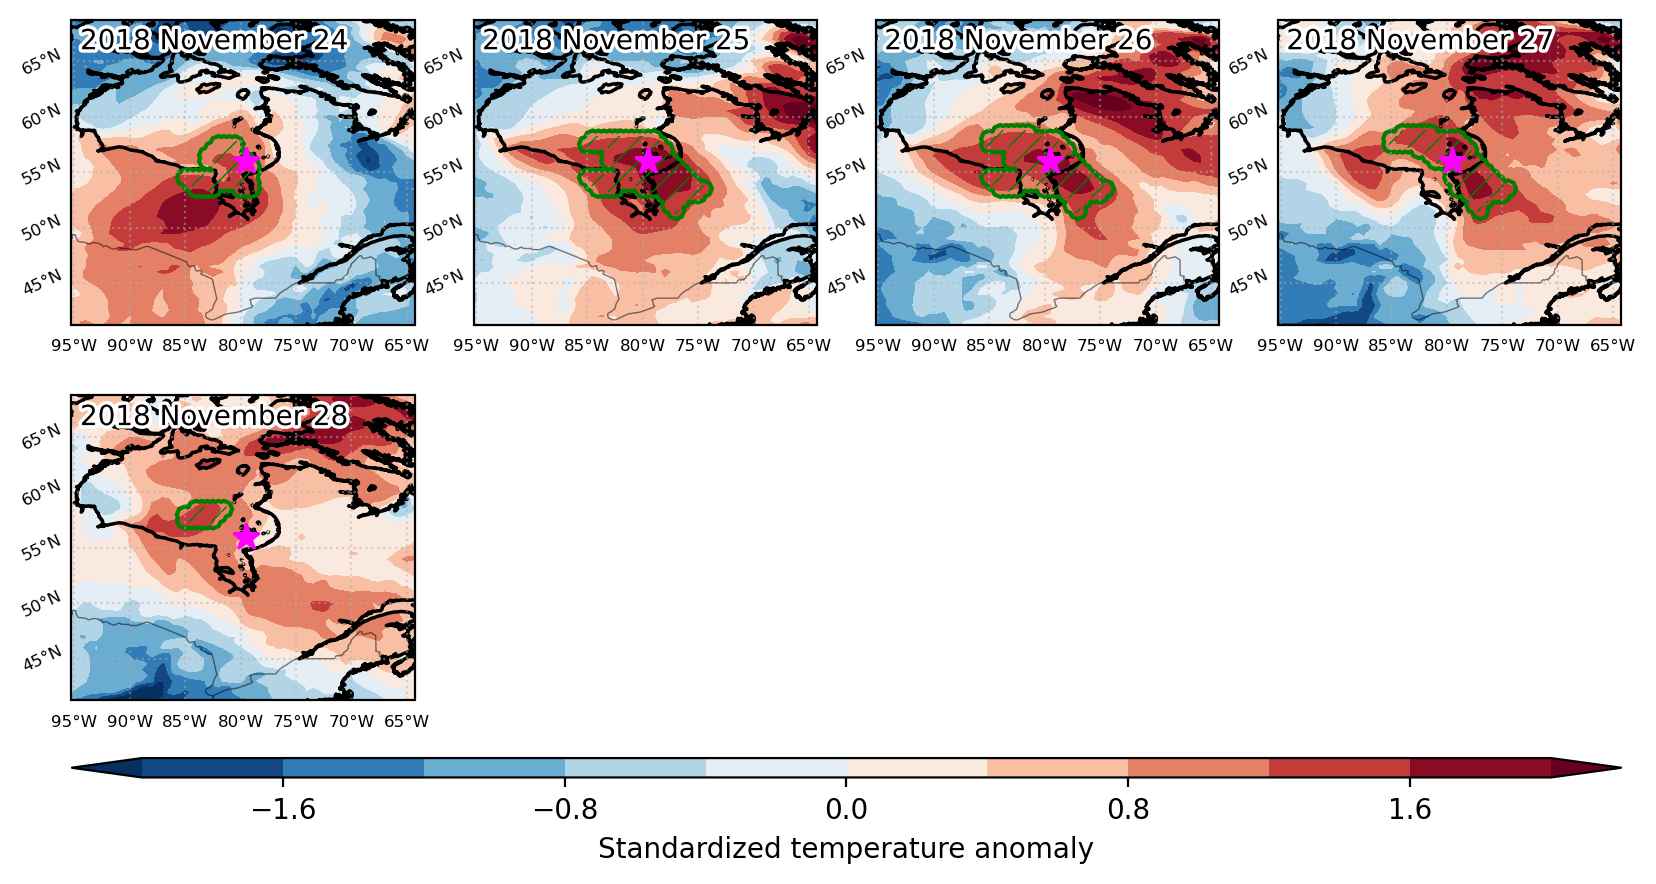
Fig. 3: Maps illustrating the evolution of standardized temperature anomalies during the event.

Event ID: Heat_wave_2018-Nov-24_to_2018-Nov-28_280.5_56.0

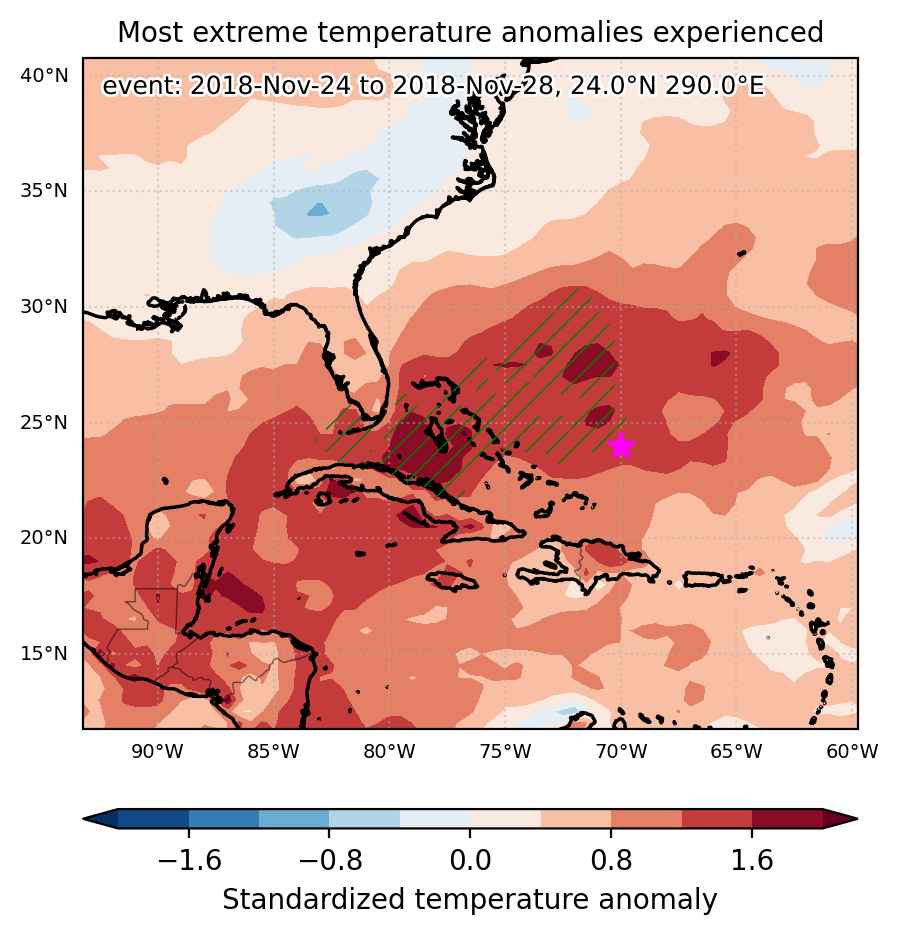
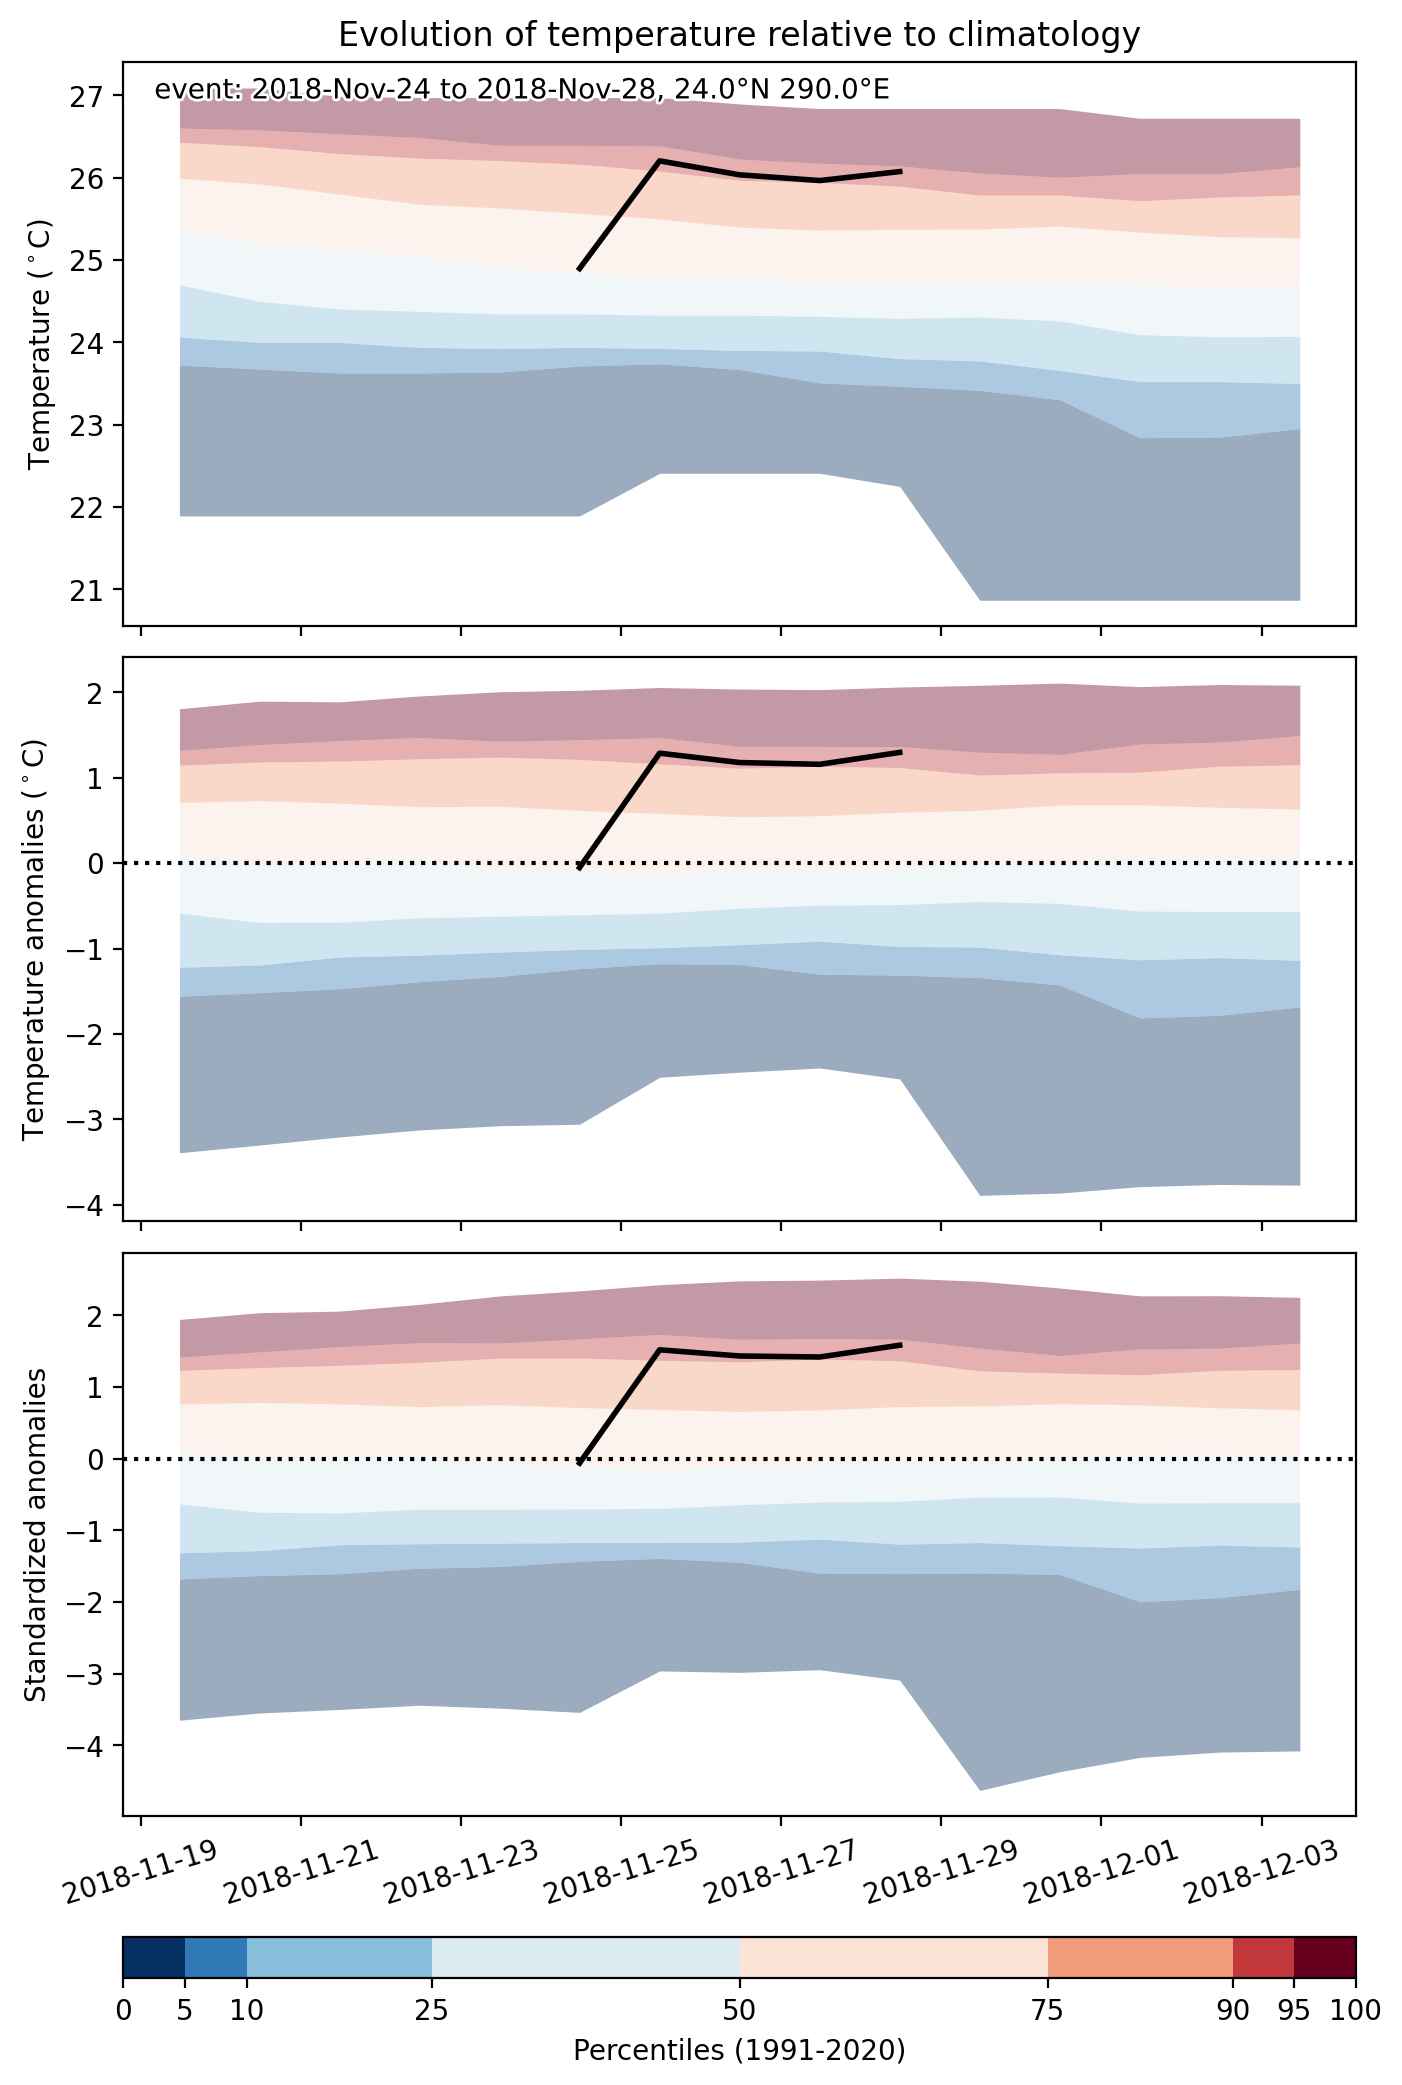
Heat wave occuring from November 24 2018 to November 28 2018 at 24.0°N 290.0°E

Download data: JSON

Event type: Heat wave

Countries affected (identified with ArcGIS Online; provided only for geographical reference):

  • Bahamas
  • Cuba

Duration: 5 days

Time span: November 24 2018 to November 28 2018

Statistics over entire affected area:

  • Mean temperature anomaly: 1.8 °C
  • Mean temperature: 25.6 °C
  • Maximum temperature anomaly: 3.0 °C
  • Maximum temperature: 26.9 °C

Event center: 24.0°N 290.0°E

Area affected: 567705 km$^2$


Fig. 1: Map of most extreme temperature anomalies (standardized) experienced during the event. The purple star indicates the center of the extreme event. Green hatching illustrates all areas under the effect of extremes at some time during the event.


Fig. 2: Evolution of temperature at the center of the event. The climatological percentile distribution is illustrated with color shadings.


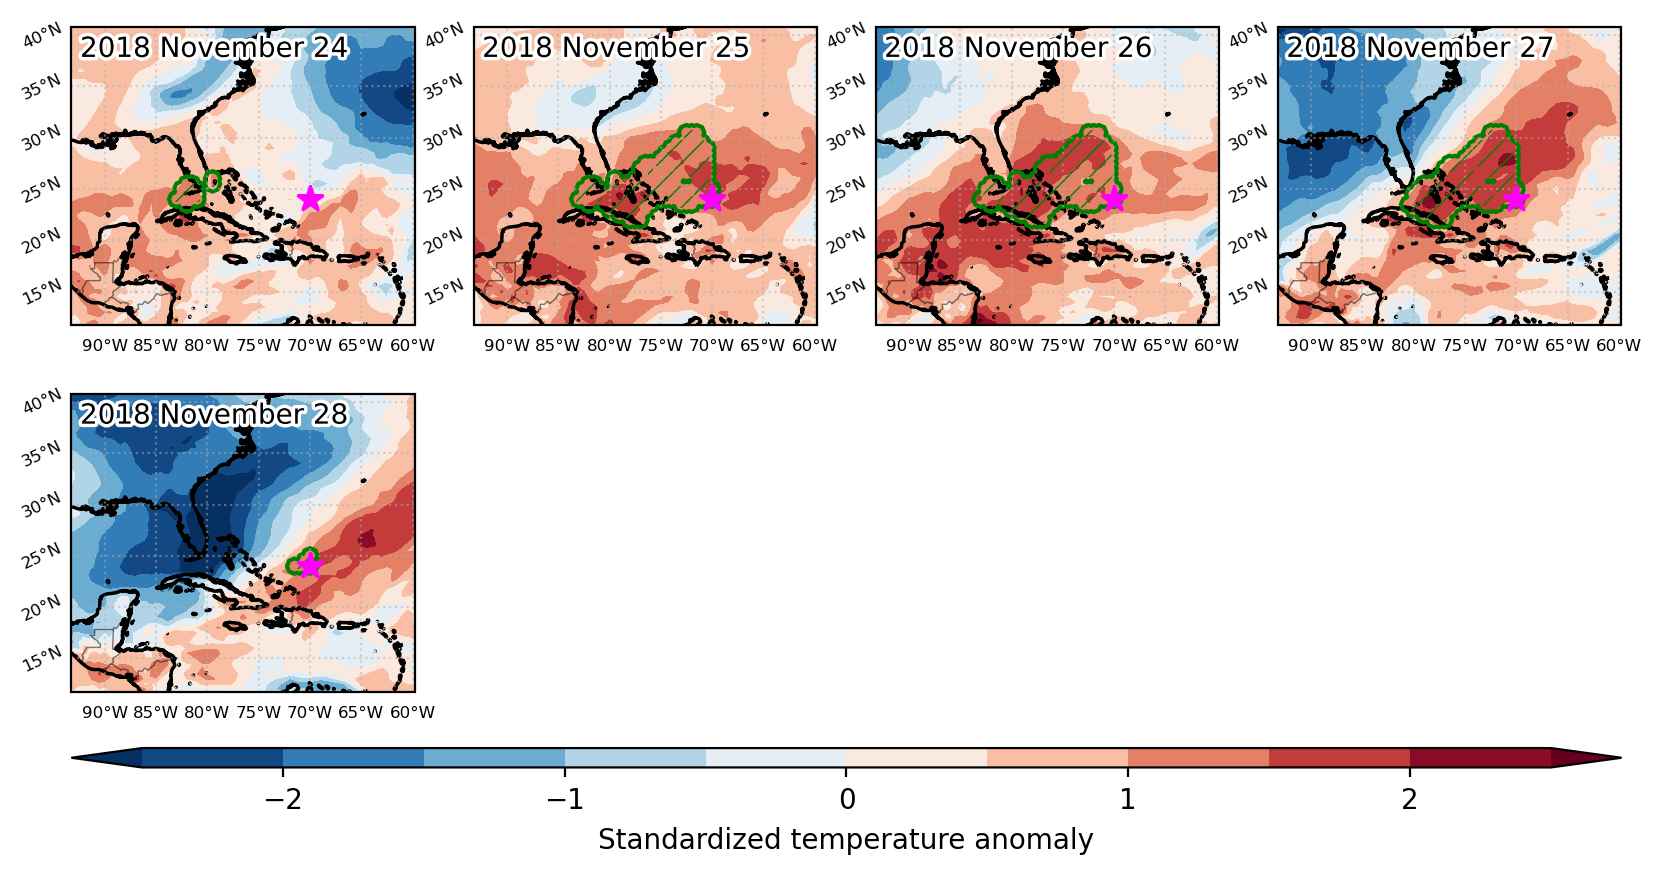
Fig. 3: Maps illustrating the evolution of standardized temperature anomalies during the event.

Event ID: Heat_wave_2018-Nov-24_to_2018-Nov-28_290.0_24.0

Heat wave occuring from November 24 2018 to November 27 2018 at -5.0°S 136.0°E

Download data: JSON

Event type: Heat wave

Countries affected (identified with ArcGIS Online; provided only for geographical reference):

  • Indonesia

Duration: 4 days

Time span: November 24 2018 to November 27 2018

Statistics over entire affected area:

  • Mean temperature anomaly: 1.0 °C
  • Mean temperature: 28.3 °C
  • Maximum temperature anomaly: 1.6 °C
  • Maximum temperature: 29.0 °C

Event center: -5.0°S 136.0°E

Area affected: 79908 km$^2$


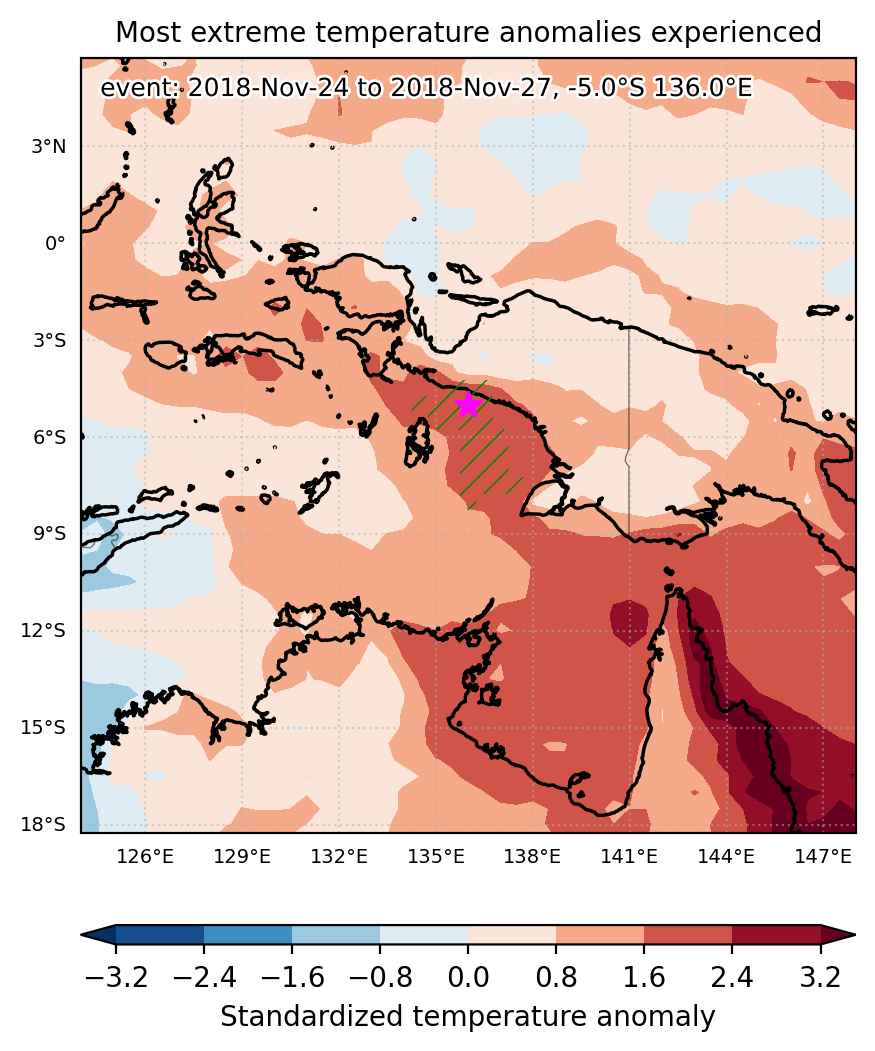
Fig. 1: Map of most extreme temperature anomalies (standardized) experienced during the event. The purple star indicates the center of the extreme event. Green hatching illustrates all areas under the effect of extremes at some time during the event.


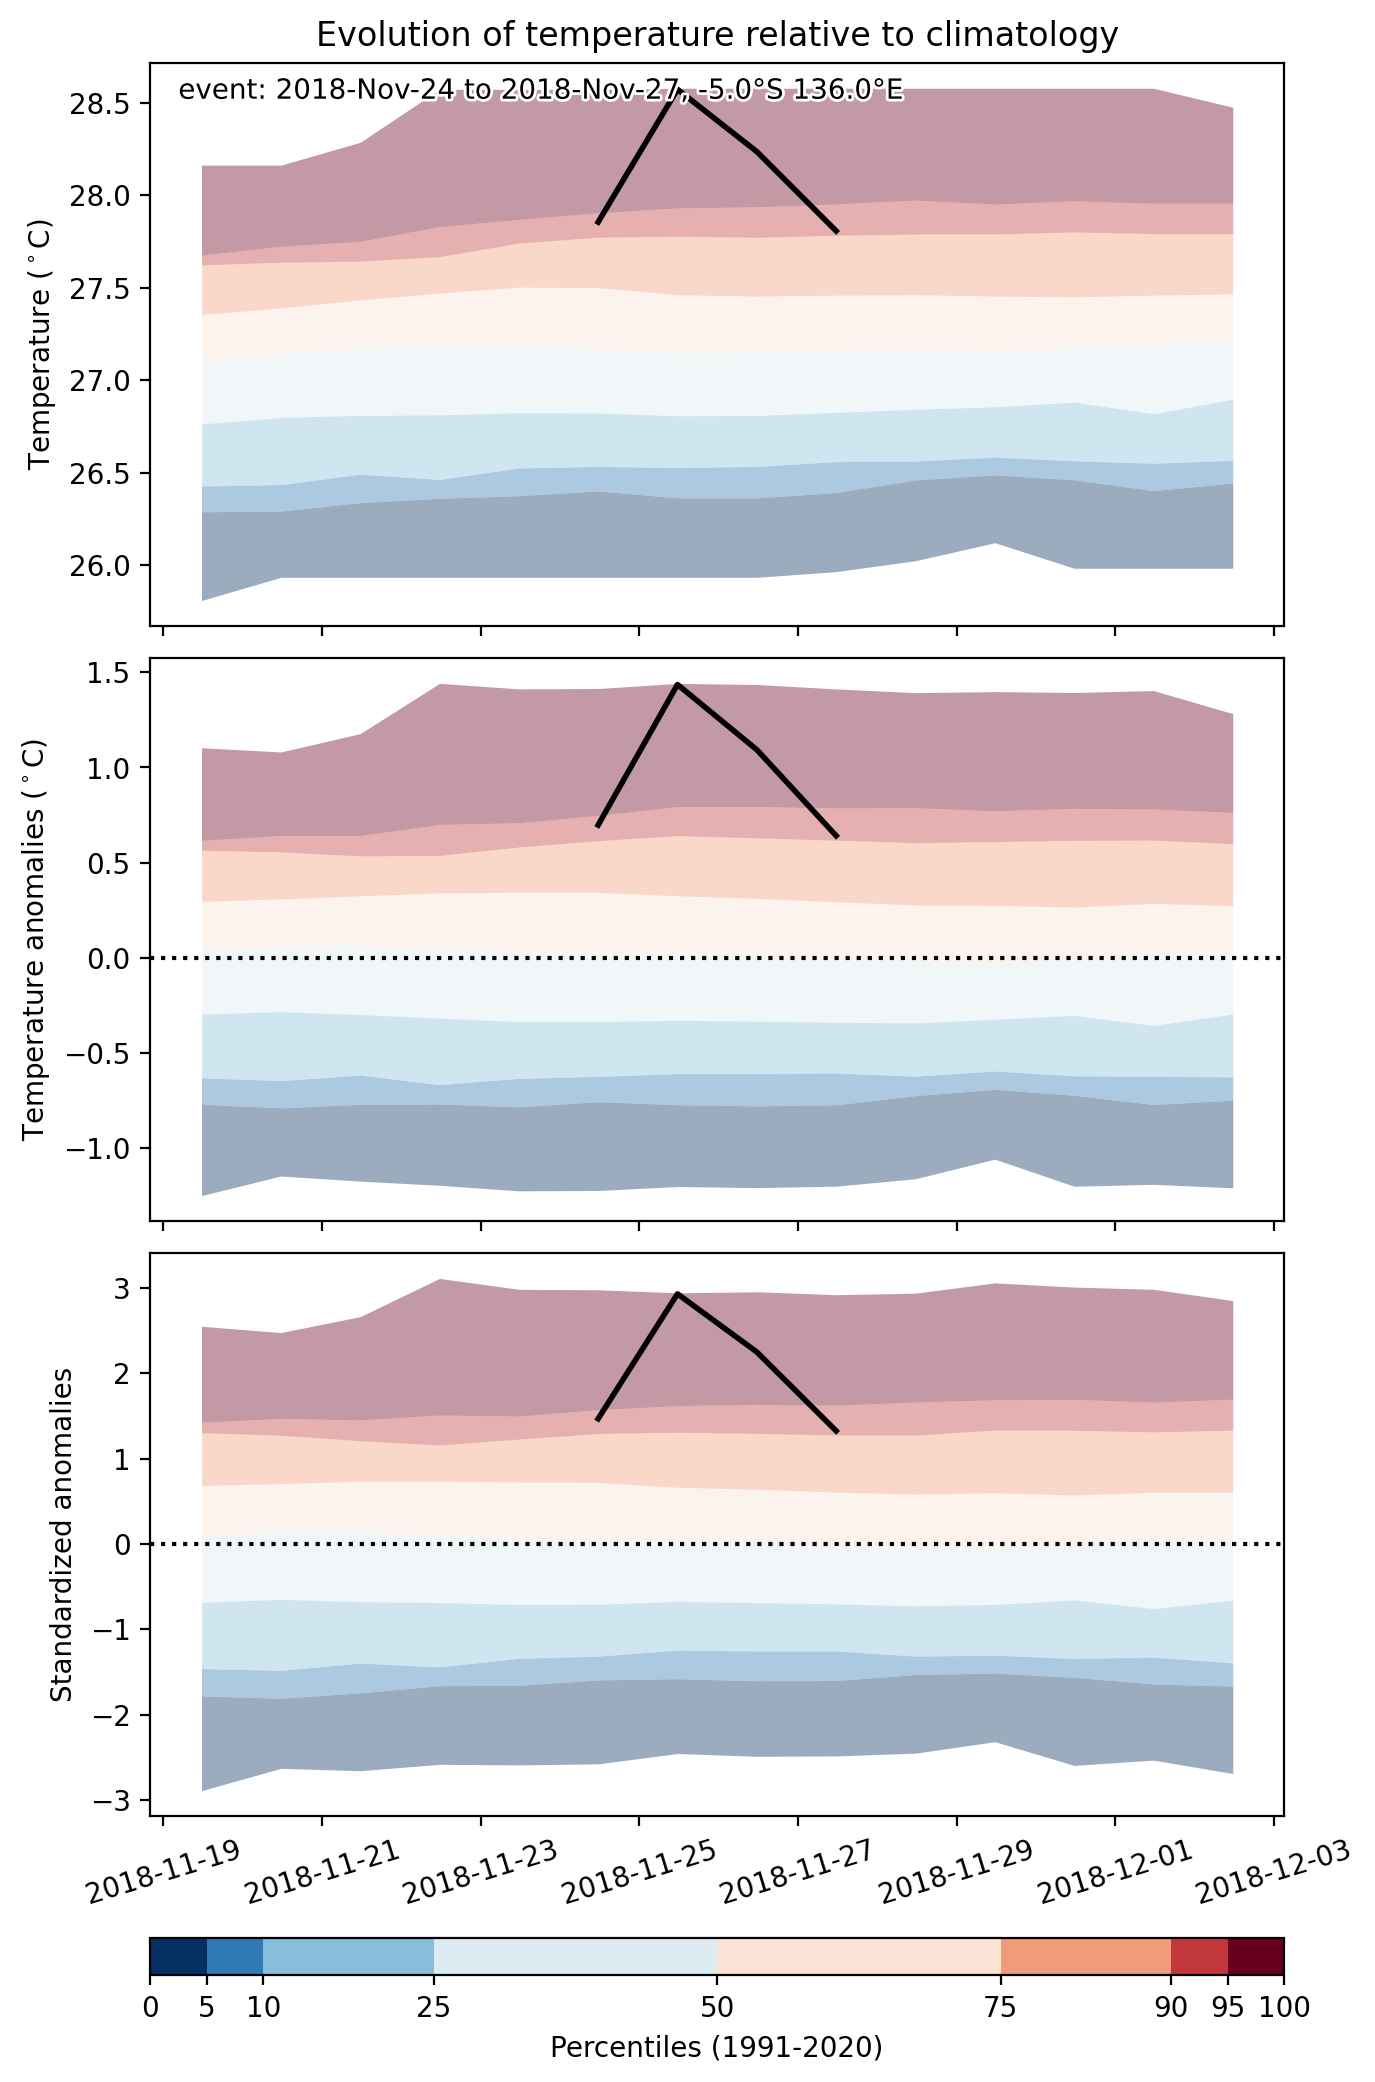
Fig. 2: Evolution of temperature at the center of the event. The climatological percentile distribution is illustrated with color shadings.


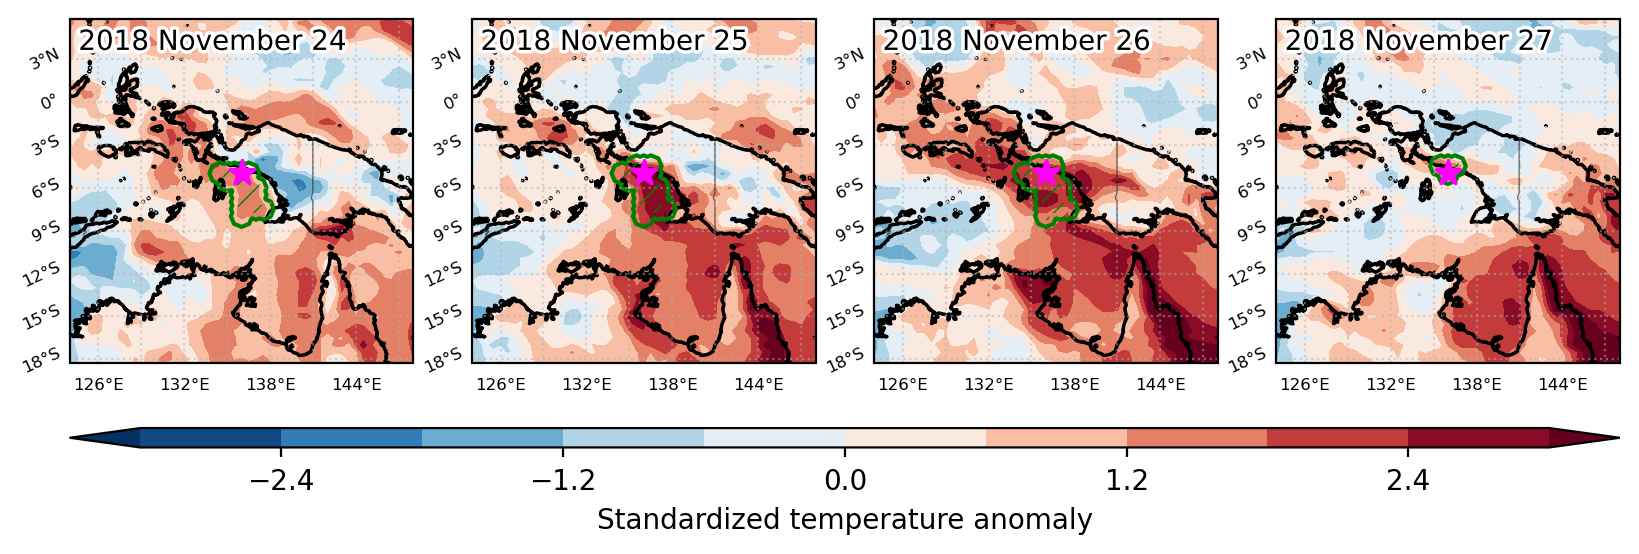
Fig. 3: Maps illustrating the evolution of standardized temperature anomalies during the event.

Event ID: Heat_wave_2018-Nov-24_to_2018-Nov-27_136.0_-5.0

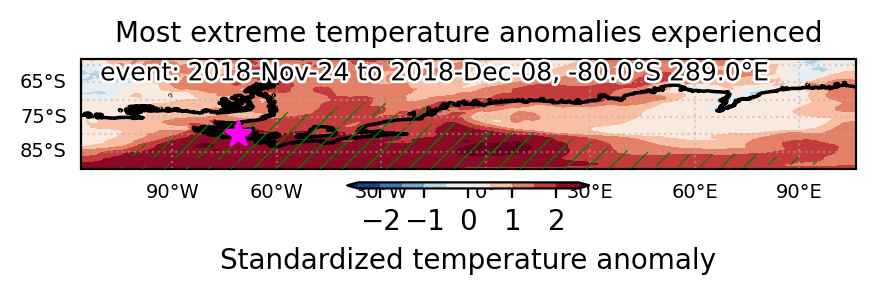
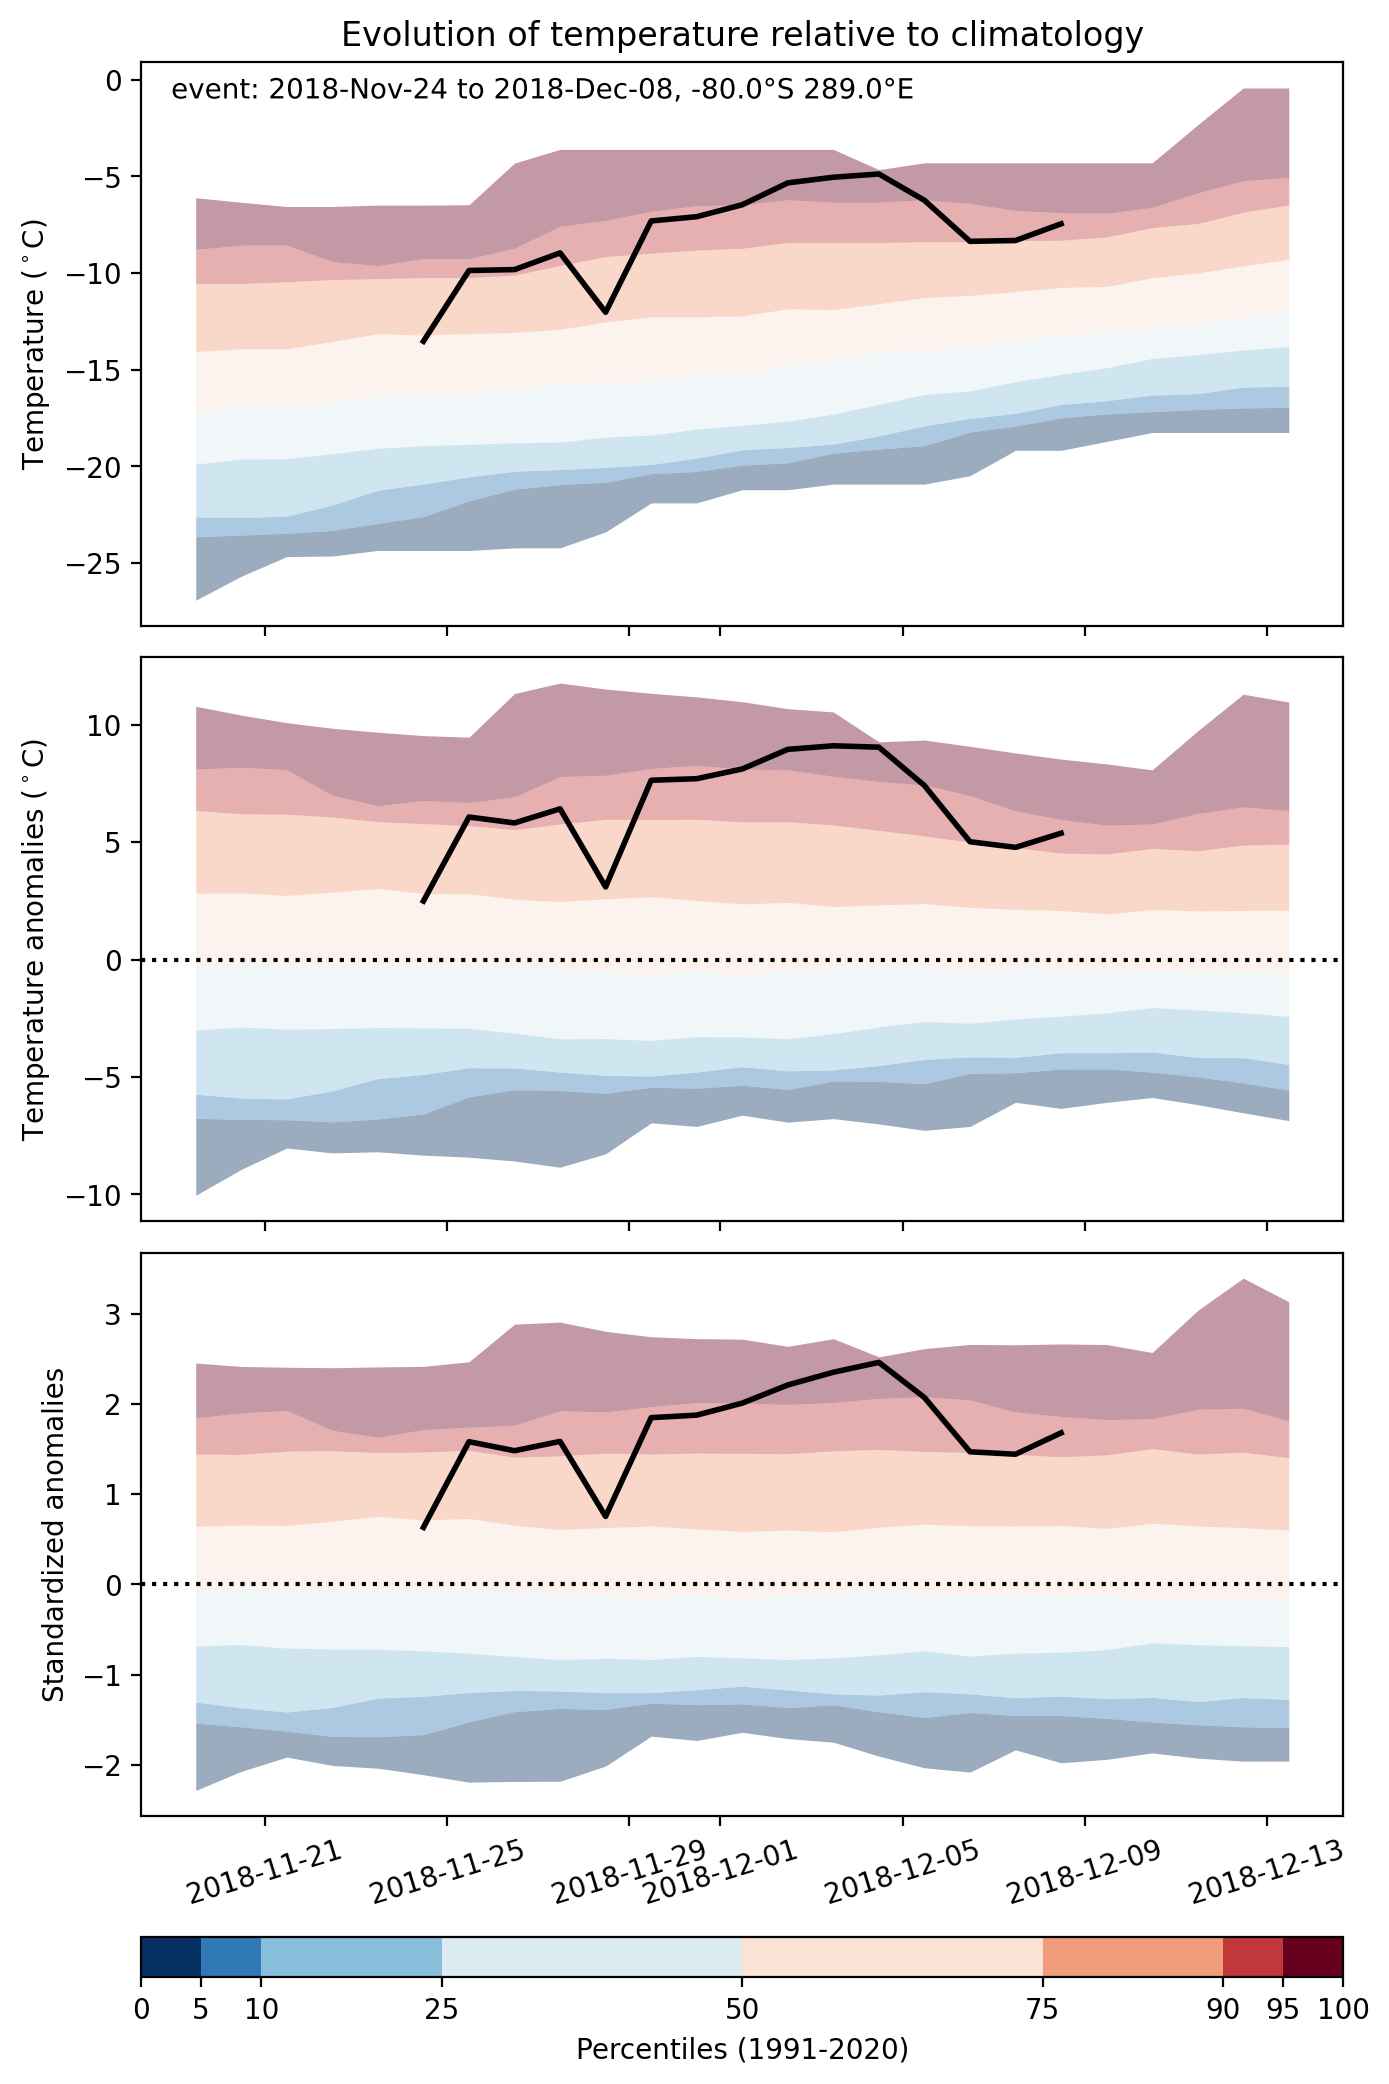
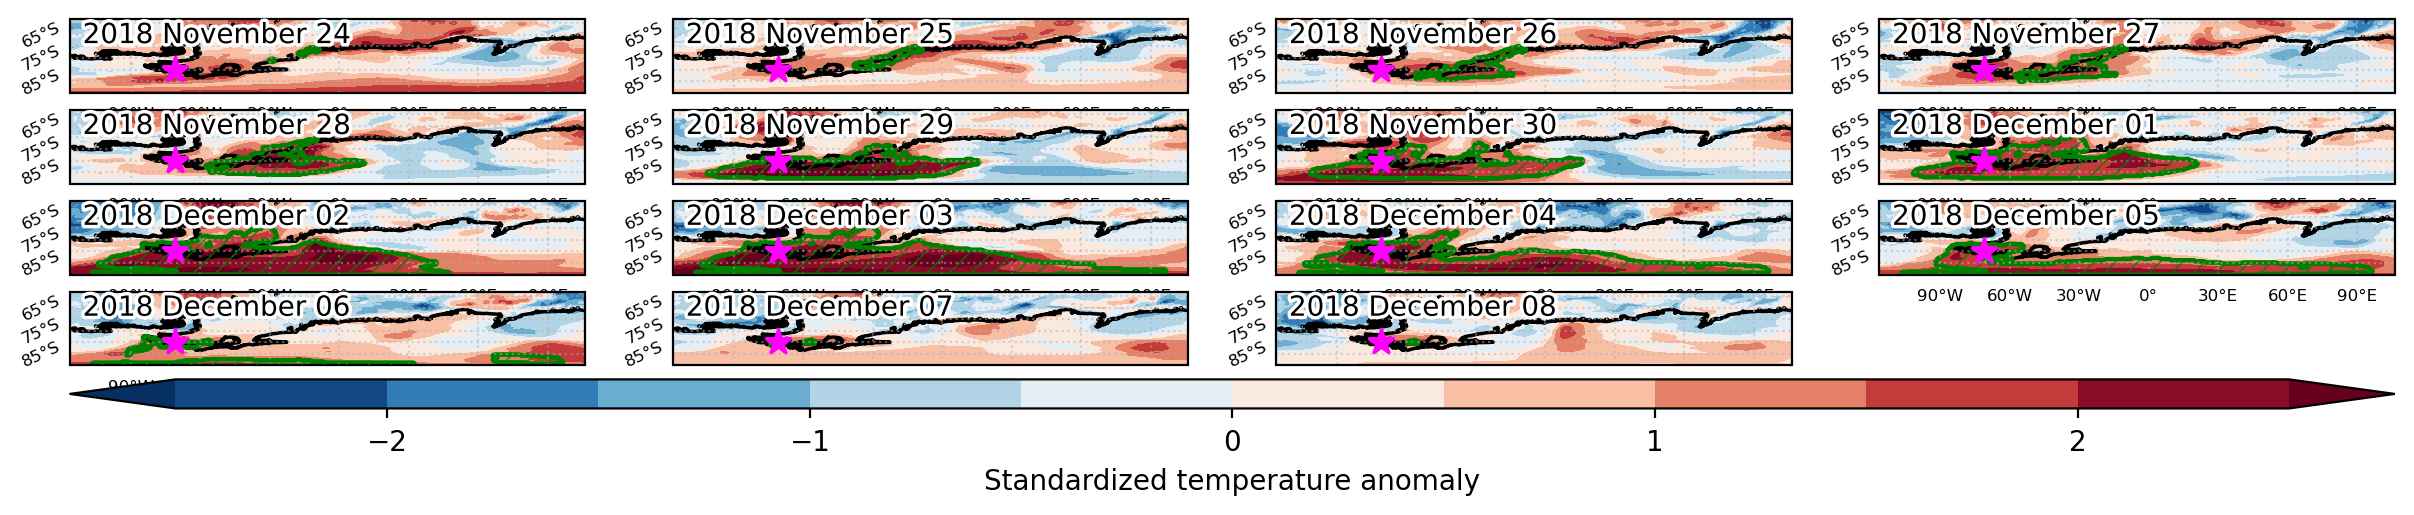
Heat wave occuring from November 24 2018 to December 08 2018 at -80.0°S 289.0°E

Download data: JSON

Event type: Heat wave

Countries affected (identified with ArcGIS Online; provided only for geographical reference):

  • Antarctica

Duration: 15 days

Time span: November 24 2018 to December 08 2018

Statistics over entire affected area:

  • Mean temperature anomaly: 6.3 °C
  • Mean temperature: -15.4 °C
  • Maximum temperature anomaly: 10.8 °C
  • Maximum temperature: 0.3 °C

Event center: -80.0°S 289.0°E

Area affected: 2591397 km$^2$


Fig. 1: Map of most extreme temperature anomalies (standardized) experienced during the event. The purple star indicates the center of the extreme event. Green hatching illustrates all areas under the effect of extremes at some time during the event.


Fig. 2: Evolution of temperature at the center of the event. The climatological percentile distribution is illustrated with color shadings.


Fig. 3: Maps illustrating the evolution of standardized temperature anomalies during the event.

Event ID: Heat_wave_2018-Nov-24_to_2018-Dec-08_289.0_-80.0

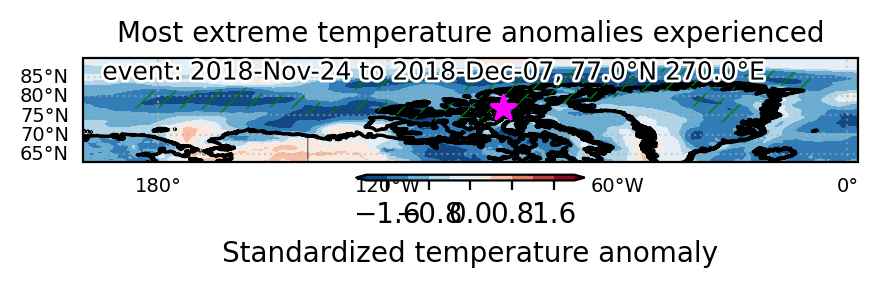
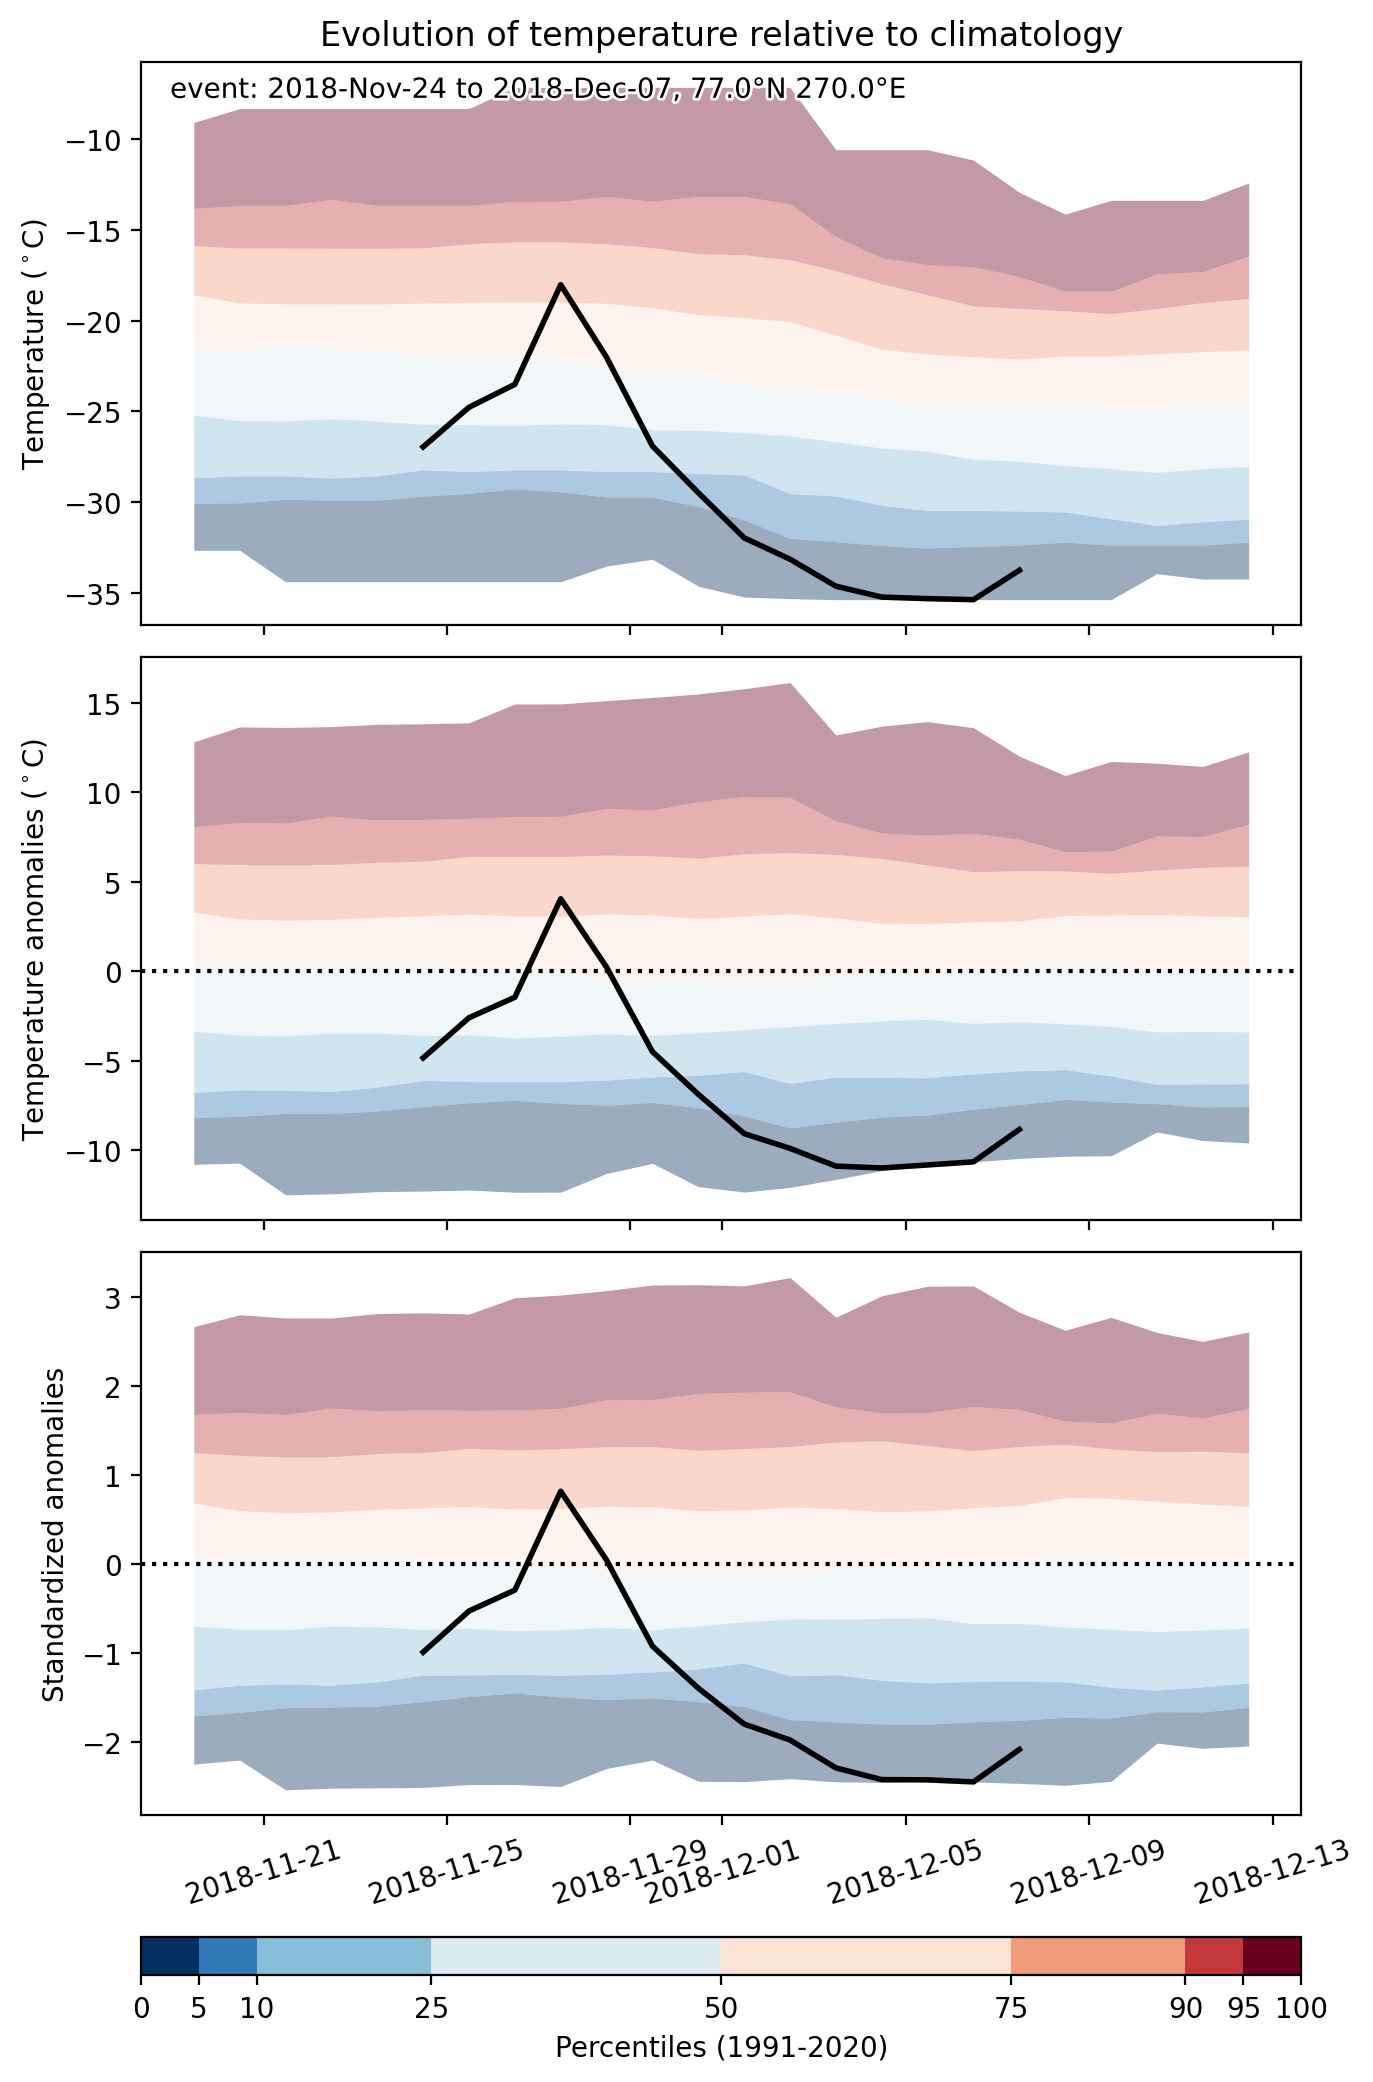
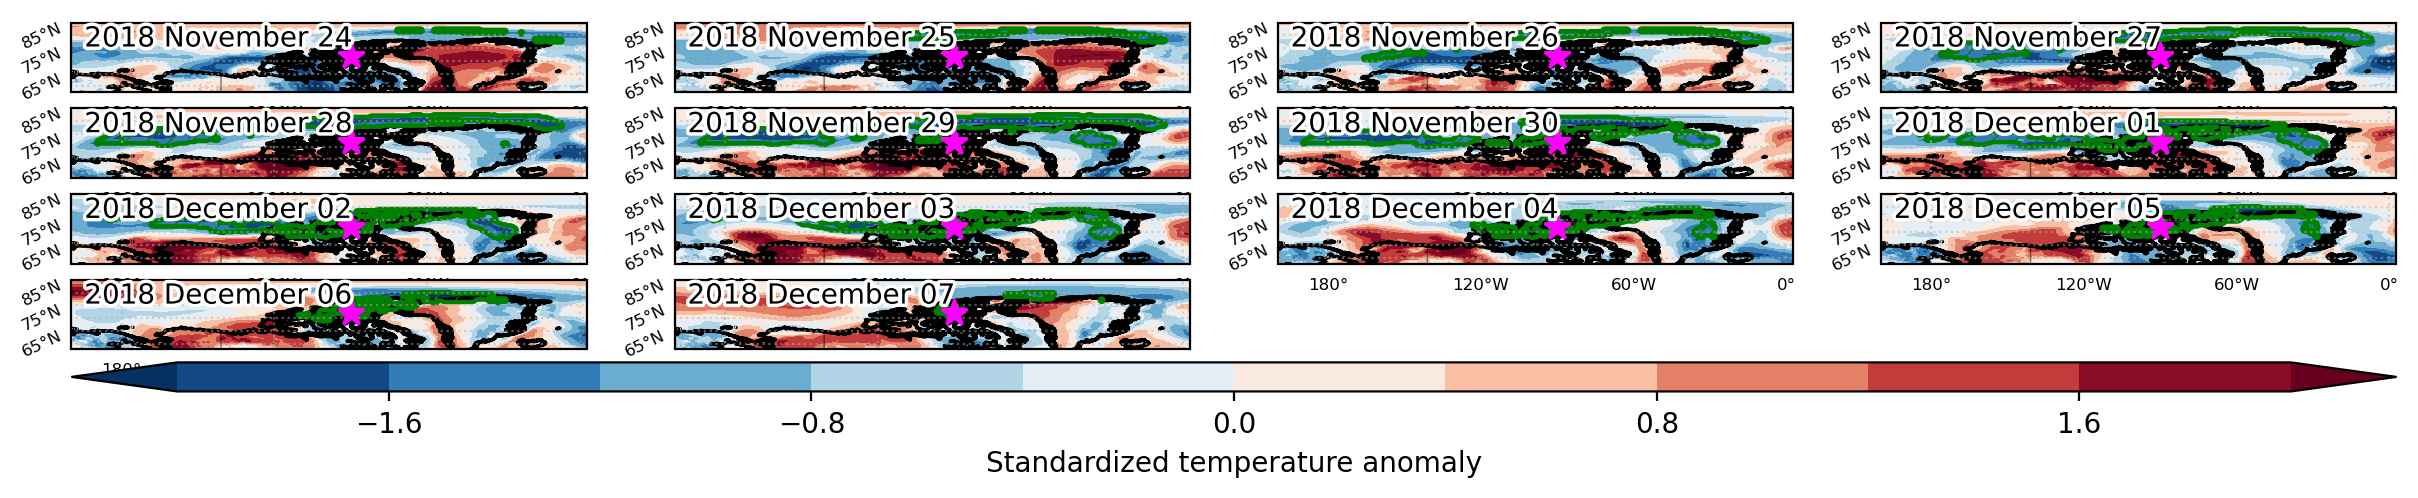
Cold spell occuring from November 24 2018 to December 07 2018 at 77.0°N 270.0°E

Download data: JSON

Event type: Cold spell

Countries affected (identified with ArcGIS Online; provided only for geographical reference):

  • Canada
  • Greenland

Duration: 14 days

Time span: November 24 2018 to December 07 2018

Statistics over entire affected area:

  • Mean temperature anomaly: -7.5 °C
  • Mean temperature: -31.5 °C
  • Minimum temperature anomaly: -13.9 °C
  • Minimum temperature: -48.3 °C

Event center: 77.0°N 270.0°E

Area affected: 1768367 km$^2$


Fig. 1: Map of most extreme temperature anomalies (standardized) experienced during the event. The purple star indicates the center of the extreme event. Green hatching illustrates all areas under the effect of extremes at some time during the event.


Fig. 2: Evolution of temperature at the center of the event. The climatological percentile distribution is illustrated with color shadings.


Fig. 3: Maps illustrating the evolution of standardized temperature anomalies during the event.

Event ID: Cold_spell_2018-Nov-24_to_2018-Dec-07_270.0_77.0