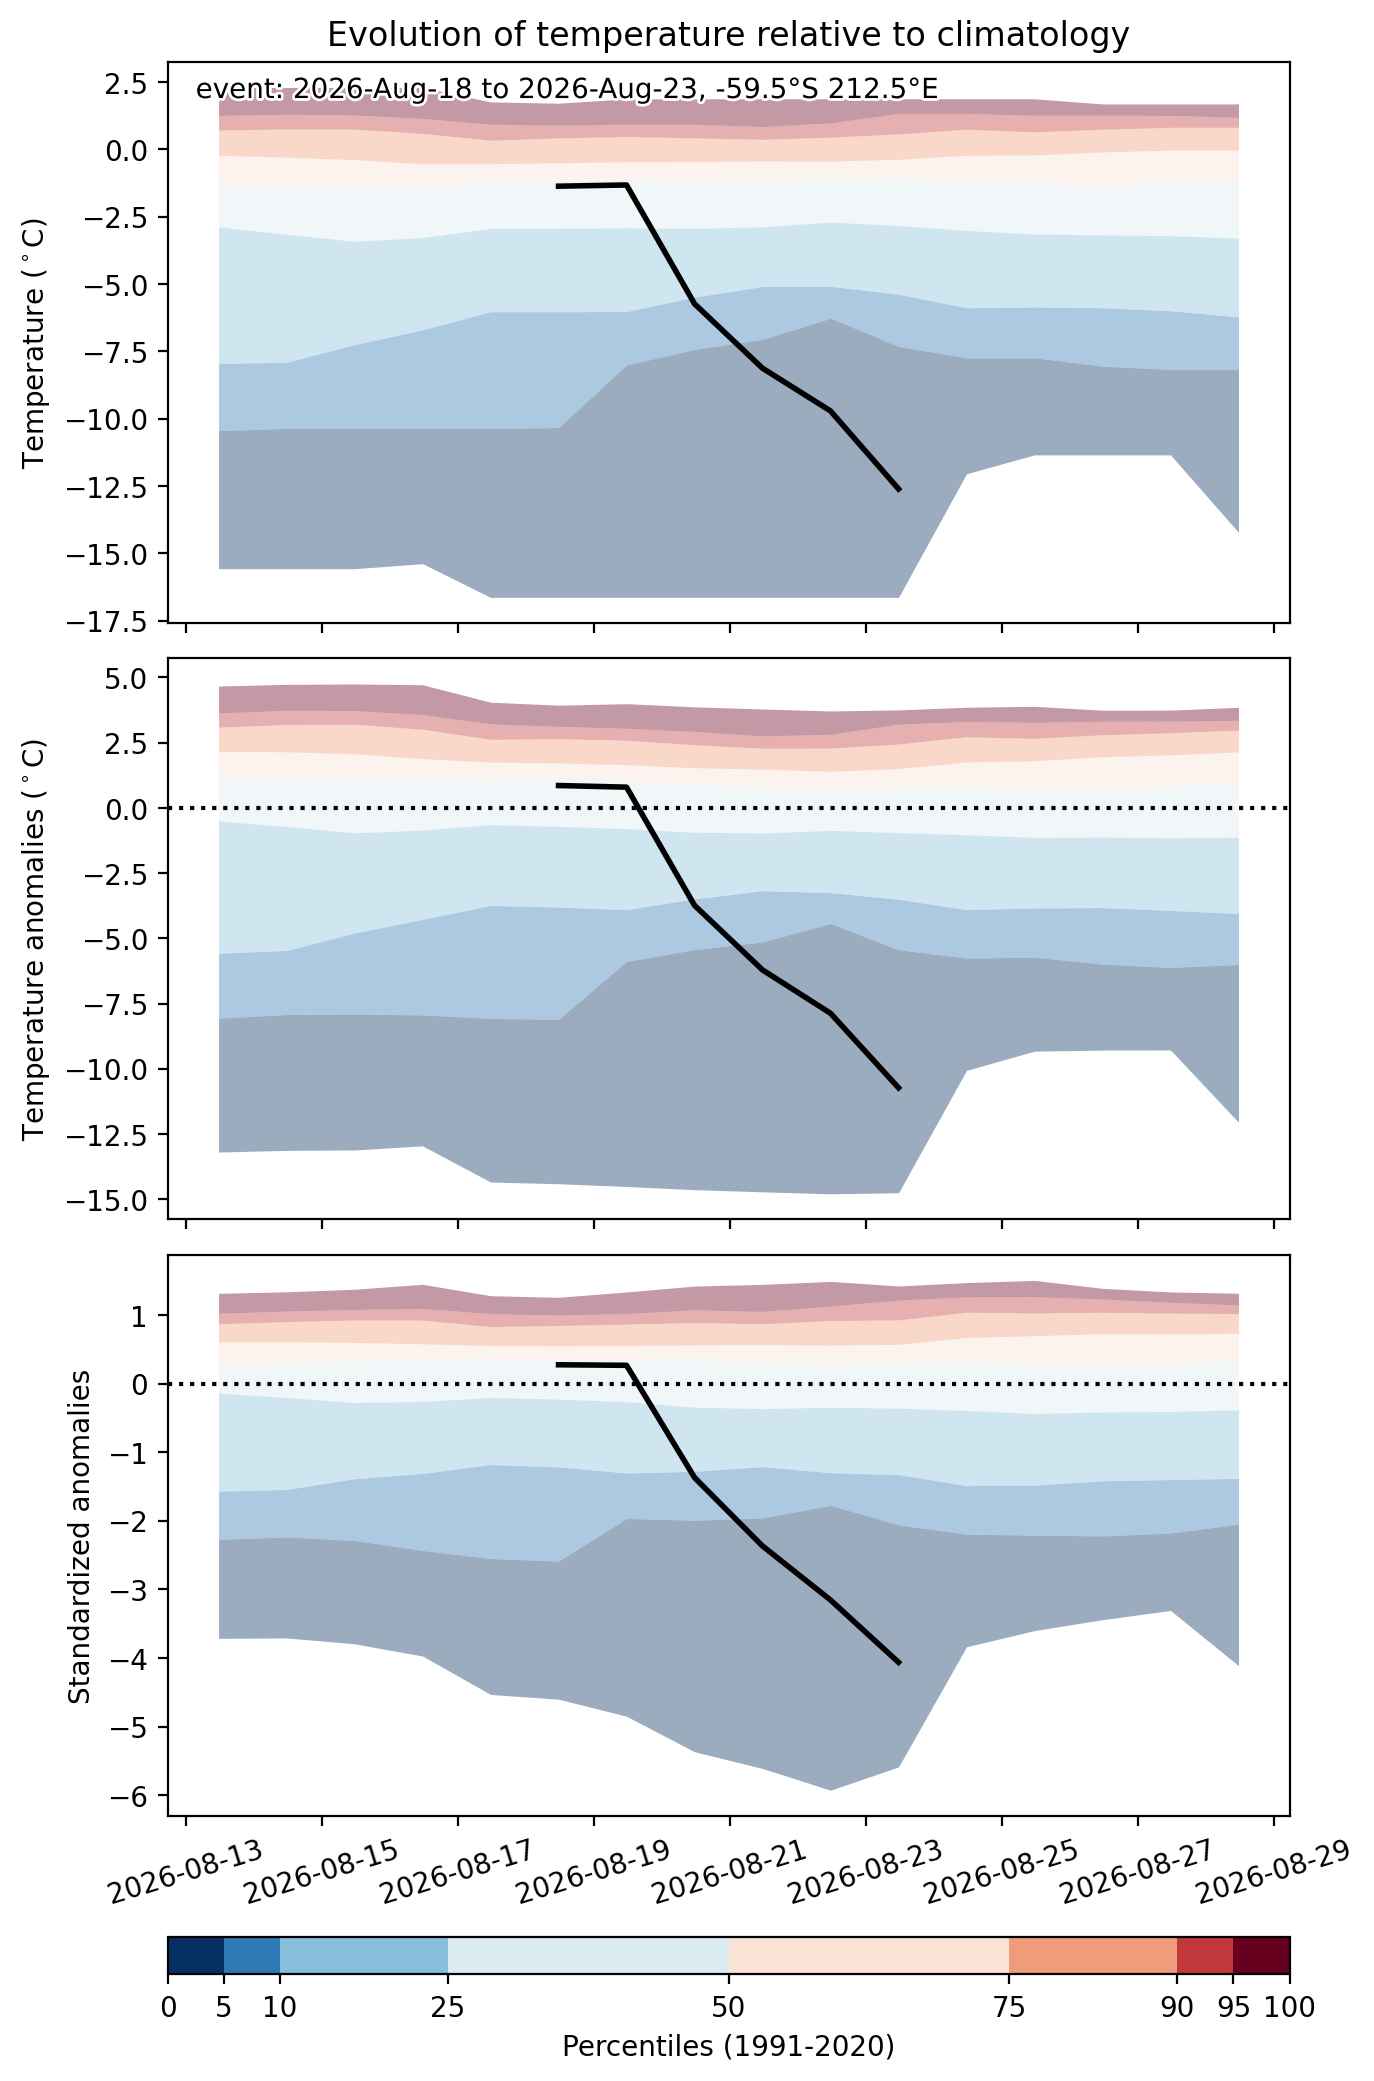
(ongoing) Heat wave occuring from May 01 2026 to May 03 2026 at -35.0°S 47.5°E

Download data: JSON

Event type: Heat wave

Countries affected (identified with ArcGIS Online; provided only for geographical reference):

    Duration: 3 days

    Time span: May 01 2026 to May 03 2026

    Statistics over entire affected area:

    • Mean temperature anomaly: 2.1 °C
    • Mean temperature: 20.9 °C
    • Maximum temperature anomaly: 2.7 °C
    • Maximum temperature: 22.1 °C

    Event center: -35.0°S 47.5°E

    Area affected: 51047 km$^2$


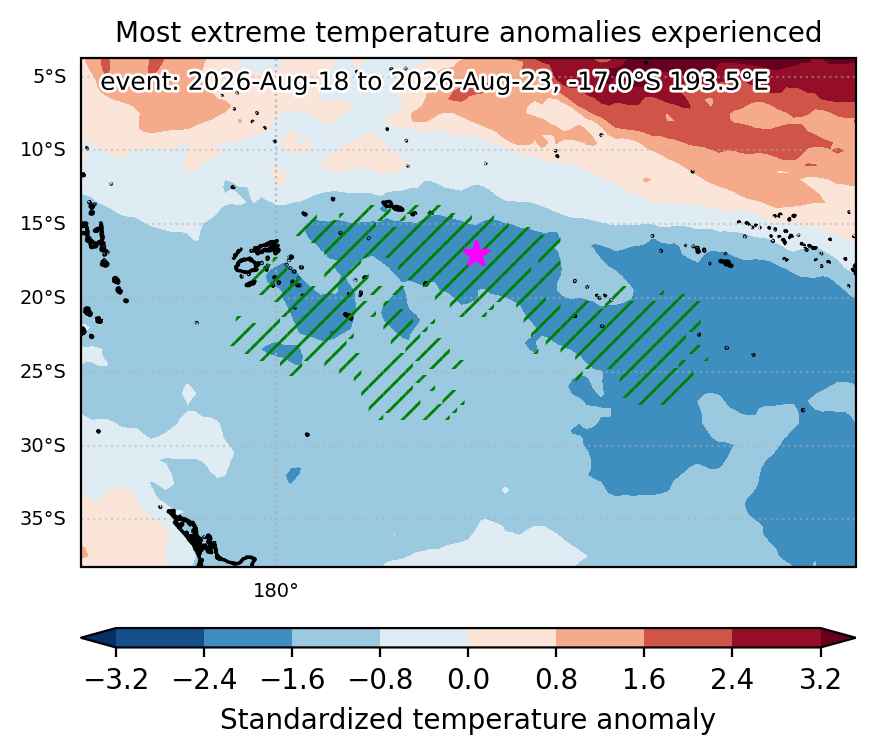
    Fig. 1: unavailable since event is ongoing.


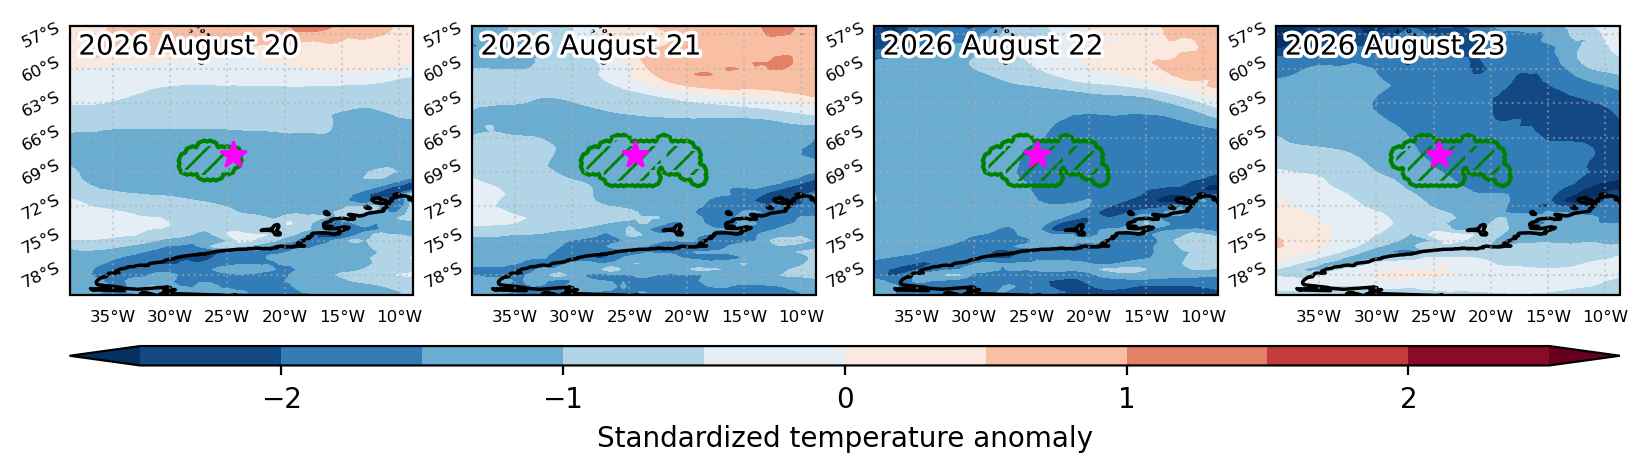
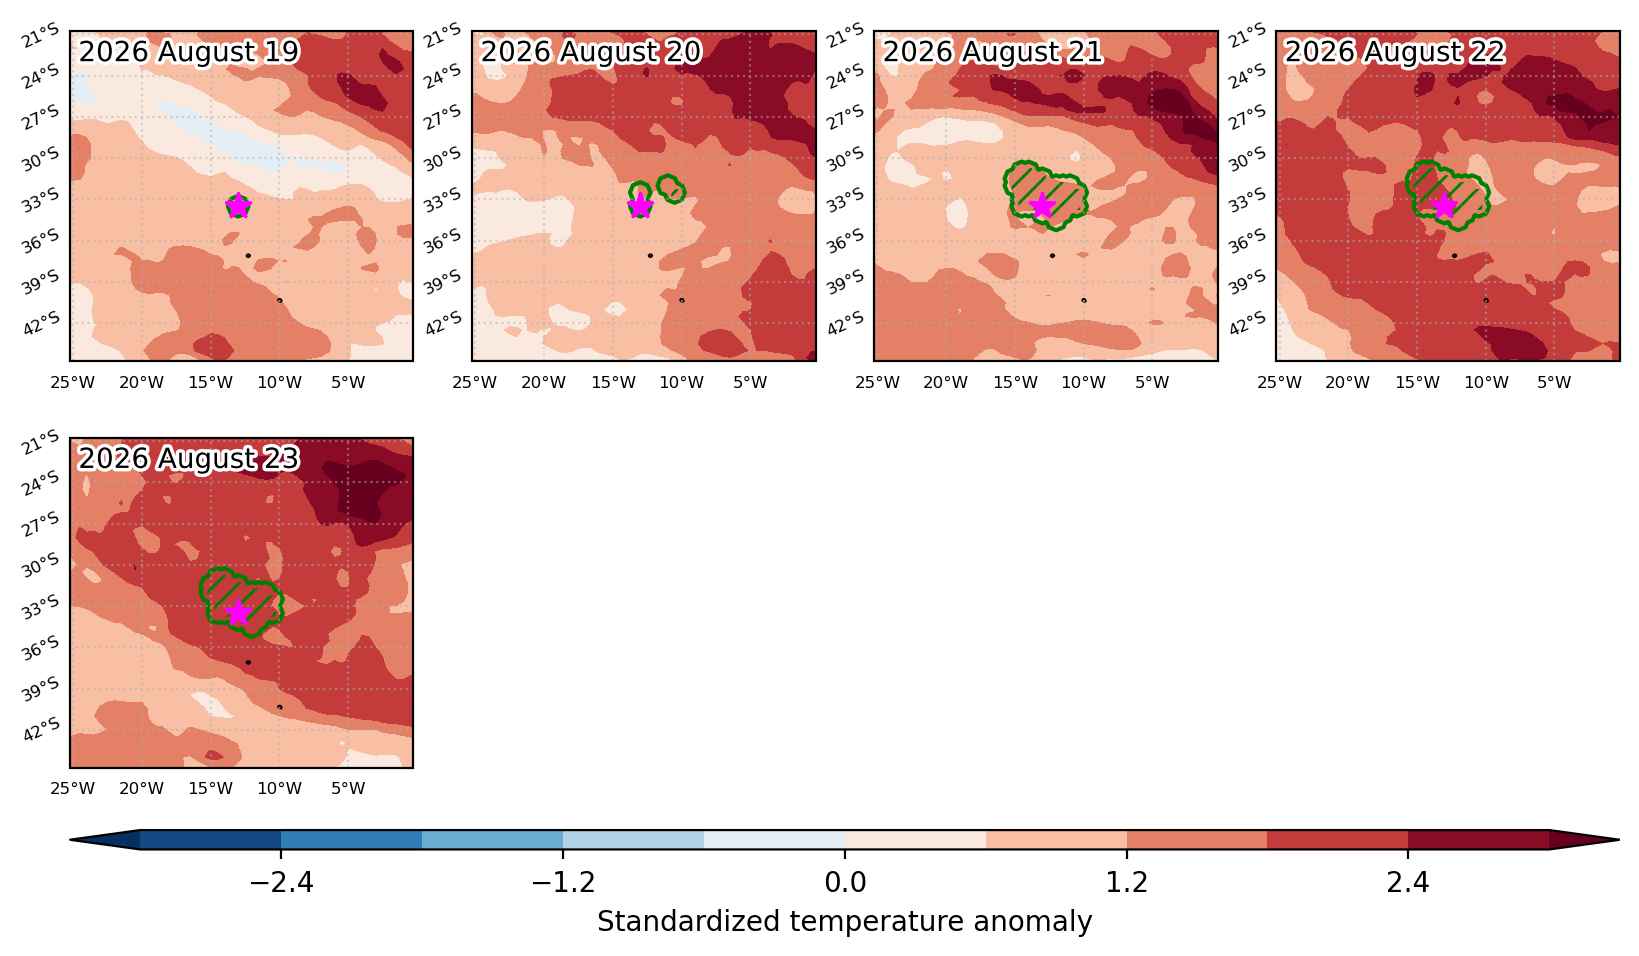
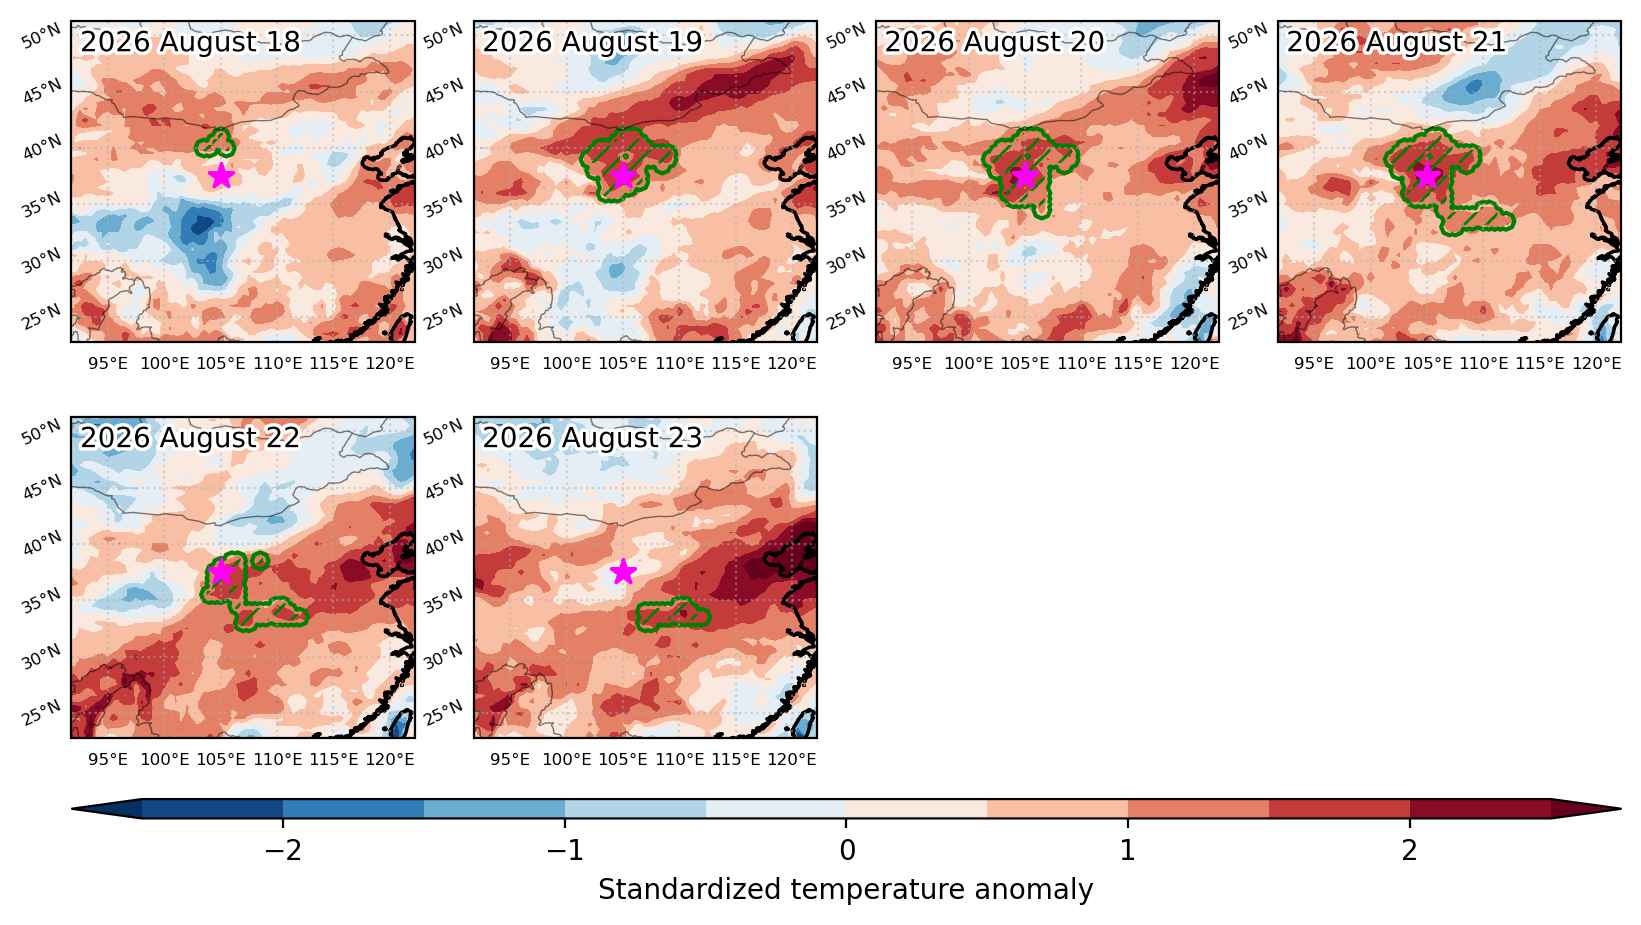
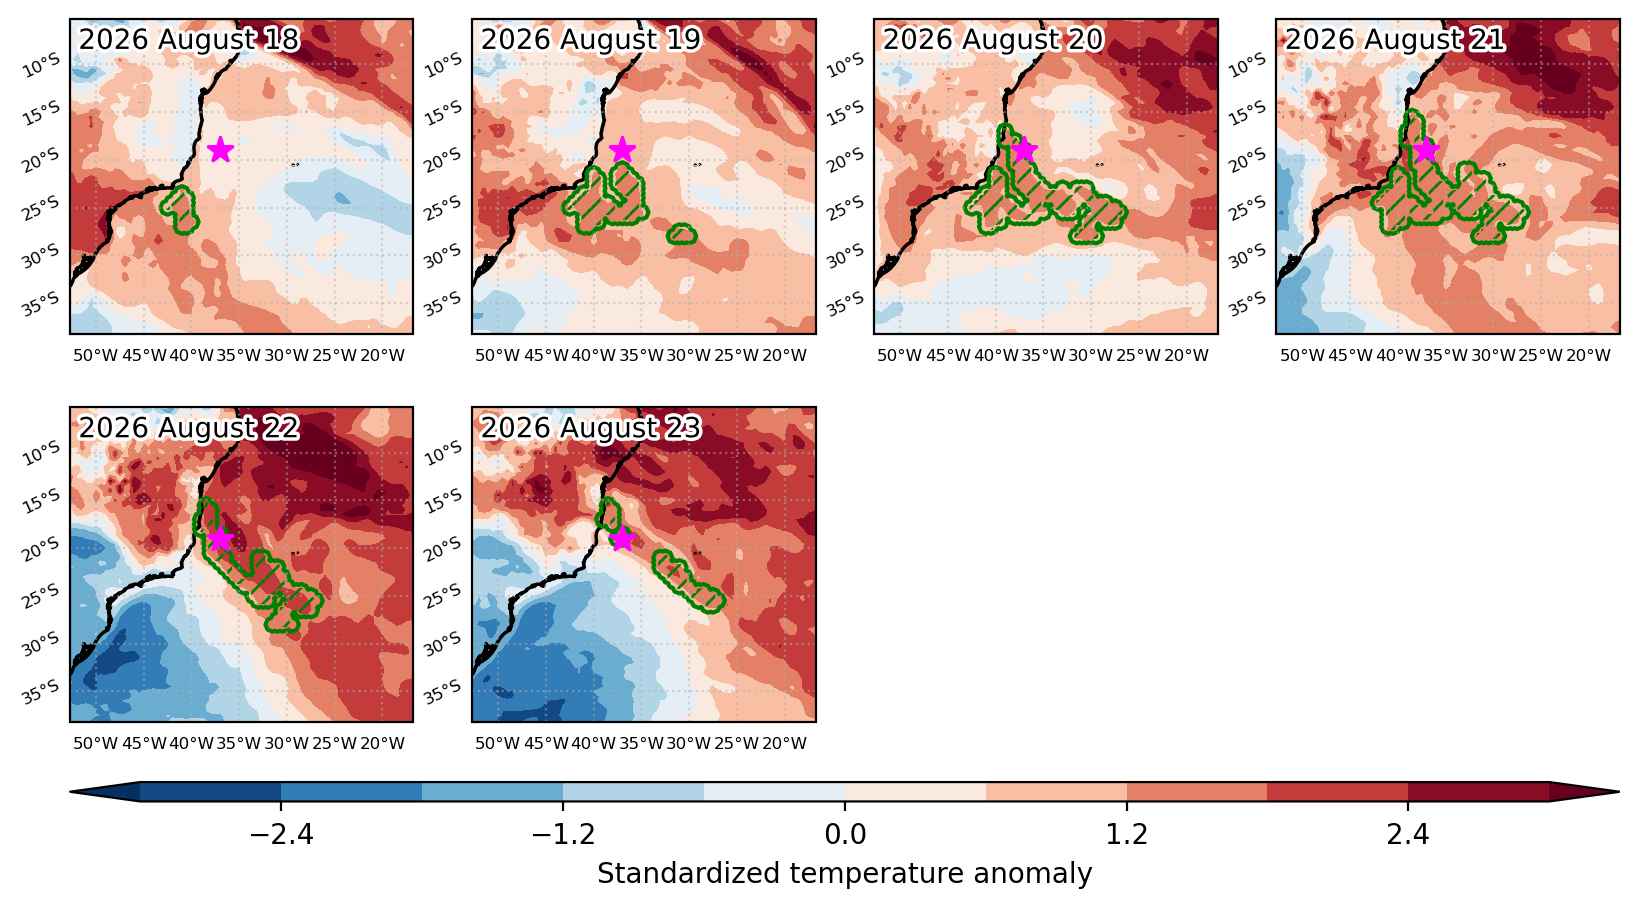
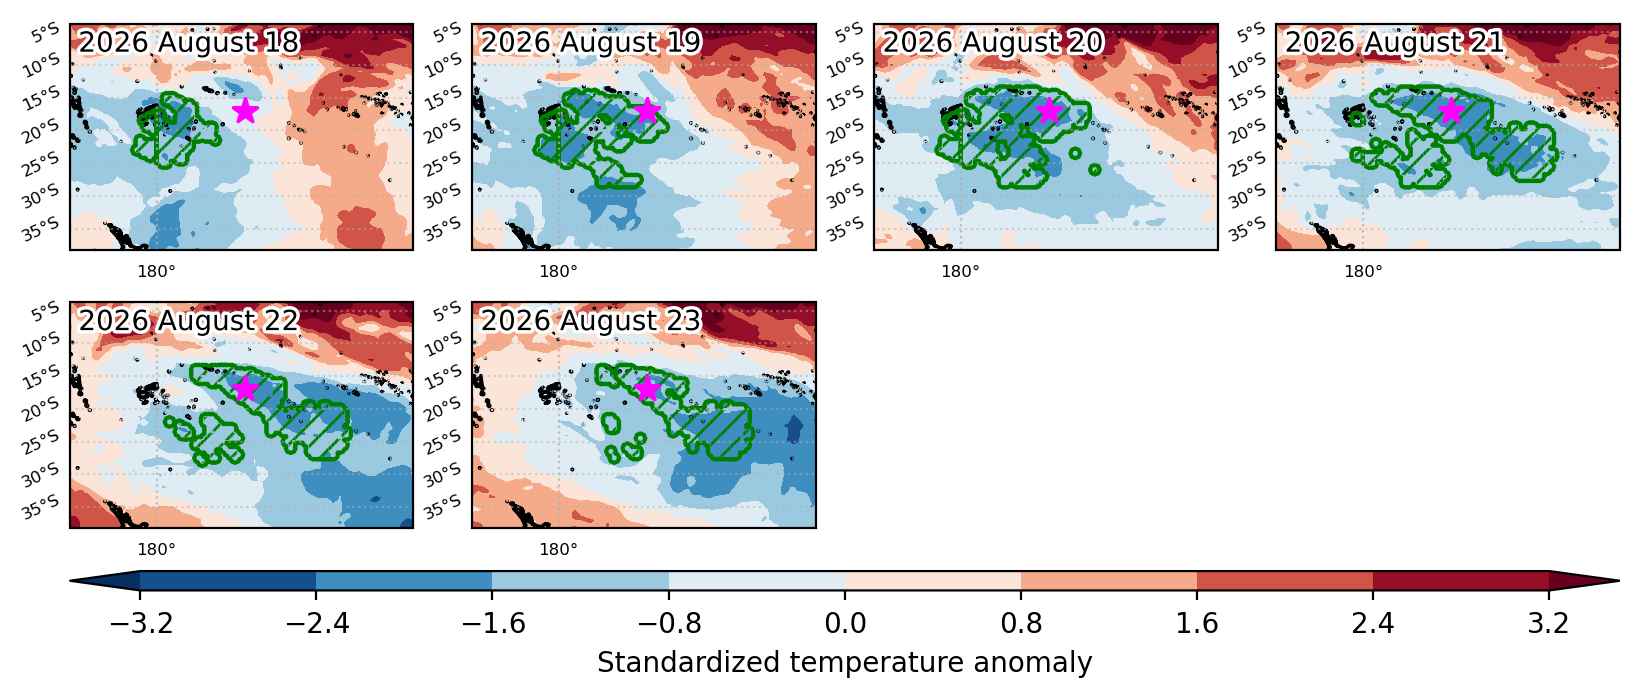
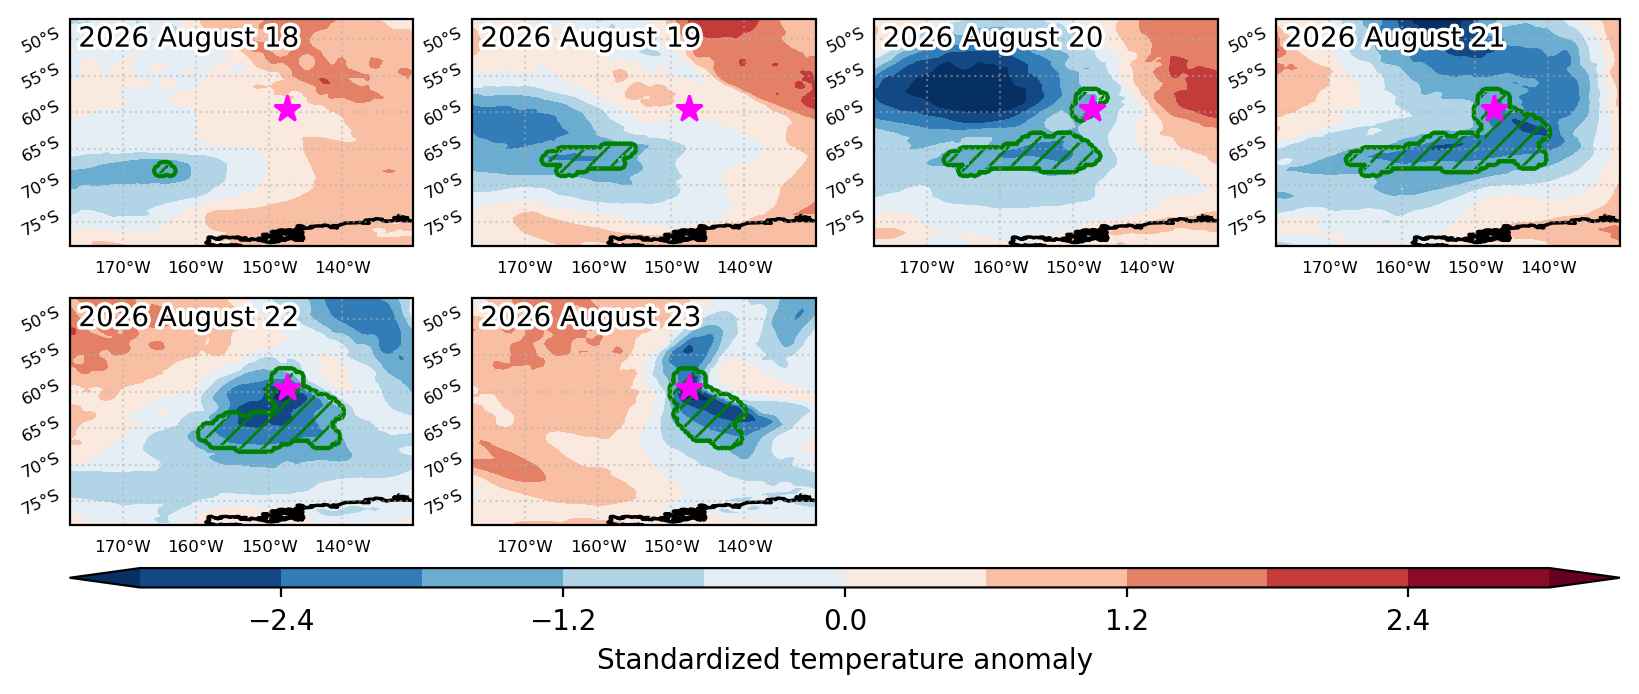
    Fig. 3: Maps illustrating the evolution of standardized temperature anomalies during the event.

    Event ID: Heat_wave_2026-May-01_to_2026-May-03_47.5_-35.0

    (ongoing) Heat wave occuring from May 01 2026 to May 03 2026 at 5.5°N 237.5°E

    Download data: JSON

    Event type: Heat wave

    Countries affected (identified with ArcGIS Online; provided only for geographical reference):

      Duration: 3 days

      Time span: May 01 2026 to May 03 2026

      Statistics over entire affected area:

      • Mean temperature anomaly: 1.2 °C
      • Mean temperature: 27.8 °C
      • Maximum temperature anomaly: 2.0 °C
      • Maximum temperature: 28.5 °C

      Event center: 5.5°N 237.5°E

      Area affected: 184608 km$^2$


      Fig. 1: unavailable since event is ongoing.


      Fig. 3: Maps illustrating the evolution of standardized temperature anomalies during the event.

      Event ID: Heat_wave_2026-May-01_to_2026-May-03_237.5_5.5

      (ongoing) Heat wave occuring from May 01 2026 to May 03 2026 at -23.5°S 34.5°E

      Download data: JSON

      Event type: Heat wave

      Countries affected (identified with ArcGIS Online; provided only for geographical reference):

      • Mozambique

      Duration: 3 days

      Time span: May 01 2026 to May 03 2026

      Statistics over entire affected area:

      • Mean temperature anomaly: 2.2 °C
      • Mean temperature: 25.7 °C
      • Maximum temperature anomaly: 4.3 °C
      • Maximum temperature: 27.9 °C

      Event center: -23.5°S 34.5°E

      Area affected: 213185 km$^2$


      Fig. 1: unavailable since event is ongoing.


      Fig. 3: Maps illustrating the evolution of standardized temperature anomalies during the event.

      Event ID: Heat_wave_2026-May-01_to_2026-May-03_34.5_-23.5

      (ongoing) Heat wave occuring from May 01 2026 to May 03 2026 at 86.5°N 311.5°E

      Download data: JSON

      Event type: Heat wave

      Countries affected (identified with ArcGIS Online; provided only for geographical reference):

        Duration: 3 days

        Time span: May 01 2026 to May 03 2026

        Statistics over entire affected area:

        • Mean temperature anomaly: 5.6 °C
        • Mean temperature: -6.9 °C
        • Maximum temperature anomaly: 6.9 °C
        • Maximum temperature: -5.1 °C

        Event center: 86.5°N 311.5°E

        Area affected: 52373 km$^2$


        Fig. 1: unavailable since event is ongoing.


        Fig. 3: Maps illustrating the evolution of standardized temperature anomalies during the event.

        Event ID: Heat_wave_2026-May-01_to_2026-May-03_311.5_86.5

        (ongoing) Heat wave occuring from May 01 2026 to May 03 2026 at 28.5°N 293.5°E

        Download data: JSON

        Event type: Heat wave

        Countries affected (identified with ArcGIS Online; provided only for geographical reference):

          Duration: 3 days

          Time span: May 01 2026 to May 03 2026

          Statistics over entire affected area:

          • Mean temperature anomaly: 1.7 °C
          • Mean temperature: 23.6 °C
          • Maximum temperature anomaly: 2.4 °C
          • Maximum temperature: 24.6 °C

          Event center: 28.5°N 293.5°E

          Area affected: 108730 km$^2$


          Fig. 1: unavailable since event is ongoing.


          Fig. 3: Maps illustrating the evolution of standardized temperature anomalies during the event.

          Event ID: Heat_wave_2026-May-01_to_2026-May-03_293.5_28.5

          (ongoing) Heat wave occuring from May 01 2026 to May 03 2026 at 31.0°N 322.0°E

          Download data: JSON

          Event type: Heat wave

          Countries affected (identified with ArcGIS Online; provided only for geographical reference):

            Duration: 3 days

            Time span: May 01 2026 to May 03 2026

            Statistics over entire affected area:

            • Mean temperature anomaly: 1.4 °C
            • Mean temperature: 20.8 °C
            • Maximum temperature anomaly: 1.8 °C
            • Maximum temperature: 21.4 °C

            Event center: 31.0°N 322.0°E

            Area affected: 60443 km$^2$


            Fig. 1: unavailable since event is ongoing.


            Fig. 3: Maps illustrating the evolution of standardized temperature anomalies during the event.

            Event ID: Heat_wave_2026-May-01_to_2026-May-03_322.0_31.0

            (ongoing) Cold spell occuring from April 30 2026 to May 03 2026 at -73.5°S 300.5°E

            Download data: JSON

            Event type: Cold spell

            Countries affected (identified with ArcGIS Online; provided only for geographical reference):

              Duration: 4 days

              Time span: April 30 2026 to May 03 2026

              Statistics over entire affected area:

              • Mean temperature anomaly: -7.2 °C
              • Mean temperature: -29.6 °C
              • Minimum temperature anomaly: -10.3 °C
              • Minimum temperature: -37.6 °C

              Event center: -73.5°S 300.5°E

              Area affected: 132897 km$^2$


              Fig. 1: unavailable since event is ongoing.


              Fig. 3: Maps illustrating the evolution of standardized temperature anomalies during the event.

              Event ID: Cold_spell_2026-Apr-30_to_2026-May-03_300.5_-73.5

              (ongoing) Heat wave occuring from April 30 2026 to May 03 2026 at 42.5°N 150.0°E

              Download data: JSON

              Event type: Heat wave

              Countries affected (identified with ArcGIS Online; provided only for geographical reference):

                Duration: 4 days

                Time span: April 30 2026 to May 03 2026

                Statistics over entire affected area:

                • Mean temperature anomaly: 3.4 °C
                • Mean temperature: 10.8 °C
                • Maximum temperature anomaly: 6.1 °C
                • Maximum temperature: 15.2 °C

                Event center: 42.5°N 150.0°E

                Area affected: 127187 km$^2$


                Fig. 1: unavailable since event is ongoing.


                Fig. 3: Maps illustrating the evolution of standardized temperature anomalies during the event.

                Event ID: Heat_wave_2026-Apr-30_to_2026-May-03_150.0_42.5

                (ongoing) Cold spell occuring from April 30 2026 to May 03 2026 at -6.5°S 324.0°E

                Download data: JSON

                Event type: Cold spell

                Countries affected (identified with ArcGIS Online; provided only for geographical reference):

                • Brazil

                Duration: 4 days

                Time span: April 30 2026 to May 03 2026

                Statistics over entire affected area:

                • Mean temperature anomaly: -2.0 °C
                • Mean temperature: 23.9 °C
                • Minimum temperature anomaly: -3.4 °C
                • Minimum temperature: 21.3 °C

                Event center: -6.5°S 324.0°E

                Area affected: 55251 km$^2$


                Fig. 1: unavailable since event is ongoing.


                Fig. 3: Maps illustrating the evolution of standardized temperature anomalies during the event.

                Event ID: Cold_spell_2026-Apr-30_to_2026-May-03_324.0_-6.5

                (ongoing) Heat wave occuring from April 30 2026 to May 03 2026 at 22.0°N 278.0°E

                Download data: JSON

                Event type: Heat wave

                Countries affected (identified with ArcGIS Online; provided only for geographical reference):

                • Cuba

                Duration: 4 days

                Time span: April 30 2026 to May 03 2026

                Statistics over entire affected area:

                • Mean temperature anomaly: 1.4 °C
                • Mean temperature: 27.7 °C
                • Maximum temperature anomaly: 2.1 °C
                • Maximum temperature: 28.4 °C

                Event center: 22.0°N 278.0°E

                Area affected: 94631 km$^2$


                Fig. 1: unavailable since event is ongoing.


                Fig. 3: Maps illustrating the evolution of standardized temperature anomalies during the event.

                Event ID: Heat_wave_2026-Apr-30_to_2026-May-03_278.0_22.0