Heat wave occuring from November 15 2017 to November 22 2017 at 2.0°N 106.5°E

Download data: JSON

Event type: Heat wave

Countries affected (identified with ArcGIS Online; provided only for geographical reference):

  • Indonesia
  • Malaysia
  • Thailand

Duration: 8 days

Time span: November 15 2017 to November 22 2017

Statistics over entire affected area:

  • Mean temperature anomaly: 1.2 °C
  • Mean temperature: 27.6 °C
  • Maximum temperature anomaly: 2.7 °C
  • Maximum temperature: 28.6 °C

Event center: 2.0°N 106.5°E

Area affected: 492043 km$^2$
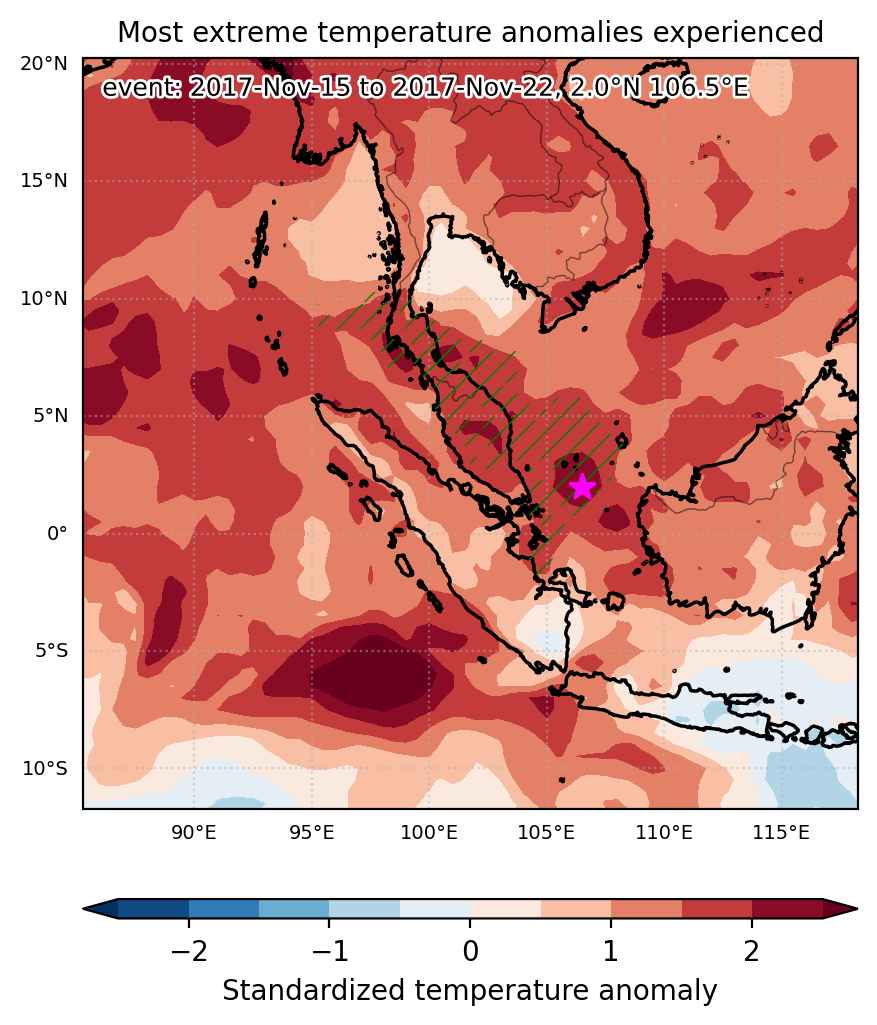

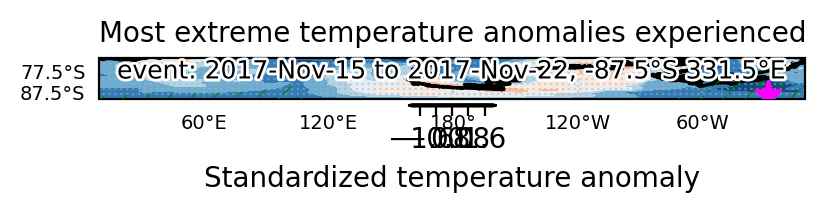
Fig. 1: Map of most extreme temperature anomalies (standardized) experienced during the event. The purple star indicates the center of the extreme event. Green hatching illustrates all areas under the effect of extremes at some time during the event.
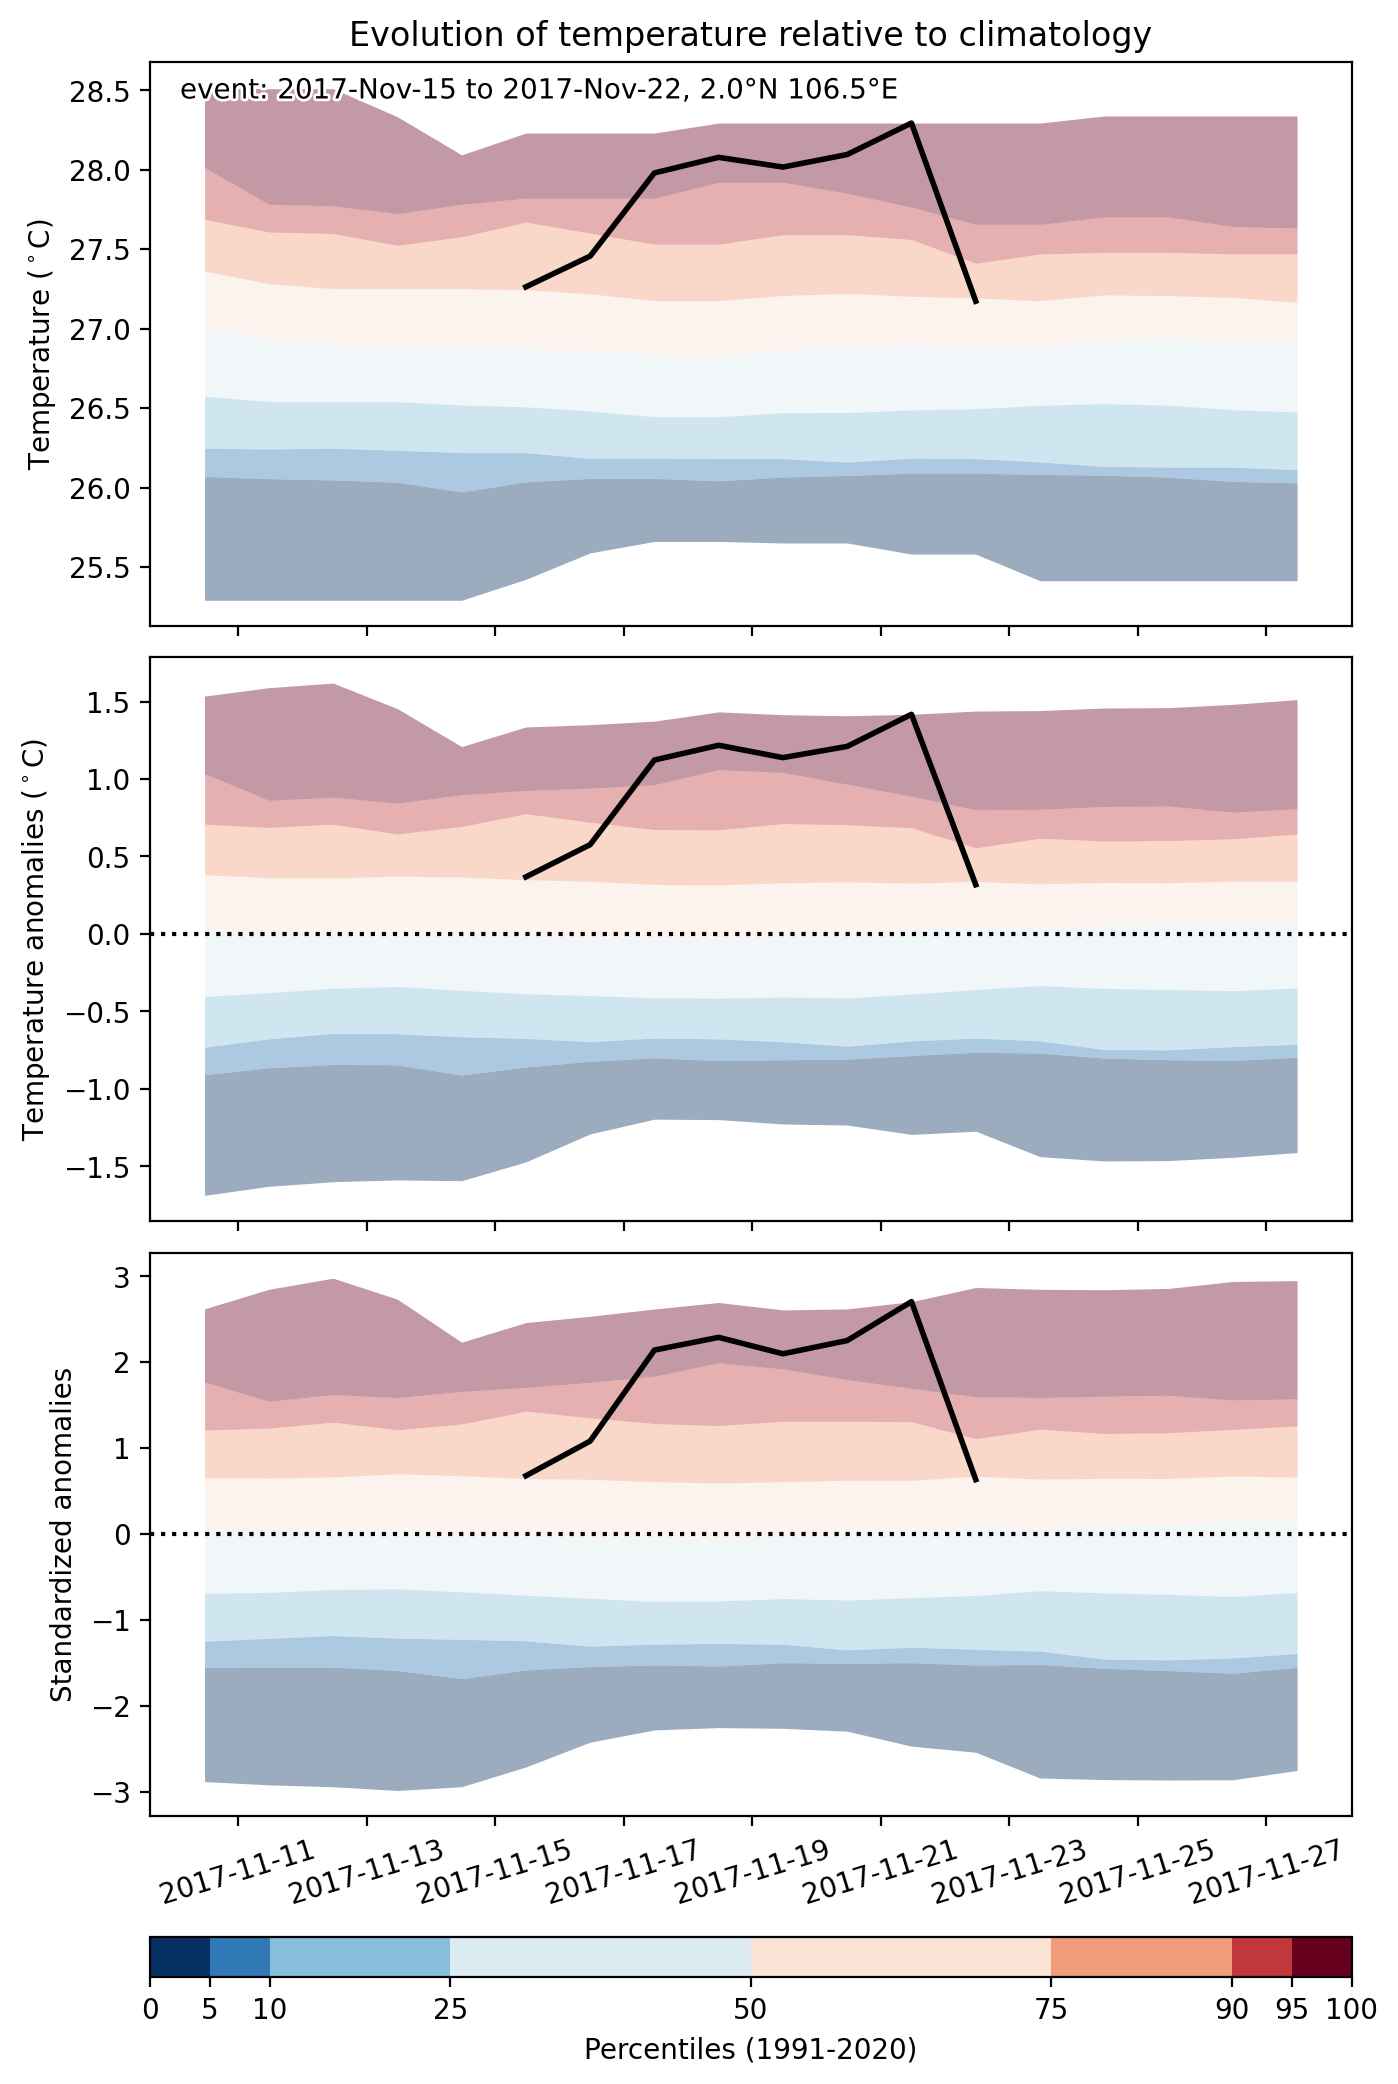


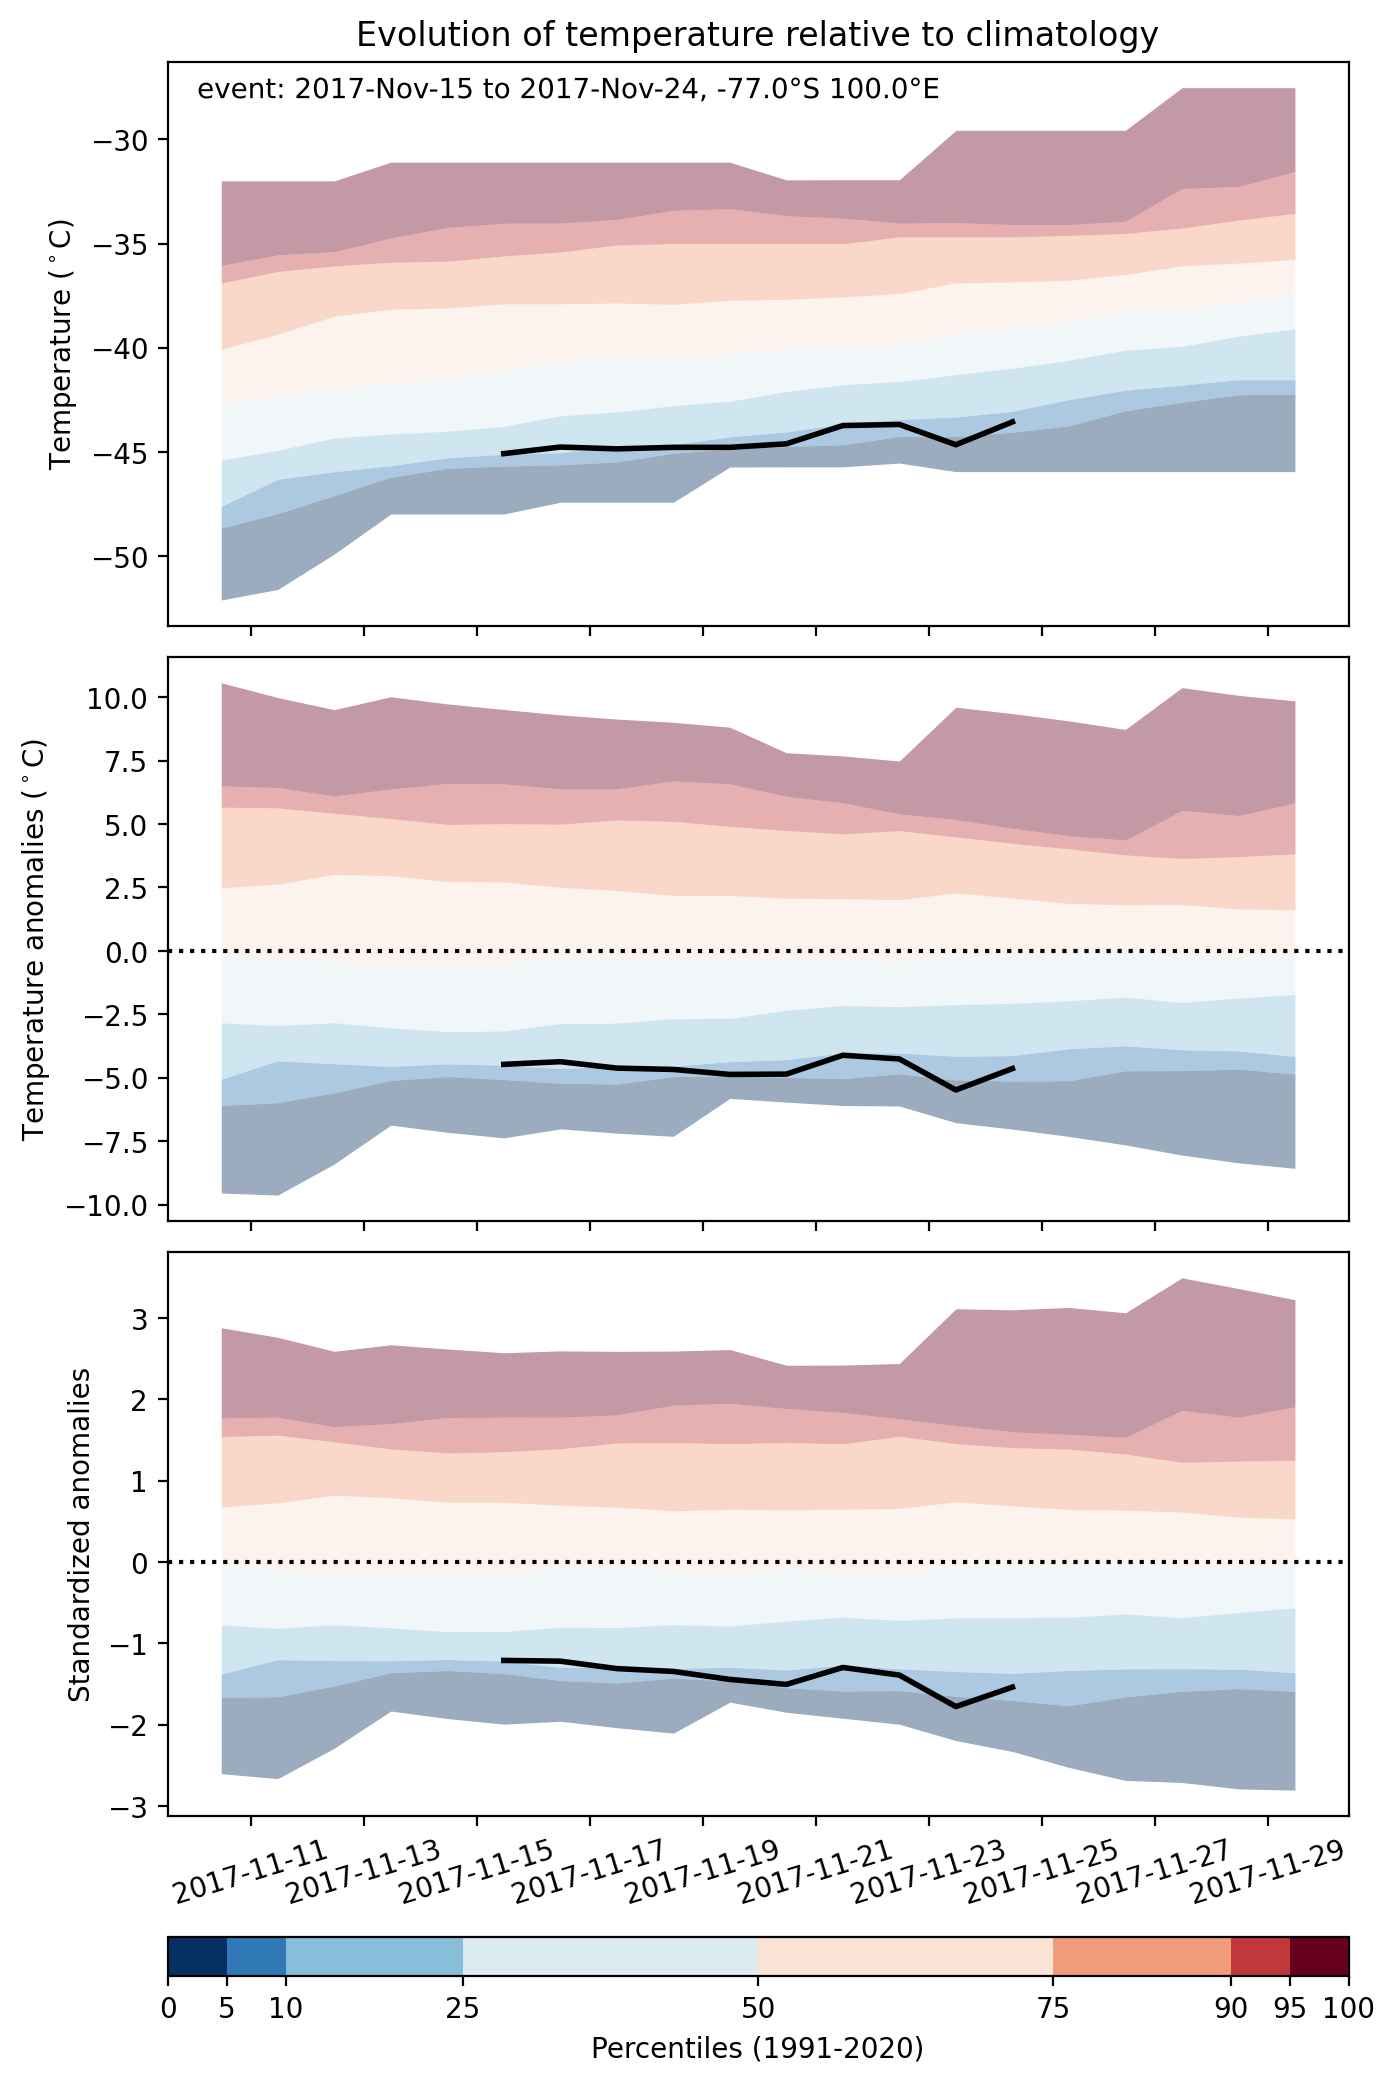
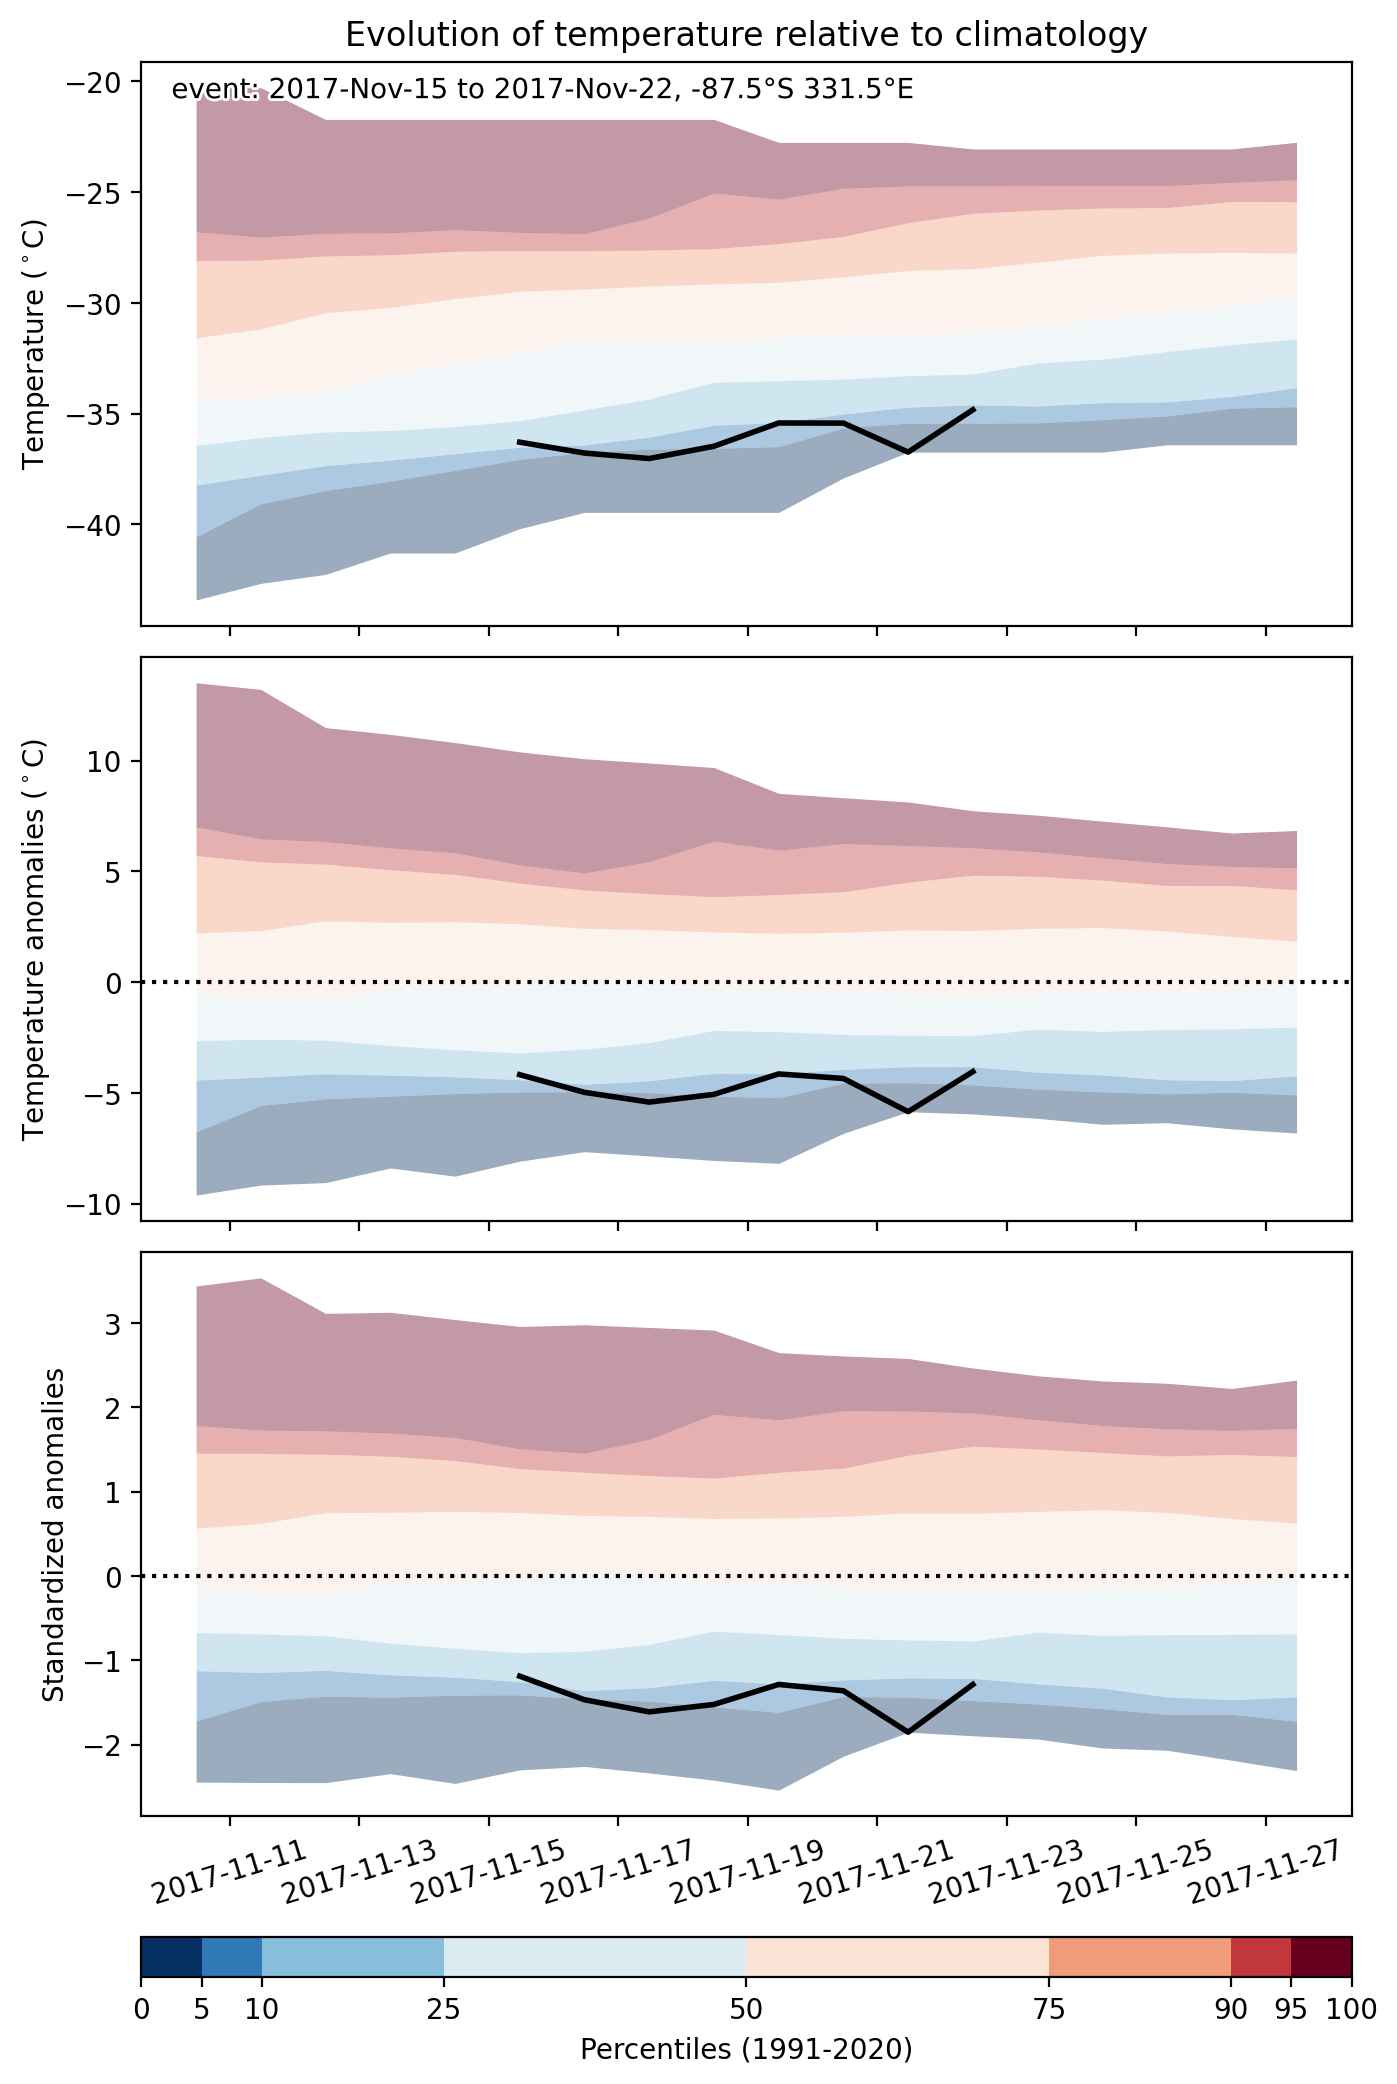
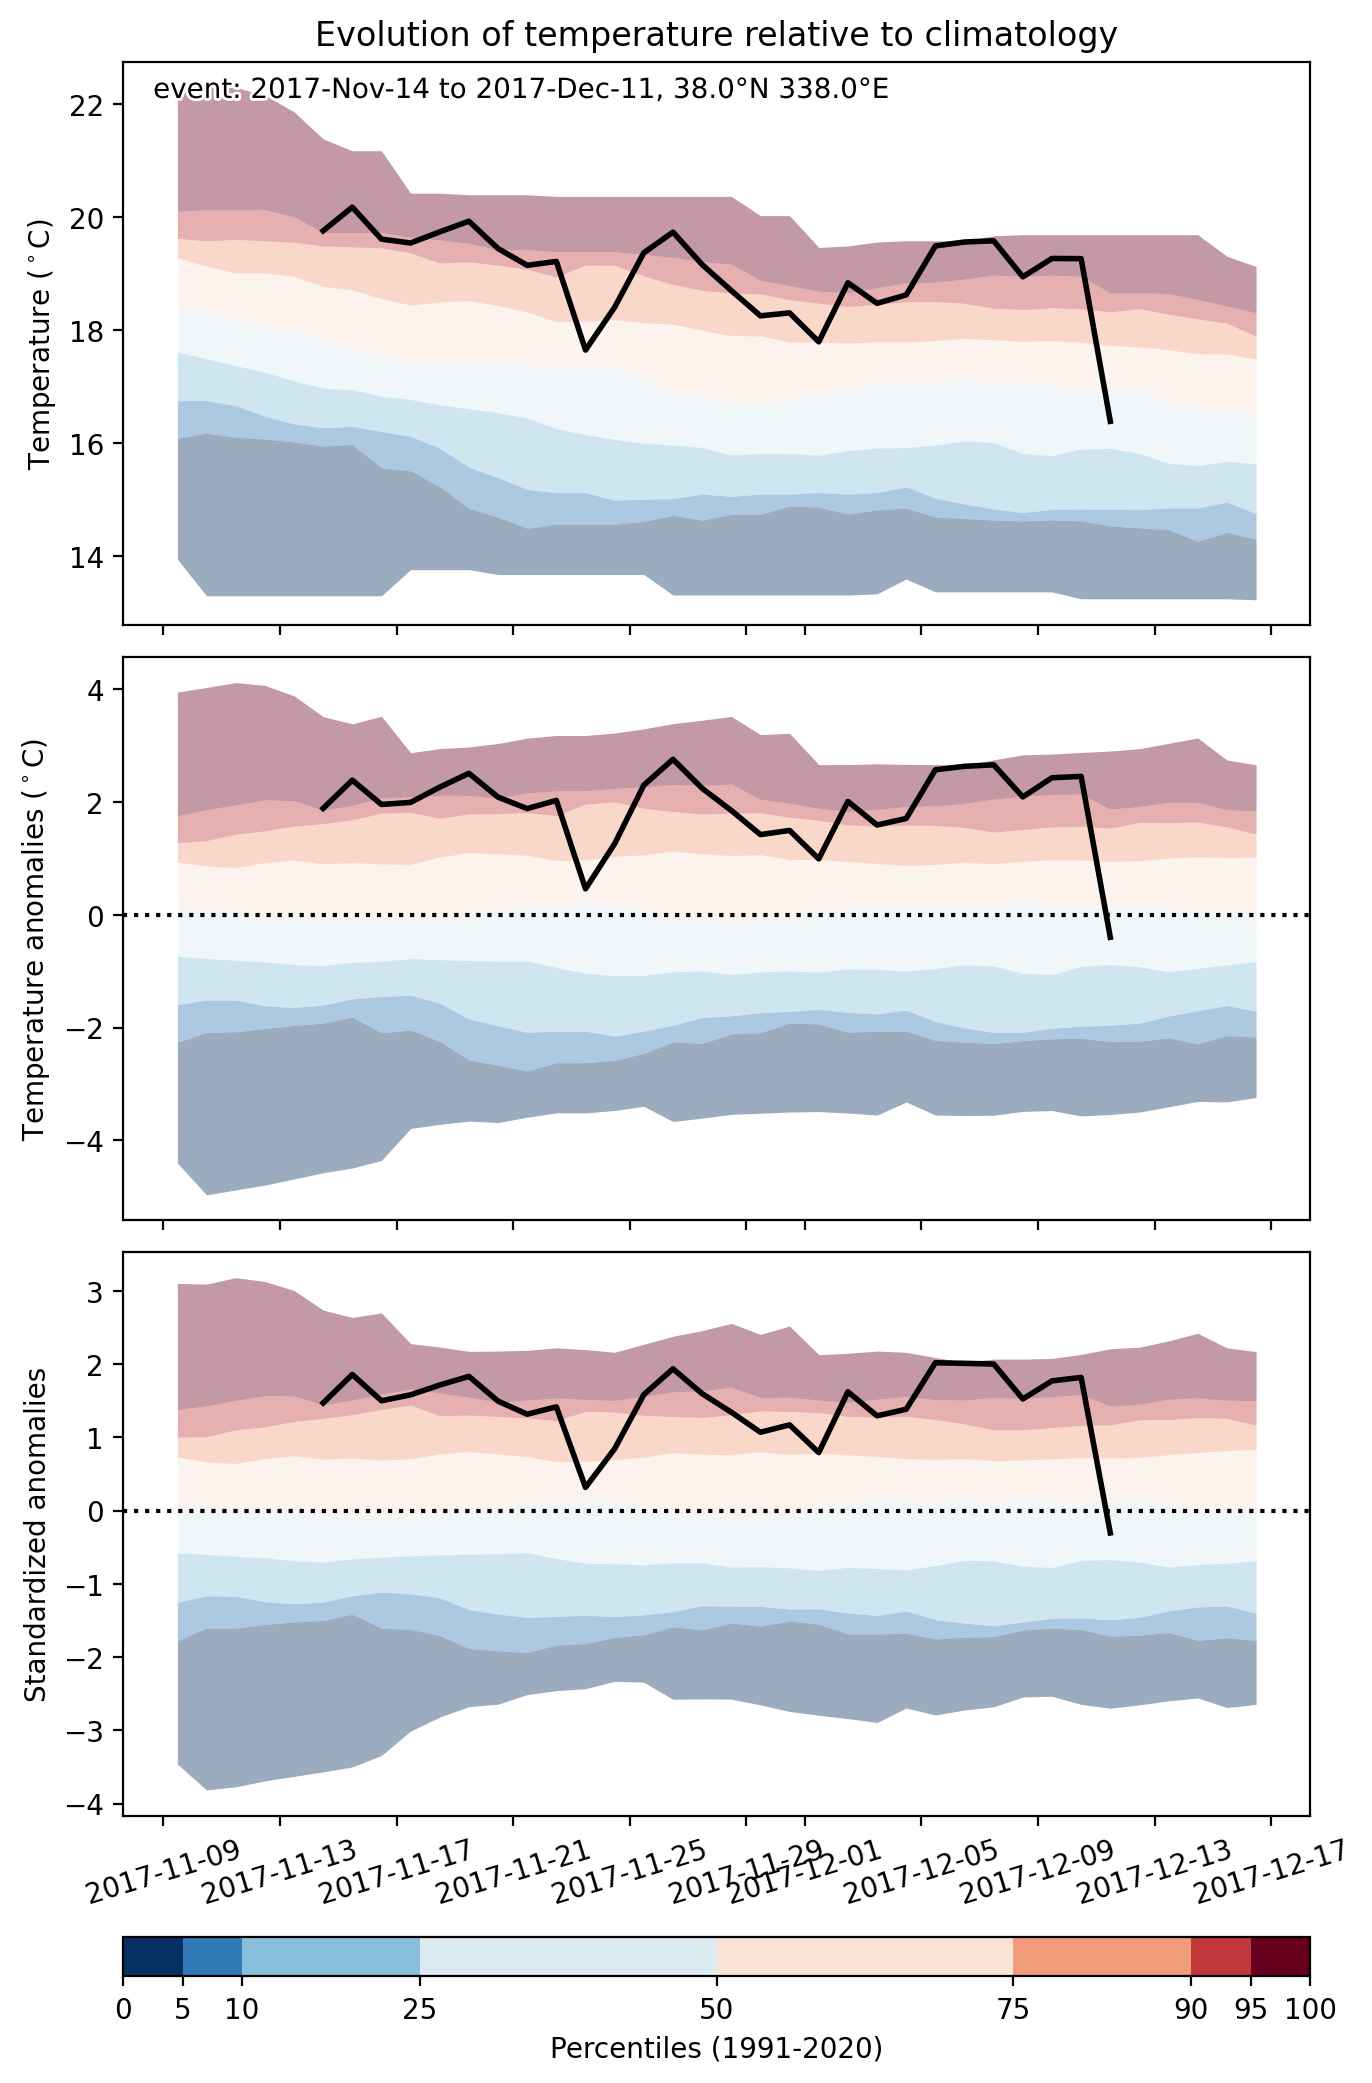
Fig. 2: Evolution of temperature at the center of the event. The climatological percentile distribution is illustrated with color shadings.
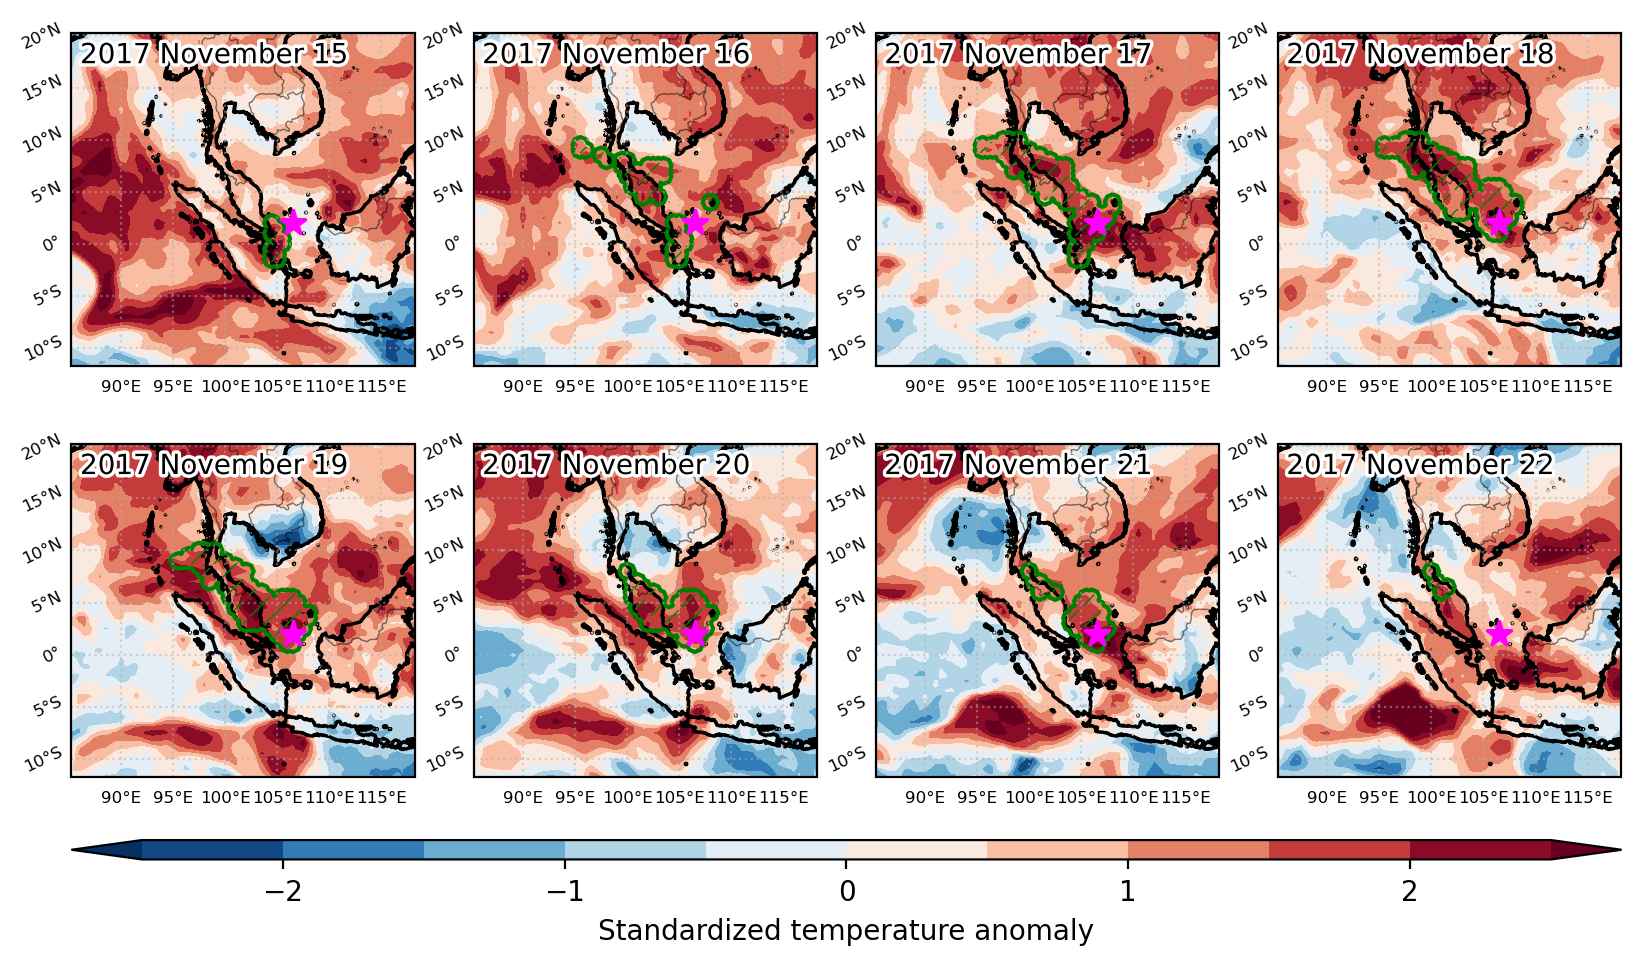


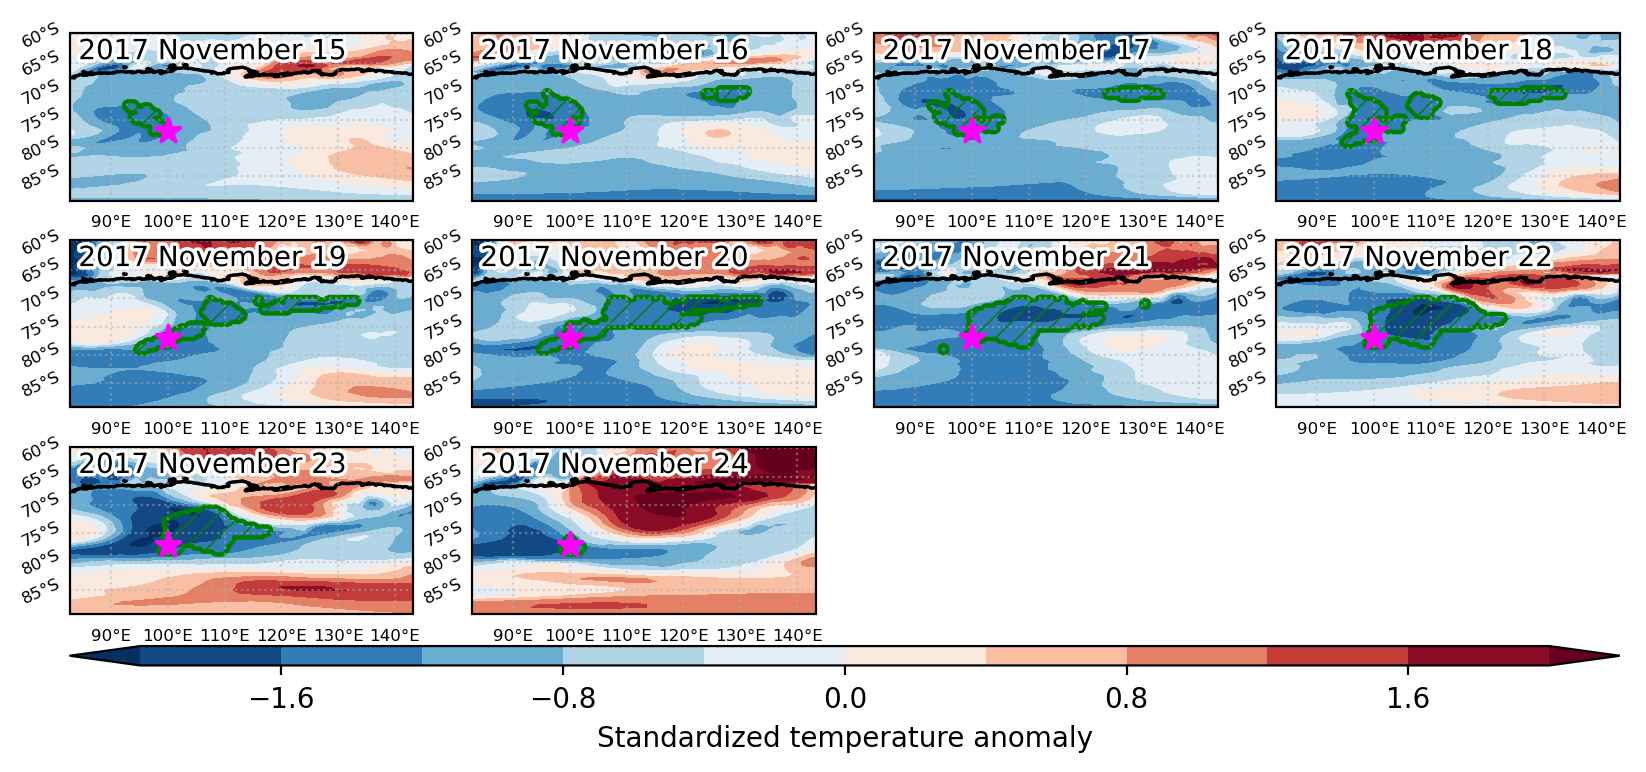
Fig. 3: Maps illustrating the evolution of standardized temperature anomalies during the event.

Event ID: Heat_wave_2017-Nov-15_to_2017-Nov-22_106.5_2.0
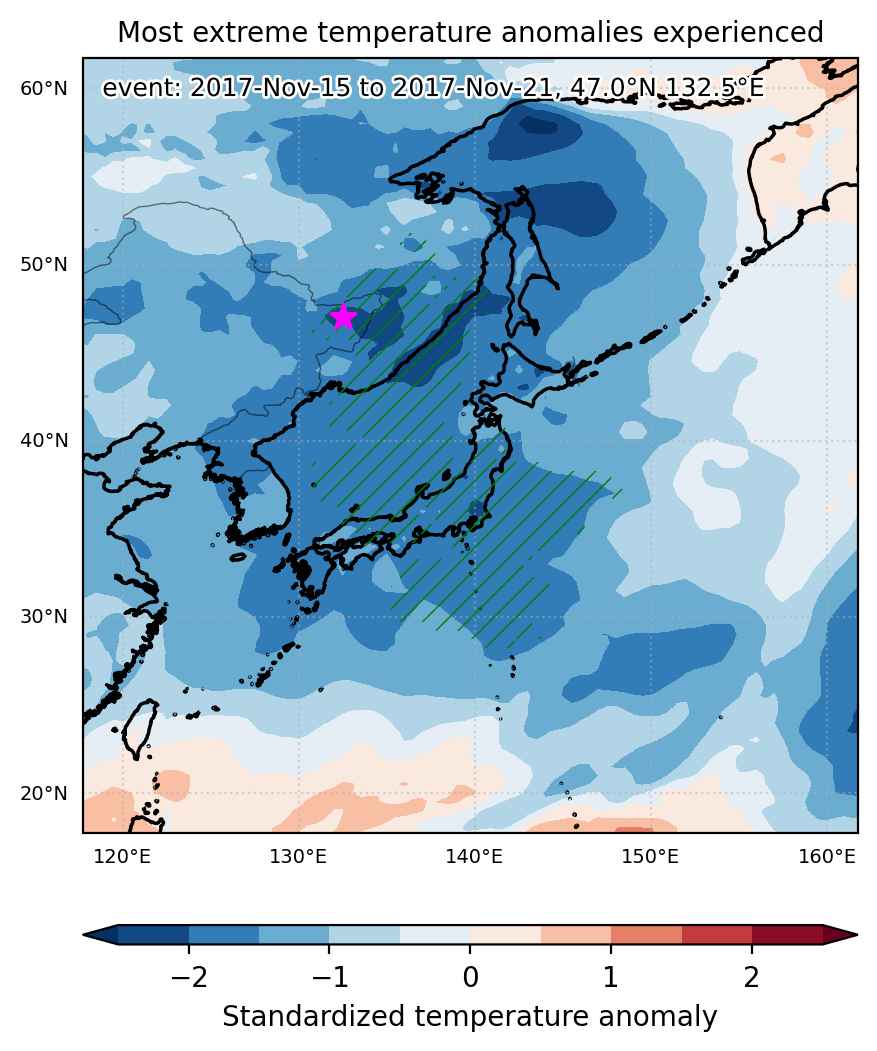
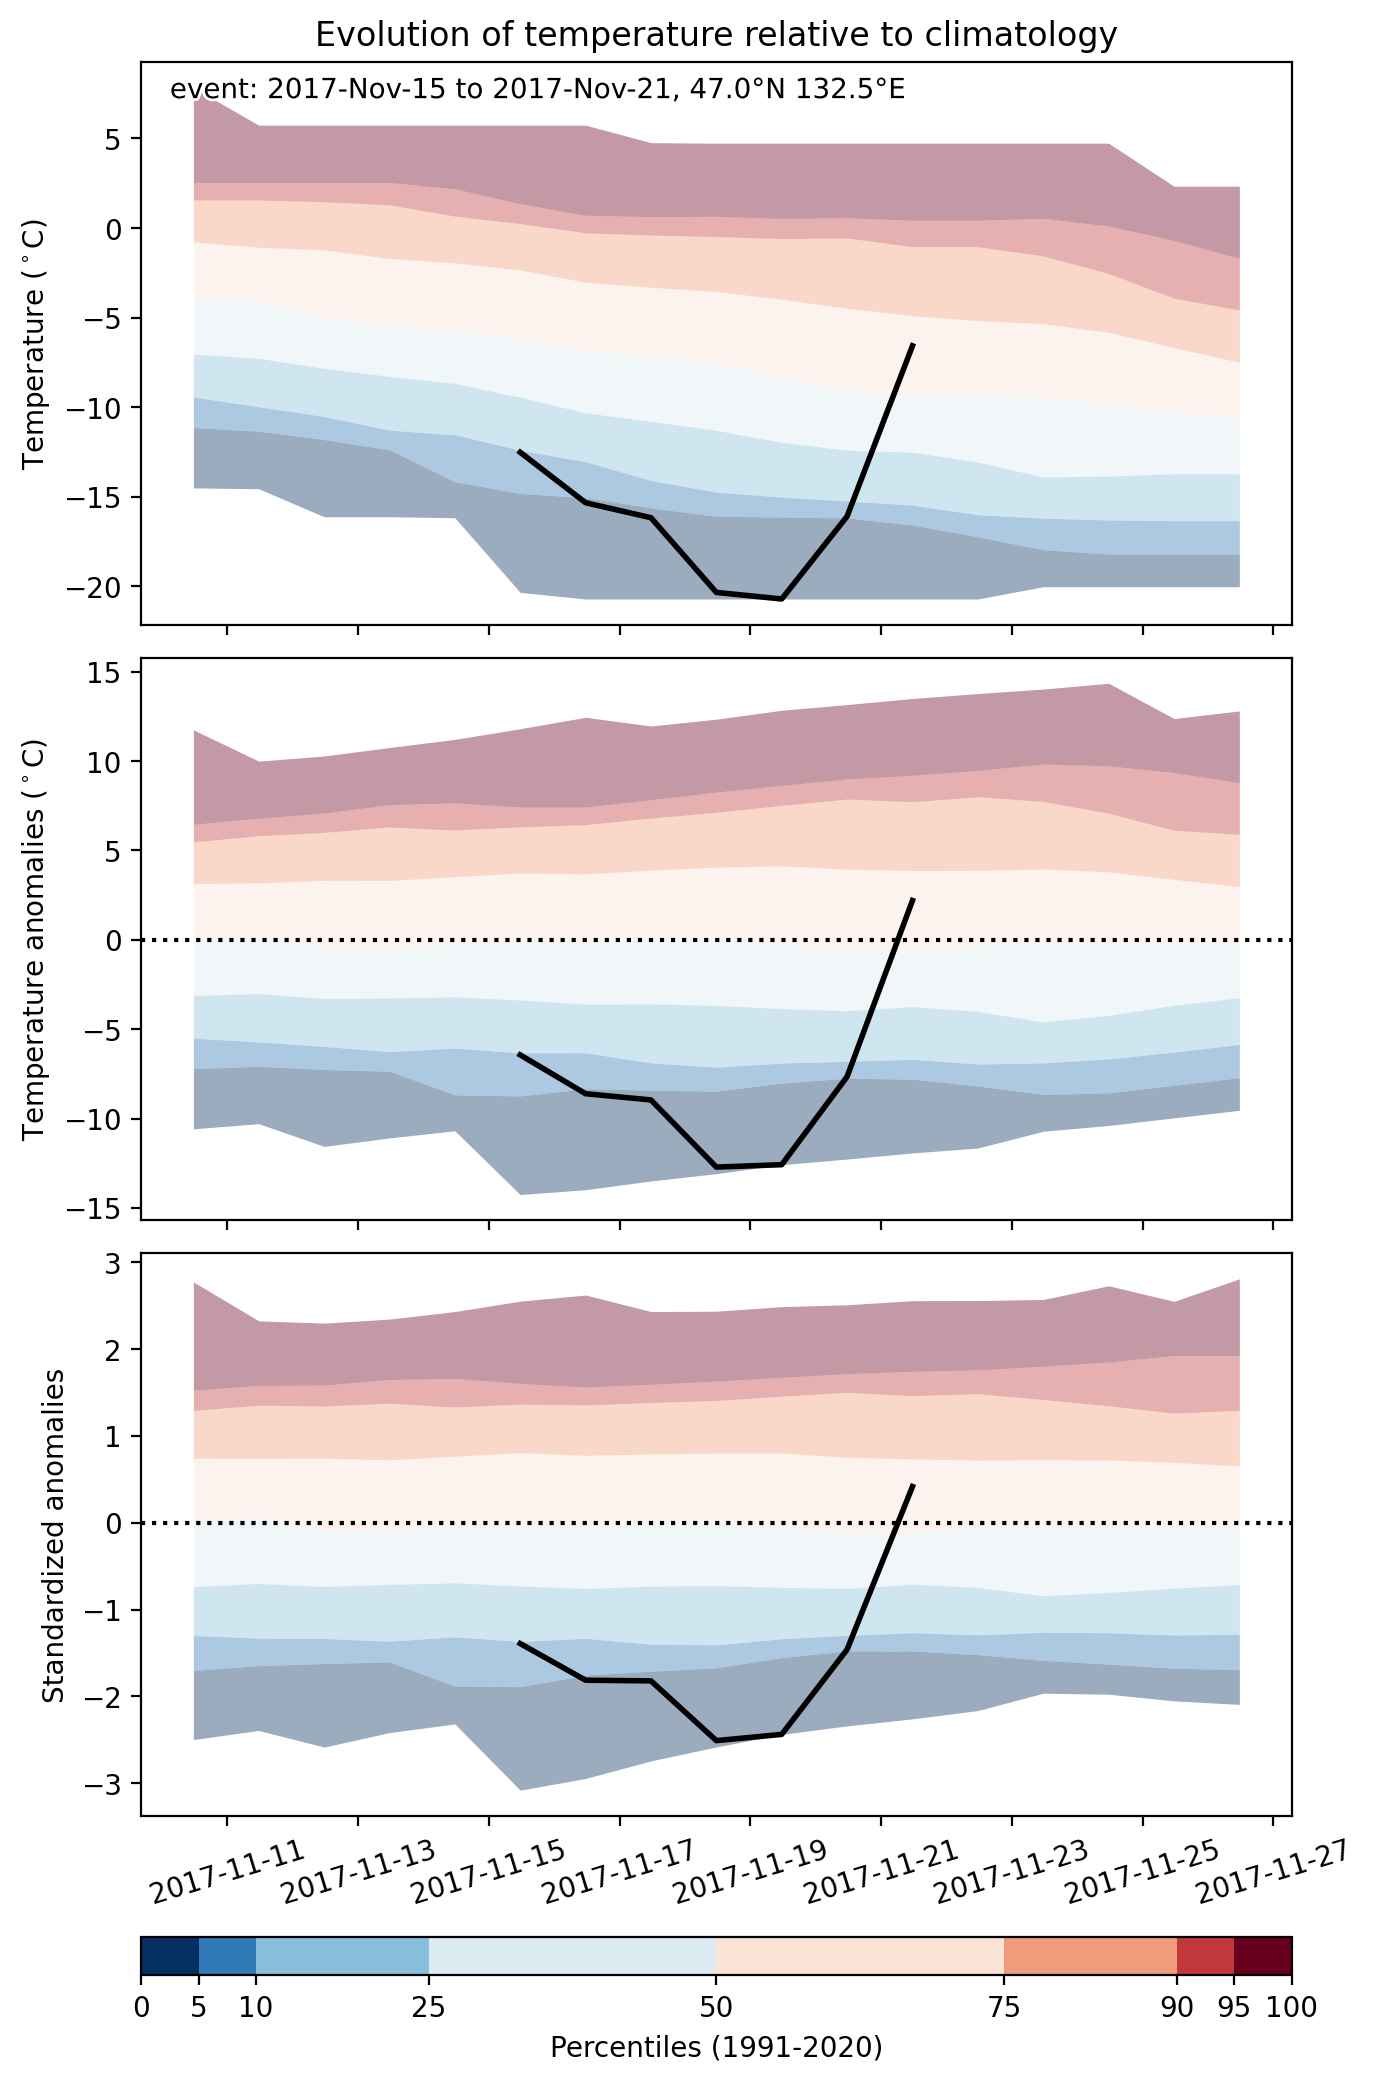
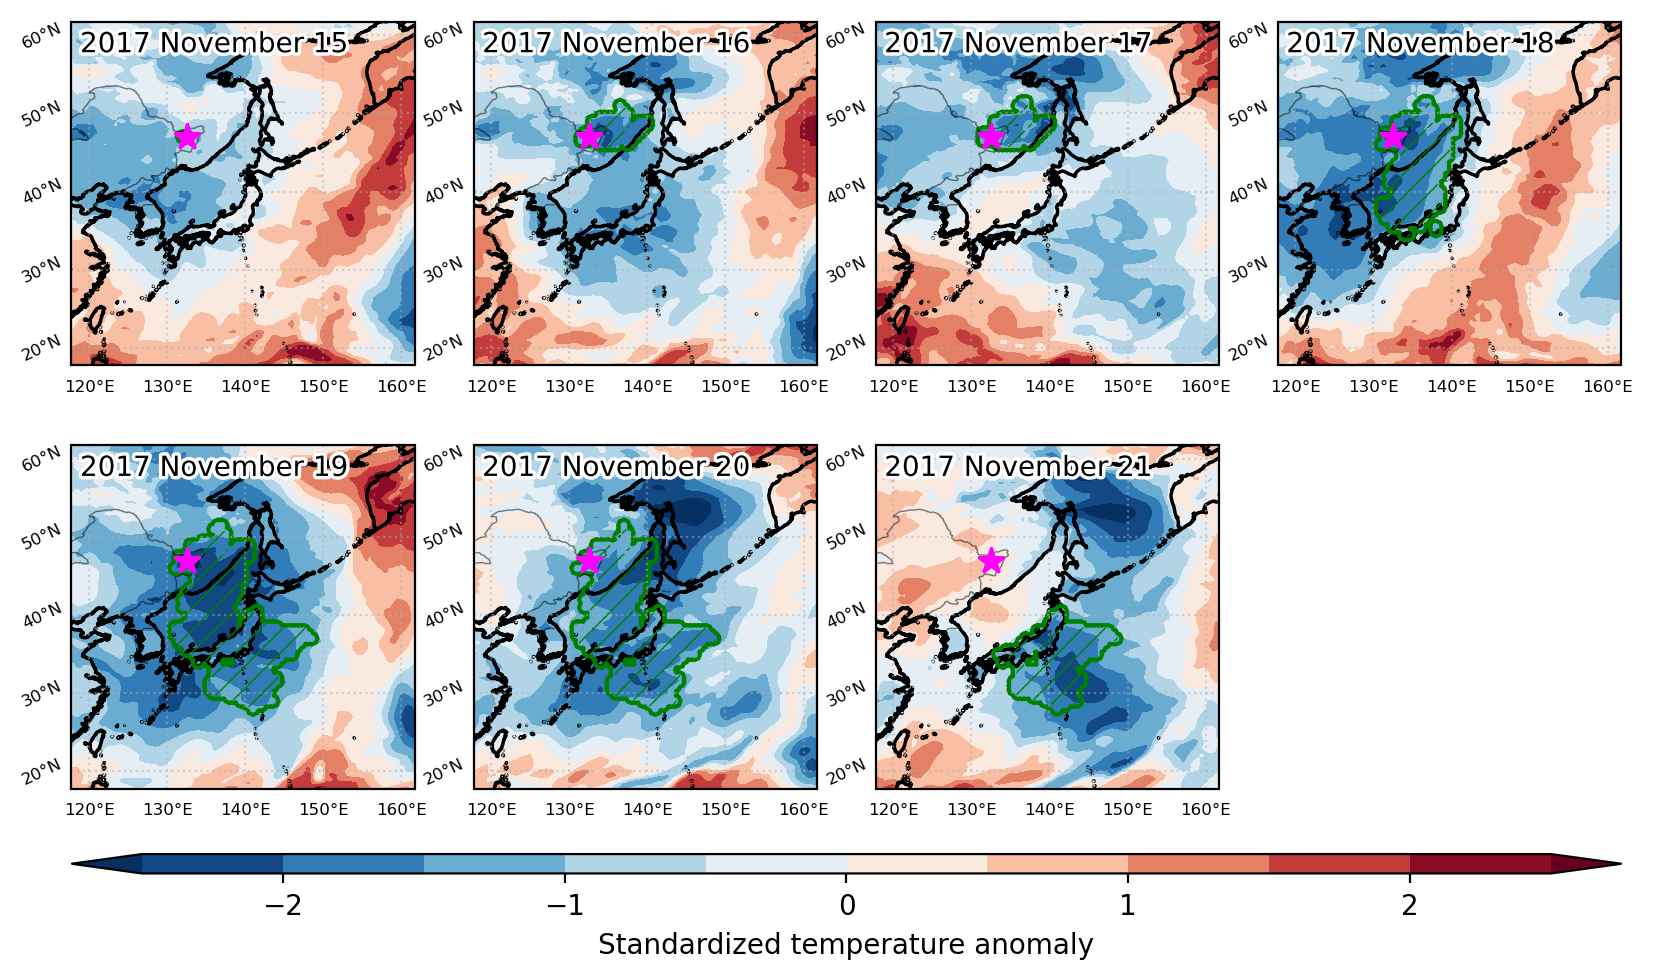
Cold spell occuring from November 15 2017 to November 21 2017 at 47.0°N 132.5°E

Download data: JSON

Event type: Cold spell

Countries affected (identified with ArcGIS Online; provided only for geographical reference):

  • China
  • Japan
  • Russian Federation

Duration: 7 days

Time span: November 15 2017 to November 21 2017

Statistics over entire affected area:

  • Mean temperature anomaly: -6.1 °C
  • Mean temperature: 0.5 °C
  • Minimum temperature anomaly: -14.2 °C
  • Minimum temperature: -25.7 °C

Event center: 47.0°N 132.5°E

Area affected: 1742776 km$^2$


Fig. 1: Map of most extreme temperature anomalies (standardized) experienced during the event. The purple star indicates the center of the extreme event. Green hatching illustrates all areas under the effect of extremes at some time during the event.


Fig. 2: Evolution of temperature at the center of the event. The climatological percentile distribution is illustrated with color shadings.


Fig. 3: Maps illustrating the evolution of standardized temperature anomalies during the event.

Event ID: Cold_spell_2017-Nov-15_to_2017-Nov-21_132.5_47.0

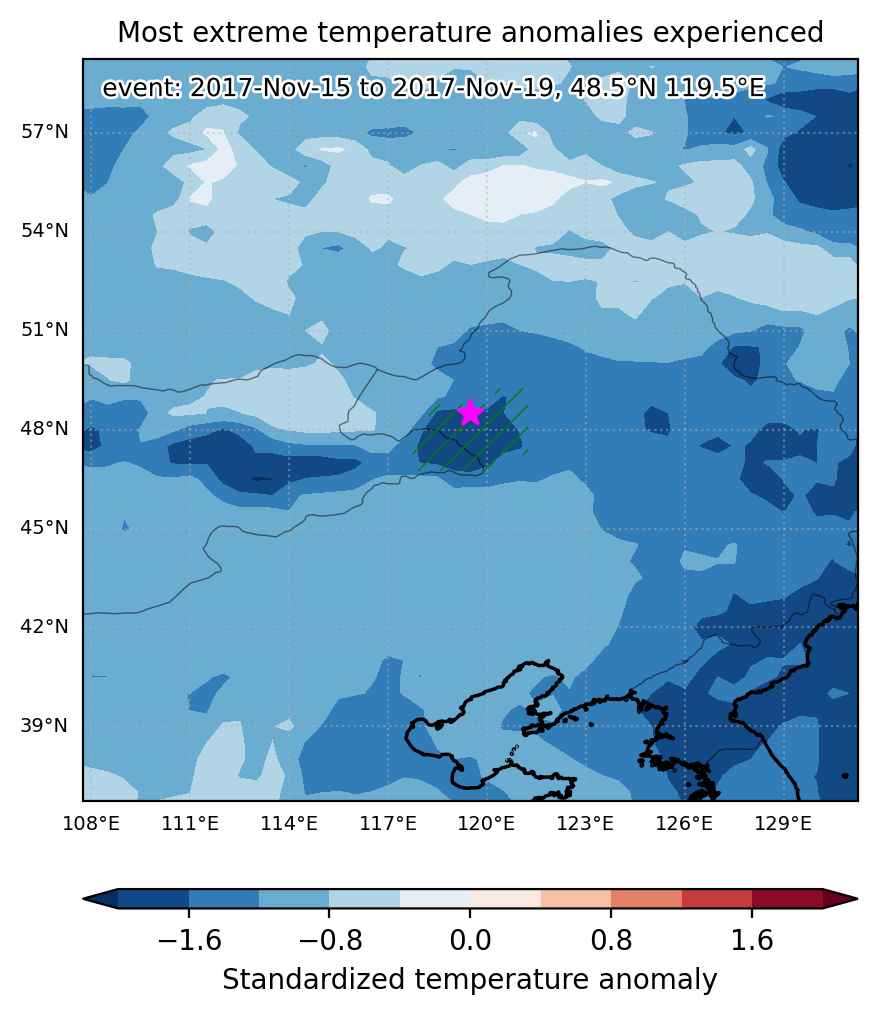
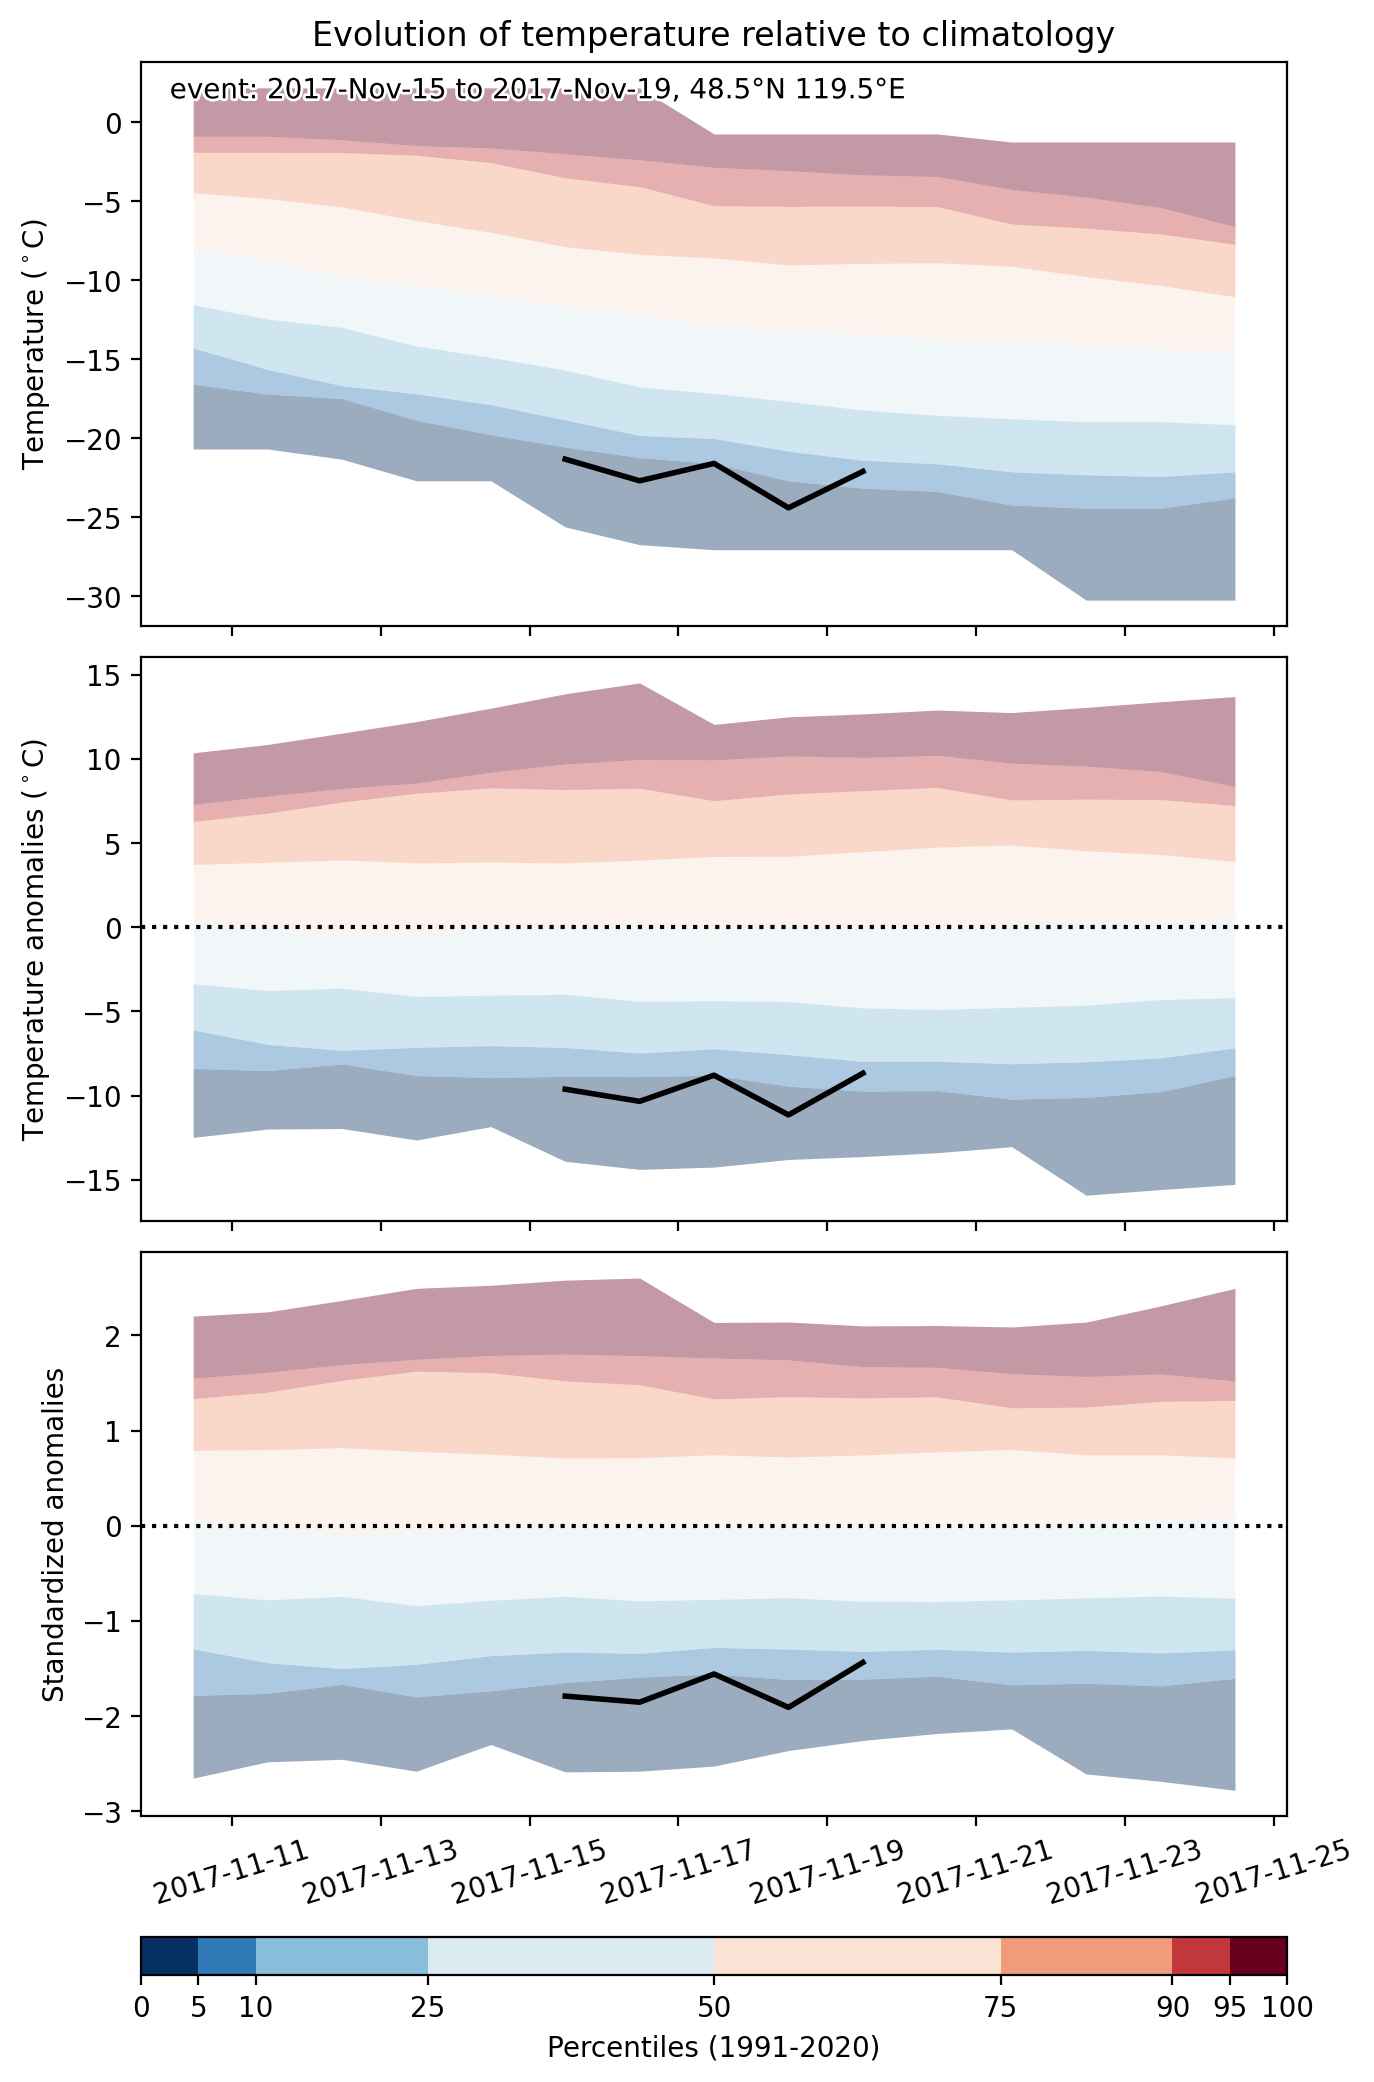
Cold spell occuring from November 15 2017 to November 19 2017 at 48.5°N 119.5°E

Download data: JSON

Event type: Cold spell

Countries affected (identified with ArcGIS Online; provided only for geographical reference):

  • China
  • Mongolia

Duration: 5 days

Time span: November 15 2017 to November 19 2017

Statistics over entire affected area:

  • Mean temperature anomaly: -9.4 °C
  • Mean temperature: -21.9 °C
  • Minimum temperature anomaly: -11.6 °C
  • Minimum temperature: -24.9 °C

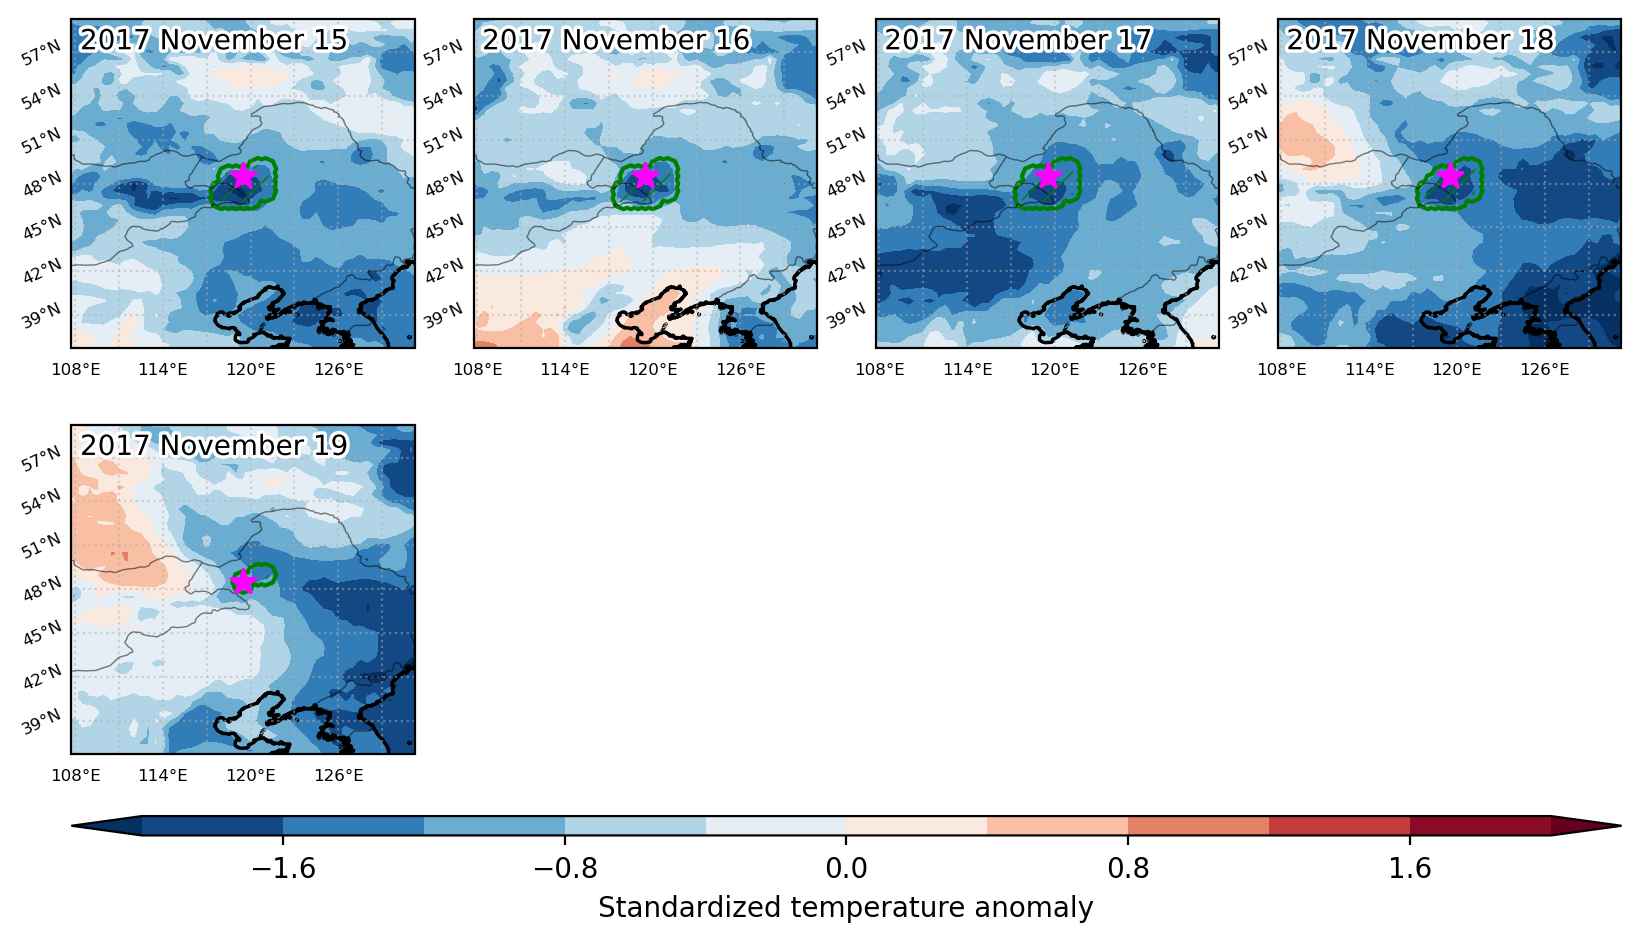
Event center: 48.5°N 119.5°E

Area affected: 53913 km$^2$


Fig. 1: Map of most extreme temperature anomalies (standardized) experienced during the event. The purple star indicates the center of the extreme event. Green hatching illustrates all areas under the effect of extremes at some time during the event.


Fig. 2: Evolution of temperature at the center of the event. The climatological percentile distribution is illustrated with color shadings.


Fig. 3: Maps illustrating the evolution of standardized temperature anomalies during the event.

Event ID: Cold_spell_2017-Nov-15_to_2017-Nov-19_119.5_48.5

Cold spell occuring from November 15 2017 to November 24 2017 at 15.5°N 50.5°E

Download data: JSON

Event type: Cold spell

Countries affected (identified with ArcGIS Online; provided only for geographical reference):

  • Saudi Arabia
  • Yemen

Duration: 10 days

Time span: November 15 2017 to November 24 2017

Statistics over entire affected area:

  • Mean temperature anomaly: -2.2 °C
  • Mean temperature: 20.6 °C
  • Minimum temperature anomaly: -3.5 °C
  • Minimum temperature: 16.9 °C

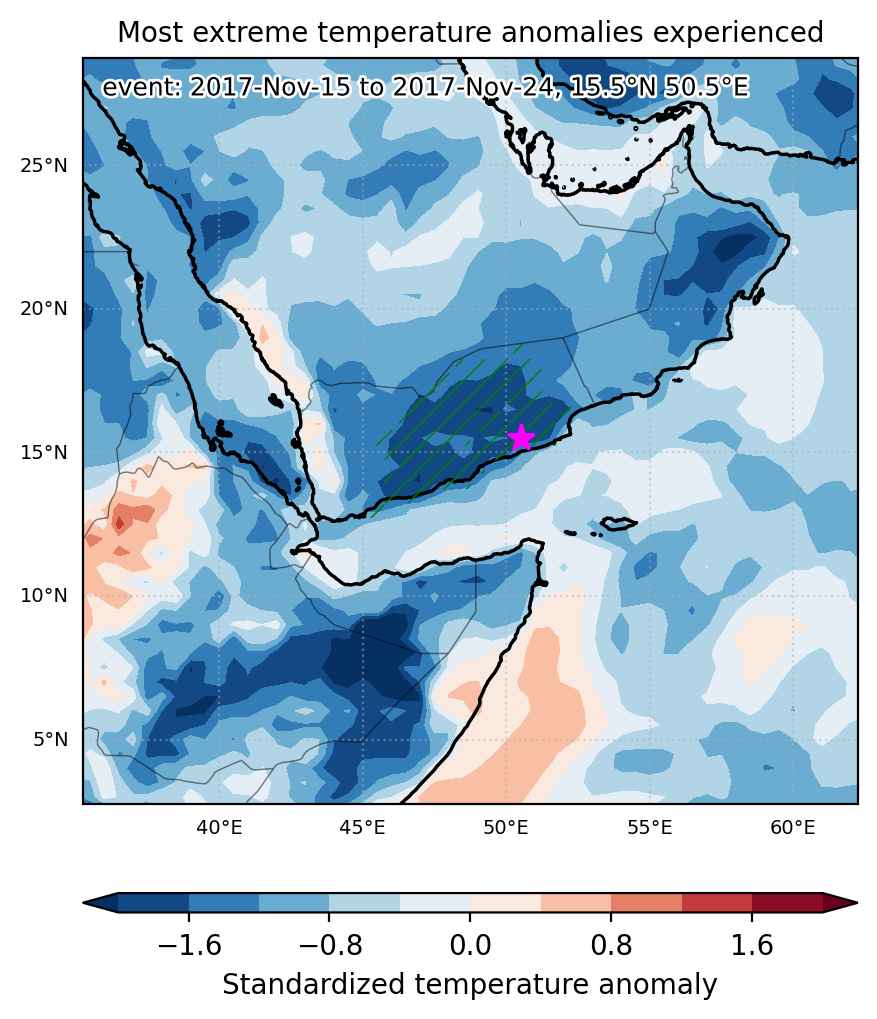
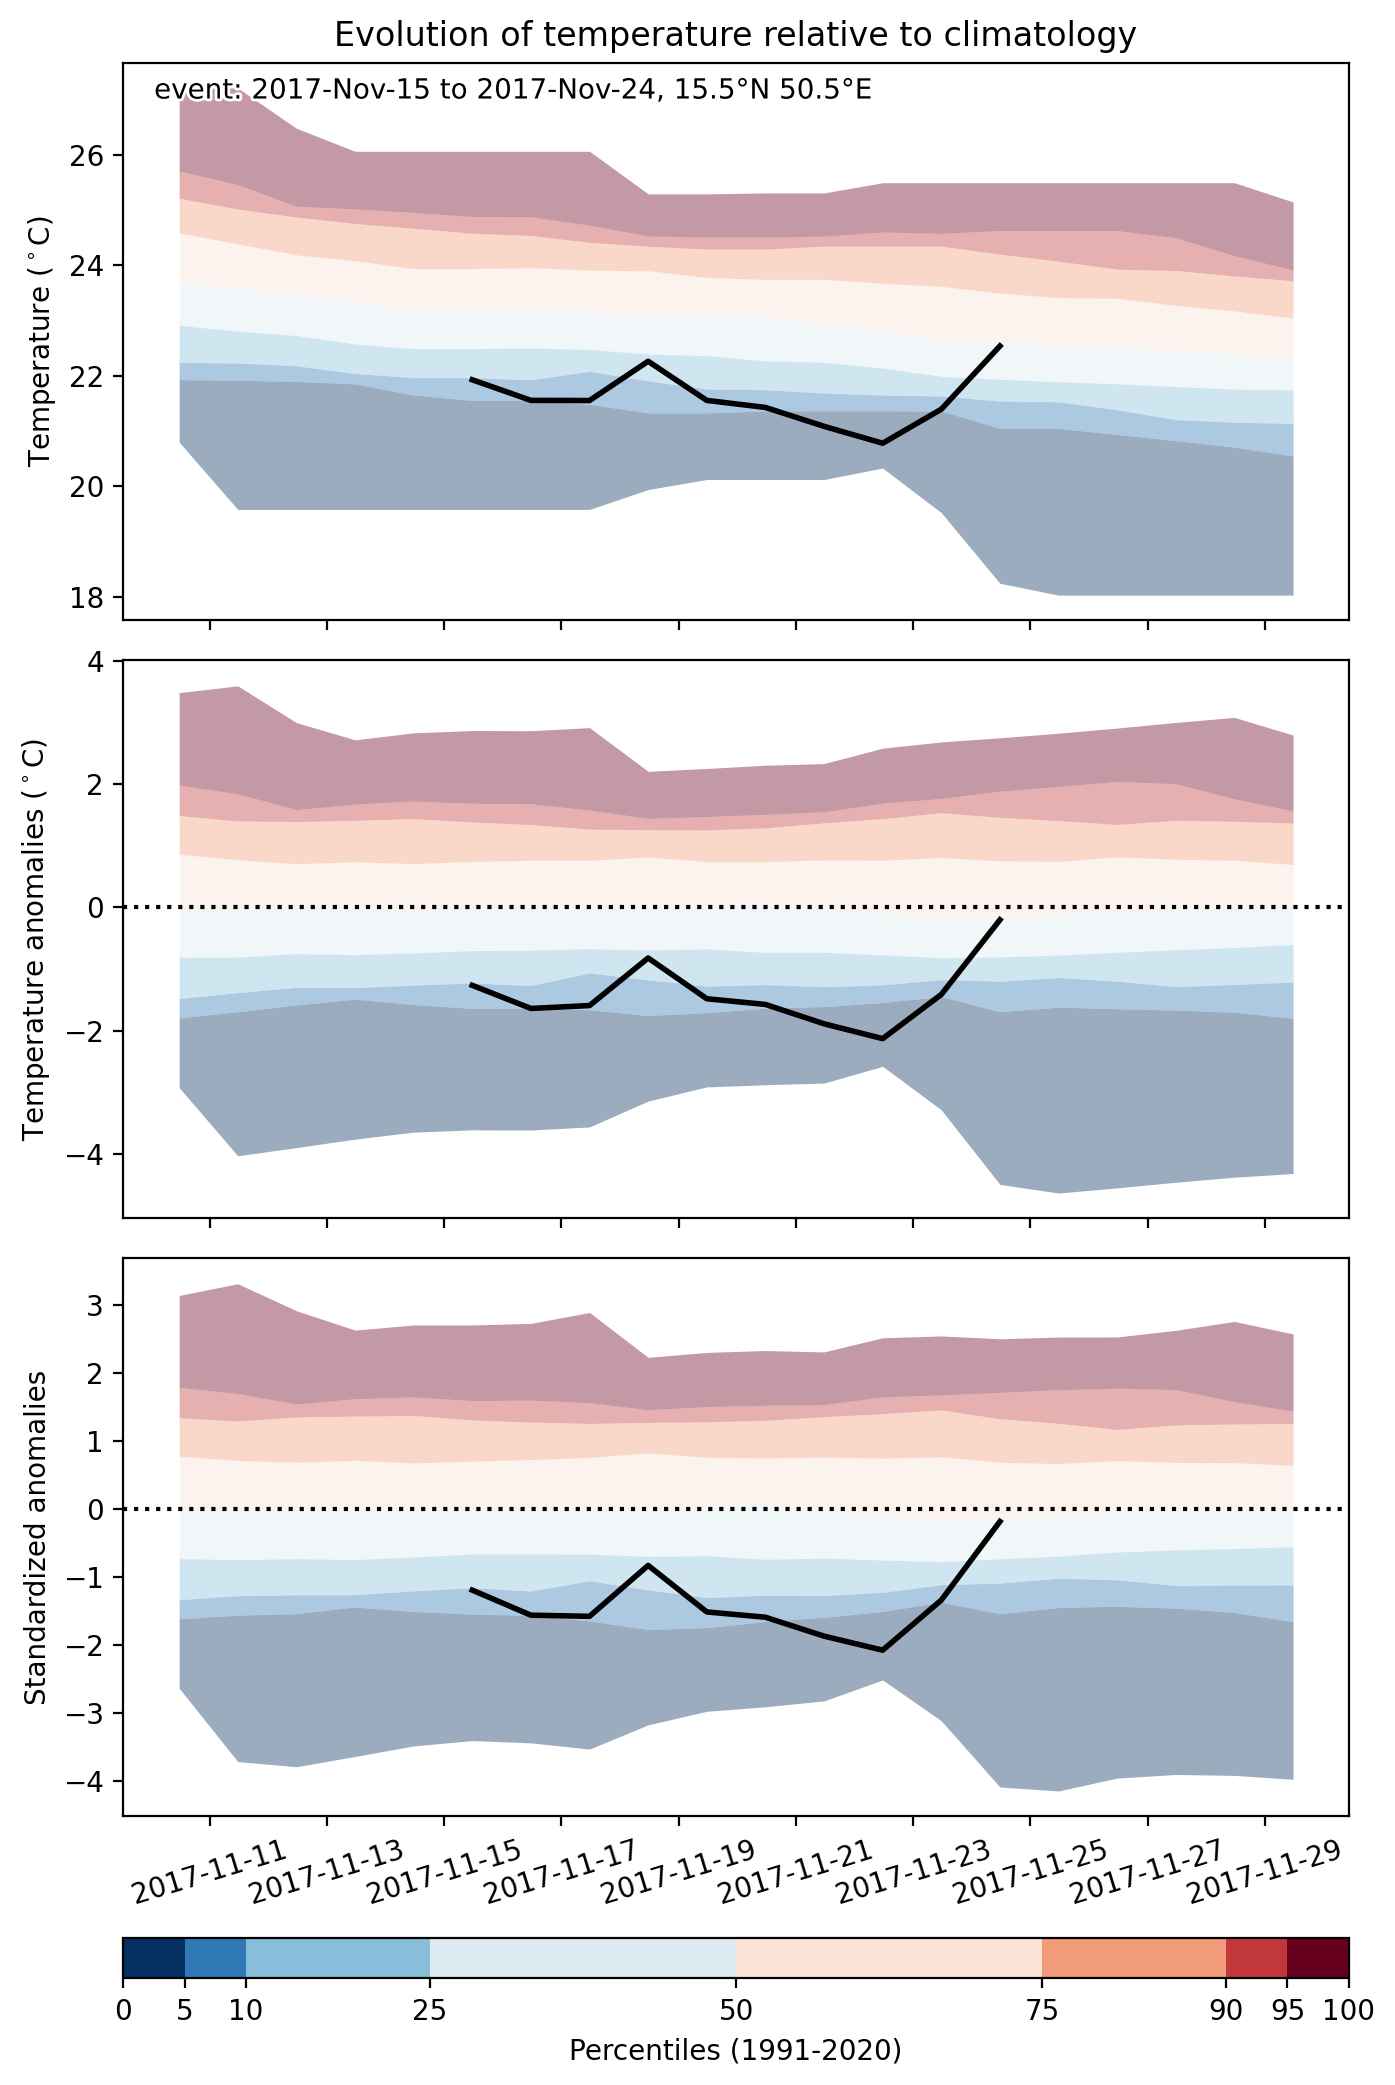
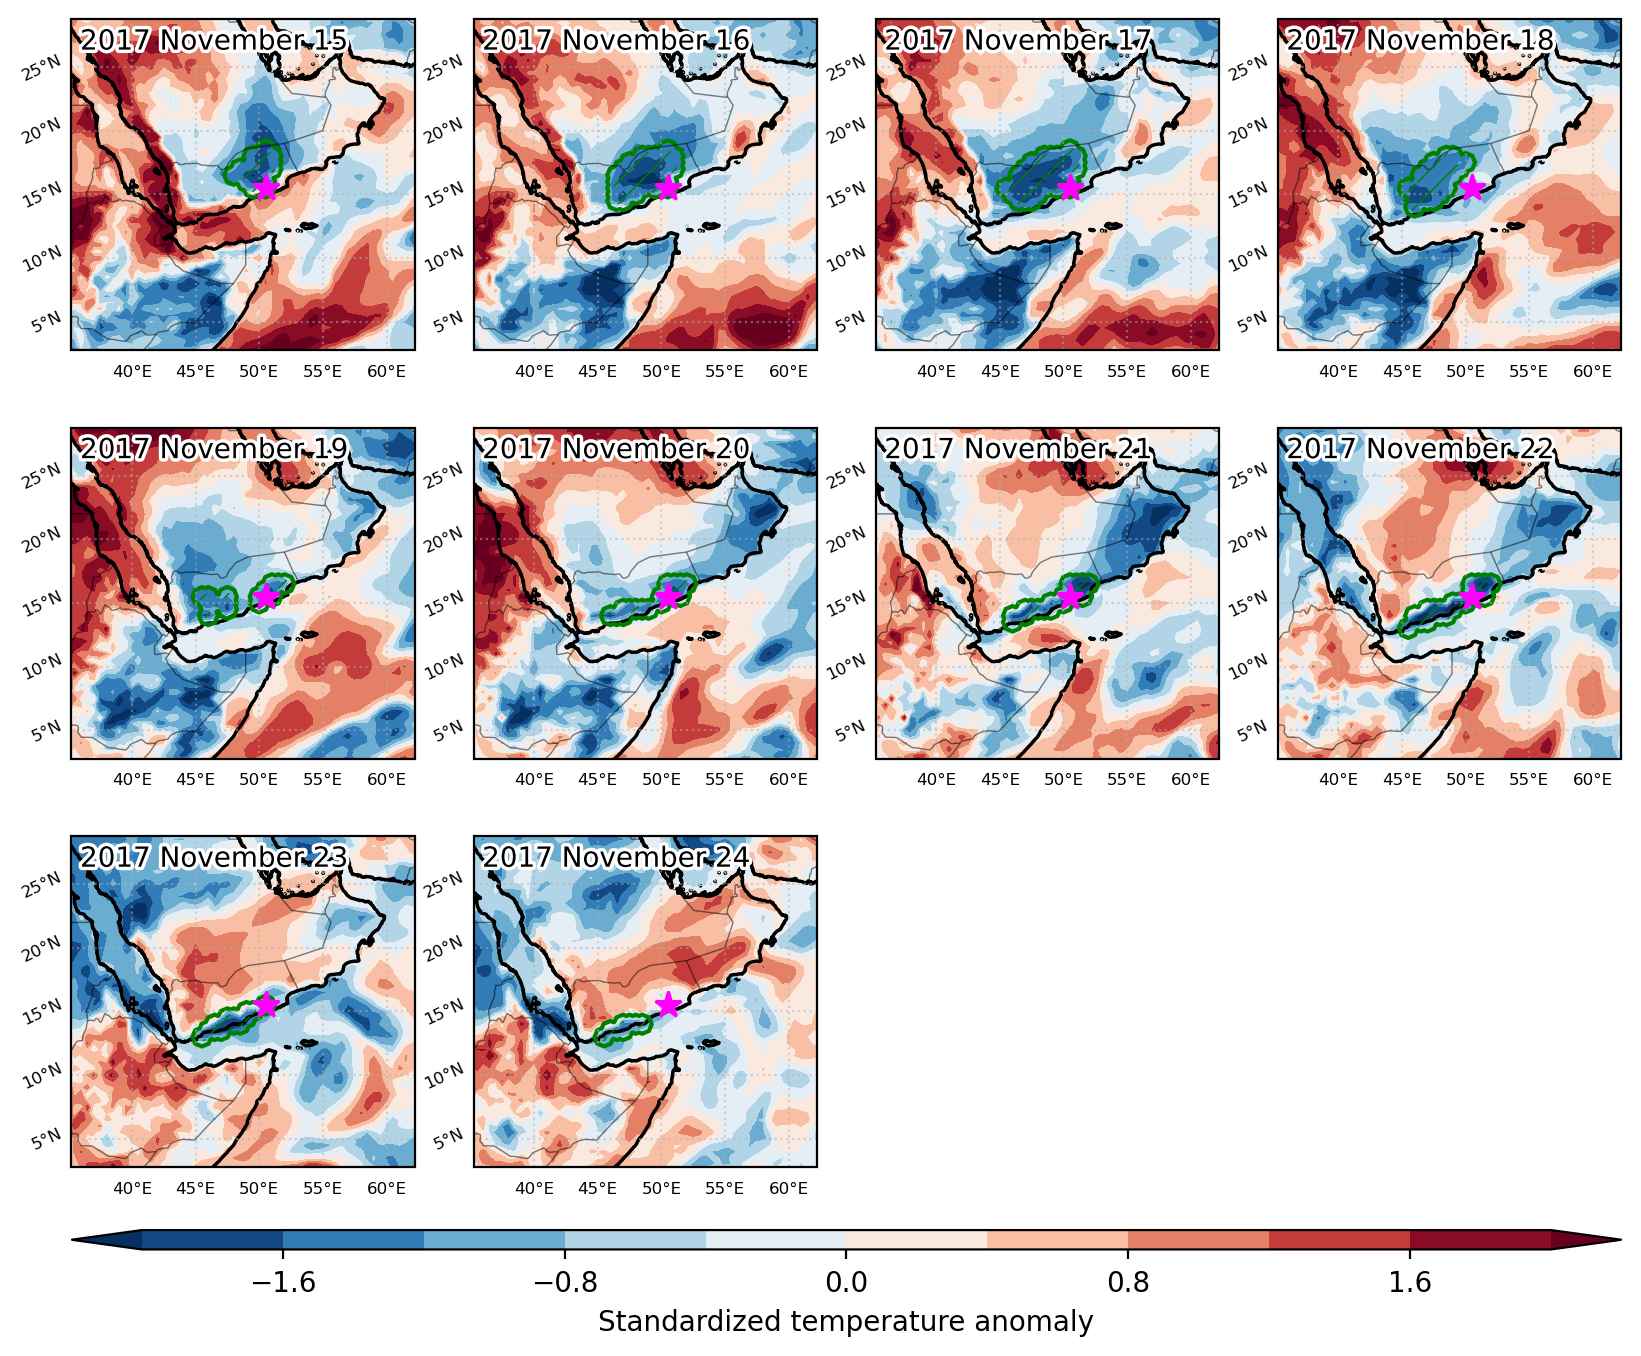
Event center: 15.5°N 50.5°E

Area affected: 243654 km$^2$


Fig. 1: Map of most extreme temperature anomalies (standardized) experienced during the event. The purple star indicates the center of the extreme event. Green hatching illustrates all areas under the effect of extremes at some time during the event.


Fig. 2: Evolution of temperature at the center of the event. The climatological percentile distribution is illustrated with color shadings.


Fig. 3: Maps illustrating the evolution of standardized temperature anomalies during the event.

Event ID: Cold_spell_2017-Nov-15_to_2017-Nov-24_50.5_15.5

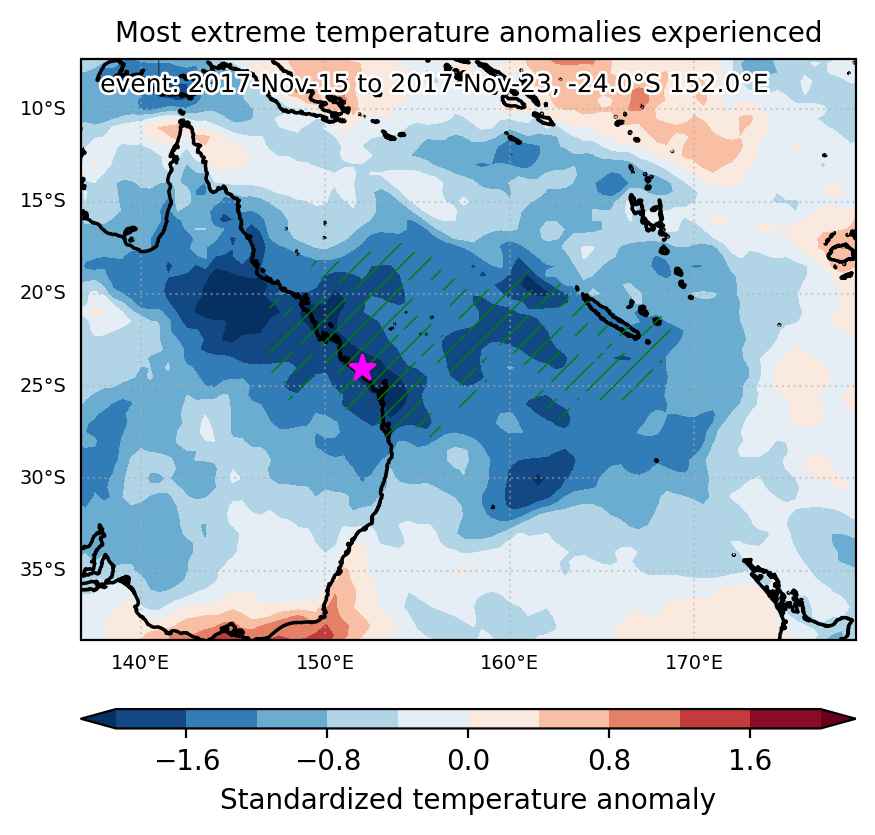
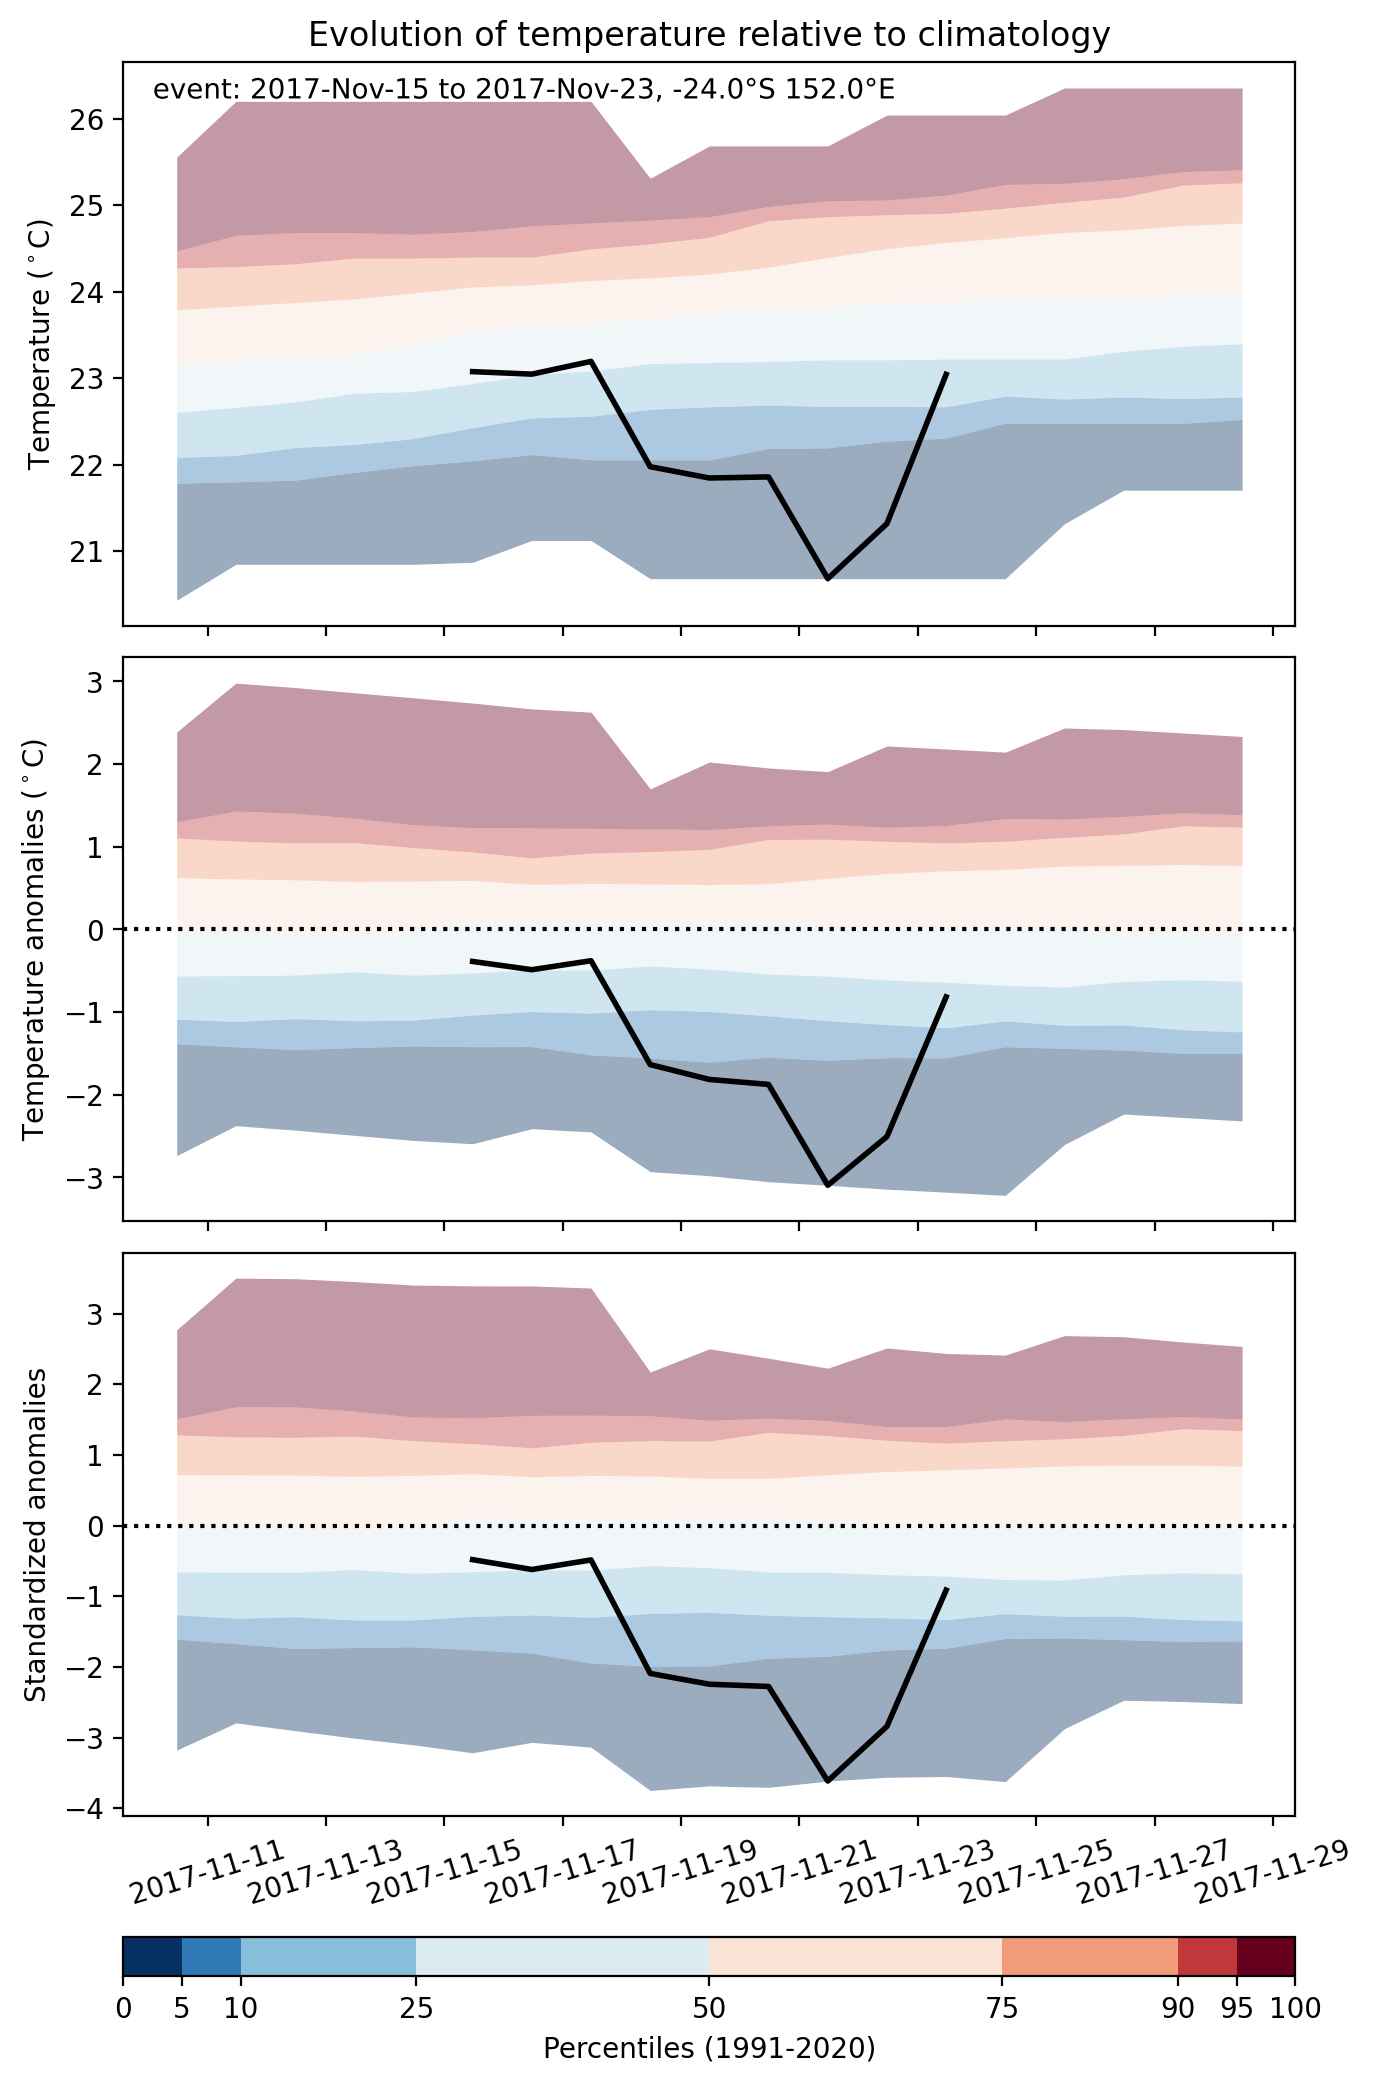
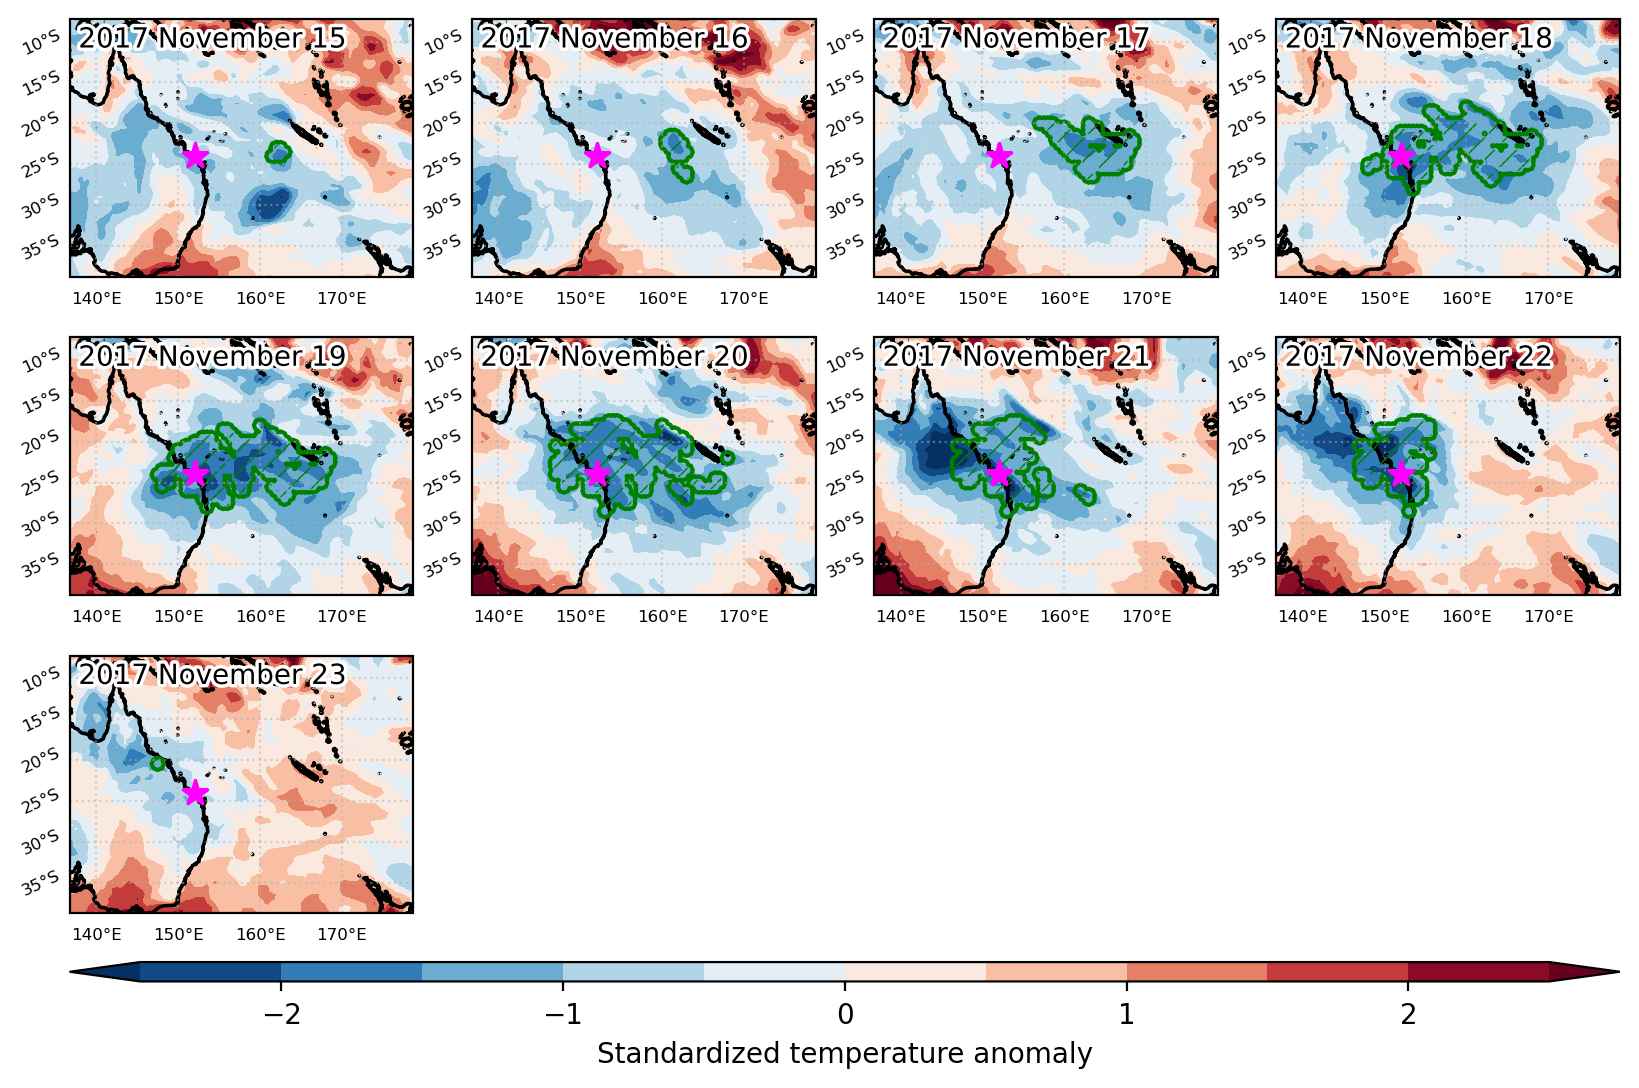
Cold spell occuring from November 15 2017 to November 23 2017 at -24.0°S 152.0°E

Download data: JSON

Event type: Cold spell

Countries affected (identified with ArcGIS Online; provided only for geographical reference):

  • Australia
  • New Caledonia

Duration: 9 days

Time span: November 15 2017 to November 23 2017

Statistics over entire affected area:

  • Mean temperature anomaly: -1.7 °C
  • Mean temperature: 22.2 °C
  • Minimum temperature anomaly: -6.6 °C
  • Minimum temperature: 16.4 °C

Event center: -24.0°S 152.0°E

Area affected: 1209456 km$^2$


Fig. 1: Map of most extreme temperature anomalies (standardized) experienced during the event. The purple star indicates the center of the extreme event. Green hatching illustrates all areas under the effect of extremes at some time during the event.


Fig. 2: Evolution of temperature at the center of the event. The climatological percentile distribution is illustrated with color shadings.


Fig. 3: Maps illustrating the evolution of standardized temperature anomalies during the event.

Event ID: Cold_spell_2017-Nov-15_to_2017-Nov-23_152.0_-24.0

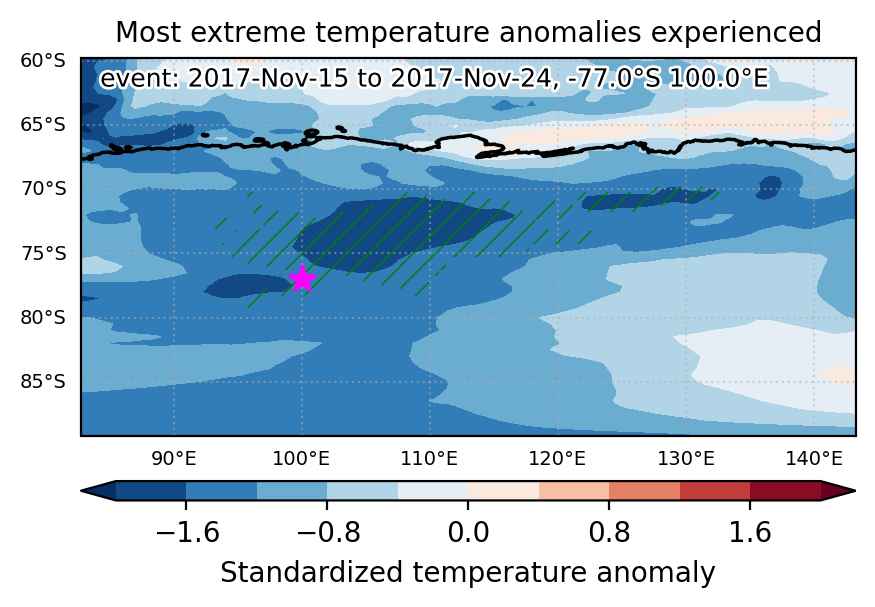
Cold spell occuring from November 15 2017 to November 24 2017 at -77.0°S 100.0°E

Download data: JSON

Event type: Cold spell

Countries affected (identified with ArcGIS Online; provided only for geographical reference):

  • Antarctica

Duration: 10 days

Time span: November 15 2017 to November 24 2017

Statistics over entire affected area:

  • Mean temperature anomaly: -5.3 °C
  • Mean temperature: -41.5 °C
  • Minimum temperature anomaly: -7.7 °C
  • Minimum temperature: -45.9 °C

Event center: -77.0°S 100.0°E

Area affected: 531399 km$^2$


Fig. 1: Map of most extreme temperature anomalies (standardized) experienced during the event. The purple star indicates the center of the extreme event. Green hatching illustrates all areas under the effect of extremes at some time during the event.


Fig. 2: Evolution of temperature at the center of the event. The climatological percentile distribution is illustrated with color shadings.


Fig. 3: Maps illustrating the evolution of standardized temperature anomalies during the event.

Event ID: Cold_spell_2017-Nov-15_to_2017-Nov-24_100.0_-77.0

Cold spell occuring from November 15 2017 to November 22 2017 at -87.5°S 331.5°E

Download data: JSON

Event type: Cold spell

Countries affected (identified with ArcGIS Online; provided only for geographical reference):

  • Antarctica

Duration: 8 days

Time span: November 15 2017 to November 22 2017

Statistics over entire affected area:

  • Mean temperature anomaly: -5.1 °C
  • Mean temperature: -36.6 °C
  • Minimum temperature anomaly: -8.2 °C
  • Minimum temperature: -42.9 °C

Event center: -87.5°S 331.5°E

Area affected: 495675 km$^2$


Fig. 1: Map of most extreme temperature anomalies (standardized) experienced during the event. The purple star indicates the center of the extreme event. Green hatching illustrates all areas under the effect of extremes at some time during the event.


Fig. 2: Evolution of temperature at the center of the event. The climatological percentile distribution is illustrated with color shadings.


Fig. 3: Maps illustrating the evolution of standardized temperature anomalies during the event.

Event ID: Cold_spell_2017-Nov-15_to_2017-Nov-22_331.5_-87.5

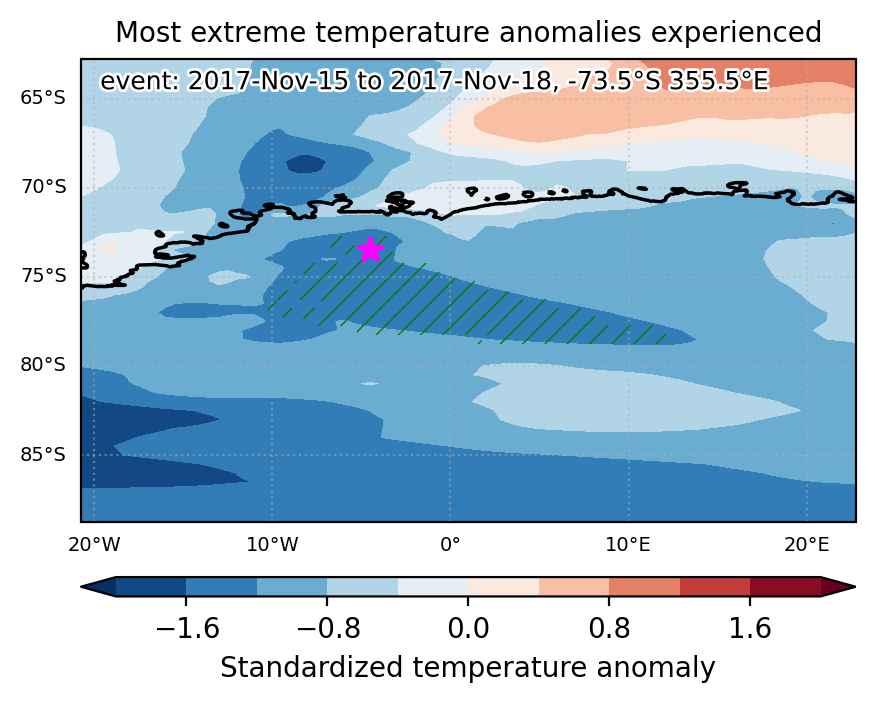
Cold spell occuring from November 15 2017 to November 18 2017 at -73.5°S 355.5°E

Download data: JSON

Event type: Cold spell

Countries affected (identified with ArcGIS Online; provided only for geographical reference):

  • Antarctica

Duration: 4 days

Time span: November 15 2017 to November 18 2017

Statistics over entire affected area:

  • Mean temperature anomaly: -5.7 °C
  • Mean temperature: -35.7 °C
  • Minimum temperature anomaly: -7.1 °C
  • Minimum temperature: -40.9 °C

Event center: -73.5°S 4.5°W

Area affected: 180003 km$^2$


Fig. 1: Map of most extreme temperature anomalies (standardized) experienced during the event. The purple star indicates the center of the extreme event. Green hatching illustrates all areas under the effect of extremes at some time during the event.


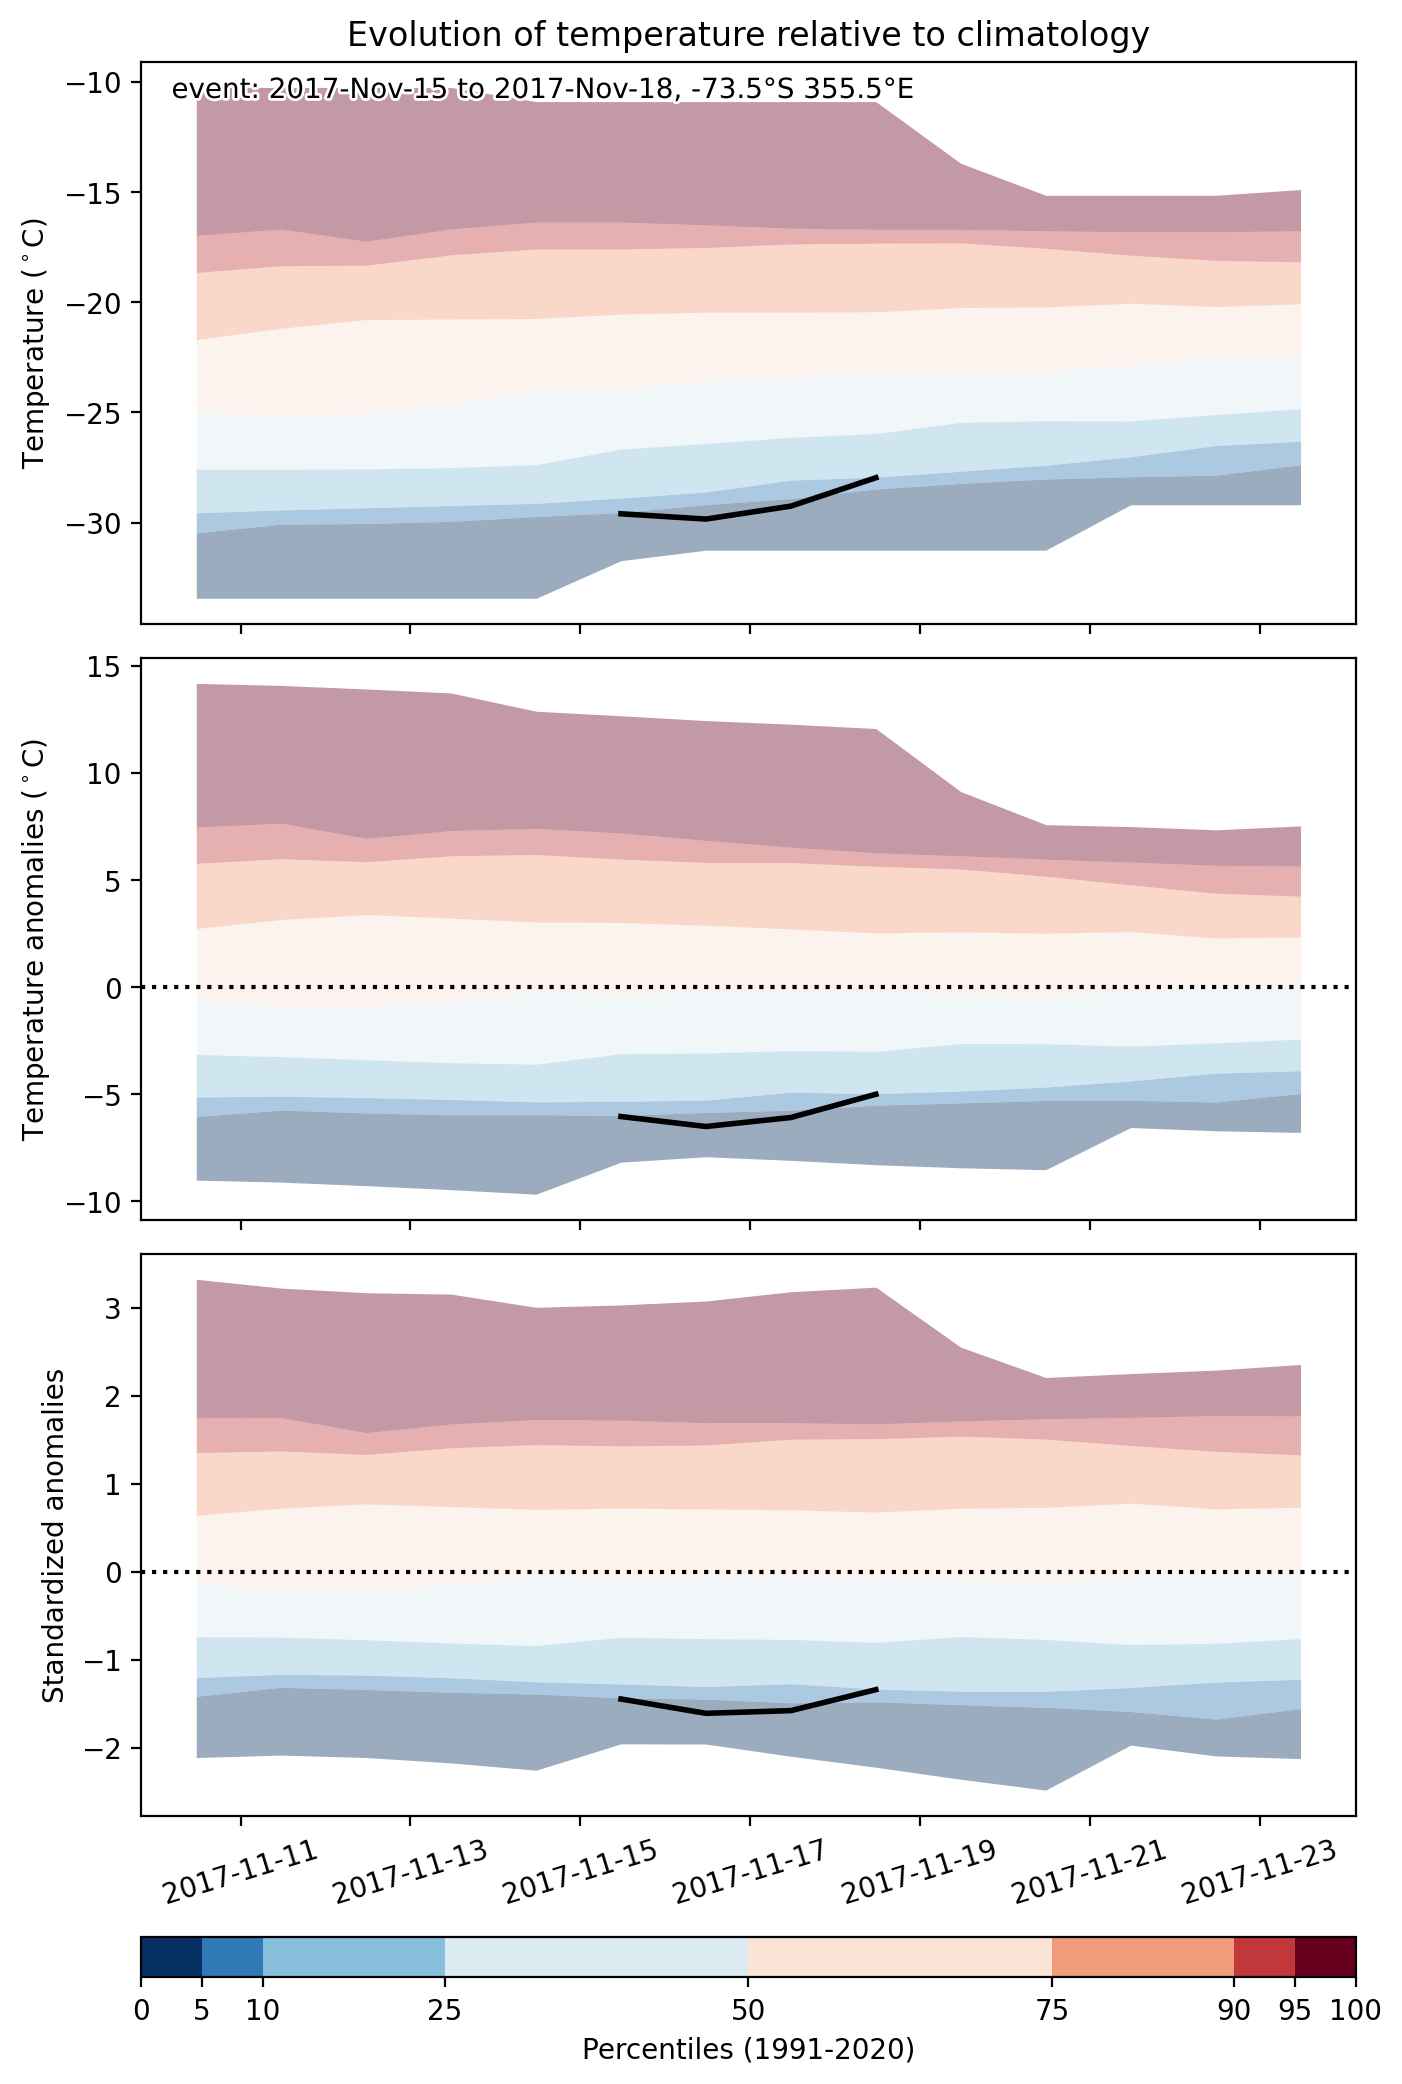
Fig. 2: Evolution of temperature at the center of the event. The climatological percentile distribution is illustrated with color shadings.


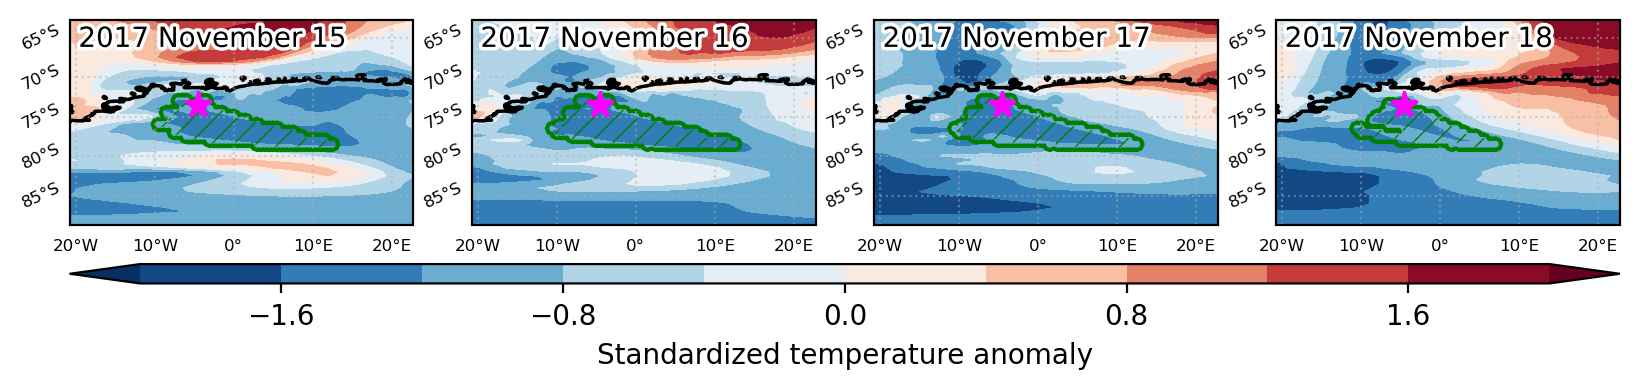
Fig. 3: Maps illustrating the evolution of standardized temperature anomalies during the event.

Event ID: Cold_spell_2017-Nov-15_to_2017-Nov-18_355.5_-73.5

Heat wave occuring from November 14 2017 to December 11 2017 at 38.0°N 338.0°E

Download data: JSON

Event type: Heat wave

Countries affected (identified with ArcGIS Online; provided only for geographical reference):

  • Algeria
  • Azores
  • Cabo Verde
  • Canarias
  • Madeira
  • Mali
  • Mauritania
  • Morocco
  • Portugal
  • Senegal
  • Spain

Duration: 28 days

Time span: November 14 2017 to December 11 2017

Statistics over entire affected area:

  • Mean temperature anomaly: 2.2 °C
  • Mean temperature: 21.0 °C
  • Maximum temperature anomaly: 7.7 °C
  • Maximum temperature: 32.2 °C

Event center: 38.0°N 338.0°E

Area affected: 12134718 km$^2$


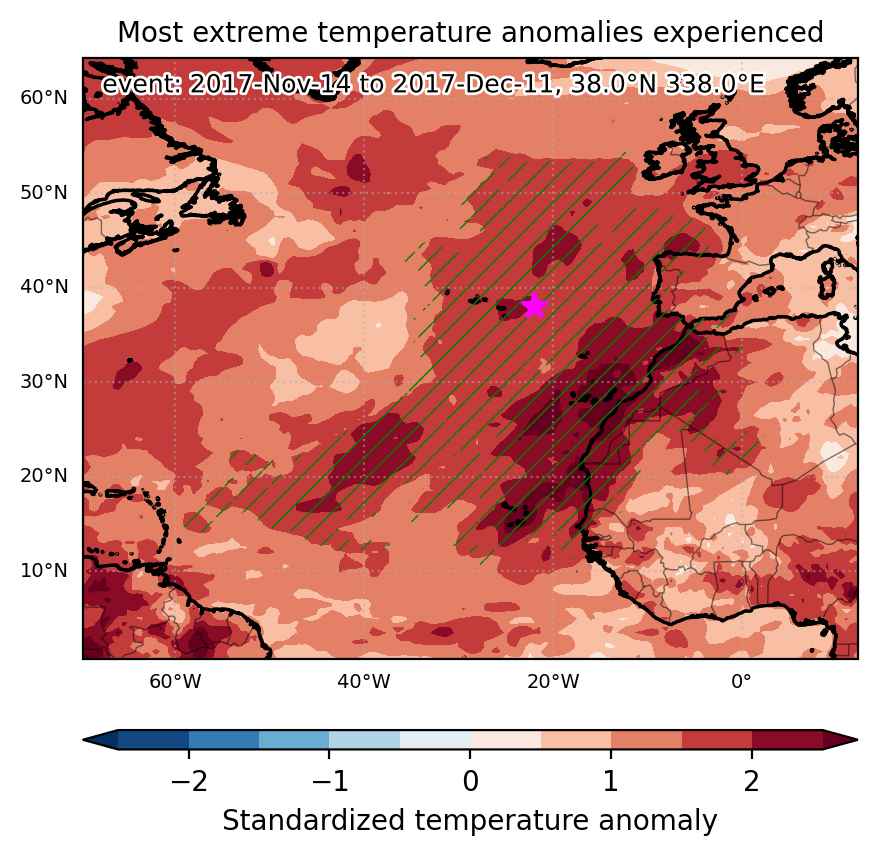
Fig. 1: Map of most extreme temperature anomalies (standardized) experienced during the event. The purple star indicates the center of the extreme event. Green hatching illustrates all areas under the effect of extremes at some time during the event.


Fig. 2: Evolution of temperature at the center of the event. The climatological percentile distribution is illustrated with color shadings.


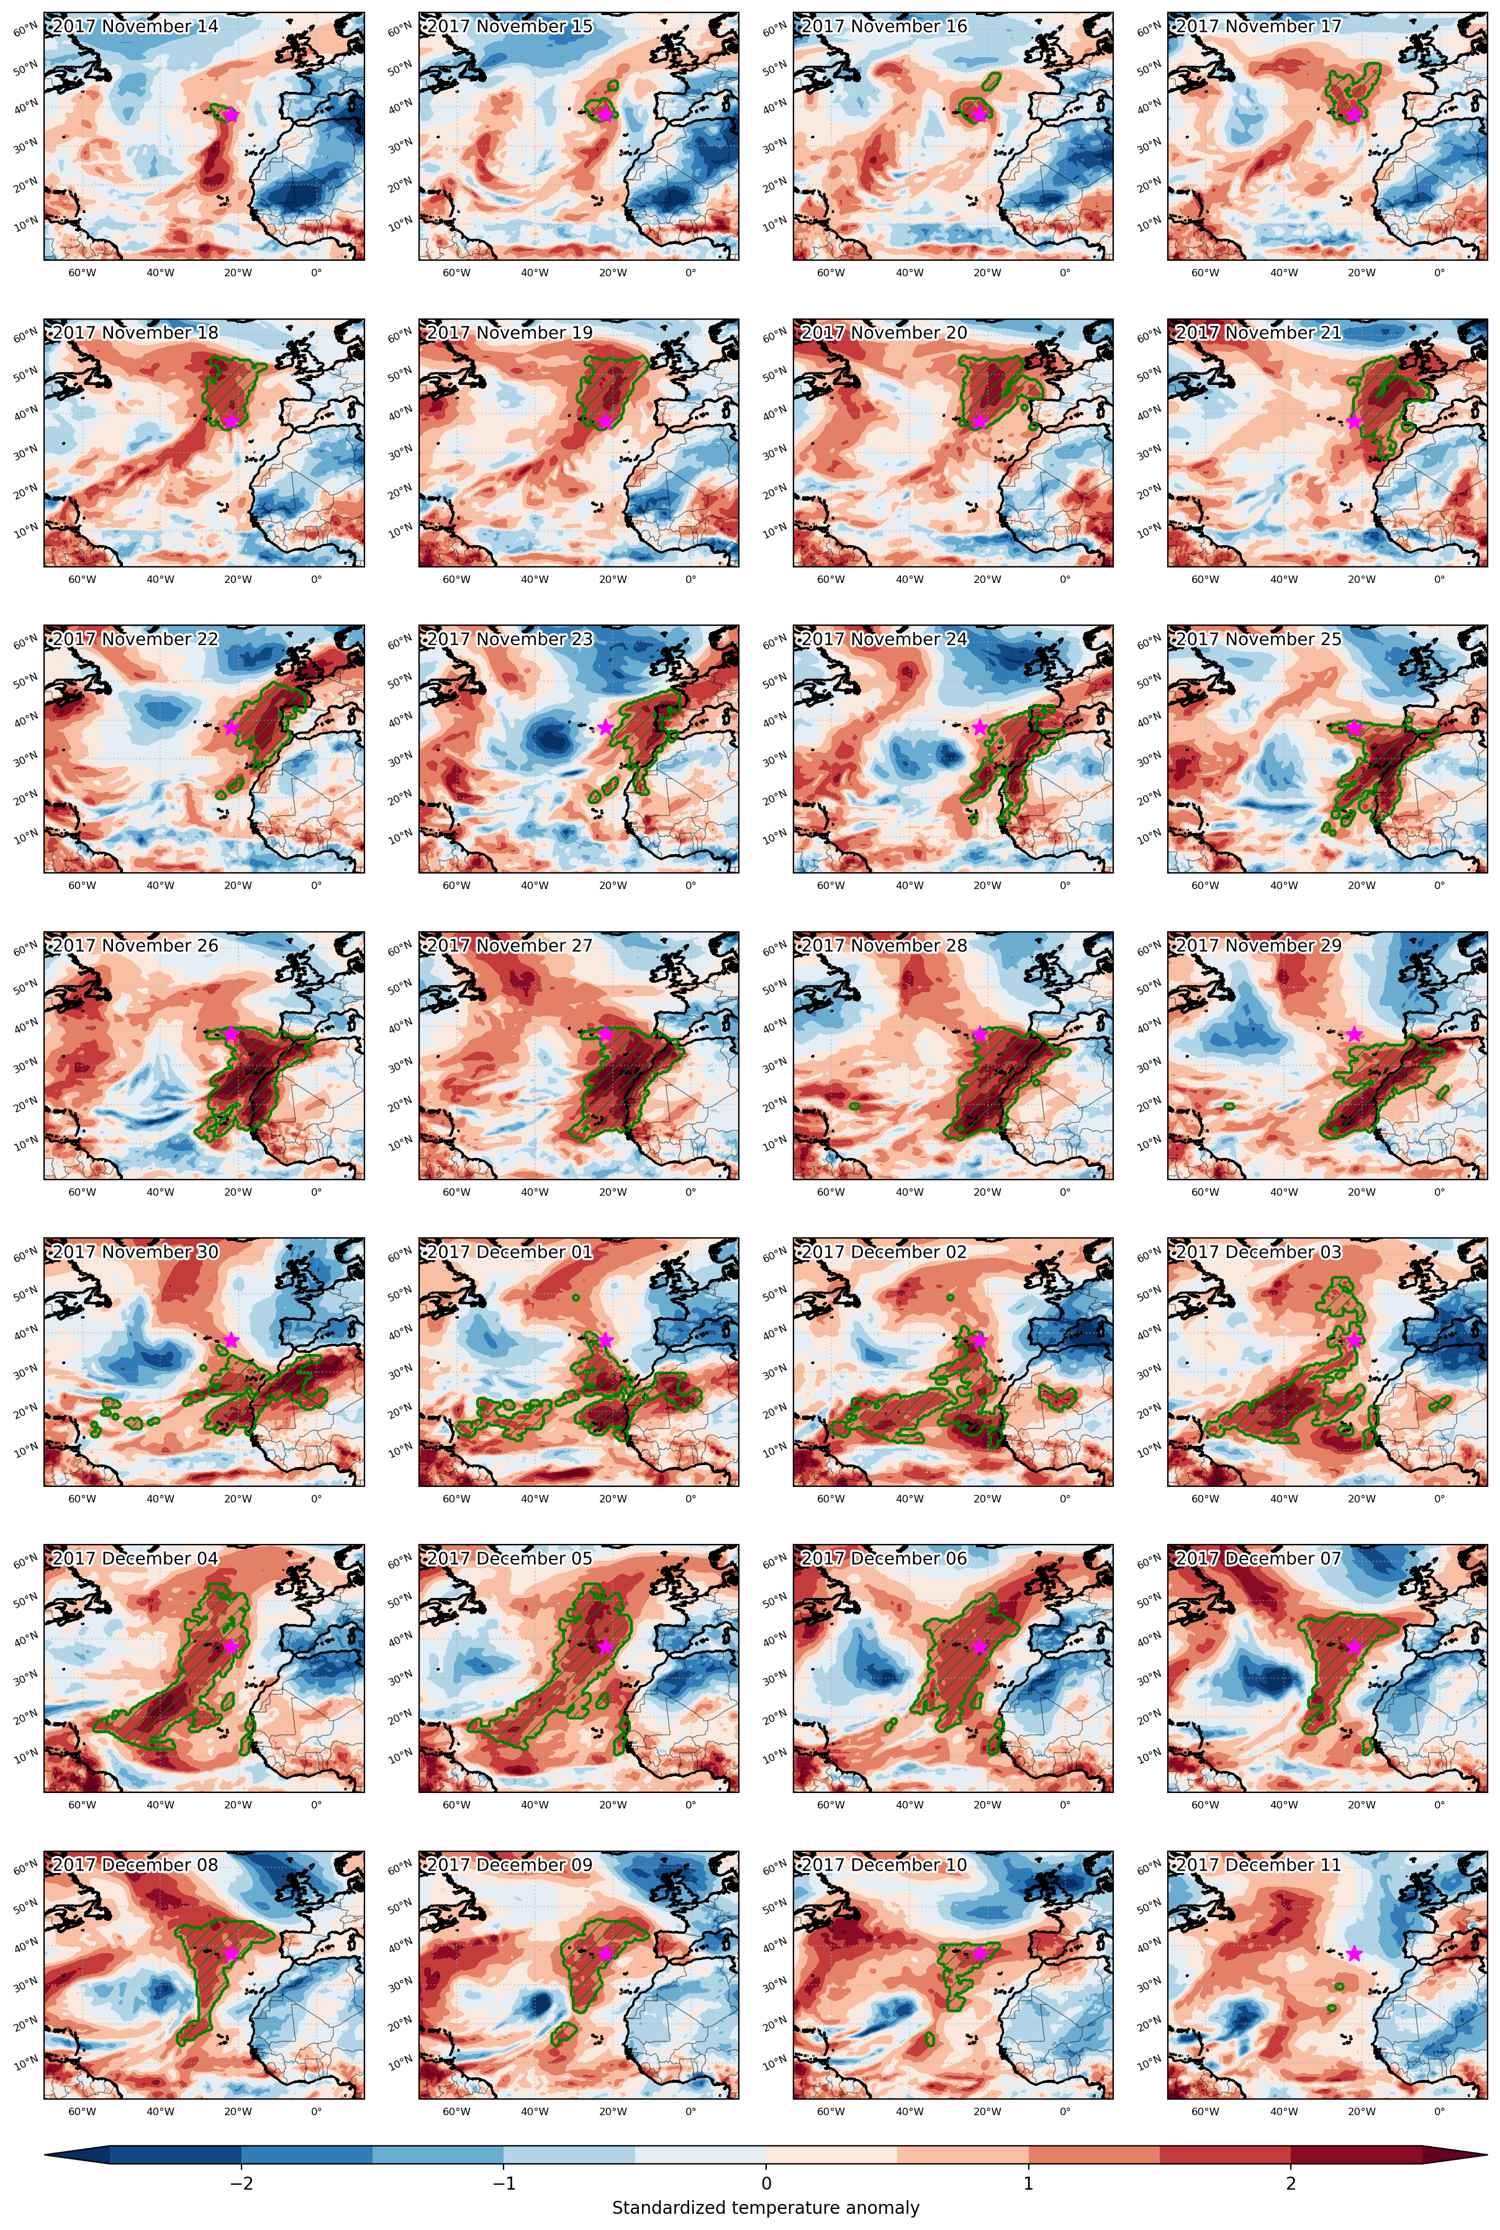
Fig. 3: Maps illustrating the evolution of standardized temperature anomalies during the event.

Event ID: Heat_wave_2017-Nov-14_to_2017-Dec-11_338.0_38.0

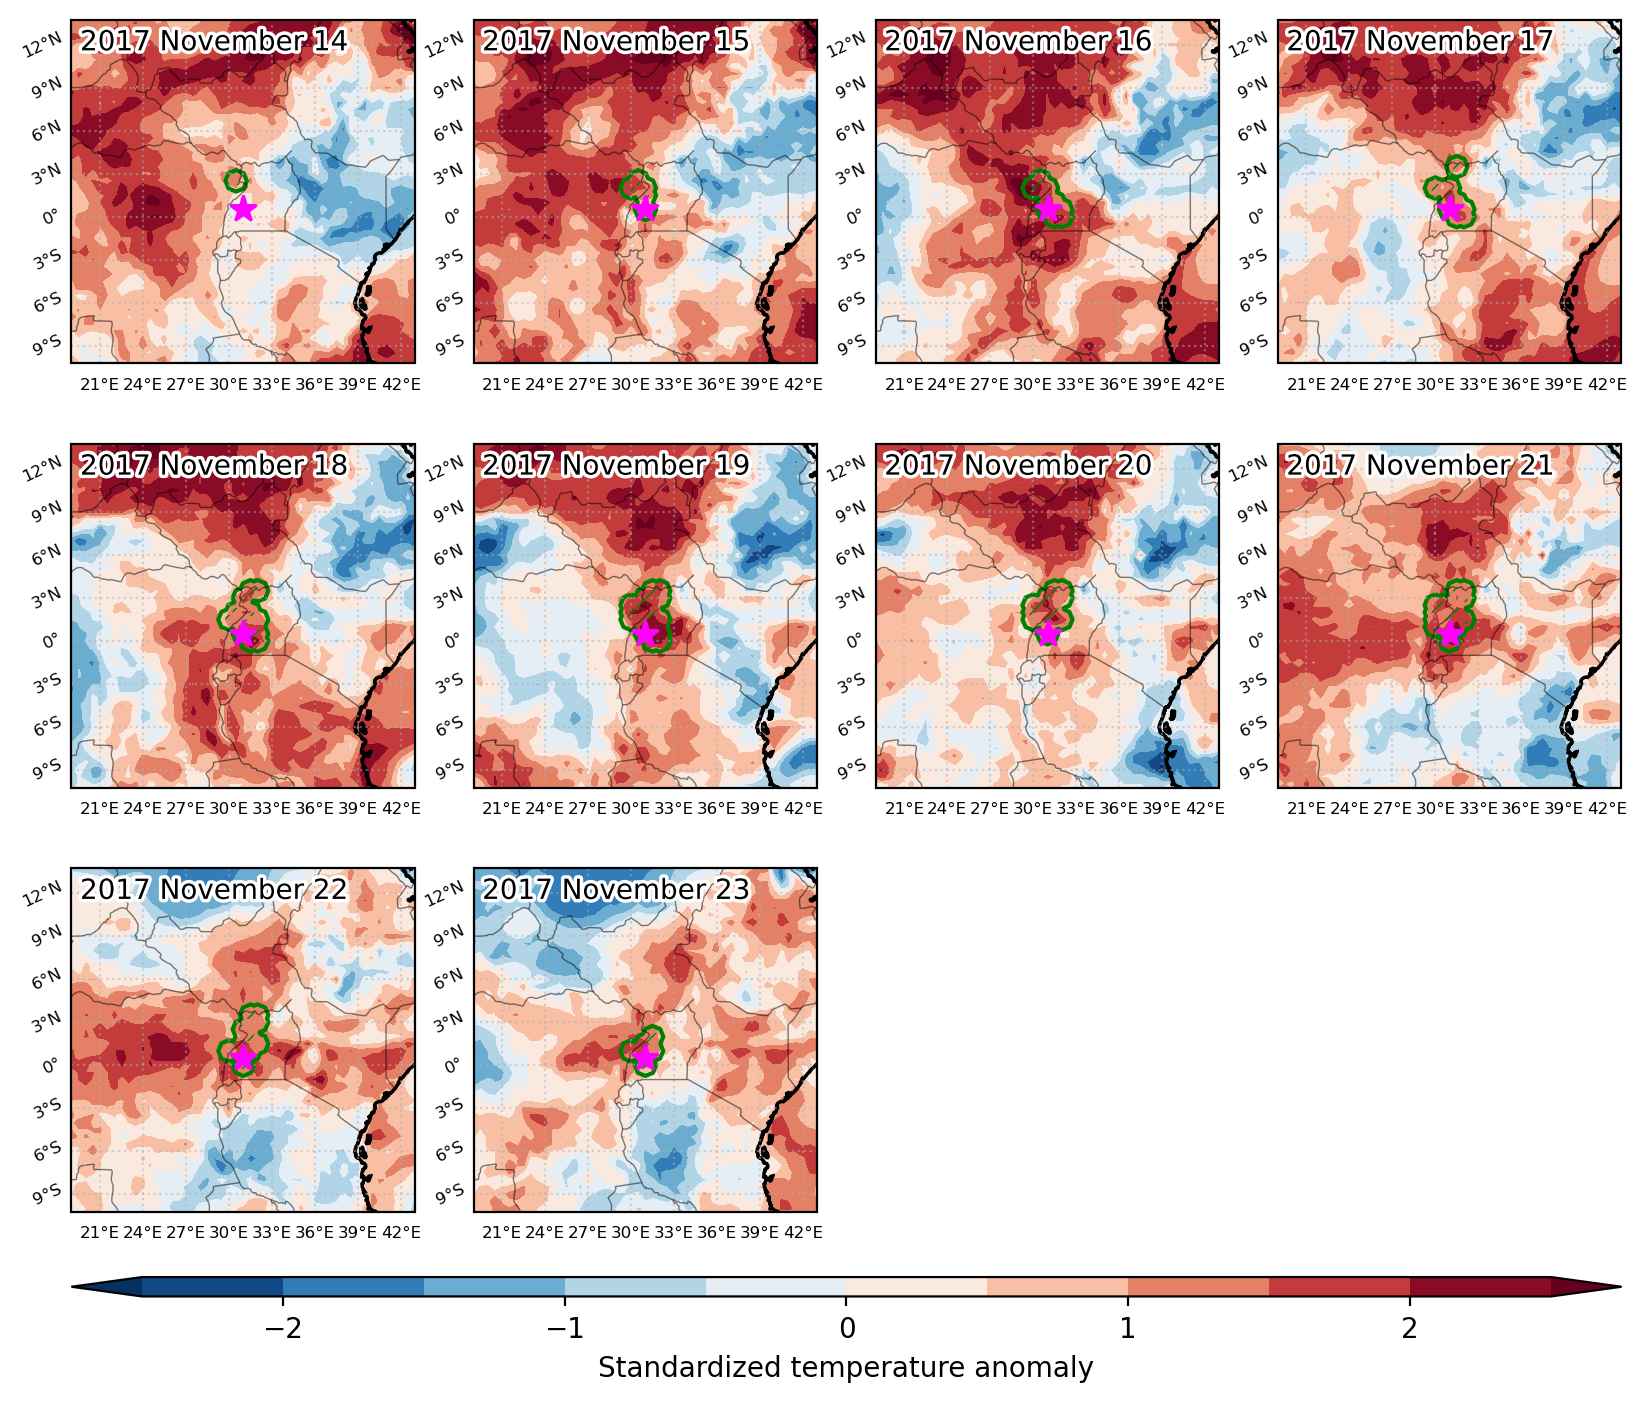
Heat wave occuring from November 14 2017 to November 23 2017 at 0.5°N 31.0°E

Download data: JSON

Event type: Heat wave

Countries affected (identified with ArcGIS Online; provided only for geographical reference):

  • Congo DRC
  • Uganda

Duration: 10 days

Time span: November 14 2017 to November 23 2017

Statistics over entire affected area:

  • Mean temperature anomaly: 1.6 °C
  • Mean temperature: 23.9 °C
  • Maximum temperature anomaly: 2.6 °C
  • Maximum temperature: 28.0 °C

Event center: 0.5°N 31.0°E

Area affected: 74143 km$^2$


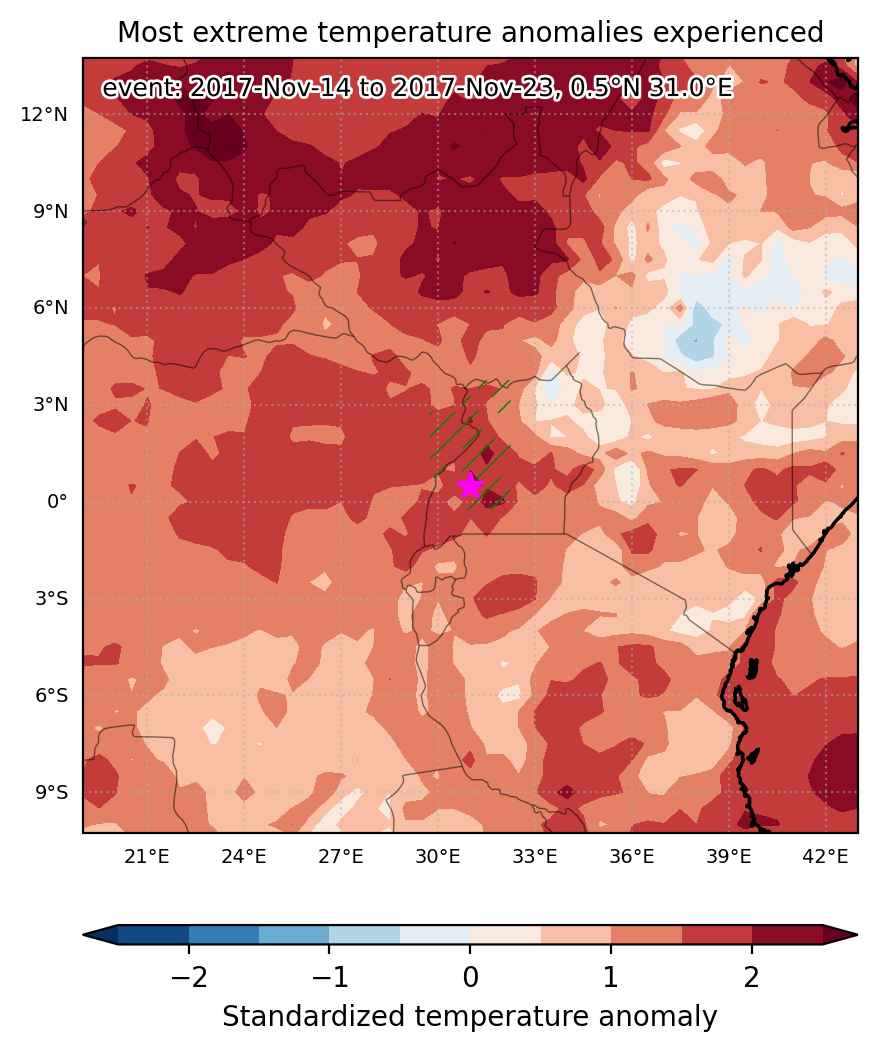
Fig. 1: Map of most extreme temperature anomalies (standardized) experienced during the event. The purple star indicates the center of the extreme event. Green hatching illustrates all areas under the effect of extremes at some time during the event.


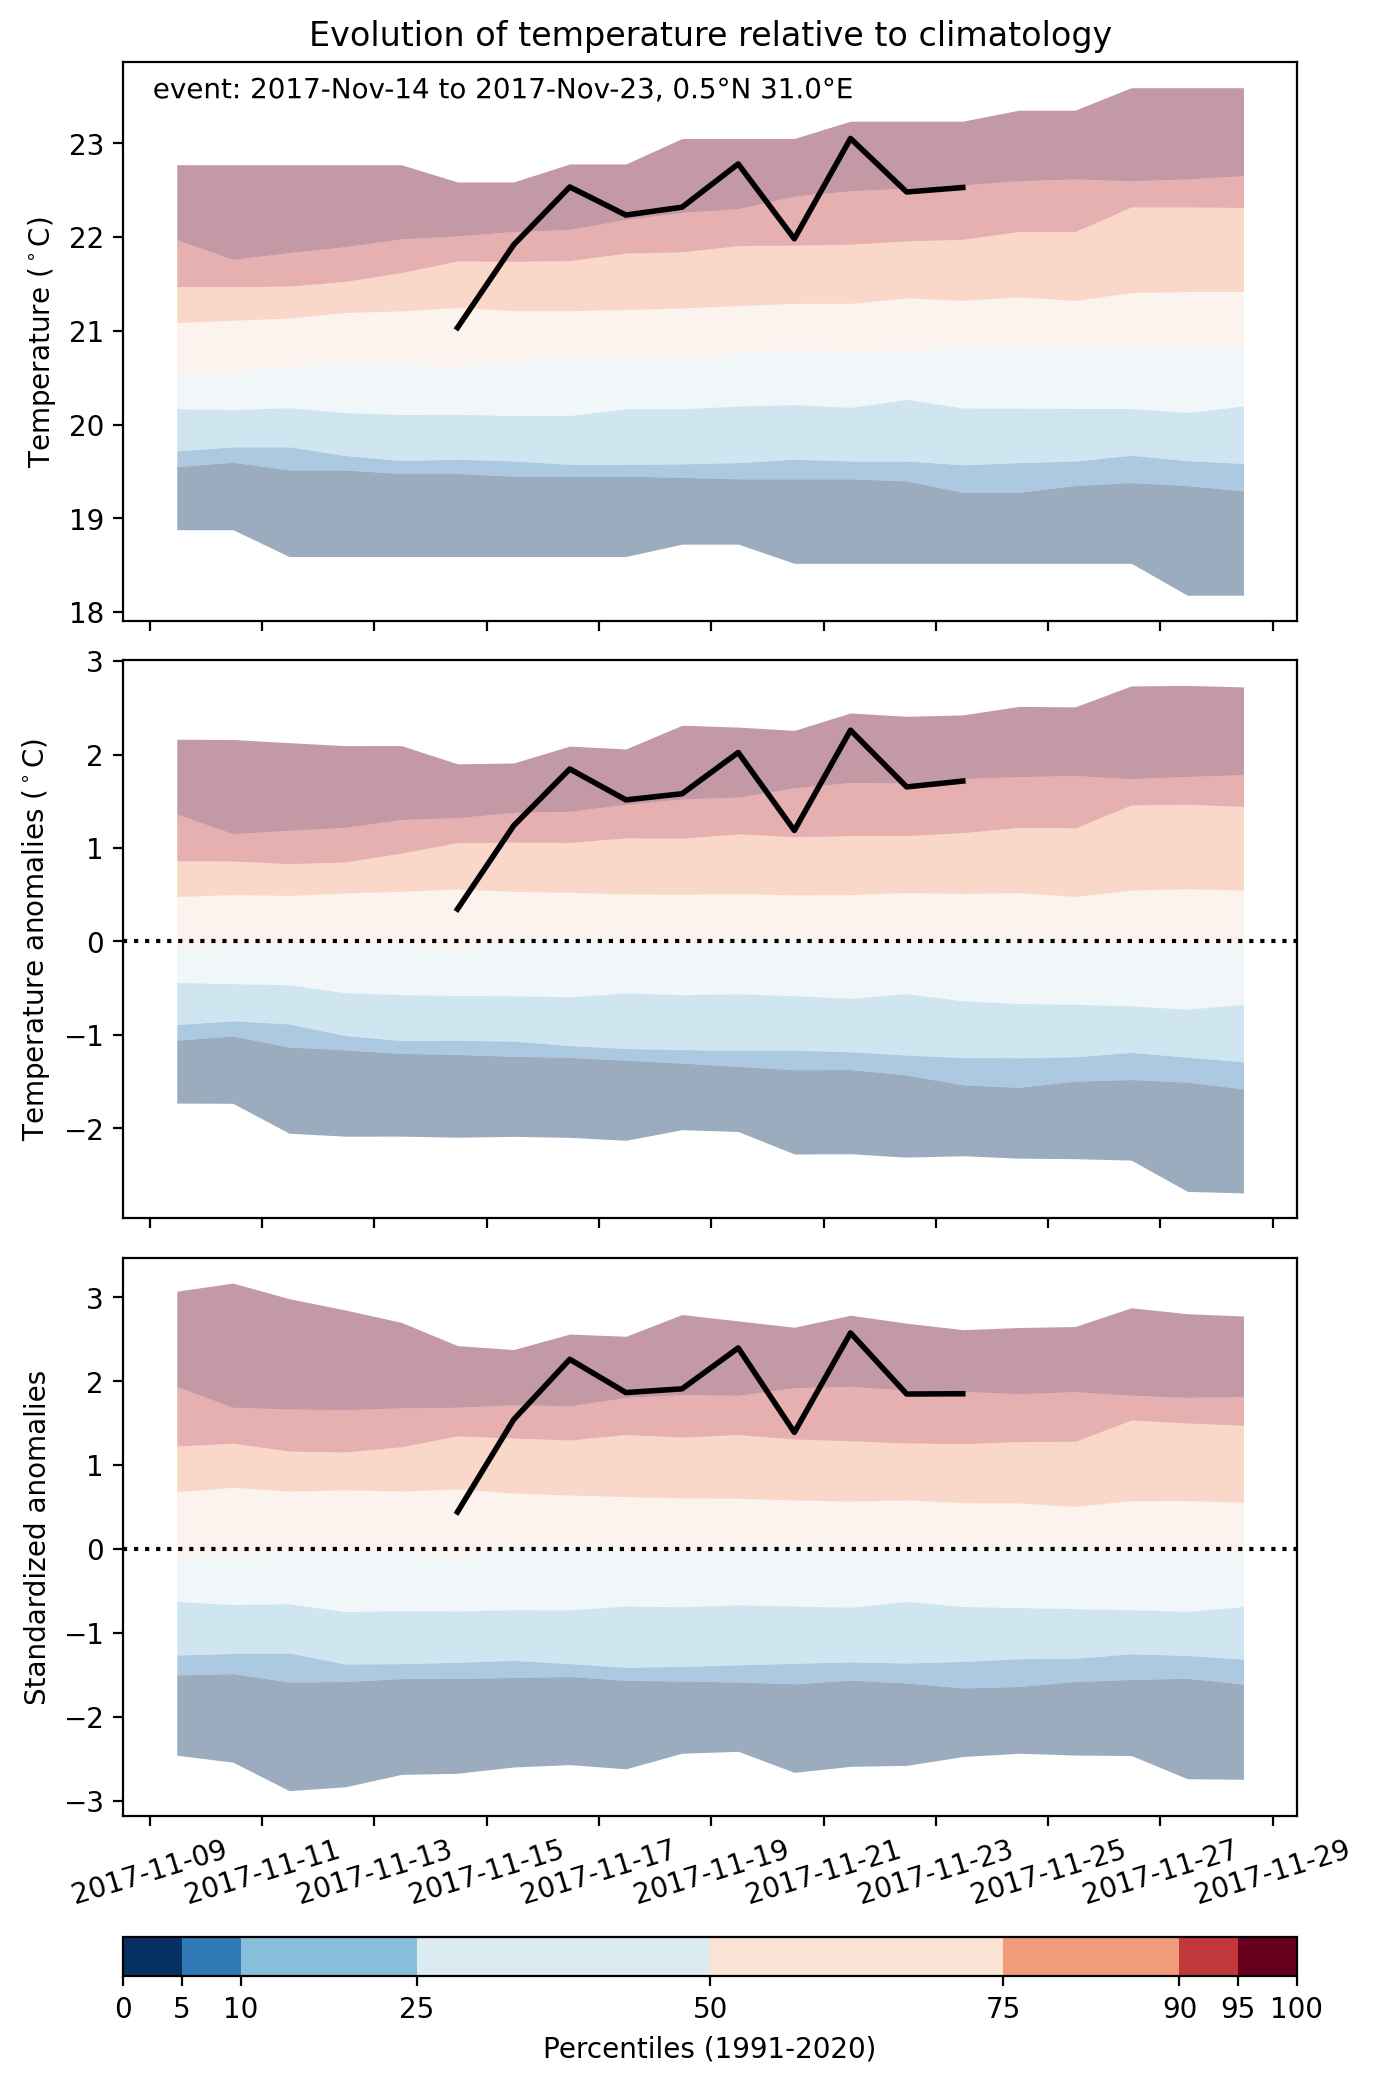
Fig. 2: Evolution of temperature at the center of the event. The climatological percentile distribution is illustrated with color shadings.


Fig. 3: Maps illustrating the evolution of standardized temperature anomalies during the event.

Event ID: Heat_wave_2017-Nov-14_to_2017-Nov-23_31.0_0.5