Cold spell occuring from April 17 2011 to April 24 2011 at -85.0°S 153.0°E

Download data: JSON

Event type: Cold spell

Countries affected (identified with ArcGIS Online; provided only for geographical reference):

  • Antarctica

Duration: 8 days

Time span: April 17 2011 to April 24 2011

Statistics over entire affected area:

  • Mean temperature anomaly: -9.1 °C
  • Mean temperature: -54.9 °C
  • Minimum temperature anomaly: -12.2 °C
  • Minimum temperature: -61.6 °C

Event center: -85.0°S 153.0°E

Area affected: 108504 km$^2$
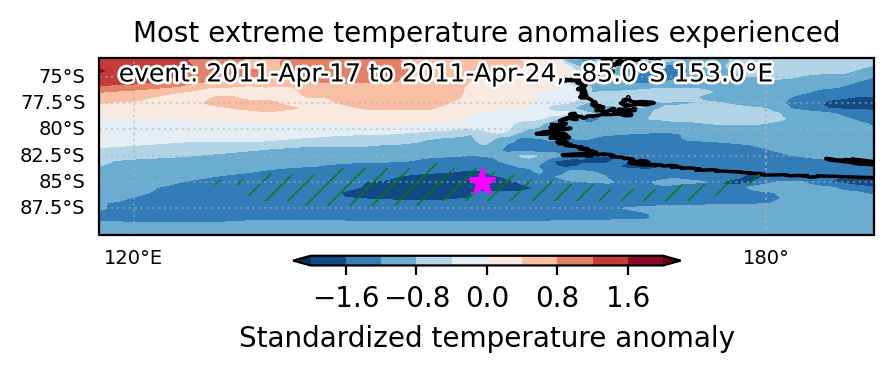

Fig. 1: Map of most extreme temperature anomalies (standardized) experienced during the event. The purple star indicates the center of the extreme event. Green hatching illustrates all areas under the effect of extremes at some time during the event.
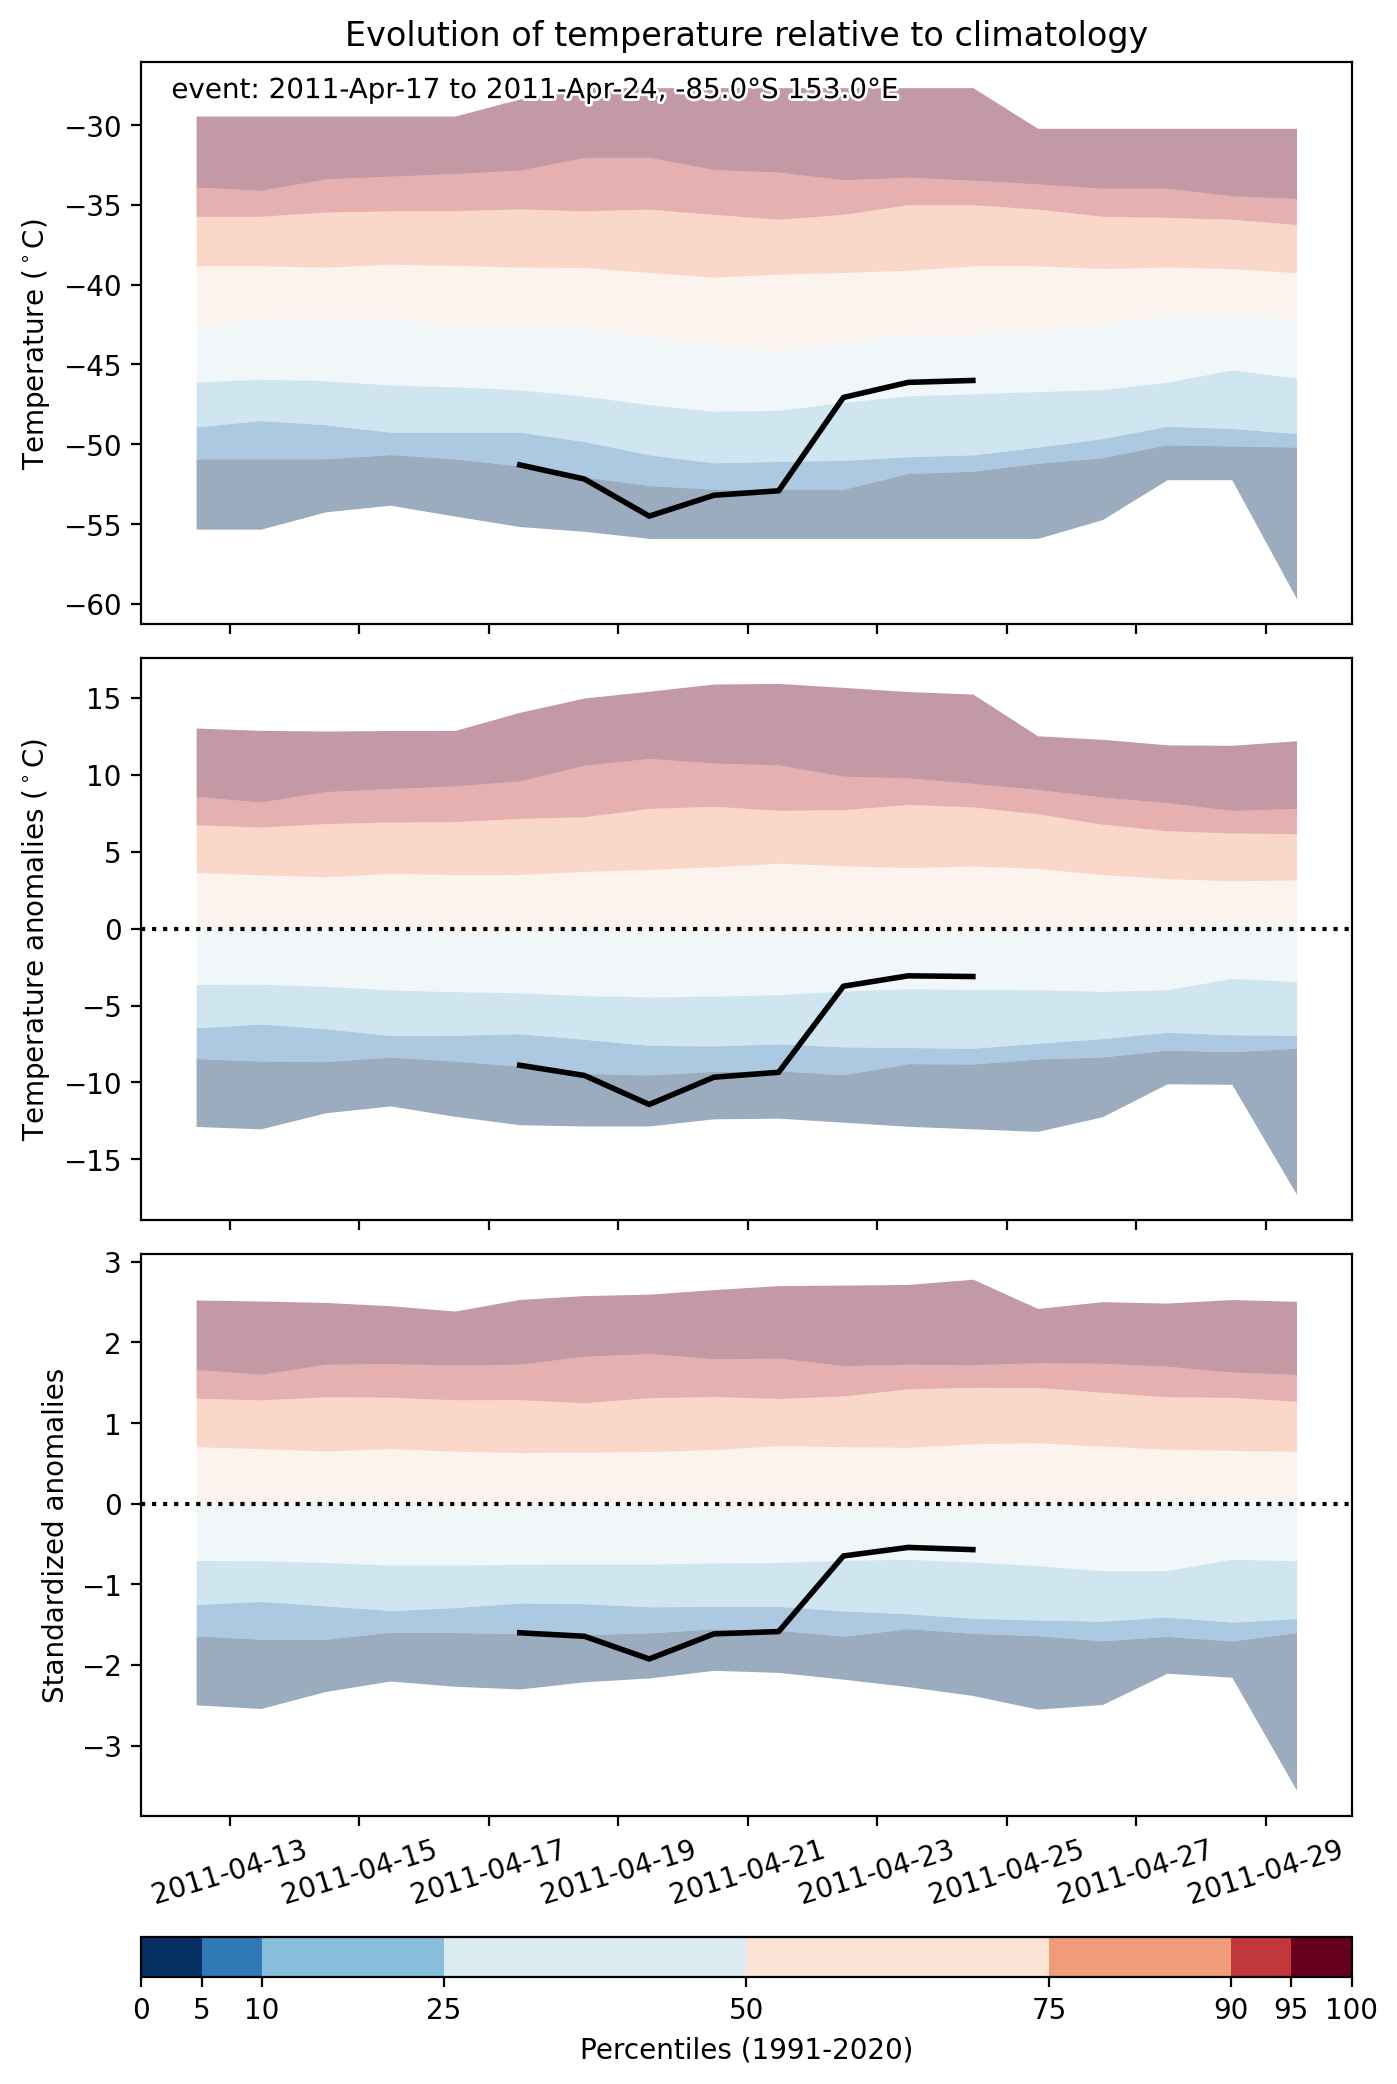


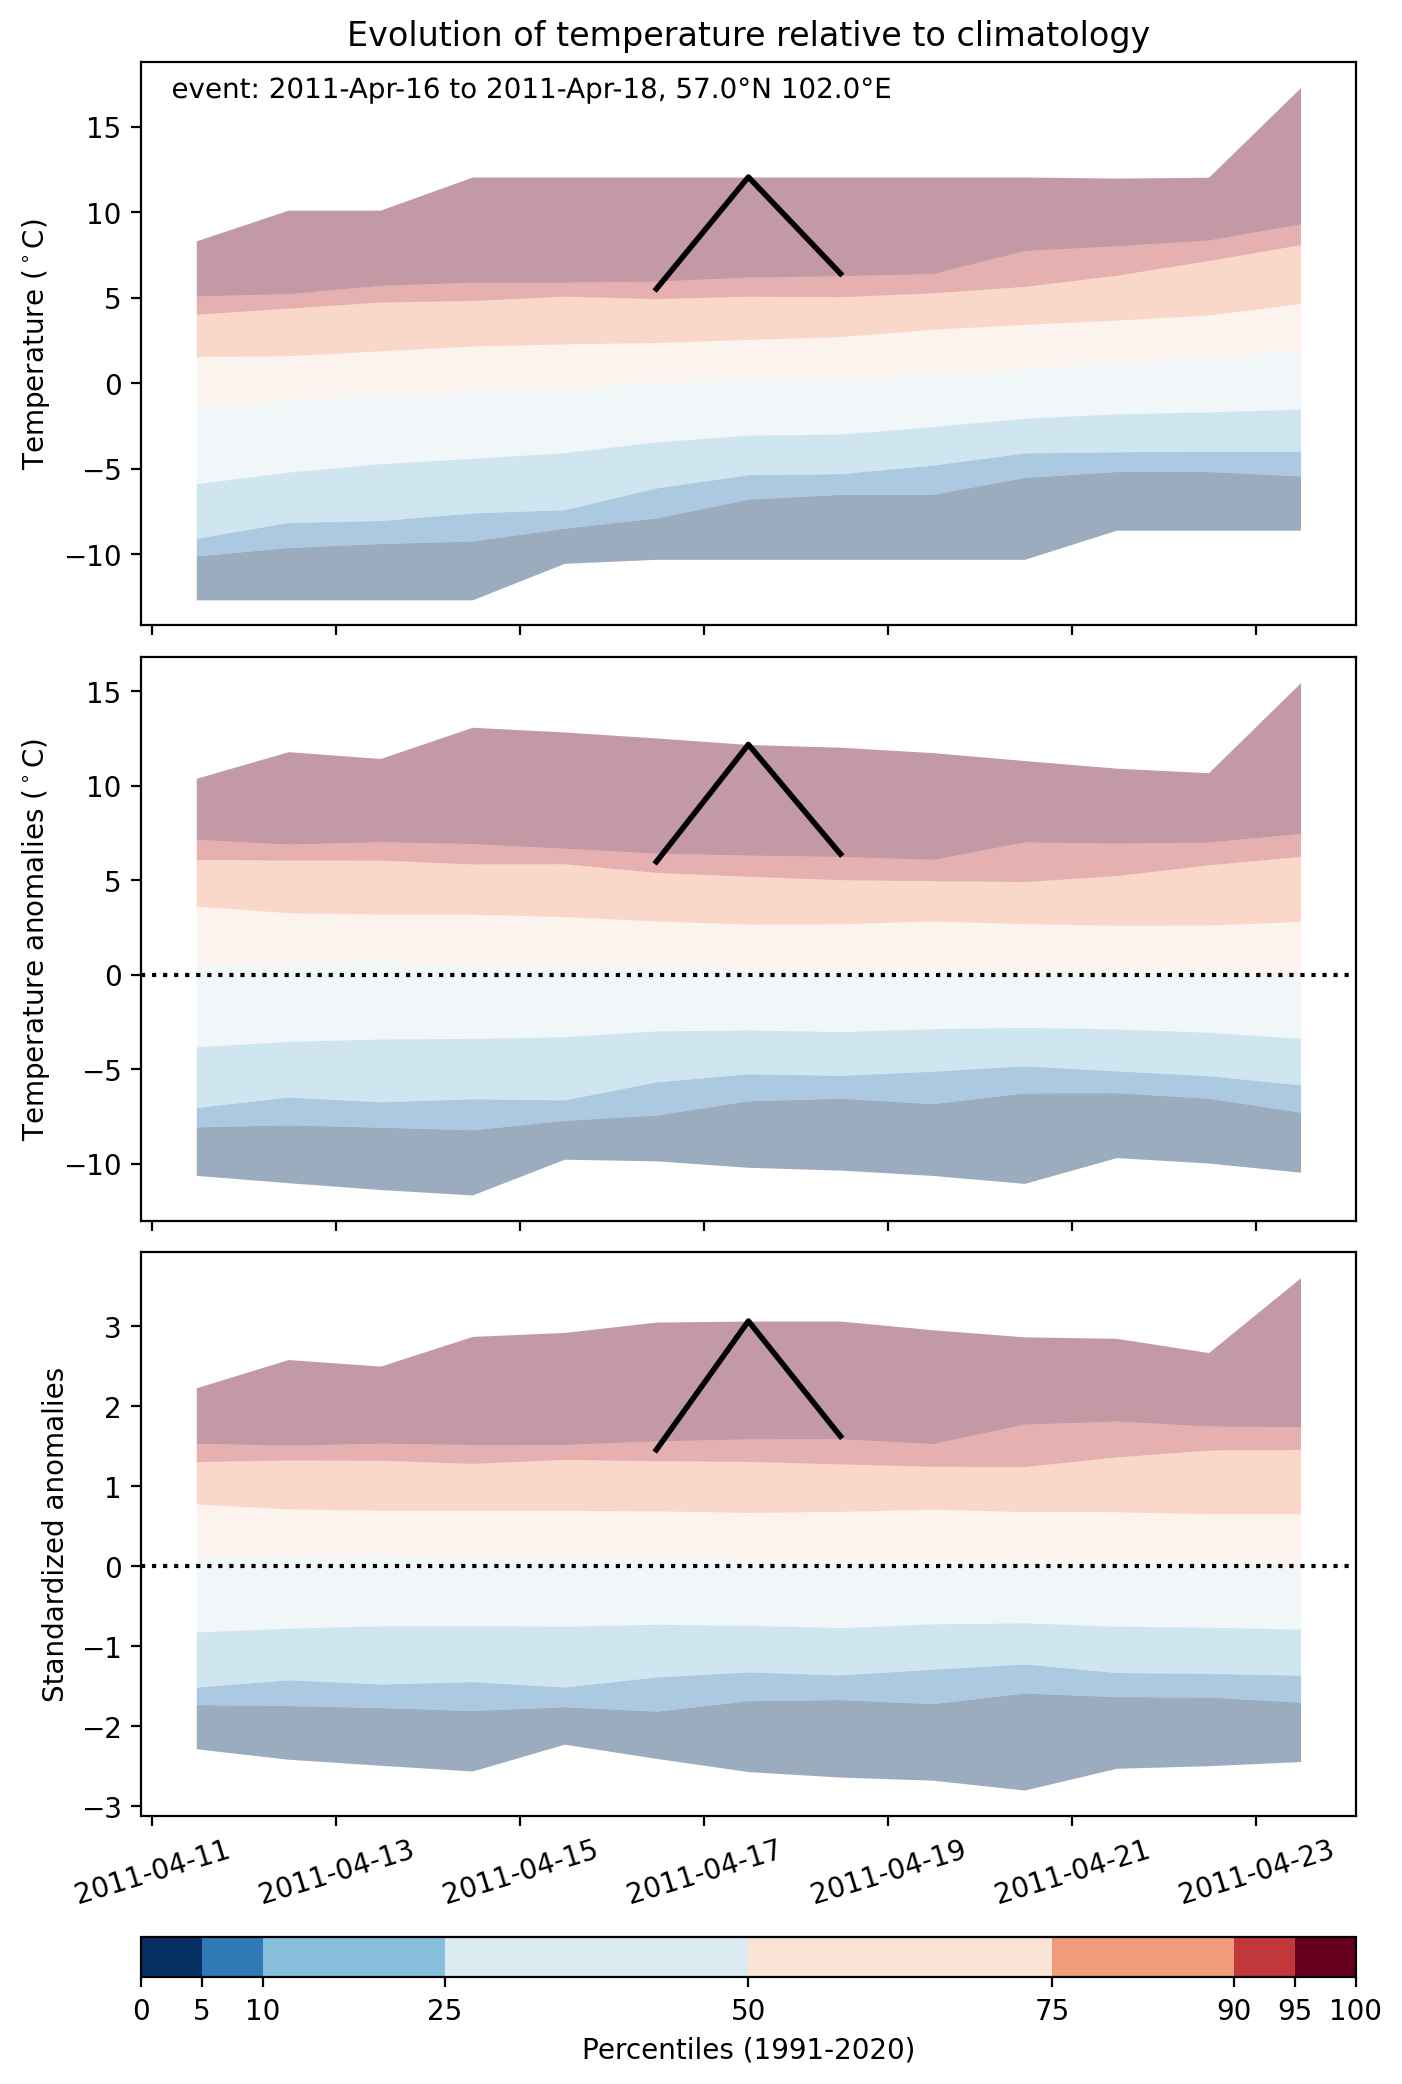
Fig. 2: Evolution of temperature at the center of the event. The climatological percentile distribution is illustrated with color shadings.
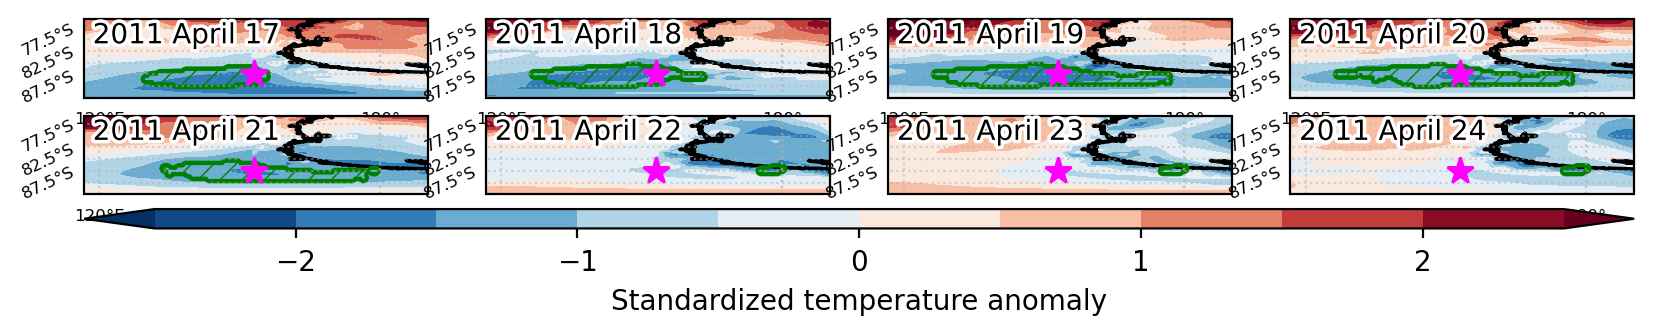


Fig. 3: Maps illustrating the evolution of standardized temperature anomalies during the event.

Event ID: Cold_spell_2011-Apr-17_to_2011-Apr-24_153.0_-85.0
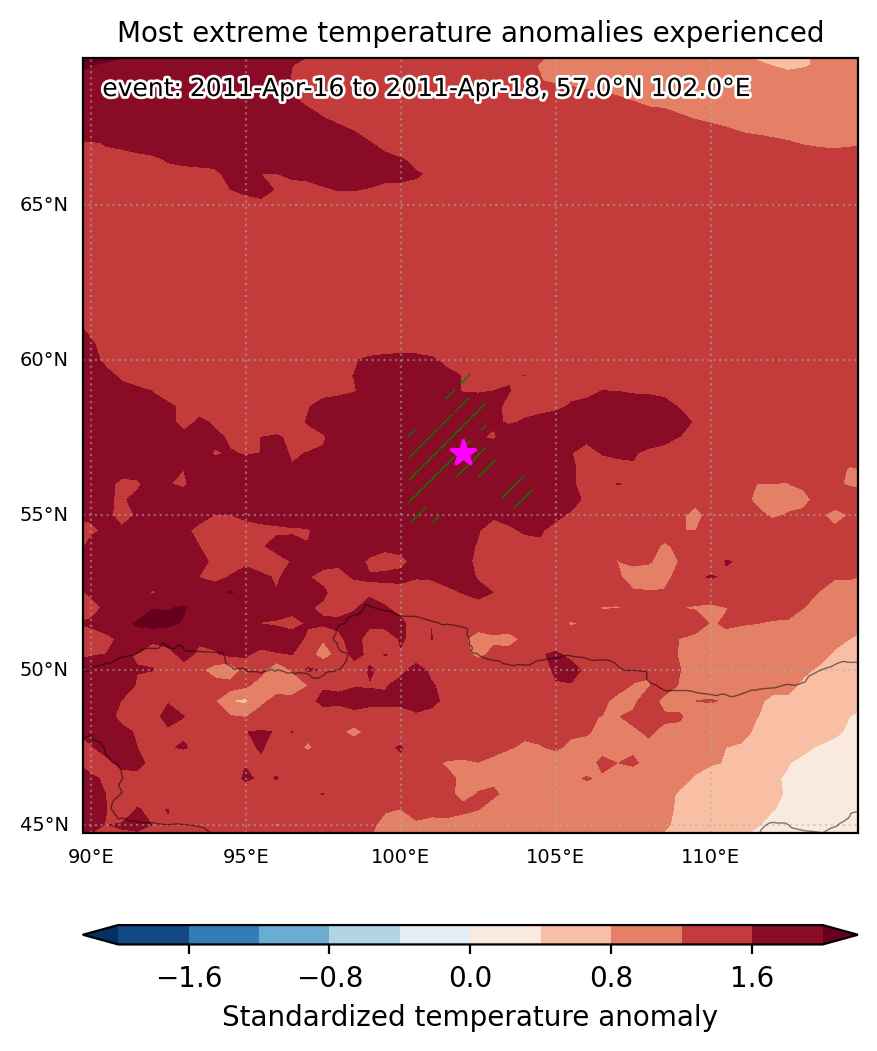
Heat wave occuring from April 16 2011 to April 18 2011 at 57.0°N 102.0°E

Download data: JSON

Event type: Heat wave

Countries affected (identified with ArcGIS Online; provided only for geographical reference):

  • Russian Federation

Duration: 3 days

Time span: April 16 2011 to April 18 2011

Statistics over entire affected area:

  • Mean temperature anomaly: 7.8 °C
  • Mean temperature: 8.1 °C
  • Maximum temperature anomaly: 12.6 °C
  • Maximum temperature: 14.1 °C

Event center: 57.0°N 102.0°E

Area affected: 52314 km$^2$


Fig. 1: Map of most extreme temperature anomalies (standardized) experienced during the event. The purple star indicates the center of the extreme event. Green hatching illustrates all areas under the effect of extremes at some time during the event.


Fig. 2: Evolution of temperature at the center of the event. The climatological percentile distribution is illustrated with color shadings.


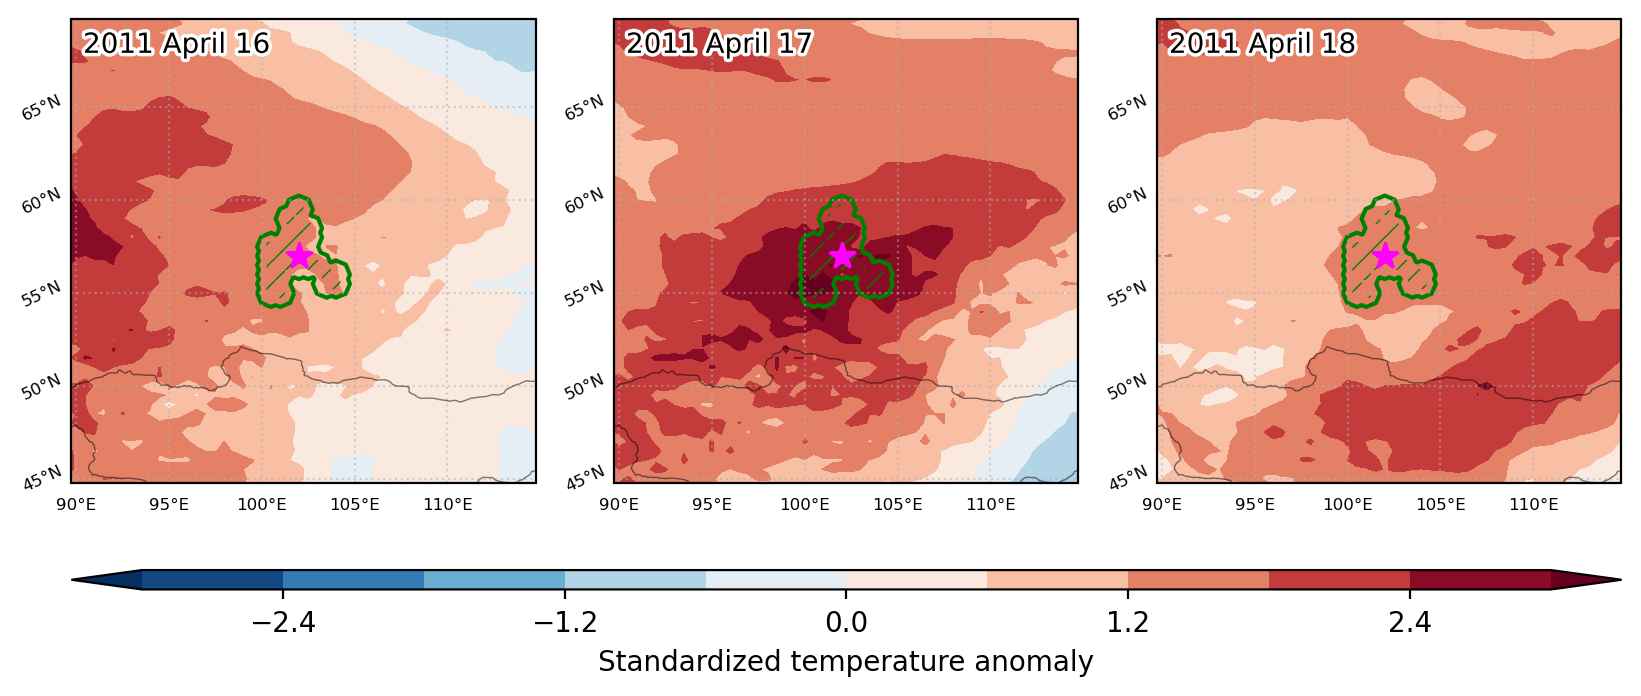
Fig. 3: Maps illustrating the evolution of standardized temperature anomalies during the event.

Event ID: Heat_wave_2011-Apr-16_to_2011-Apr-18_102.0_57.0

Heat wave occuring from April 16 2011 to April 23 2011 at 33.5°N 254.5°E

Download data: JSON

Event type: Heat wave

Countries affected (identified with ArcGIS Online; provided only for geographical reference):

  • United States

Duration: 8 days

Time span: April 16 2011 to April 23 2011

Statistics over entire affected area:

  • Mean temperature anomaly: 5.2 °C
  • Mean temperature: 19.7 °C
  • Maximum temperature anomaly: 8.3 °C
  • Maximum temperature: 28.1 °C

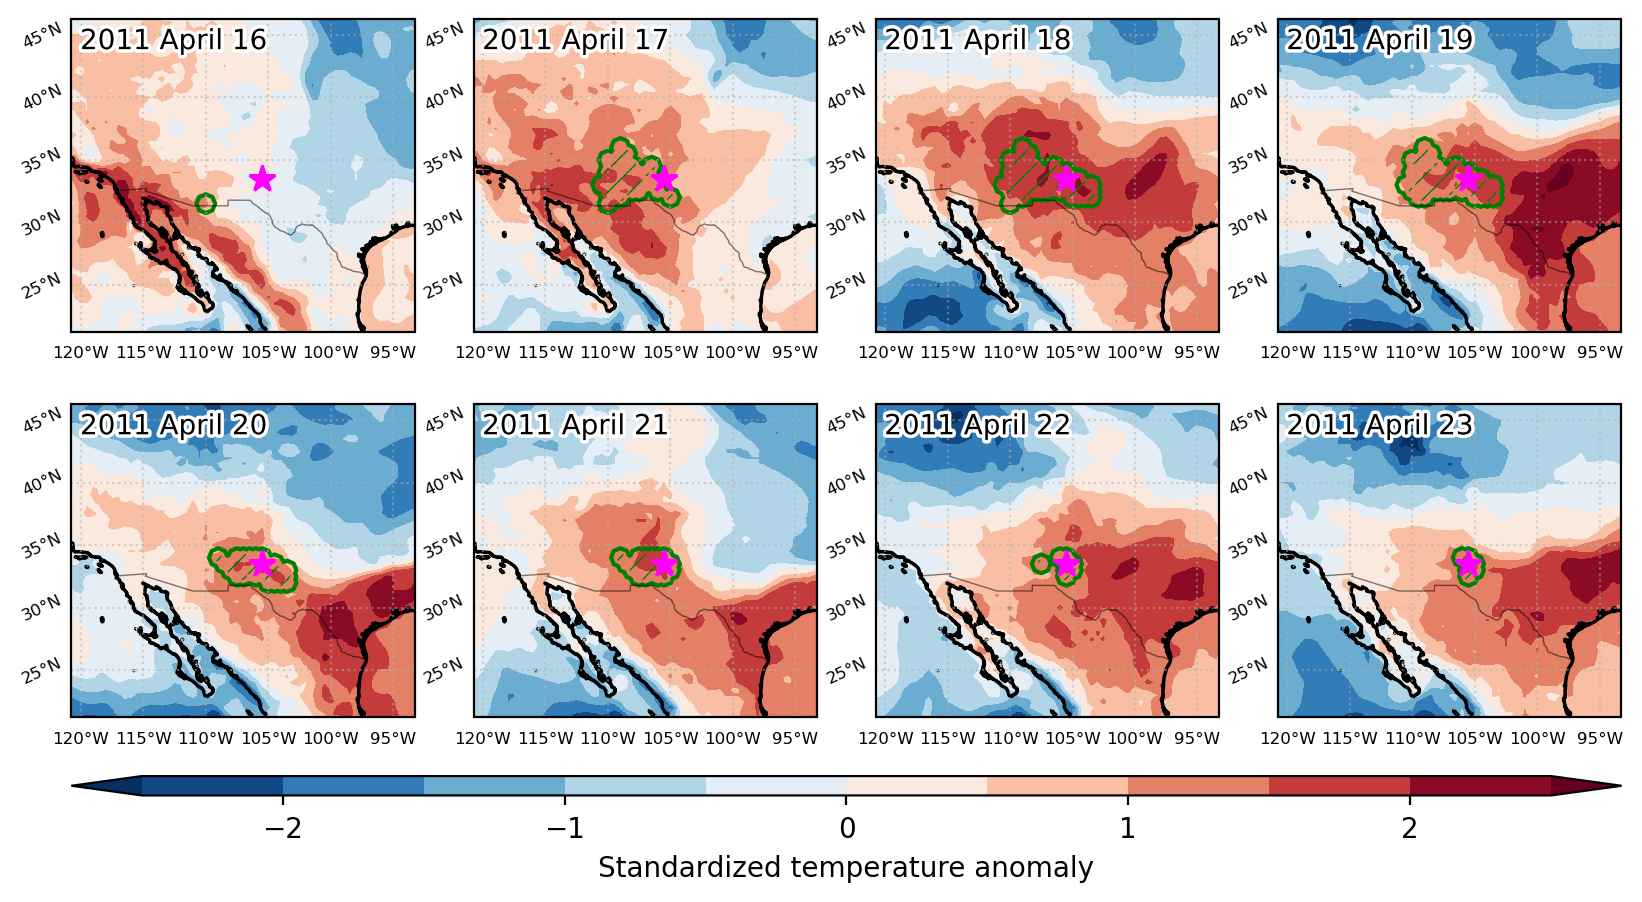
Event center: 33.5°N 254.5°E

Area affected: 170379 km$^2$


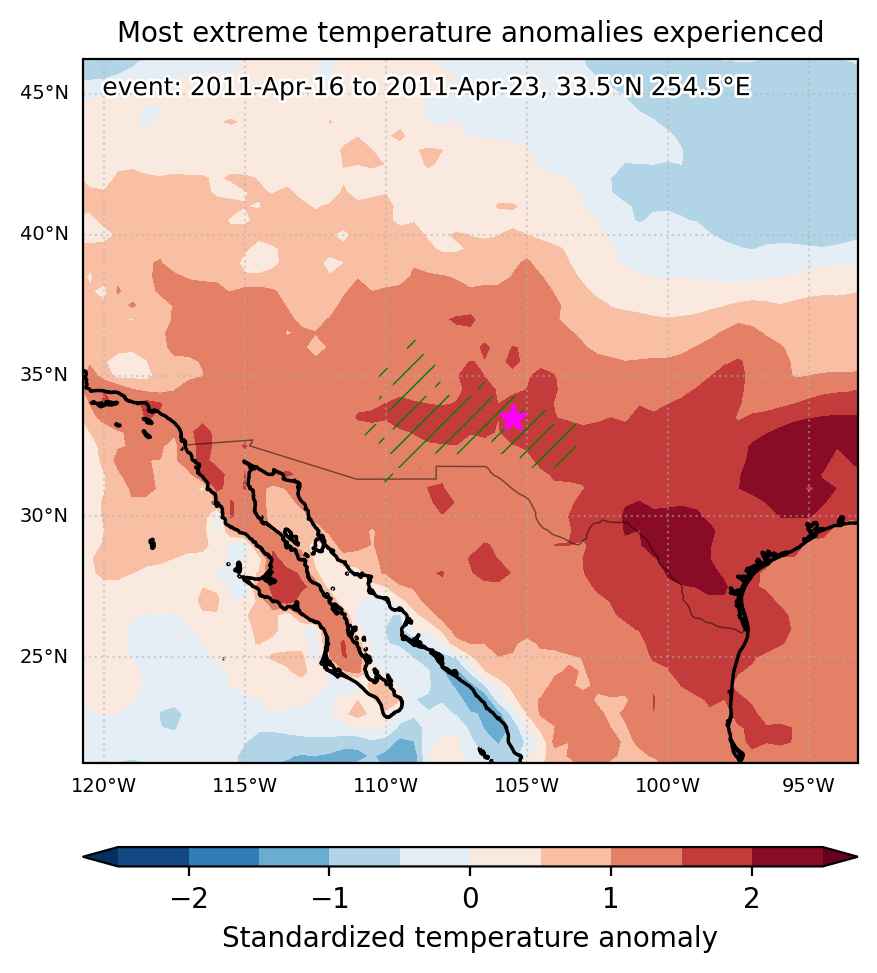
Fig. 1: Map of most extreme temperature anomalies (standardized) experienced during the event. The purple star indicates the center of the extreme event. Green hatching illustrates all areas under the effect of extremes at some time during the event.


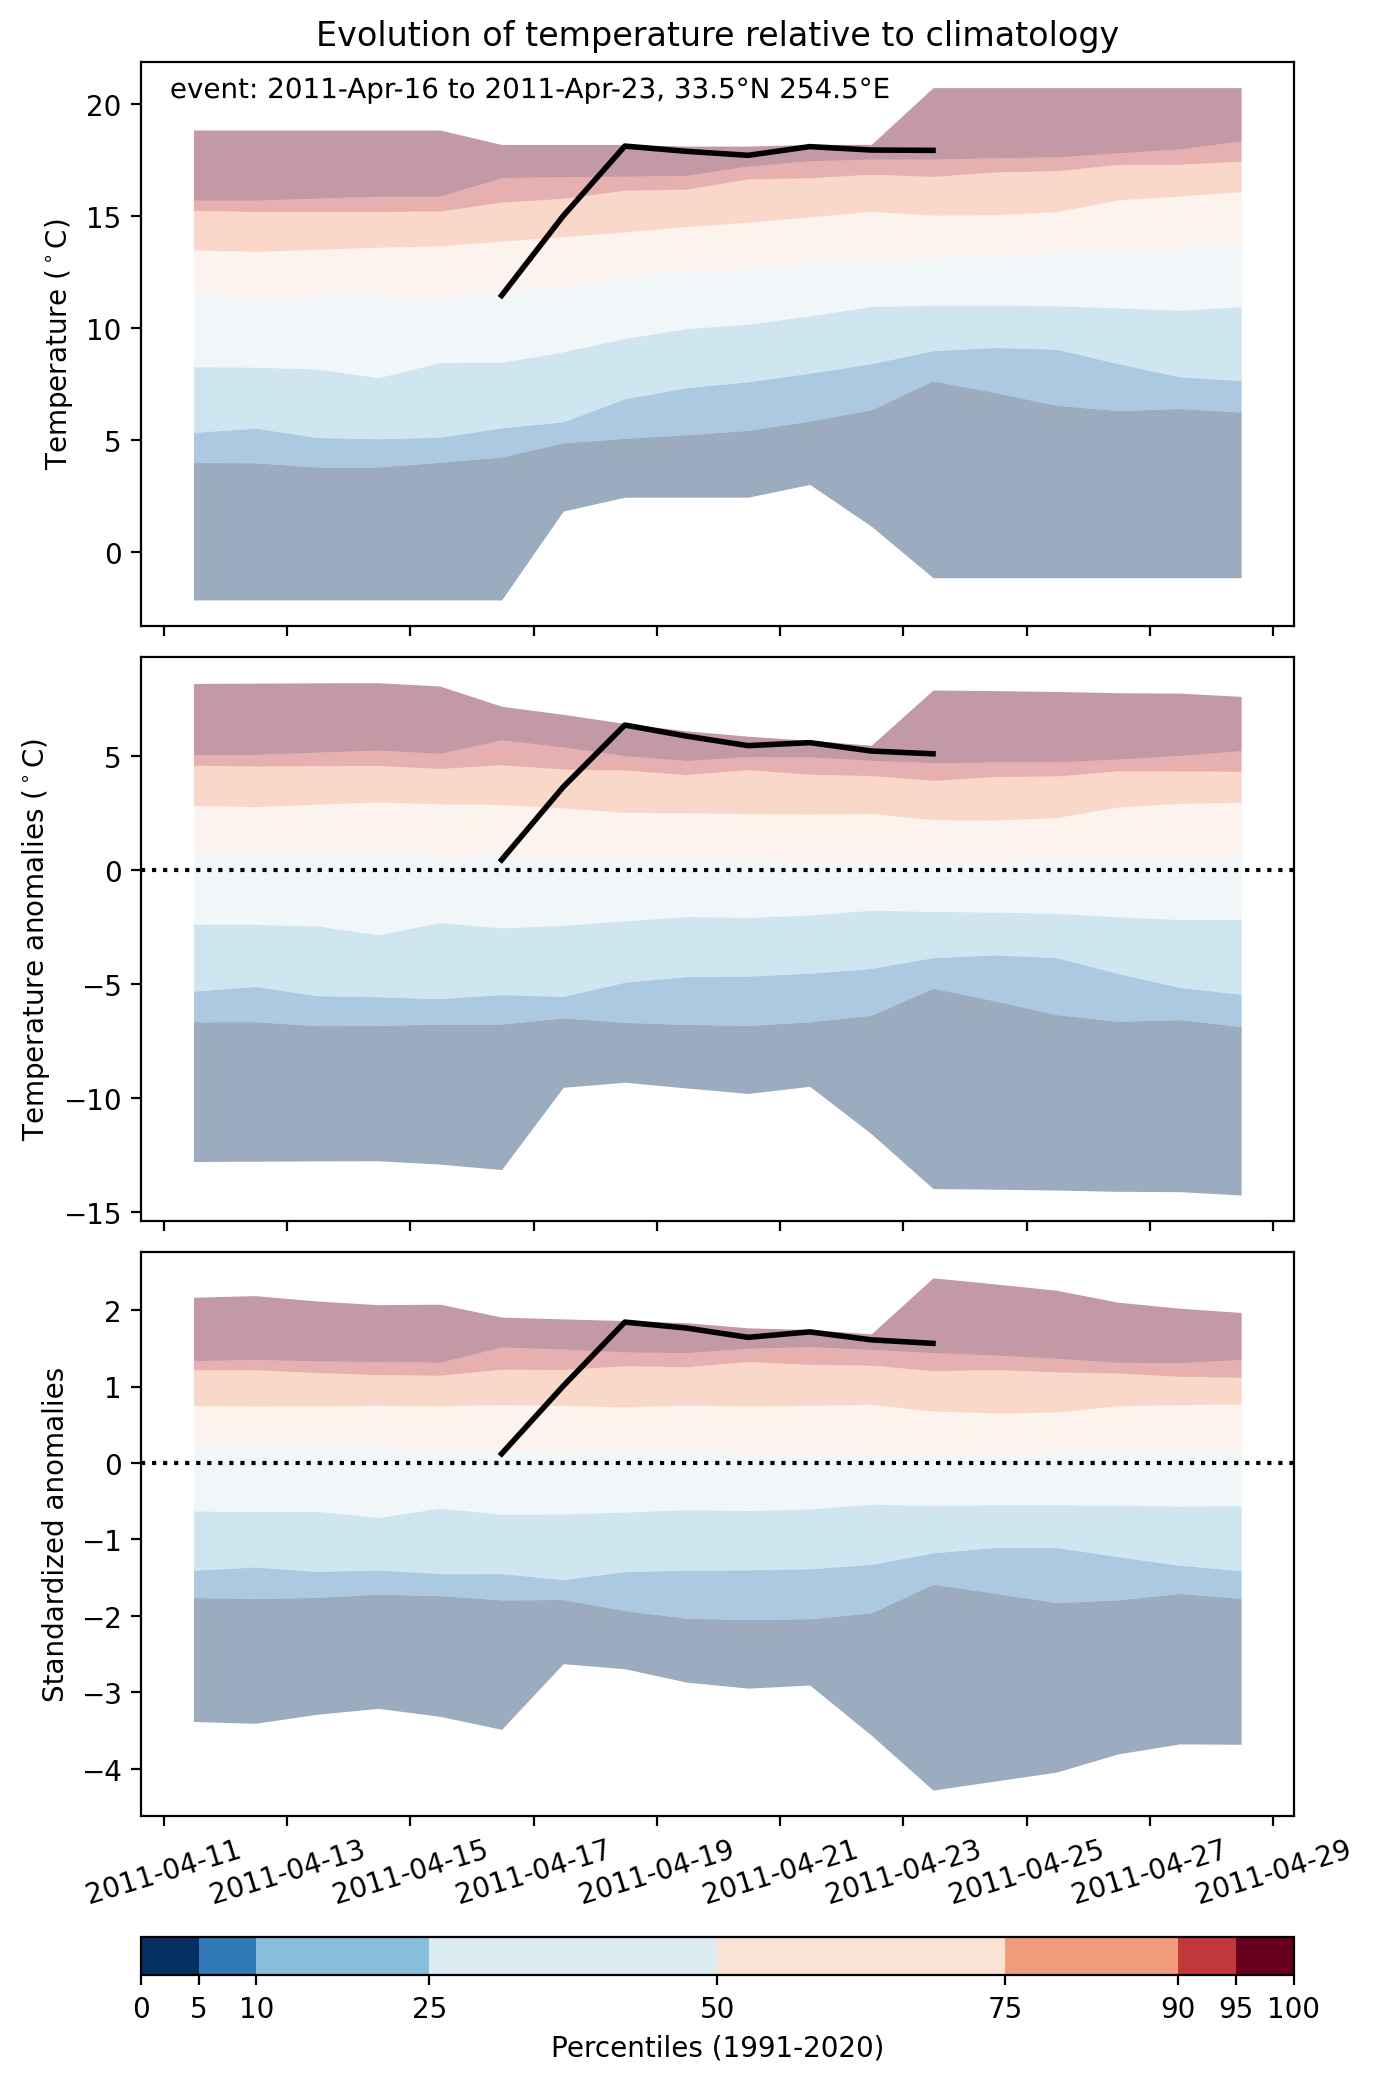
Fig. 2: Evolution of temperature at the center of the event. The climatological percentile distribution is illustrated with color shadings.


Fig. 3: Maps illustrating the evolution of standardized temperature anomalies during the event.

Event ID: Heat_wave_2011-Apr-16_to_2011-Apr-23_254.5_33.5

Heat wave occuring from April 16 2011 to April 18 2011 at 31.5°N 33.5°E

Download data: JSON

Event type: Heat wave

Countries affected (identified with ArcGIS Online; provided only for geographical reference):

  • Egypt

Duration: 3 days

Time span: April 16 2011 to April 18 2011

Statistics over entire affected area:

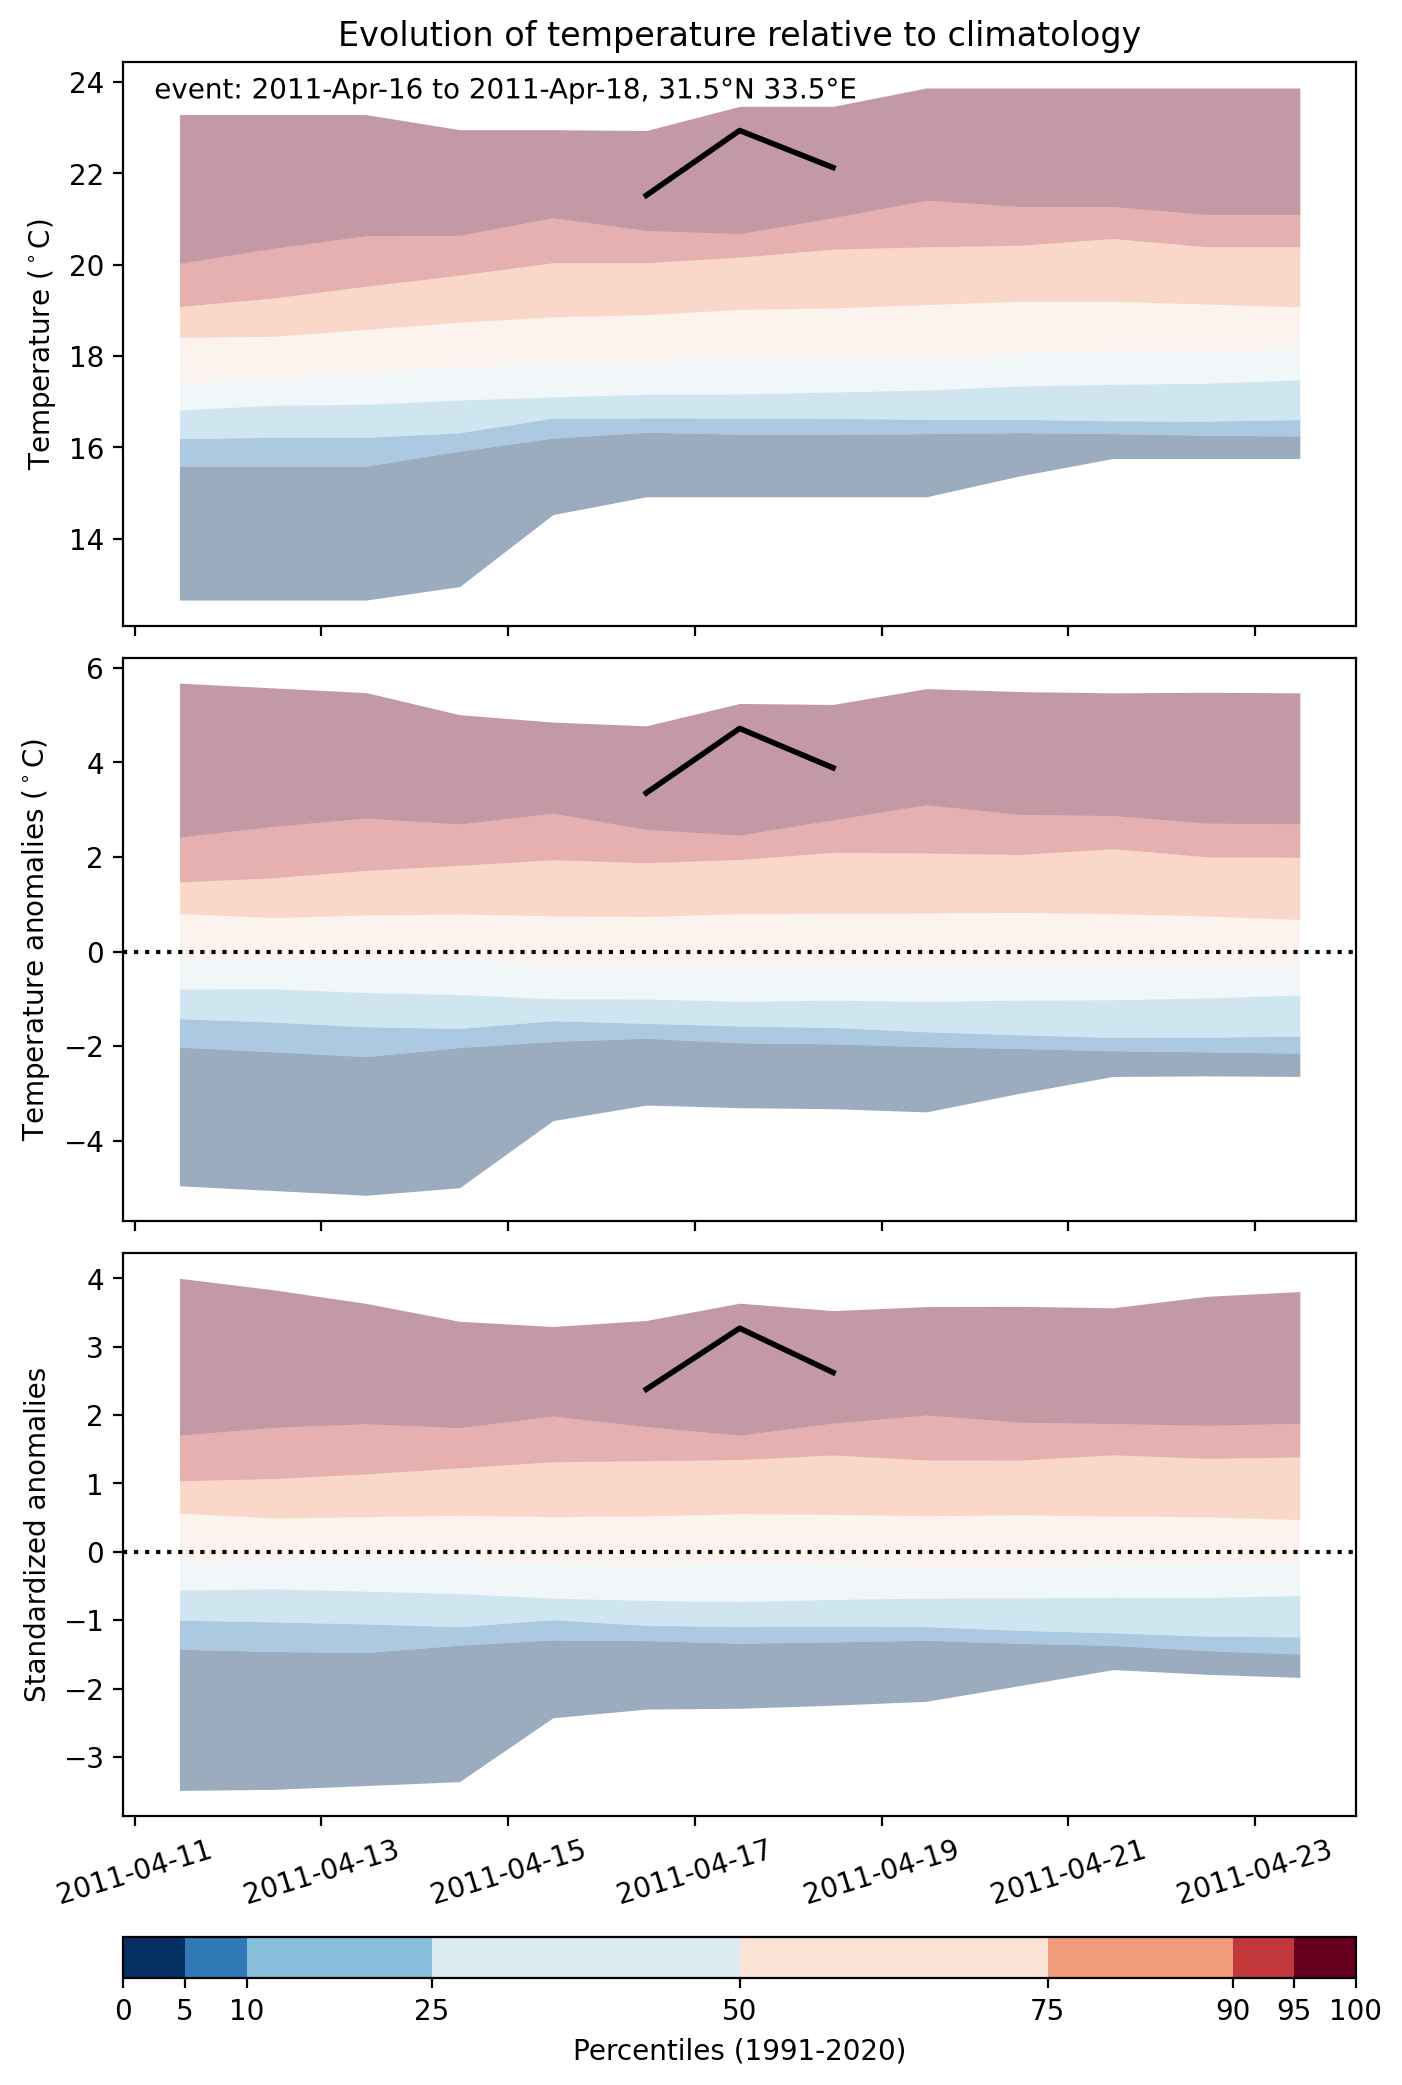
  • Mean temperature anomaly: 4.0 °C
  • Mean temperature: 22.8 °C
  • Maximum temperature anomaly: 9.2 °C
  • Maximum temperature: 30.4 °C

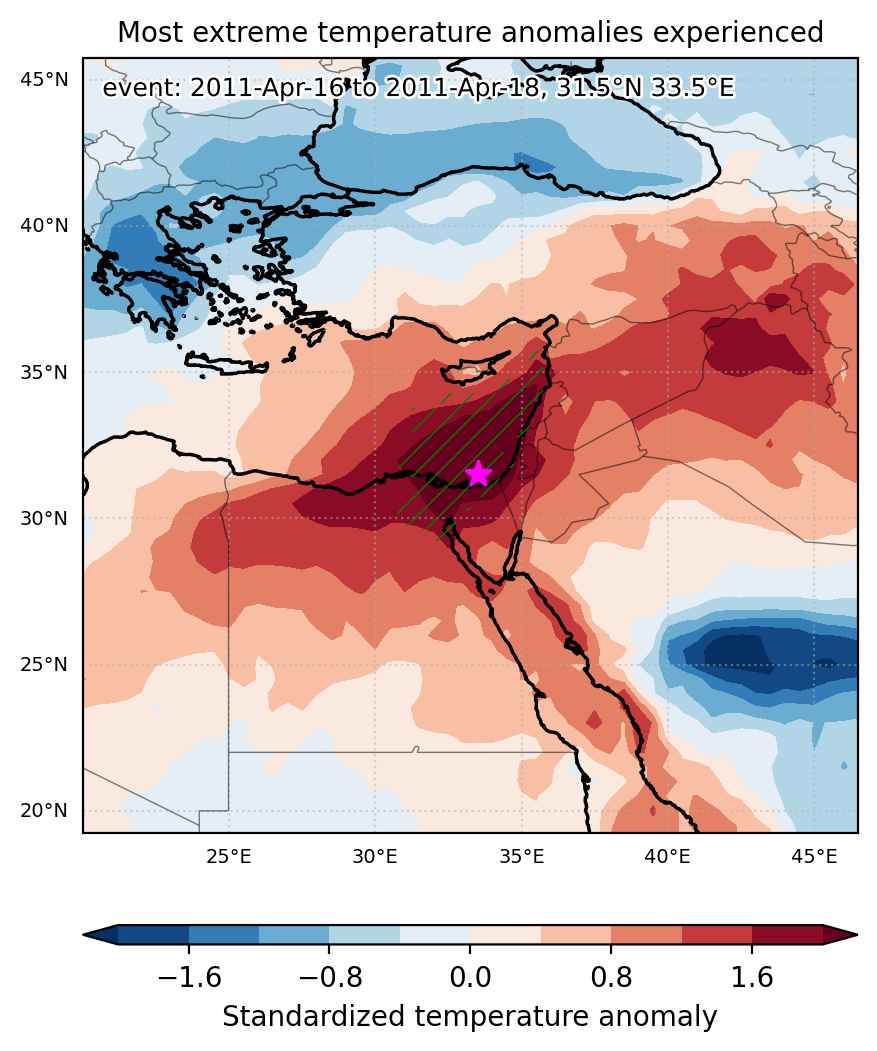
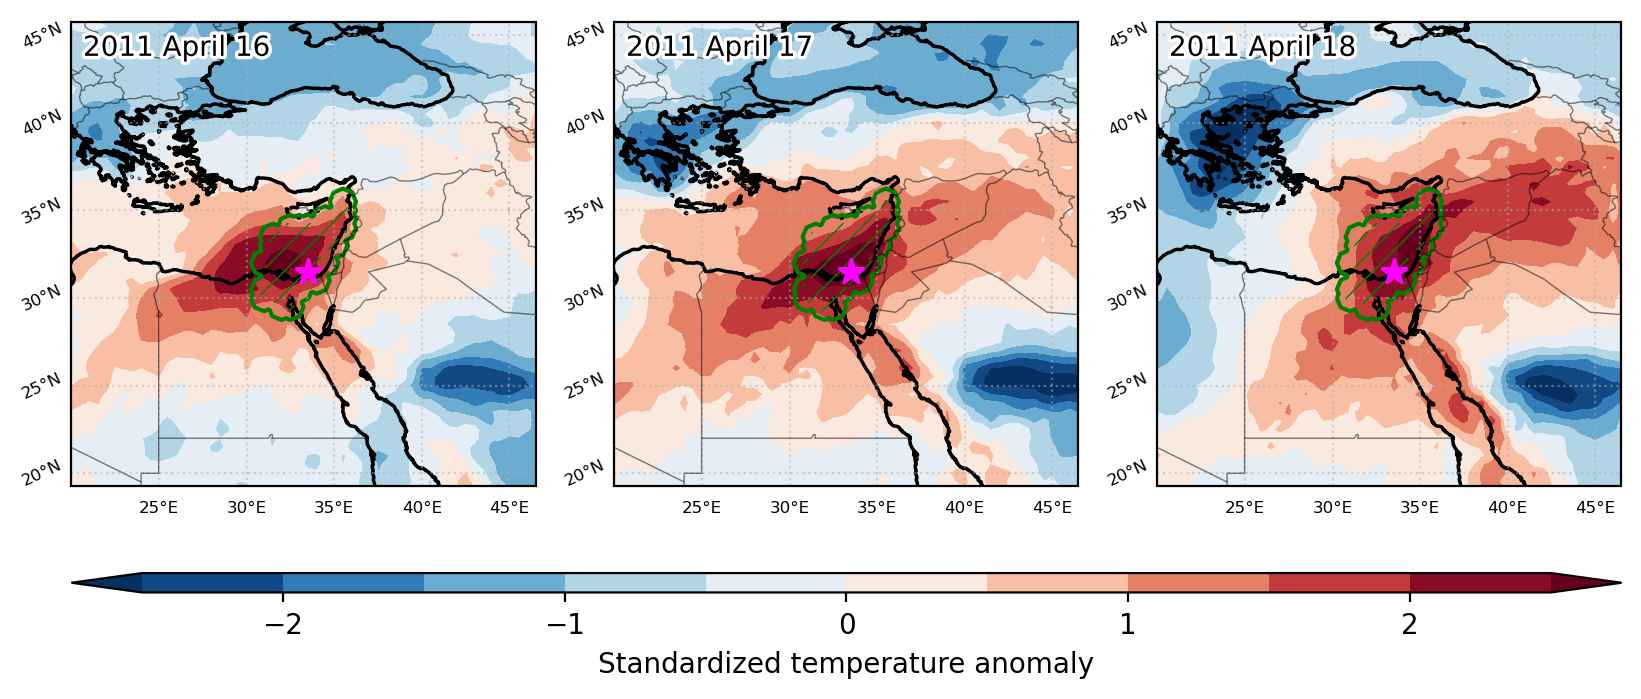
Event center: 31.5°N 33.5°E

Area affected: 169718 km$^2$


Fig. 1: Map of most extreme temperature anomalies (standardized) experienced during the event. The purple star indicates the center of the extreme event. Green hatching illustrates all areas under the effect of extremes at some time during the event.


Fig. 2: Evolution of temperature at the center of the event. The climatological percentile distribution is illustrated with color shadings.


Fig. 3: Maps illustrating the evolution of standardized temperature anomalies during the event.

Event ID: Heat_wave_2011-Apr-16_to_2011-Apr-18_33.5_31.5

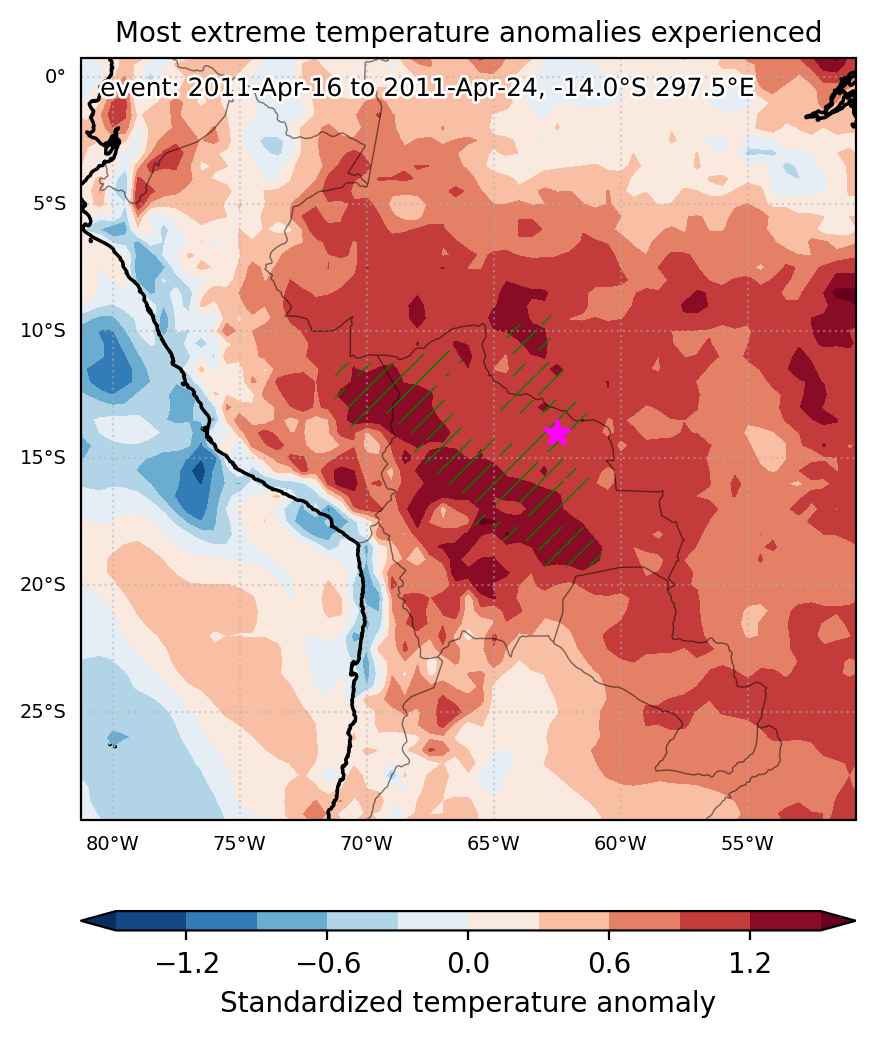
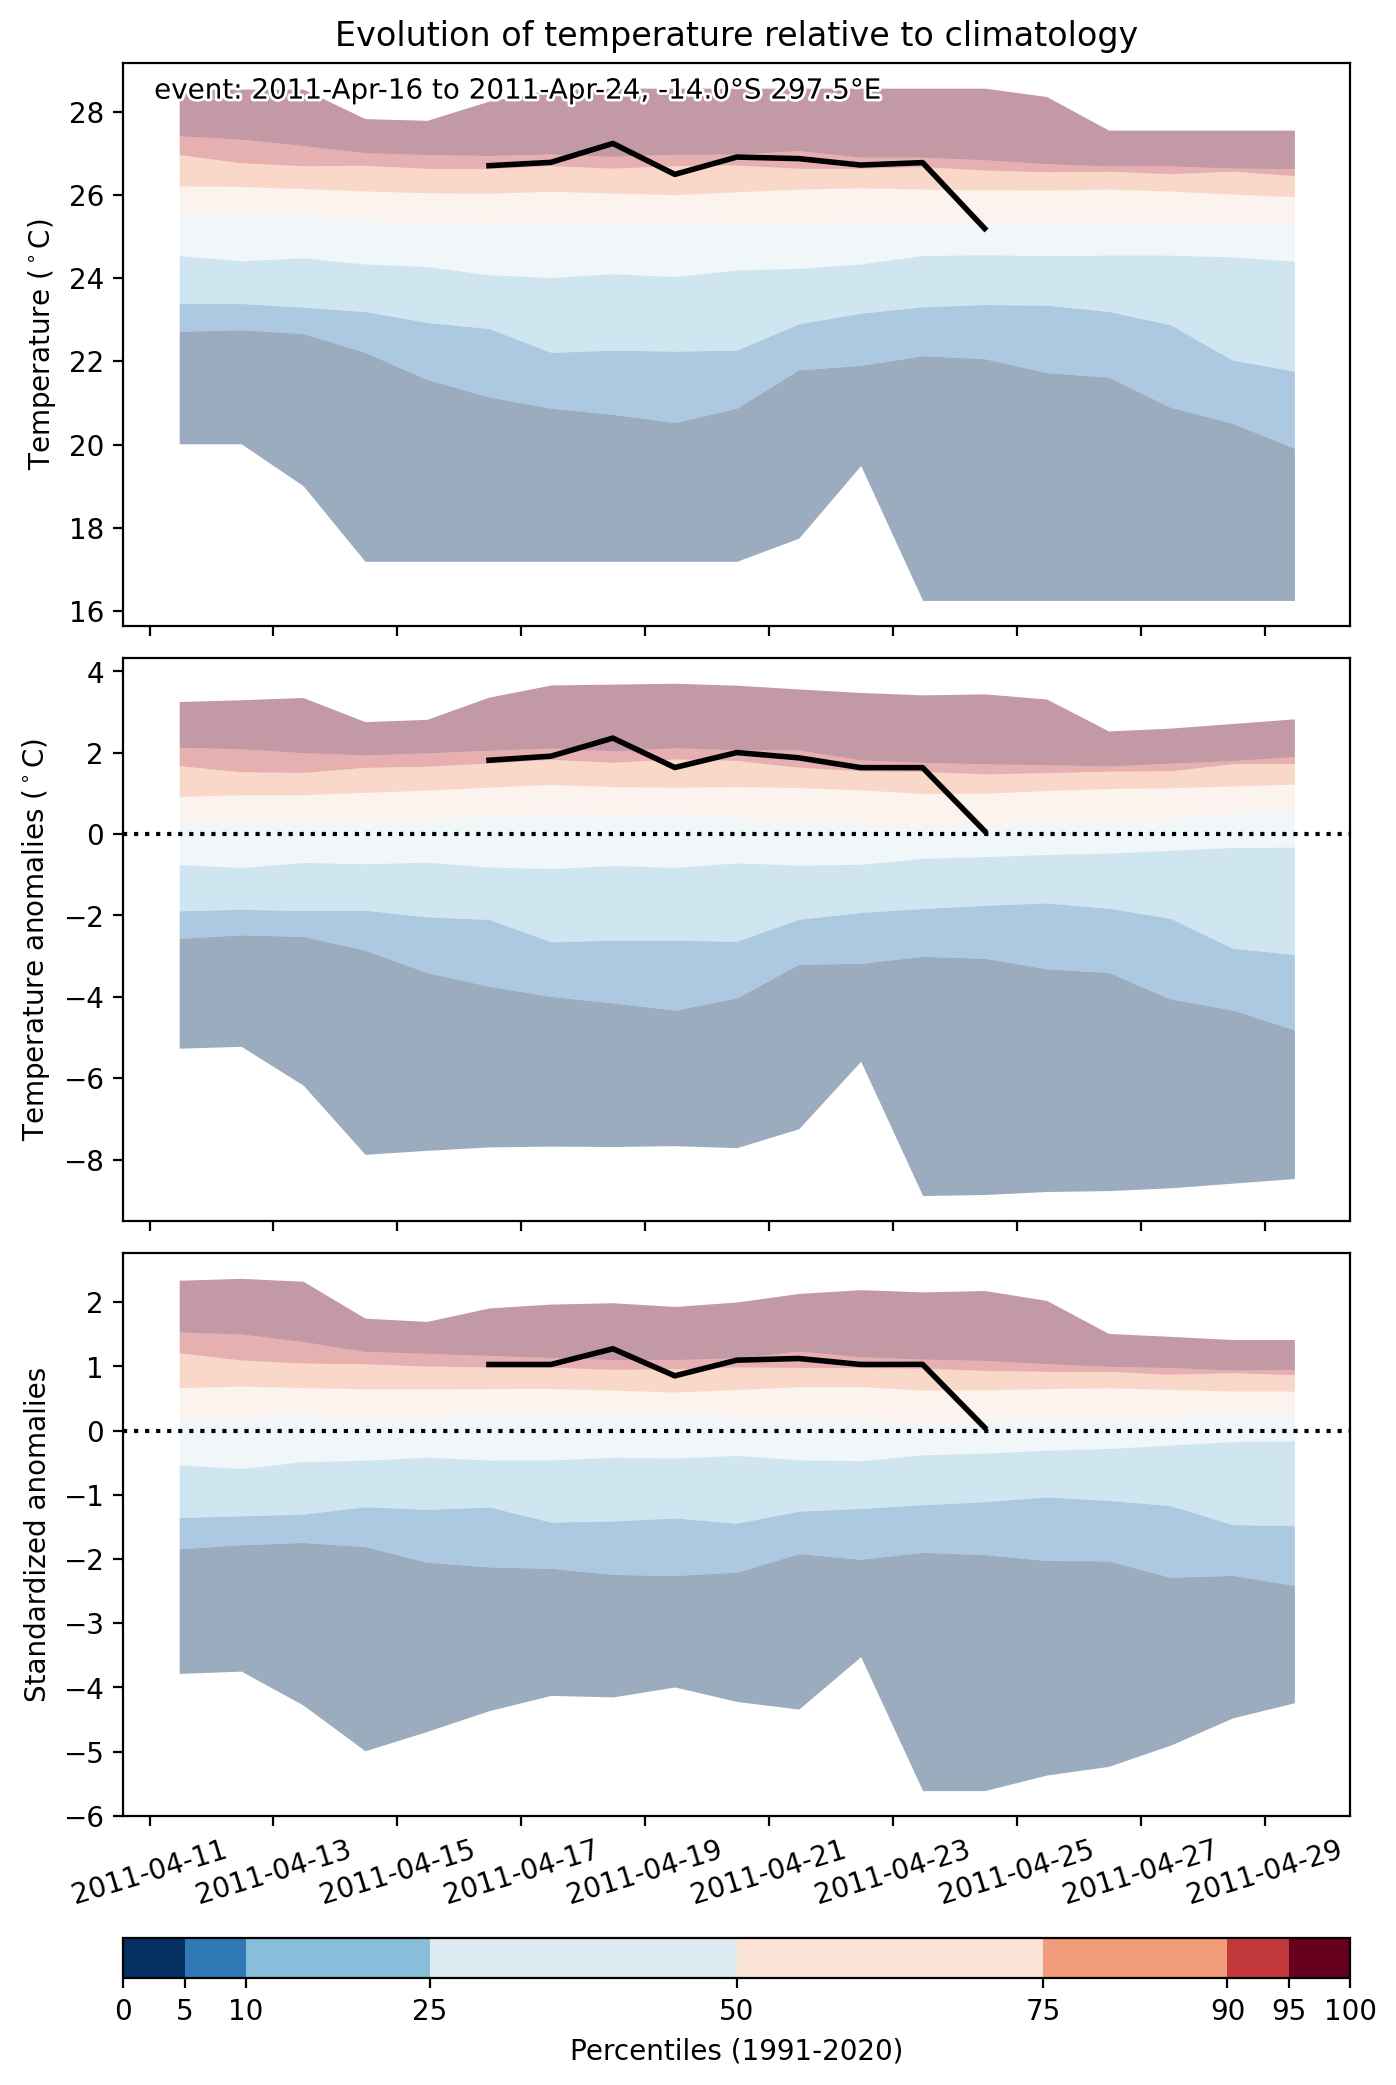
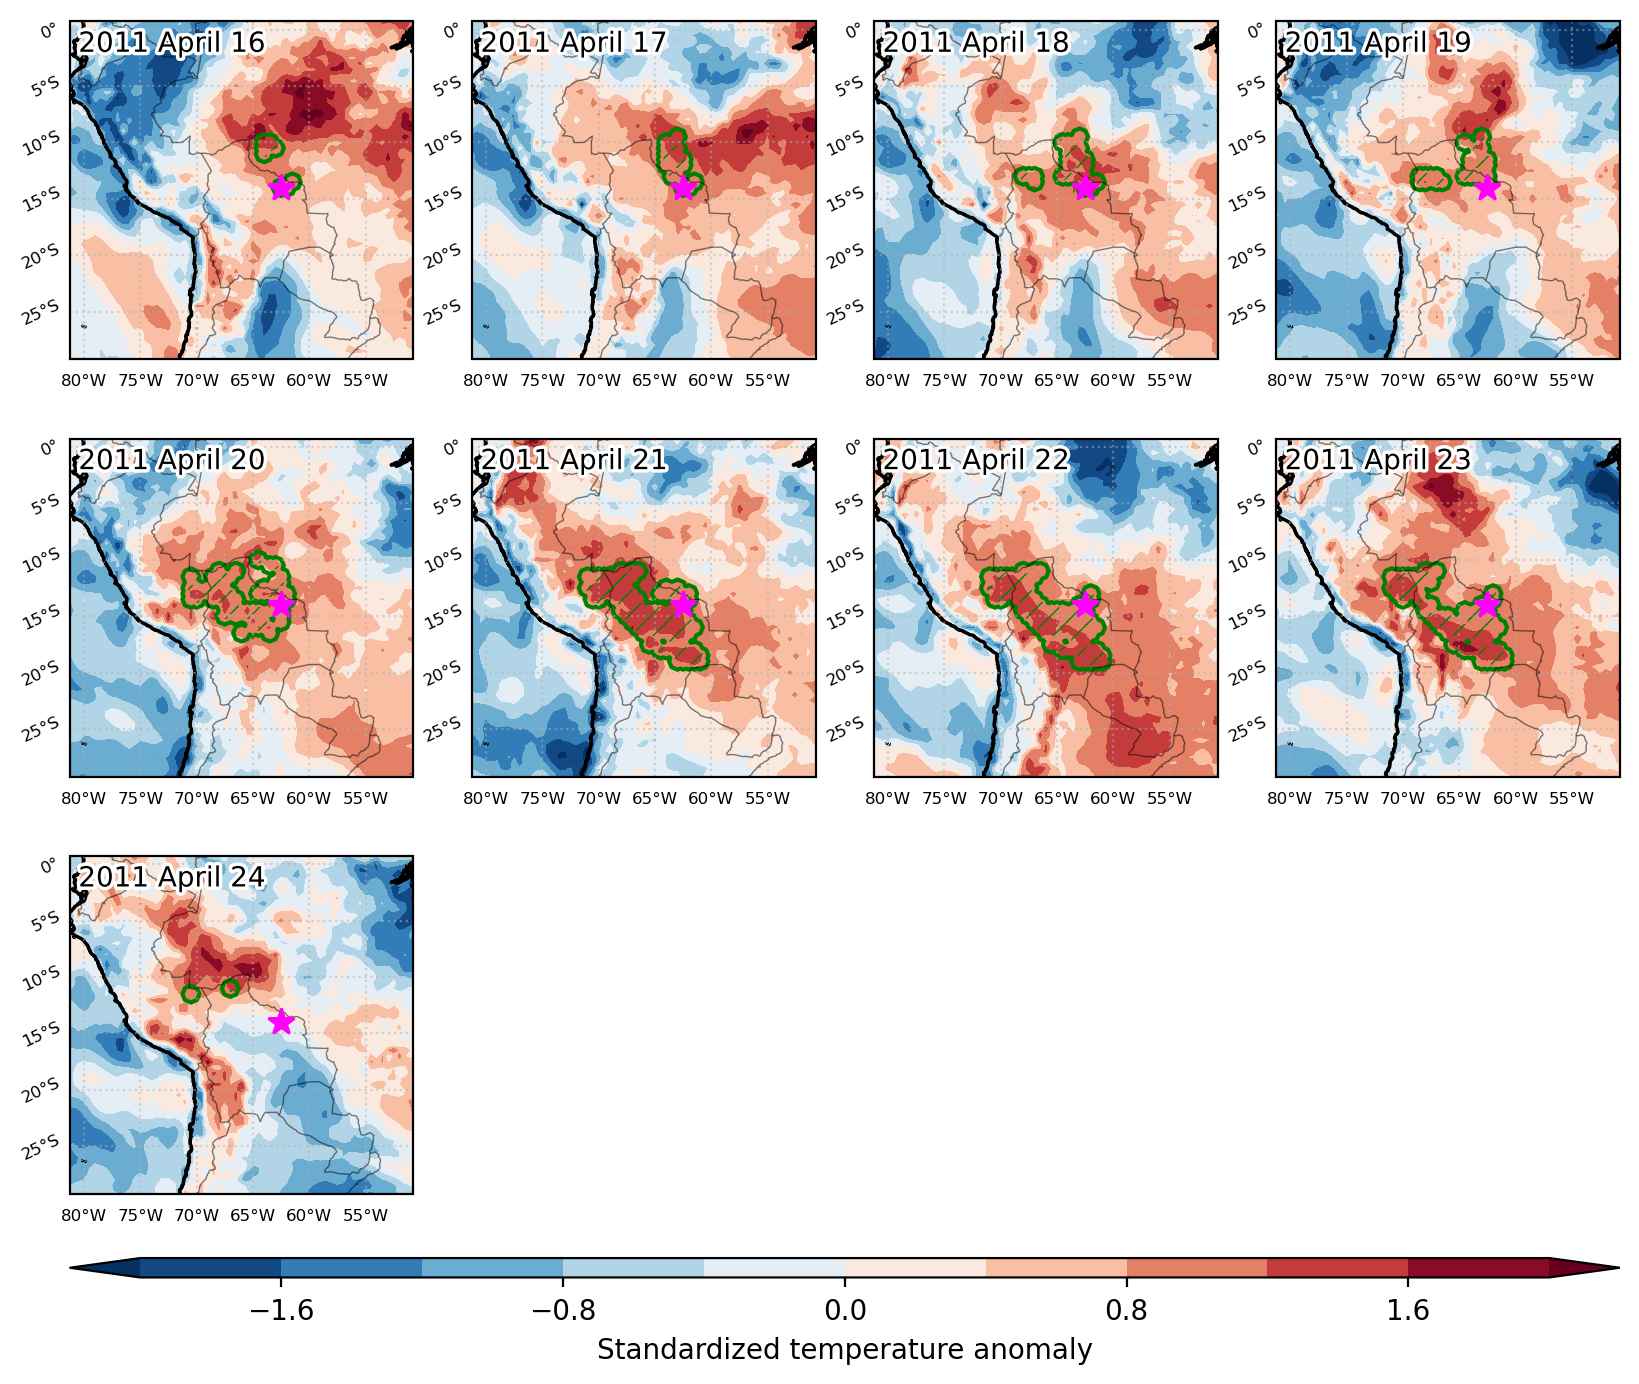
Heat wave occuring from April 16 2011 to April 24 2011 at -14.0°S 297.5°E

Download data: JSON

Event type: Heat wave

Countries affected (identified with ArcGIS Online; provided only for geographical reference):

  • Bolivia
  • Brazil
  • Peru

Duration: 9 days

Time span: April 16 2011 to April 24 2011

Statistics over entire affected area:

  • Mean temperature anomaly: 2.2 °C
  • Mean temperature: 26.9 °C
  • Maximum temperature anomaly: 4.7 °C
  • Maximum temperature: 29.7 °C

Event center: -14.0°S 297.5°E

Area affected: 436926 km$^2$


Fig. 1: Map of most extreme temperature anomalies (standardized) experienced during the event. The purple star indicates the center of the extreme event. Green hatching illustrates all areas under the effect of extremes at some time during the event.


Fig. 2: Evolution of temperature at the center of the event. The climatological percentile distribution is illustrated with color shadings.


Fig. 3: Maps illustrating the evolution of standardized temperature anomalies during the event.

Event ID: Heat_wave_2011-Apr-16_to_2011-Apr-24_297.5_-14.0

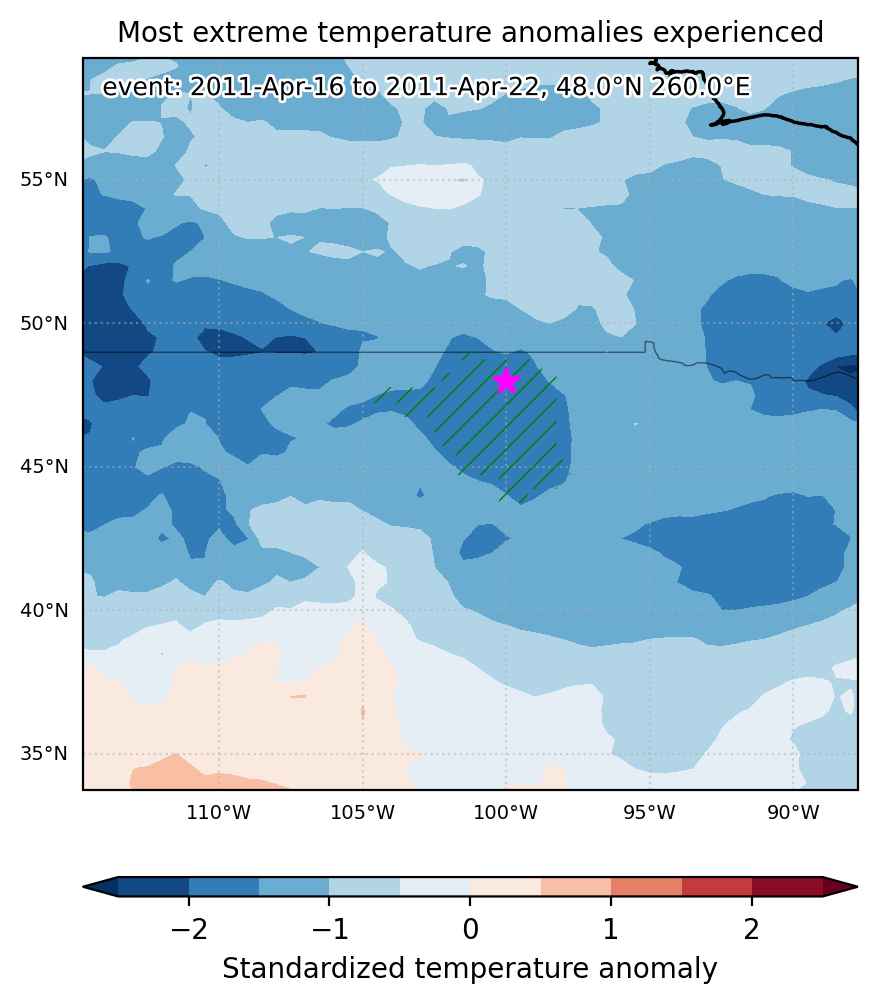
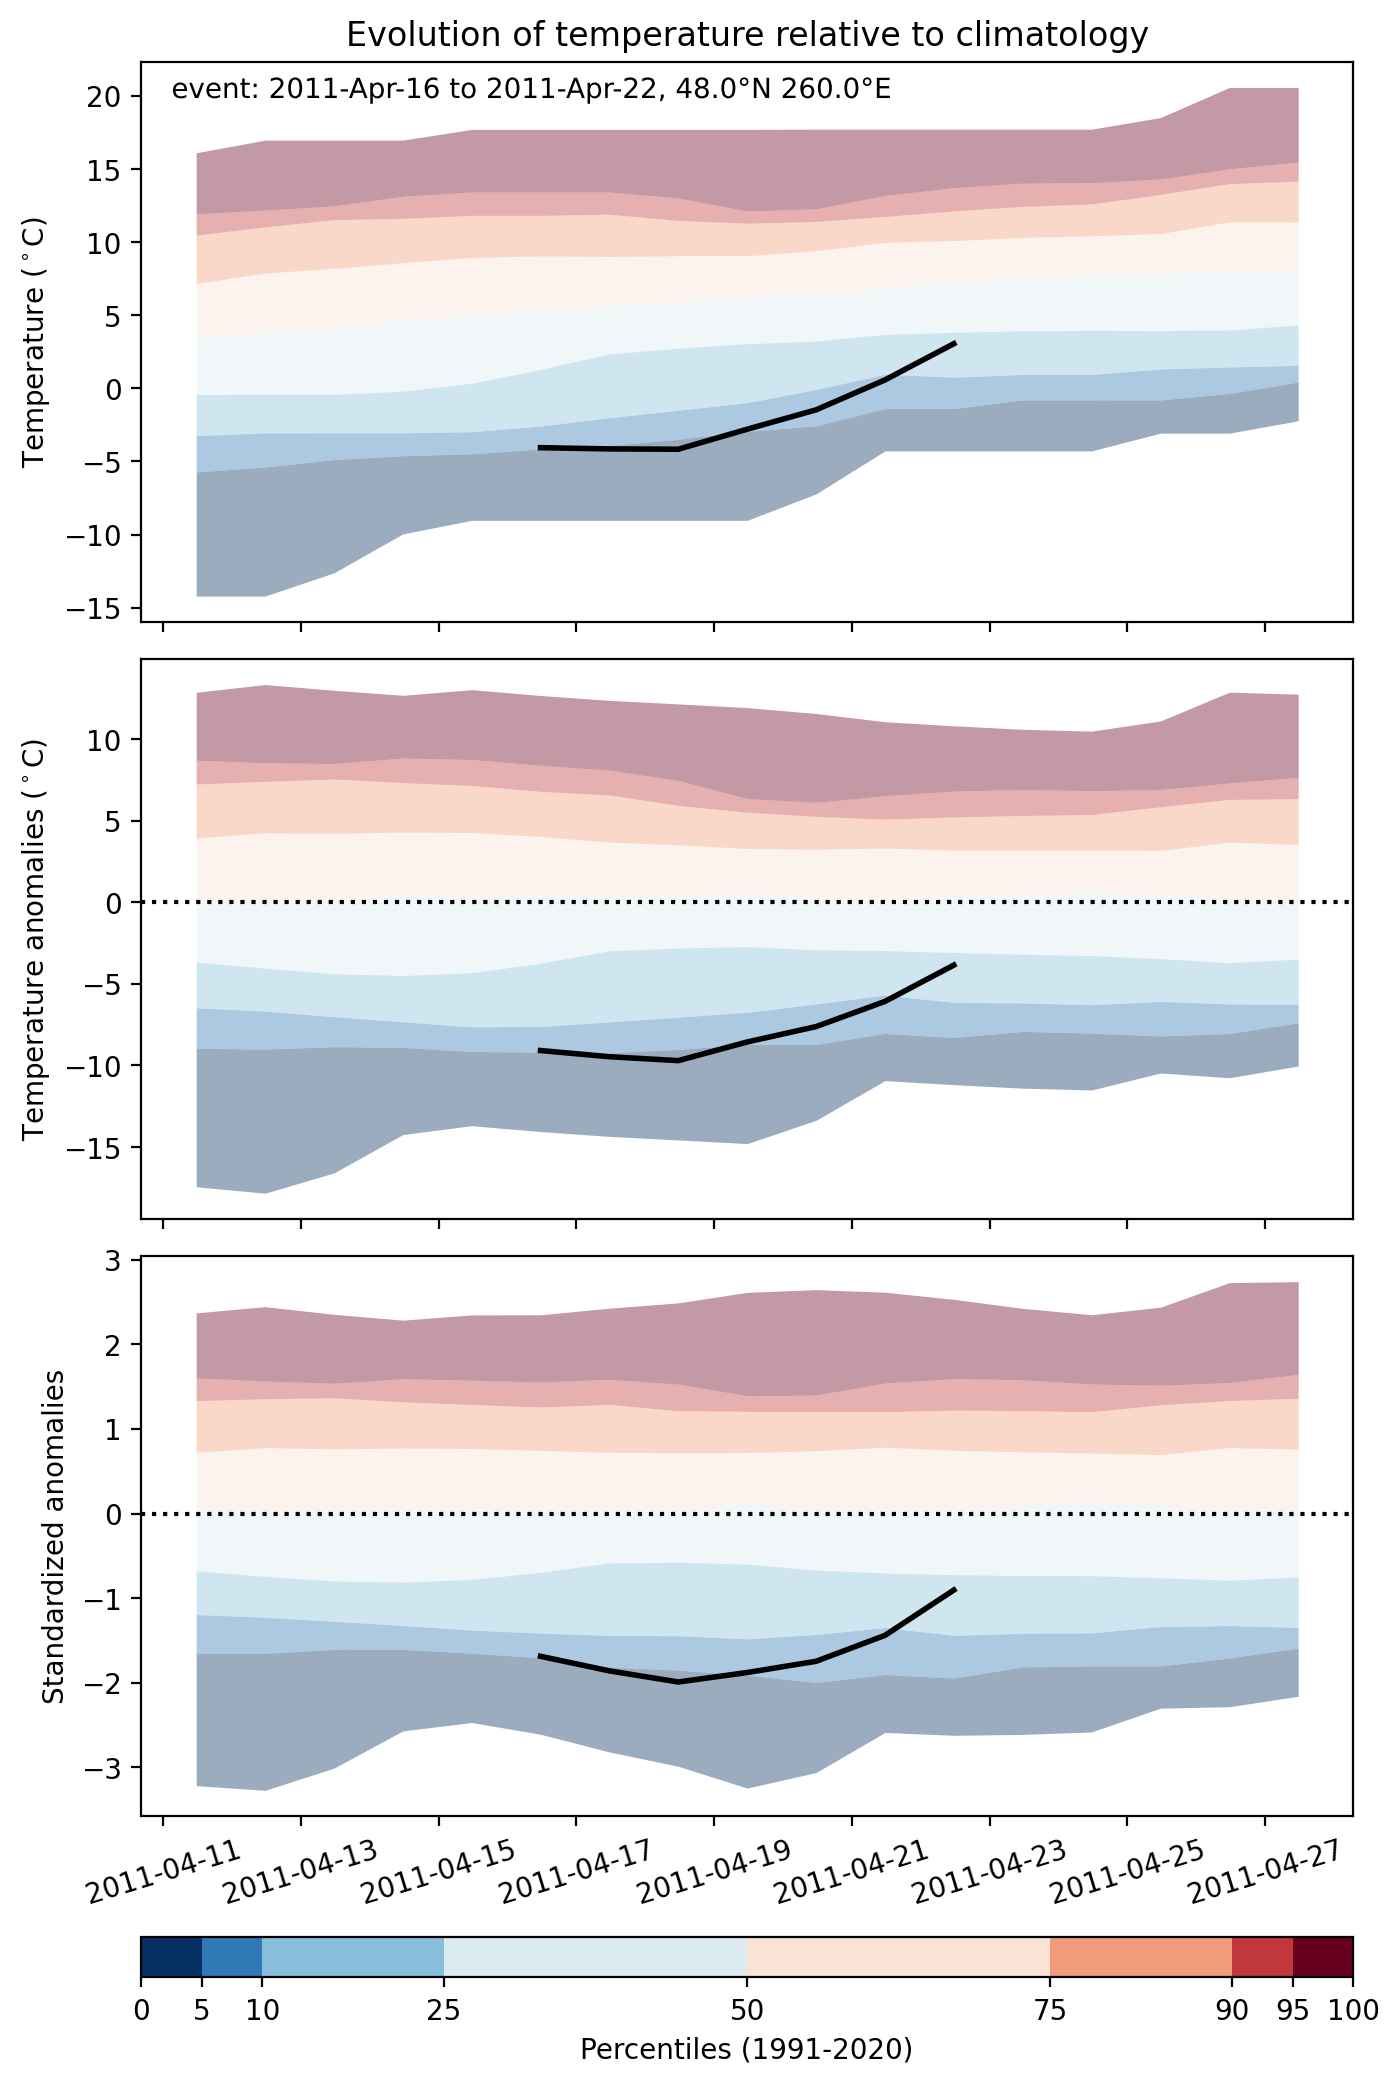
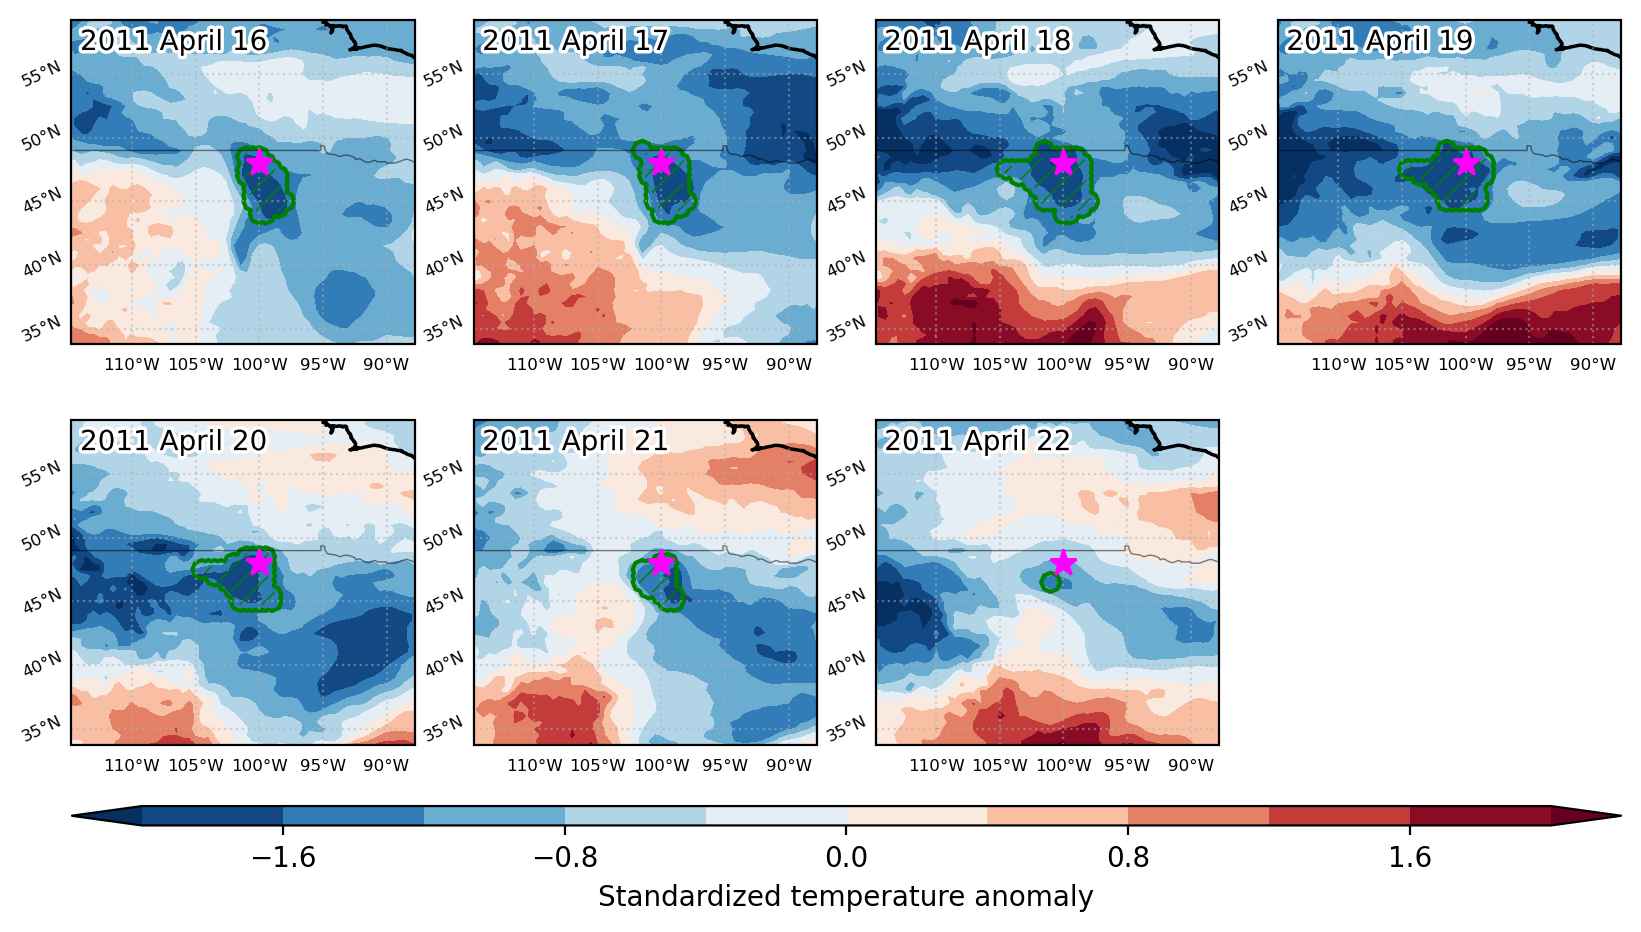
Cold spell occuring from April 16 2011 to April 22 2011 at 48.0°N 260.0°E

Download data: JSON

Event type: Cold spell

Countries affected (identified with ArcGIS Online; provided only for geographical reference):

  • Canada
  • United States

Duration: 7 days

Time span: April 16 2011 to April 22 2011

Statistics over entire affected area:

  • Mean temperature anomaly: -8.1 °C
  • Mean temperature: -1.6 °C
  • Minimum temperature anomaly: -10.8 °C
  • Minimum temperature: -5.1 °C

Event center: 48.0°N 260.0°E

Area affected: 161398 km$^2$


Fig. 1: Map of most extreme temperature anomalies (standardized) experienced during the event. The purple star indicates the center of the extreme event. Green hatching illustrates all areas under the effect of extremes at some time during the event.


Fig. 2: Evolution of temperature at the center of the event. The climatological percentile distribution is illustrated with color shadings.


Fig. 3: Maps illustrating the evolution of standardized temperature anomalies during the event.

Event ID: Cold_spell_2011-Apr-16_to_2011-Apr-22_260.0_48.0

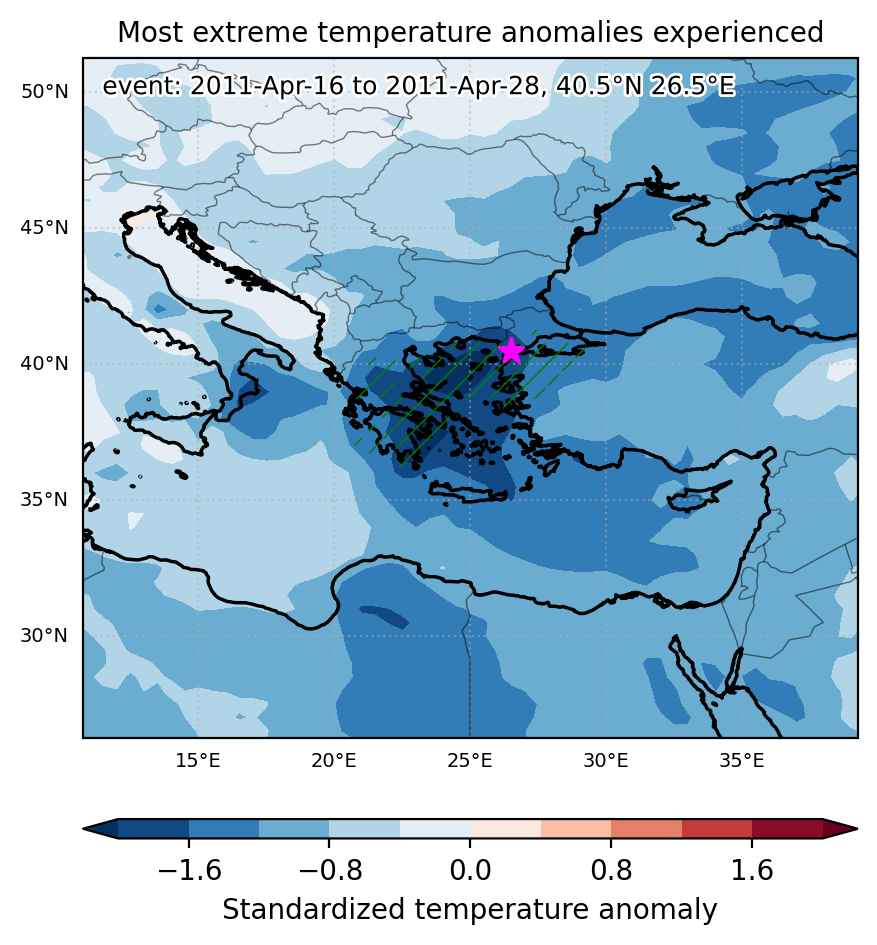
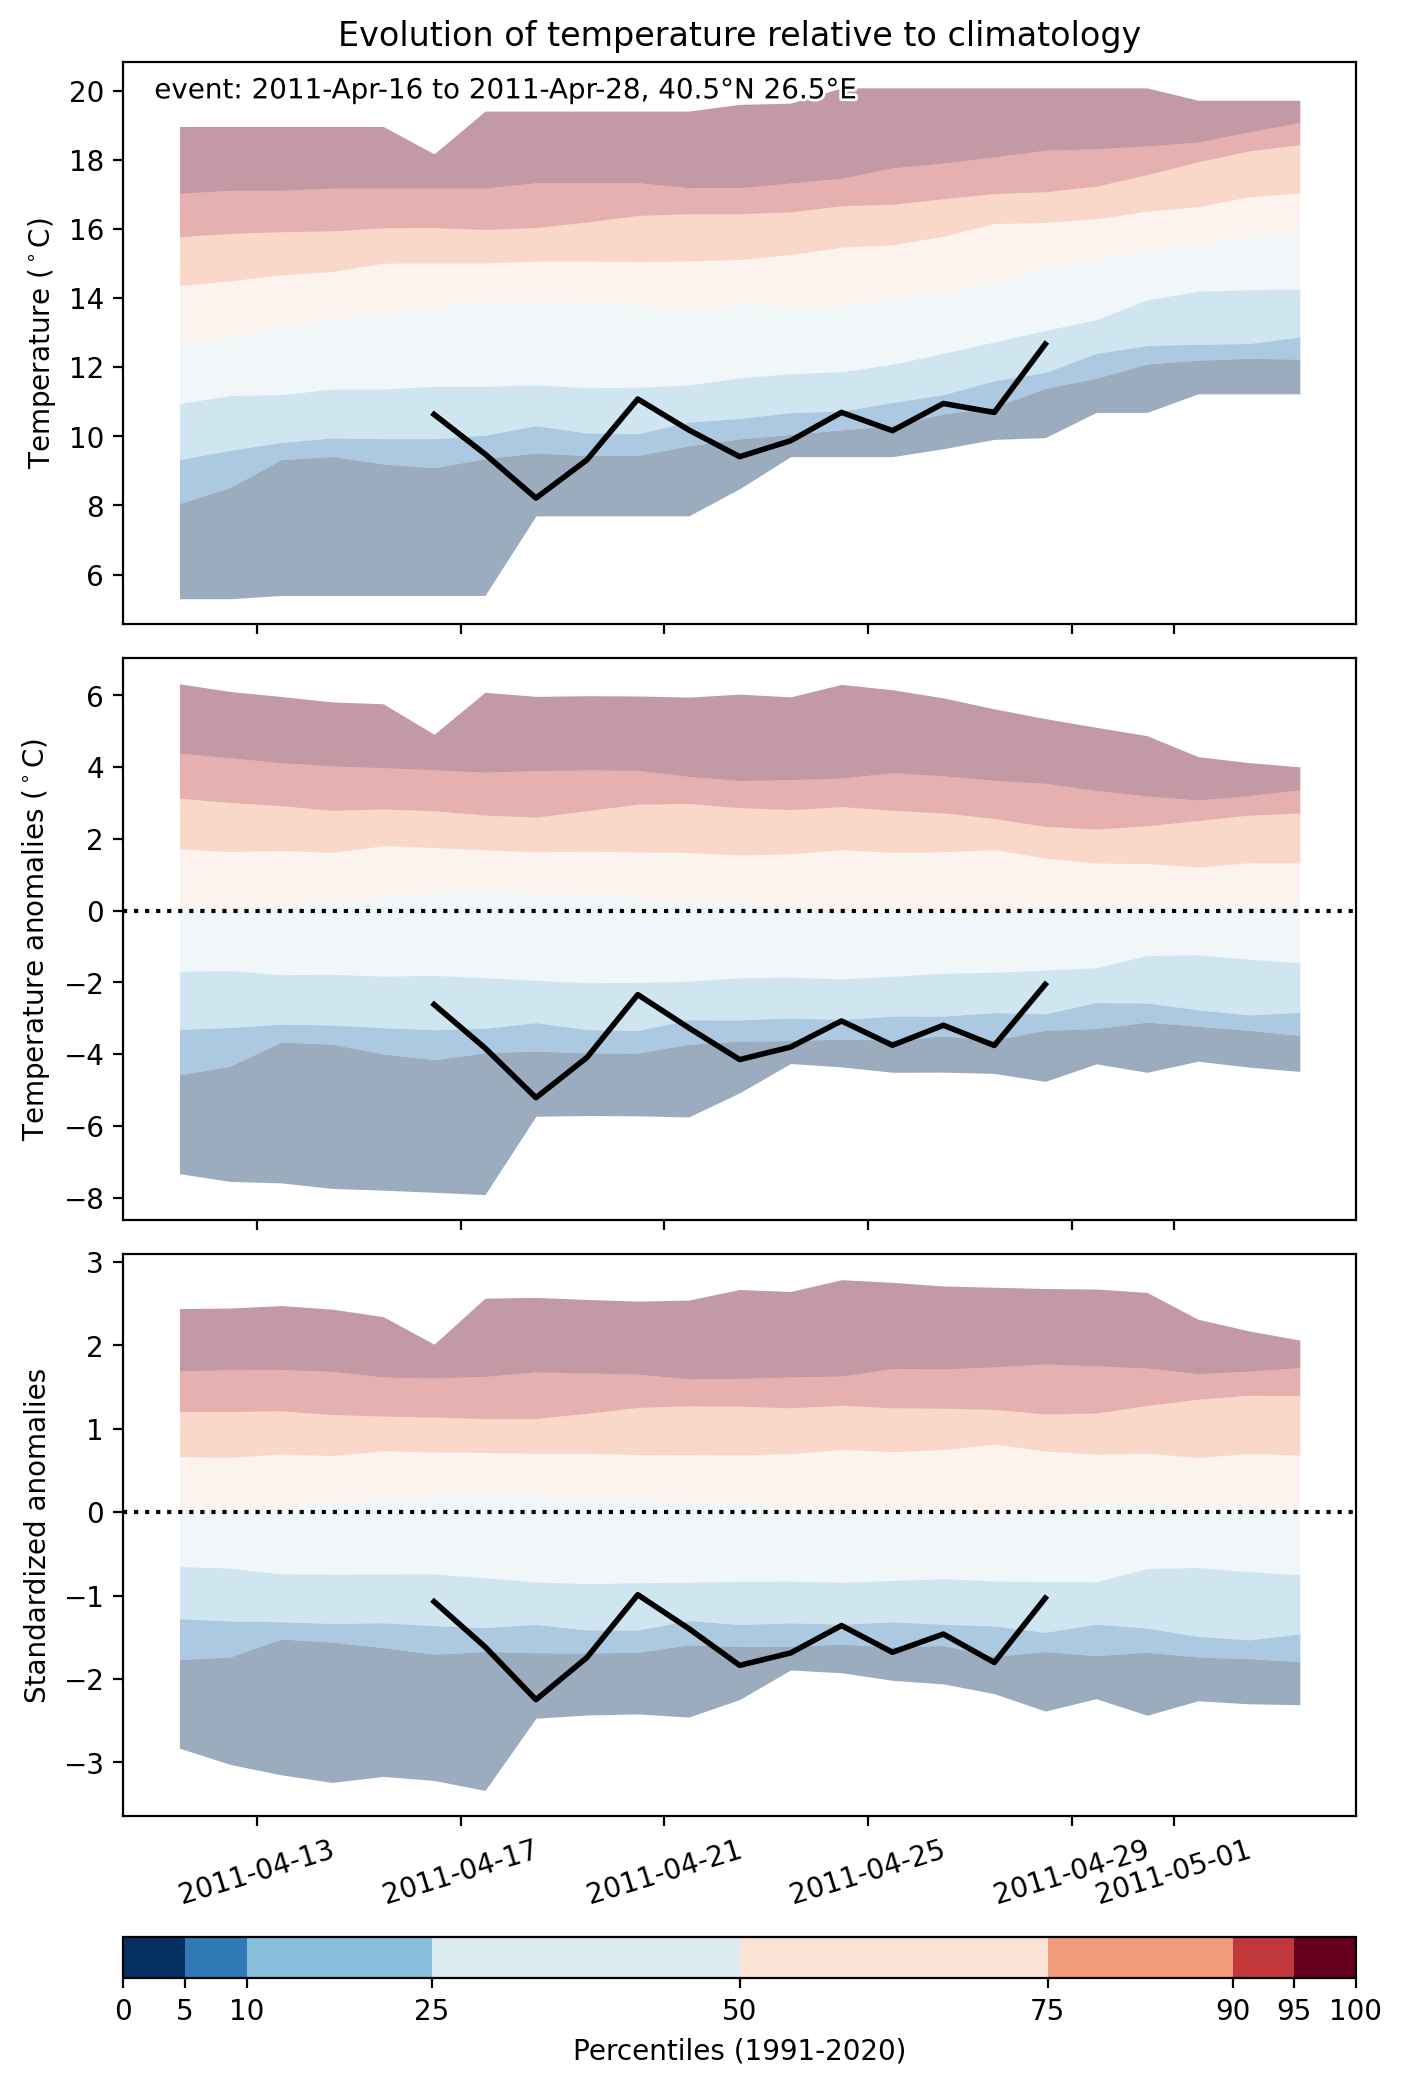
Cold spell occuring from April 16 2011 to April 28 2011 at 40.5°N 26.5°E

Download data: JSON

Event type: Cold spell

Countries affected (identified with ArcGIS Online; provided only for geographical reference):

  • Greece
  • Turkiye

Duration: 13 days

Time span: April 16 2011 to April 28 2011

Statistics over entire affected area:

  • Mean temperature anomaly: -3.6 °C
  • Mean temperature: 10.6 °C
  • Minimum temperature anomaly: -6.2 °C
  • Minimum temperature: 3.7 °C

Event center: 40.5°N 26.5°E

Area affected: 172737 km$^2$


Fig. 1: Map of most extreme temperature anomalies (standardized) experienced during the event. The purple star indicates the center of the extreme event. Green hatching illustrates all areas under the effect of extremes at some time during the event.


Fig. 2: Evolution of temperature at the center of the event. The climatological percentile distribution is illustrated with color shadings.


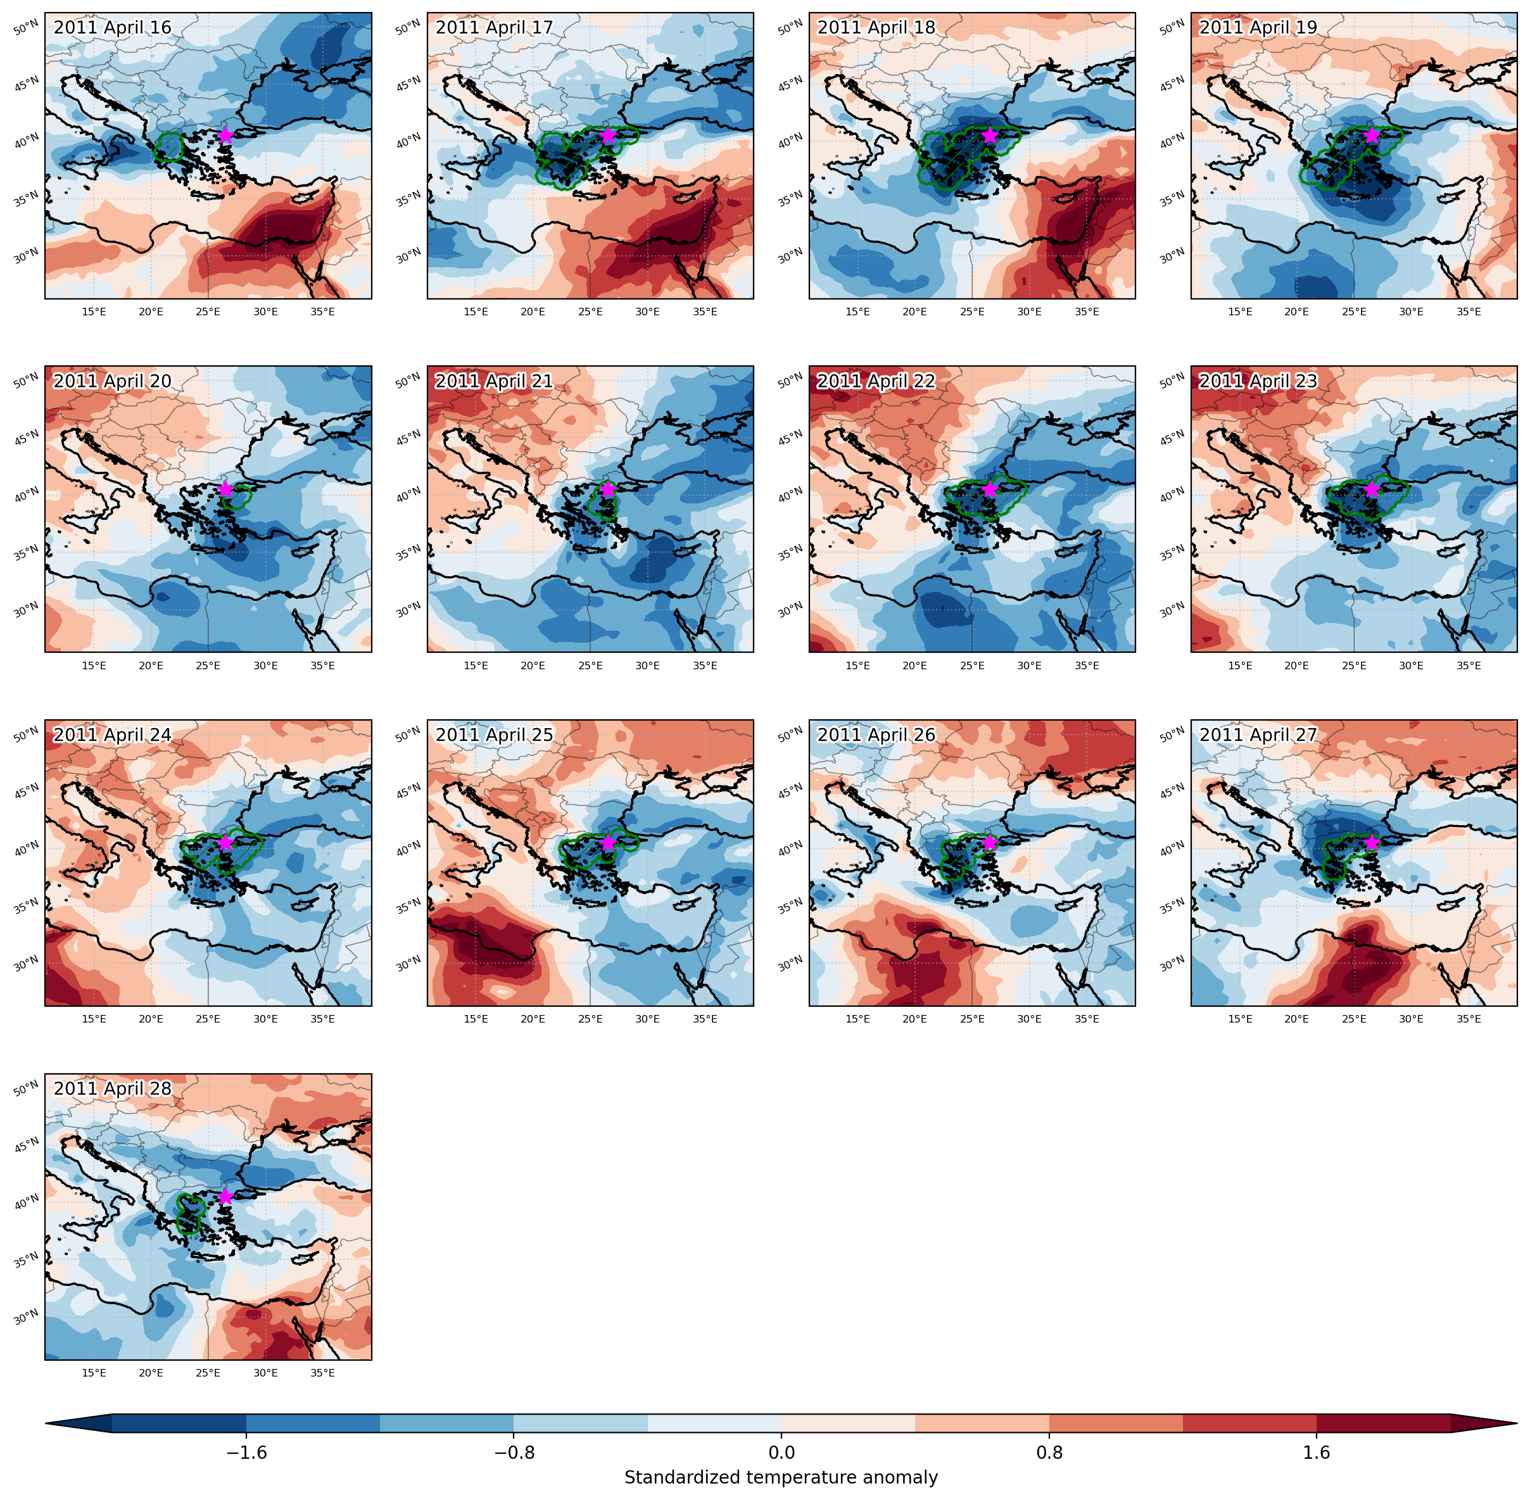
Fig. 3: Maps illustrating the evolution of standardized temperature anomalies during the event.

Event ID: Cold_spell_2011-Apr-16_to_2011-Apr-28_26.5_40.5

Cold spell occuring from April 16 2011 to April 20 2011 at 37.0°N 131.0°E

Download data: JSON

Event type: Cold spell

Countries affected (identified with ArcGIS Online; provided only for geographical reference):

  • Japan

Duration: 5 days

Time span: April 16 2011 to April 20 2011

Statistics over entire affected area:

  • Mean temperature anomaly: -4.1 °C
  • Mean temperature: 9.9 °C
  • Minimum temperature anomaly: -7.4 °C
  • Minimum temperature: 5.9 °C

Event center: 37.0°N 131.0°E

Area affected: 83668 km$^2$


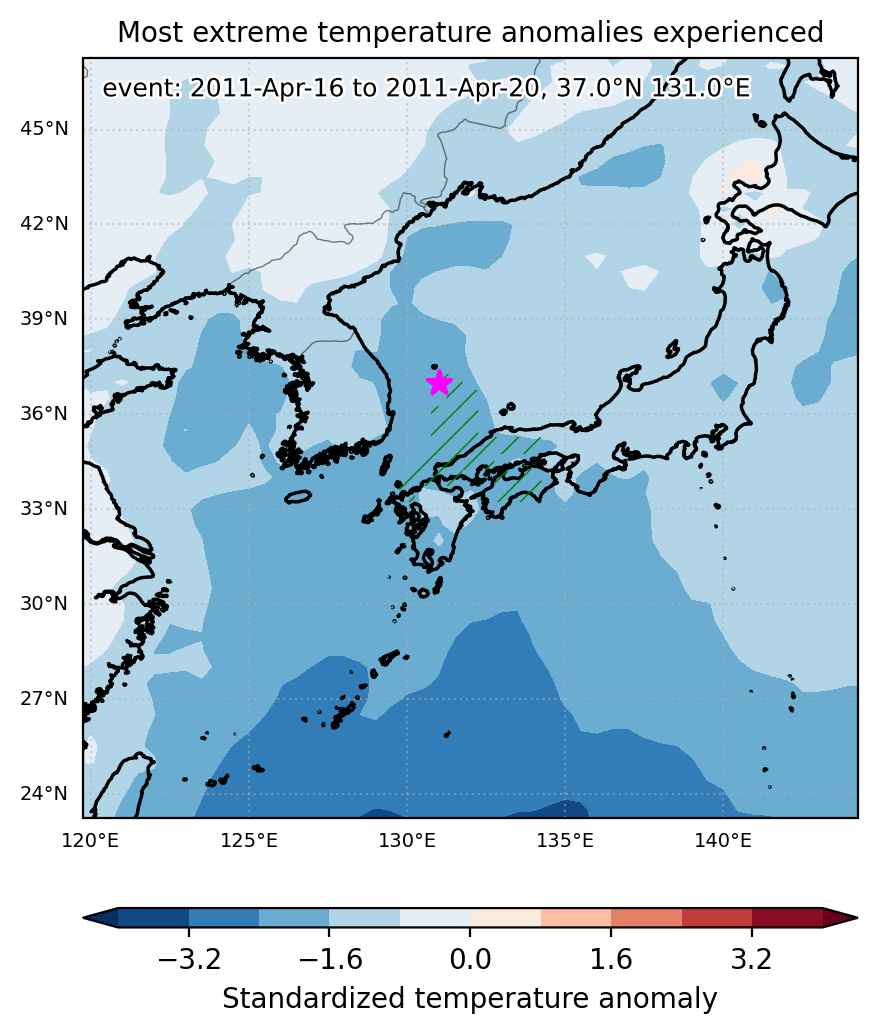
Fig. 1: Map of most extreme temperature anomalies (standardized) experienced during the event. The purple star indicates the center of the extreme event. Green hatching illustrates all areas under the effect of extremes at some time during the event.


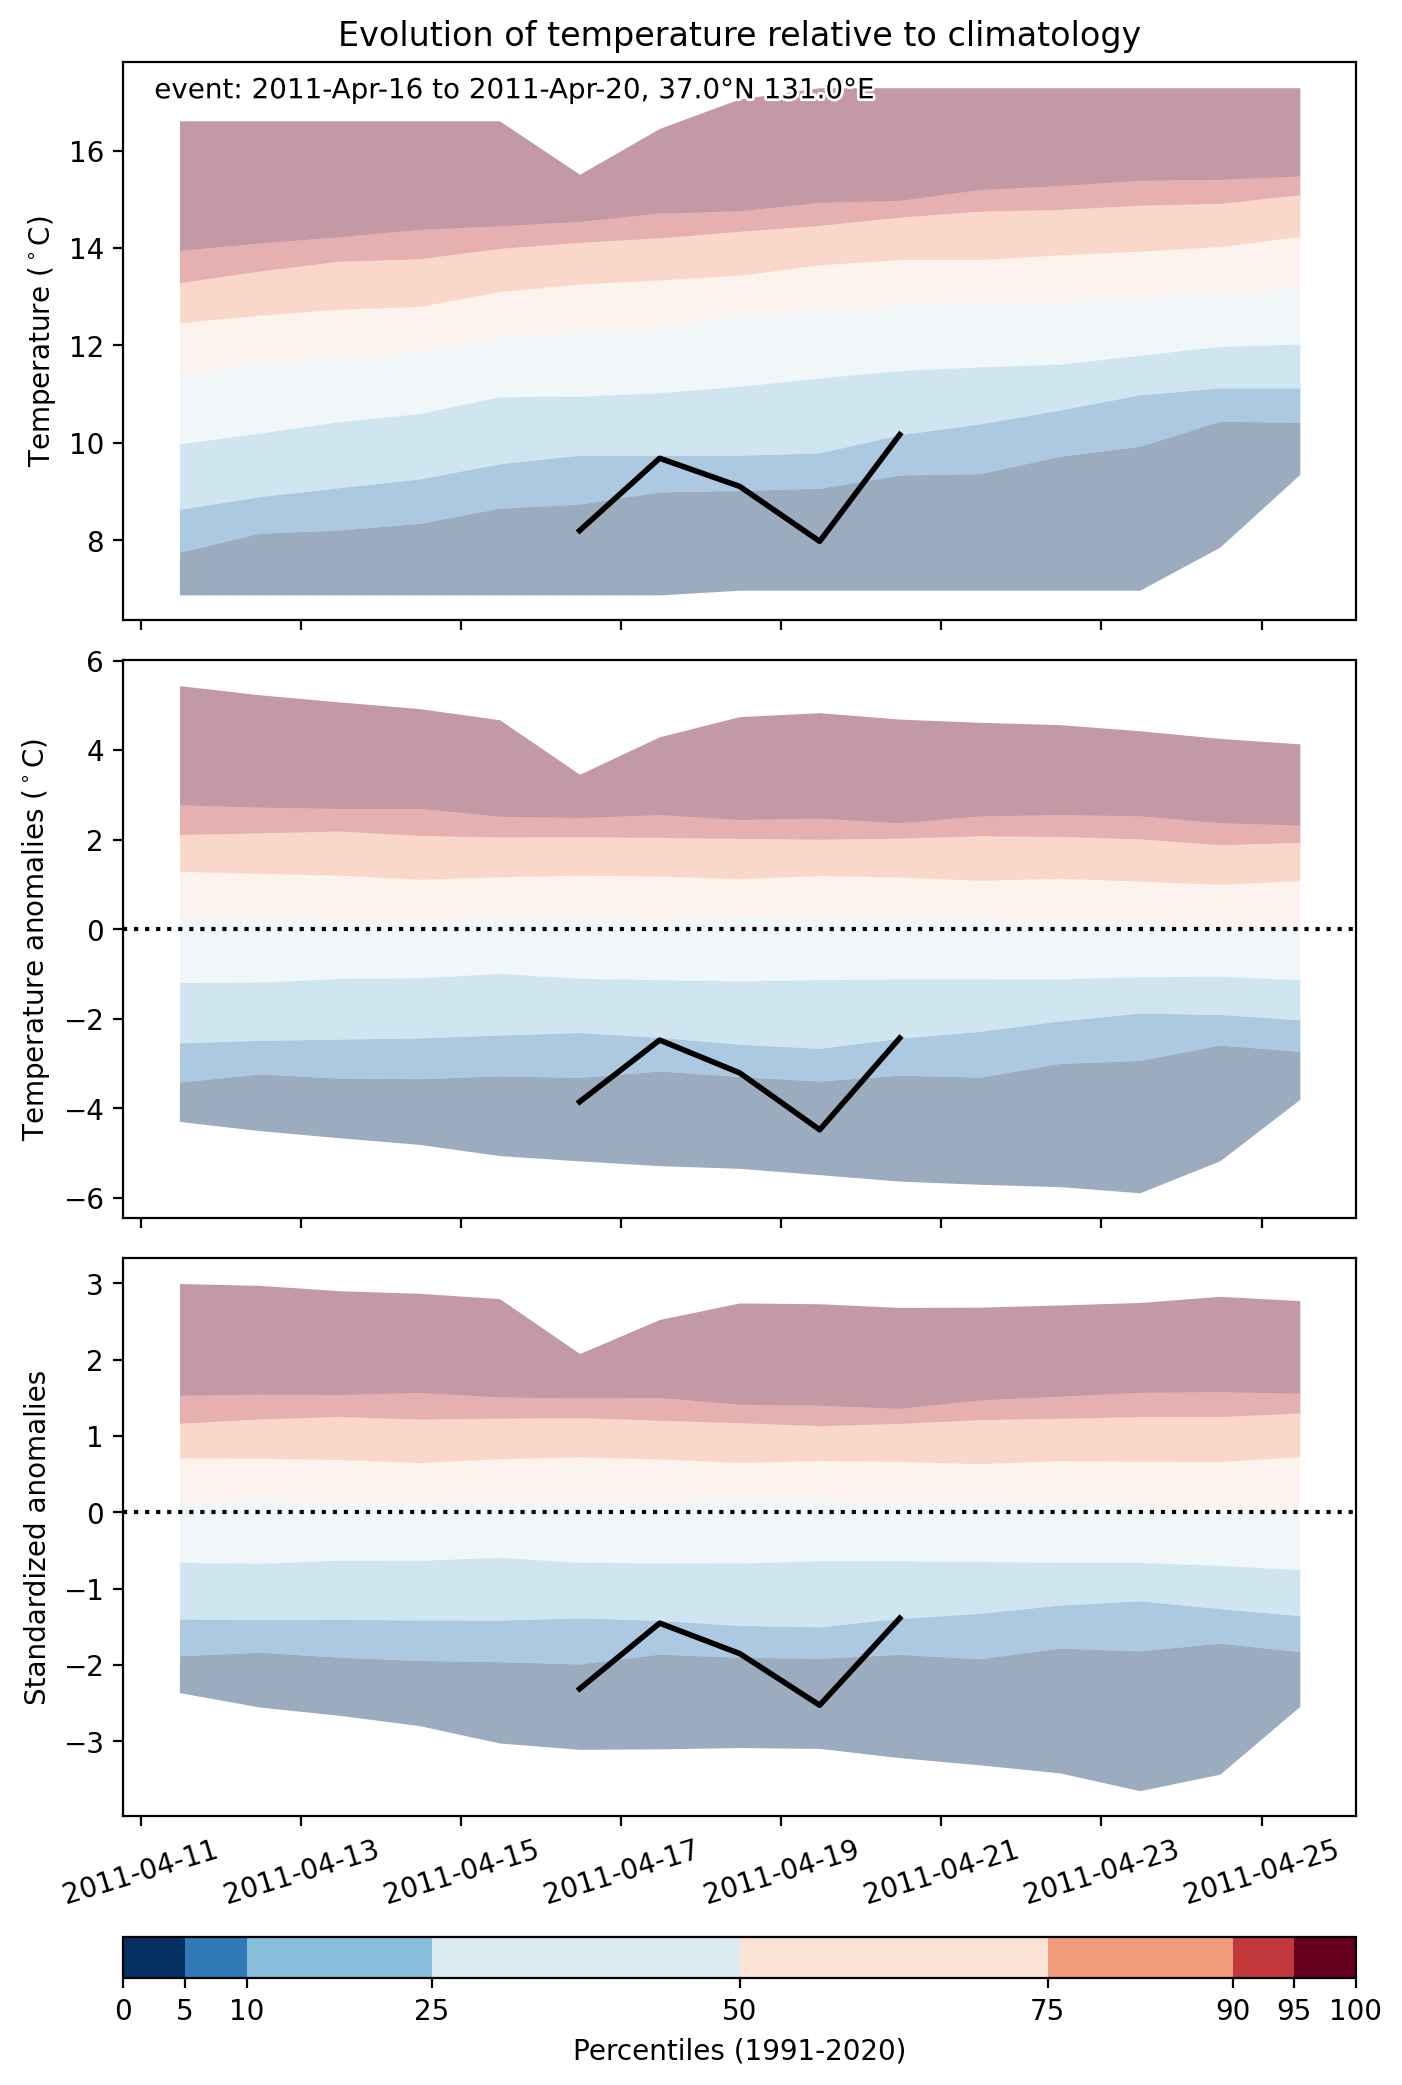
Fig. 2: Evolution of temperature at the center of the event. The climatological percentile distribution is illustrated with color shadings.


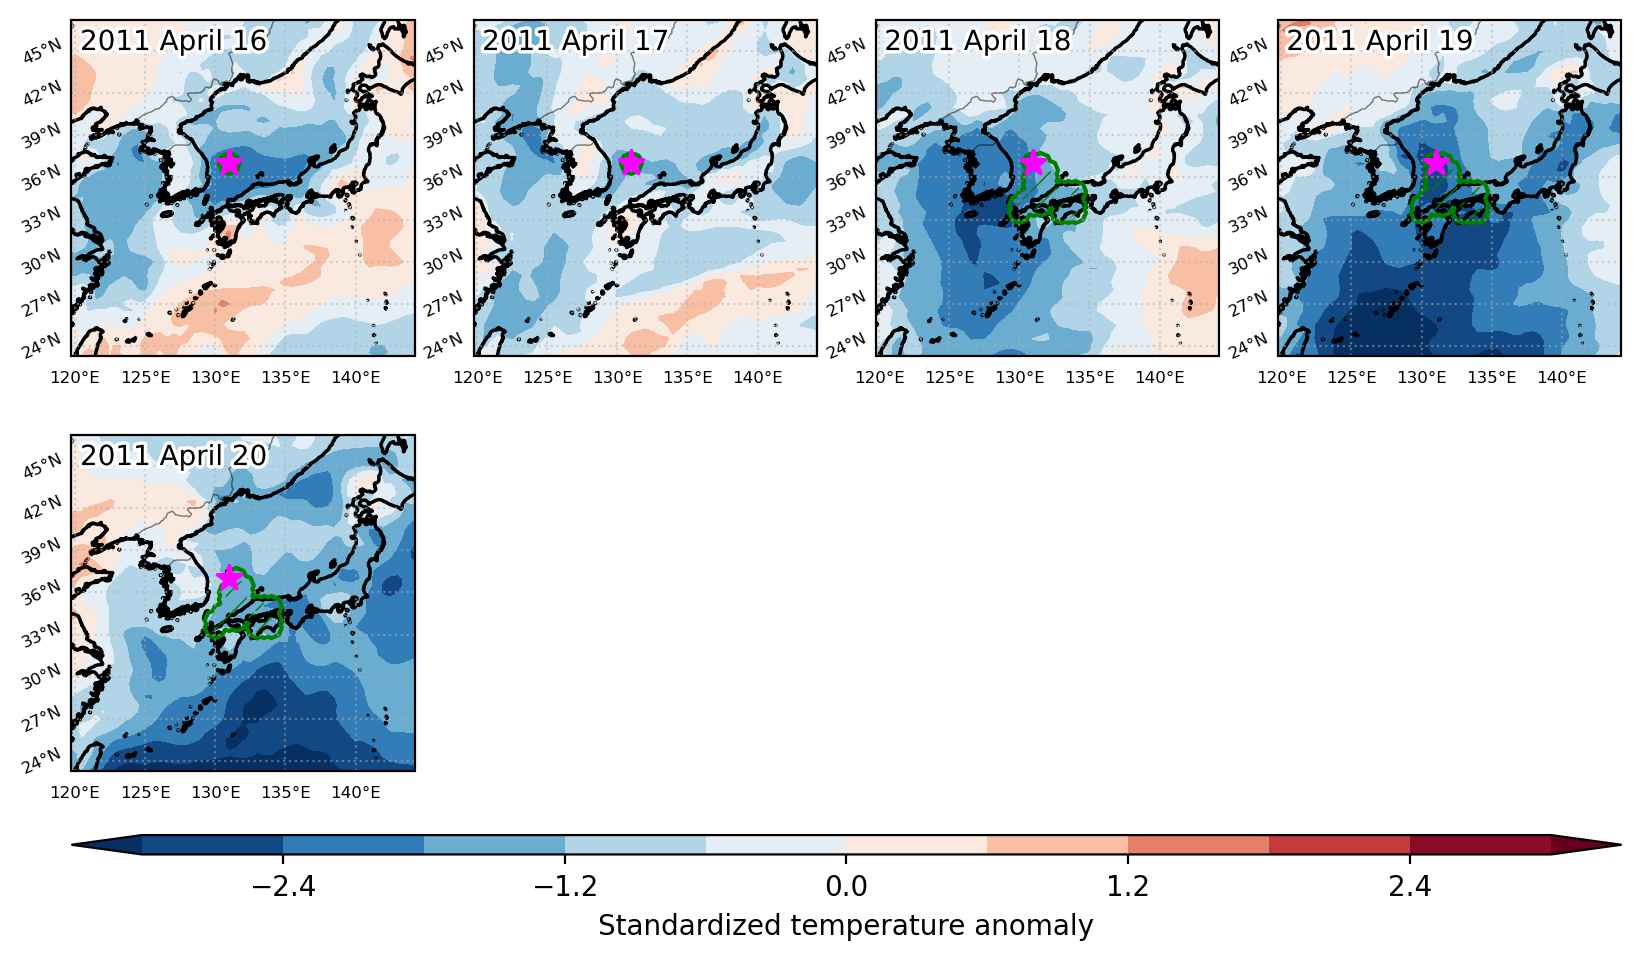
Fig. 3: Maps illustrating the evolution of standardized temperature anomalies during the event.

Event ID: Cold_spell_2011-Apr-16_to_2011-Apr-20_131.0_37.0

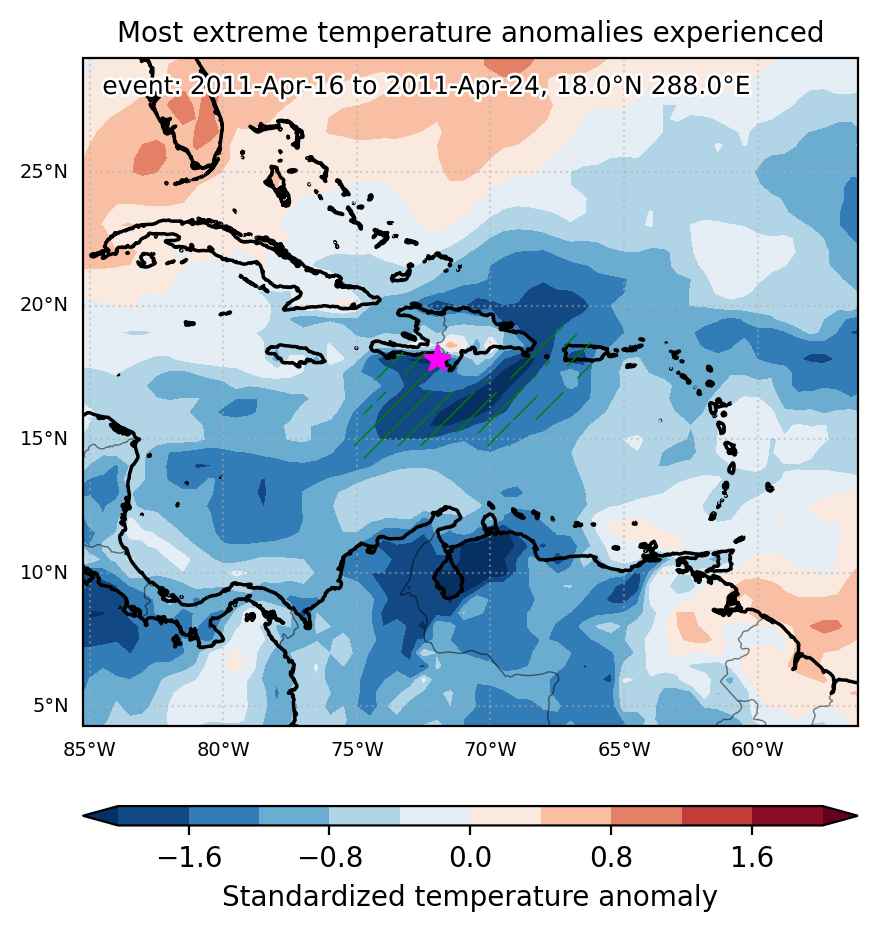
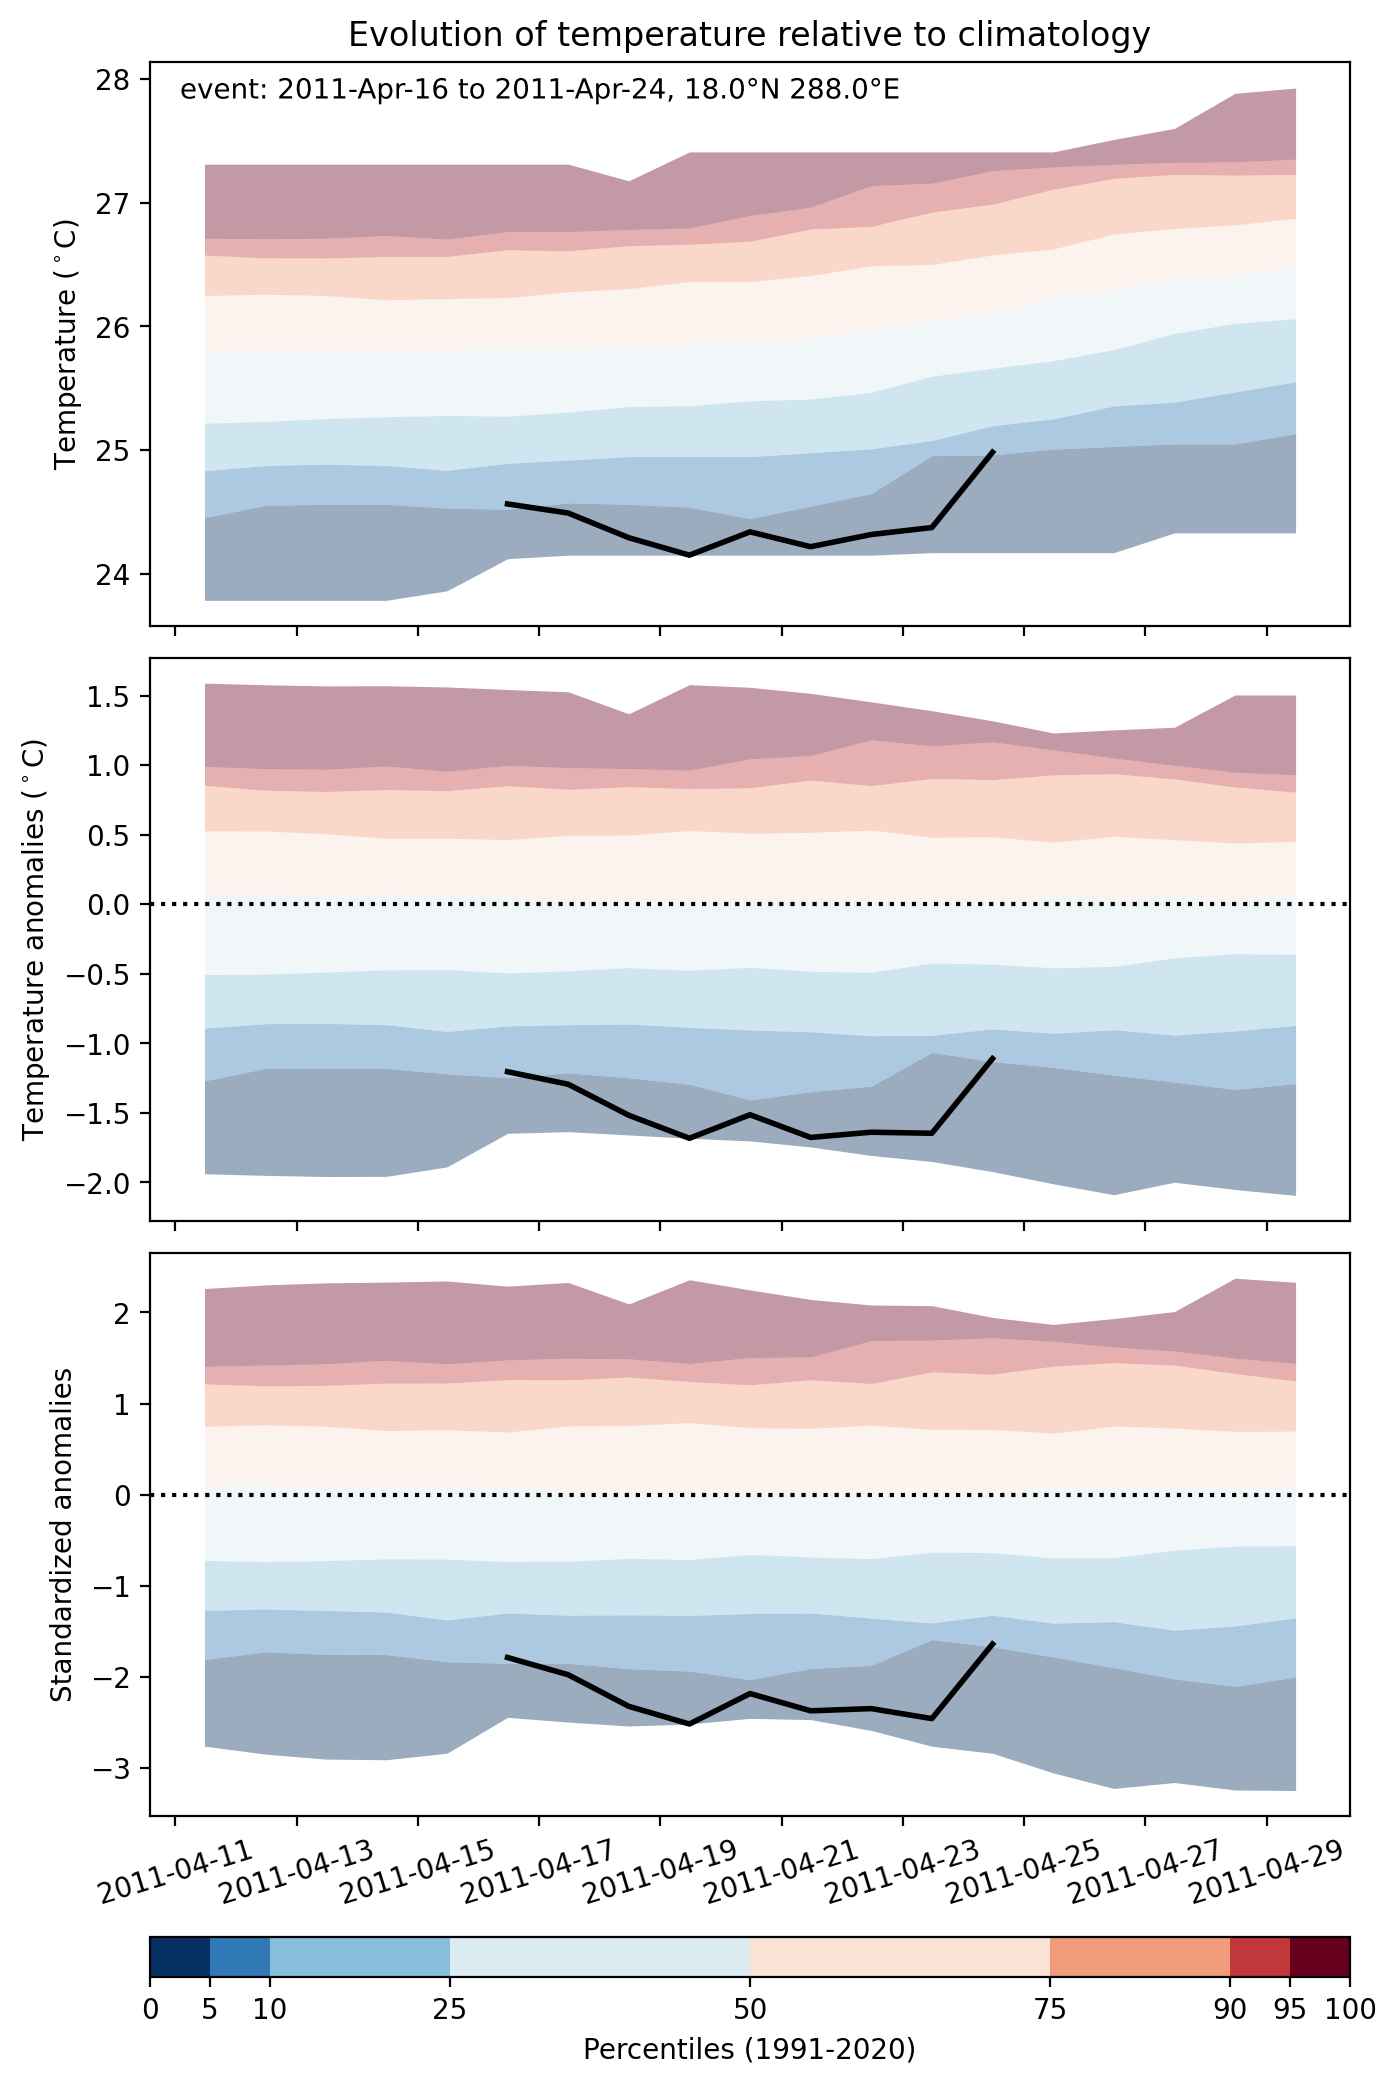
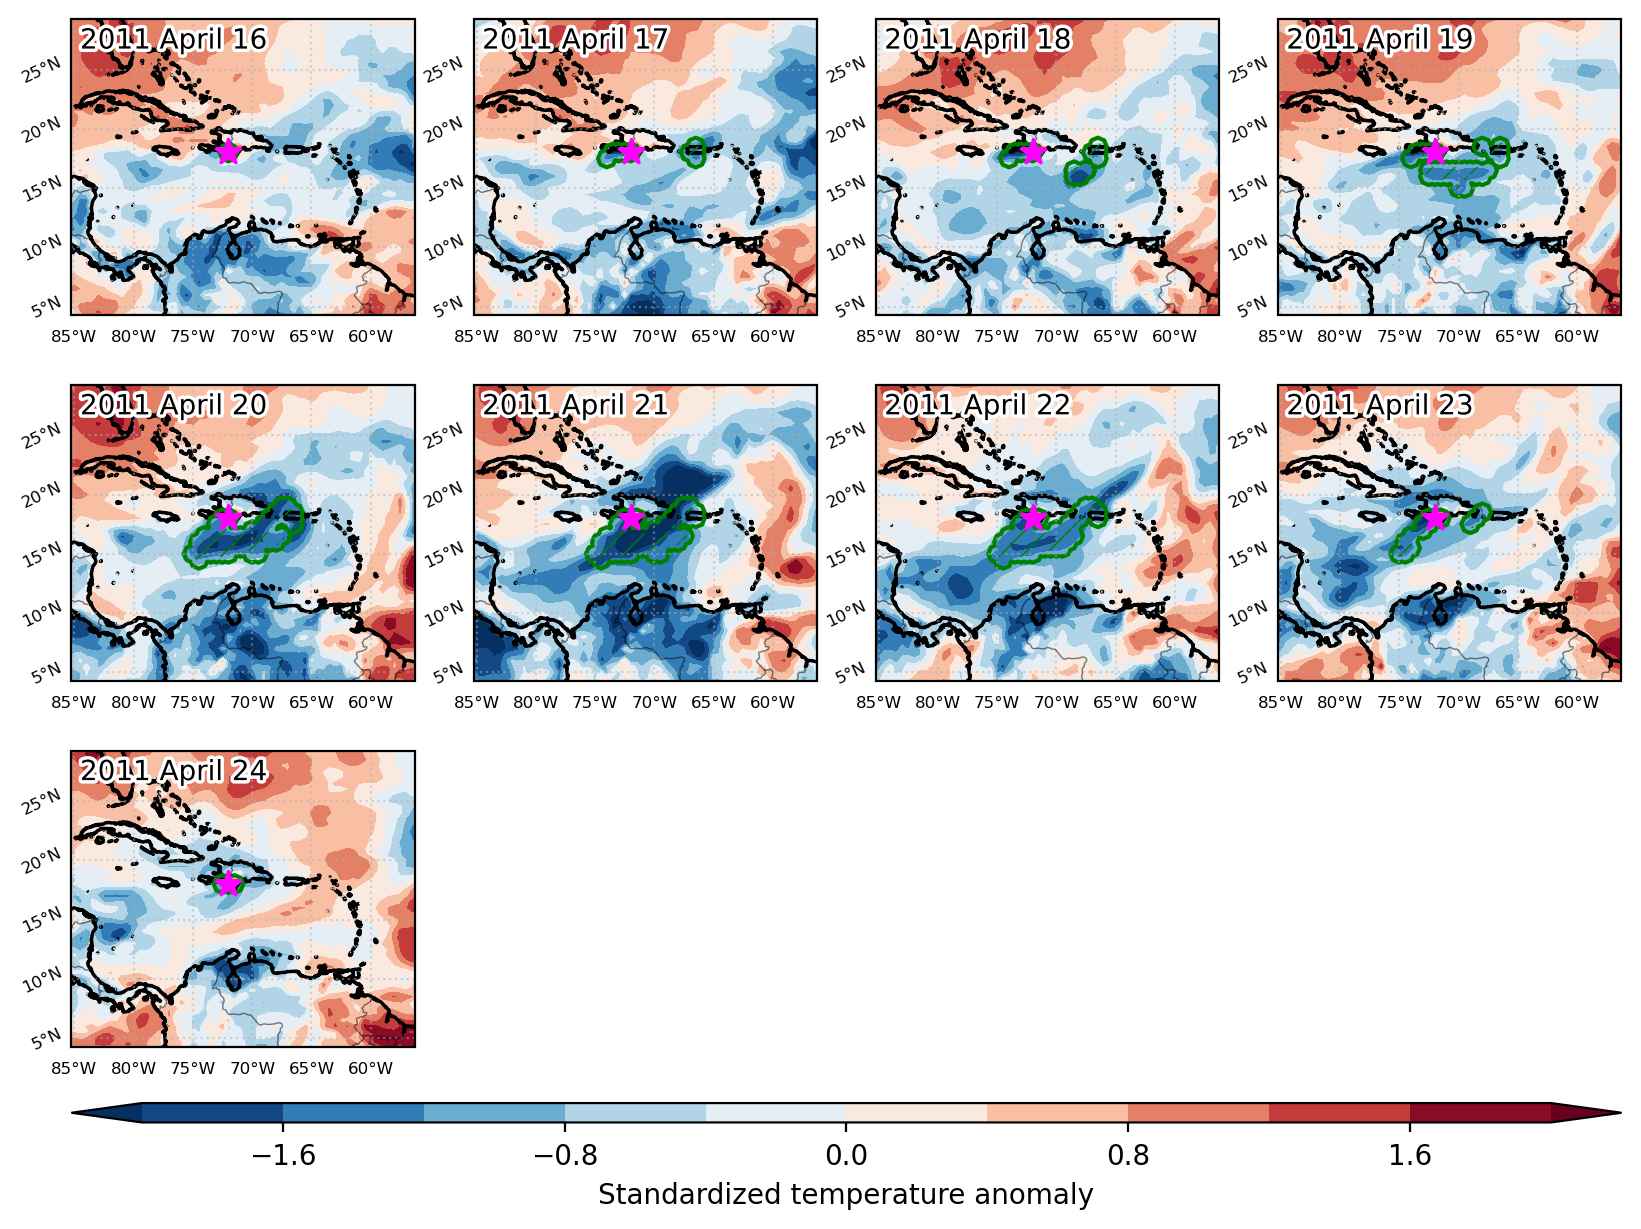
Cold spell occuring from April 16 2011 to April 24 2011 at 18.0°N 288.0°E

Download data: JSON

Event type: Cold spell

Countries affected (identified with ArcGIS Online; provided only for geographical reference):

  • Dominican Republic
  • Puerto Rico

Duration: 9 days

Time span: April 16 2011 to April 24 2011

Statistics over entire affected area:

  • Mean temperature anomaly: -0.9 °C
  • Mean temperature: 25.2 °C
  • Minimum temperature anomaly: -1.7 °C
  • Minimum temperature: 22.6 °C

Event center: 18.0°N 288.0°E

Area affected: 213367 km$^2$


Fig. 1: Map of most extreme temperature anomalies (standardized) experienced during the event. The purple star indicates the center of the extreme event. Green hatching illustrates all areas under the effect of extremes at some time during the event.


Fig. 2: Evolution of temperature at the center of the event. The climatological percentile distribution is illustrated with color shadings.


Fig. 3: Maps illustrating the evolution of standardized temperature anomalies during the event.

Event ID: Cold_spell_2011-Apr-16_to_2011-Apr-24_288.0_18.0

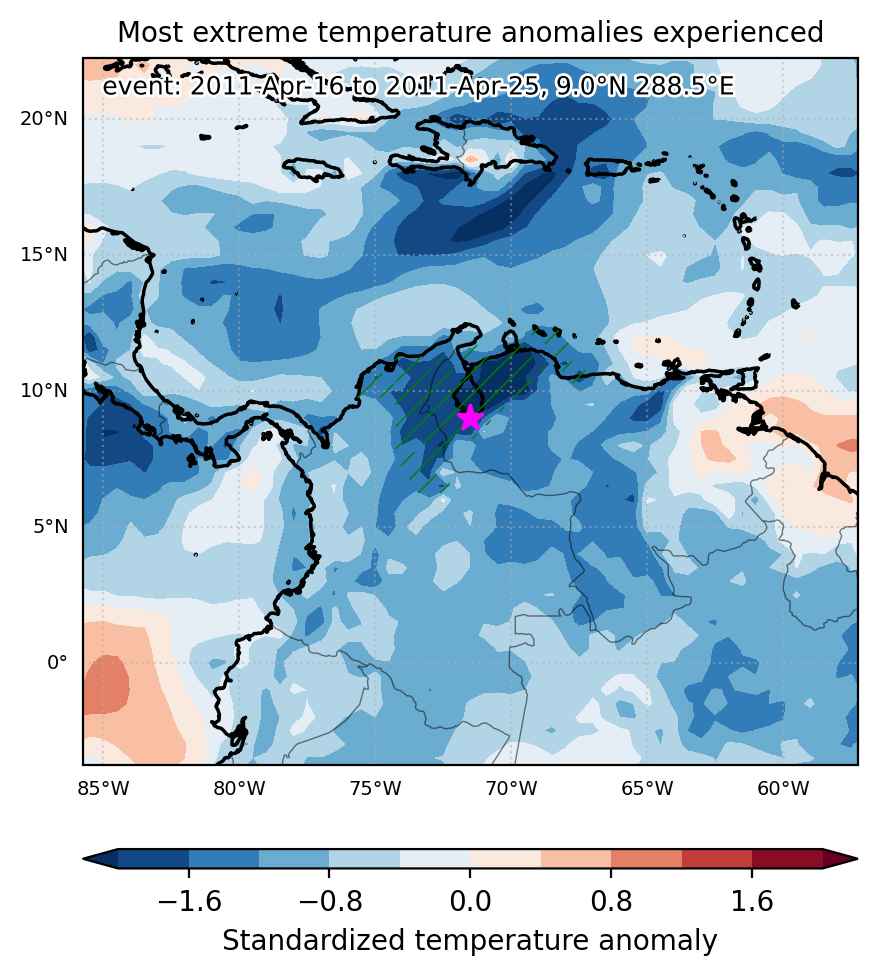
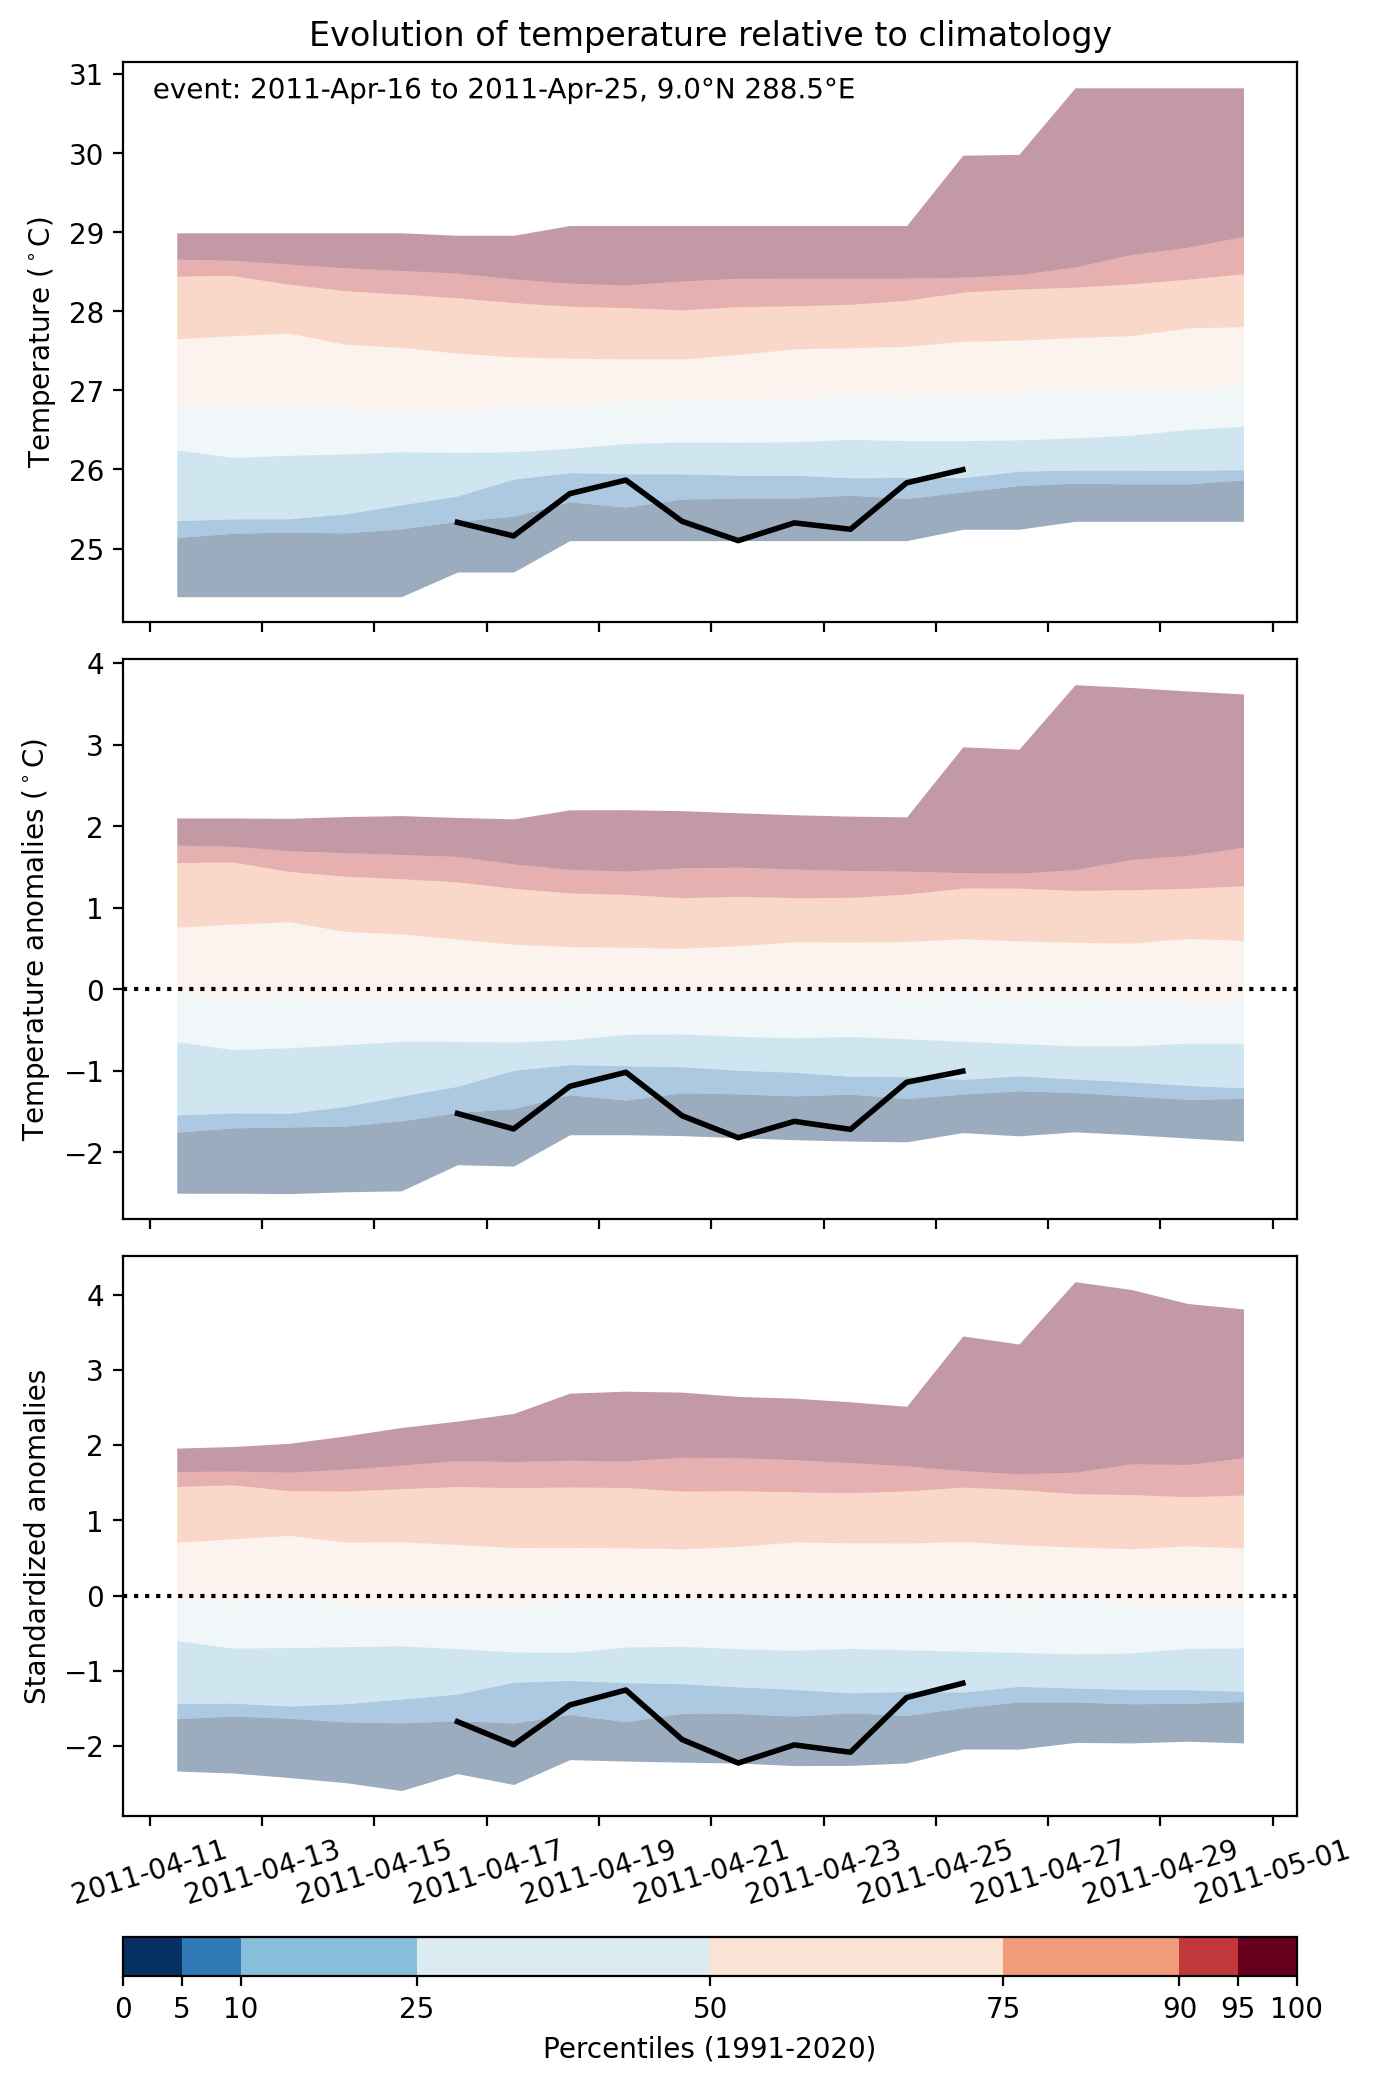
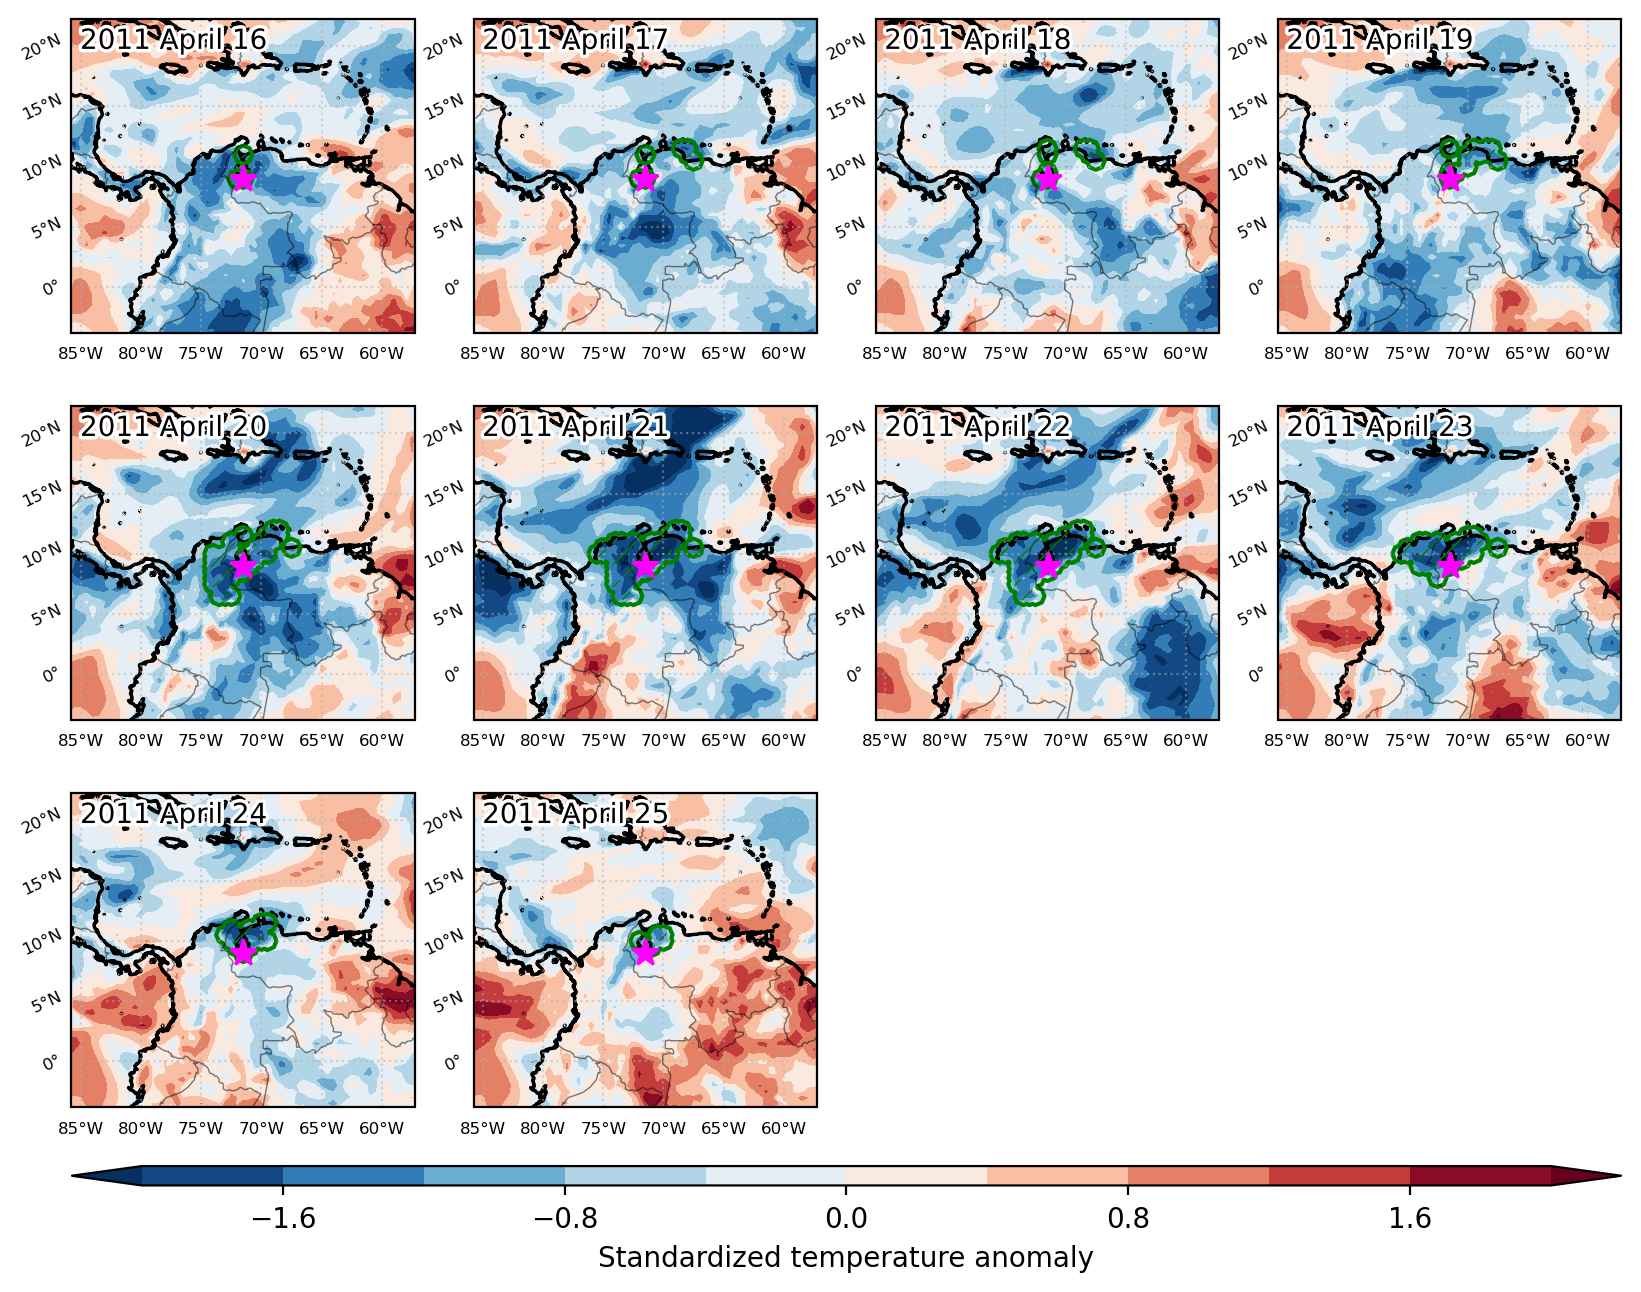
Cold spell occuring from April 16 2011 to April 25 2011 at 9.0°N 288.5°E

Download data: JSON

Event type: Cold spell

Countries affected (identified with ArcGIS Online; provided only for geographical reference):

  • Colombia
  • Venezuela

Duration: 10 days

Time span: April 16 2011 to April 25 2011

Statistics over entire affected area:

  • Mean temperature anomaly: -1.7 °C
  • Mean temperature: 23.8 °C
  • Minimum temperature anomaly: -3.6 °C
  • Minimum temperature: 9.8 °C

Event center: 9.0°N 288.5°E

Area affected: 225410 km$^2$


Fig. 1: Map of most extreme temperature anomalies (standardized) experienced during the event. The purple star indicates the center of the extreme event. Green hatching illustrates all areas under the effect of extremes at some time during the event.


Fig. 2: Evolution of temperature at the center of the event. The climatological percentile distribution is illustrated with color shadings.


Fig. 3: Maps illustrating the evolution of standardized temperature anomalies during the event.

Event ID: Cold_spell_2011-Apr-16_to_2011-Apr-25_288.5_9.0