Cold spell occuring from August 12 2010 to August 20 2010 at 41.5°N 350.5°E

Download data: JSON

Event type: Cold spell

Countries affected (identified with ArcGIS Online; provided only for geographical reference):

  • Madeira

Duration: 9 days

Time span: August 12 2010 to August 20 2010

Statistics over entire affected area:

  • Mean temperature anomaly: -1.1 °C
  • Mean temperature: 20.6 °C
  • Minimum temperature anomaly: -1.6 °C
  • Minimum temperature: 16.4 °C

Event center: 41.5°N 350.5°E

Area affected: 774307 km$^2$
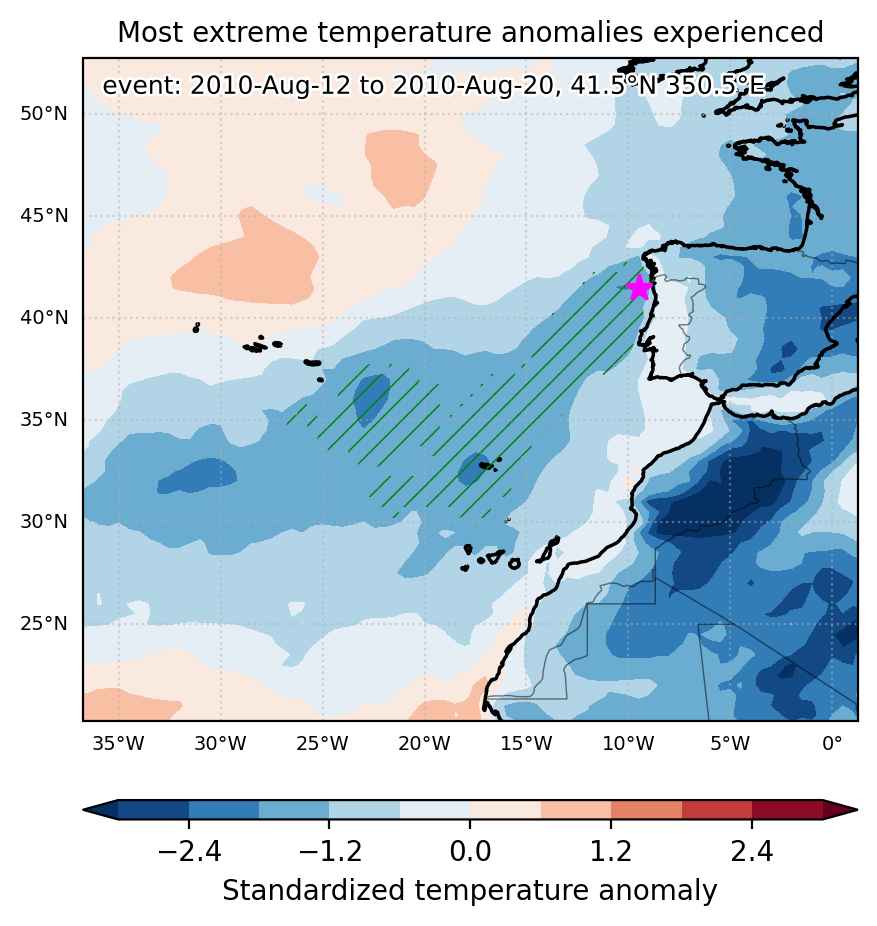

Fig. 1: Map of most extreme temperature anomalies (standardized) experienced during the event. The purple star indicates the center of the extreme event. Green hatching illustrates all areas under the effect of extremes at some time during the event.
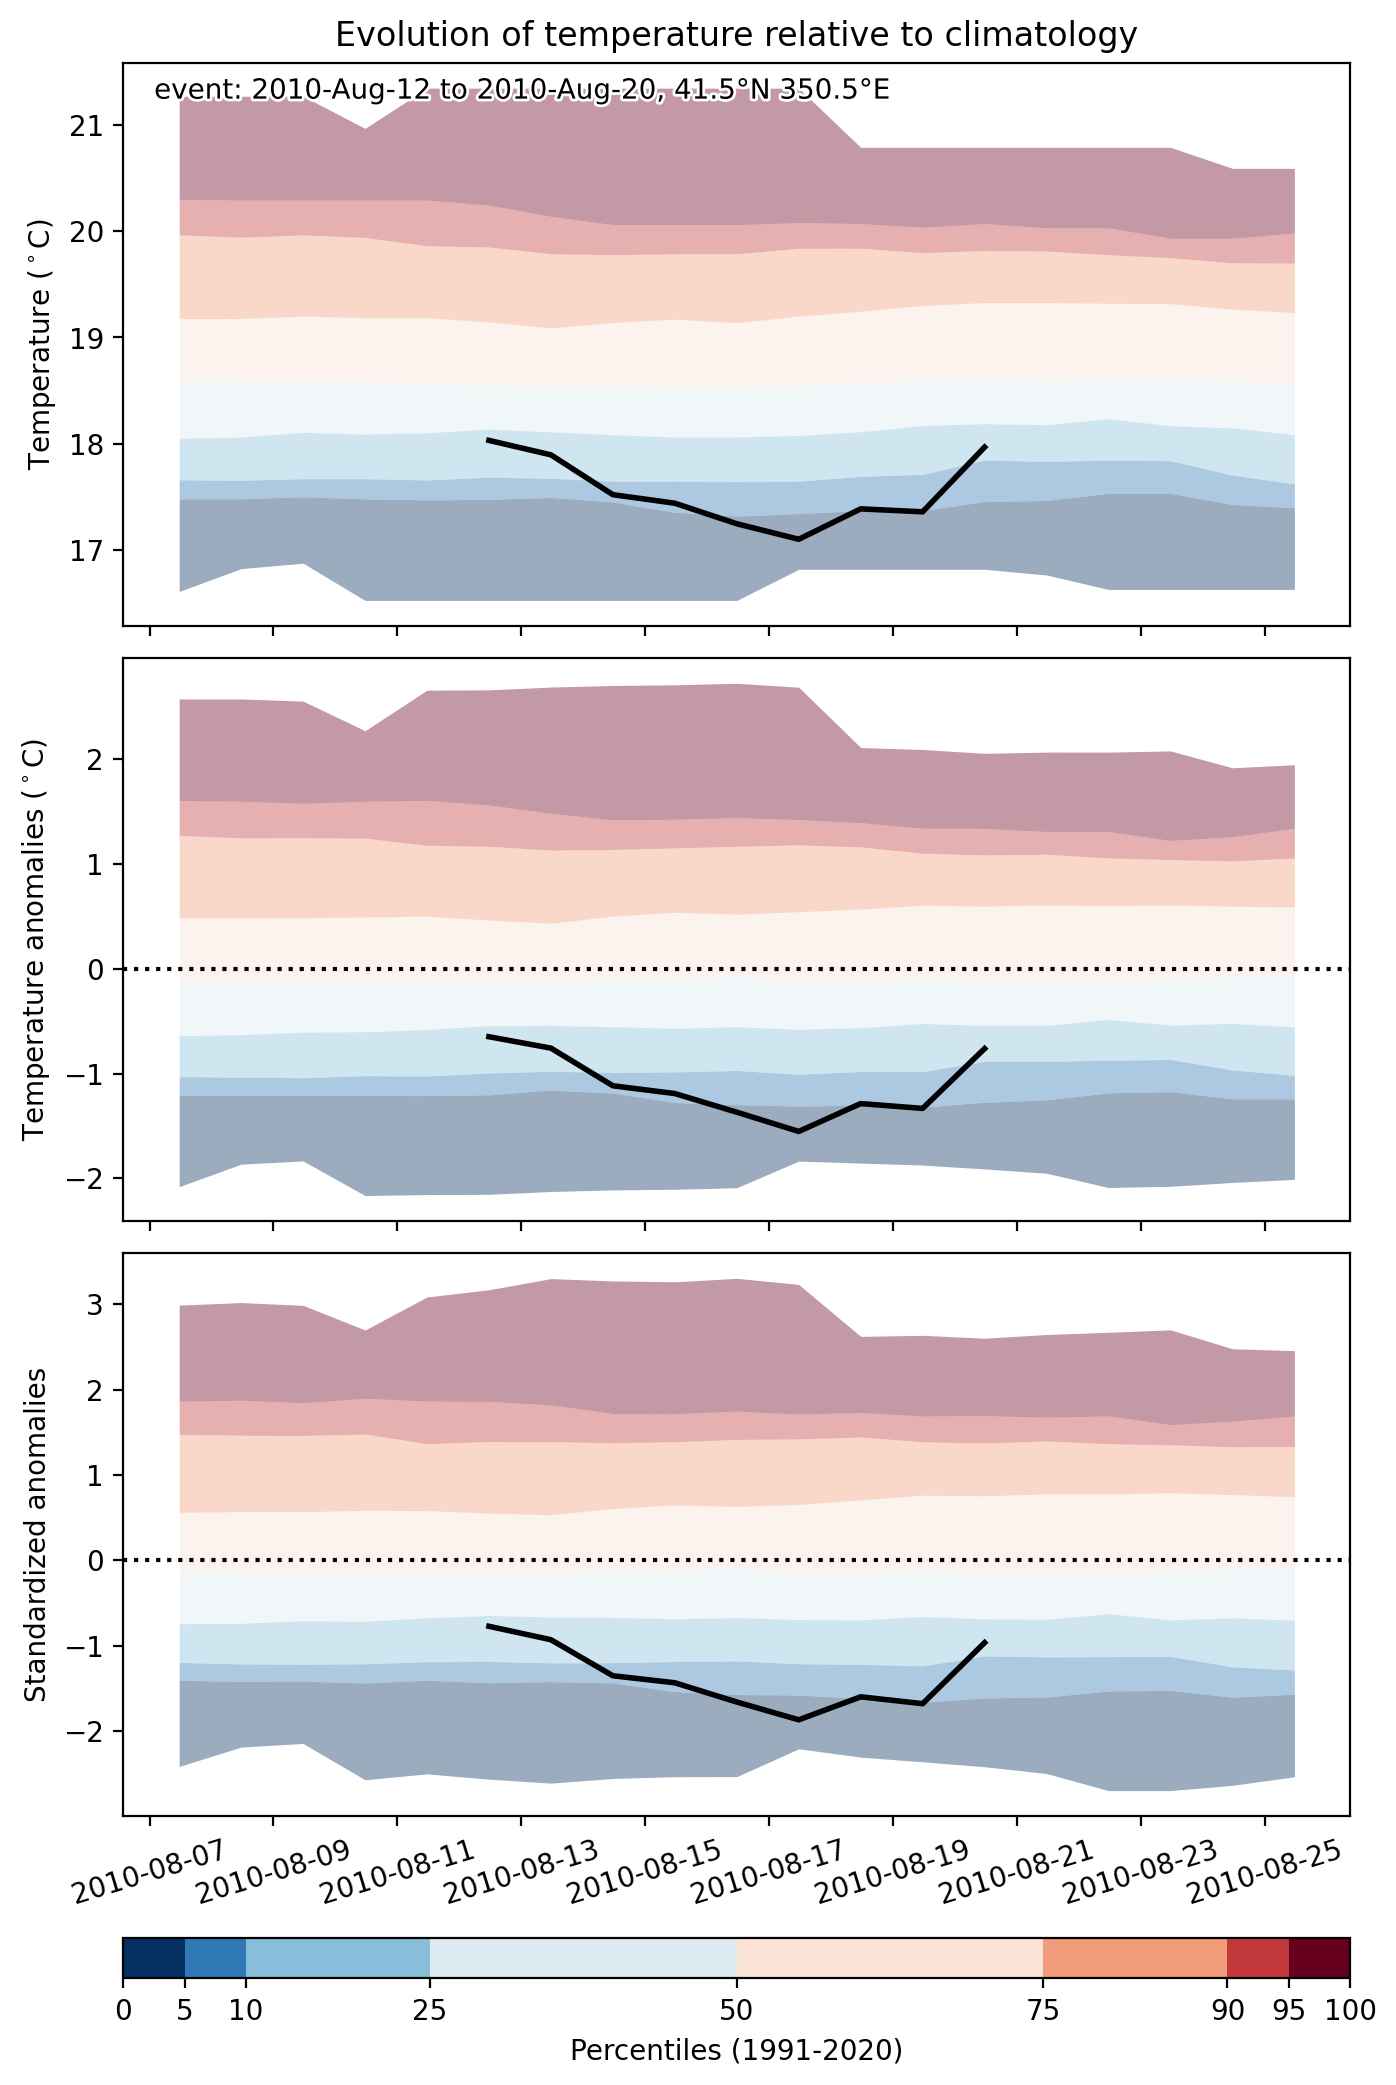


Fig. 2: Evolution of temperature at the center of the event. The climatological percentile distribution is illustrated with color shadings.
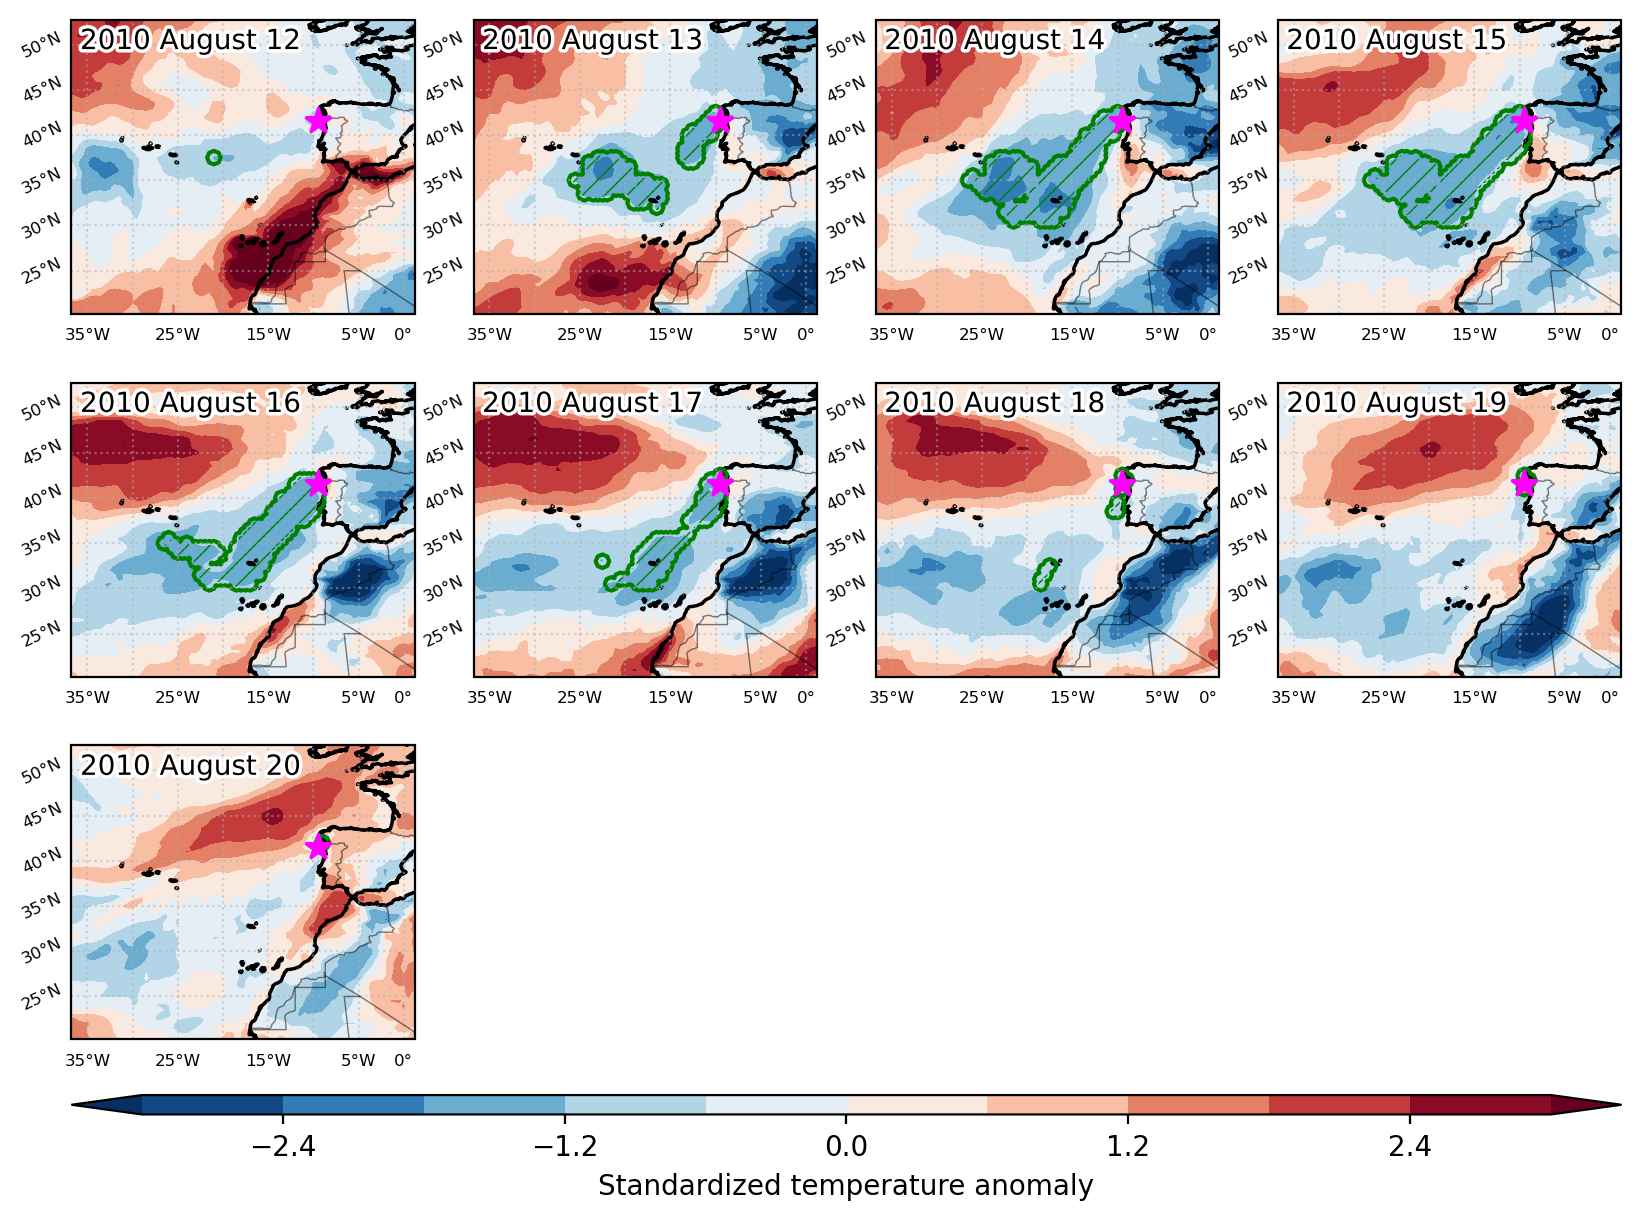


Fig. 3: Maps illustrating the evolution of standardized temperature anomalies during the event.

Event ID: Cold_spell_2010-Aug-12_to_2010-Aug-20_350.5_41.5
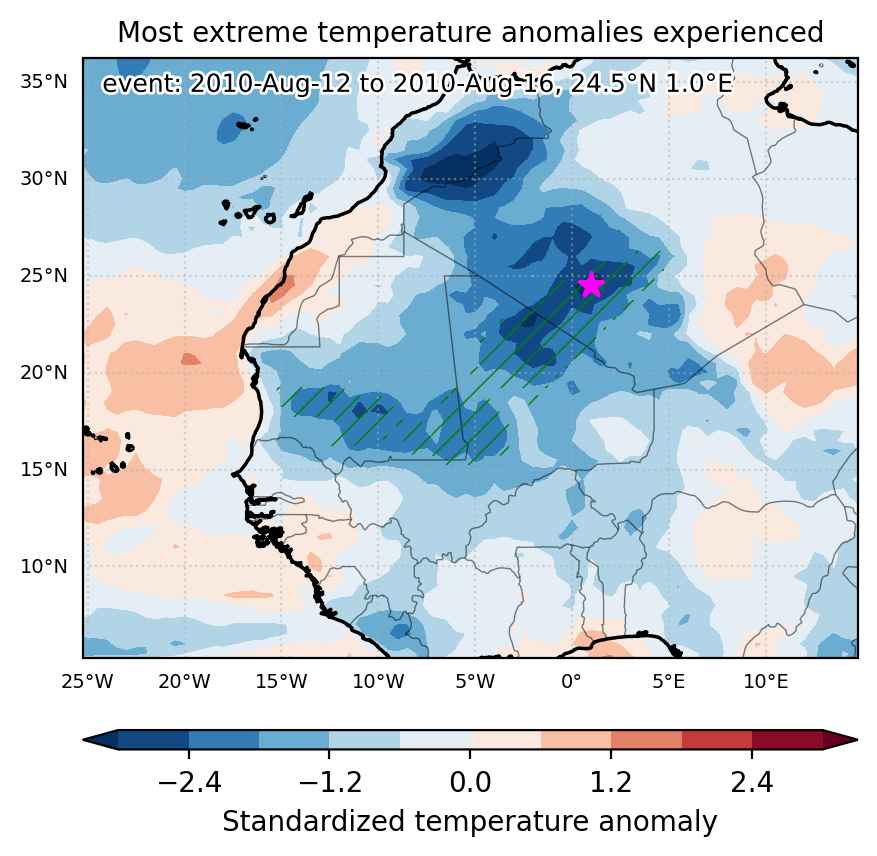
Cold spell occuring from August 12 2010 to August 16 2010 at 24.5°N 1.0°E

Download data: JSON

Event type: Cold spell

Countries affected (identified with ArcGIS Online; provided only for geographical reference):

  • Algeria
  • Mali
  • Mauritania

Duration: 5 days

Time span: August 12 2010 to August 16 2010

Statistics over entire affected area:

  • Mean temperature anomaly: -3.4 °C
  • Mean temperature: 30.7 °C
  • Minimum temperature anomaly: -6.5 °C
  • Minimum temperature: 24.6 °C

Event center: 24.5°N 361.0°E

Area affected: 686536 km$^2$


Fig. 1: Map of most extreme temperature anomalies (standardized) experienced during the event. The purple star indicates the center of the extreme event. Green hatching illustrates all areas under the effect of extremes at some time during the event.


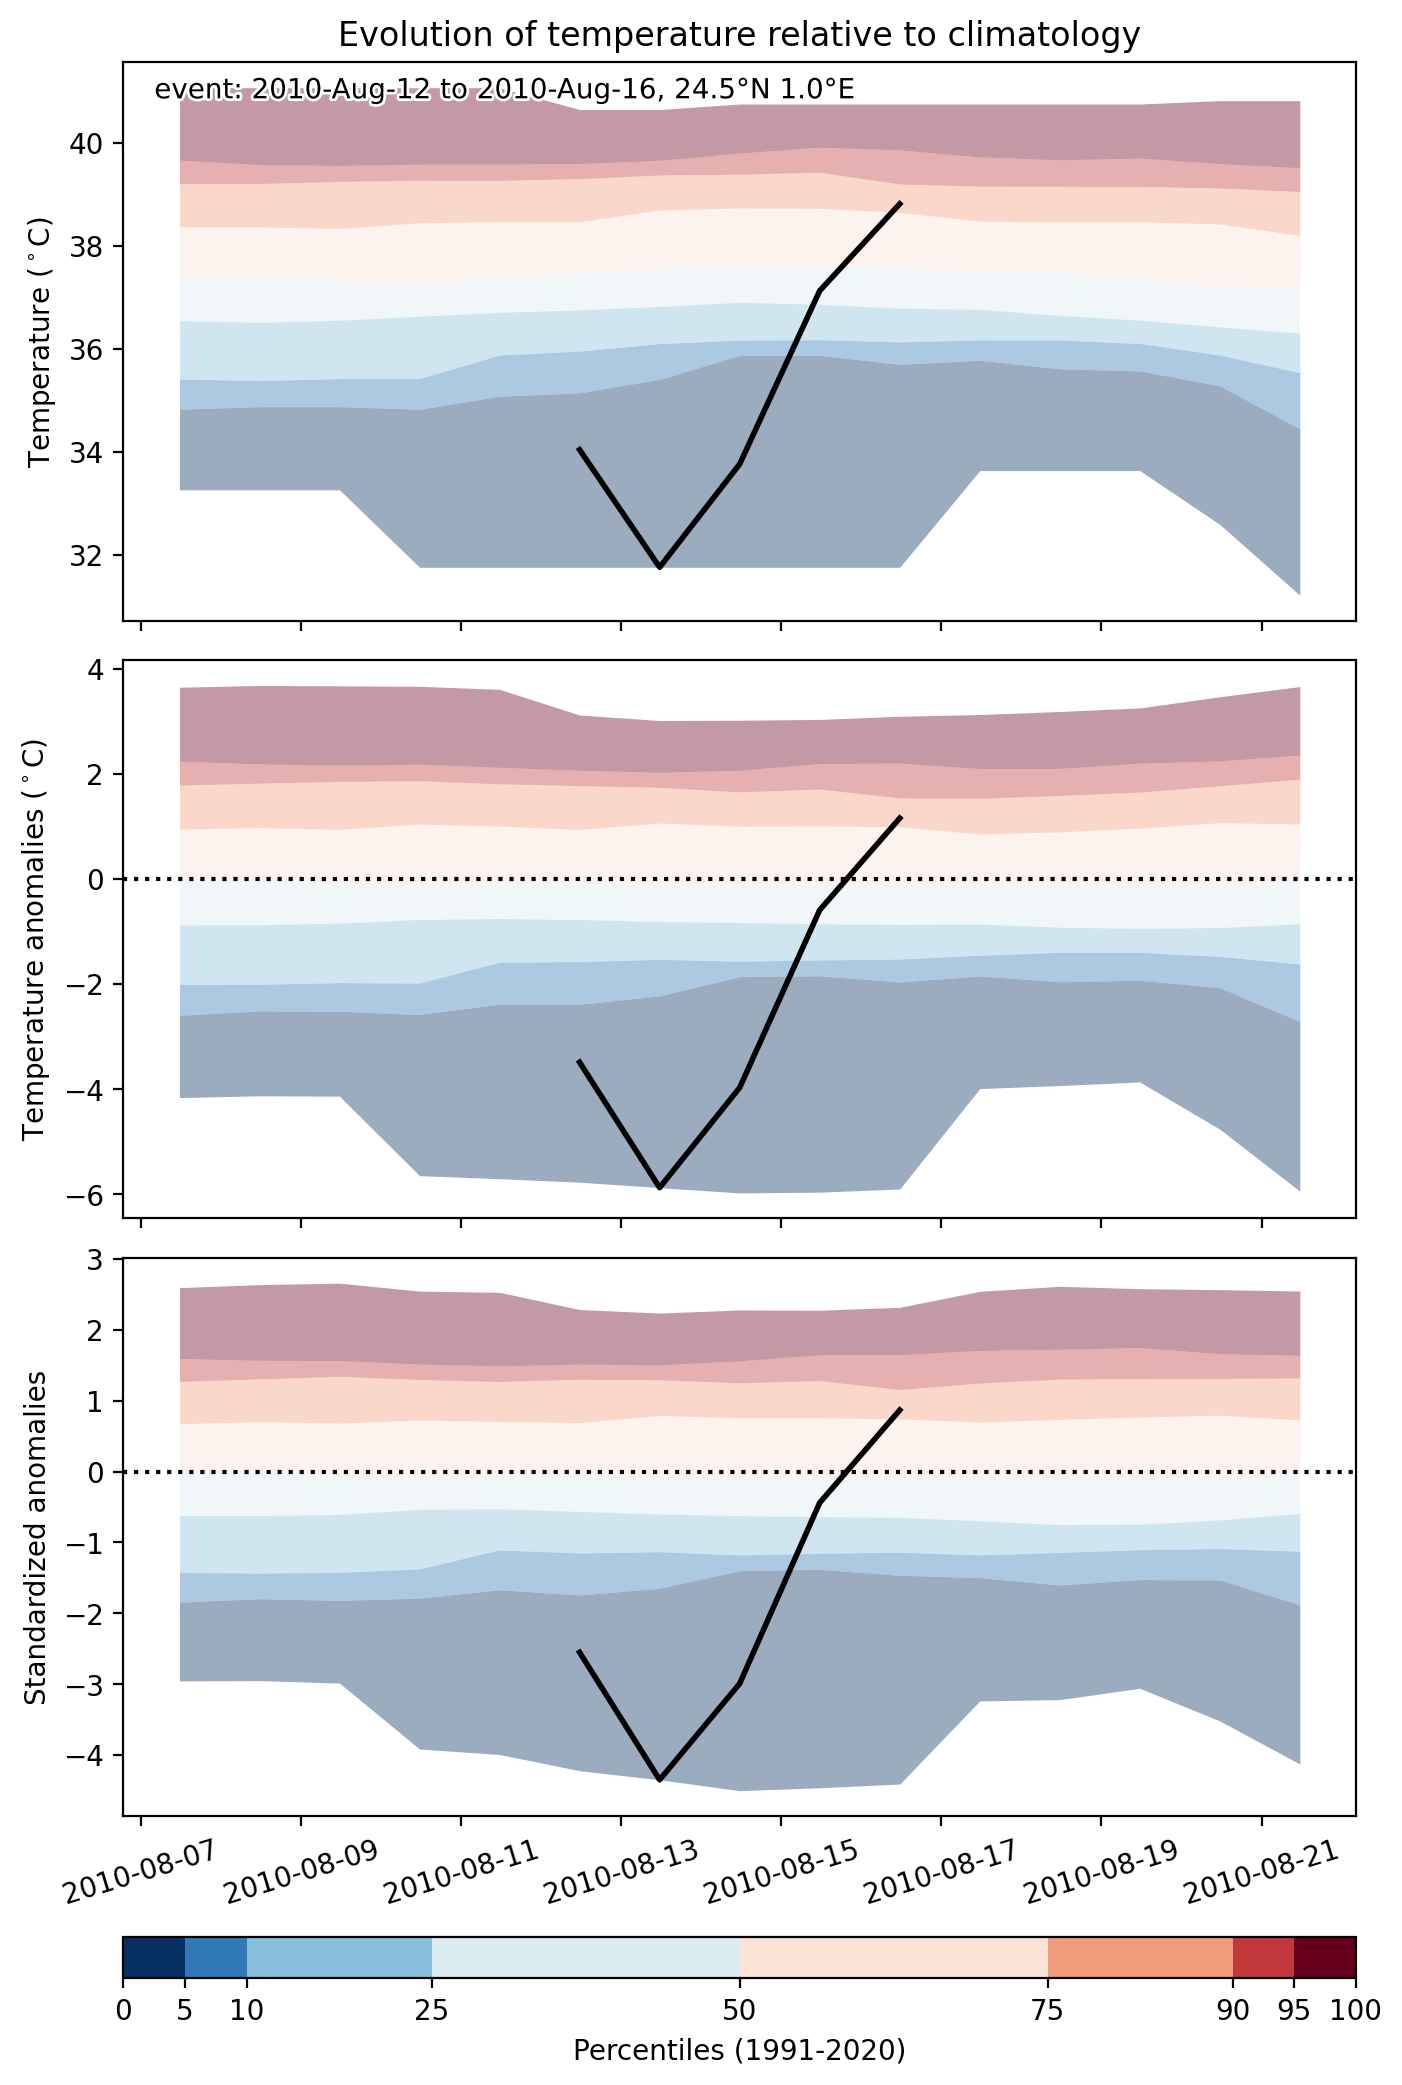
Fig. 2: Evolution of temperature at the center of the event. The climatological percentile distribution is illustrated with color shadings.


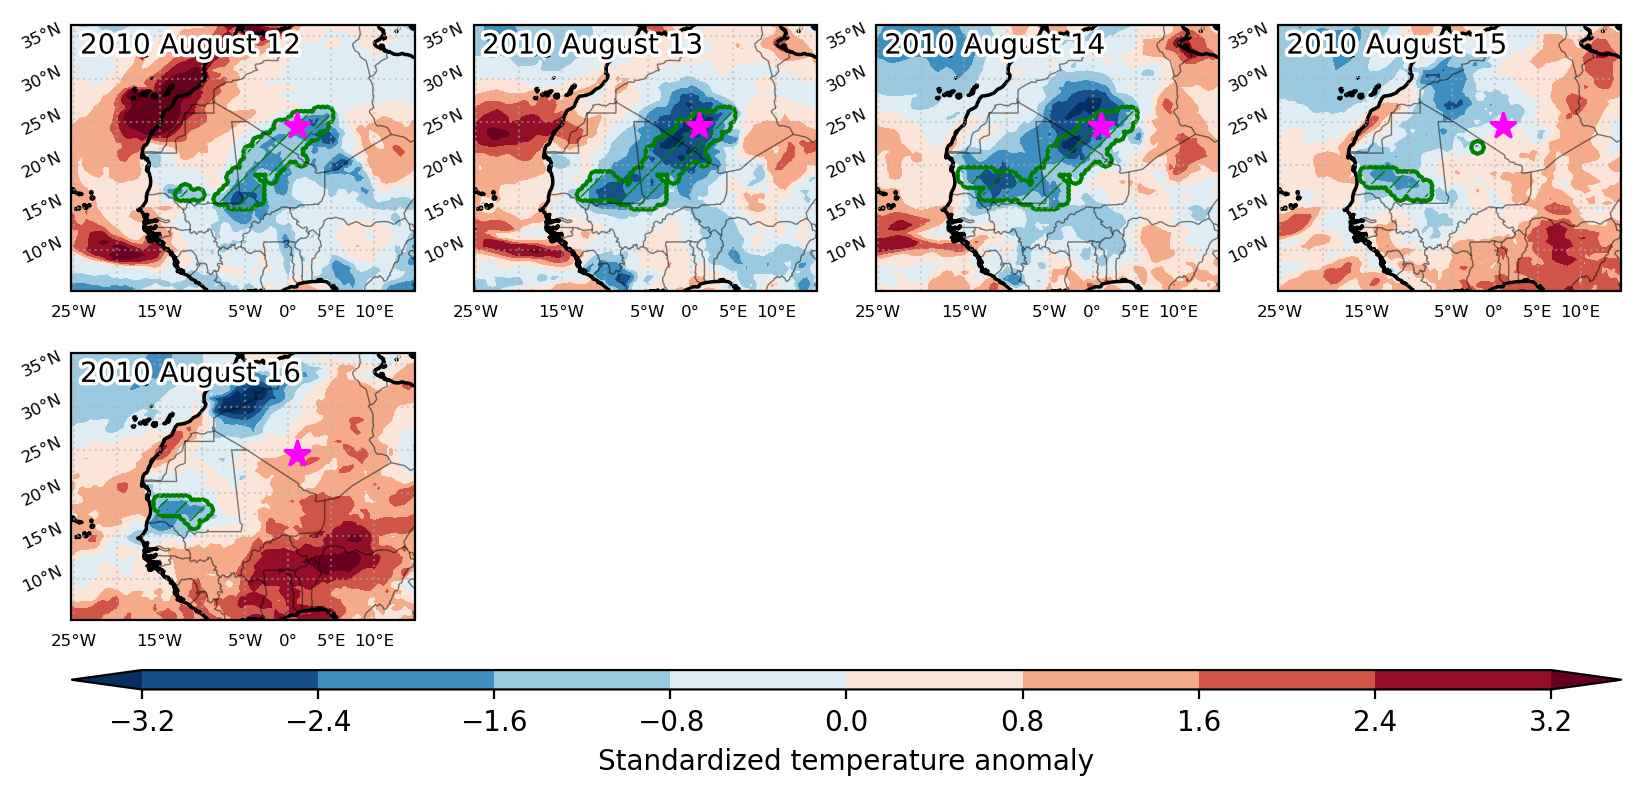
Fig. 3: Maps illustrating the evolution of standardized temperature anomalies during the event.

Event ID: Cold_spell_2010-Aug-12_to_2010-Aug-16_1.0_24.5

Cold spell occuring from August 12 2010 to August 22 2010 at 3.0°N 306.0°E

Download data: JSON

Event type: Cold spell

Countries affected (identified with ArcGIS Online; provided only for geographical reference):

  • Brazil
  • French Guiana
  • Suriname

Duration: 11 days

Time span: August 12 2010 to August 22 2010

Statistics over entire affected area:

  • Mean temperature anomaly: -1.7 °C
  • Mean temperature: 24.6 °C
  • Minimum temperature anomaly: -3.1 °C
  • Minimum temperature: 22.2 °C

Event center: 3.0°N 306.0°E

Area affected: 404685 km$^2$


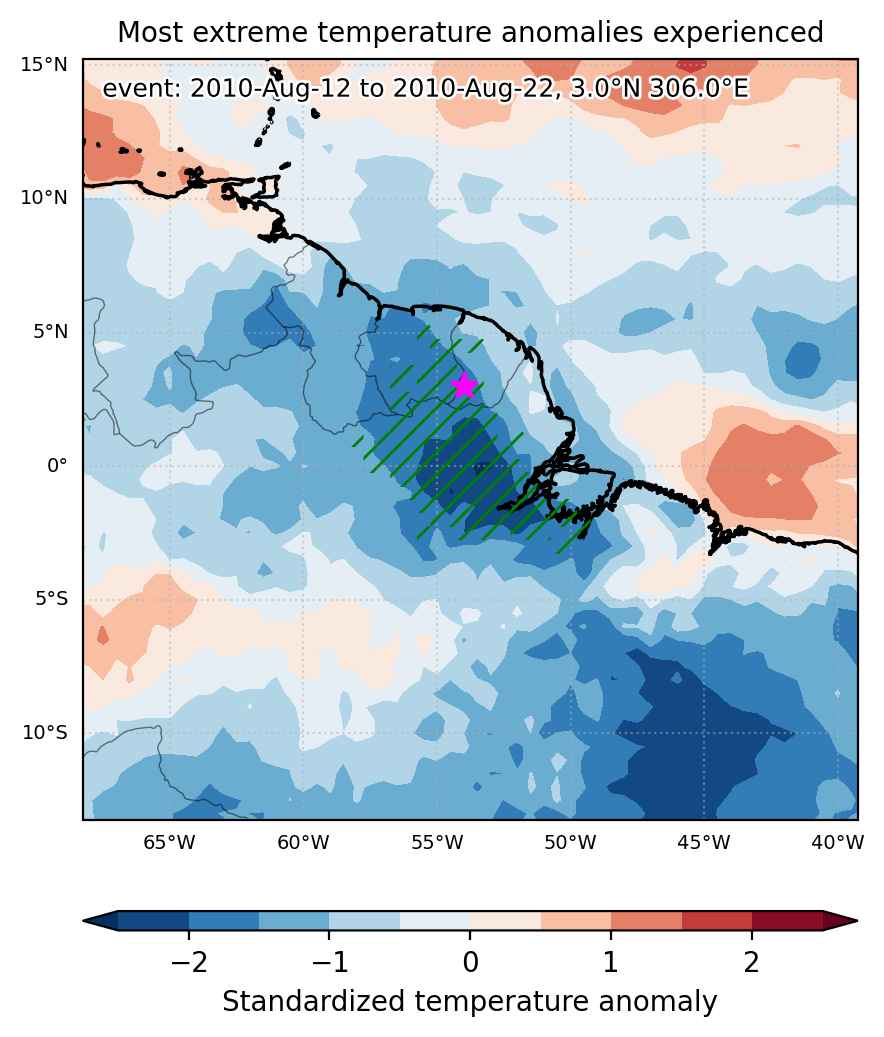
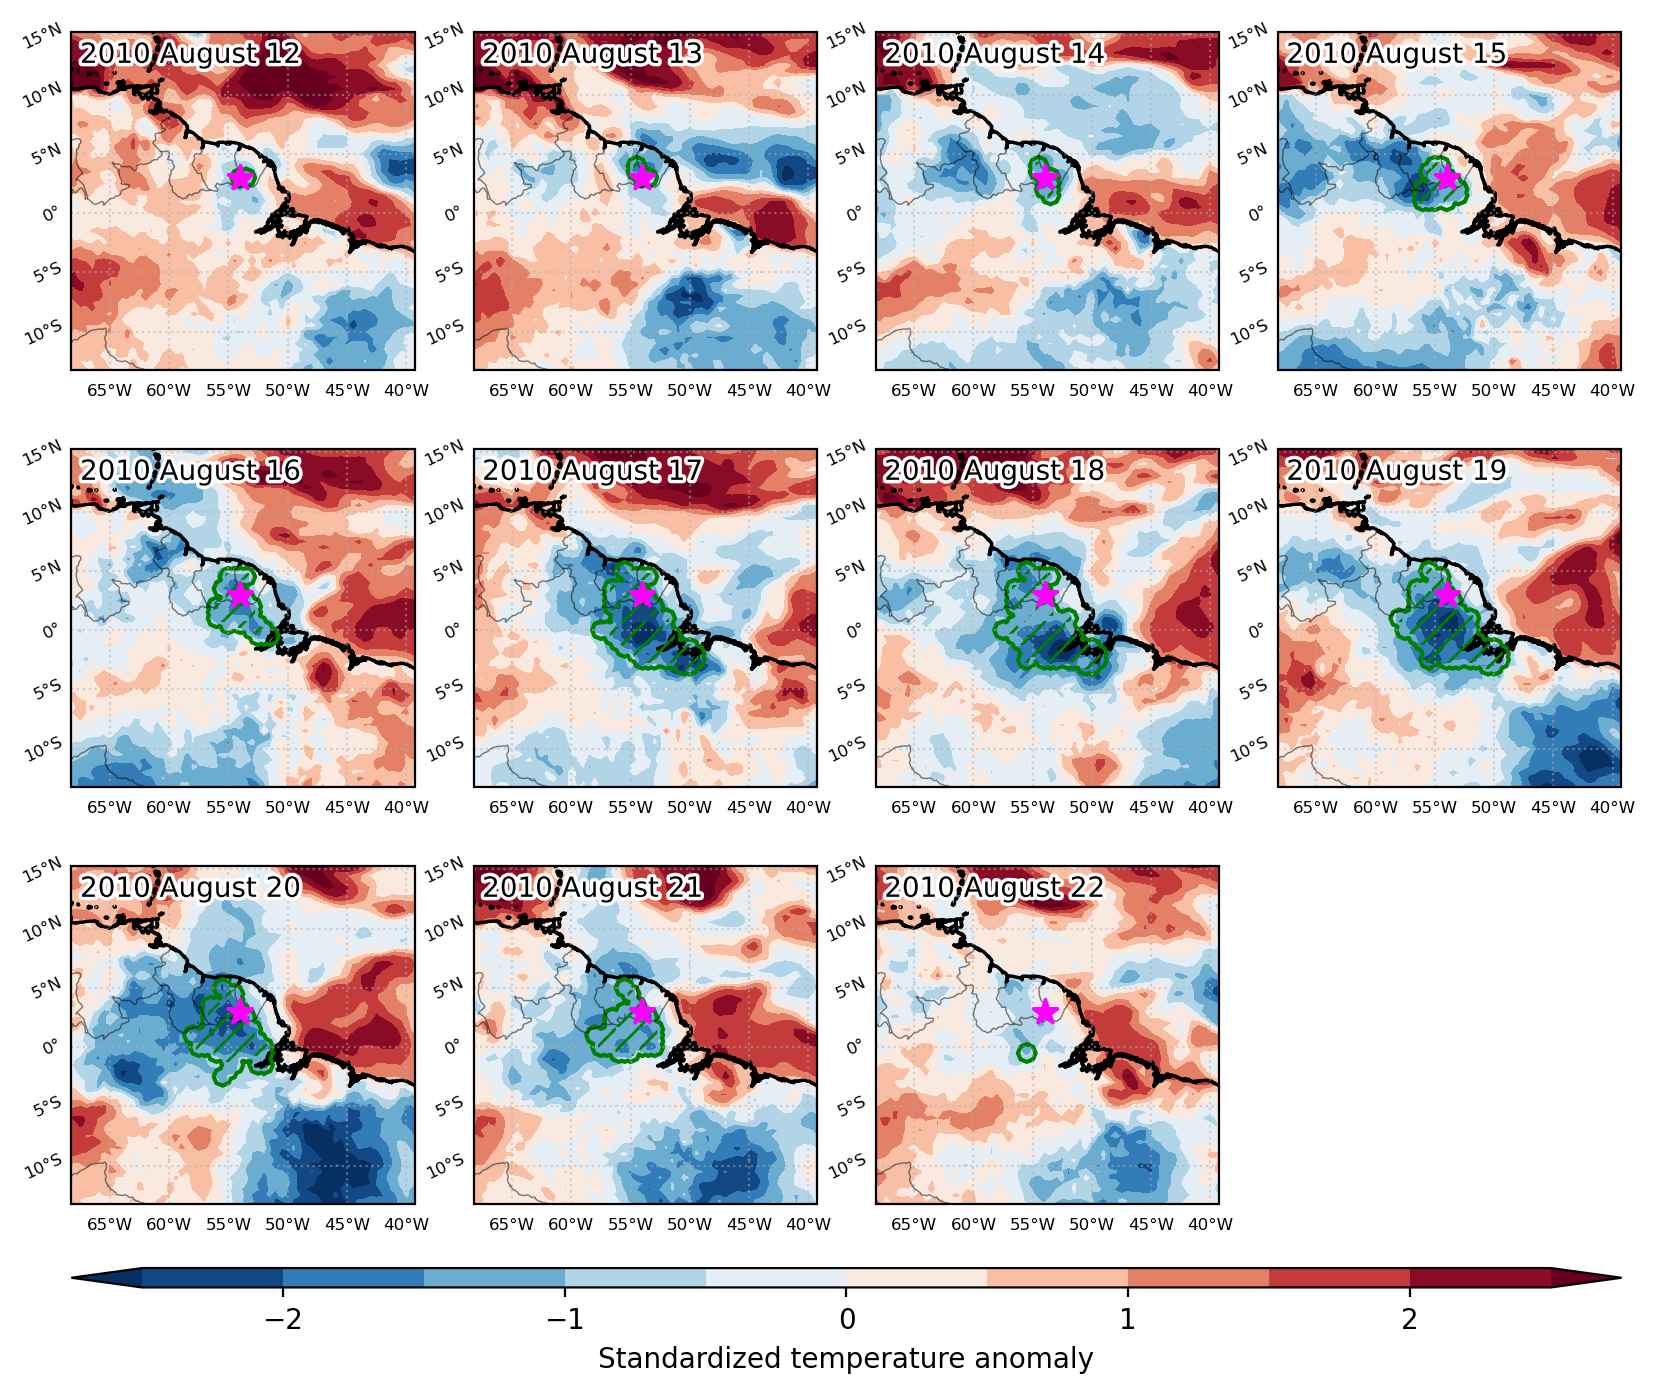
Fig. 1: Map of most extreme temperature anomalies (standardized) experienced during the event. The purple star indicates the center of the extreme event. Green hatching illustrates all areas under the effect of extremes at some time during the event.


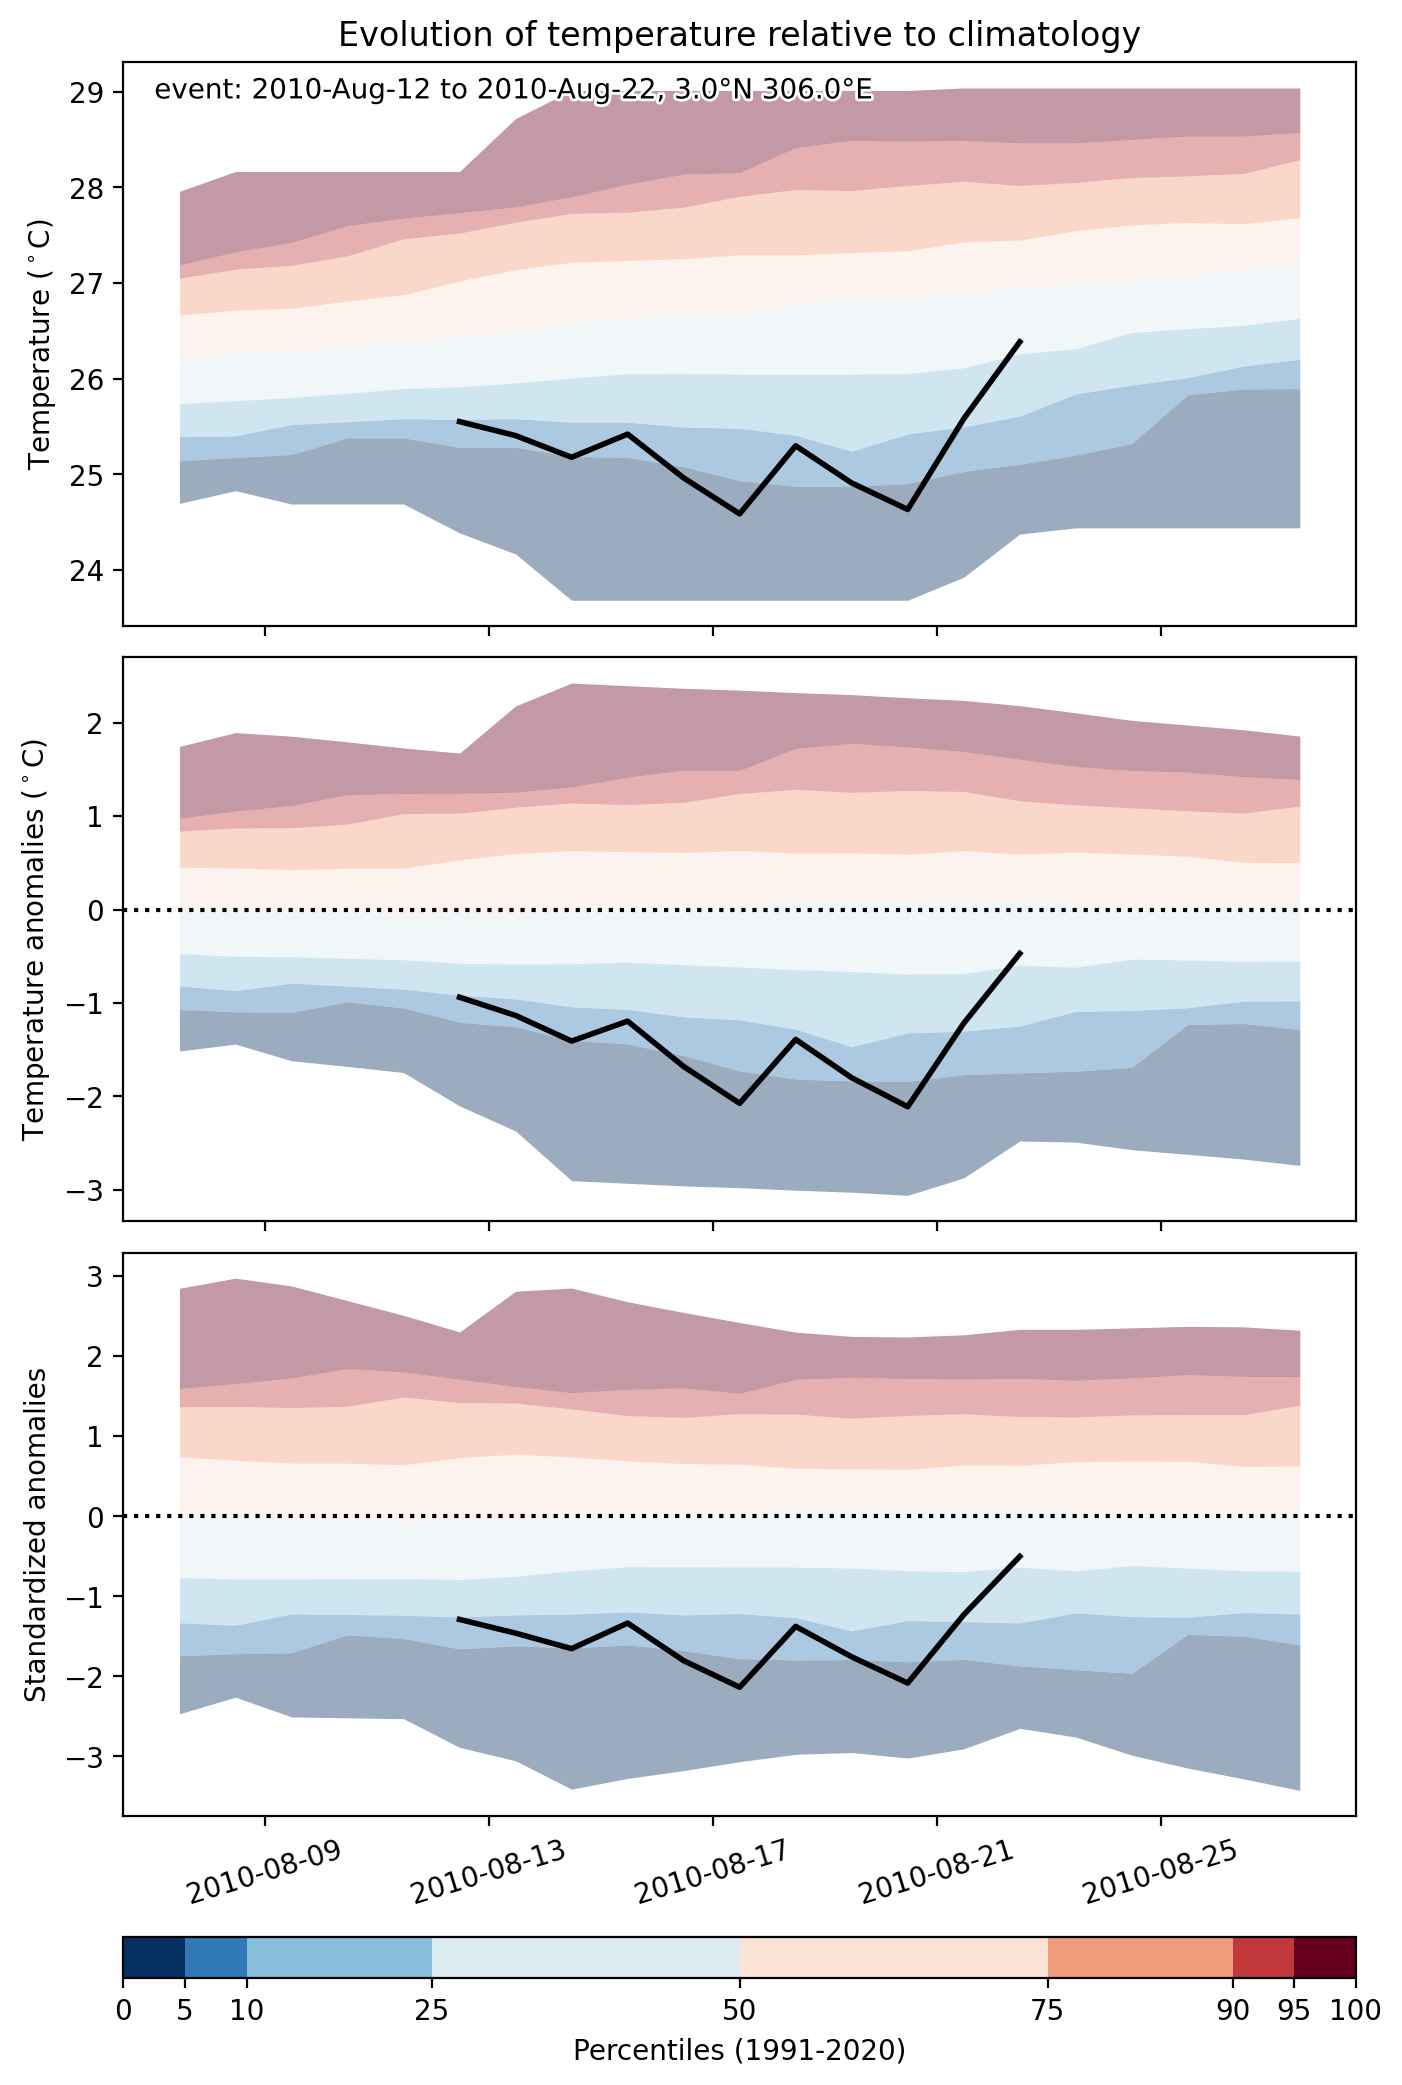
Fig. 2: Evolution of temperature at the center of the event. The climatological percentile distribution is illustrated with color shadings.


Fig. 3: Maps illustrating the evolution of standardized temperature anomalies during the event.

Event ID: Cold_spell_2010-Aug-12_to_2010-Aug-22_306.0_3.0

Cold spell occuring from August 12 2010 to August 18 2010 at 0.5°N 42.0°E

Download data: JSON

Event type: Cold spell

Countries affected (identified with ArcGIS Online; provided only for geographical reference):

  • Ethiopia
  • Kenya
  • Somalia

Duration: 7 days

Time span: August 12 2010 to August 18 2010

Statistics over entire affected area:

  • Mean temperature anomaly: -1.7 °C
  • Mean temperature: 24.9 °C
  • Minimum temperature anomaly: -3.9 °C
  • Minimum temperature: 22.3 °C

Event center: 0.5°N 42.0°E

Area affected: 166781 km$^2$


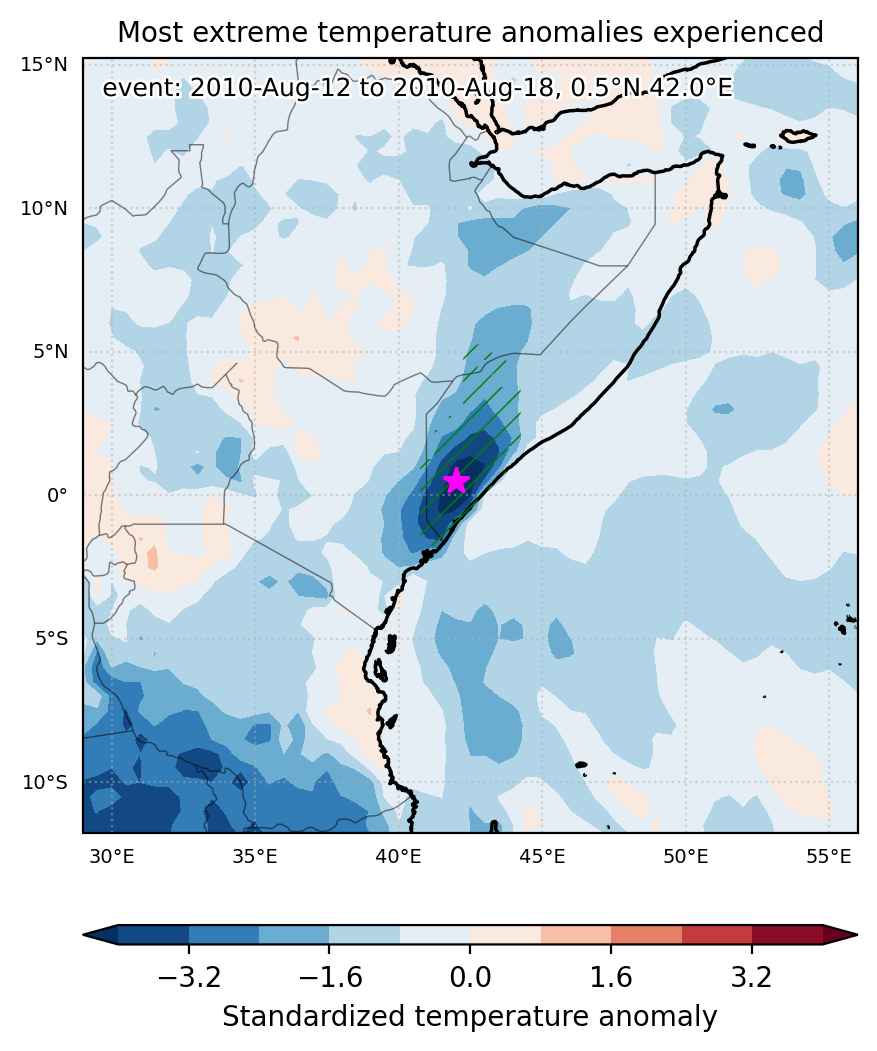
Fig. 1: Map of most extreme temperature anomalies (standardized) experienced during the event. The purple star indicates the center of the extreme event. Green hatching illustrates all areas under the effect of extremes at some time during the event.


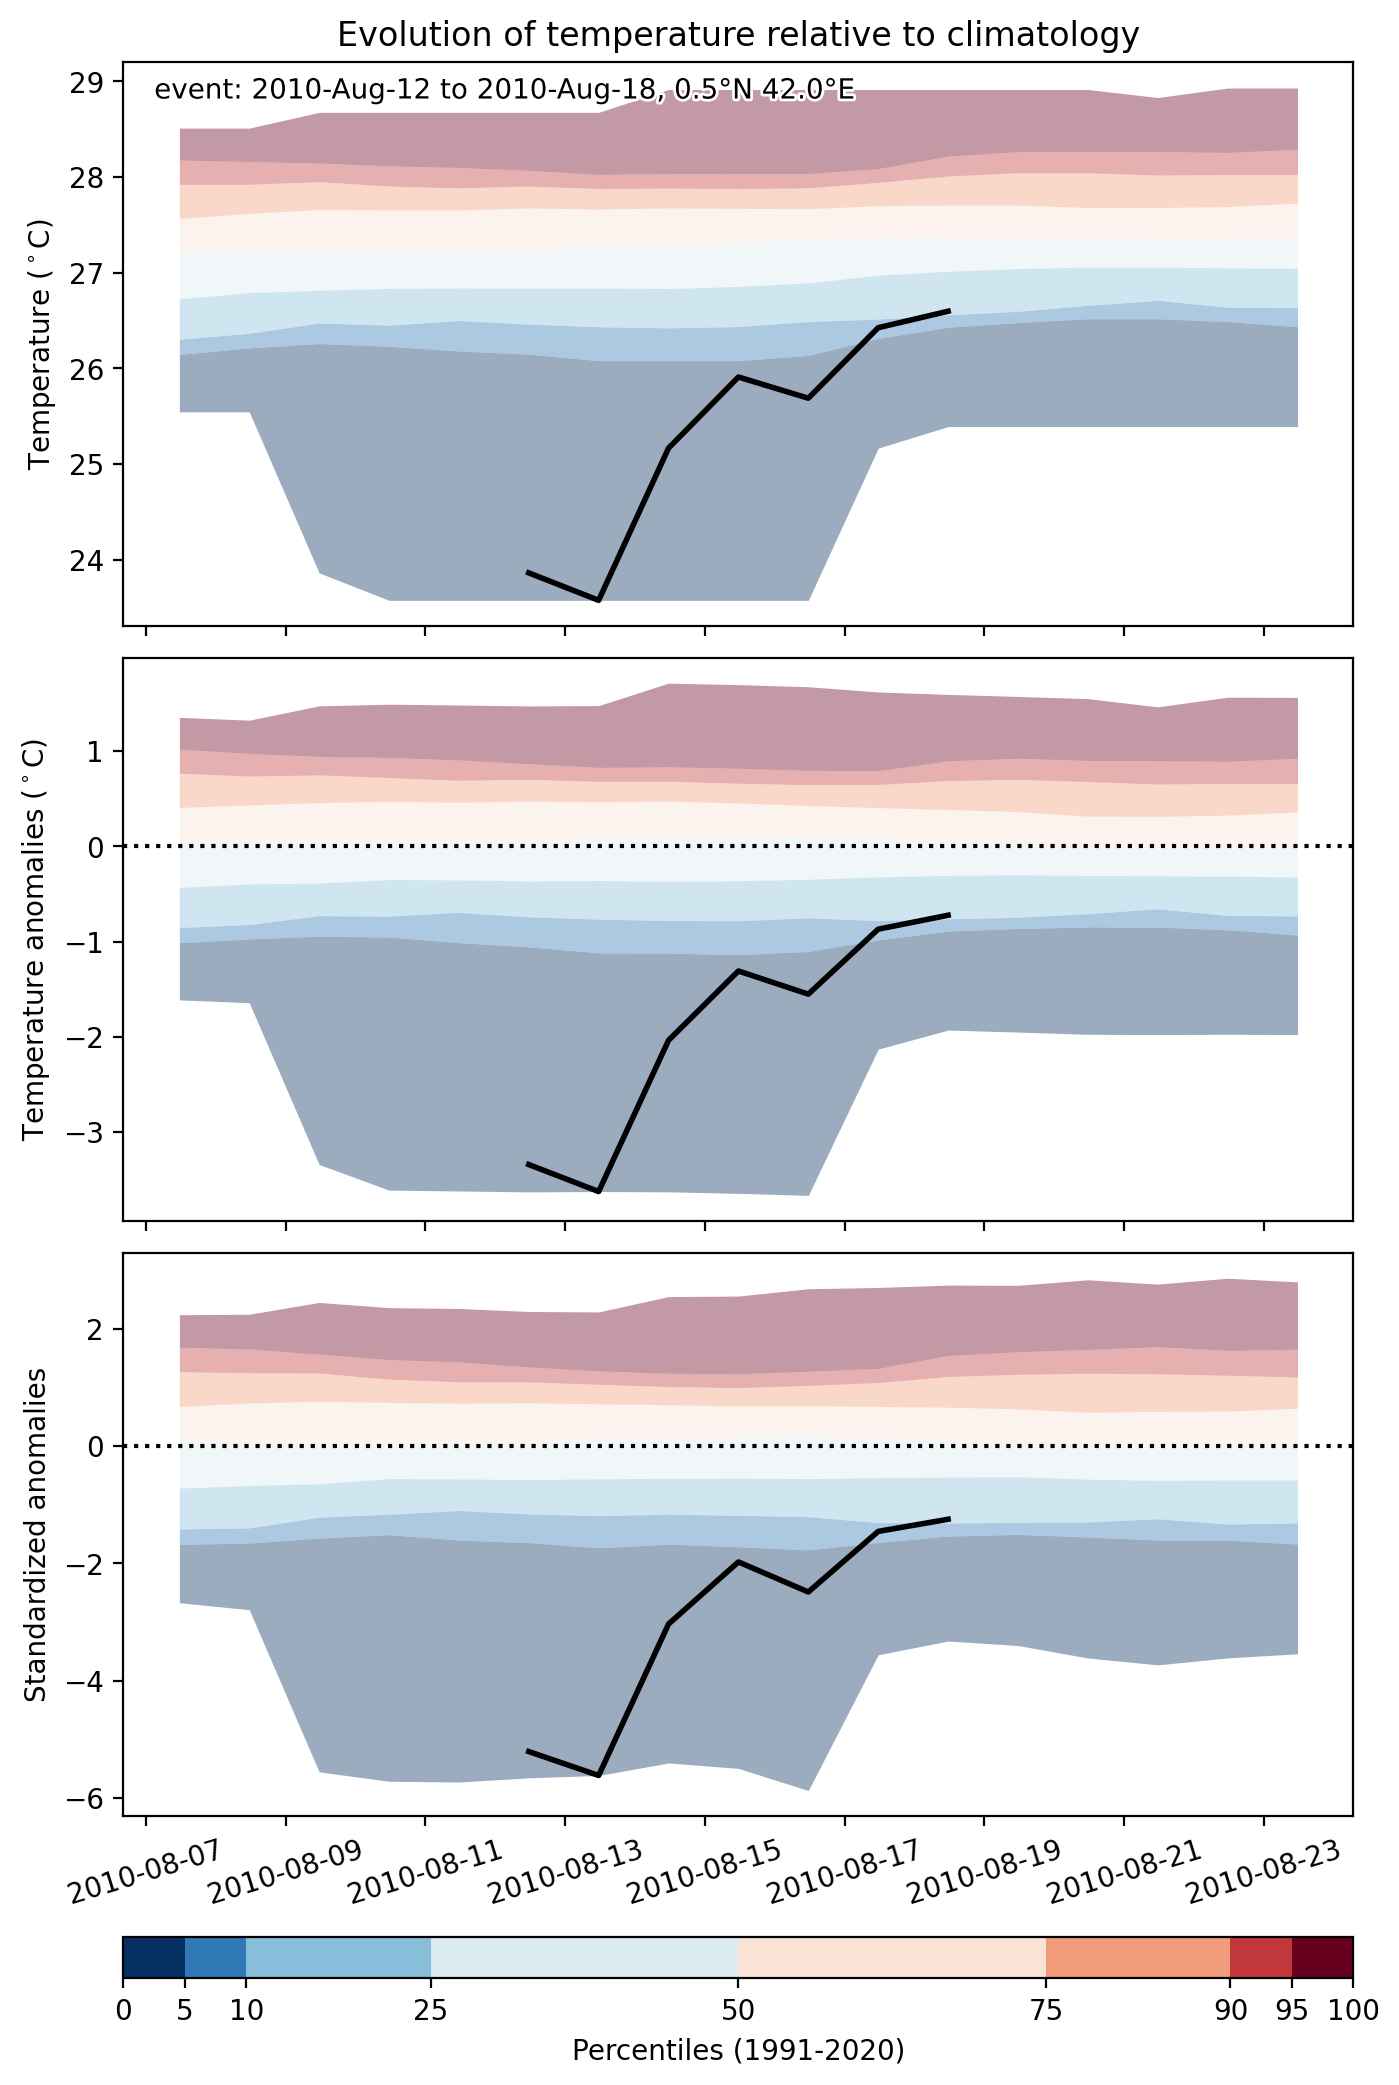
Fig. 2: Evolution of temperature at the center of the event. The climatological percentile distribution is illustrated with color shadings.


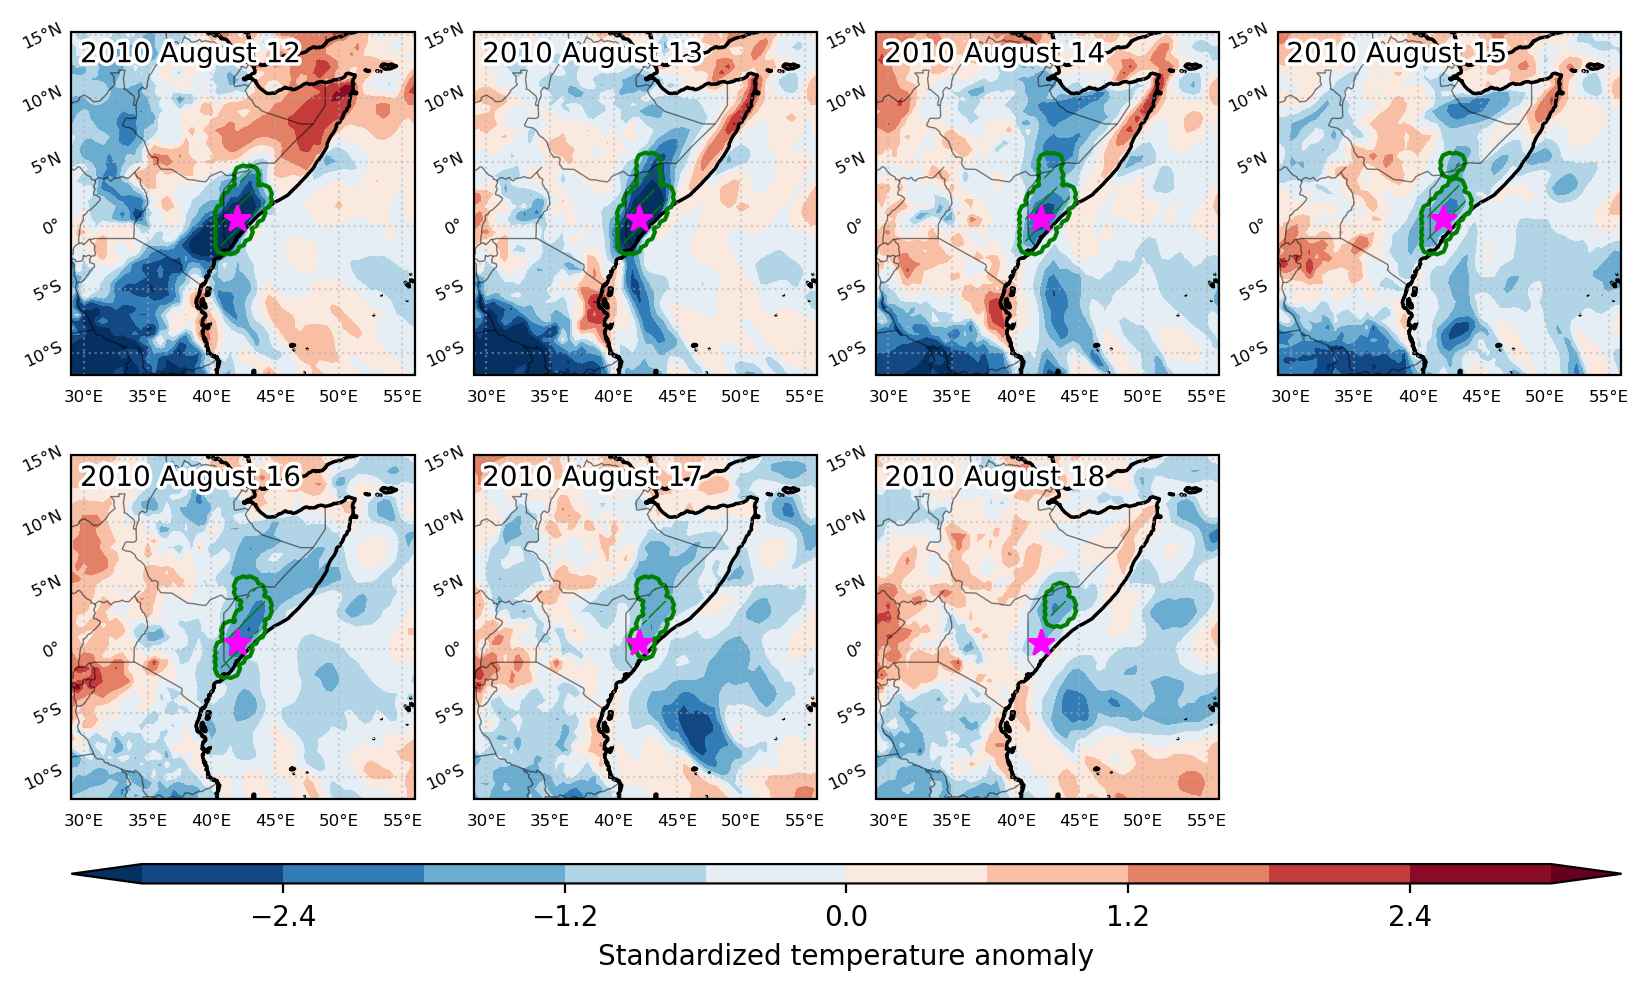
Fig. 3: Maps illustrating the evolution of standardized temperature anomalies during the event.

Event ID: Cold_spell_2010-Aug-12_to_2010-Aug-18_42.0_0.5

Cold spell occuring from August 12 2010 to August 16 2010 at -40.0°S 301.0°E

Download data: JSON

Event type: Cold spell

Countries affected (identified with ArcGIS Online; provided only for geographical reference):

  • Argentina

Duration: 5 days

Time span: August 12 2010 to August 16 2010

Statistics over entire affected area:

  • Mean temperature anomaly: -5.3 °C
  • Mean temperature: 6.1 °C
  • Minimum temperature anomaly: -9.7 °C
  • Minimum temperature: -6.5 °C

Event center: -40.0°S 301.0°E

Area affected: 1224695 km$^2$


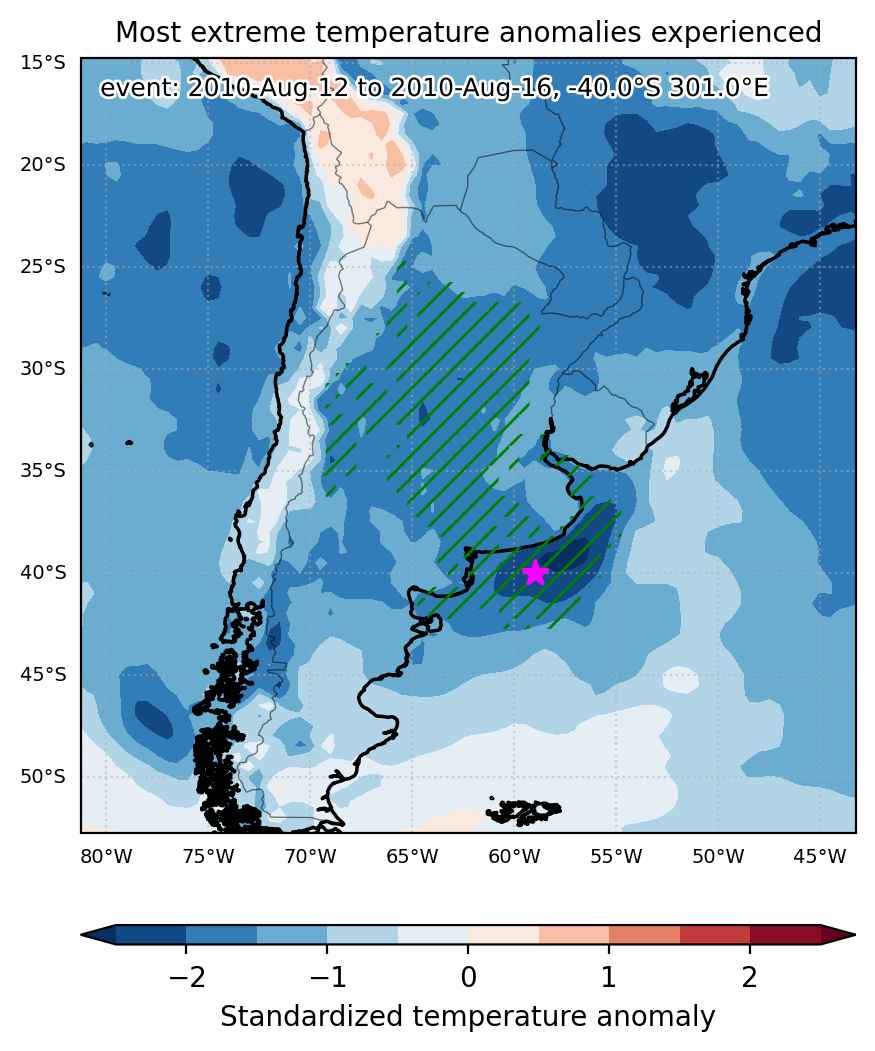
Fig. 1: Map of most extreme temperature anomalies (standardized) experienced during the event. The purple star indicates the center of the extreme event. Green hatching illustrates all areas under the effect of extremes at some time during the event.


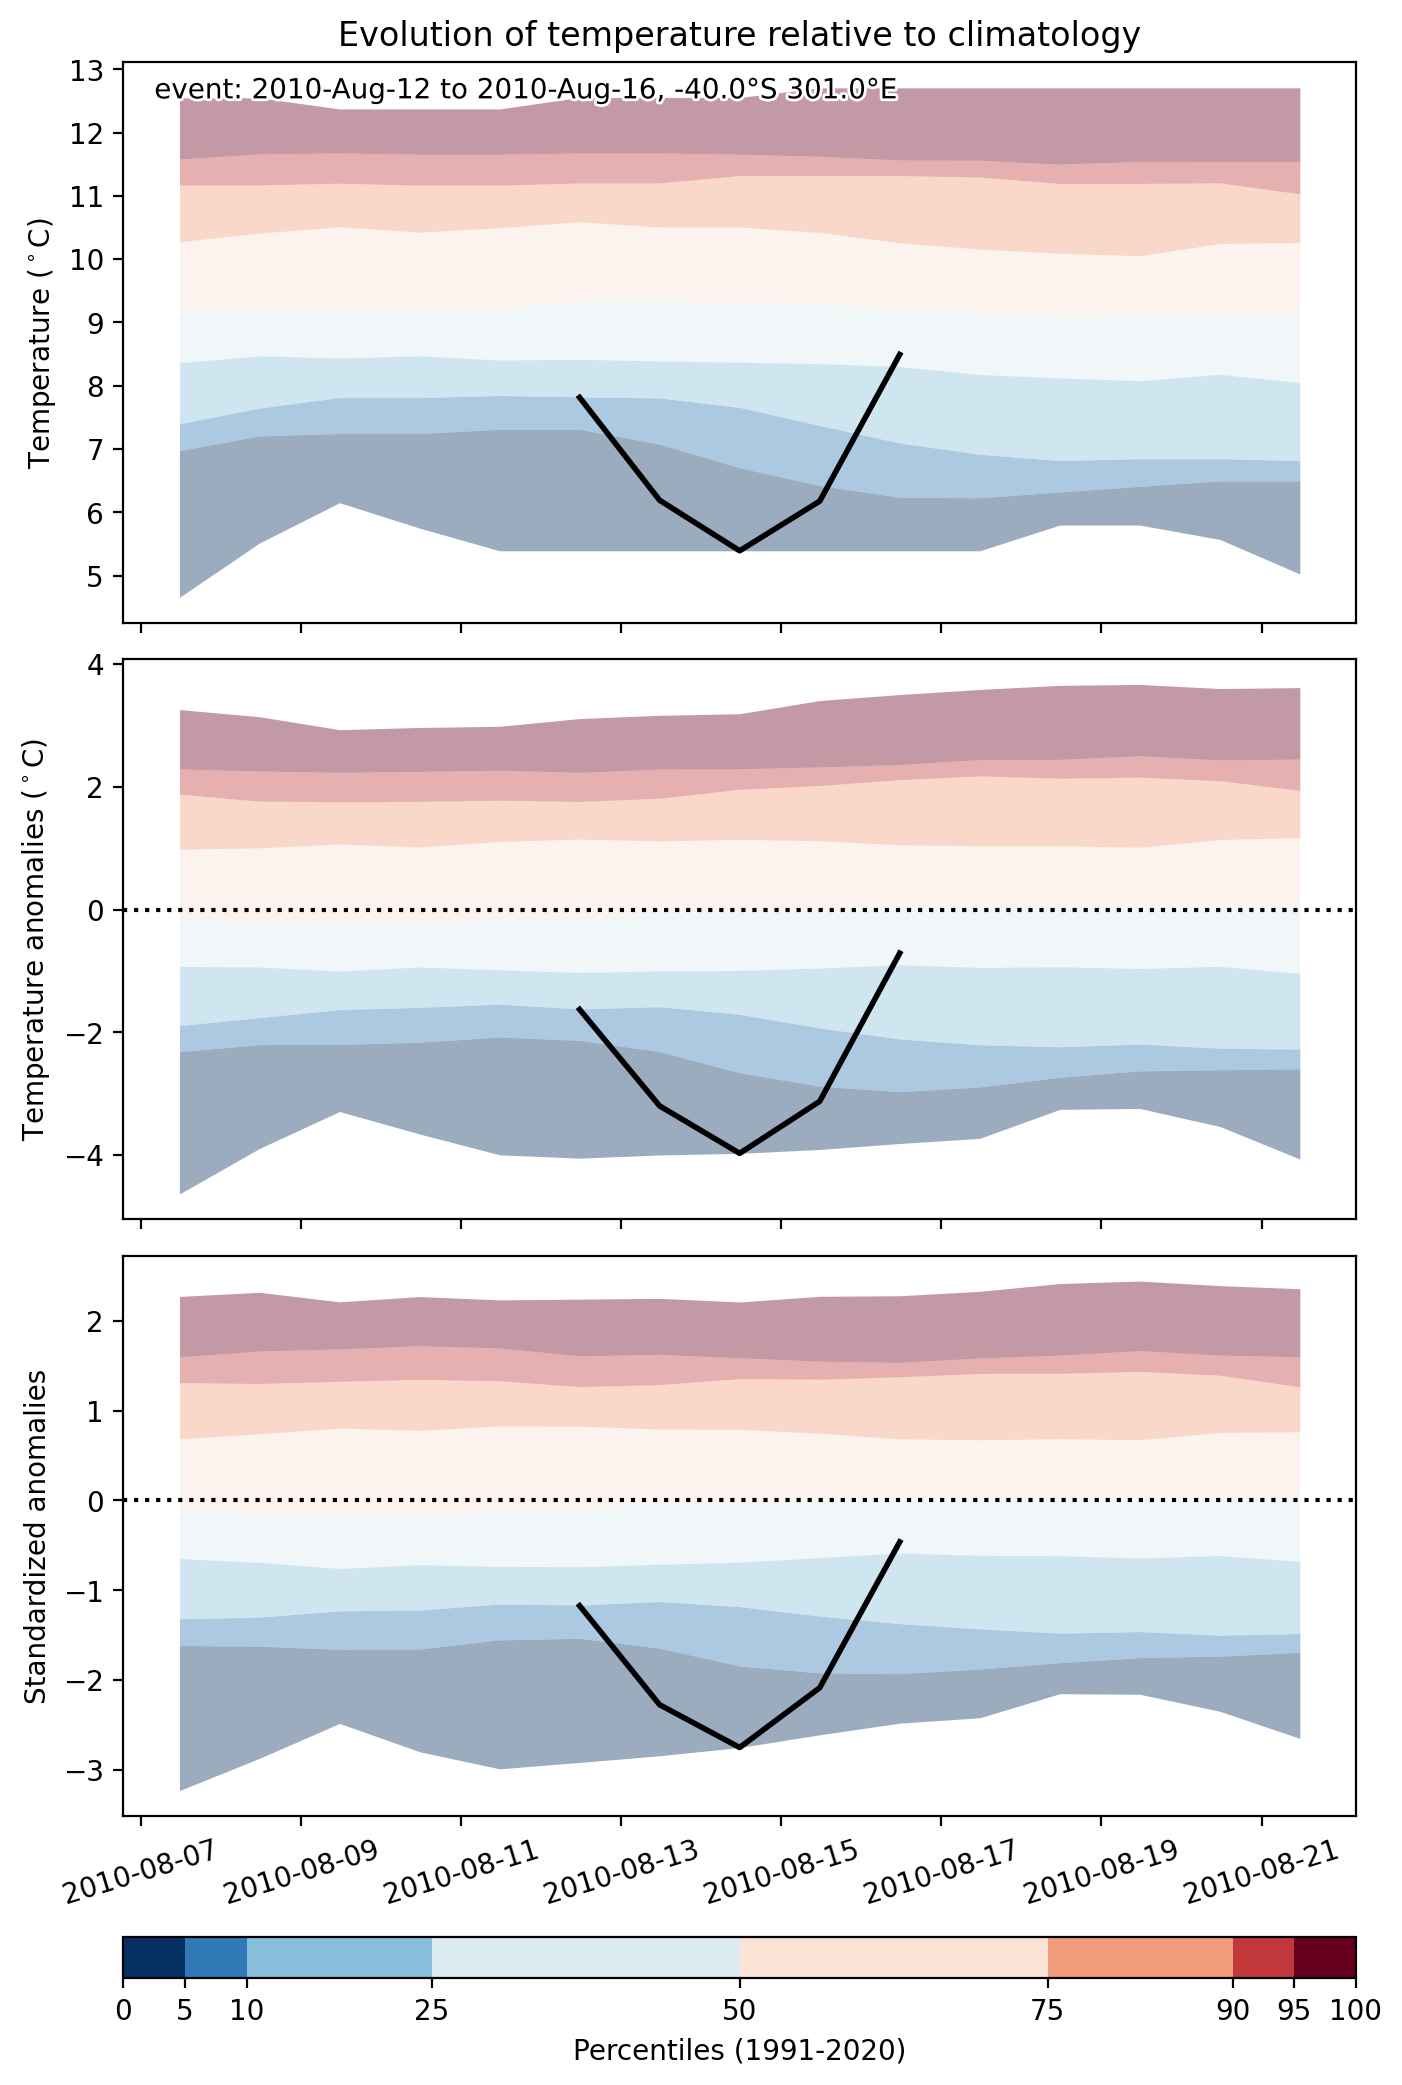
Fig. 2: Evolution of temperature at the center of the event. The climatological percentile distribution is illustrated with color shadings.


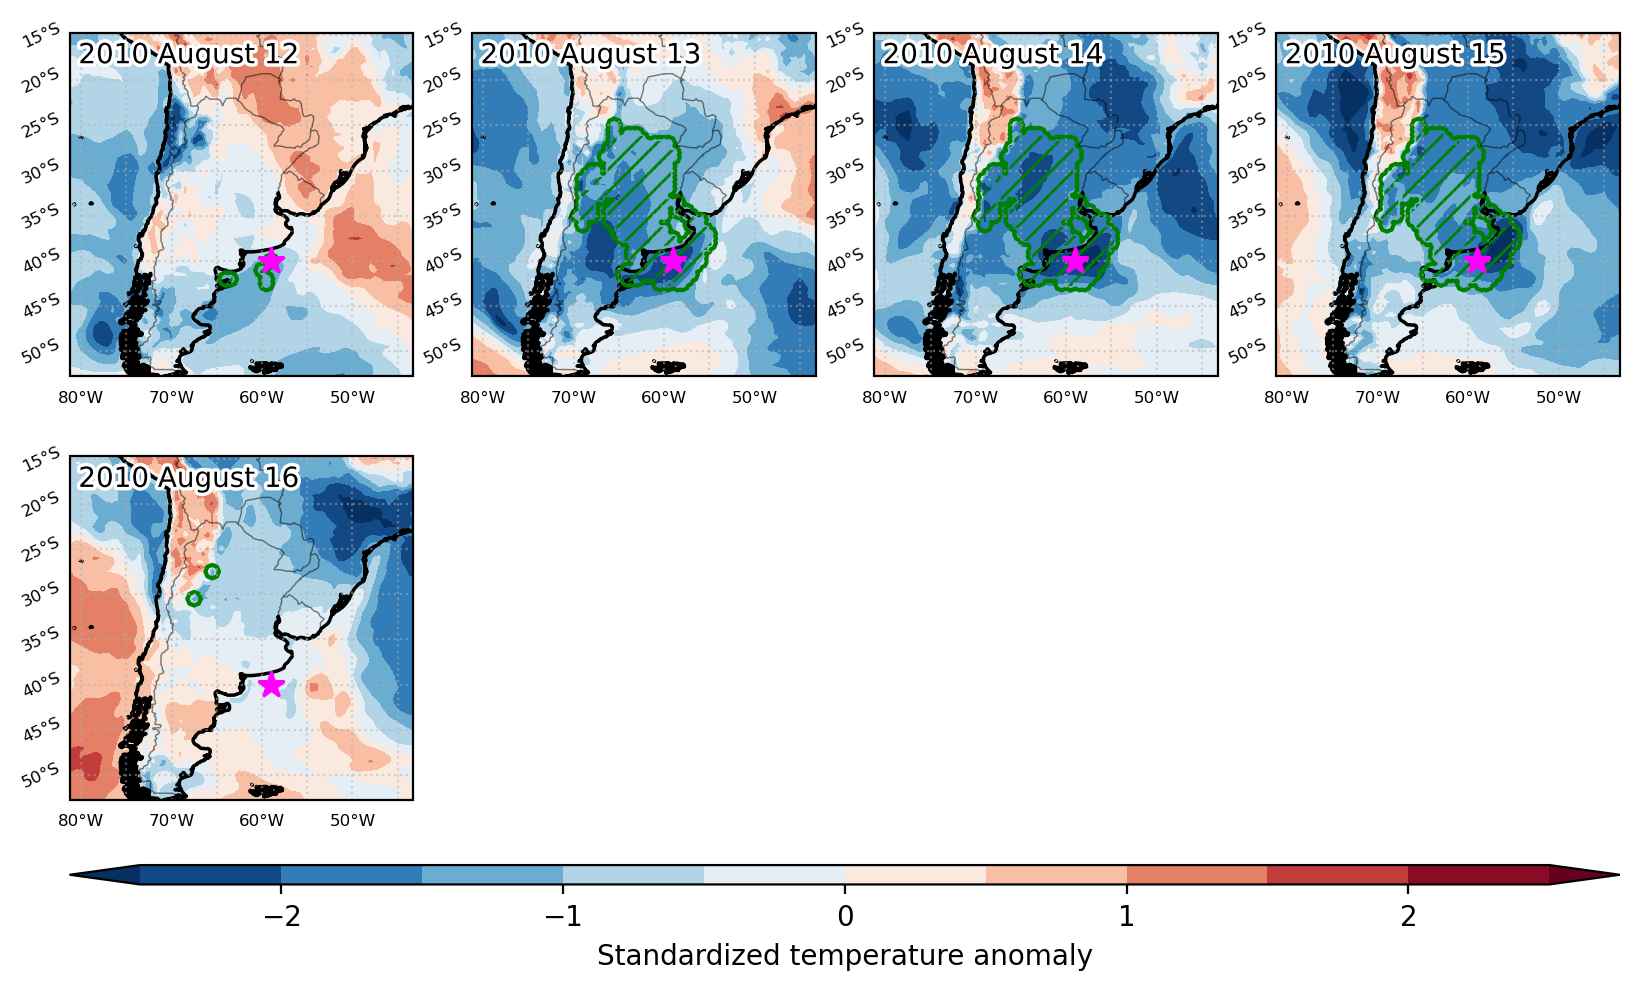
Fig. 3: Maps illustrating the evolution of standardized temperature anomalies during the event.

Event ID: Cold_spell_2010-Aug-12_to_2010-Aug-16_301.0_-40.0

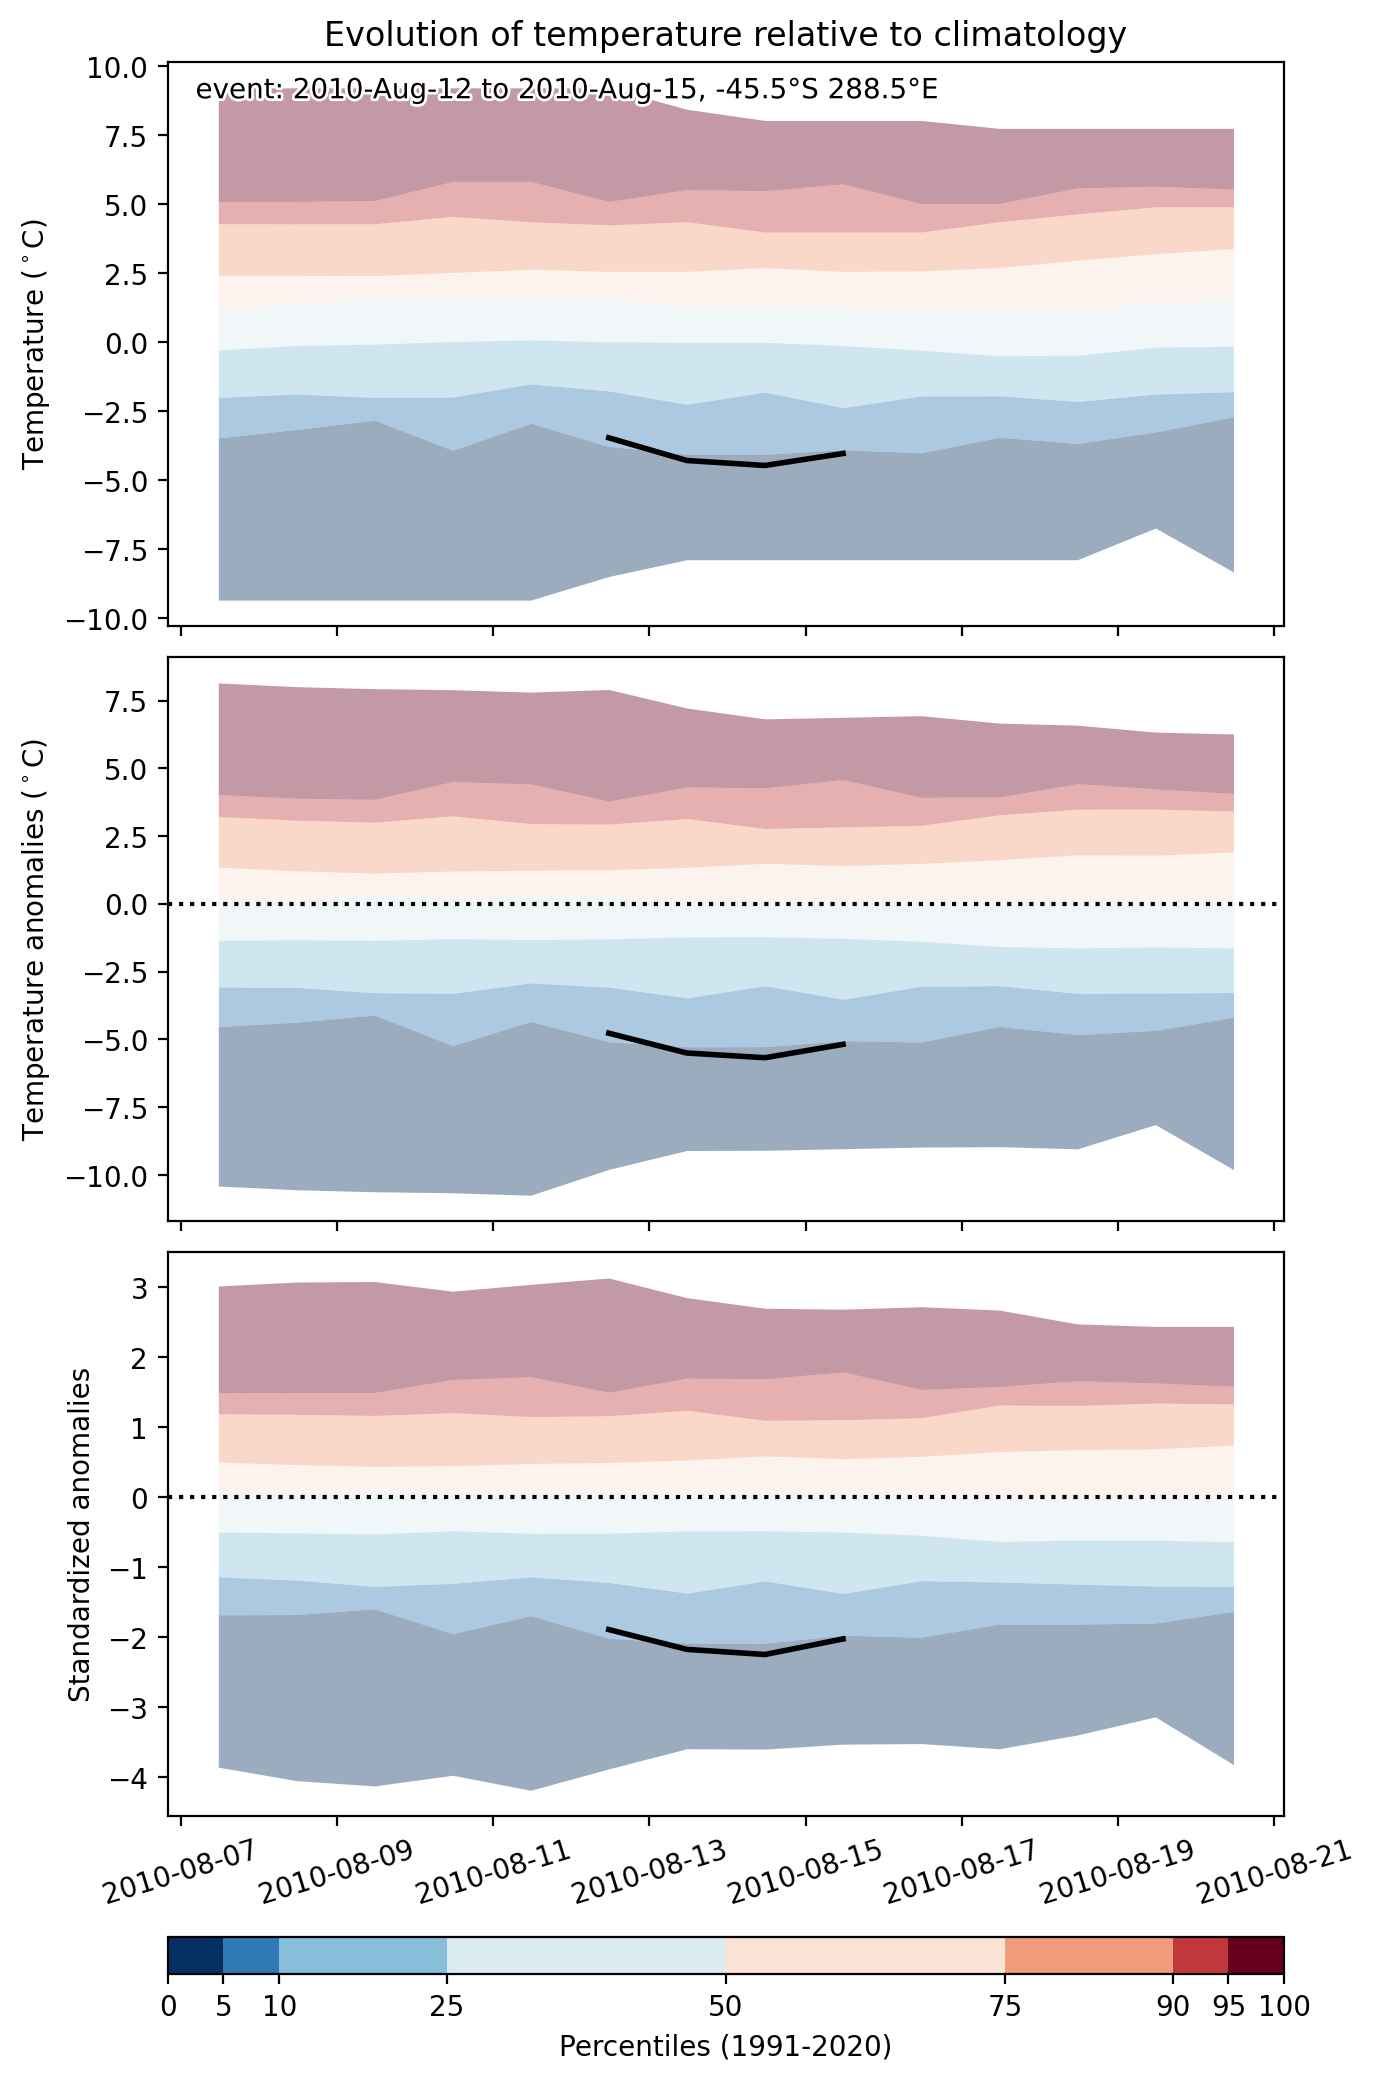
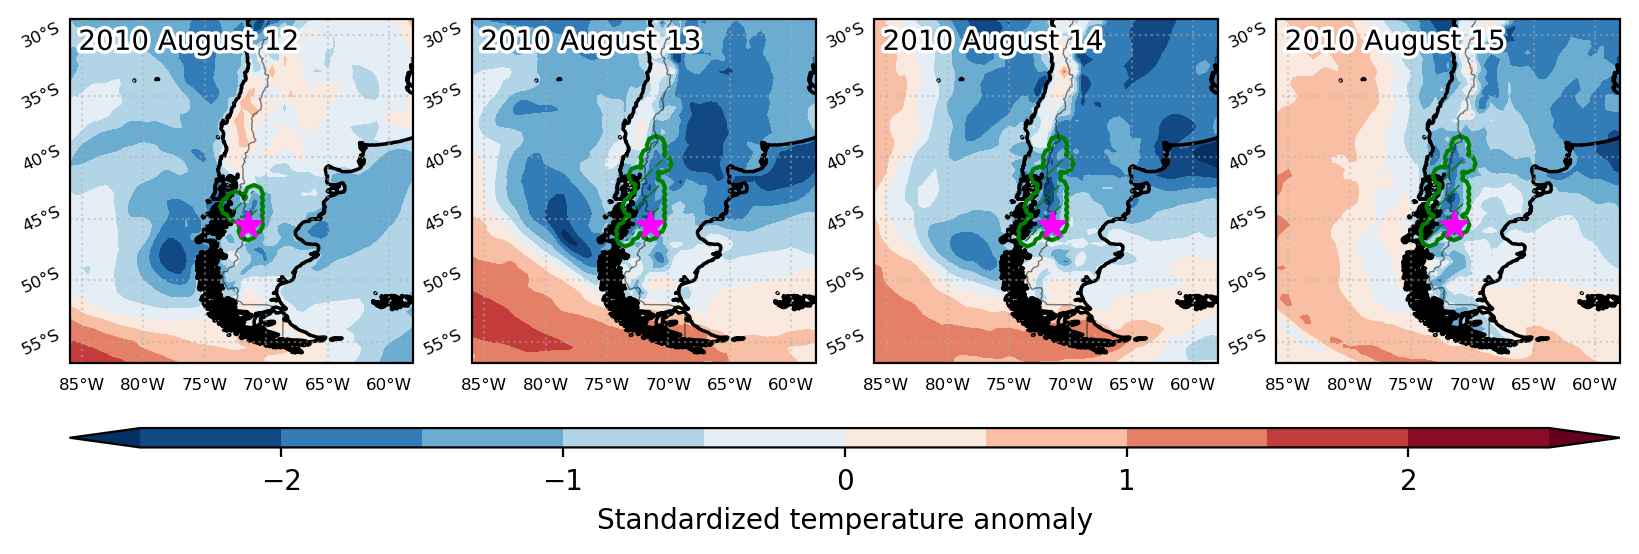
Cold spell occuring from August 12 2010 to August 15 2010 at -45.5°S 288.5°E

Download data: JSON

Event type: Cold spell

Countries affected (identified with ArcGIS Online; provided only for geographical reference):

  • Argentina
  • Chile

Duration: 4 days

Time span: August 12 2010 to August 15 2010

Statistics over entire affected area:

  • Mean temperature anomaly: -3.7 °C
  • Mean temperature: -2.4 °C
  • Minimum temperature anomaly: -5.7 °C
  • Minimum temperature: -5.2 °C

Event center: -45.5°S 288.5°E

Area affected: 98748 km$^2$


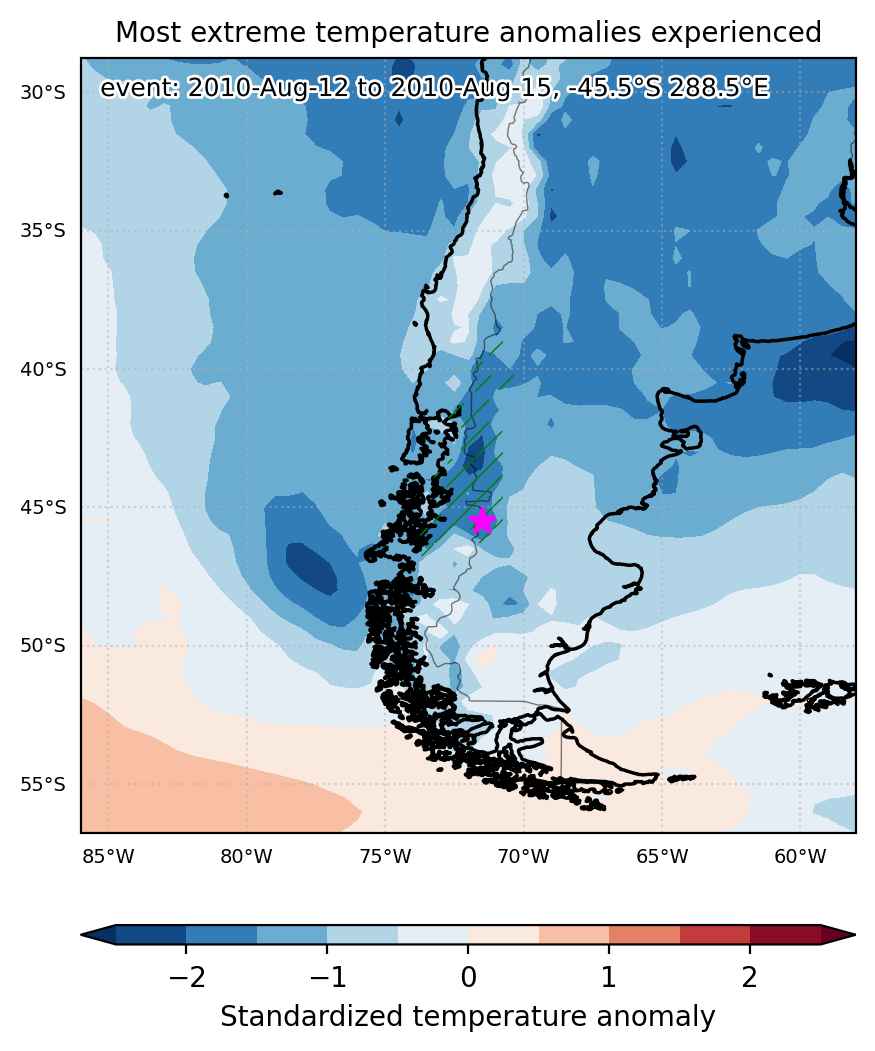
Fig. 1: Map of most extreme temperature anomalies (standardized) experienced during the event. The purple star indicates the center of the extreme event. Green hatching illustrates all areas under the effect of extremes at some time during the event.


Fig. 2: Evolution of temperature at the center of the event. The climatological percentile distribution is illustrated with color shadings.


Fig. 3: Maps illustrating the evolution of standardized temperature anomalies during the event.

Event ID: Cold_spell_2010-Aug-12_to_2010-Aug-15_288.5_-45.5

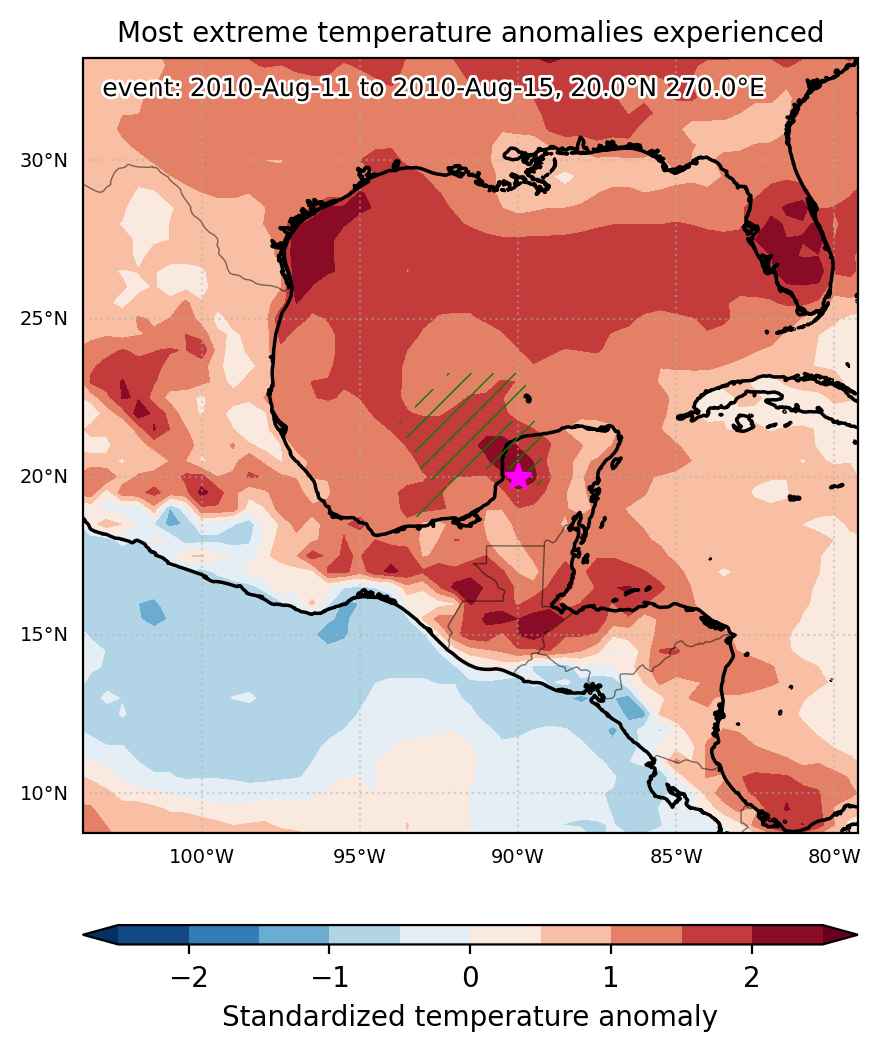
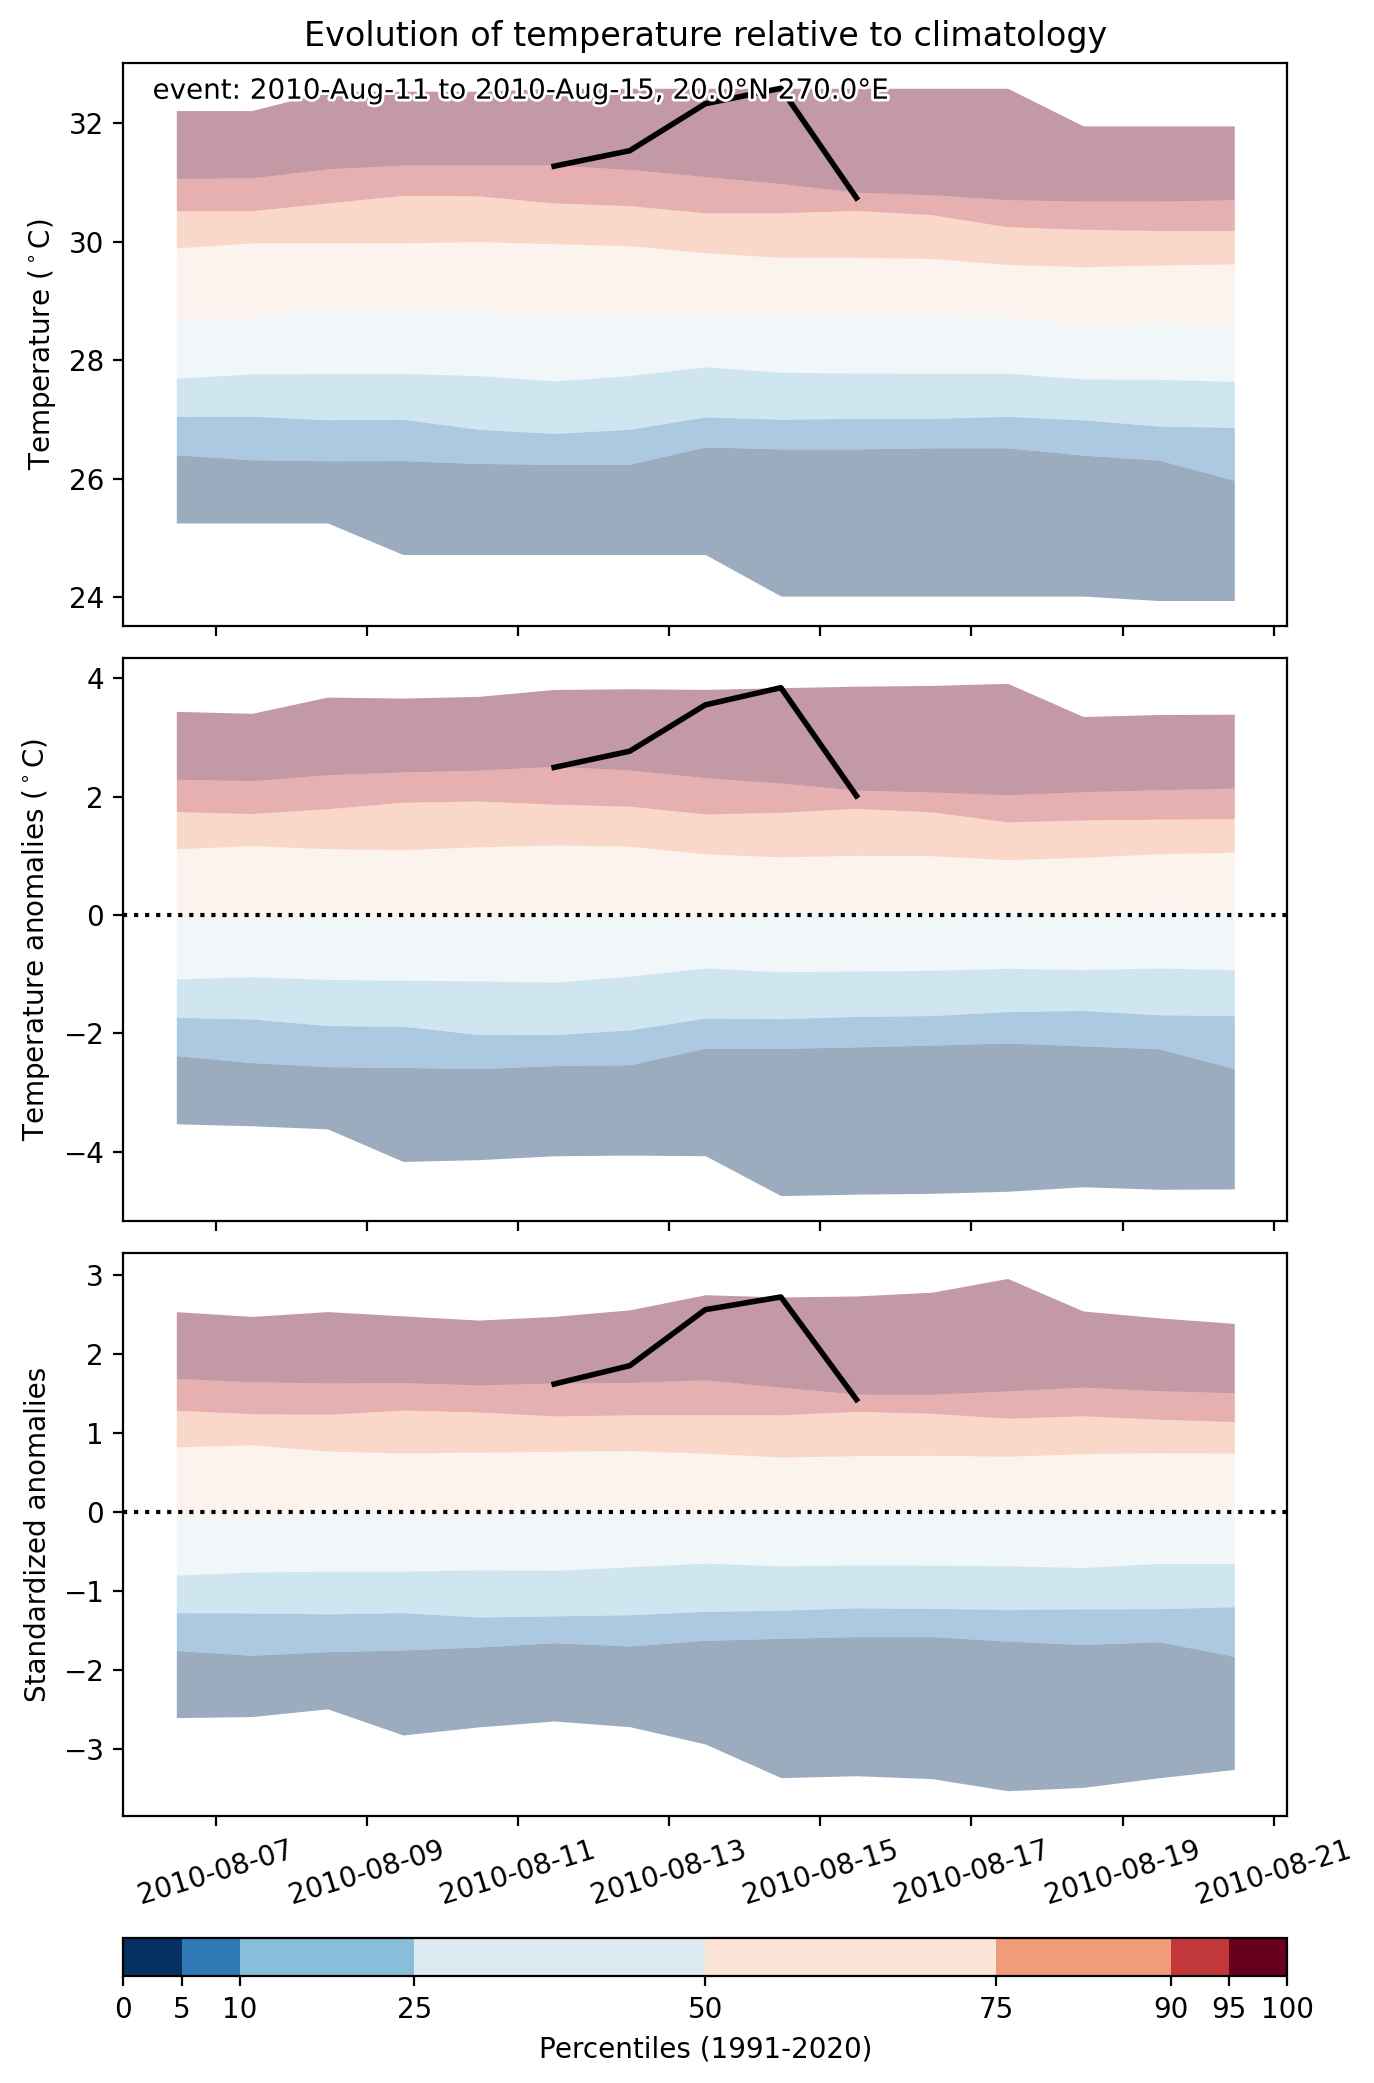
Heat wave occuring from August 11 2010 to August 15 2010 at 20.0°N 270.0°E

Download data: JSON

Event type: Heat wave

Countries affected (identified with ArcGIS Online; provided only for geographical reference):

  • Mexico

Duration: 5 days

Time span: August 11 2010 to August 15 2010

Statistics over entire affected area:

  • Mean temperature anomaly: 1.2 °C
  • Mean temperature: 29.4 °C
  • Maximum temperature anomaly: 3.8 °C
  • Maximum temperature: 32.6 °C

Event center: 20.0°N 270.0°E

Area affected: 141001 km$^2$


Fig. 1: Map of most extreme temperature anomalies (standardized) experienced during the event. The purple star indicates the center of the extreme event. Green hatching illustrates all areas under the effect of extremes at some time during the event.


Fig. 2: Evolution of temperature at the center of the event. The climatological percentile distribution is illustrated with color shadings.


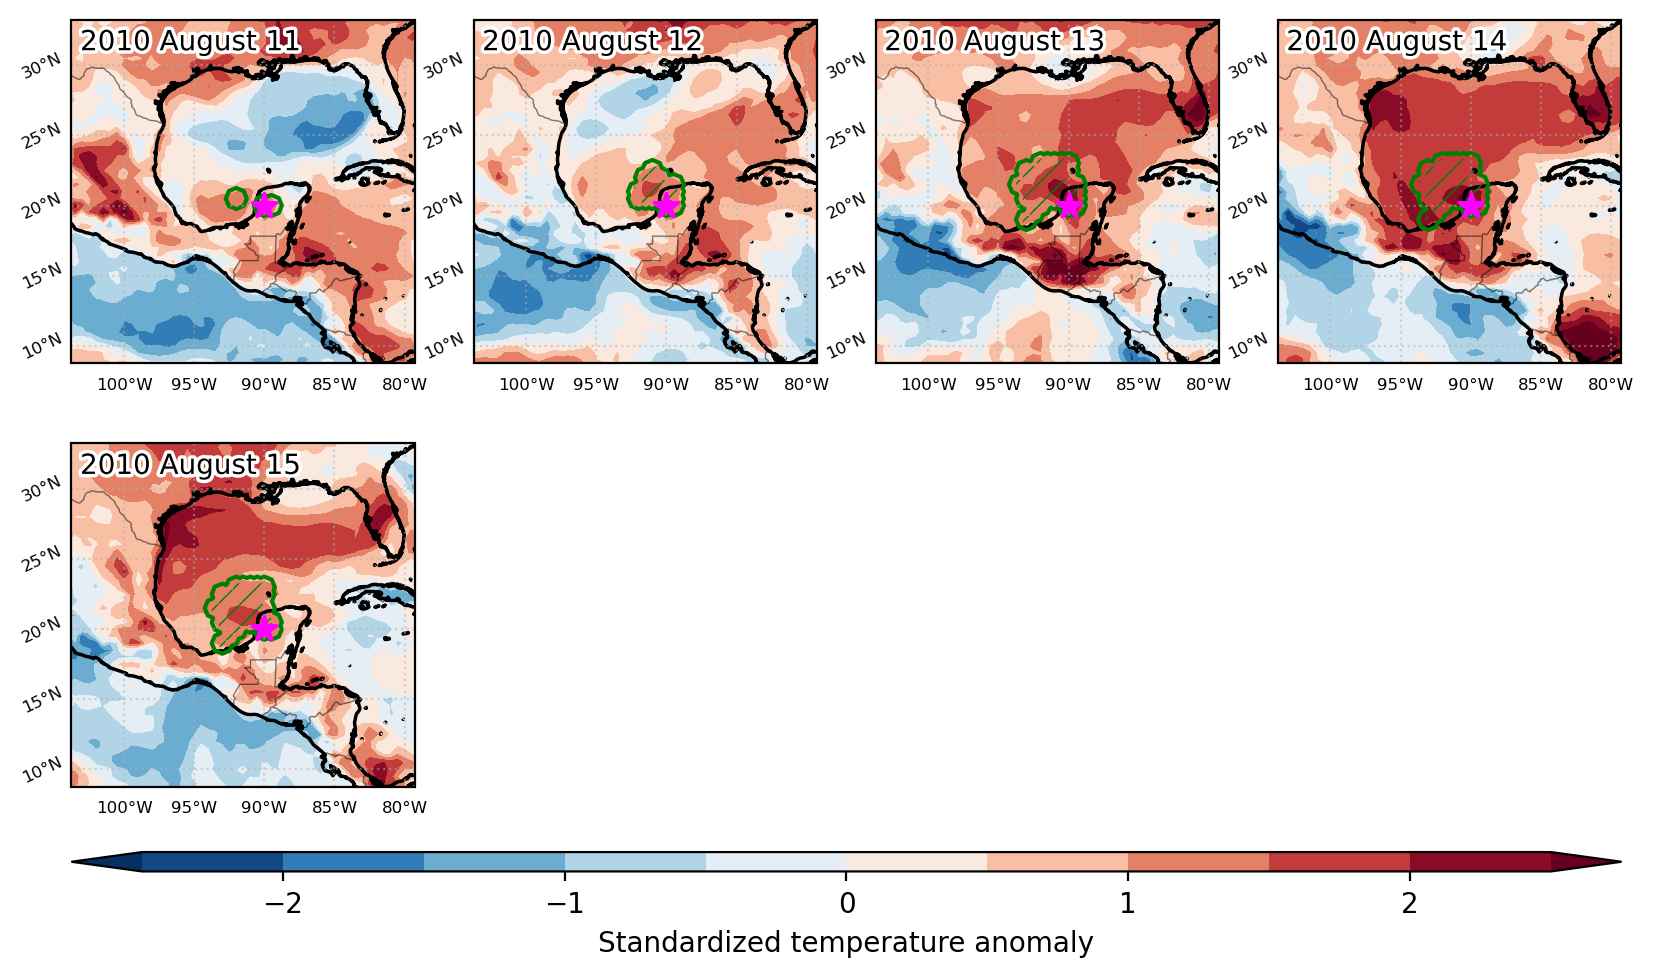
Fig. 3: Maps illustrating the evolution of standardized temperature anomalies during the event.

Event ID: Heat_wave_2010-Aug-11_to_2010-Aug-15_270.0_20.0

Cold spell occuring from August 11 2010 to August 15 2010 at 53.0°N 100.5°E

Download data: JSON

Event type: Cold spell

Countries affected (identified with ArcGIS Online; provided only for geographical reference):

  • Mongolia
  • Russian Federation

Duration: 5 days

Time span: August 11 2010 to August 15 2010

Statistics over entire affected area:

  • Mean temperature anomaly: -6.5 °C
  • Mean temperature: 5.3 °C
  • Minimum temperature anomaly: -9.7 °C
  • Minimum temperature: -0.7 °C

Event center: 53.0°N 100.5°E

Area affected: 129090 km$^2$


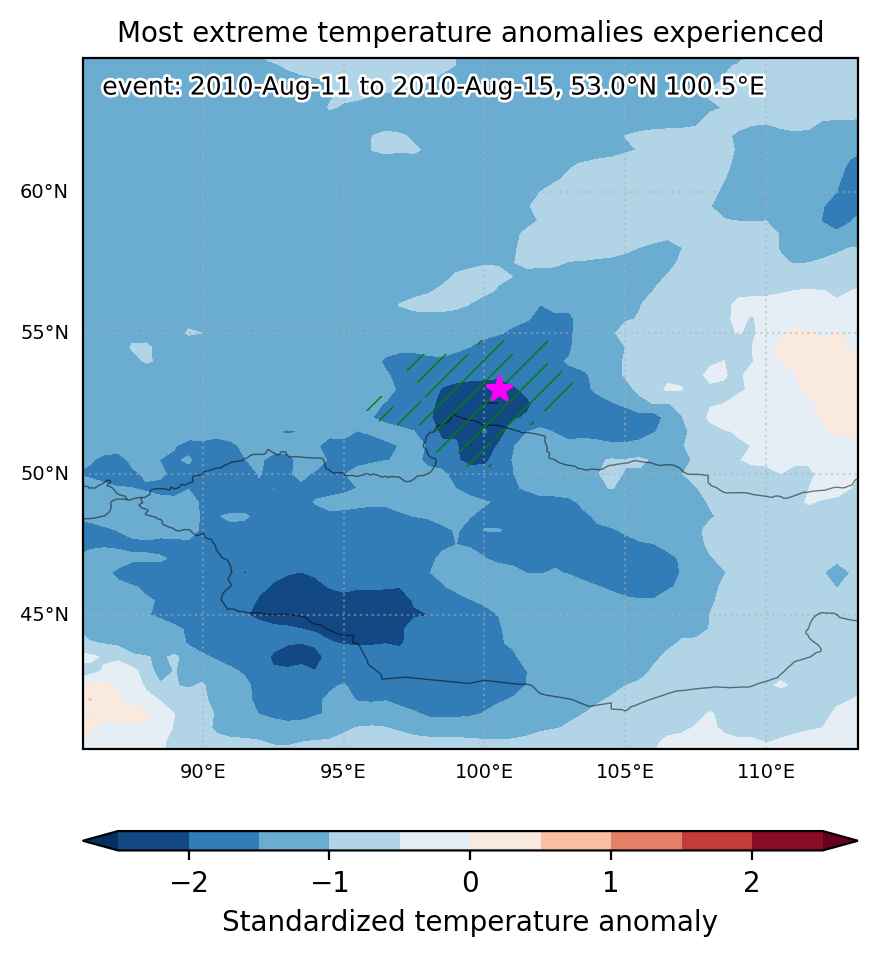
Fig. 1: Map of most extreme temperature anomalies (standardized) experienced during the event. The purple star indicates the center of the extreme event. Green hatching illustrates all areas under the effect of extremes at some time during the event.


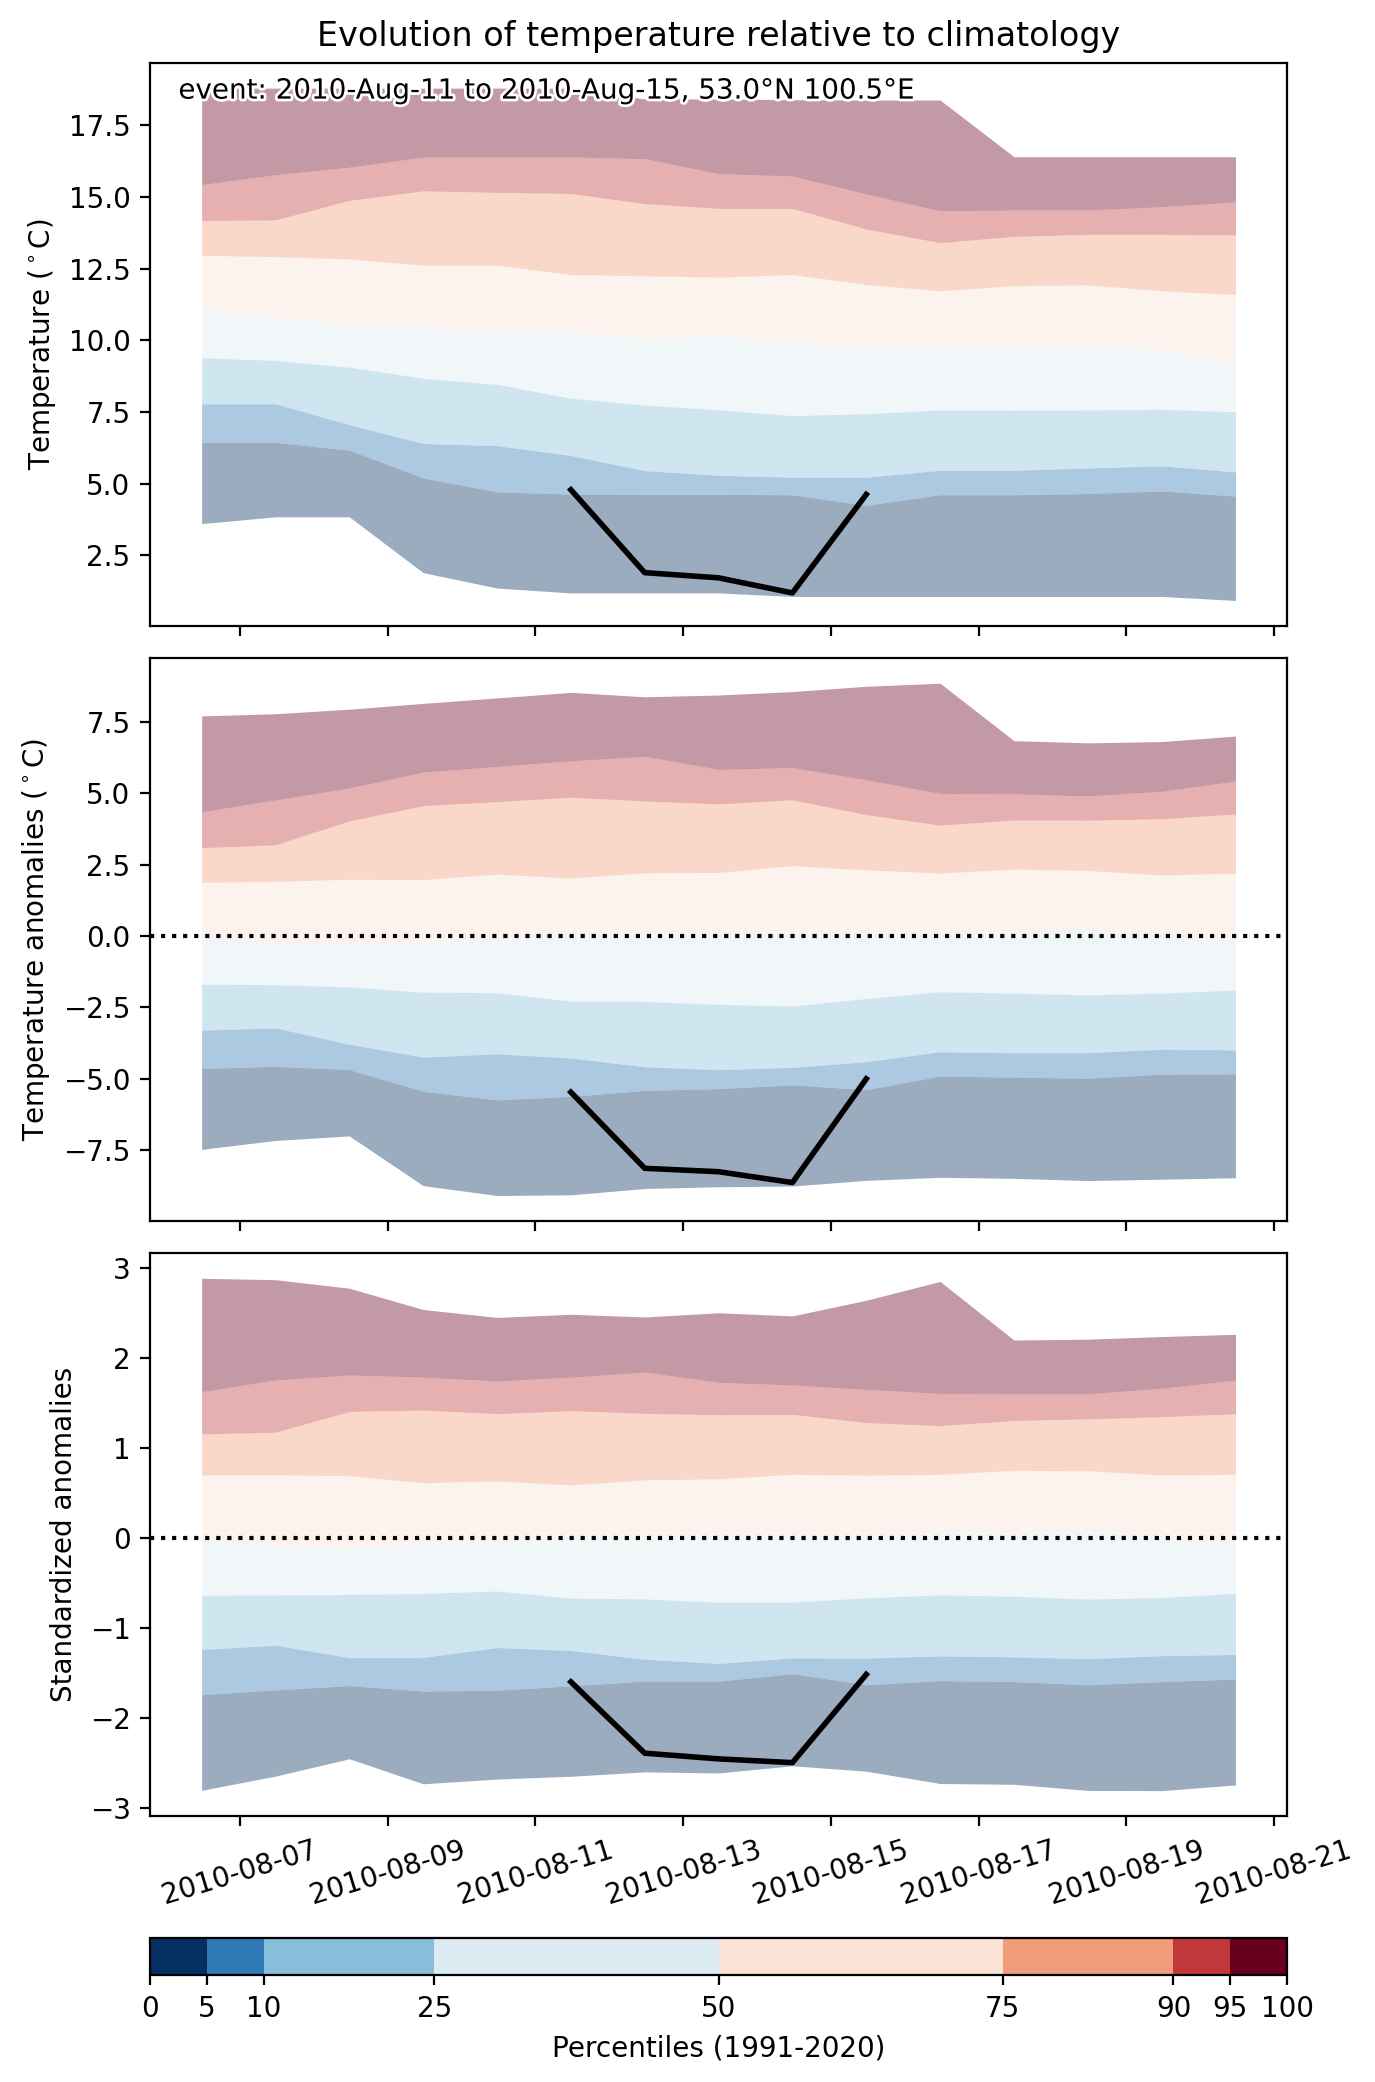
Fig. 2: Evolution of temperature at the center of the event. The climatological percentile distribution is illustrated with color shadings.


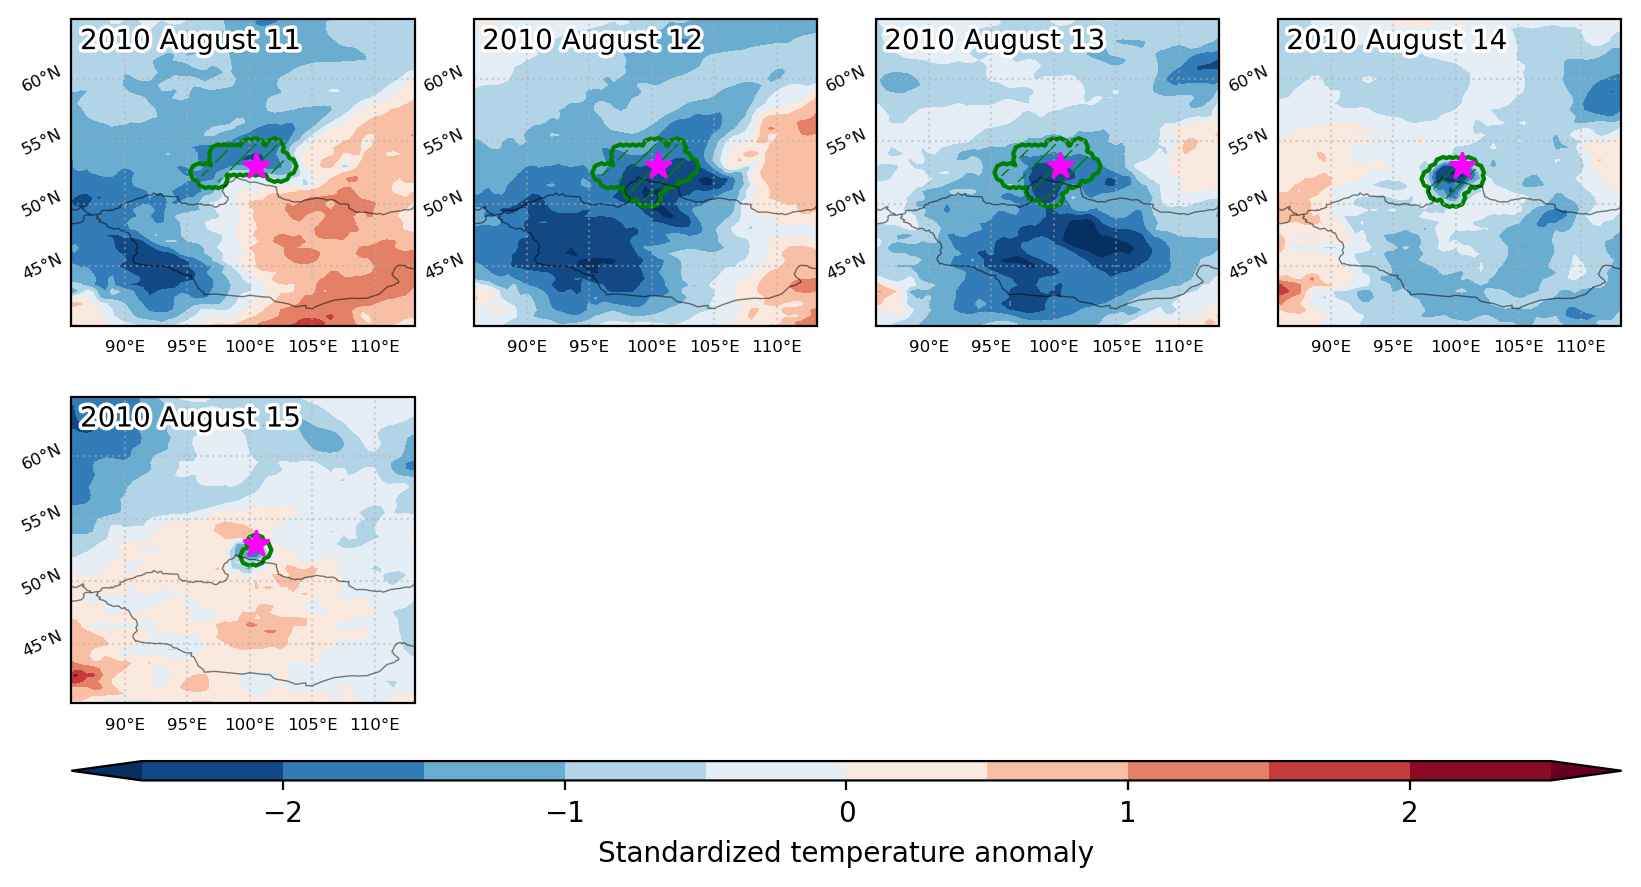
Fig. 3: Maps illustrating the evolution of standardized temperature anomalies during the event.

Event ID: Cold_spell_2010-Aug-11_to_2010-Aug-15_100.5_53.0

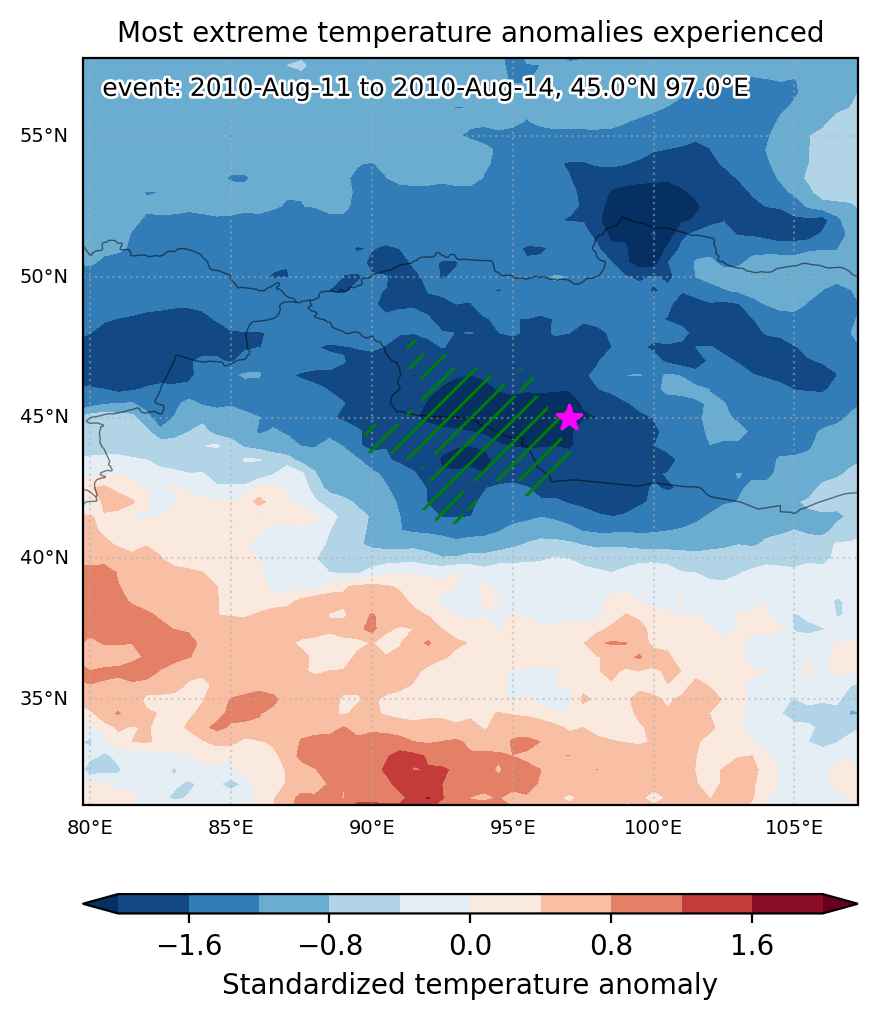
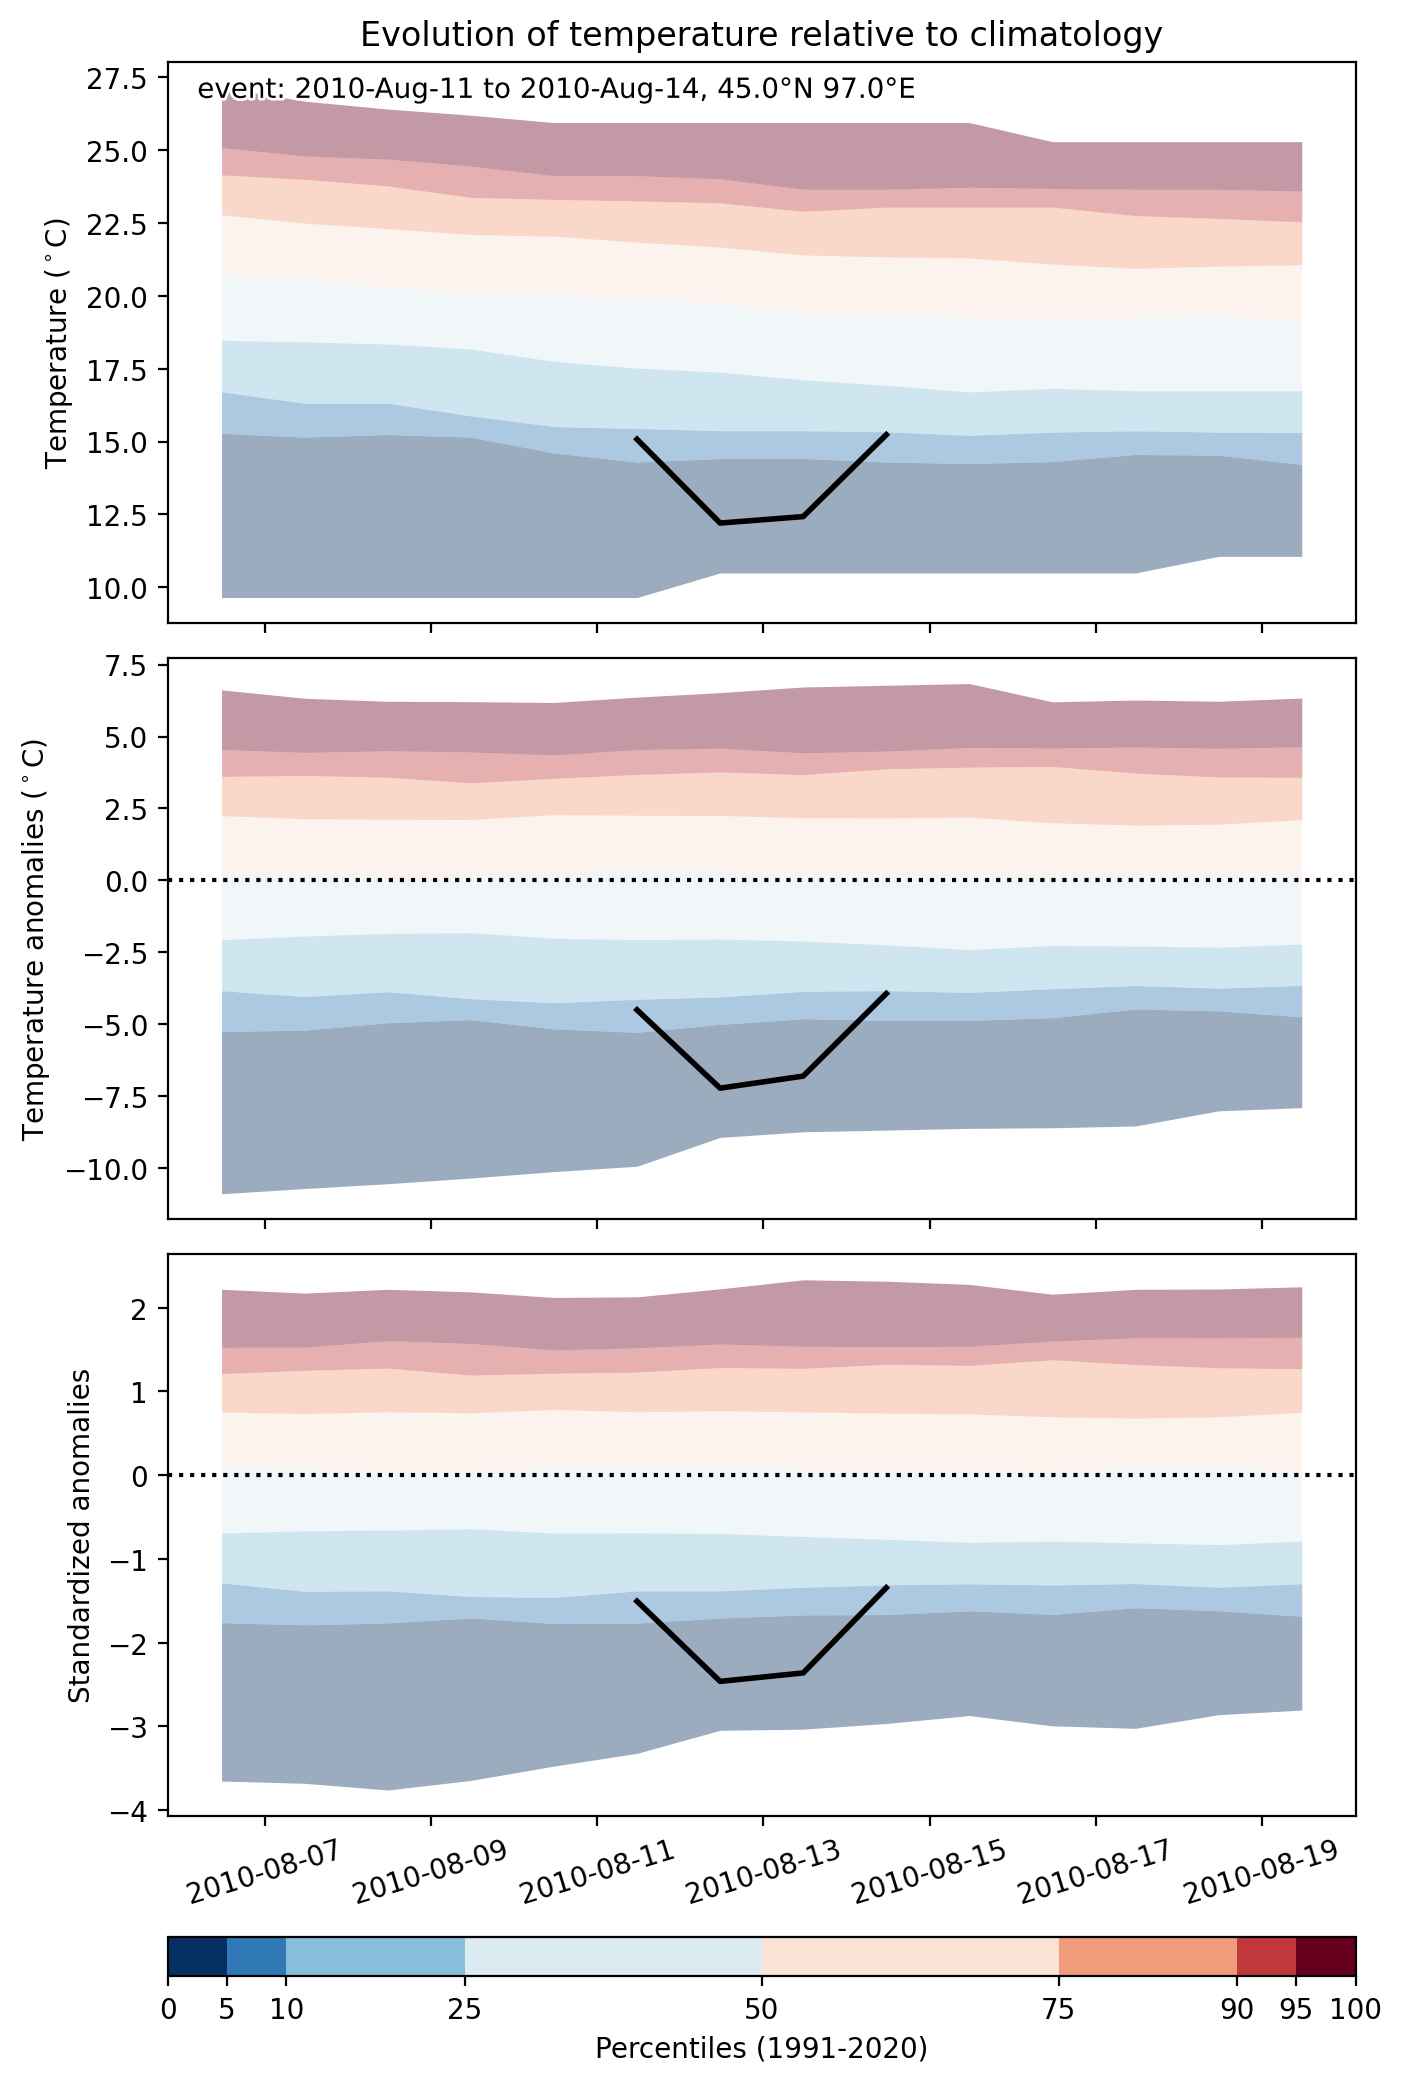
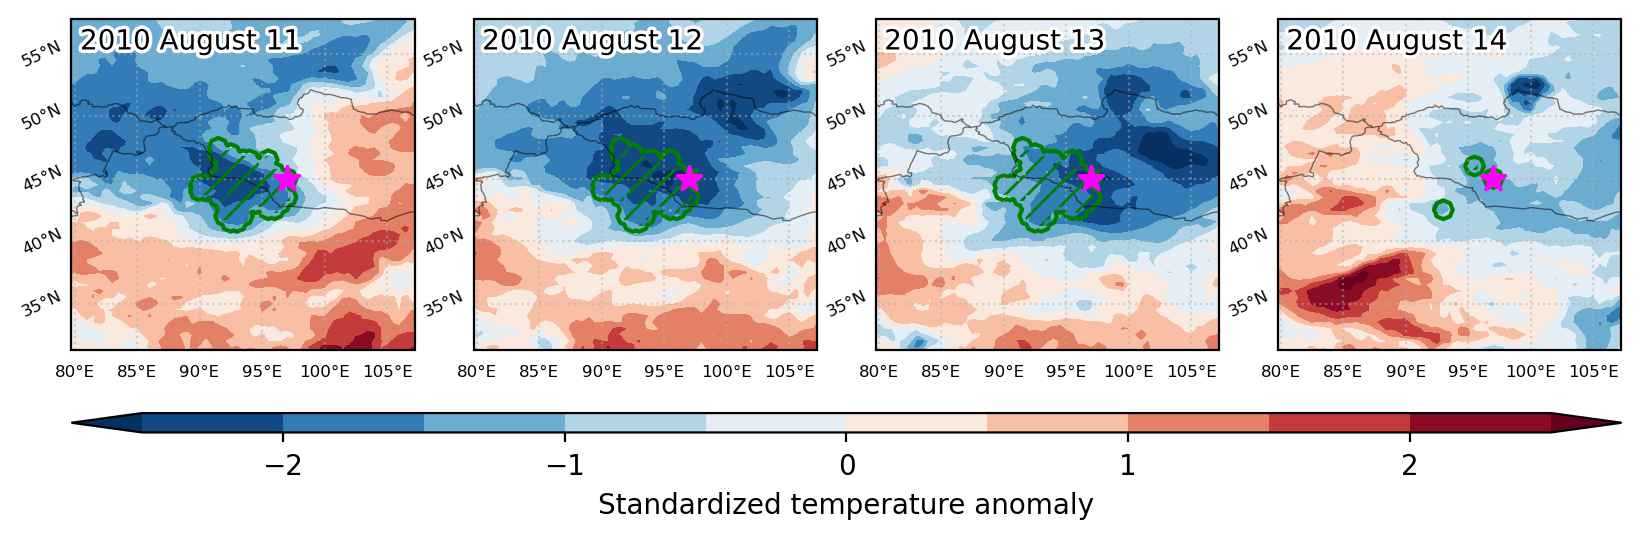
Cold spell occuring from August 11 2010 to August 14 2010 at 45.0°N 97.0°E

Download data: JSON

Event type: Cold spell

Countries affected (identified with ArcGIS Online; provided only for geographical reference):

  • China
  • Mongolia

Duration: 4 days

Time span: August 11 2010 to August 14 2010

Statistics over entire affected area:

  • Mean temperature anomaly: -6.4 °C
  • Mean temperature: 14.0 °C
  • Minimum temperature anomaly: -9.1 °C
  • Minimum temperature: 0.9 °C

Event center: 45.0°N 97.0°E

Area affected: 214138 km$^2$


Fig. 1: Map of most extreme temperature anomalies (standardized) experienced during the event. The purple star indicates the center of the extreme event. Green hatching illustrates all areas under the effect of extremes at some time during the event.


Fig. 2: Evolution of temperature at the center of the event. The climatological percentile distribution is illustrated with color shadings.


Fig. 3: Maps illustrating the evolution of standardized temperature anomalies during the event.

Event ID: Cold_spell_2010-Aug-11_to_2010-Aug-14_97.0_45.0

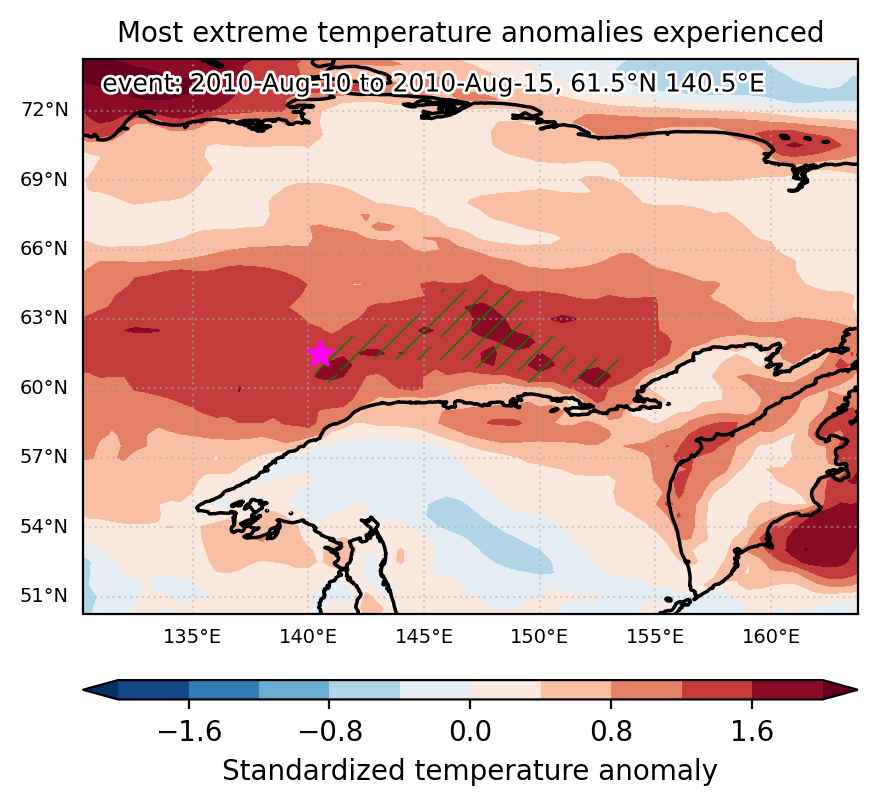
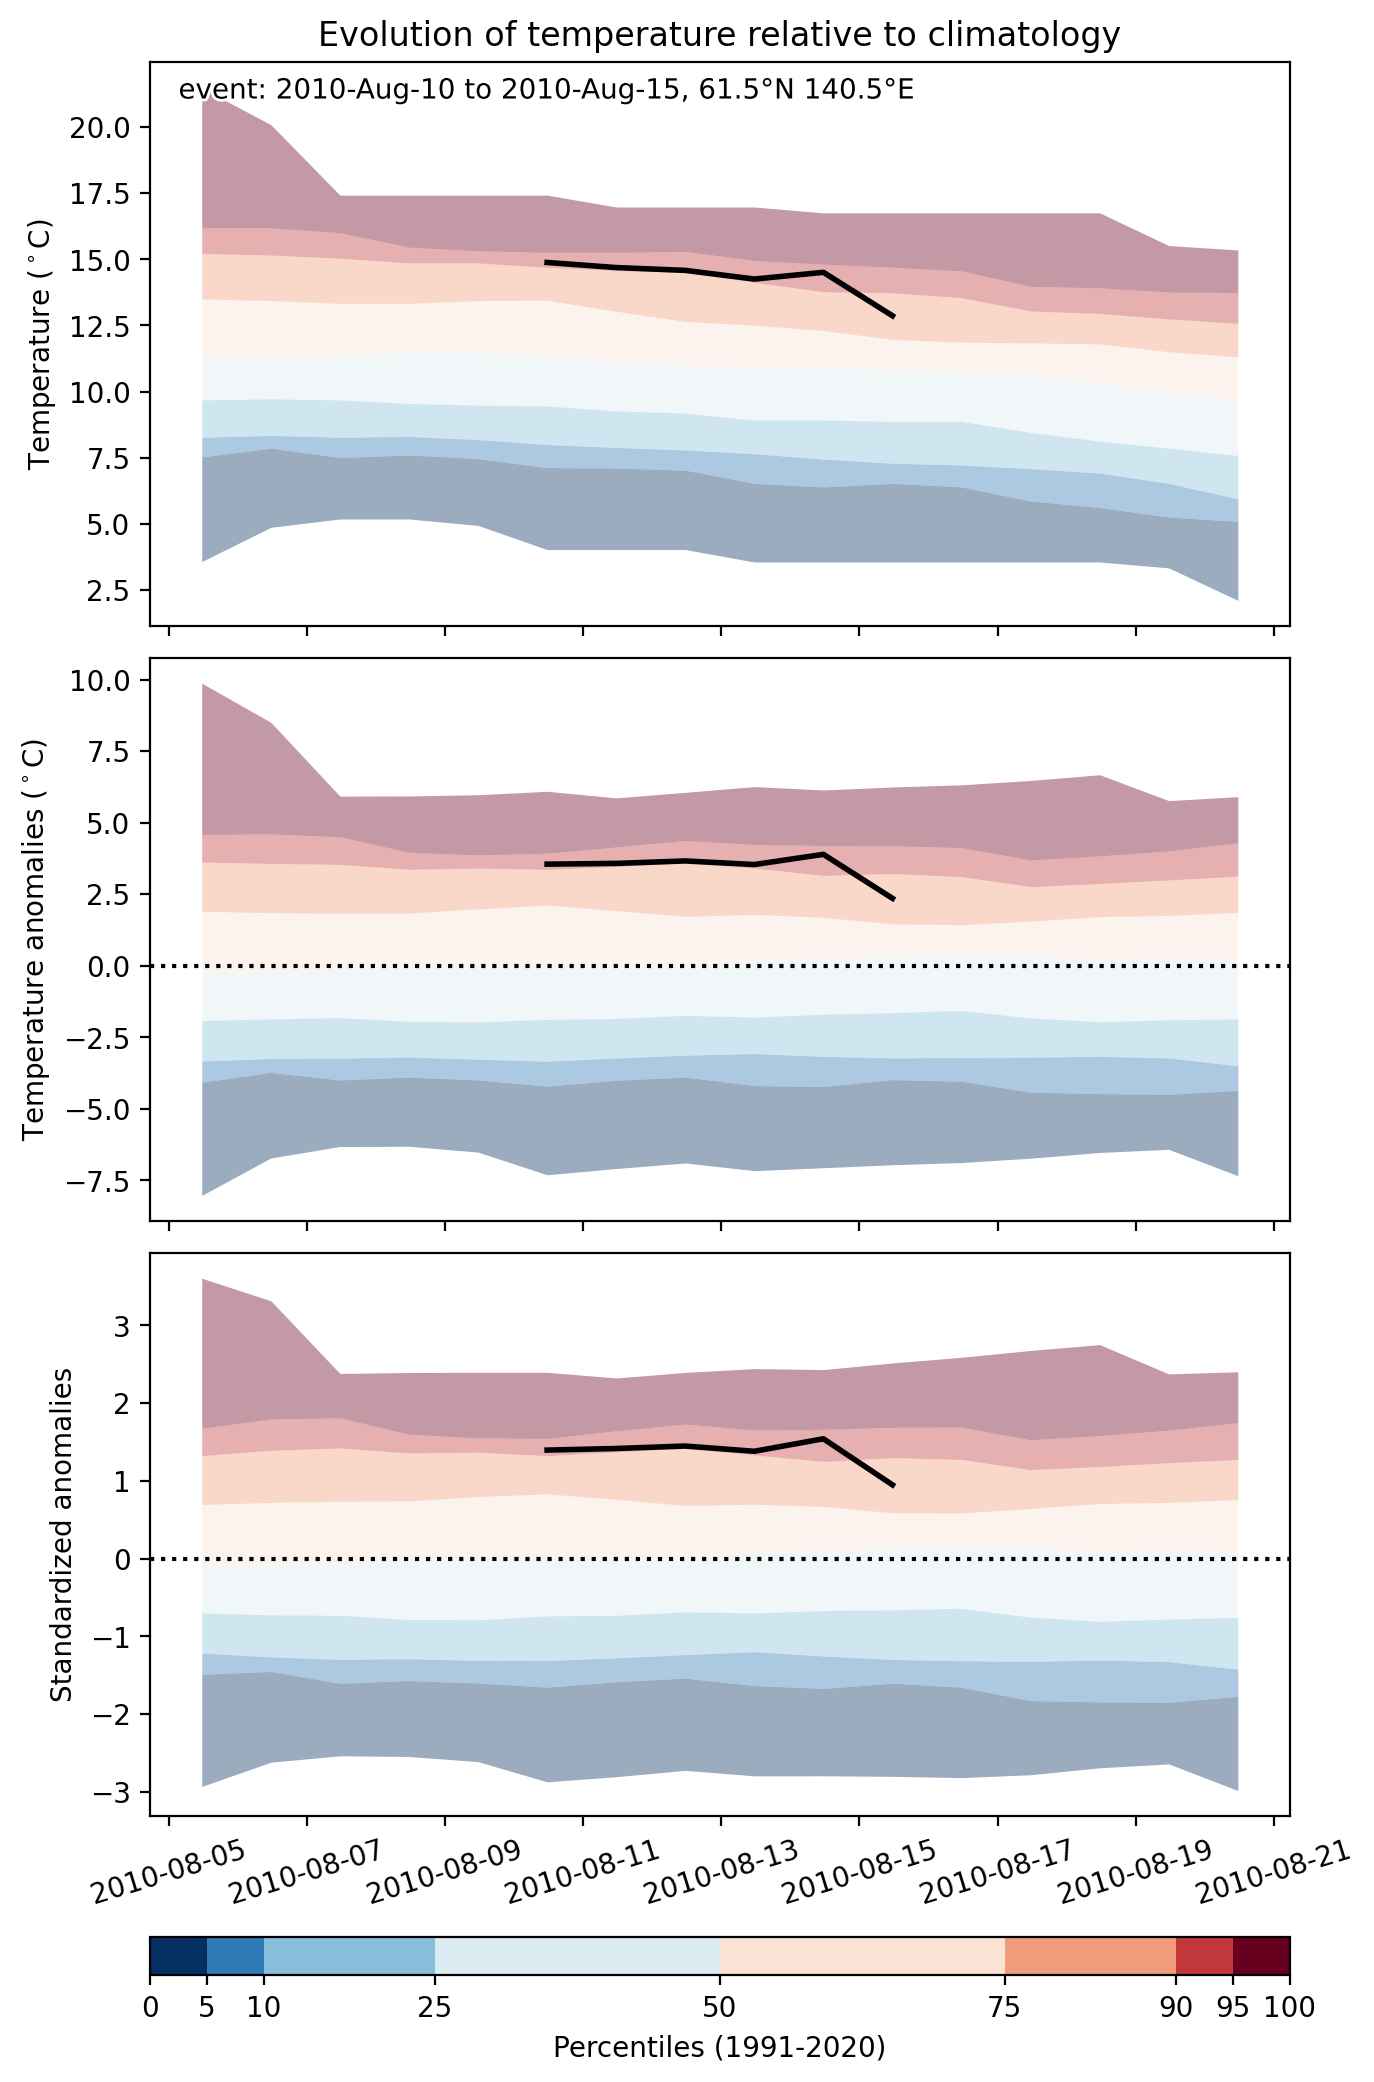
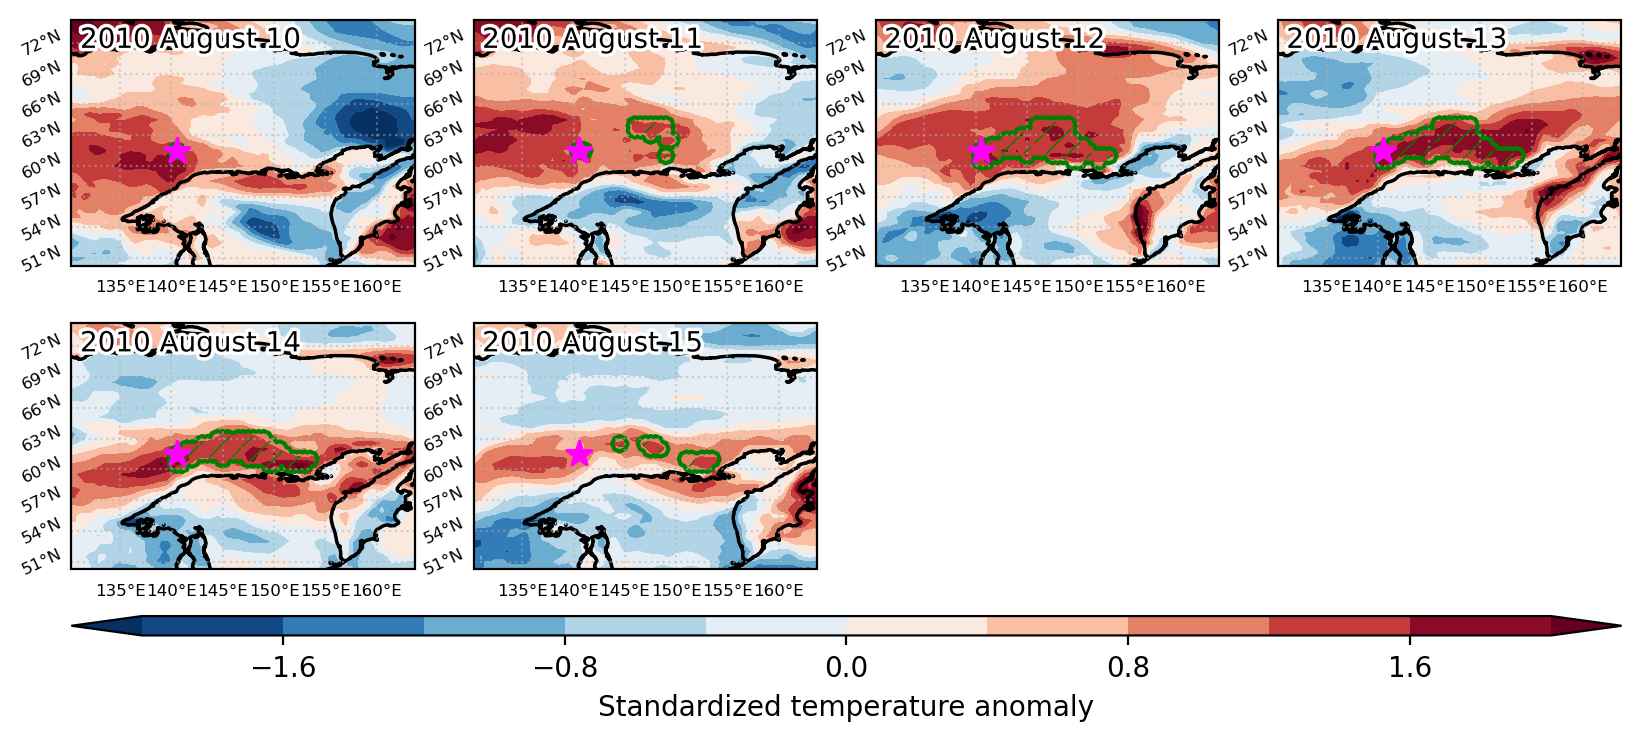
Heat wave occuring from August 10 2010 to August 15 2010 at 61.5°N 140.5°E

Download data: JSON

Event type: Heat wave

Countries affected (identified with ArcGIS Online; provided only for geographical reference):

  • Russian Federation

Duration: 6 days

Time span: August 10 2010 to August 15 2010

Statistics over entire affected area:

  • Mean temperature anomaly: 4.6 °C
  • Mean temperature: 14.9 °C
  • Maximum temperature anomaly: 6.7 °C
  • Maximum temperature: 18.0 °C

Event center: 61.5°N 140.5°E

Area affected: 146594 km$^2$


Fig. 1: Map of most extreme temperature anomalies (standardized) experienced during the event. The purple star indicates the center of the extreme event. Green hatching illustrates all areas under the effect of extremes at some time during the event.


Fig. 2: Evolution of temperature at the center of the event. The climatological percentile distribution is illustrated with color shadings.


Fig. 3: Maps illustrating the evolution of standardized temperature anomalies during the event.

Event ID: Heat_wave_2010-Aug-10_to_2010-Aug-15_140.5_61.5