Heat wave occuring from April 02 2019 to April 08 2019 at 55.5°N 21.0°E

Download data: JSON

Event type: Heat wave

Countries affected (identified with ArcGIS Online; provided only for geographical reference):

  • Czech Republic
  • Denmark
  • Estonia
  • Finland
  • Germany
  • Latvia
  • Lithuania
  • Poland
  • Sweden

Duration: 7 days

Time span: April 02 2019 to April 08 2019

Statistics over entire affected area:

  • Mean temperature anomaly: 3.7 °C
  • Mean temperature: 8.5 °C
  • Maximum temperature anomaly: 7.6 °C
  • Maximum temperature: 15.5 °C

Event center: 55.5°N 21.0°E

Area affected: 540754 km$^2$
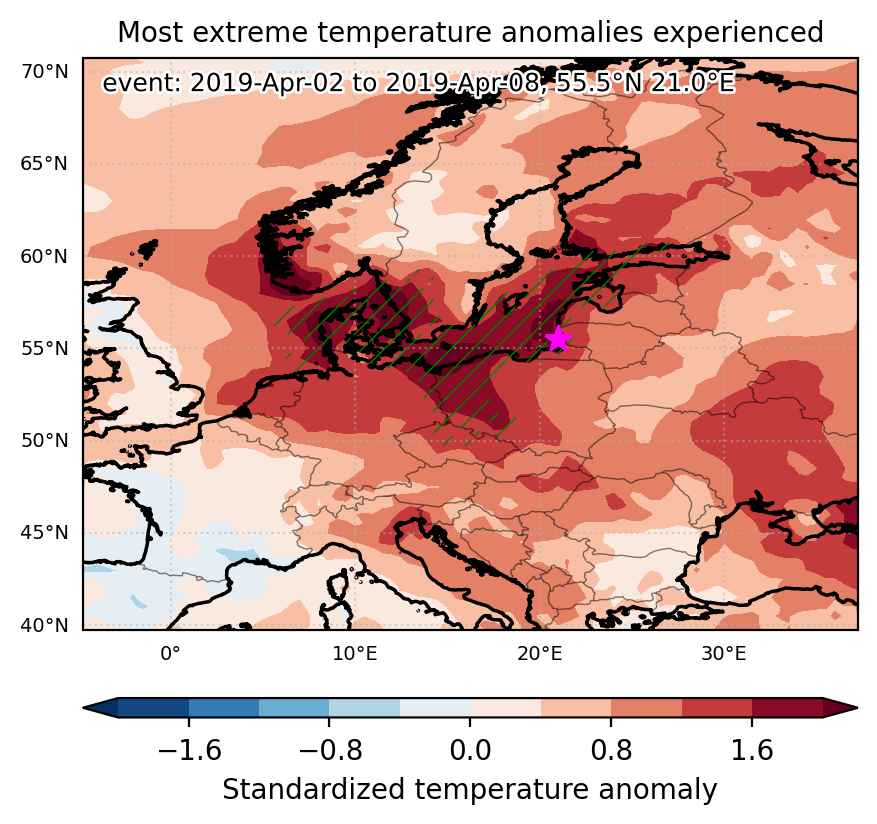

Fig. 1: Map of most extreme temperature anomalies (standardized) experienced during the event. The purple star indicates the center of the extreme event. Green hatching illustrates all areas under the effect of extremes at some time during the event.
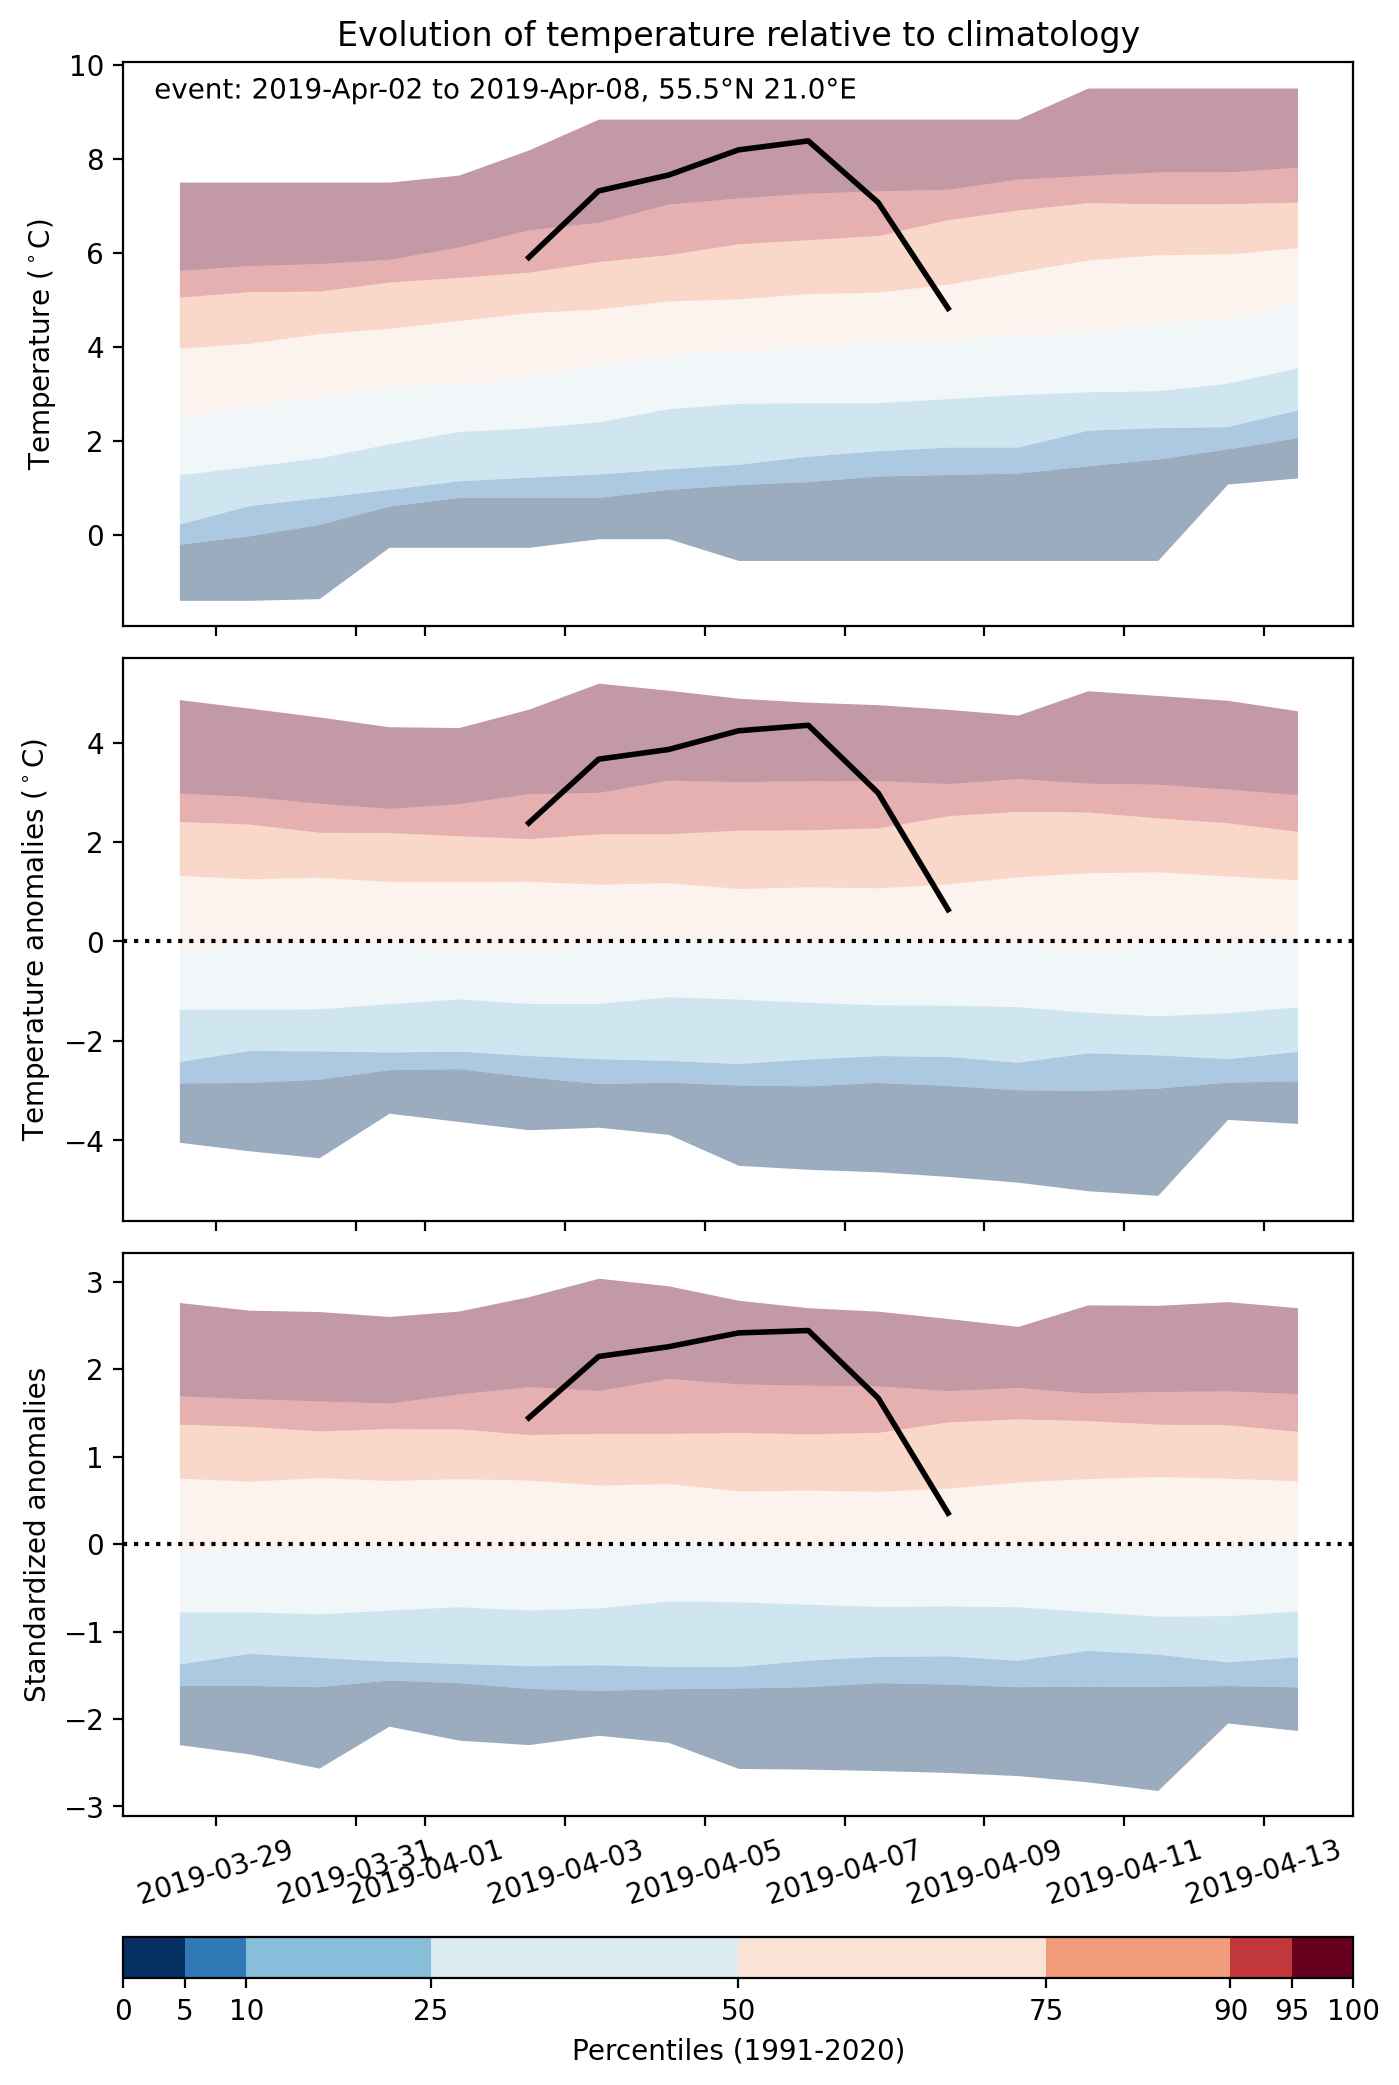


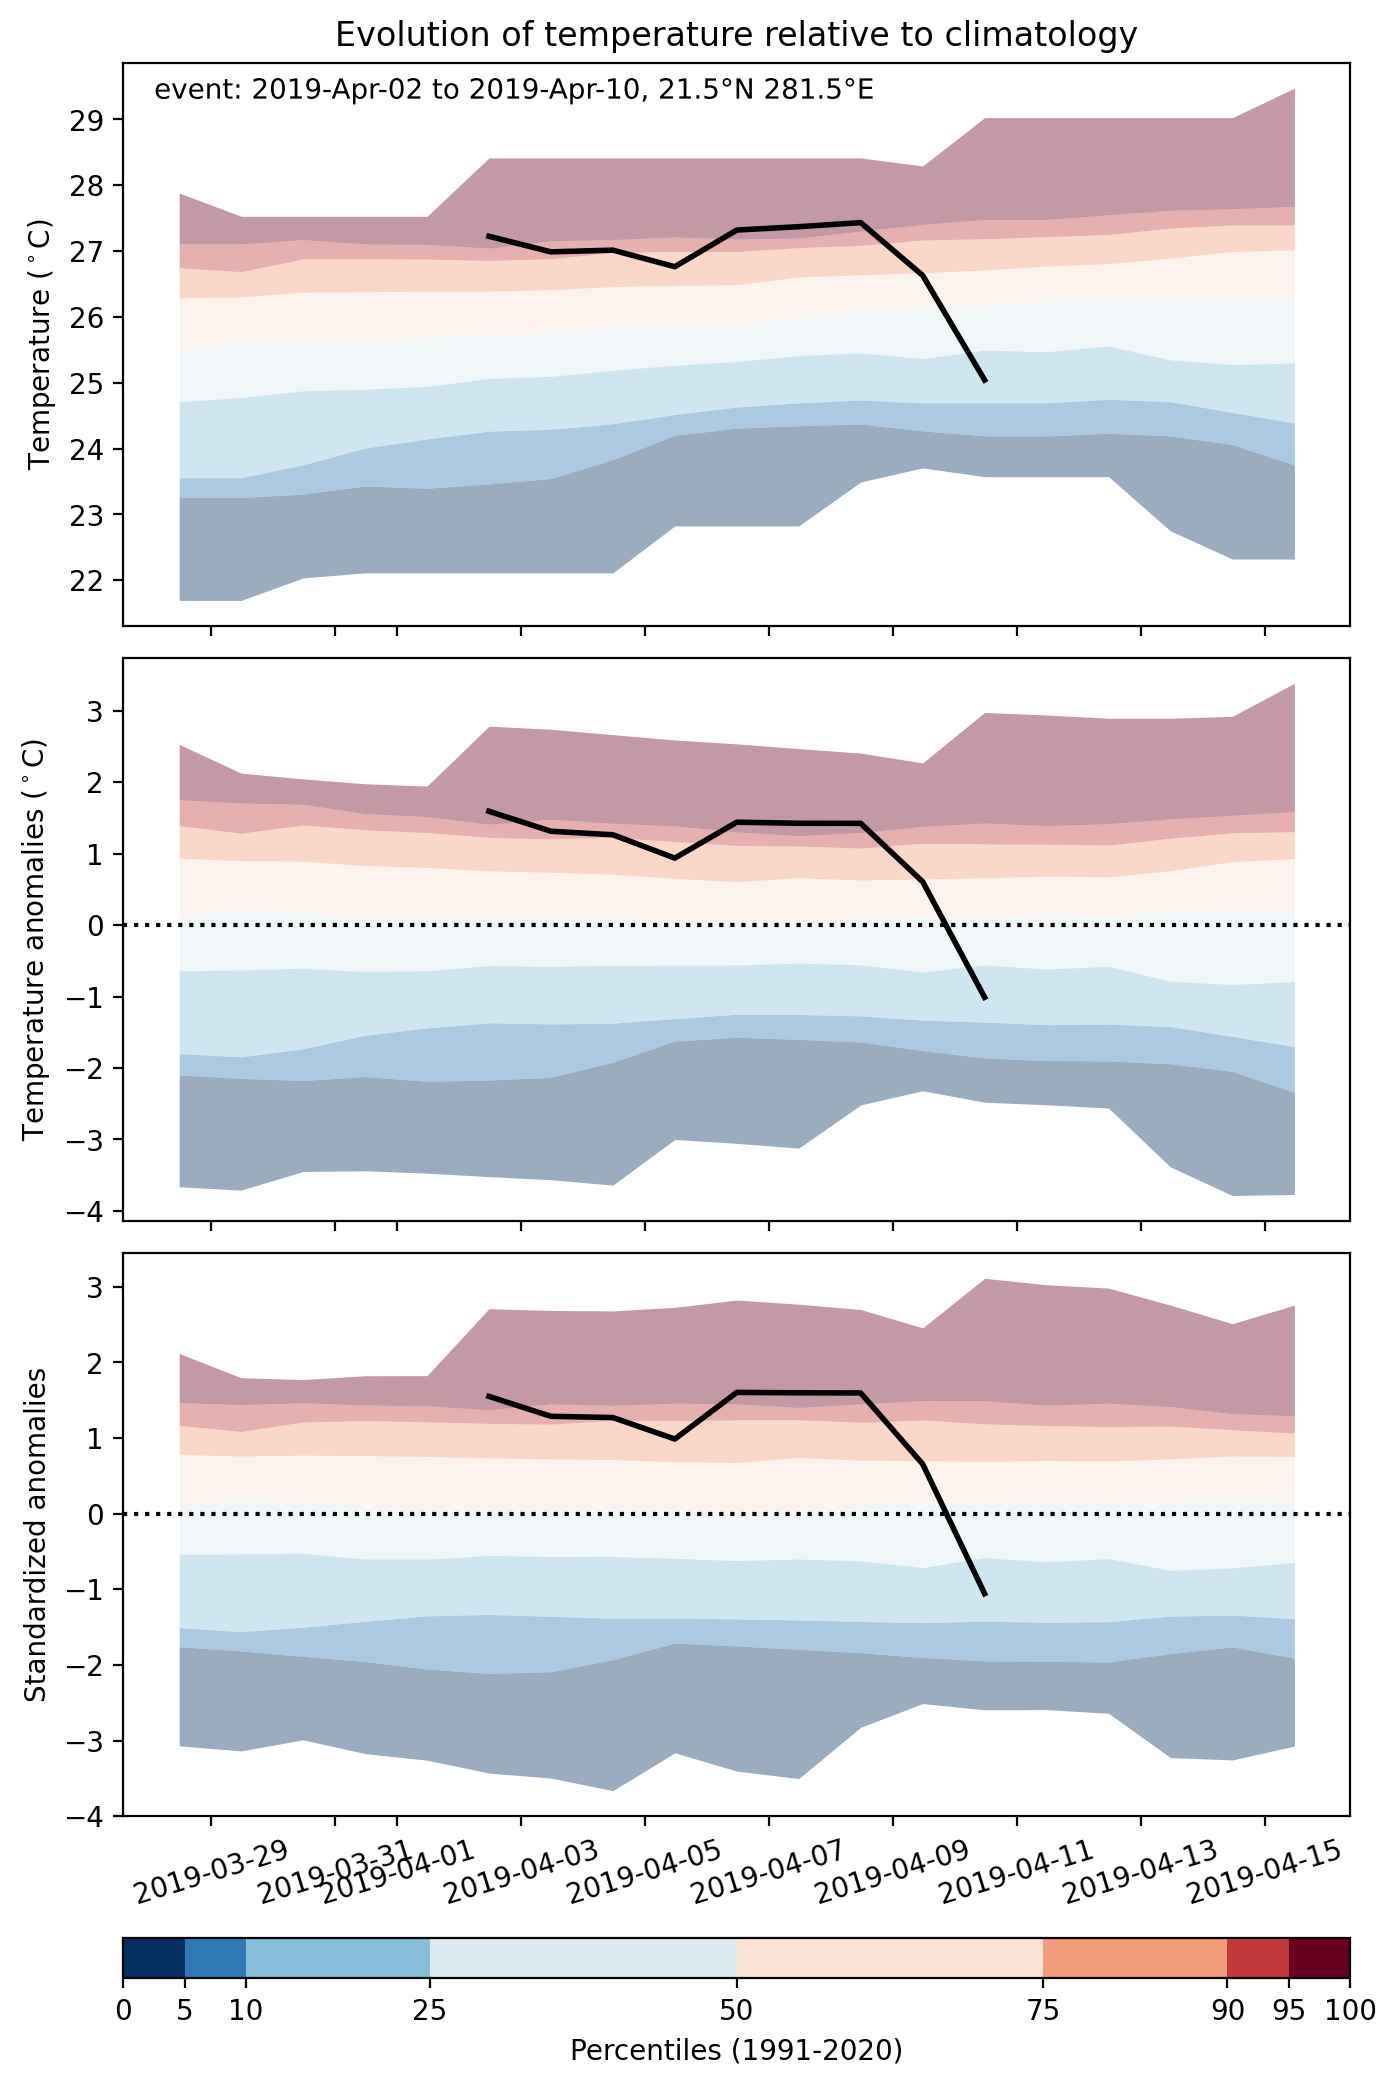
Fig. 2: Evolution of temperature at the center of the event. The climatological percentile distribution is illustrated with color shadings.
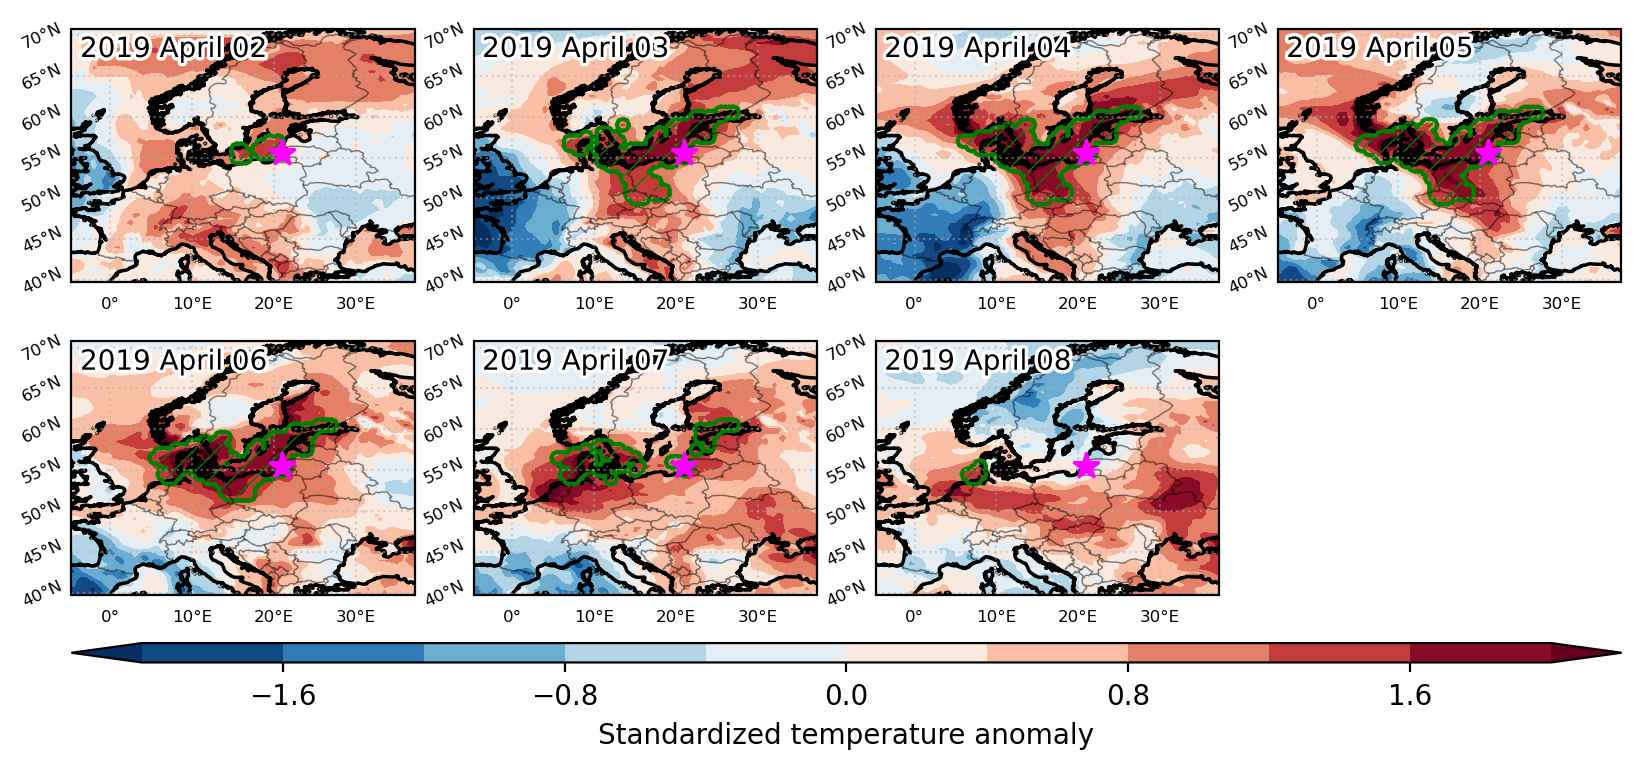


Fig. 3: Maps illustrating the evolution of standardized temperature anomalies during the event.

Event ID: Heat_wave_2019-Apr-02_to_2019-Apr-08_21.0_55.5
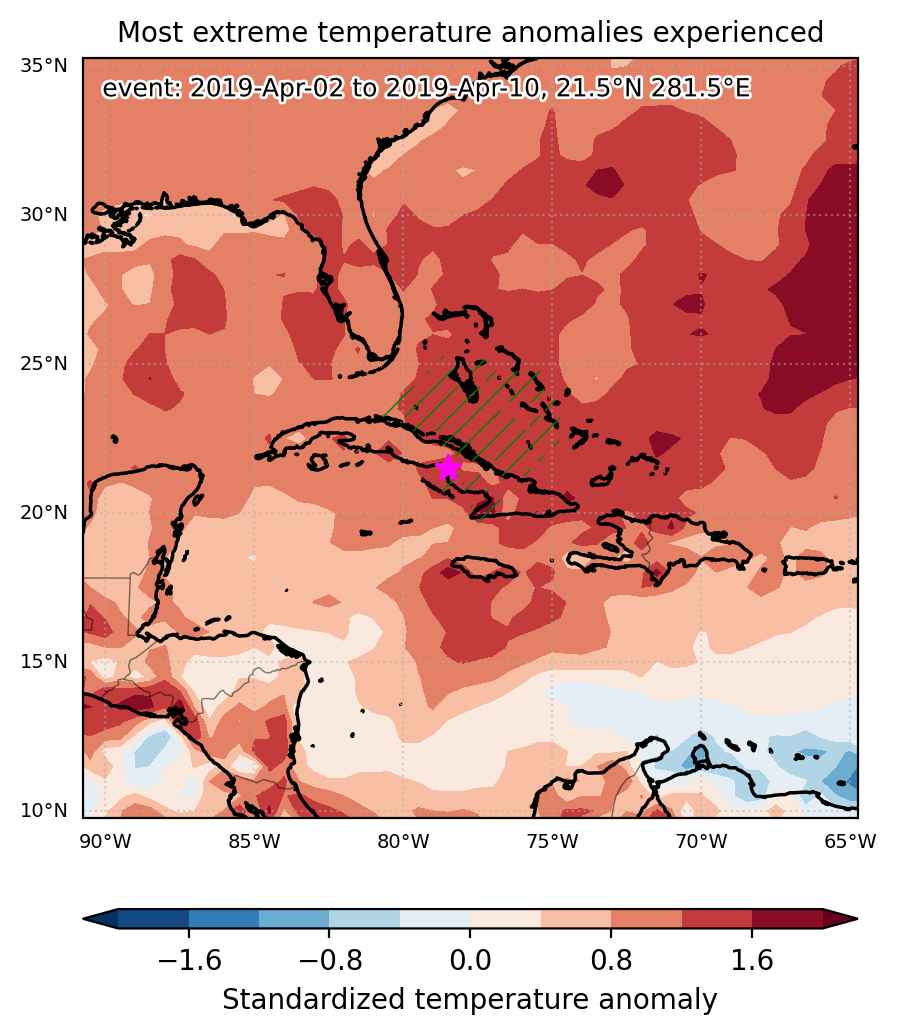
Heat wave occuring from April 02 2019 to April 10 2019 at 21.5°N 281.5°E

Download data: JSON

Event type: Heat wave

Countries affected (identified with ArcGIS Online; provided only for geographical reference):

  • Cuba

Duration: 9 days

Time span: April 02 2019 to April 10 2019

Statistics over entire affected area:

  • Mean temperature anomaly: 1.2 °C
  • Mean temperature: 25.8 °C
  • Maximum temperature anomaly: 1.9 °C
  • Maximum temperature: 28.9 °C

Event center: 21.5°N 281.5°E

Area affected: 167870 km$^2$


Fig. 1: Map of most extreme temperature anomalies (standardized) experienced during the event. The purple star indicates the center of the extreme event. Green hatching illustrates all areas under the effect of extremes at some time during the event.


Fig. 2: Evolution of temperature at the center of the event. The climatological percentile distribution is illustrated with color shadings.


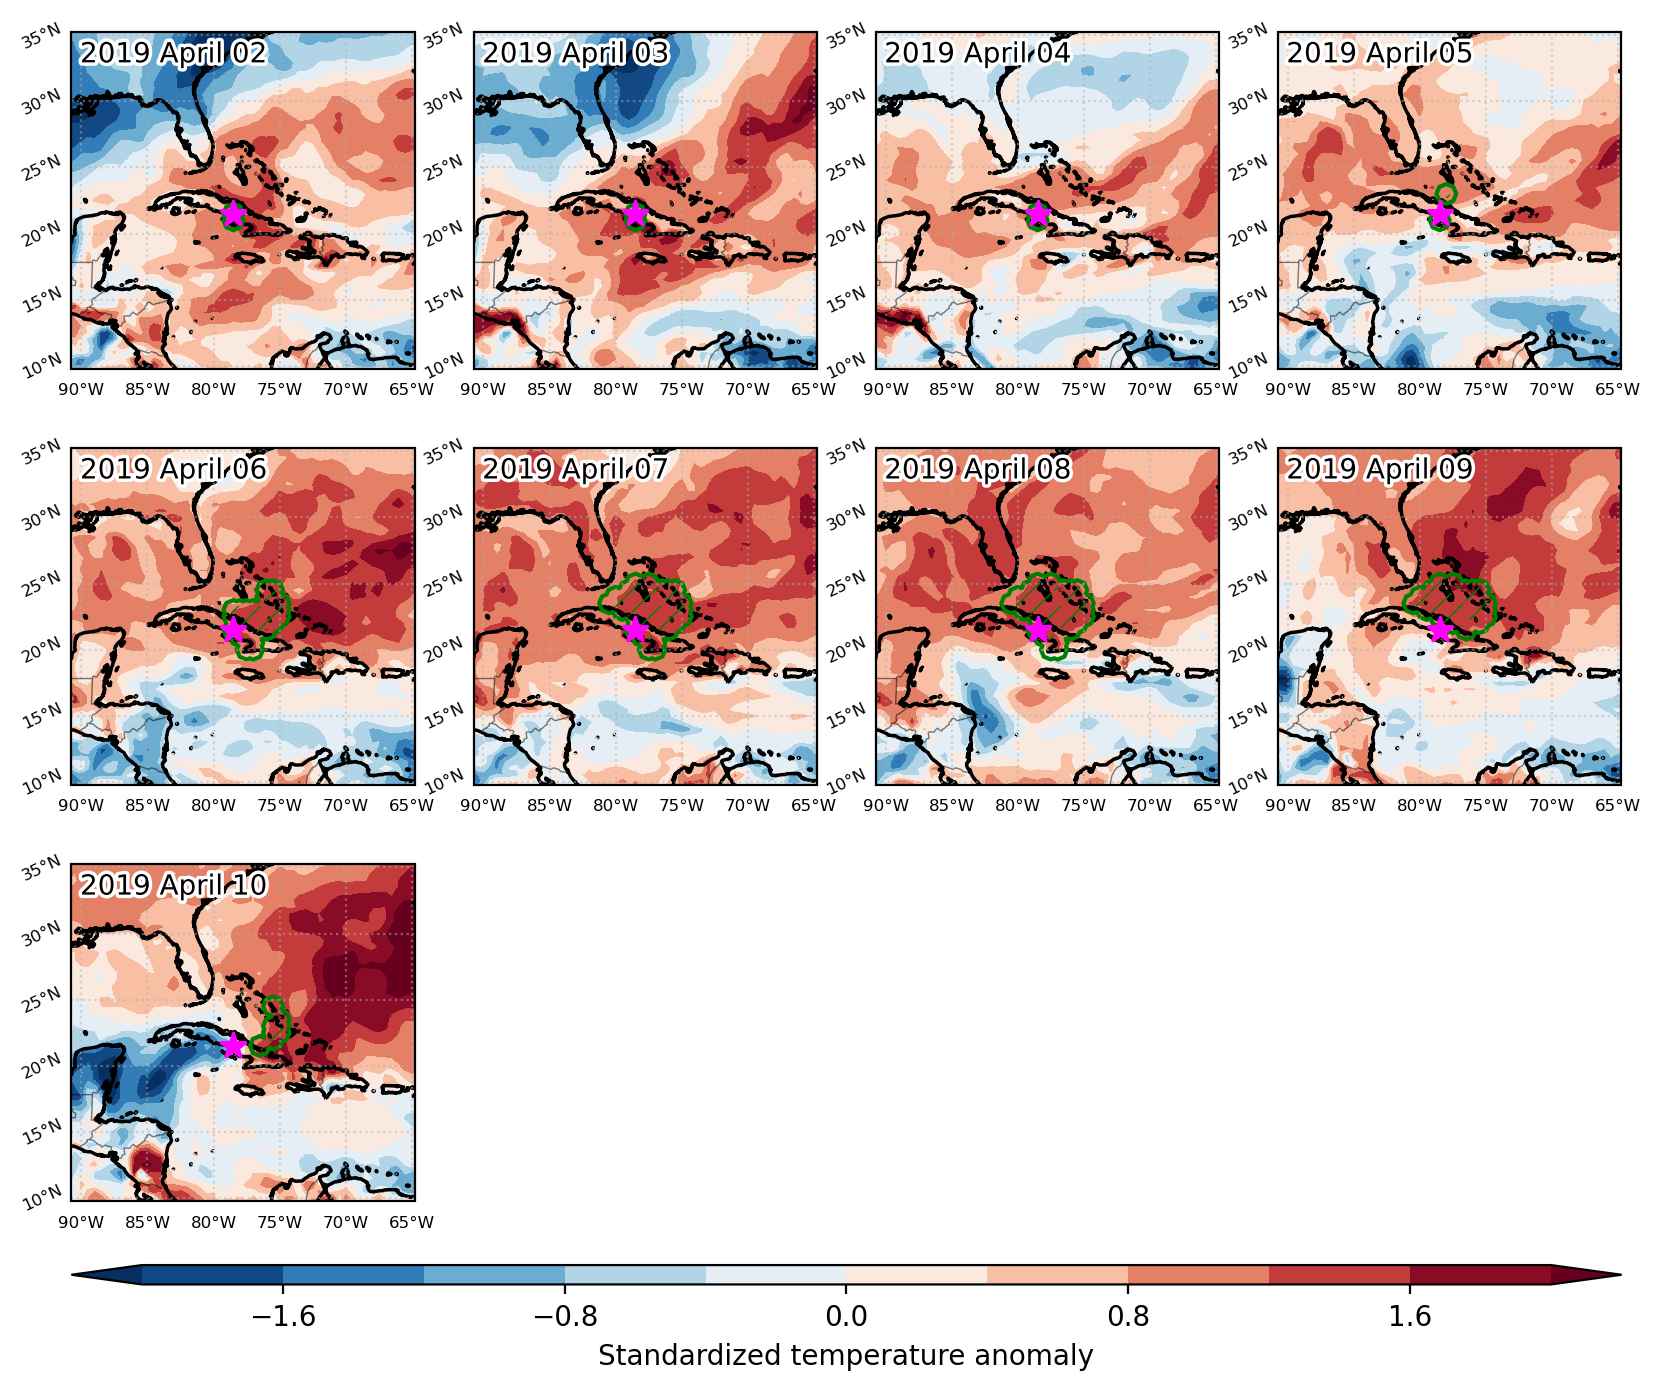
Fig. 3: Maps illustrating the evolution of standardized temperature anomalies during the event.

Event ID: Heat_wave_2019-Apr-02_to_2019-Apr-10_281.5_21.5

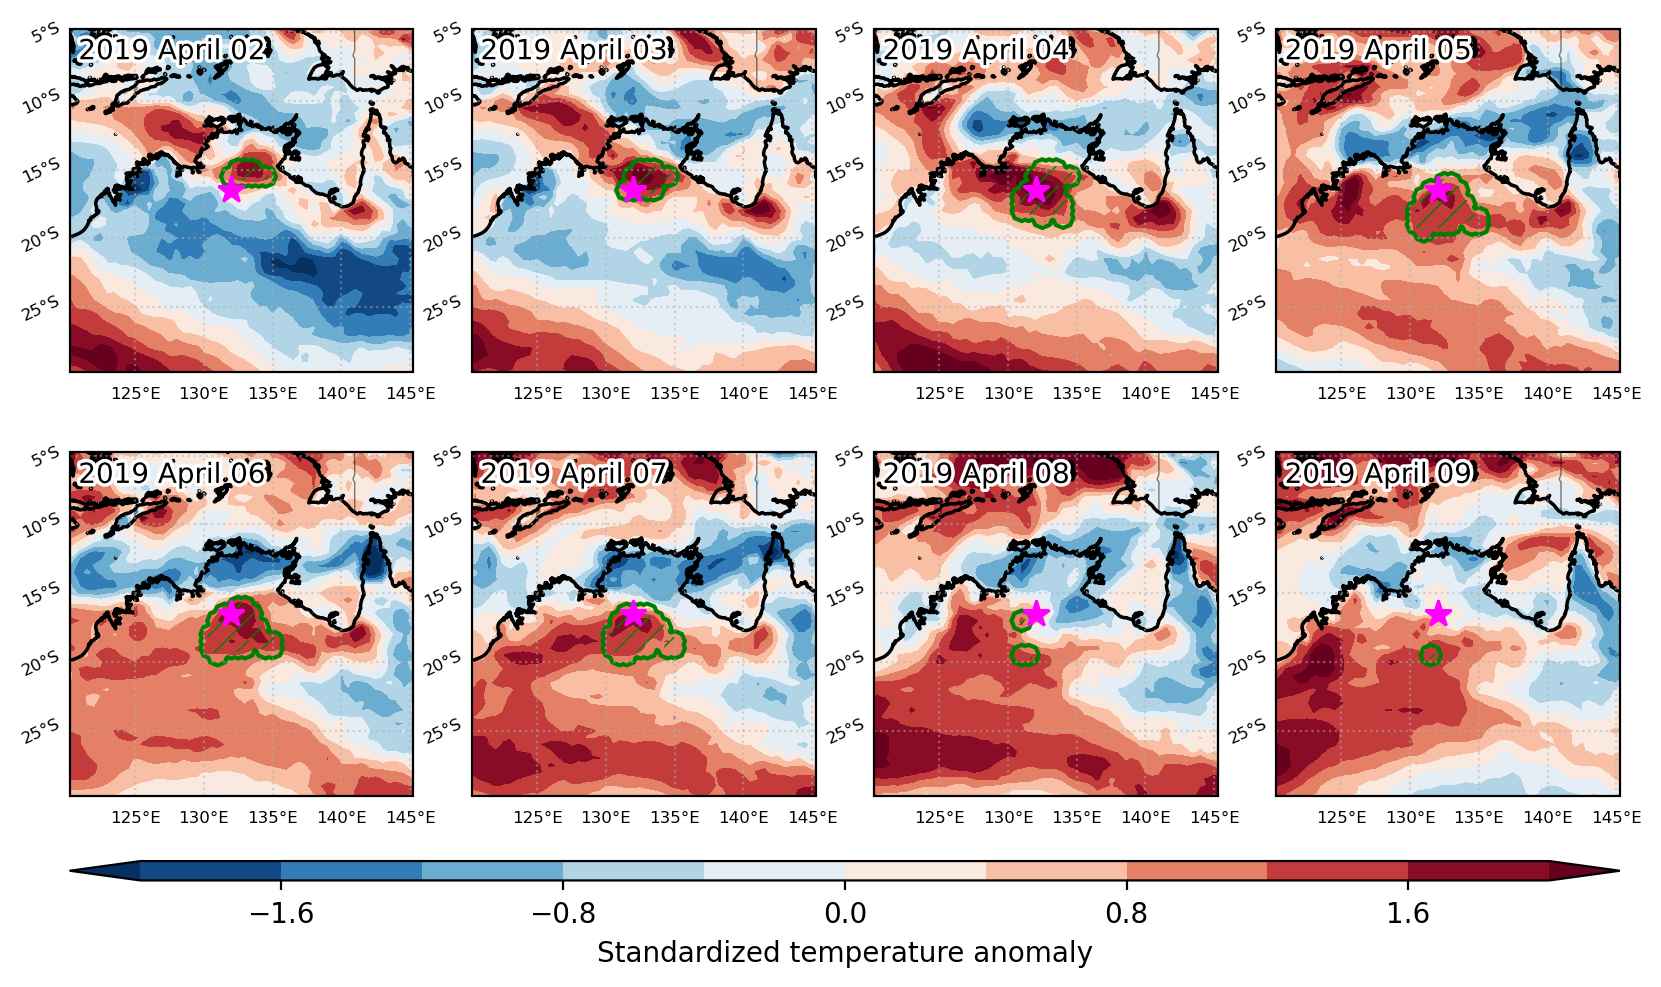
Heat wave occuring from April 02 2019 to April 09 2019 at -16.5°S 132.0°E

Download data: JSON

Event type: Heat wave

Countries affected (identified with ArcGIS Online; provided only for geographical reference):

  • Australia

Duration: 8 days

Time span: April 02 2019 to April 09 2019

Statistics over entire affected area:

  • Mean temperature anomaly: 3.2 °C
  • Mean temperature: 31.3 °C
  • Maximum temperature anomaly: 4.2 °C
  • Maximum temperature: 33.1 °C

Event center: -16.5°S 132.0°E

Area affected: 165072 km$^2$


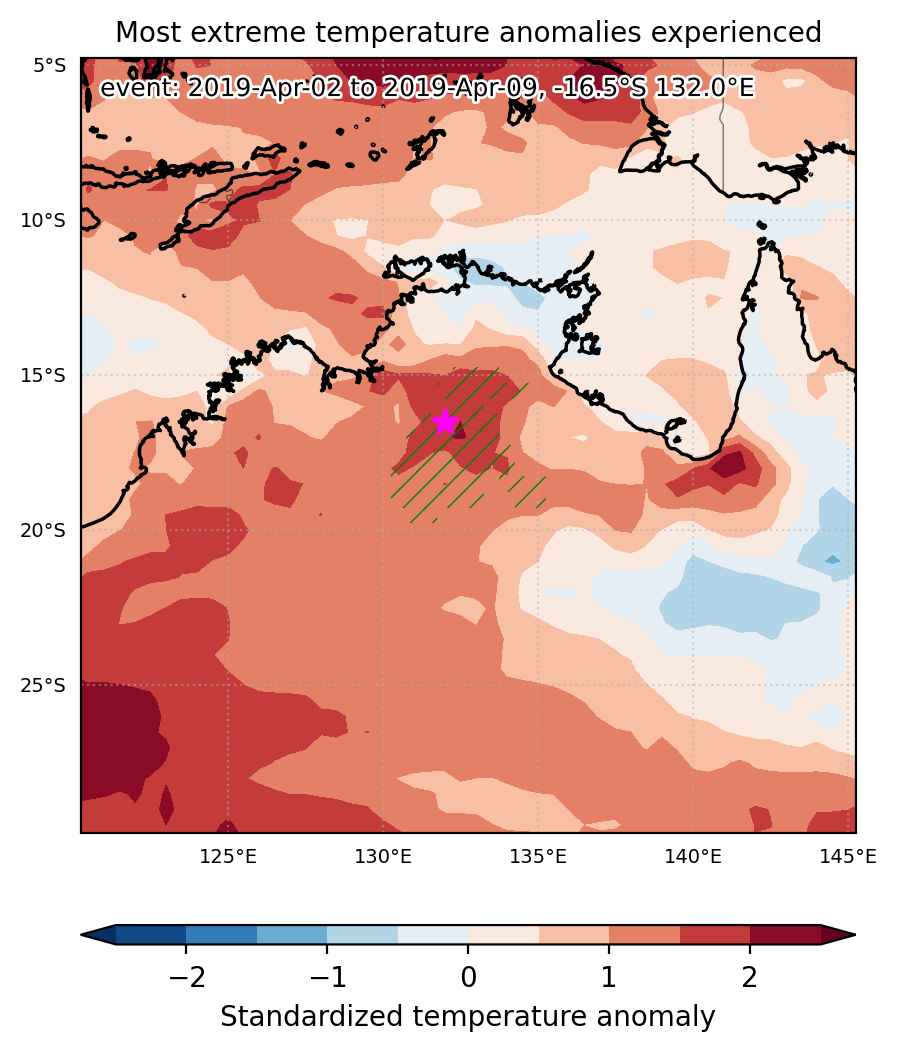
Fig. 1: Map of most extreme temperature anomalies (standardized) experienced during the event. The purple star indicates the center of the extreme event. Green hatching illustrates all areas under the effect of extremes at some time during the event.


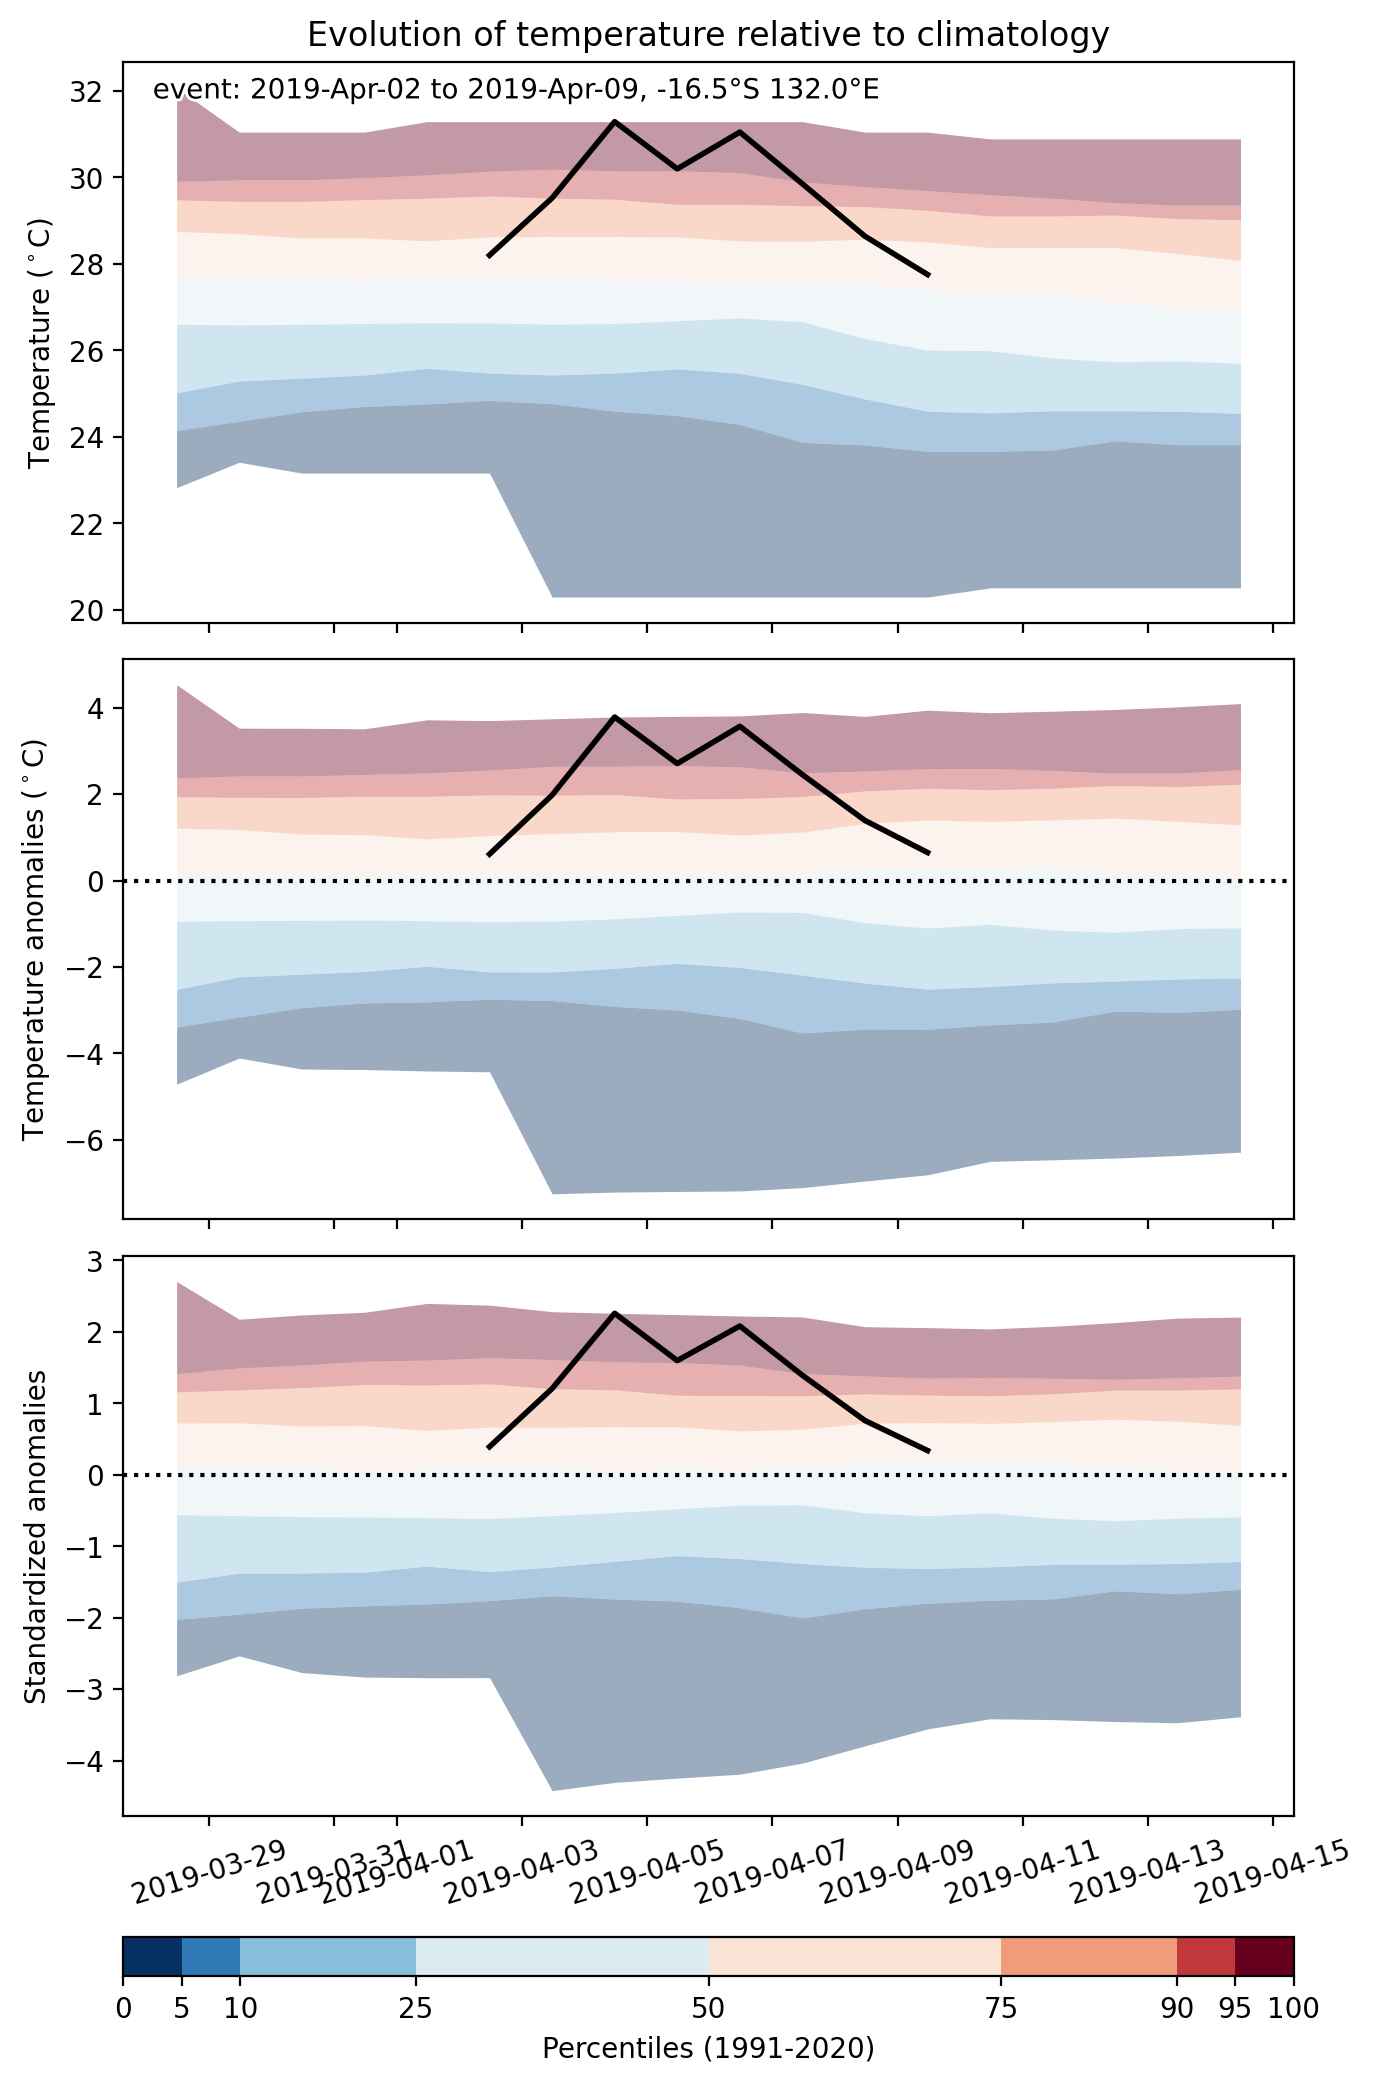
Fig. 2: Evolution of temperature at the center of the event. The climatological percentile distribution is illustrated with color shadings.


Fig. 3: Maps illustrating the evolution of standardized temperature anomalies during the event.

Event ID: Heat_wave_2019-Apr-02_to_2019-Apr-09_132.0_-16.5

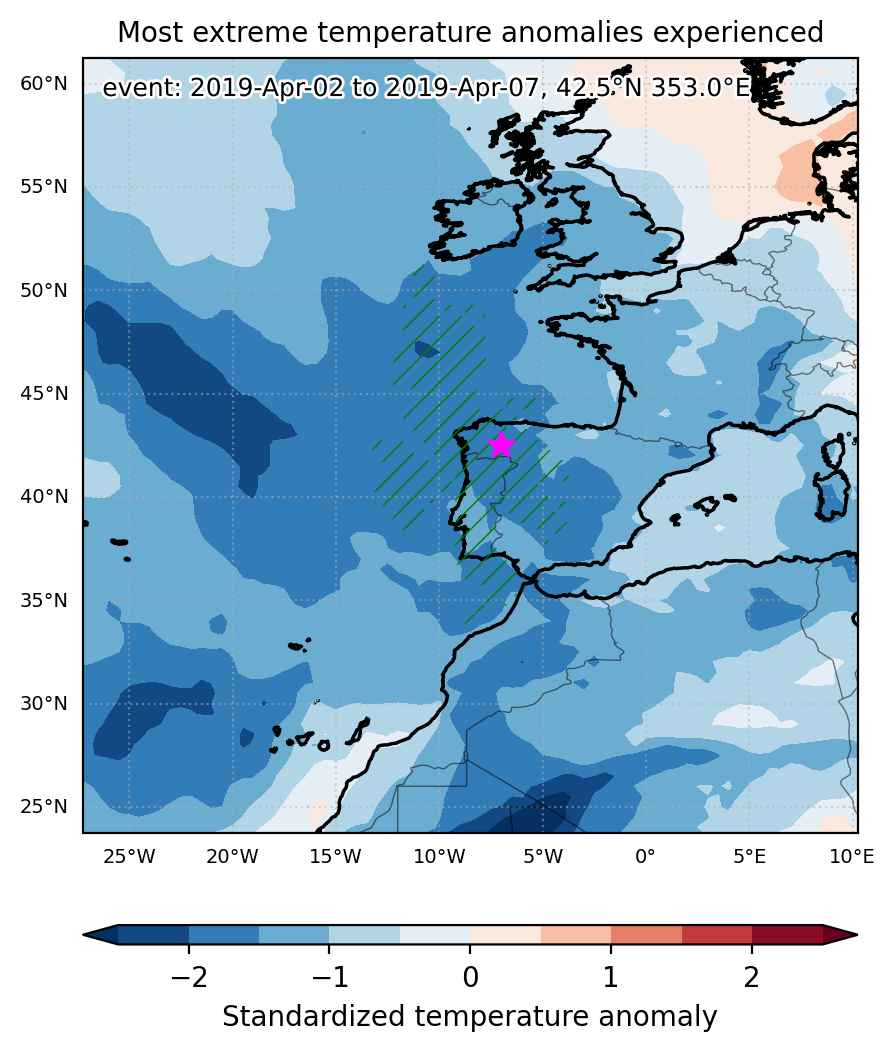
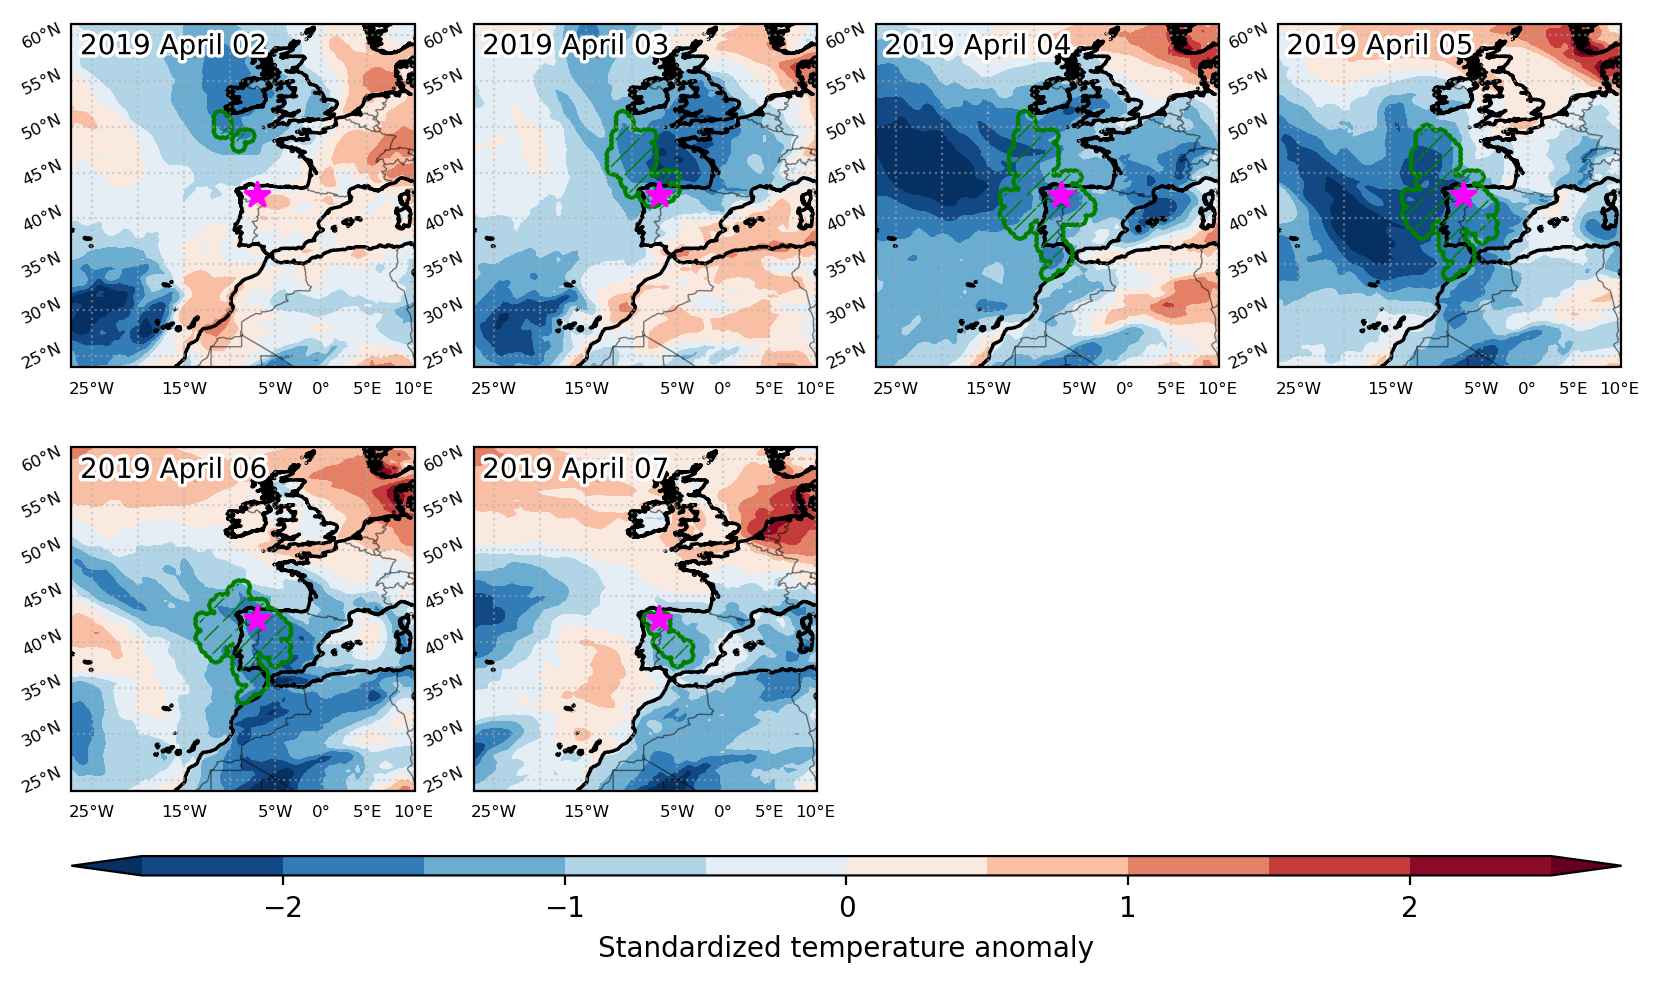
Cold spell occuring from April 02 2019 to April 07 2019 at 42.5°N 353.0°E

Download data: JSON

Event type: Cold spell

Countries affected (identified with ArcGIS Online; provided only for geographical reference):

  • Portugal
  • Spain

Duration: 6 days

Time span: April 02 2019 to April 07 2019

Statistics over entire affected area:

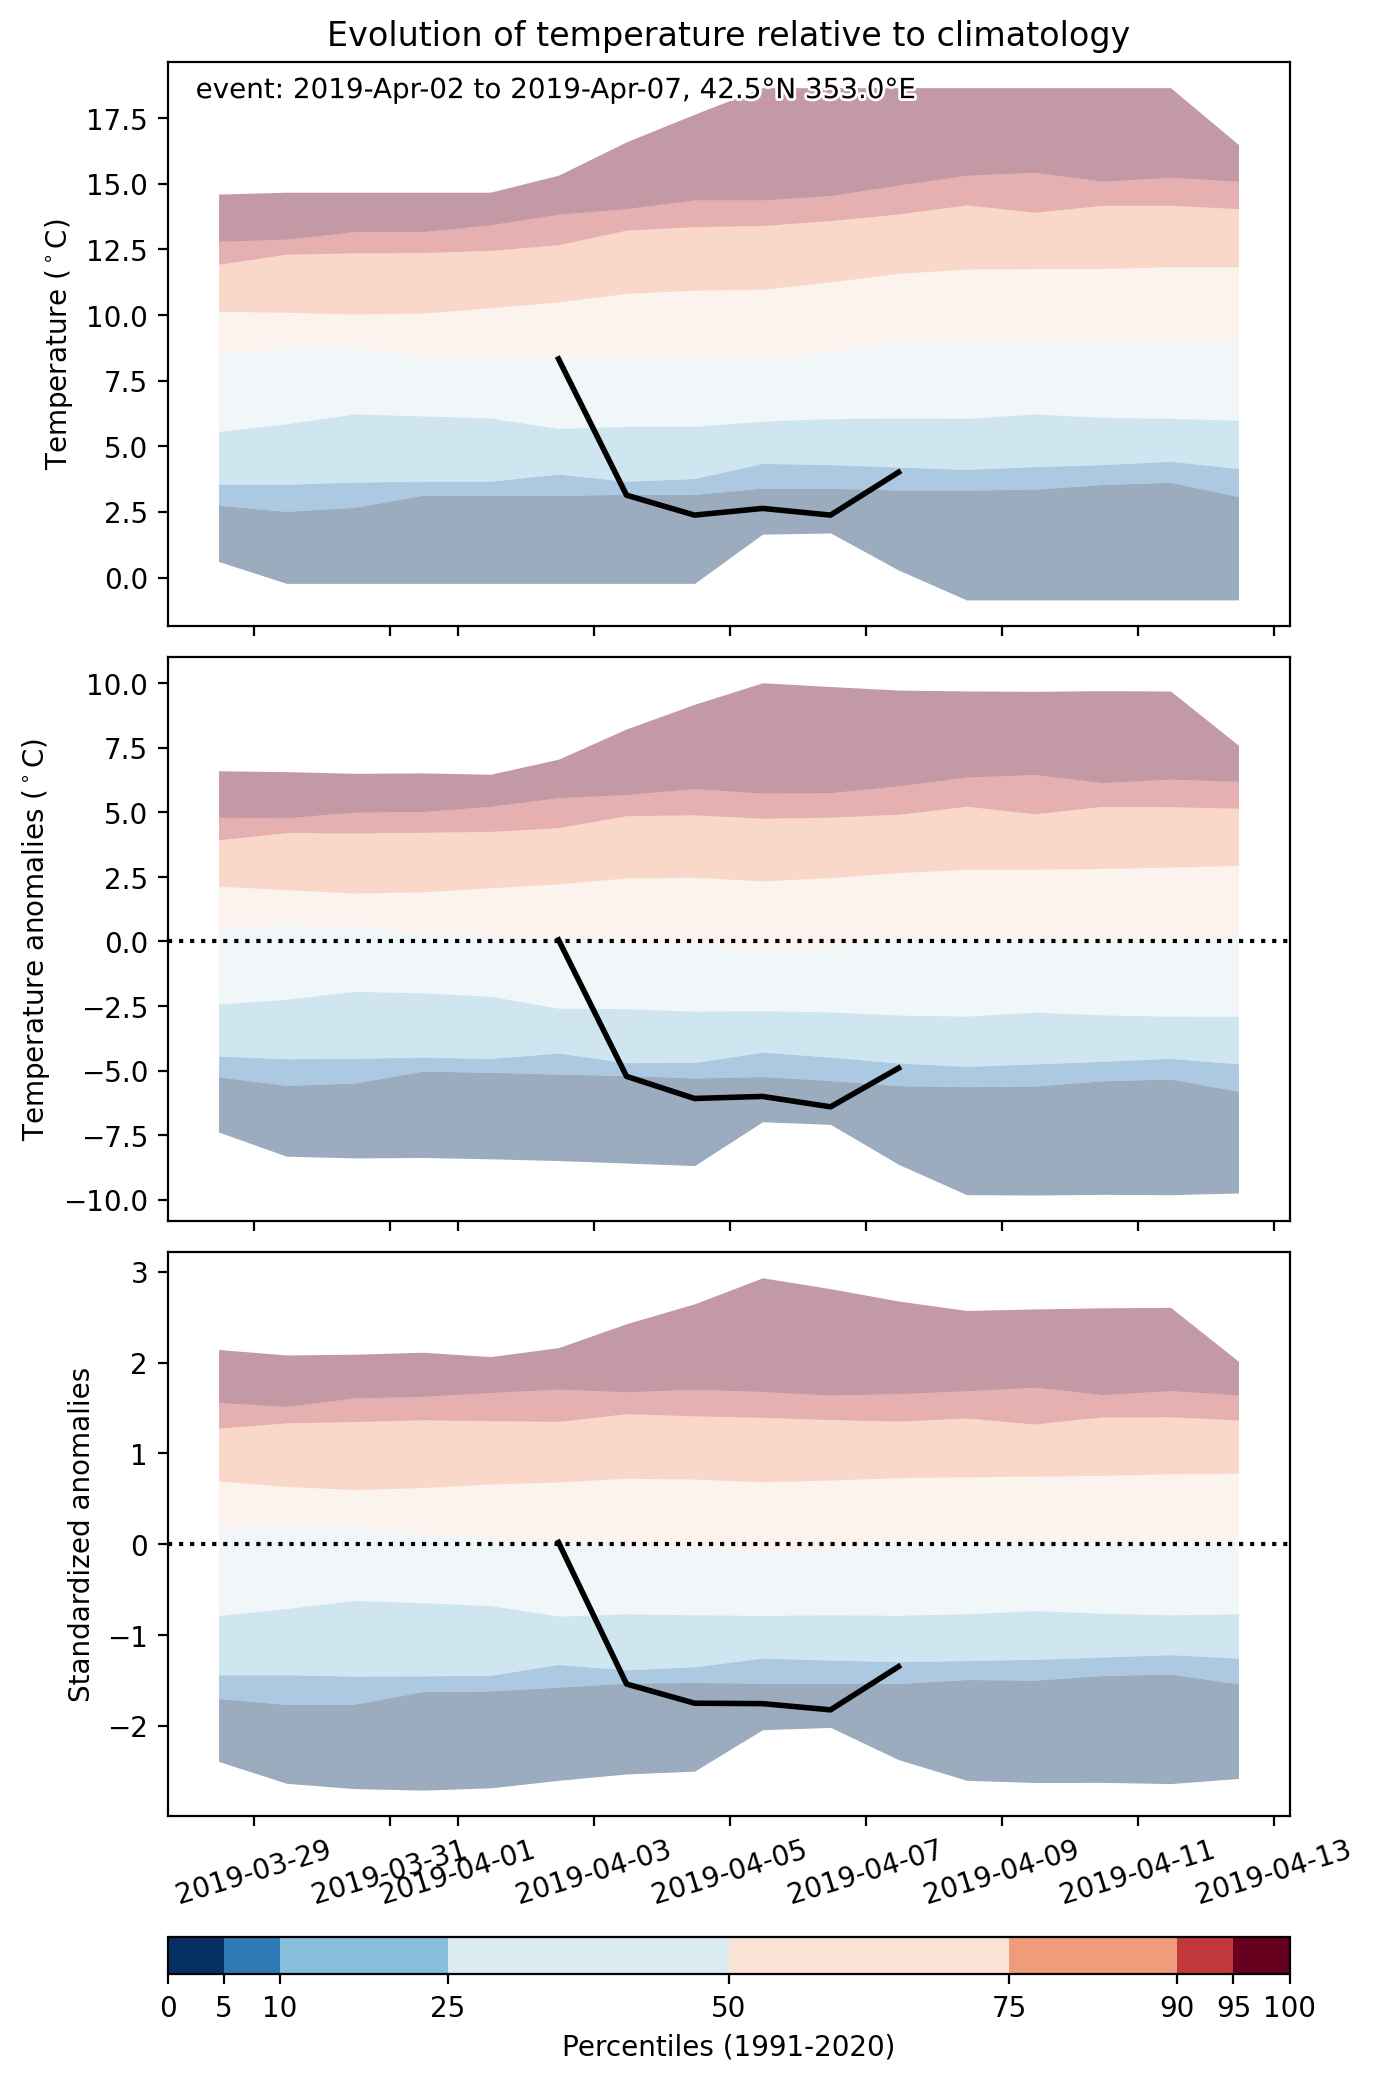
  • Mean temperature anomaly: -3.1 °C
  • Mean temperature: 9.0 °C
  • Minimum temperature anomaly: -6.9 °C
  • Minimum temperature: 0.6 °C

Event center: 42.5°N 353.0°E

Area affected: 623762 km$^2$


Fig. 1: Map of most extreme temperature anomalies (standardized) experienced during the event. The purple star indicates the center of the extreme event. Green hatching illustrates all areas under the effect of extremes at some time during the event.


Fig. 2: Evolution of temperature at the center of the event. The climatological percentile distribution is illustrated with color shadings.


Fig. 3: Maps illustrating the evolution of standardized temperature anomalies during the event.

Event ID: Cold_spell_2019-Apr-02_to_2019-Apr-07_353.0_42.5

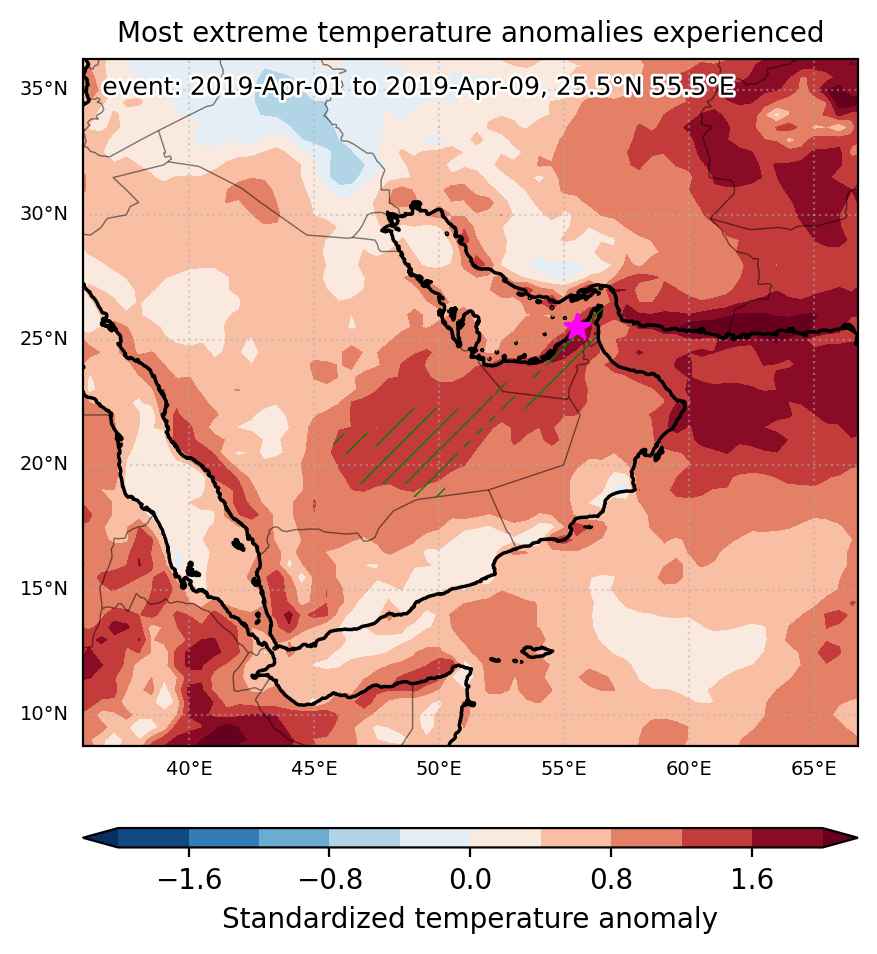
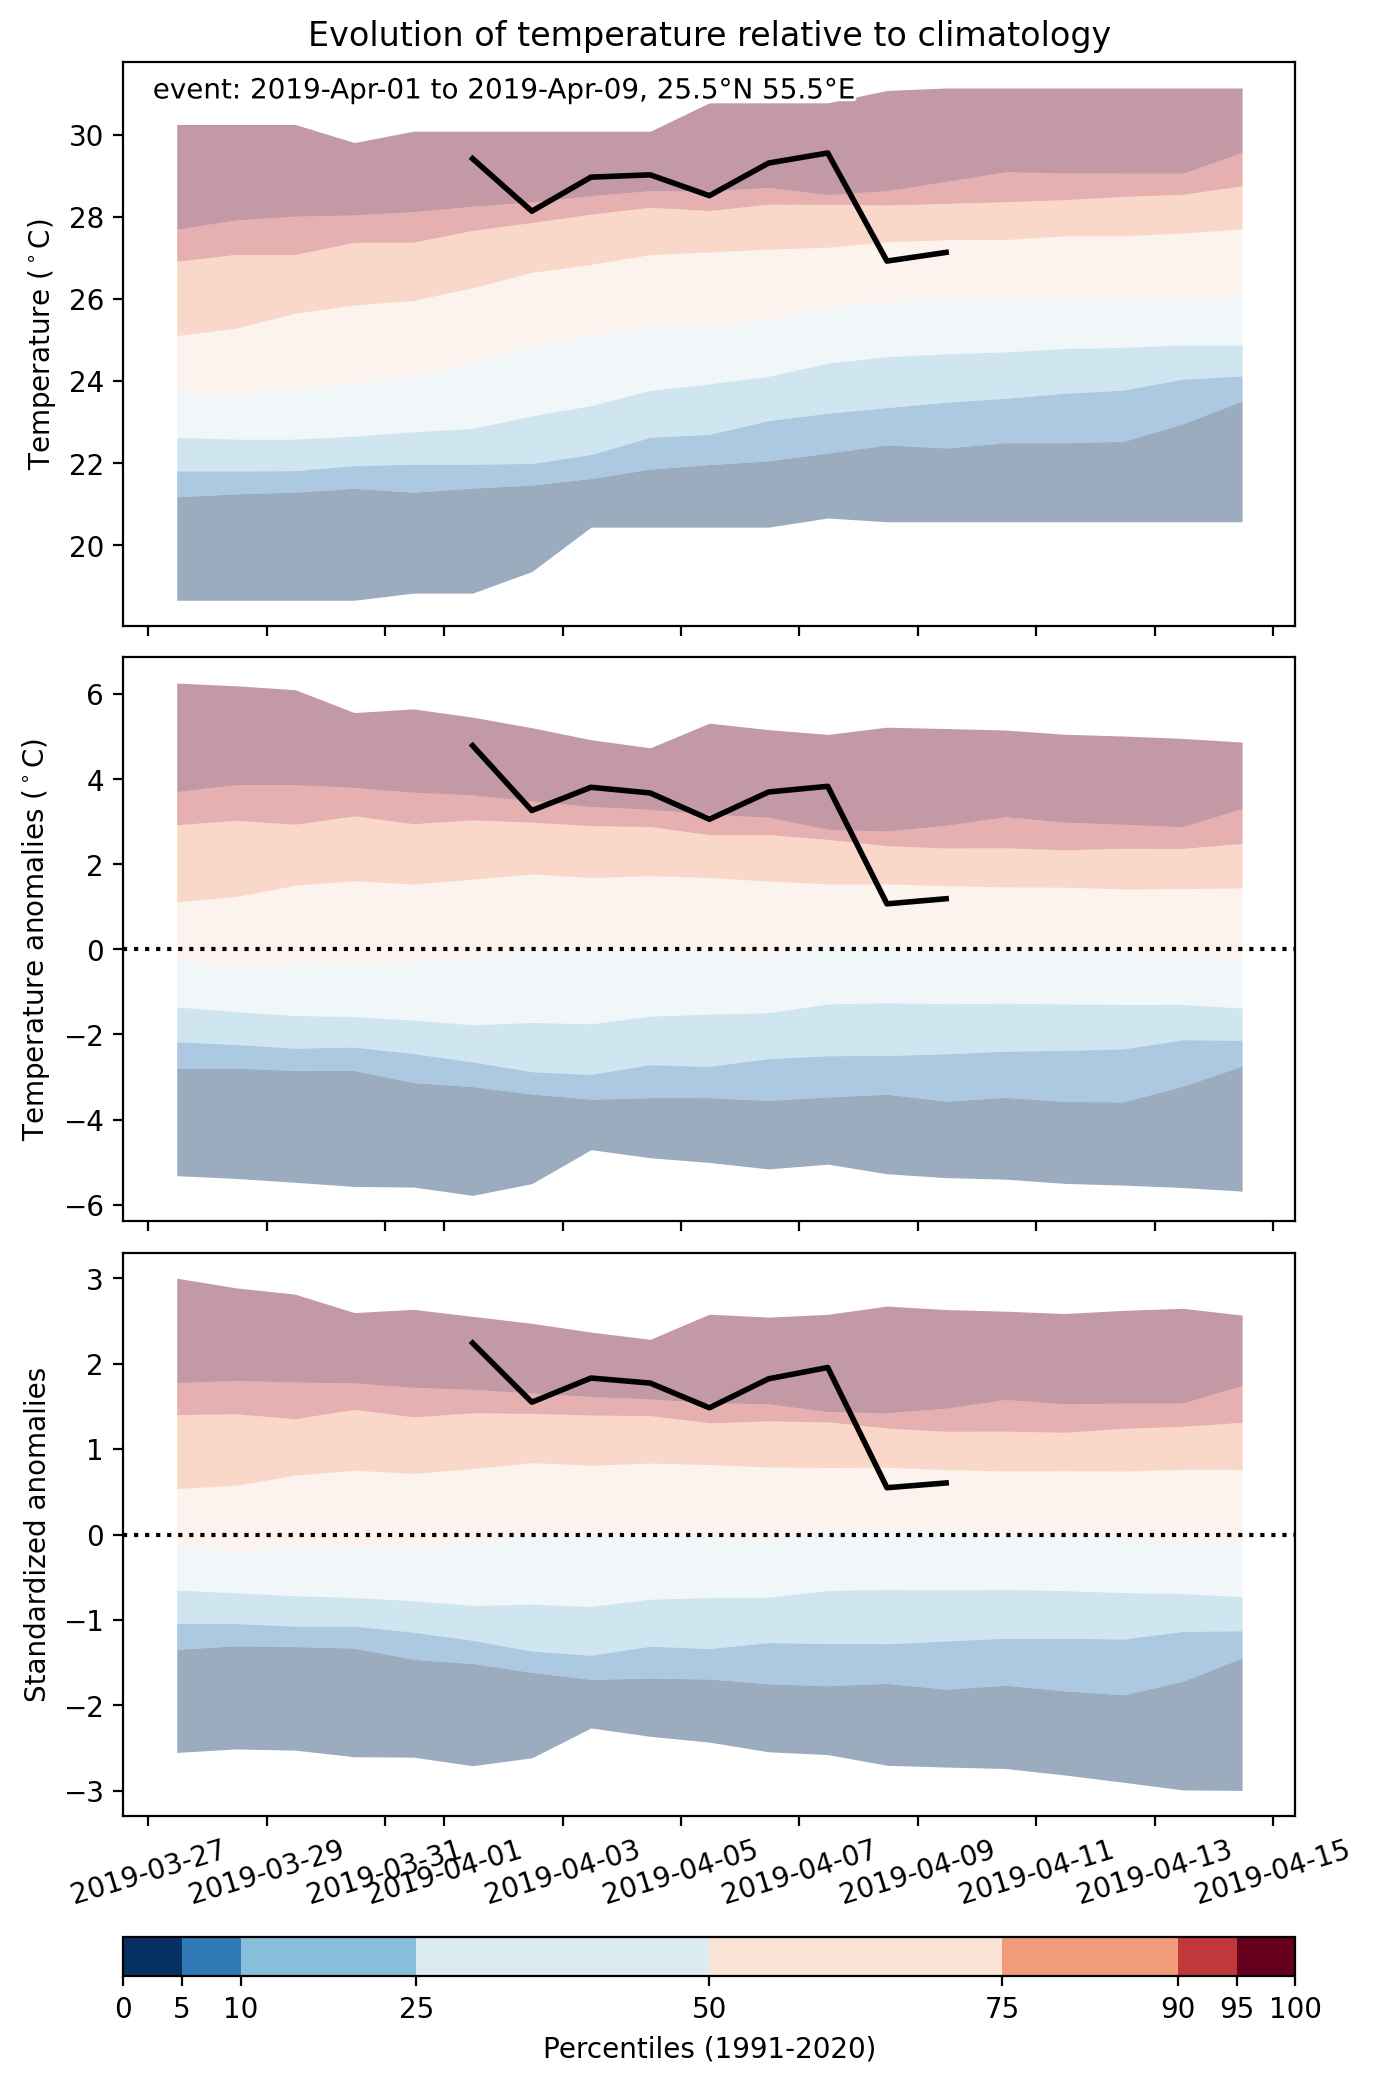
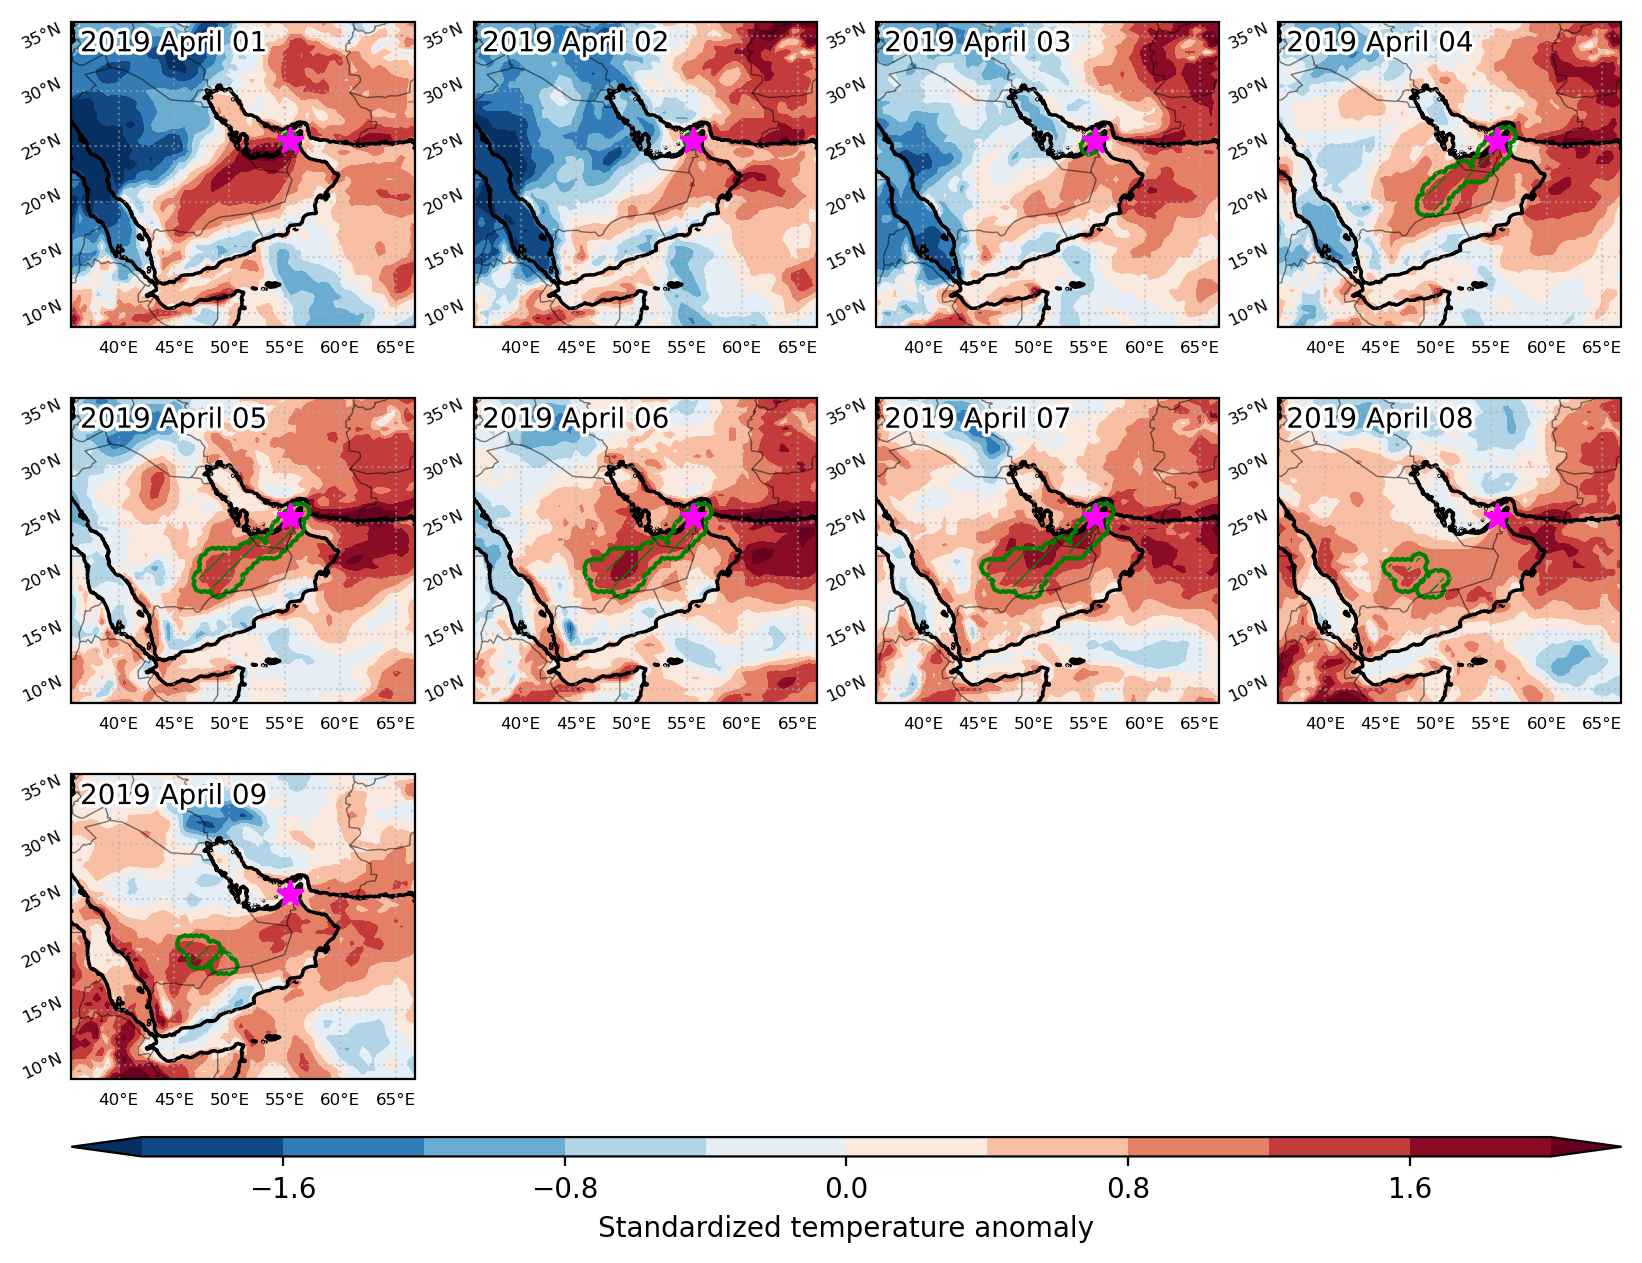
Heat wave occuring from April 01 2019 to April 09 2019 at 25.5°N 55.5°E

Download data: JSON

Event type: Heat wave

Countries affected (identified with ArcGIS Online; provided only for geographical reference):

  • Oman
  • Saudi Arabia
  • United Arab Emirates

Duration: 9 days

Time span: April 01 2019 to April 09 2019

Statistics over entire affected area:

  • Mean temperature anomaly: 4.1 °C
  • Mean temperature: 32.1 °C
  • Maximum temperature anomaly: 6.0 °C
  • Maximum temperature: 34.0 °C

Event center: 25.5°N 55.5°E

Area affected: 220882 km$^2$


Fig. 1: Map of most extreme temperature anomalies (standardized) experienced during the event. The purple star indicates the center of the extreme event. Green hatching illustrates all areas under the effect of extremes at some time during the event.


Fig. 2: Evolution of temperature at the center of the event. The climatological percentile distribution is illustrated with color shadings.


Fig. 3: Maps illustrating the evolution of standardized temperature anomalies during the event.

Event ID: Heat_wave_2019-Apr-01_to_2019-Apr-09_55.5_25.5

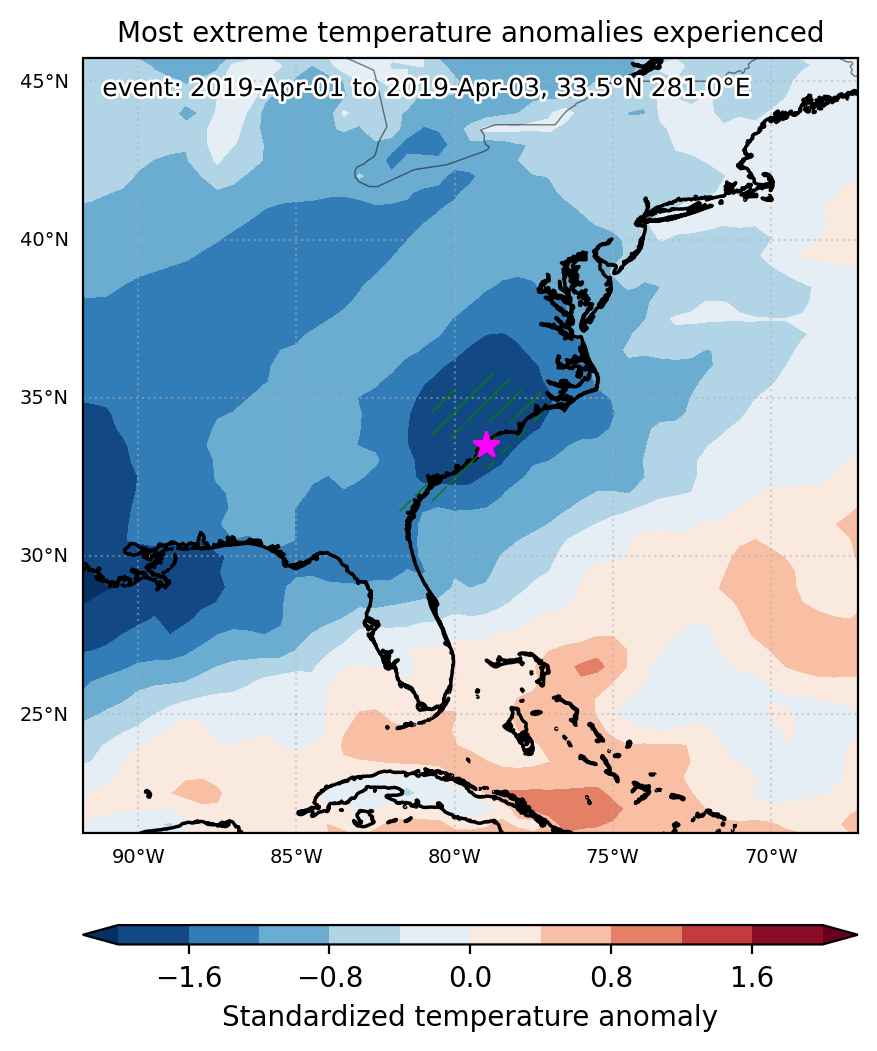
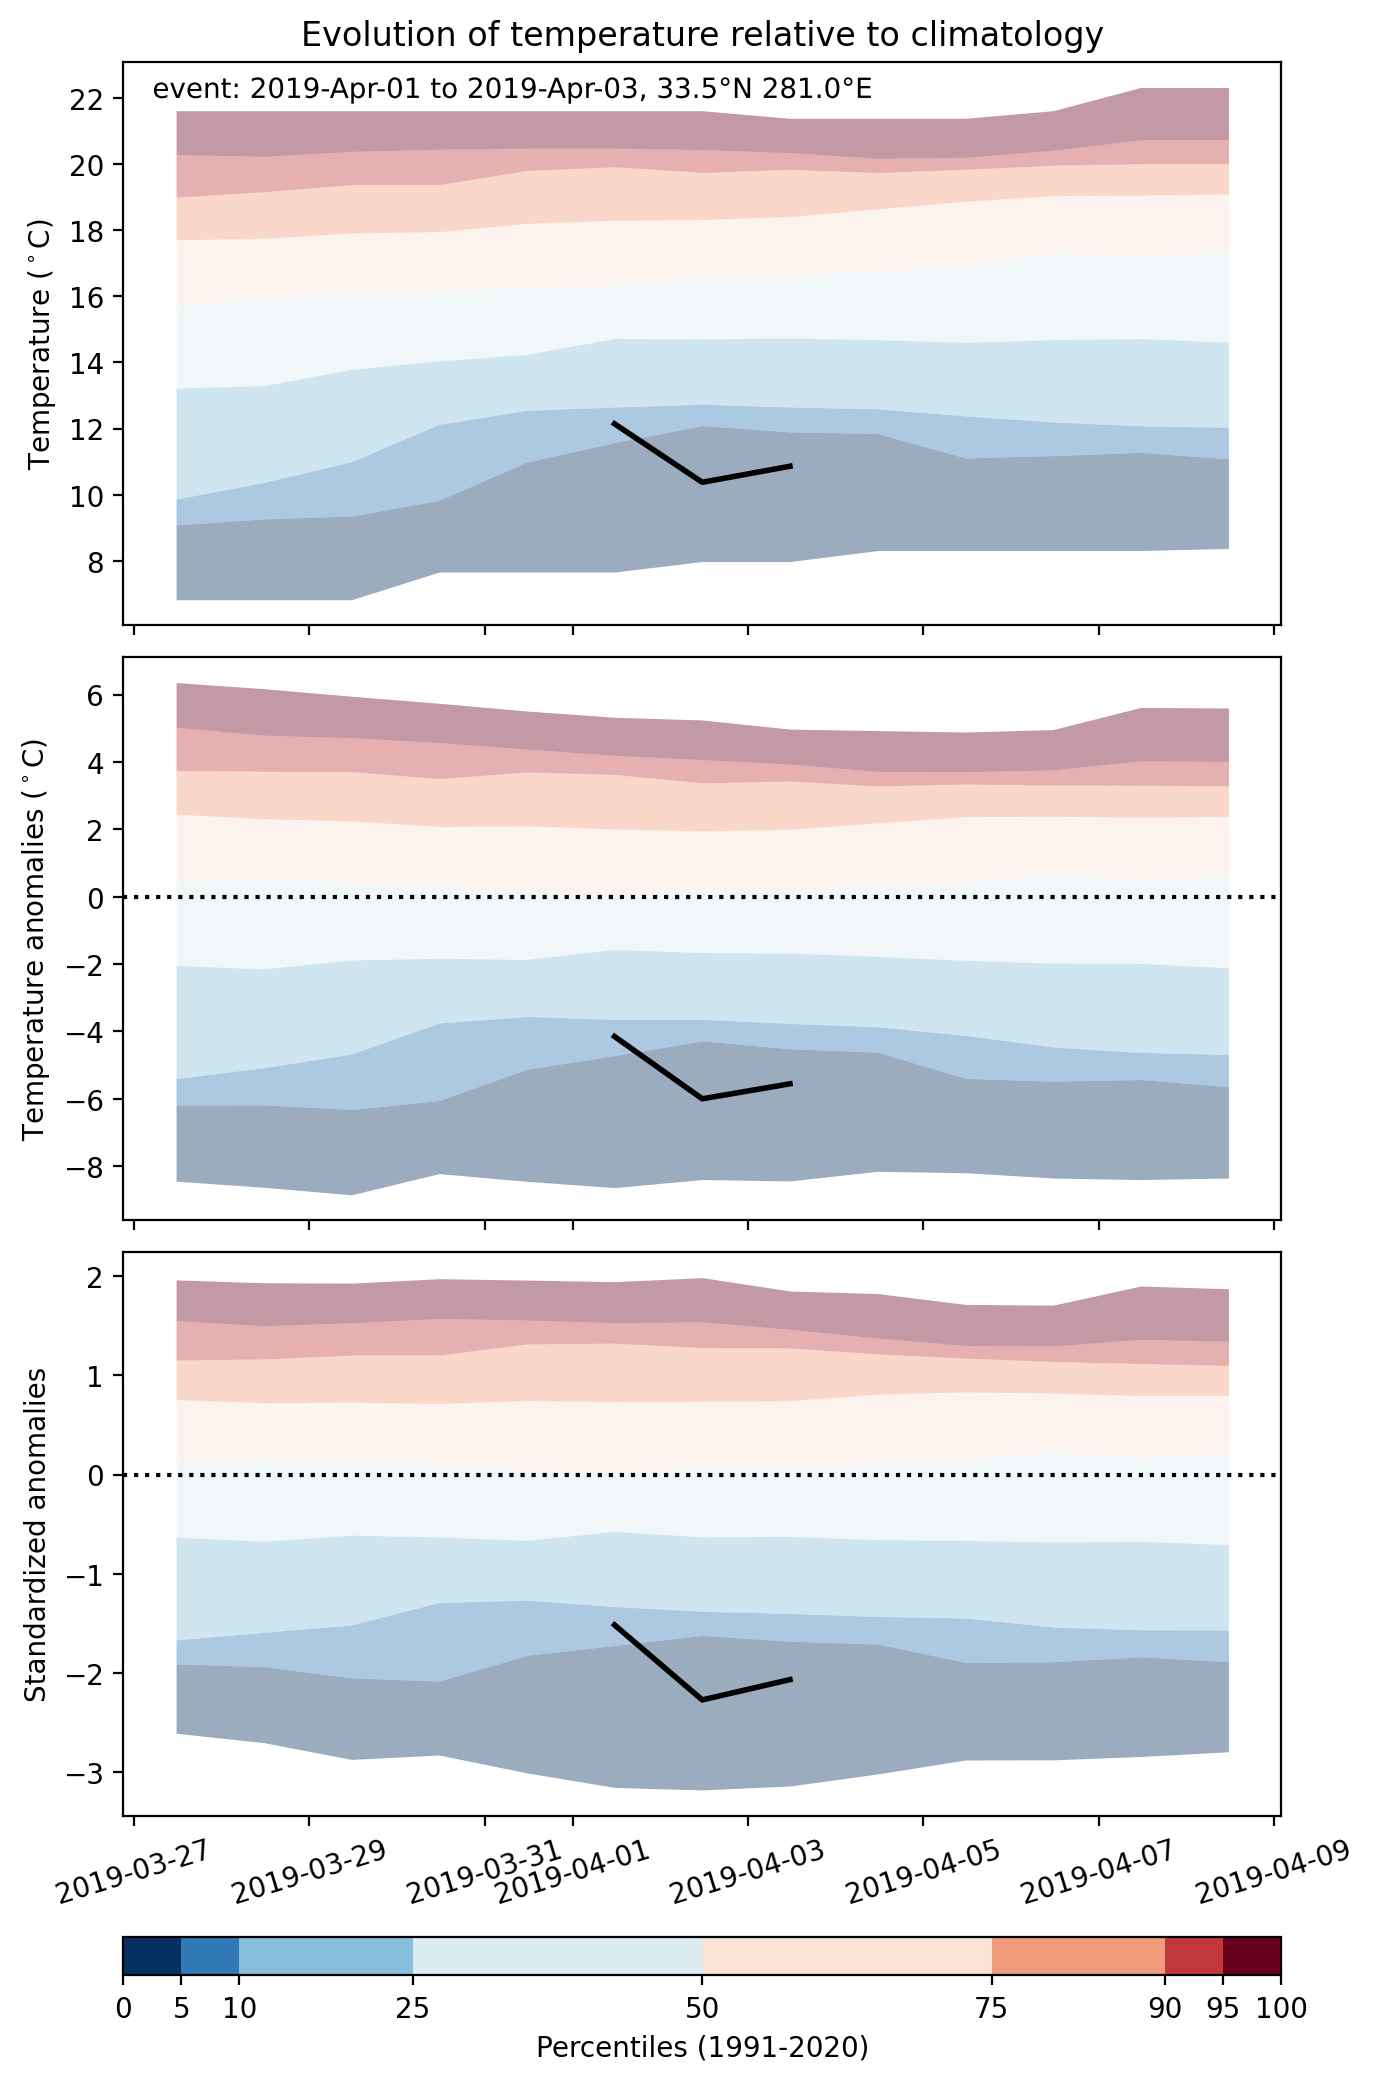
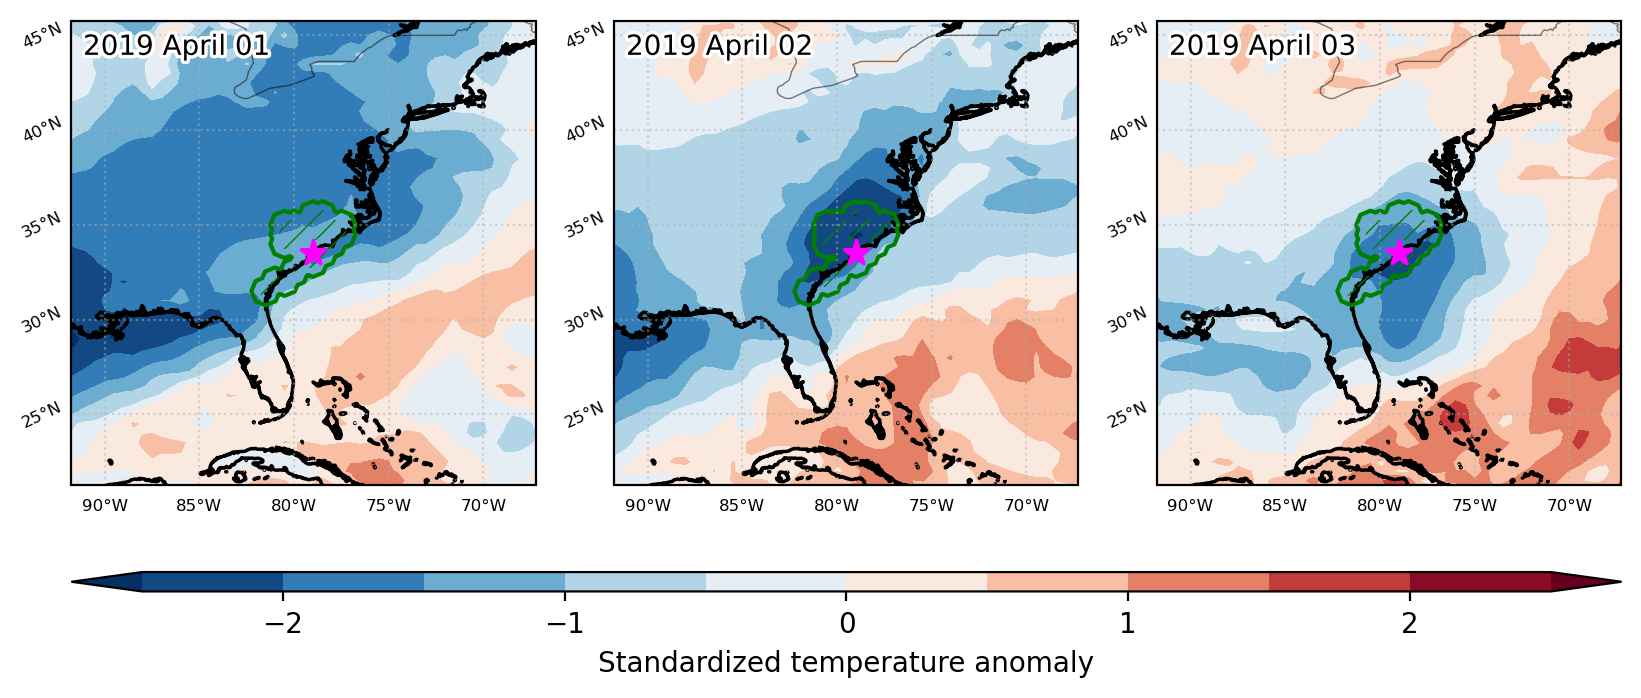
Cold spell occuring from April 01 2019 to April 03 2019 at 33.5°N 281.0°E

Download data: JSON

Event type: Cold spell

Countries affected (identified with ArcGIS Online; provided only for geographical reference):

  • United States

Duration: 3 days

Time span: April 01 2019 to April 03 2019

Statistics over entire affected area:

  • Mean temperature anomaly: -6.2 °C
  • Mean temperature: 9.7 °C
  • Minimum temperature anomaly: -10.5 °C
  • Minimum temperature: 4.4 °C

Event center: 33.5°N 281.0°E

Area affected: 69102 km$^2$


Fig. 1: Map of most extreme temperature anomalies (standardized) experienced during the event. The purple star indicates the center of the extreme event. Green hatching illustrates all areas under the effect of extremes at some time during the event.


Fig. 2: Evolution of temperature at the center of the event. The climatological percentile distribution is illustrated with color shadings.


Fig. 3: Maps illustrating the evolution of standardized temperature anomalies during the event.

Event ID: Cold_spell_2019-Apr-01_to_2019-Apr-03_281.0_33.5

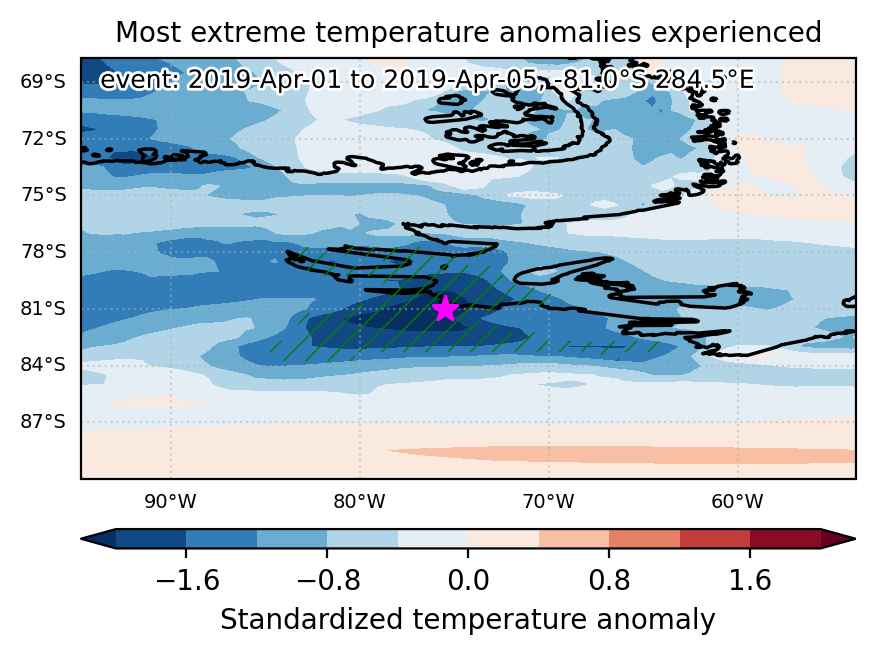
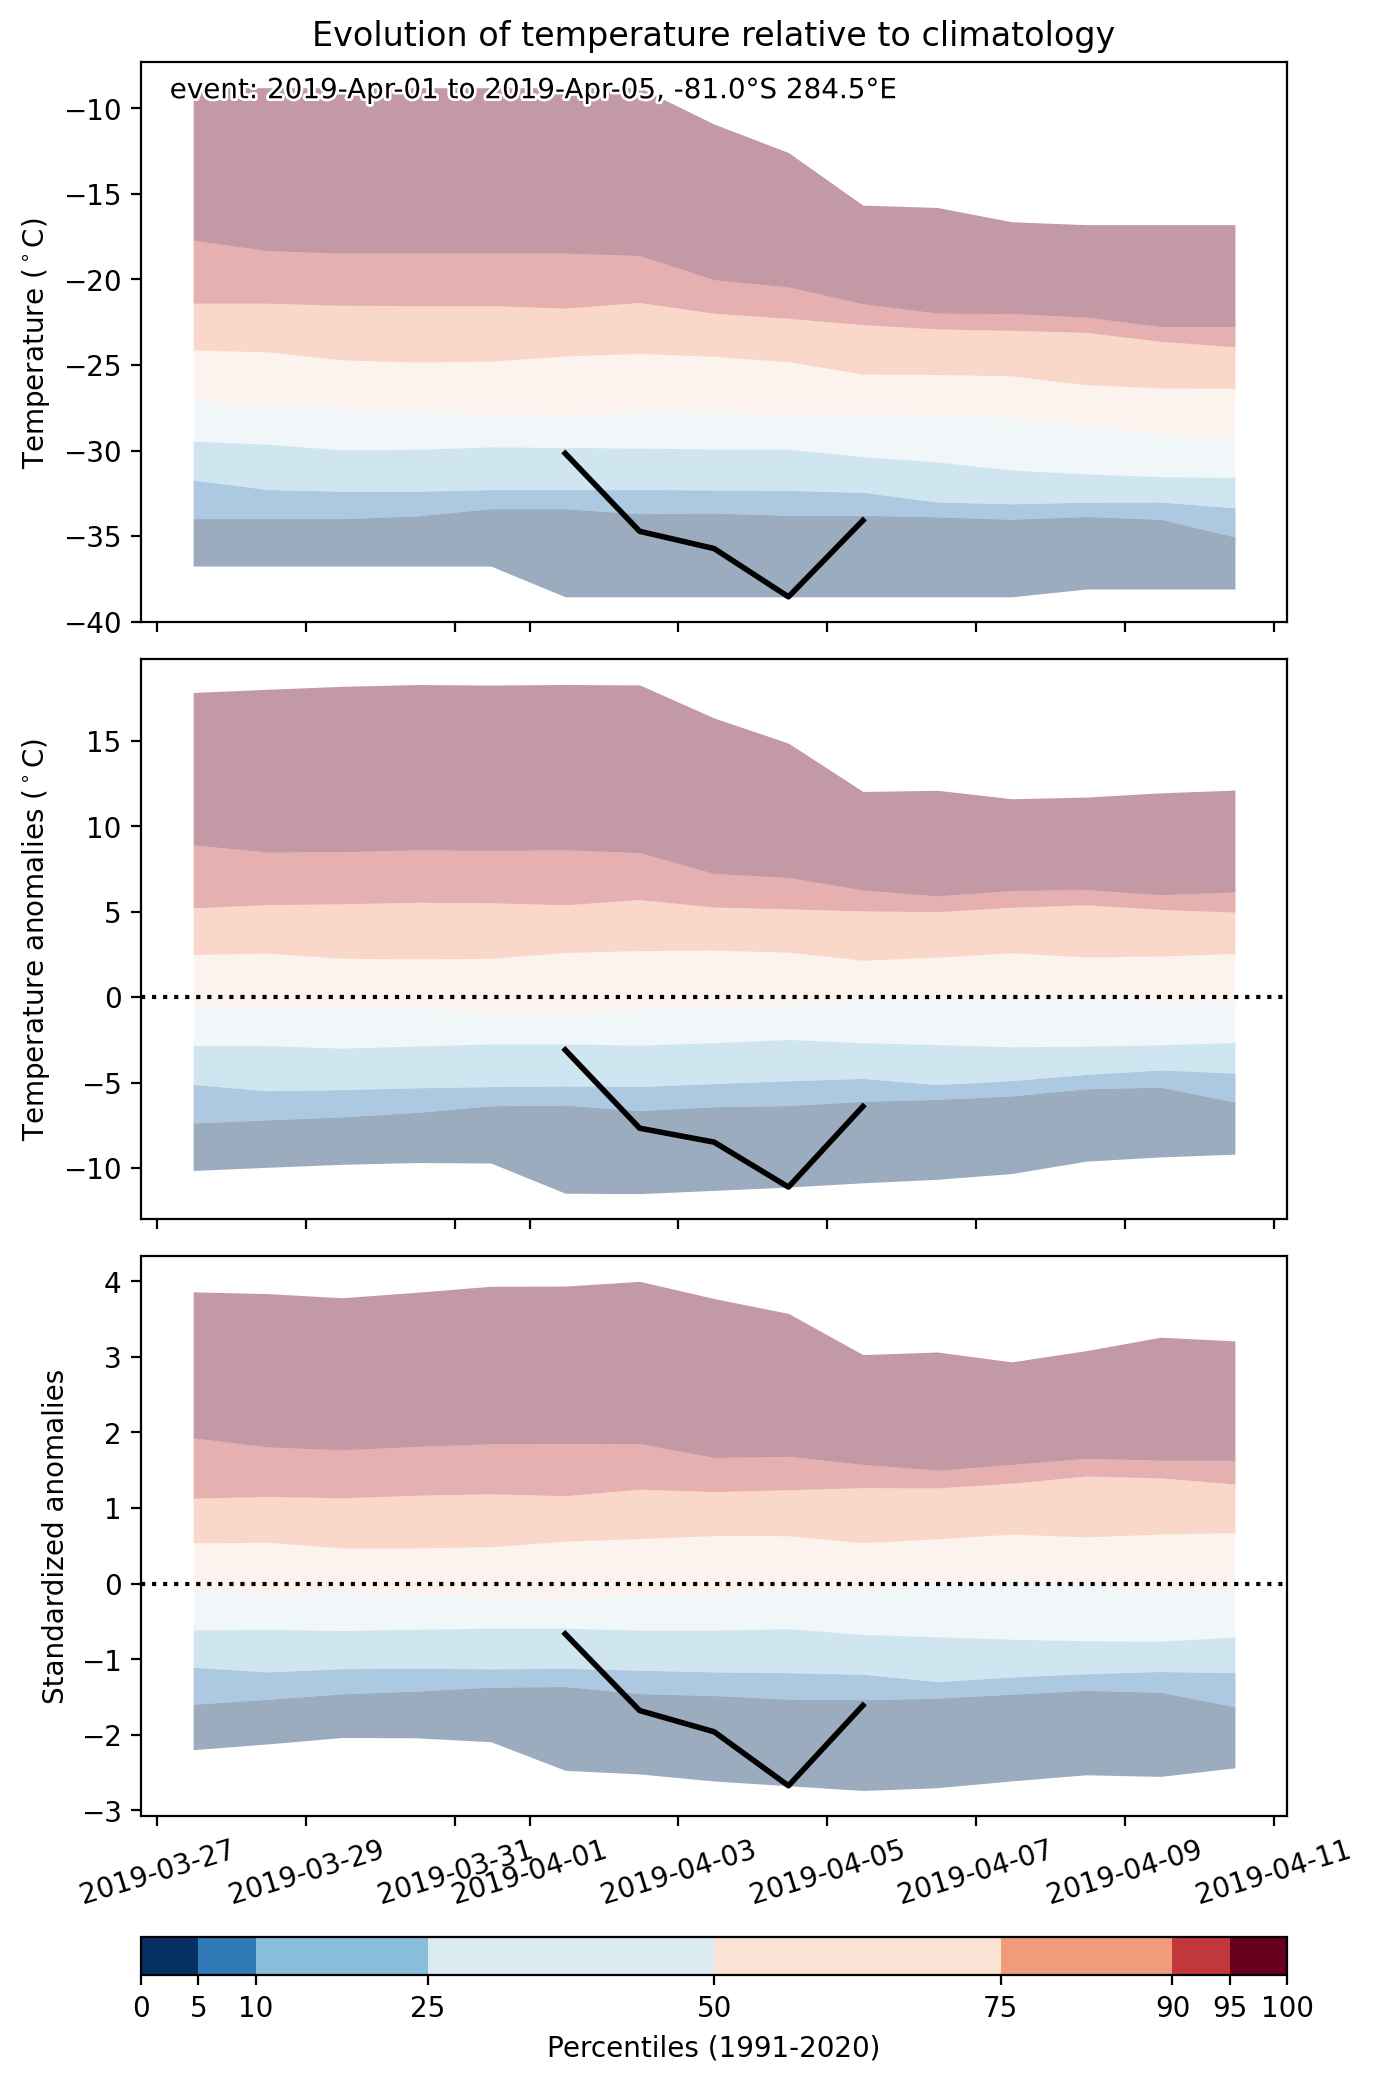
Cold spell occuring from April 01 2019 to April 05 2019 at -81.0°S 284.5°E

Download data: JSON

Event type: Cold spell

Countries affected (identified with ArcGIS Online; provided only for geographical reference):

  • Antarctica

Duration: 5 days

Time span: April 01 2019 to April 05 2019

Statistics over entire affected area:

  • Mean temperature anomaly: -7.2 °C
  • Mean temperature: -35.9 °C
  • Minimum temperature anomaly: -12.5 °C
  • Minimum temperature: -42.8 °C

Event center: -81.0°S 284.5°E

Area affected: 109512 km$^2$


Fig. 1: Map of most extreme temperature anomalies (standardized) experienced during the event. The purple star indicates the center of the extreme event. Green hatching illustrates all areas under the effect of extremes at some time during the event.


Fig. 2: Evolution of temperature at the center of the event. The climatological percentile distribution is illustrated with color shadings.


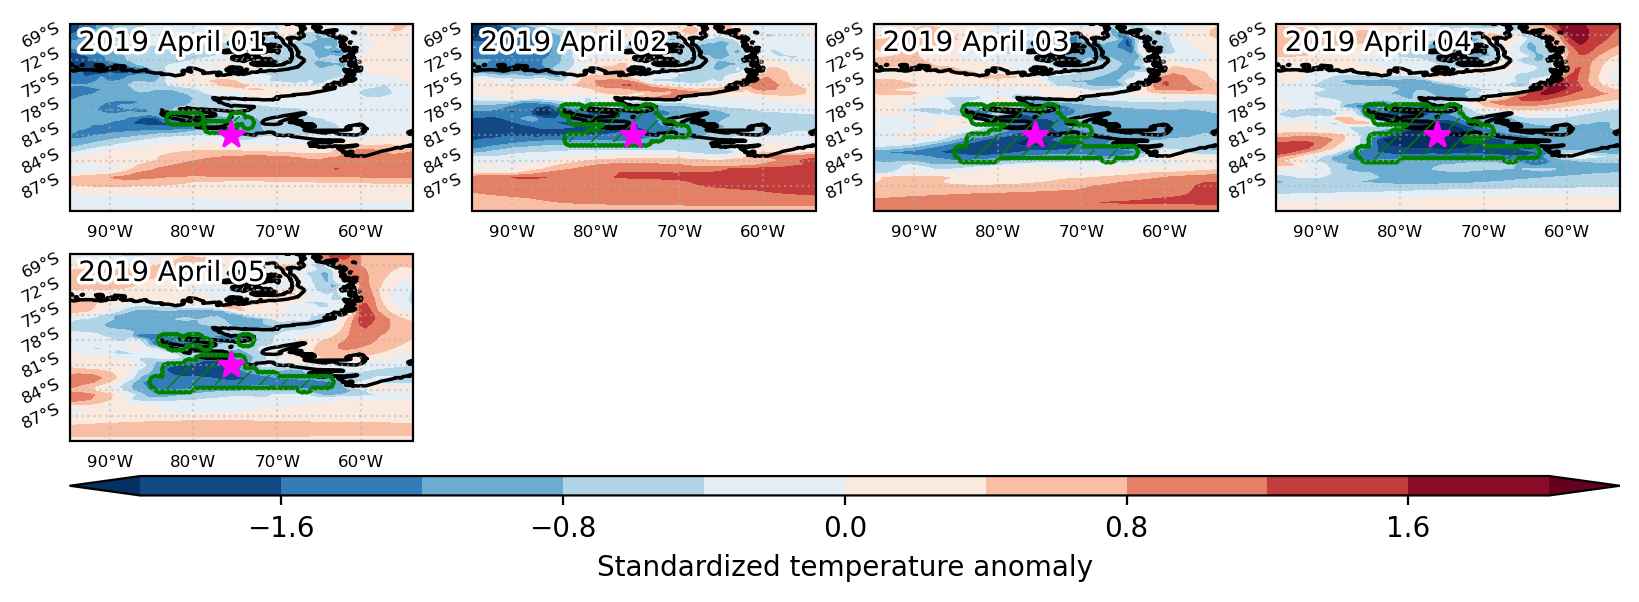
Fig. 3: Maps illustrating the evolution of standardized temperature anomalies during the event.

Event ID: Cold_spell_2019-Apr-01_to_2019-Apr-05_284.5_-81.0

Heat wave occuring from March 31 2019 to April 02 2019 at -6.0°S 296.0°E

Download data: JSON

Event type: Heat wave

Countries affected (identified with ArcGIS Online; provided only for geographical reference):

  • Brazil

Duration: 3 days

Time span: March 31 2019 to April 02 2019

Statistics over entire affected area:

  • Mean temperature anomaly: 1.6 °C
  • Mean temperature: 27.7 °C
  • Maximum temperature anomaly: 2.5 °C
  • Maximum temperature: 28.7 °C

Event center: -6.0°S 296.0°E

Area affected: 52201 km$^2$


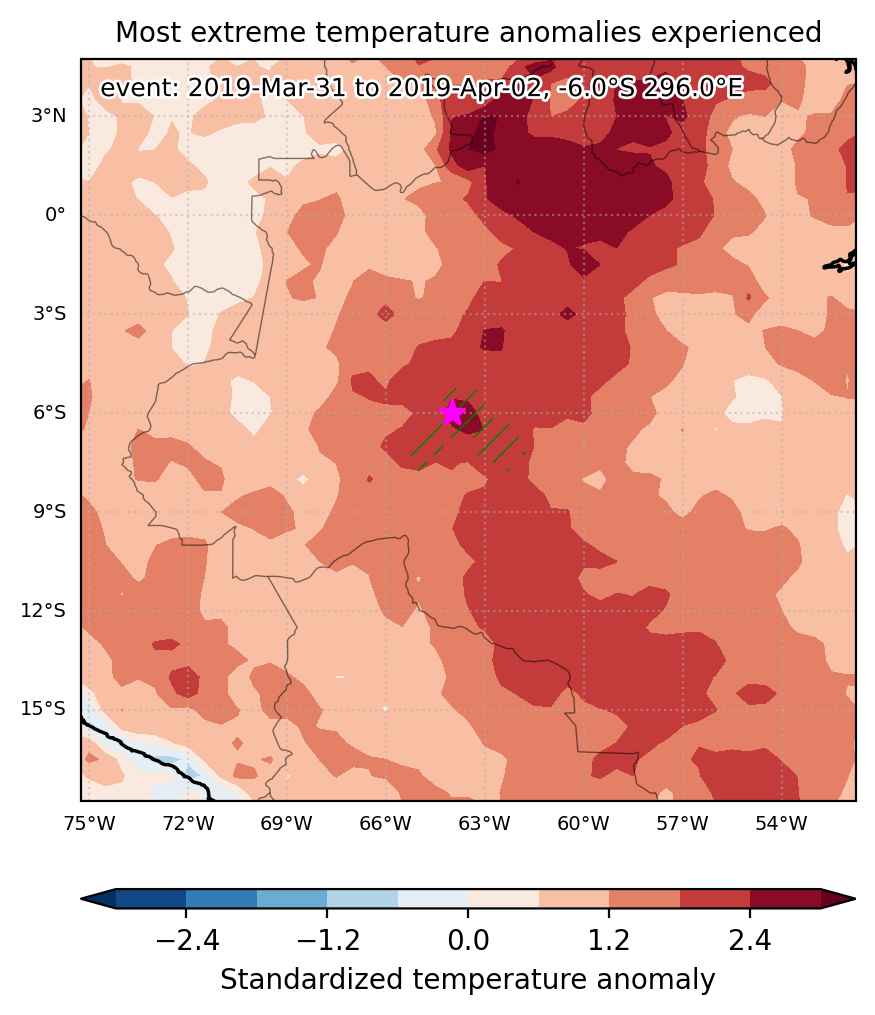
Fig. 1: Map of most extreme temperature anomalies (standardized) experienced during the event. The purple star indicates the center of the extreme event. Green hatching illustrates all areas under the effect of extremes at some time during the event.


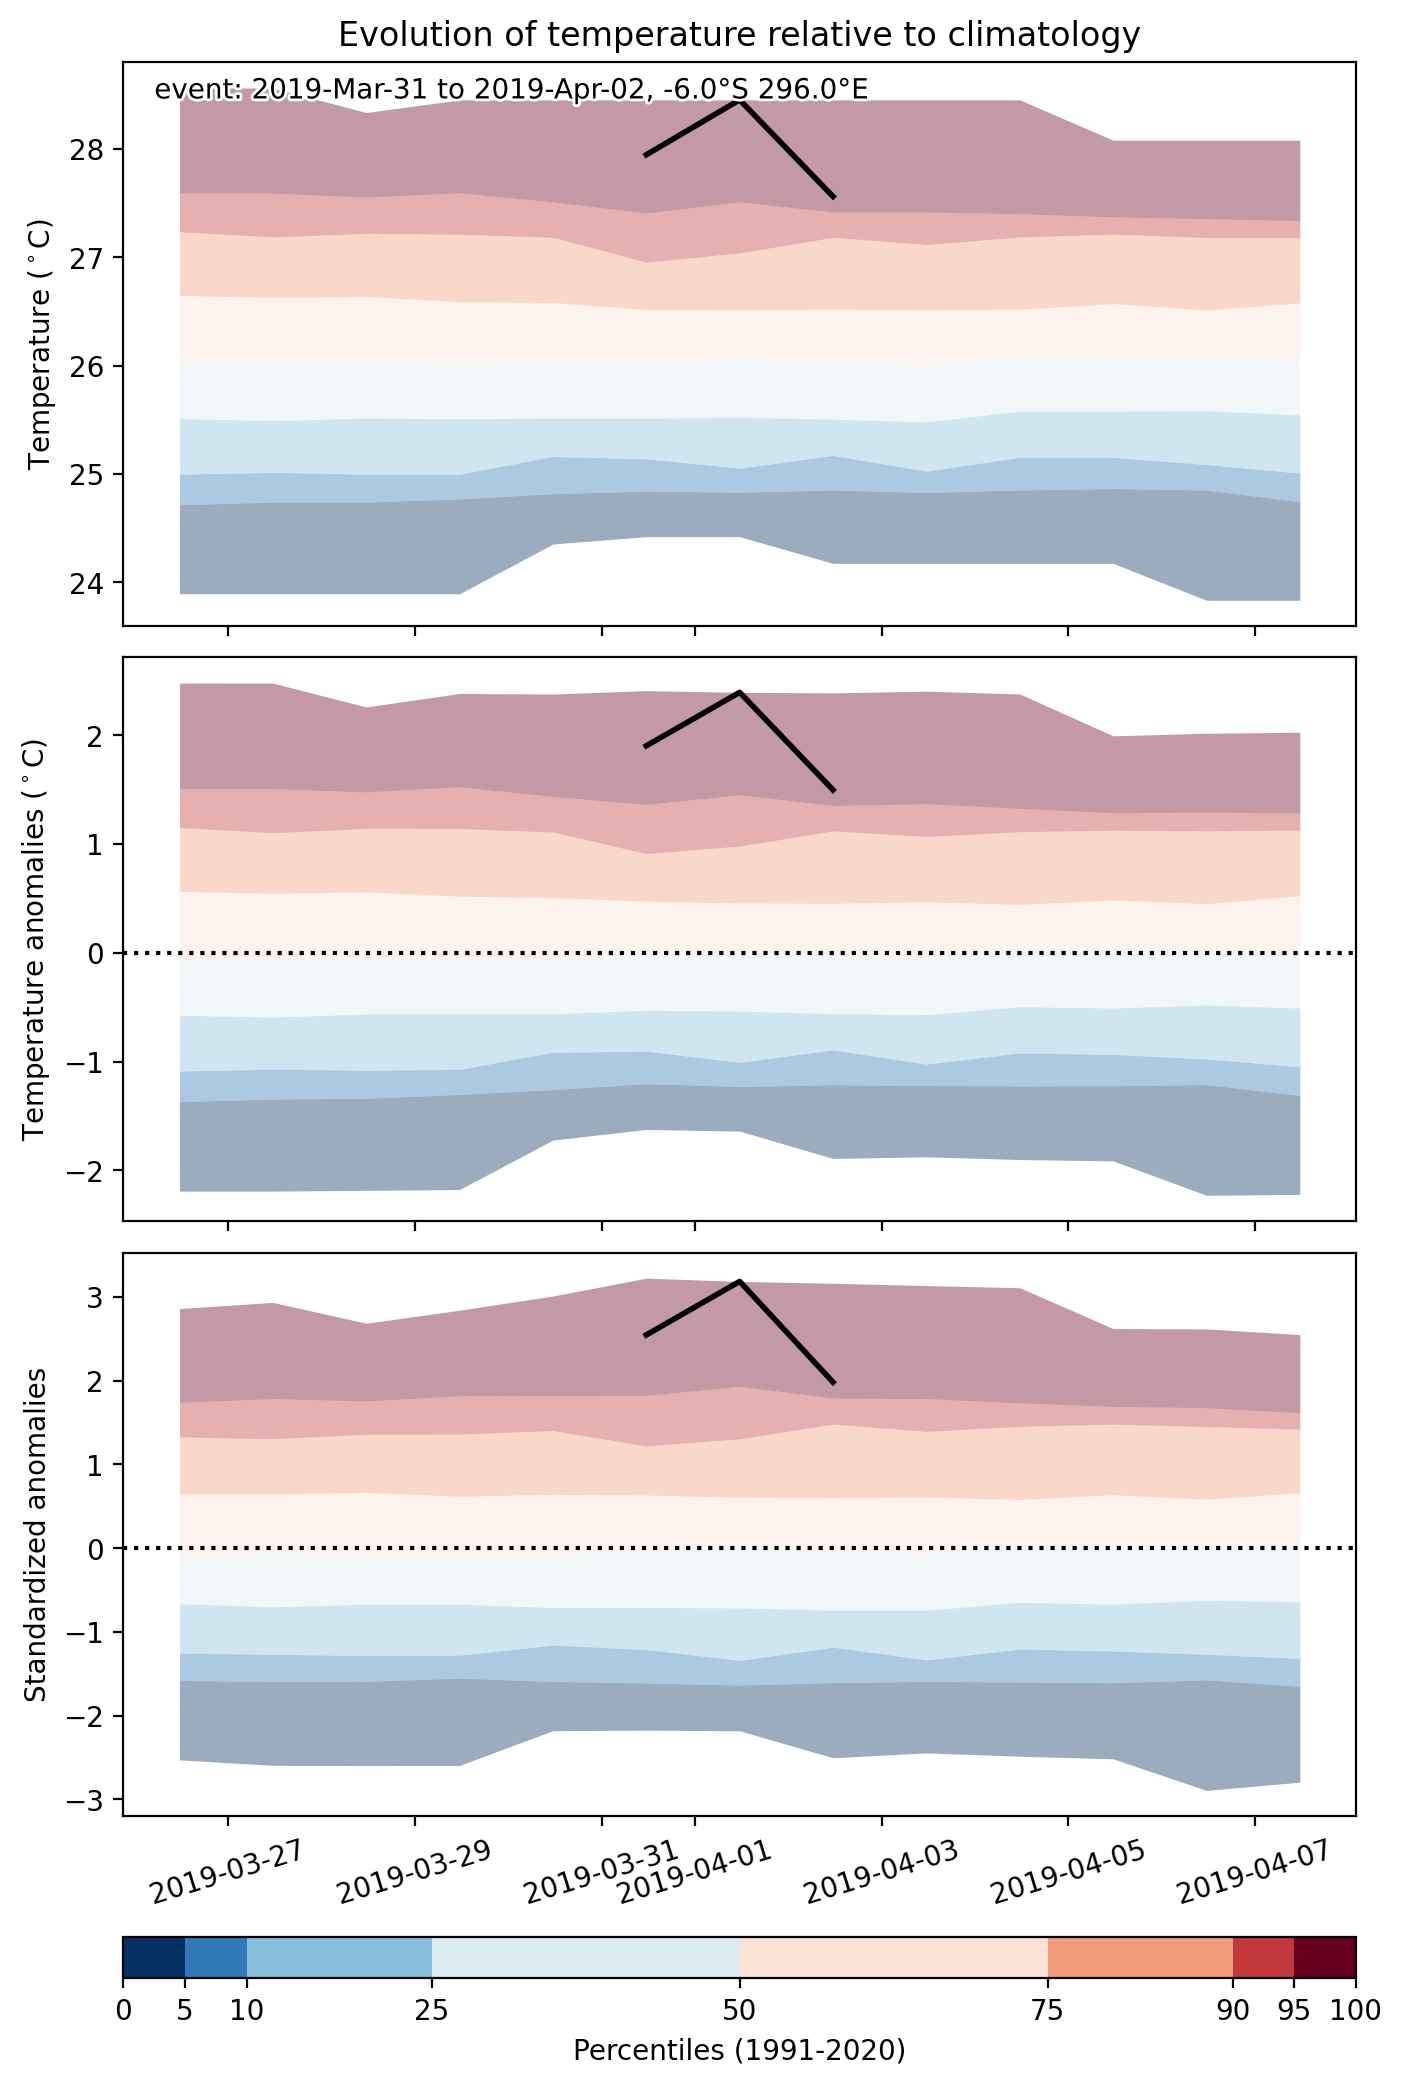
Fig. 2: Evolution of temperature at the center of the event. The climatological percentile distribution is illustrated with color shadings.


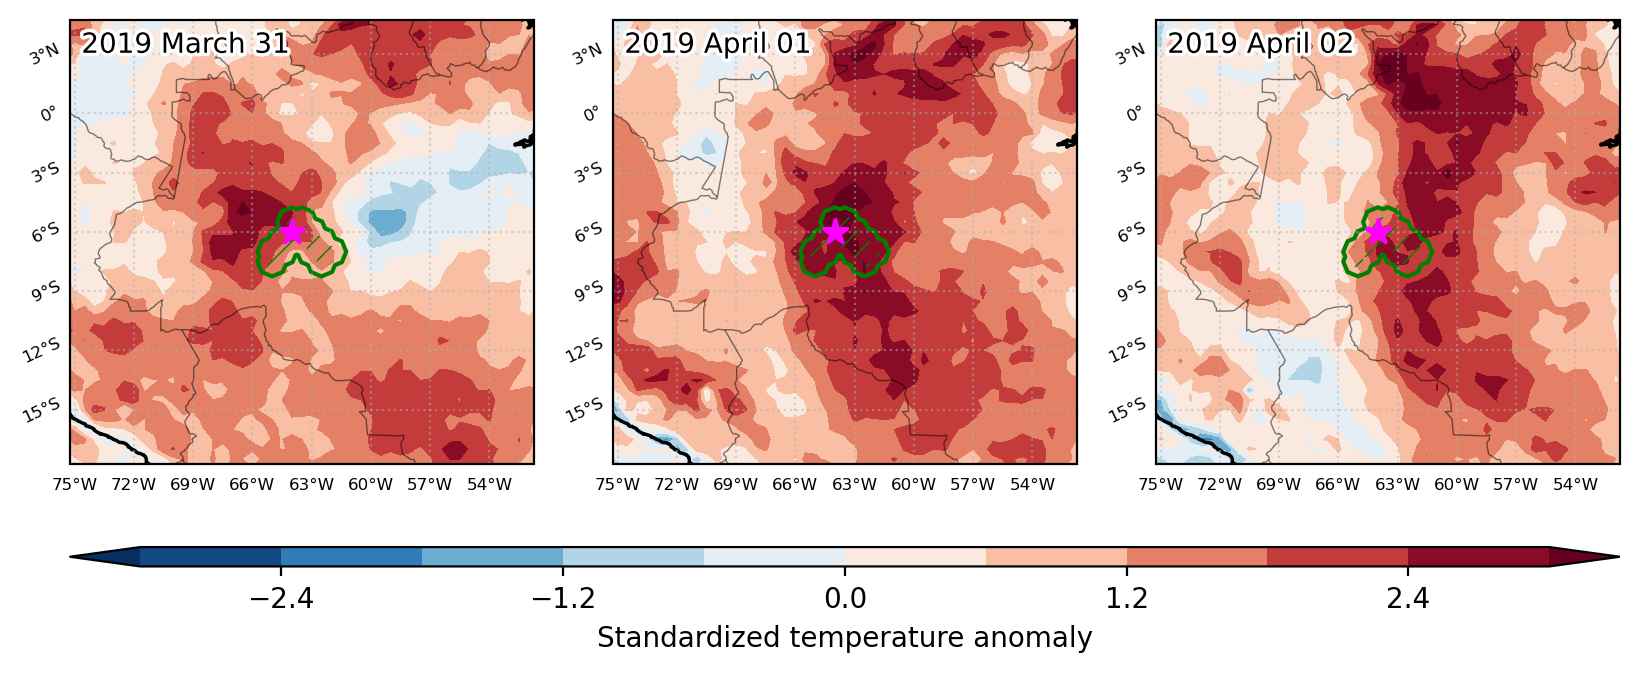
Fig. 3: Maps illustrating the evolution of standardized temperature anomalies during the event.

Event ID: Heat_wave_2019-Mar-31_to_2019-Apr-02_296.0_-6.0

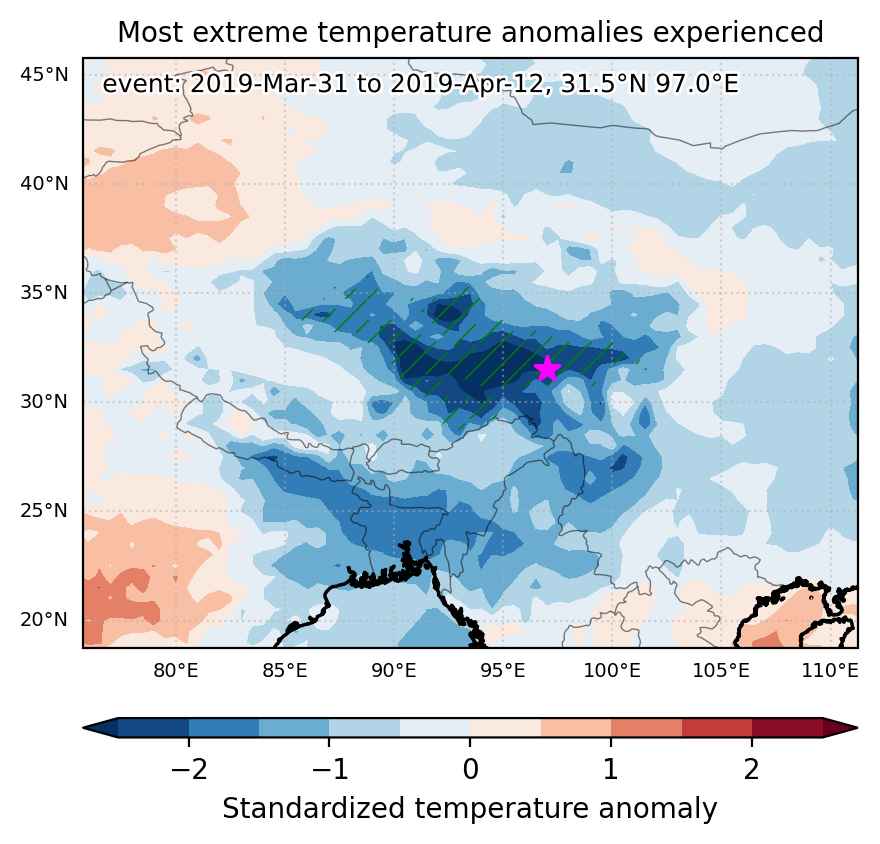
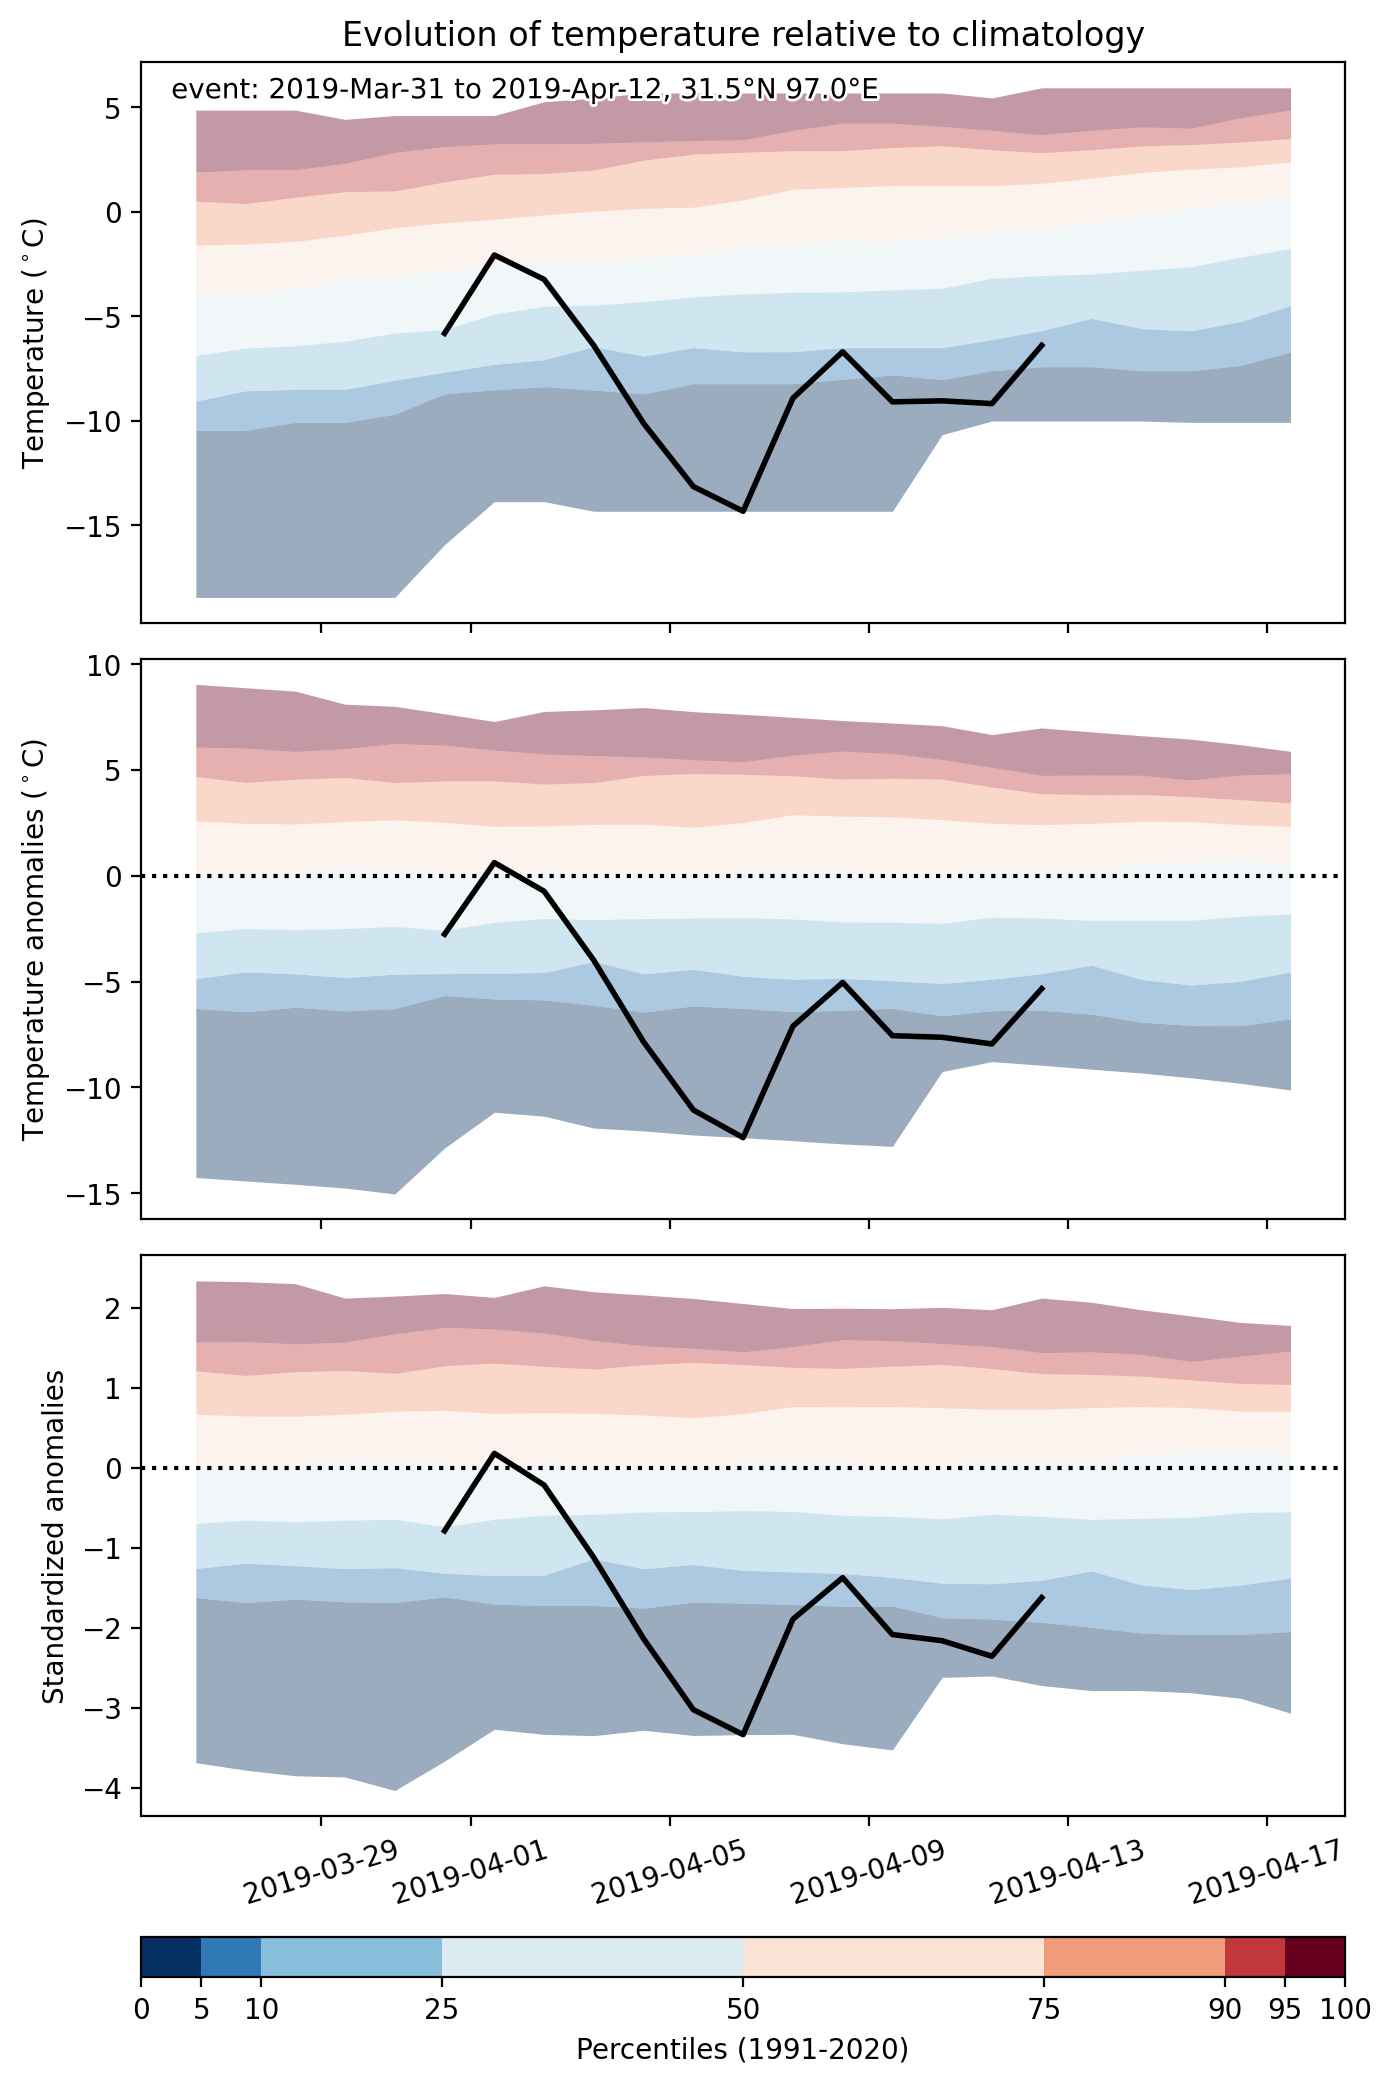
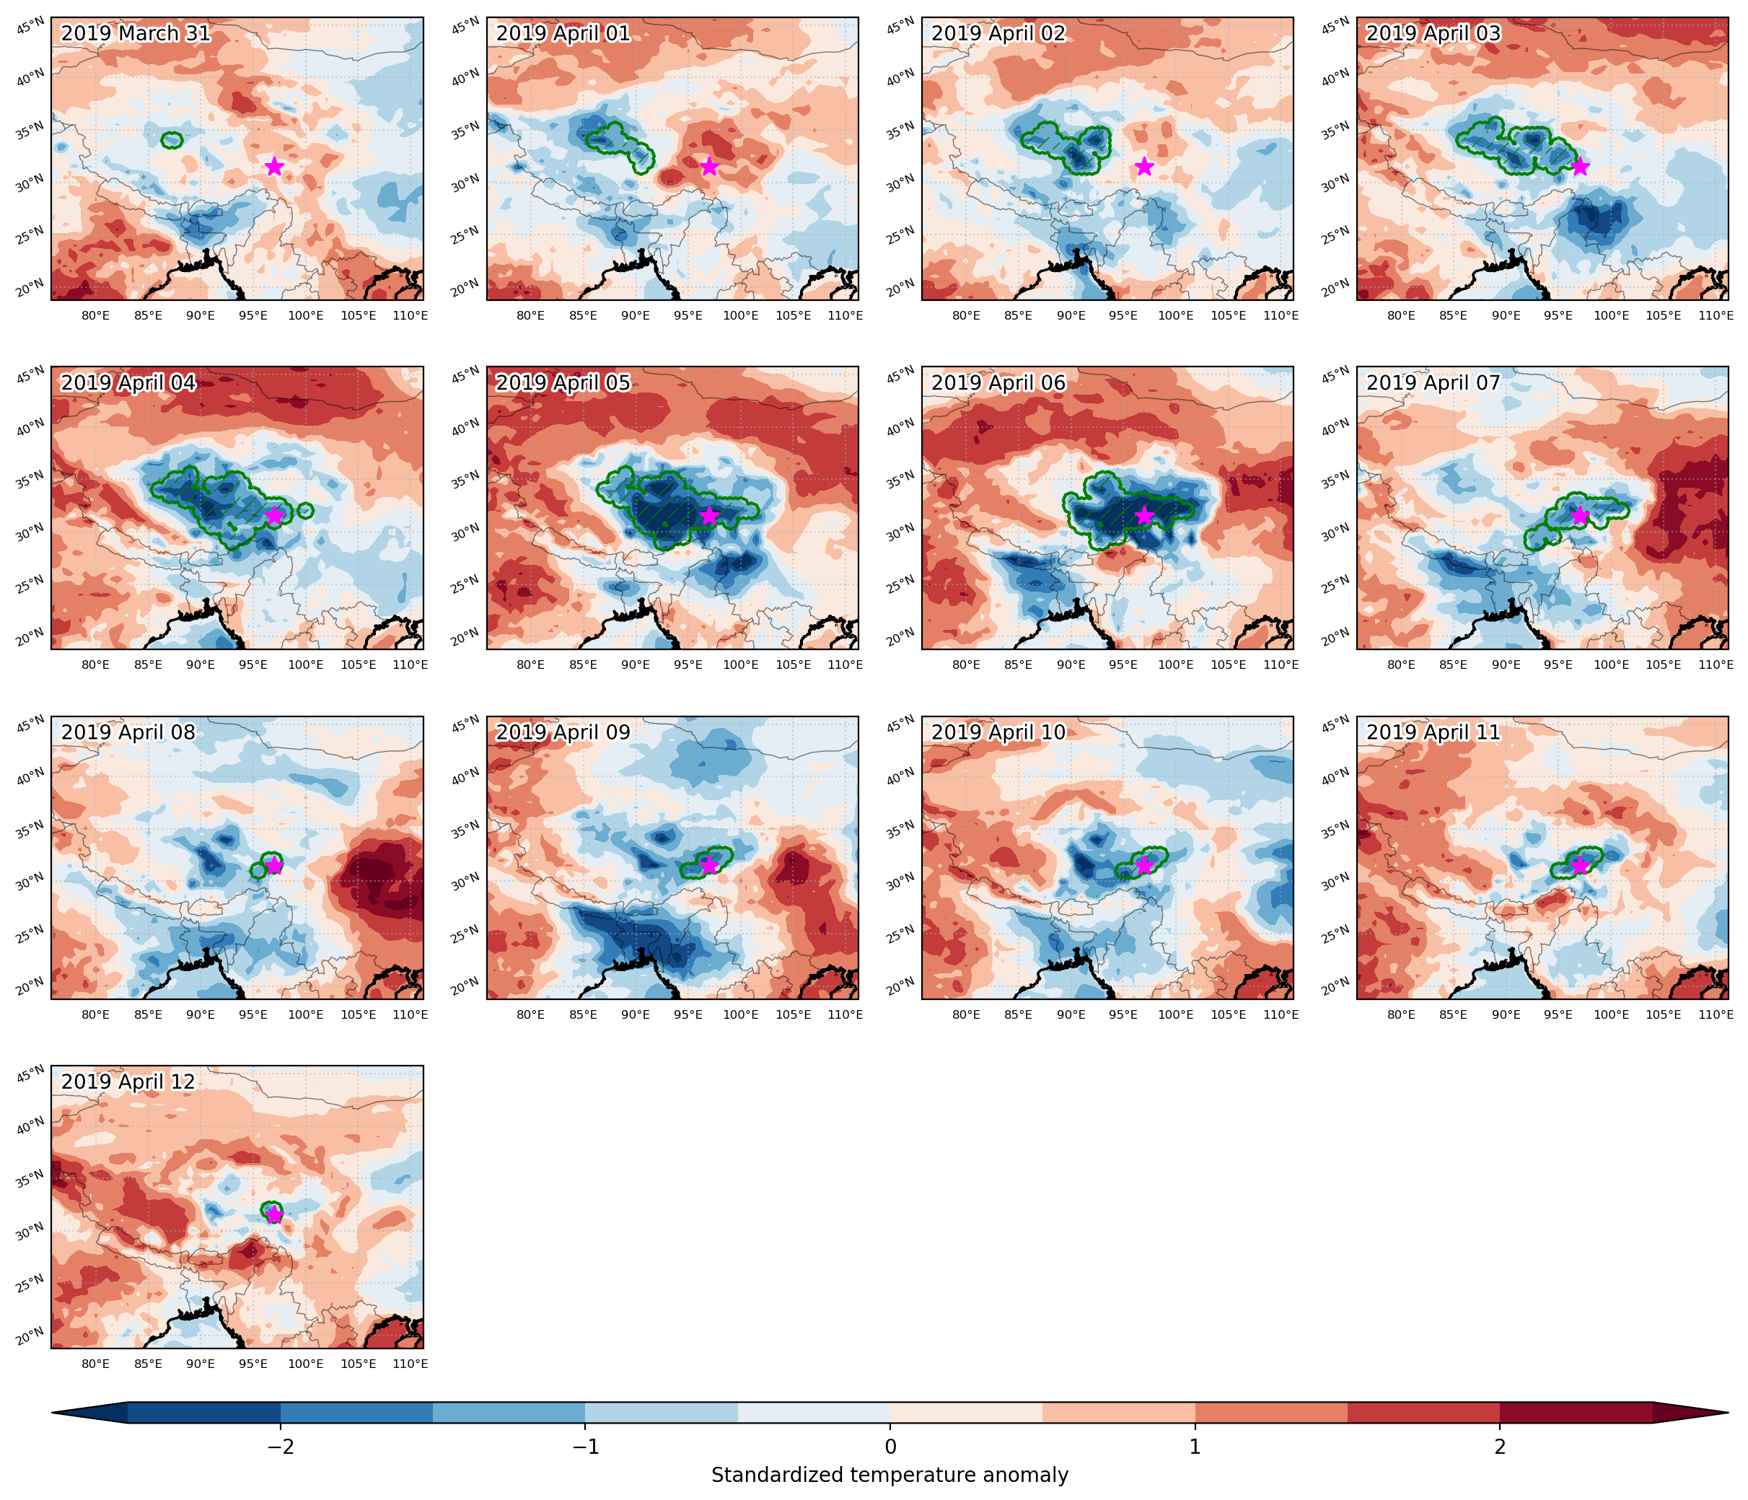
Cold spell occuring from March 31 2019 to April 12 2019 at 31.5°N 97.0°E

Download data: JSON

Event type: Cold spell

Countries affected (identified with ArcGIS Online; provided only for geographical reference):

  • China

Duration: 13 days

Time span: March 31 2019 to April 12 2019

Statistics over entire affected area:

  • Mean temperature anomaly: -6.6 °C
  • Mean temperature: -13.1 °C
  • Minimum temperature anomaly: -13.1 °C
  • Minimum temperature: -20.4 °C

Event center: 31.5°N 97.0°E

Area affected: 360106 km$^2$


Fig. 1: Map of most extreme temperature anomalies (standardized) experienced during the event. The purple star indicates the center of the extreme event. Green hatching illustrates all areas under the effect of extremes at some time during the event.


Fig. 2: Evolution of temperature at the center of the event. The climatological percentile distribution is illustrated with color shadings.


Fig. 3: Maps illustrating the evolution of standardized temperature anomalies during the event.

Event ID: Cold_spell_2019-Mar-31_to_2019-Apr-12_97.0_31.5

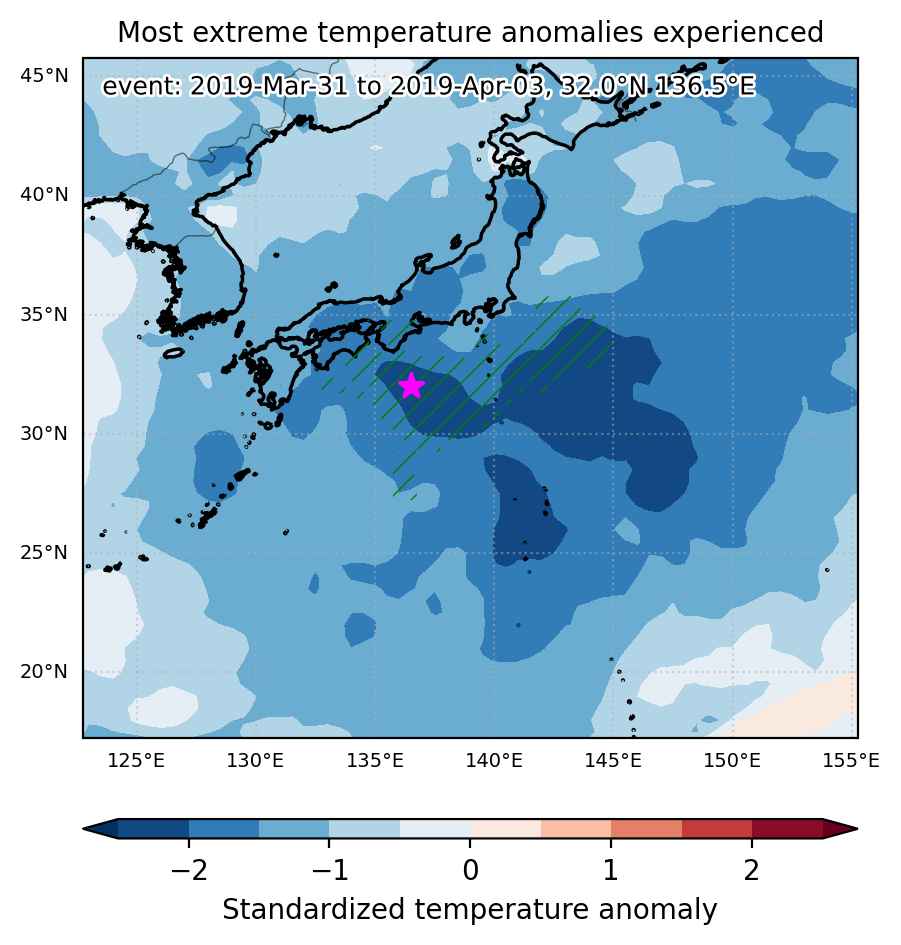
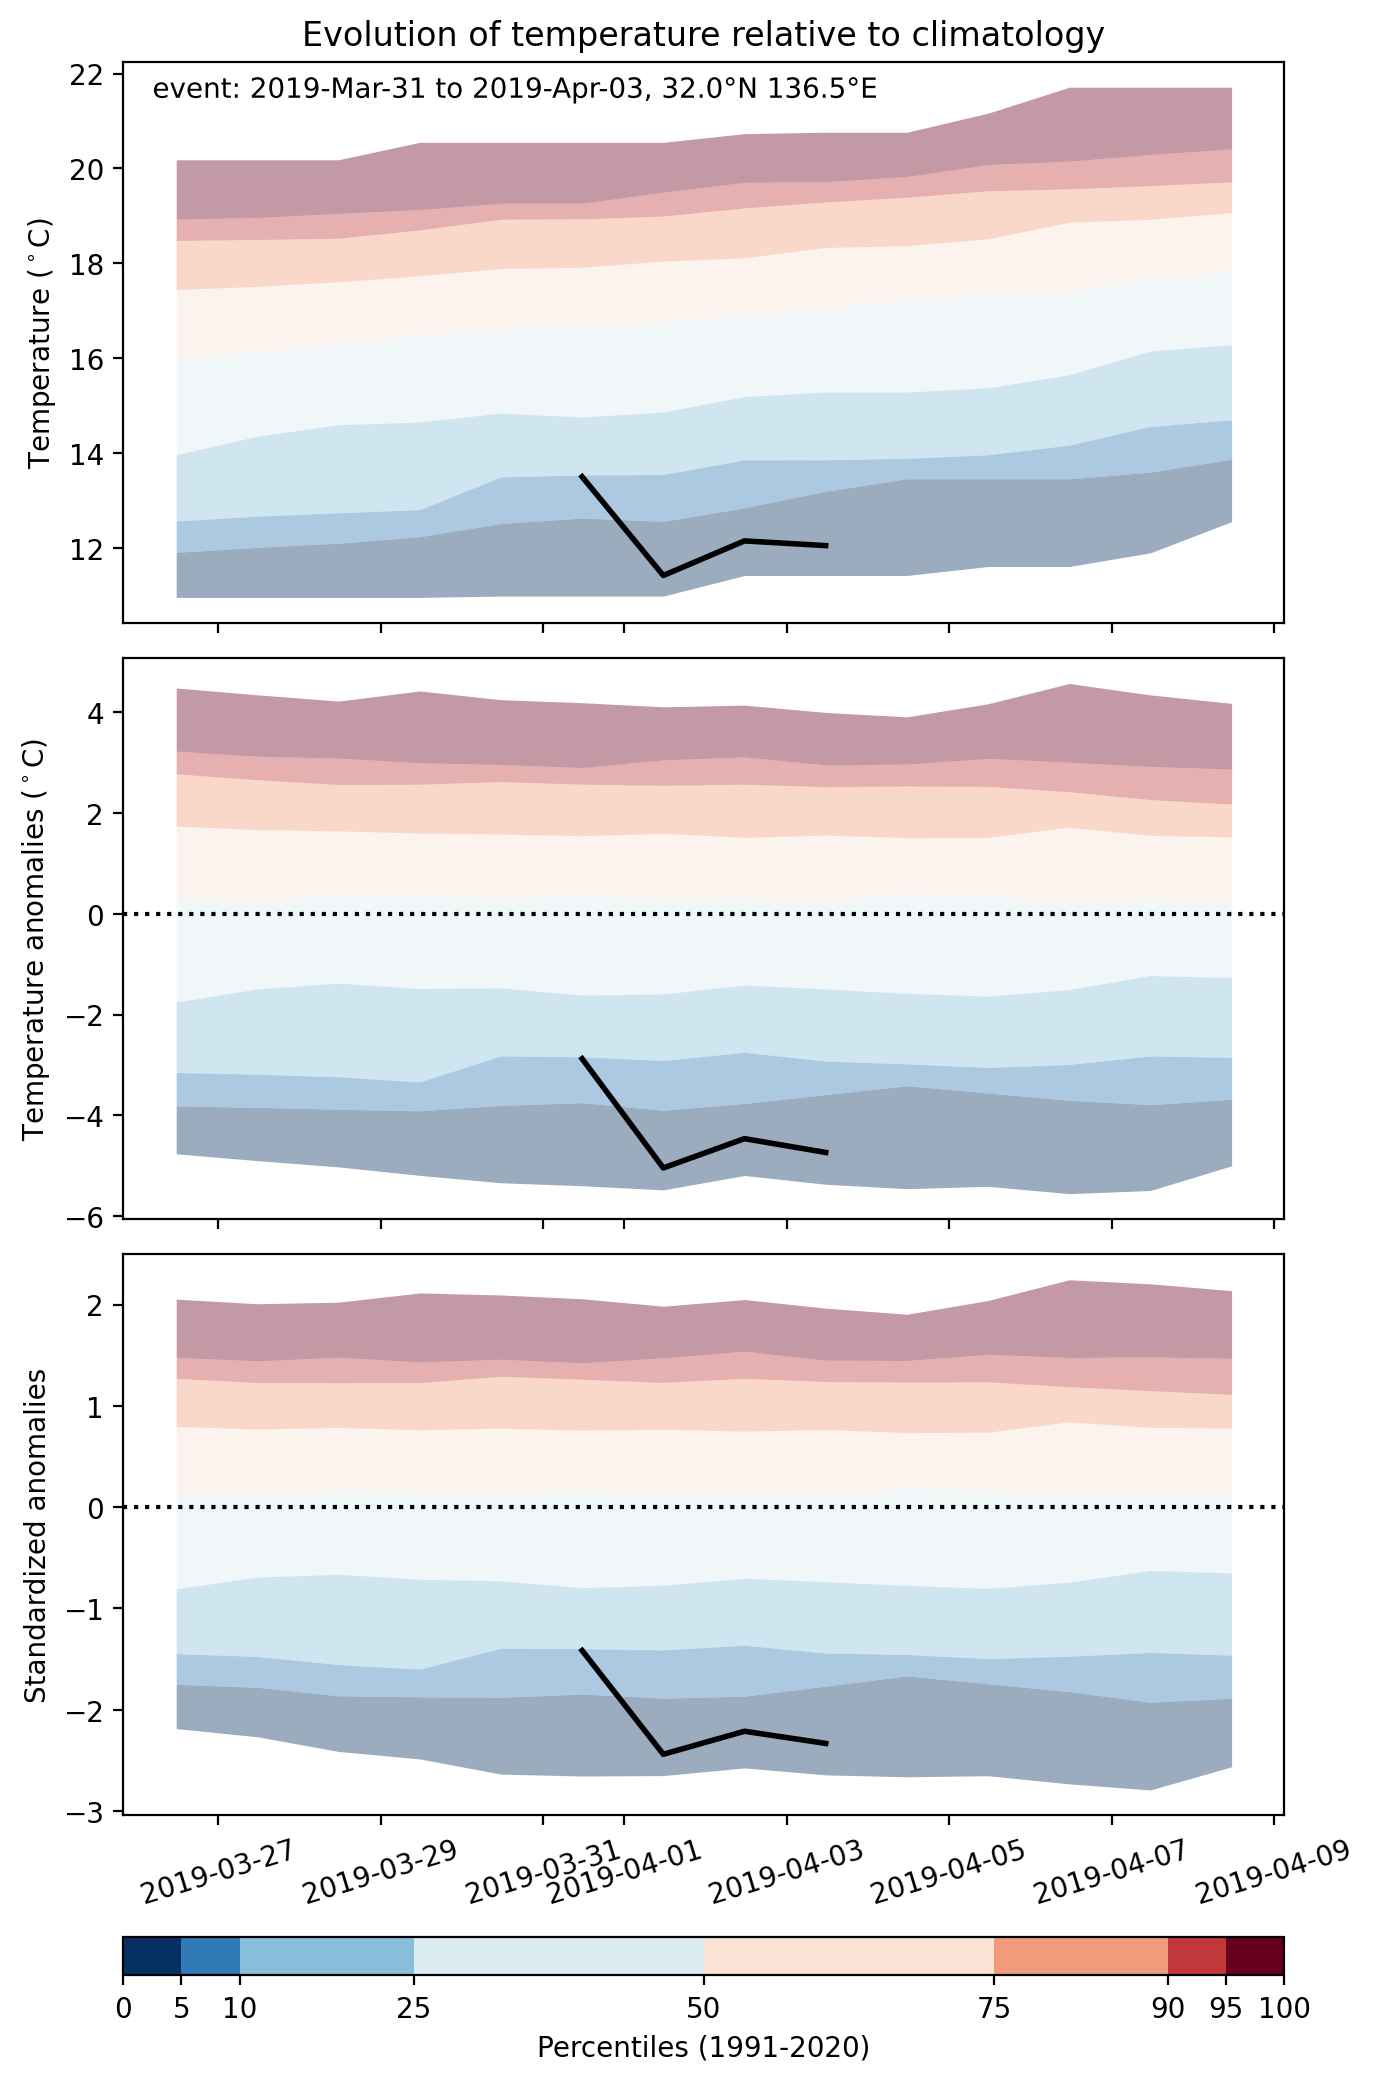
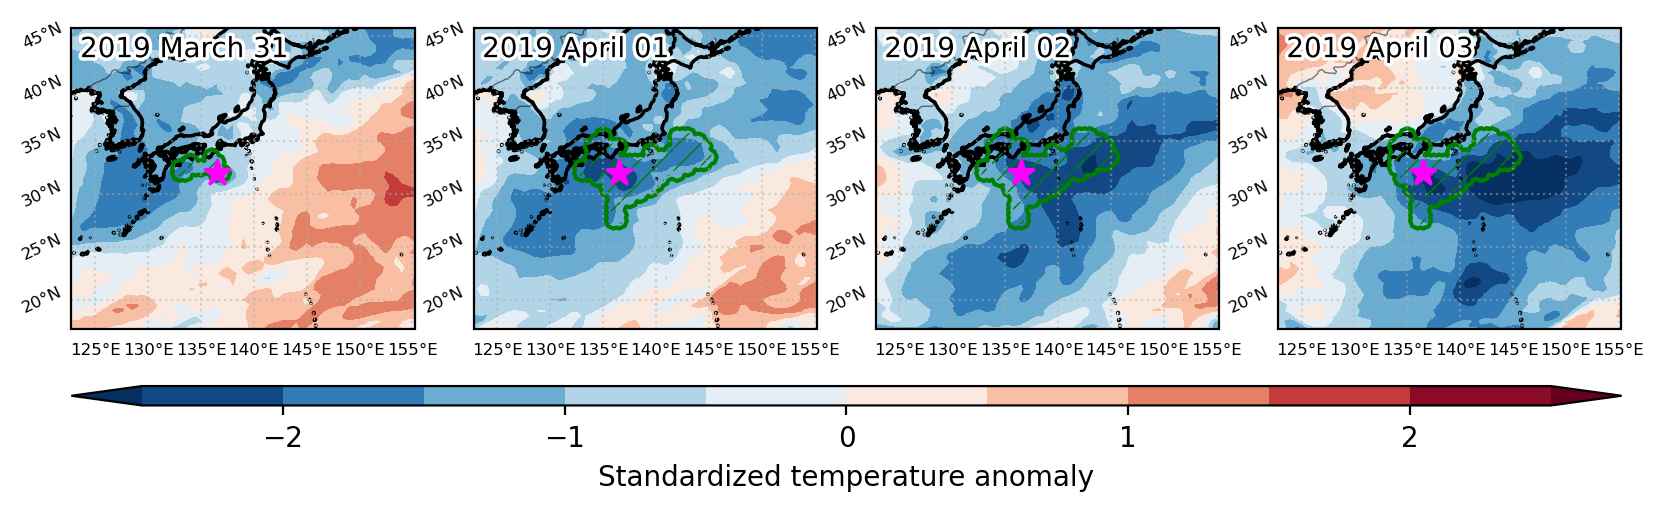
Cold spell occuring from March 31 2019 to April 03 2019 at 32.0°N 136.5°E

Download data: JSON

Event type: Cold spell

Countries affected (identified with ArcGIS Online; provided only for geographical reference):

  • Japan

Duration: 4 days

Time span: March 31 2019 to April 03 2019

Statistics over entire affected area:

  • Mean temperature anomaly: -4.0 °C
  • Mean temperature: 12.0 °C
  • Minimum temperature anomaly: -5.9 °C
  • Minimum temperature: 3.3 °C

Event center: 32.0°N 136.5°E

Area affected: 393922 km$^2$


Fig. 1: Map of most extreme temperature anomalies (standardized) experienced during the event. The purple star indicates the center of the extreme event. Green hatching illustrates all areas under the effect of extremes at some time during the event.


Fig. 2: Evolution of temperature at the center of the event. The climatological percentile distribution is illustrated with color shadings.


Fig. 3: Maps illustrating the evolution of standardized temperature anomalies during the event.

Event ID: Cold_spell_2019-Mar-31_to_2019-Apr-03_136.5_32.0