(ongoing) Heat wave occuring from April 29 2026 to May 03 2026 at -31.5°S 148.5°E

Download data: JSON

Event type: Heat wave

Countries affected (identified with ArcGIS Online; provided only for geographical reference):

  • Australia

Duration: 5 days

Time span: April 29 2026 to May 03 2026

Statistics over entire affected area:

  • Mean temperature anomaly: 4.7 °C
  • Mean temperature: 19.5 °C
  • Maximum temperature anomaly: 6.7 °C
  • Maximum temperature: 22.9 °C

Event center: -31.5°S 148.5°E

Area affected: 91992 km$^2$


Fig. 1: unavailable since event is ongoing.


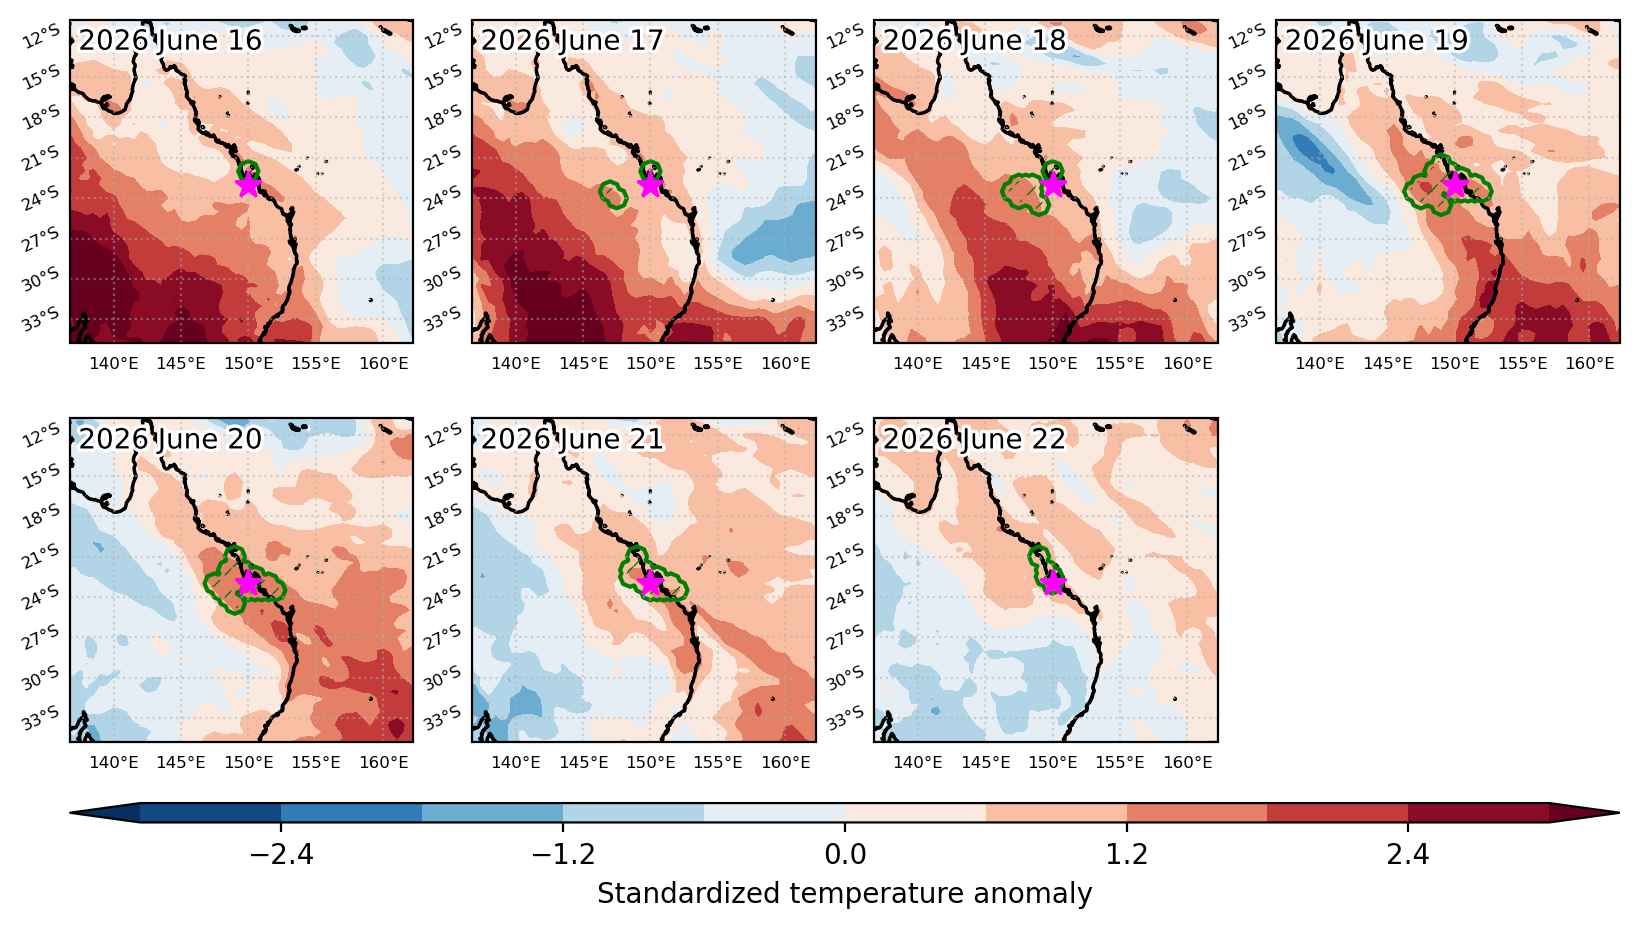
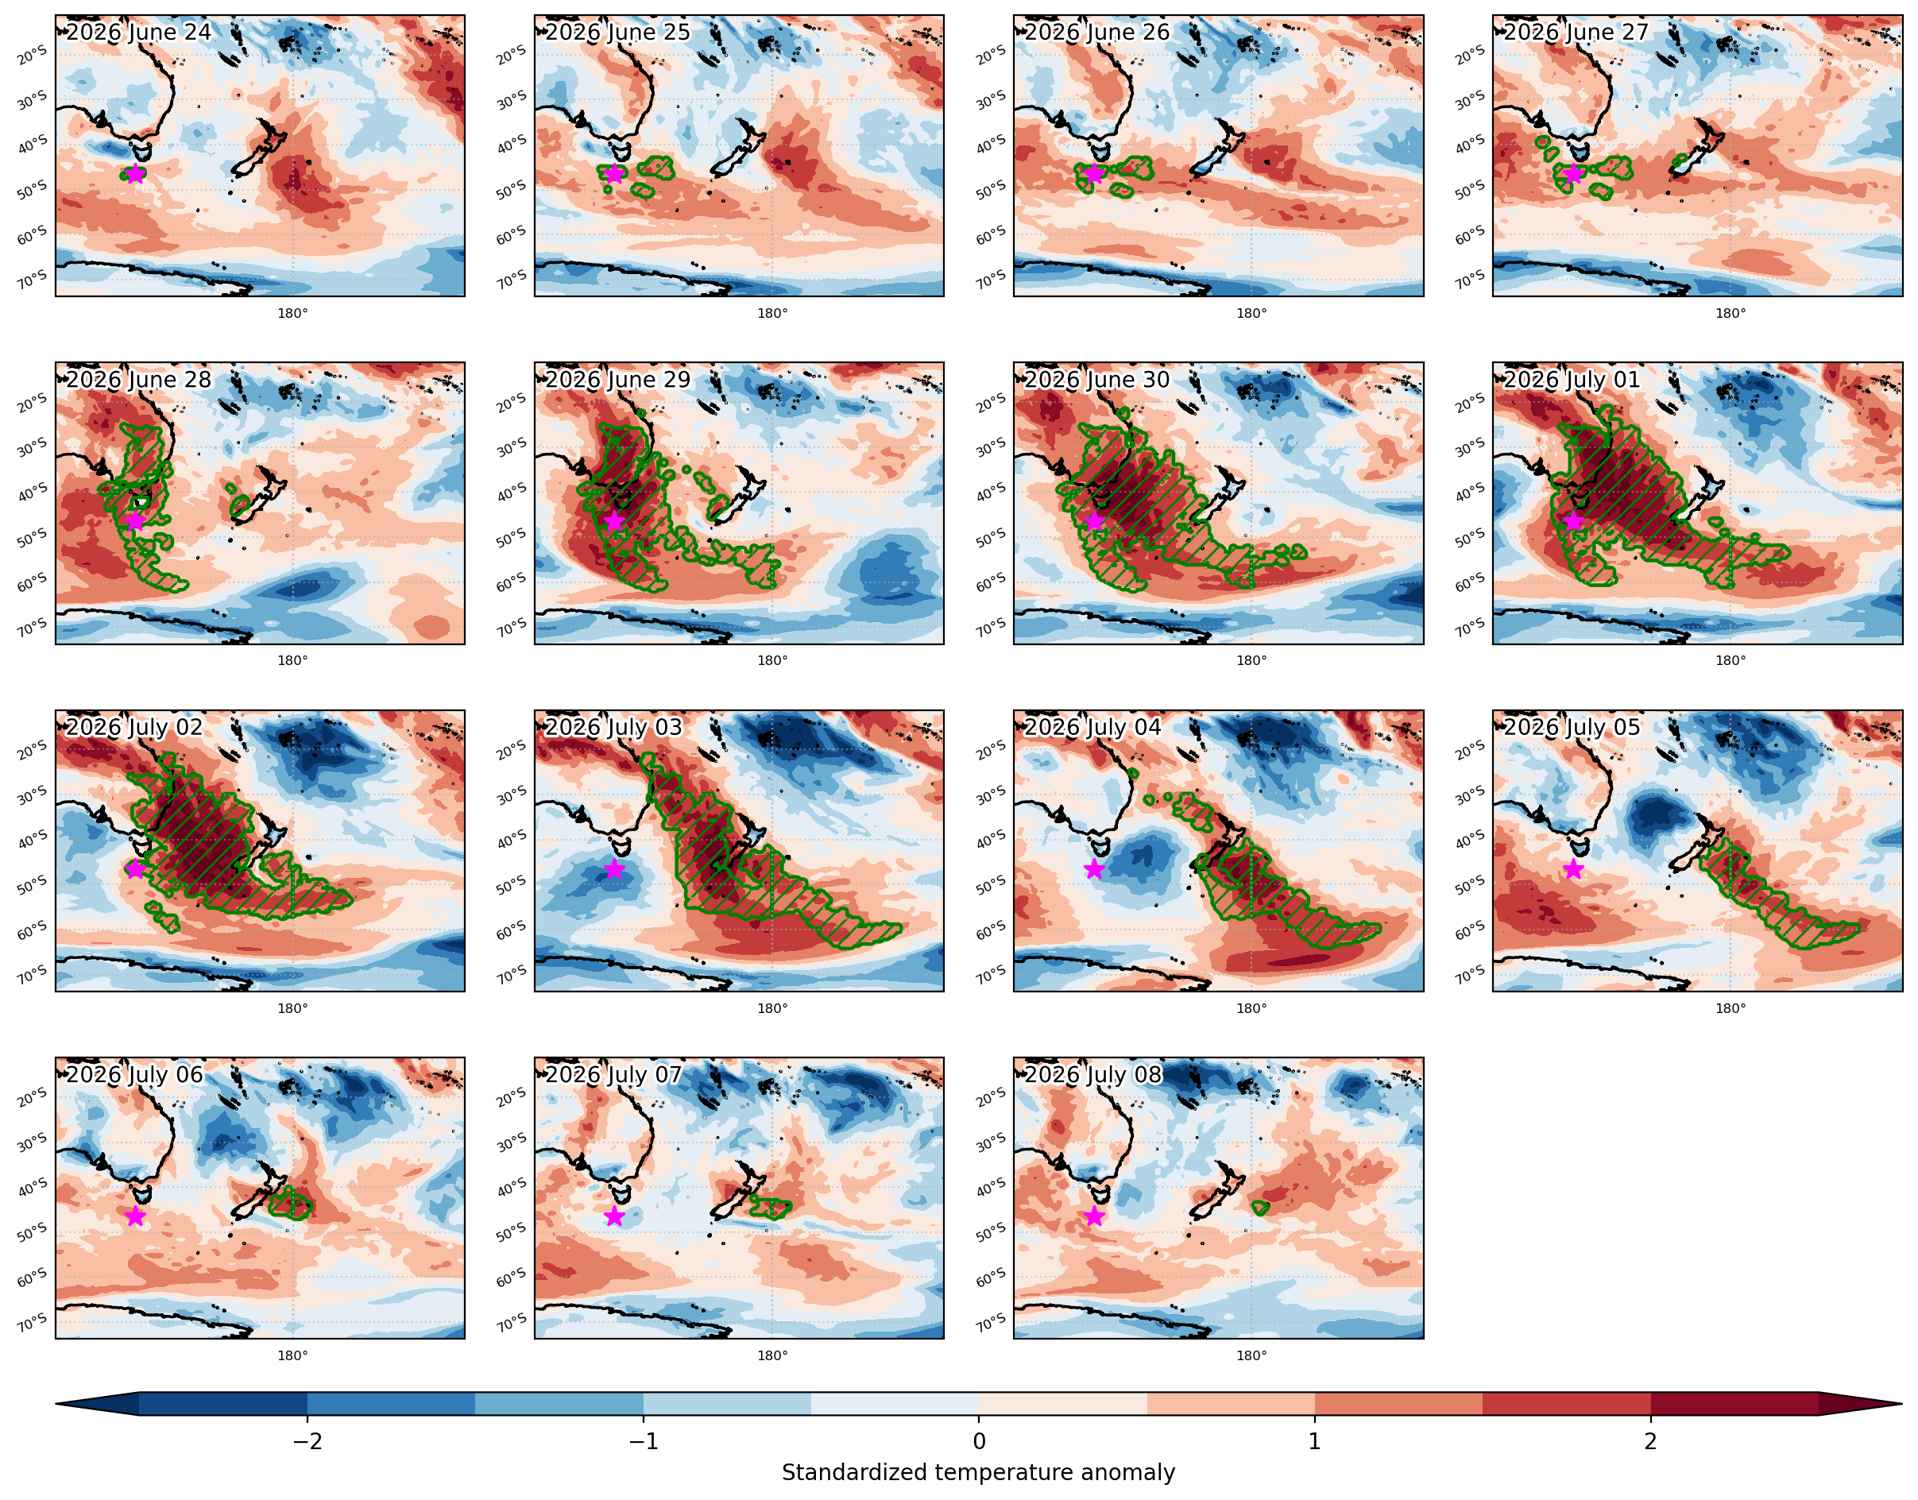
Fig. 3: Maps illustrating the evolution of standardized temperature anomalies during the event.

Event ID: Heat_wave_2026-Apr-29_to_2026-May-03_148.5_-31.5

(ongoing) Heat wave occuring from April 20 2026 to May 03 2026 at -45.5°S 147.5°E

Download data: JSON

Event type: Heat wave

Countries affected (identified with ArcGIS Online; provided only for geographical reference):

  • Australia

Duration: 14 days

Time span: April 20 2026 to May 03 2026

Statistics over entire affected area:

  • Mean temperature anomaly: 3.4 °C
  • Mean temperature: 16.1 °C
  • Maximum temperature anomaly: 10.9 °C
  • Maximum temperature: 25.9 °C

Event center: -45.5°S 147.5°E

Area affected: 3800949 km$^2$


Fig. 1: unavailable since event is ongoing.


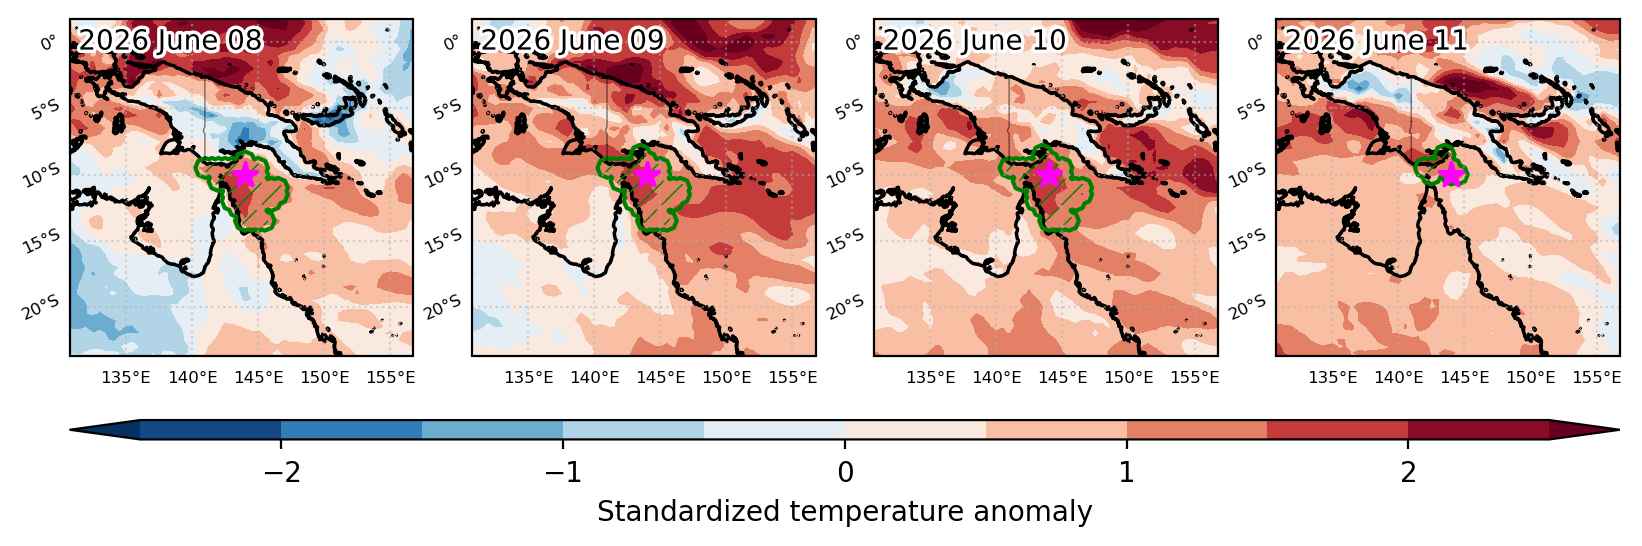
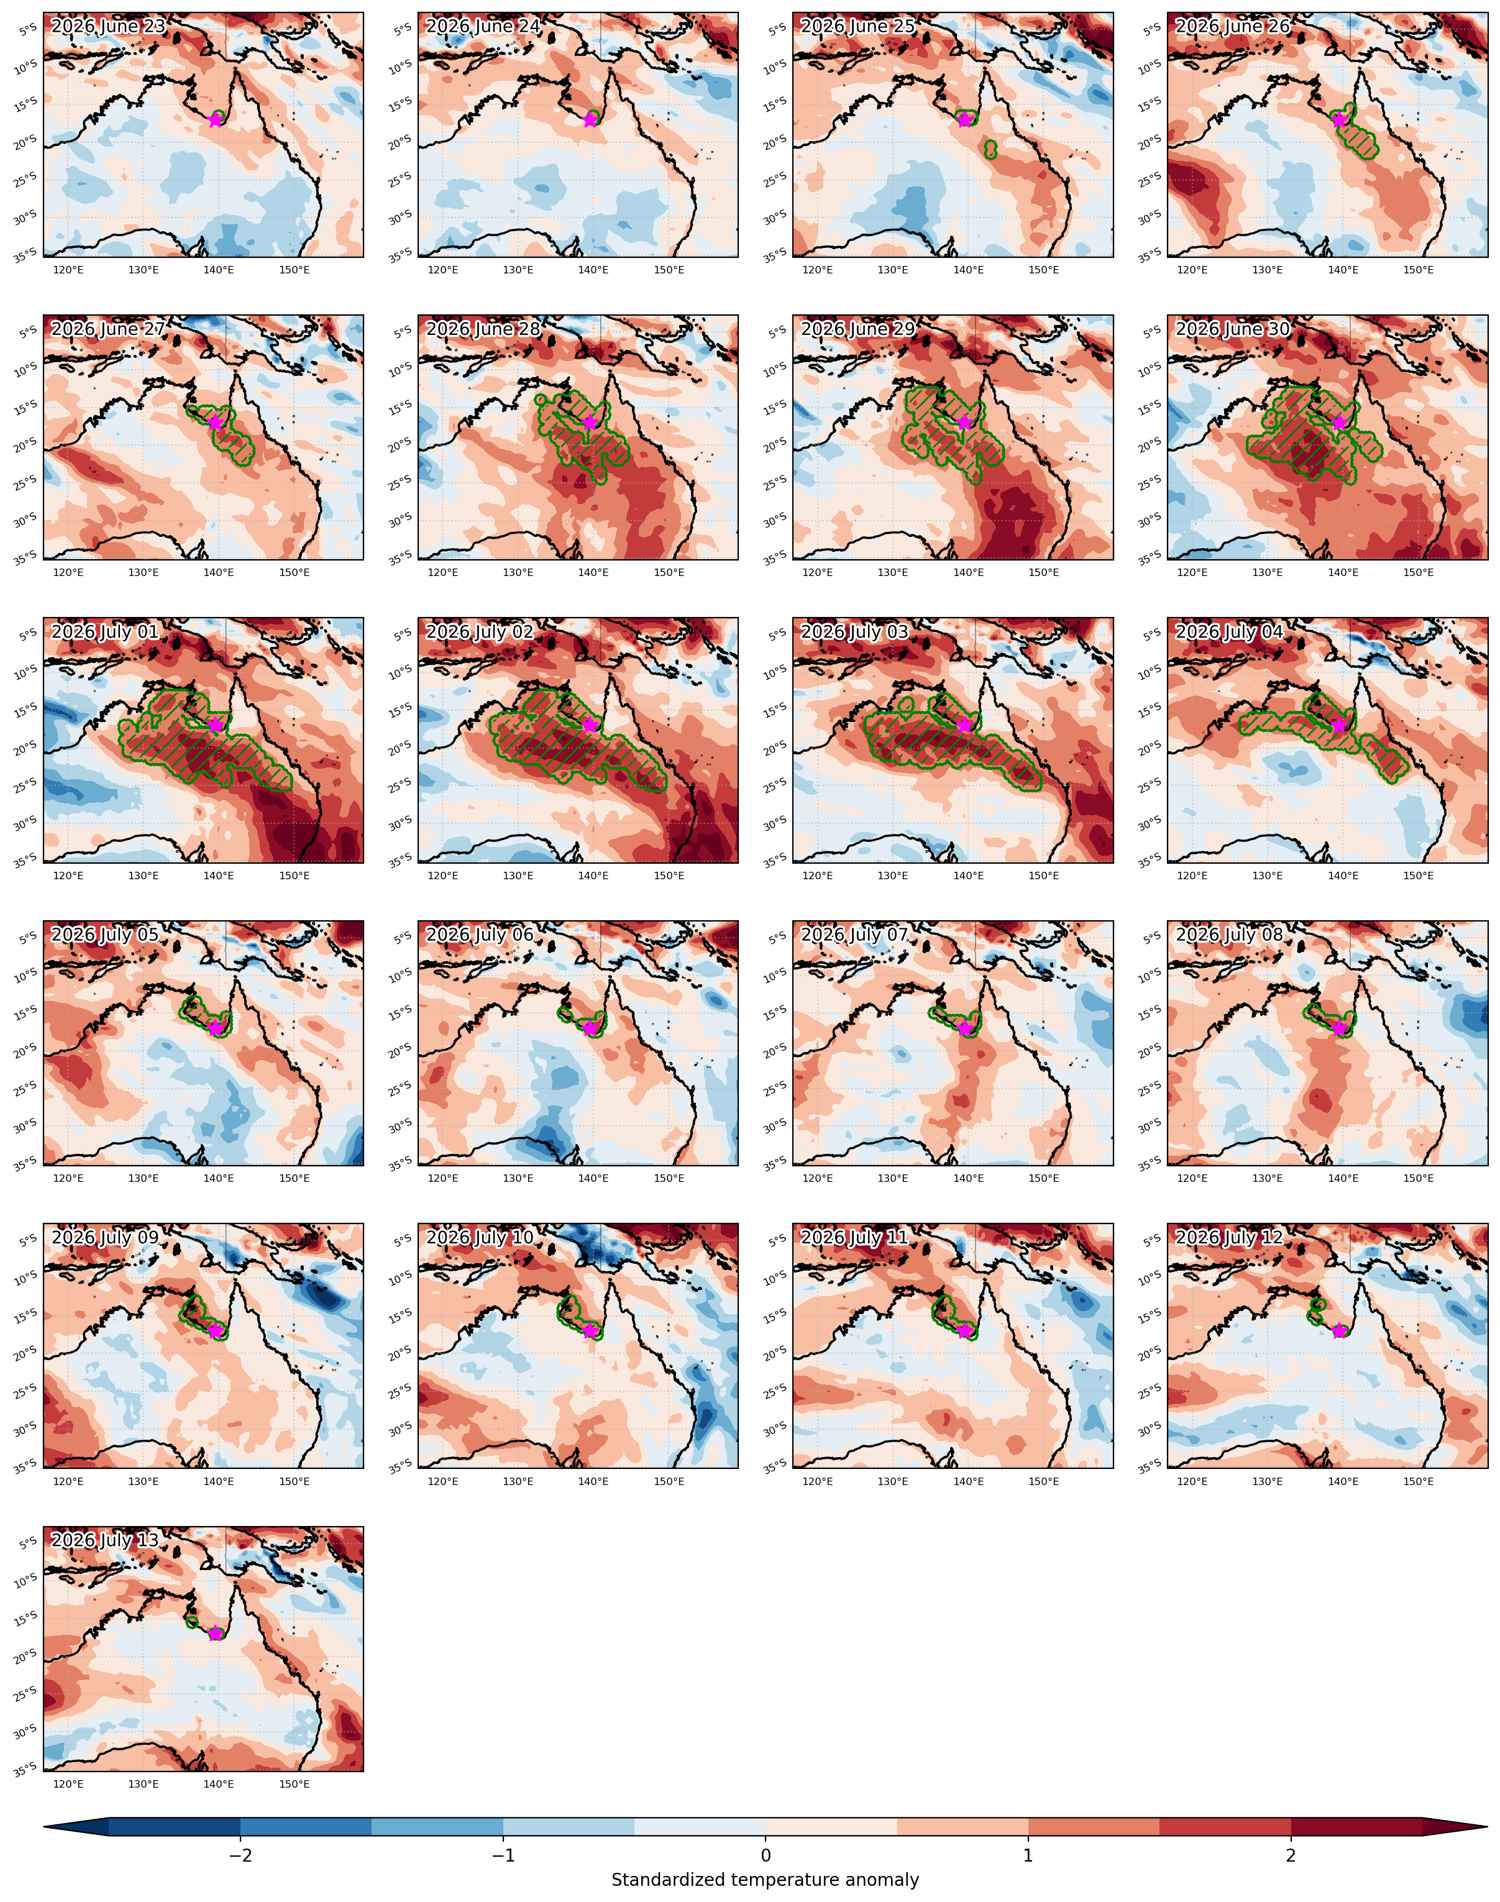
Fig. 3: Maps illustrating the evolution of standardized temperature anomalies during the event.

Event ID: Heat_wave_2026-Apr-20_to_2026-May-03_147.5_-45.5

(ongoing) Heat wave occuring from October 16 2022 to May 03 2026 at 10.5°N 294.0°E

Download data: JSON

Event type: Heat wave

Countries affected (identified with ArcGIS Online; provided only for geographical reference):

  • Afghanistan
  • Albania
  • Algeria
  • Andorra
  • Angola
  • Antarctica
  • Argentina
  • Armenia
  • Aruba
  • Australia
  • Austria
  • Azerbaijan
  • Azores
  • Bahamas
  • Bahrain
  • Bangladesh
  • Belarus
  • Belgium
  • Belize
  • Benin
  • Bhutan
  • Bolivia
  • Bosnia and Herzegovina
  • Botswana
  • Brazil
  • Brunei Darussalam
  • Bulgaria
  • Burkina Faso
  • Burundi
  • Cabo Verde
  • Cambodia
  • Cameroon
  • Canada
  • Canarias
  • Central African Republic
  • Chad
  • Chile
  • China
  • Colombia
  • Congo
  • Congo DRC
  • Costa Rica
  • Croatia
  • Cuba
  • Cyprus
  • Czech Republic
  • Côte d’Ivoire
  • Denmark
  • Djibouti
  • Dominican Republic
  • Ecuador
  • Egypt
  • El Salvador
  • Equatorial Guinea
  • Eritrea
  • Estonia
  • Eswatini
  • Ethiopia
  • Falkland Islands
  • Faroe Islands
  • Fiji
  • Finland
  • France
  • French Guiana
  • French Southern Territories
  • Gabon
  • Gambia
  • Georgia
  • Germany
  • Ghana
  • Greece
  • Greenland
  • Guatemala
  • Guinea
  • Guinea-Bissau
  • Guyana
  • Haiti
  • Honduras
  • Hungary
  • Iceland
  • India
  • Indonesia
  • Iran
  • Iraq
  • Ireland
  • Israel
  • Italy
  • Jamaica
  • Japan
  • Jordan
  • Kazakhstan
  • Kenya
  • Kuwait
  • Kyrgyzstan
  • Laos
  • Latvia
  • Lebanon
  • Lesotho
  • Liberia
  • Libya
  • Lithuania
  • Luxembourg
  • Madagascar
  • Madeira
  • Malawi
  • Malaysia
  • Mali
  • Martinique
  • Mauritania
  • Mauritius
  • Mexico
  • Moldova
  • Mongolia
  • Montenegro
  • Morocco
  • Mozambique
  • Myanmar
  • Namibia
  • Nepal
  • Netherlands
  • New Caledonia
  • New Zealand
  • Nicaragua
  • Niger
  • Nigeria
  • North Korea
  • North Macedonia
  • Norway
  • Oman
  • Pakistan
  • Palau
  • Palestinian Territory
  • Panama
  • Papua New Guinea
  • Paraguay
  • Peru
  • Philippines
  • Poland
  • Portugal
  • Puerto Rico
  • Qatar
  • Romania
  • Russian Federation
  • Rwanda
  • Réunion
  • Saint Eustatius
  • Saint Lucia
  • Samoa
  • Saudi Arabia
  • Senegal
  • Serbia
  • Sierra Leone
  • Slovakia
  • Slovenia
  • Solomon Islands
  • Somalia
  • South Africa
  • South Georgia and the South Sandwich Islands
  • South Korea
  • South Sudan
  • Spain
  • Sri Lanka
  • Sudan
  • Suriname
  • Sweden
  • Switzerland
  • Syria
  • Tajikistan
  • Tanzania
  • Thailand
  • Timor-Leste
  • Togo
  • Tunisia
  • Turkiye
  • Turkmenistan
  • Turks and Caicos Islands
  • Uganda
  • Ukraine
  • United Arab Emirates
  • United Kingdom
  • United States
  • Uruguay
  • Uzbekistan
  • Vanuatu
  • Venezuela
  • Vietnam
  • Yemen
  • Zambia
  • Zimbabwe

Duration: 1296 days

Time span: October 16 2022 to May 03 2026

Statistics over entire affected area:

  • Mean temperature anomaly: 3.4 °C
  • Mean temperature: 18.1 °C
  • Maximum temperature anomaly: 33.2 °C
  • Maximum temperature: 46.7 °C

Event center: 10.5°N 294.0°E

Area affected: 509588681 km$^2$


Fig. 1: unavailable since event is ongoing.


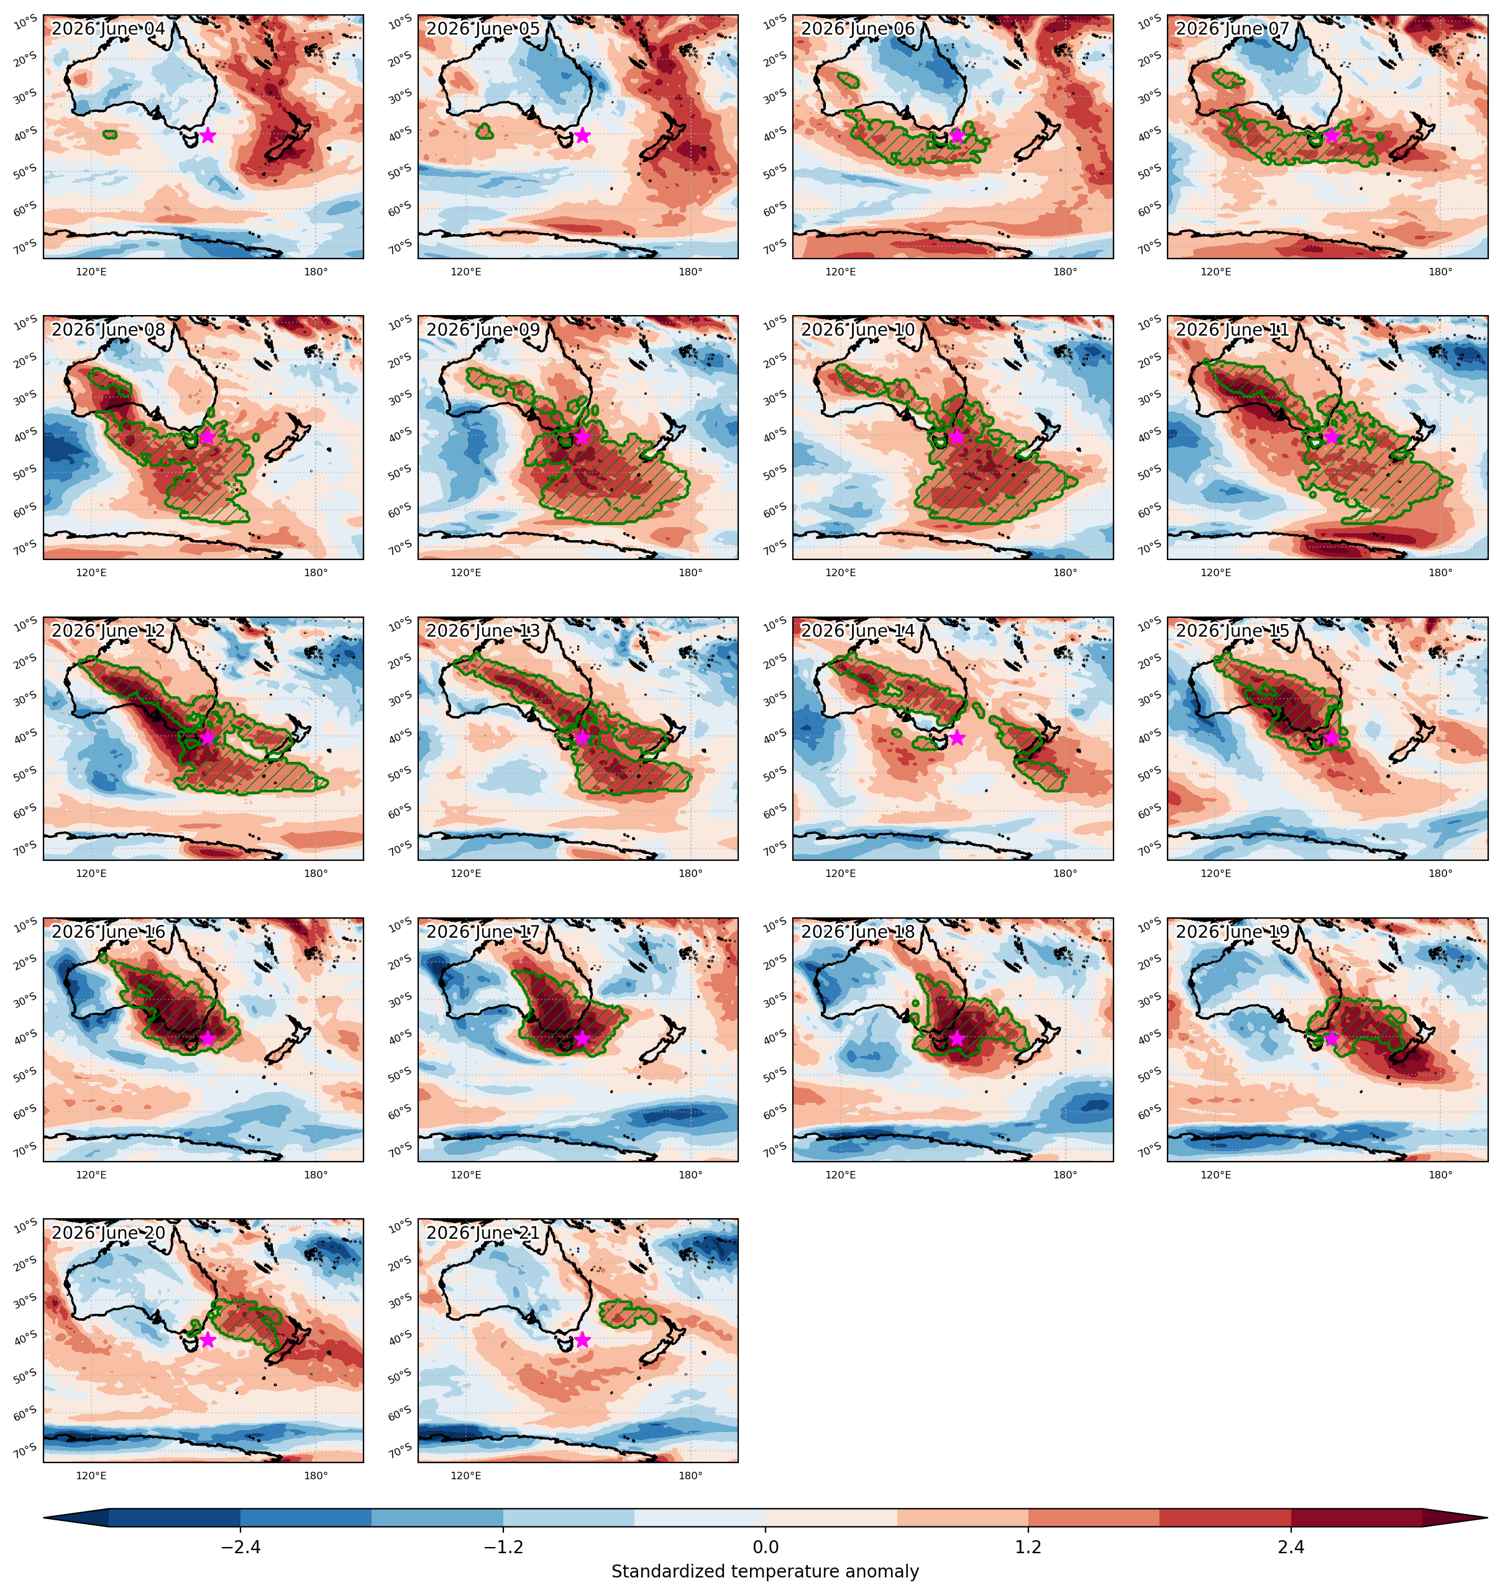
Fig. 3: Maps illustrating the evolution of standardized temperature anomalies during the event.

Event ID: Heat_wave_2022-Oct-16_to_2026-May-03_294.0_10.5

Heat wave occuring from April 22 2026 to April 30 2026 at -26.0°S 121.0°E

Download data: JSON

Event type: Heat wave

Countries affected (identified with ArcGIS Online; provided only for geographical reference):

  • Australia

Duration: 9 days

Time span: April 22 2026 to April 30 2026

Statistics over entire affected area:

  • Mean temperature anomaly: 4.9 °C
  • Mean temperature: 27.8 °C
  • Maximum temperature anomaly: 6.7 °C
  • Maximum temperature: 31.8 °C

Event center: -26.0°S 121.0°E

Area affected: 172904 km$^2$


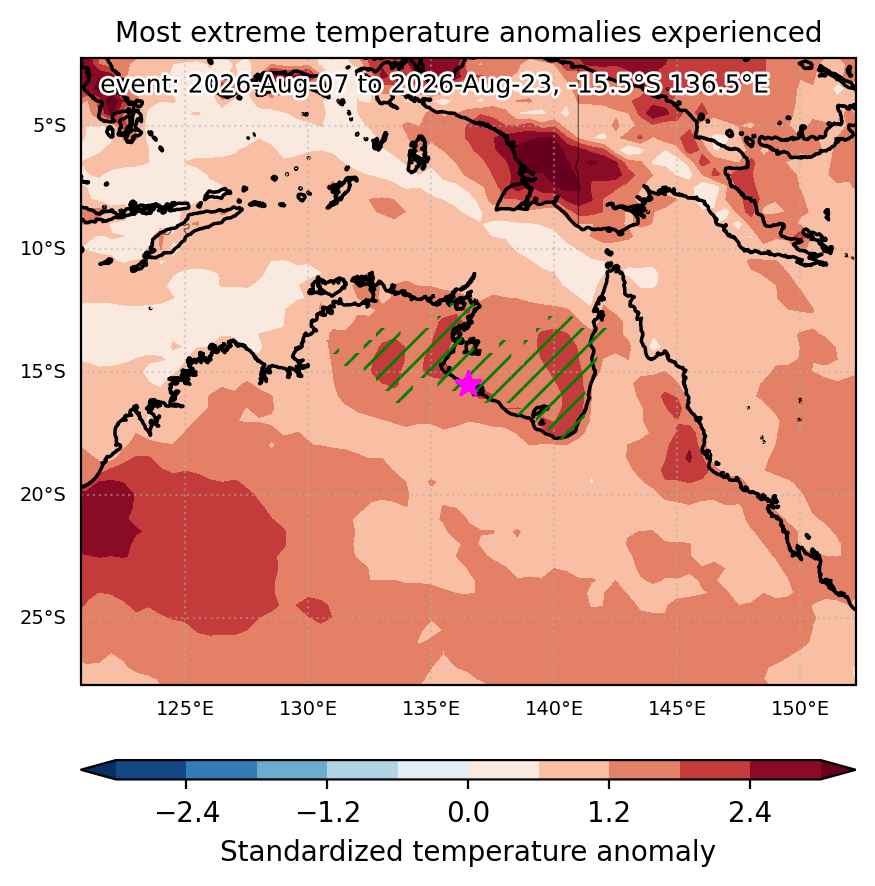
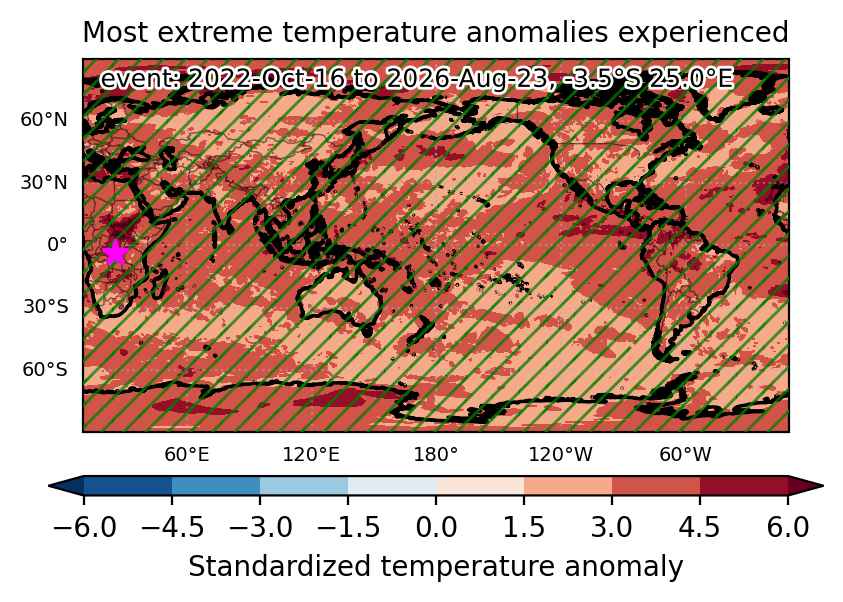
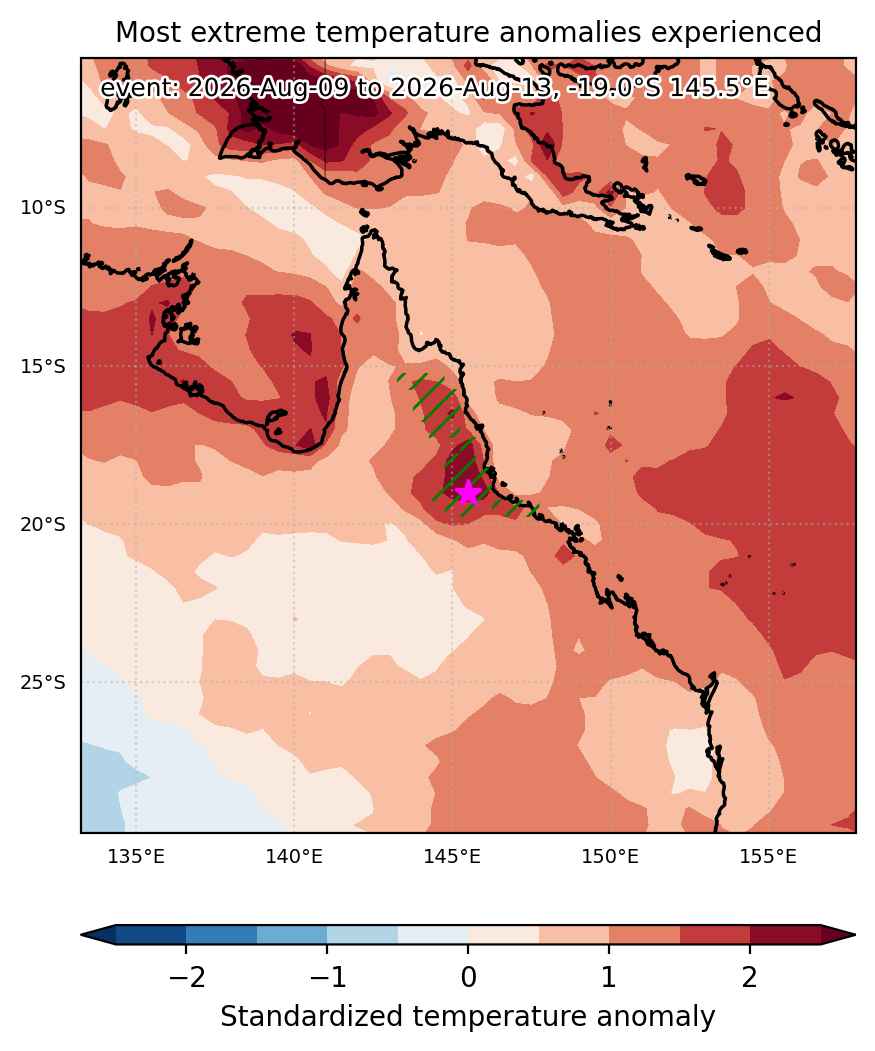
Fig. 1: Map of most extreme temperature anomalies (standardized) experienced during the event. The purple star indicates the center of the extreme event. Green hatching illustrates all areas under the effect of extremes at some time during the event.
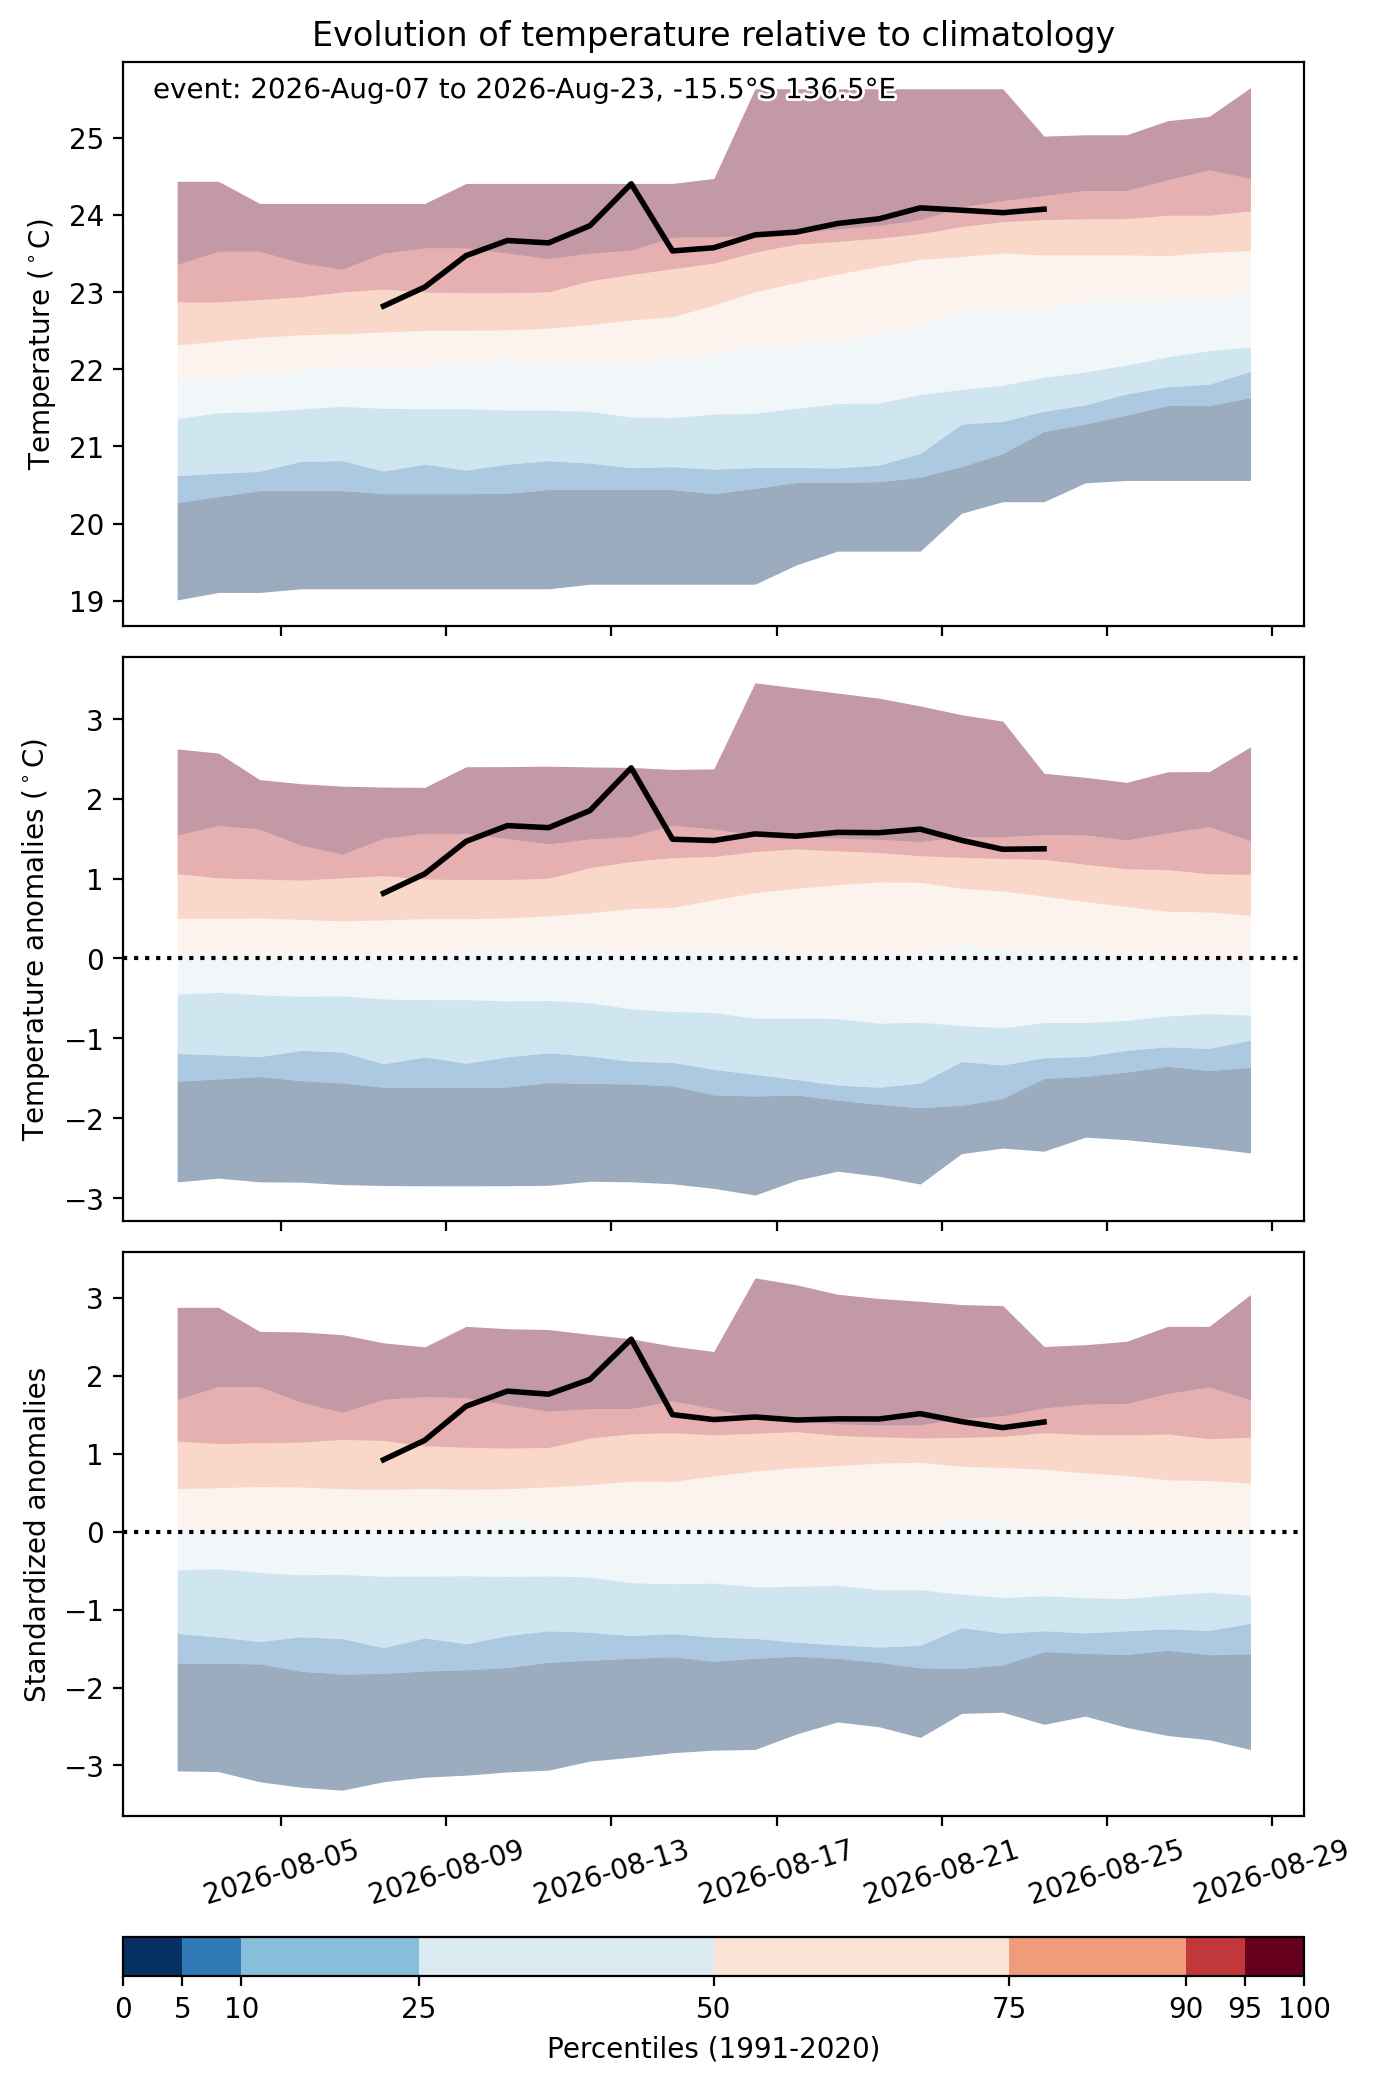


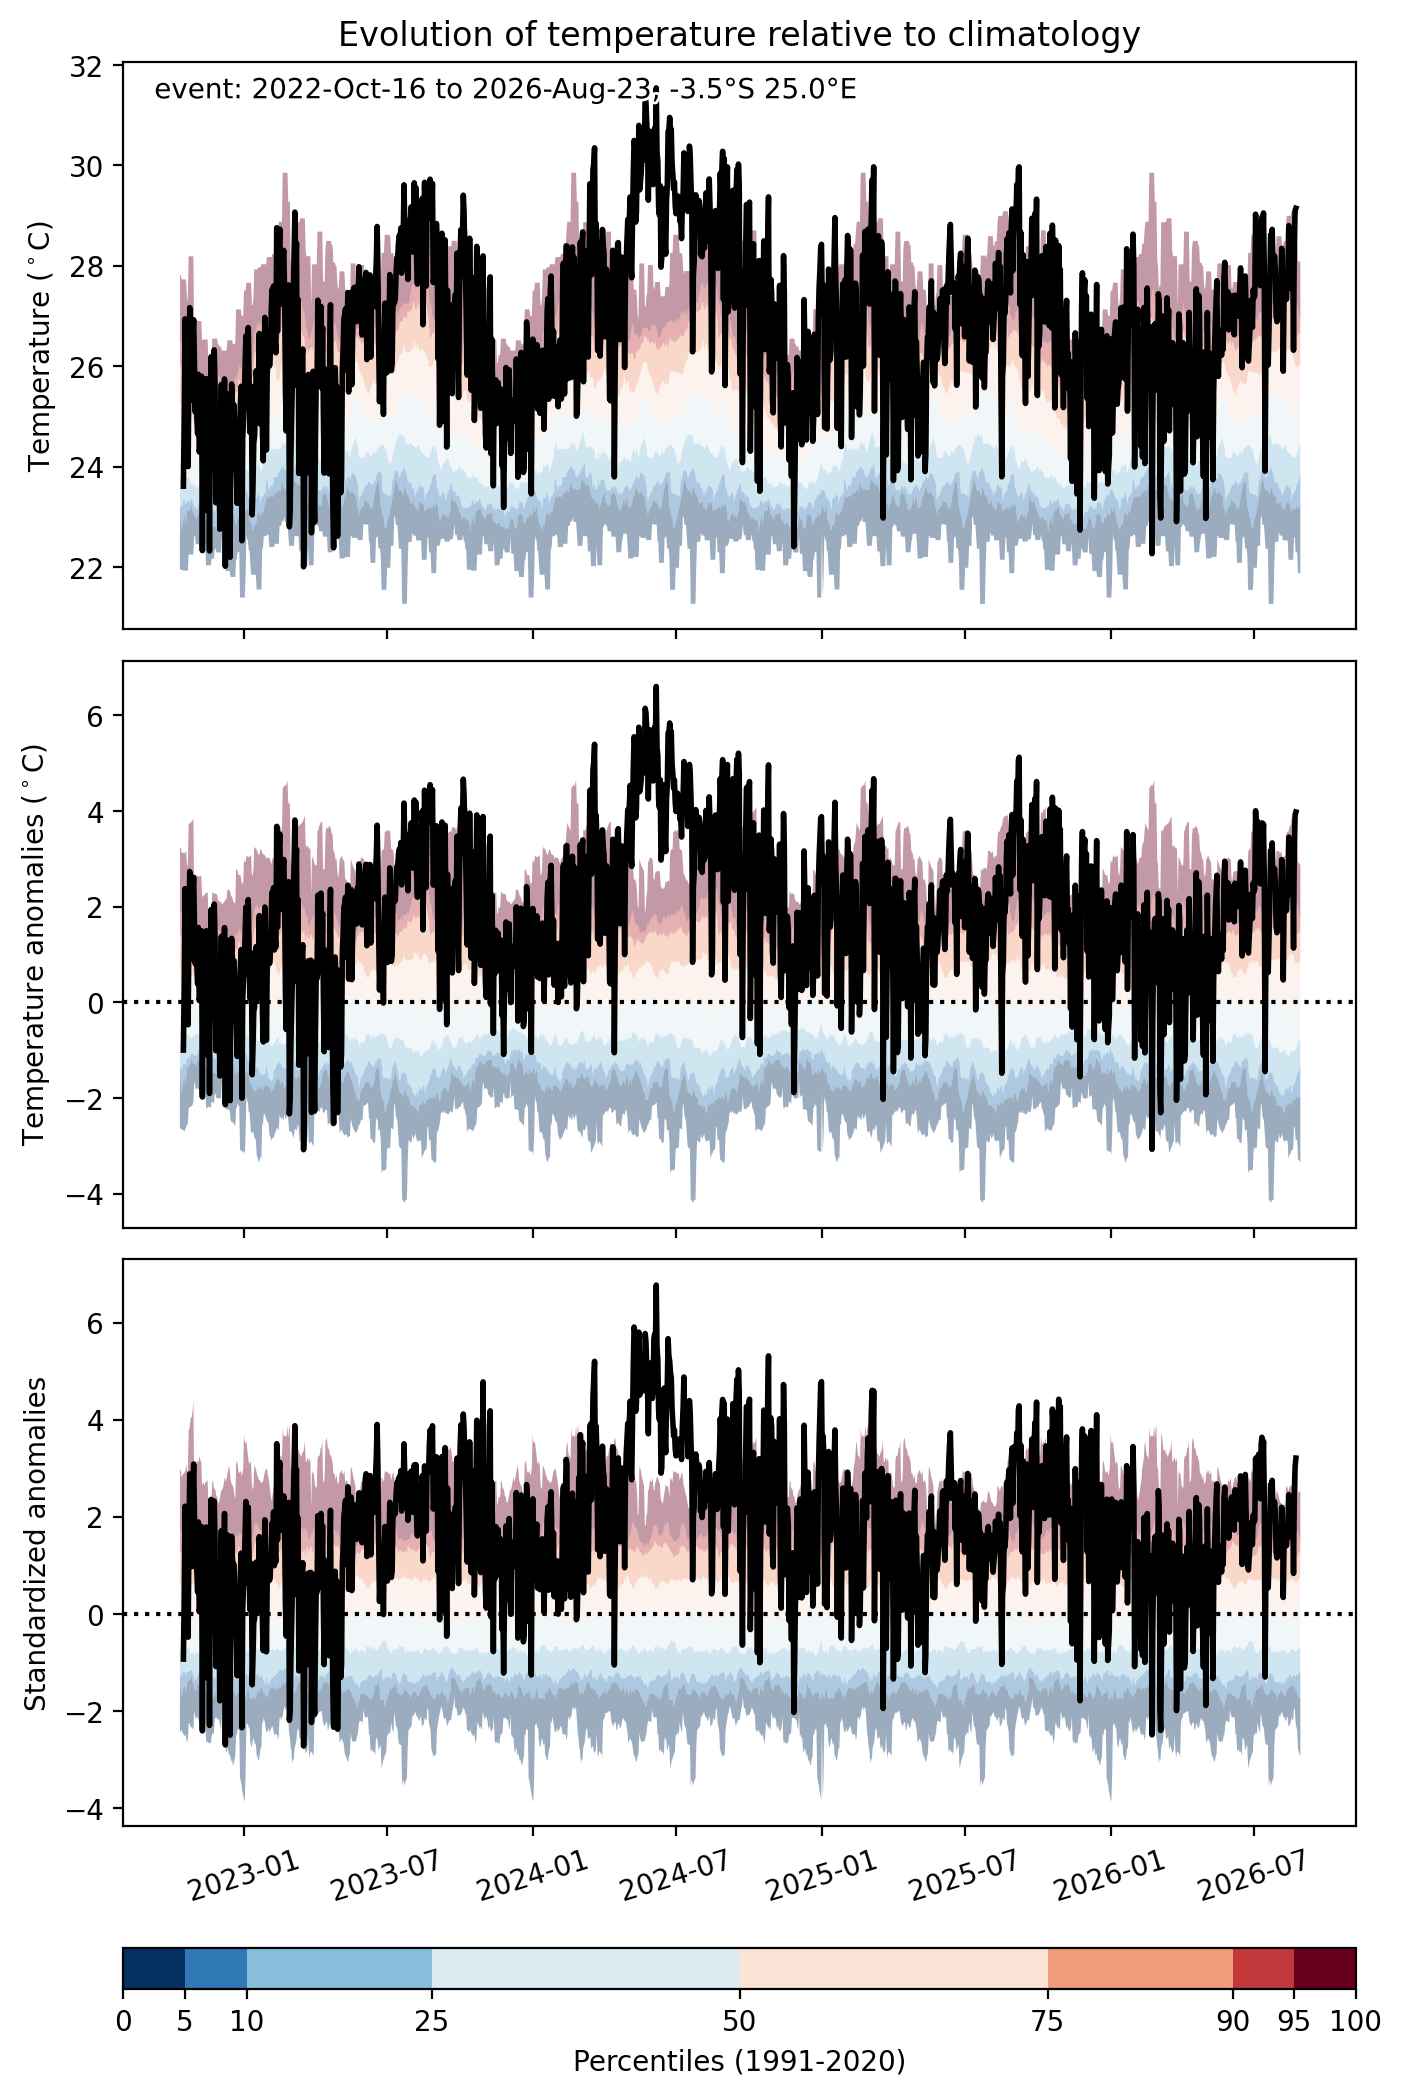
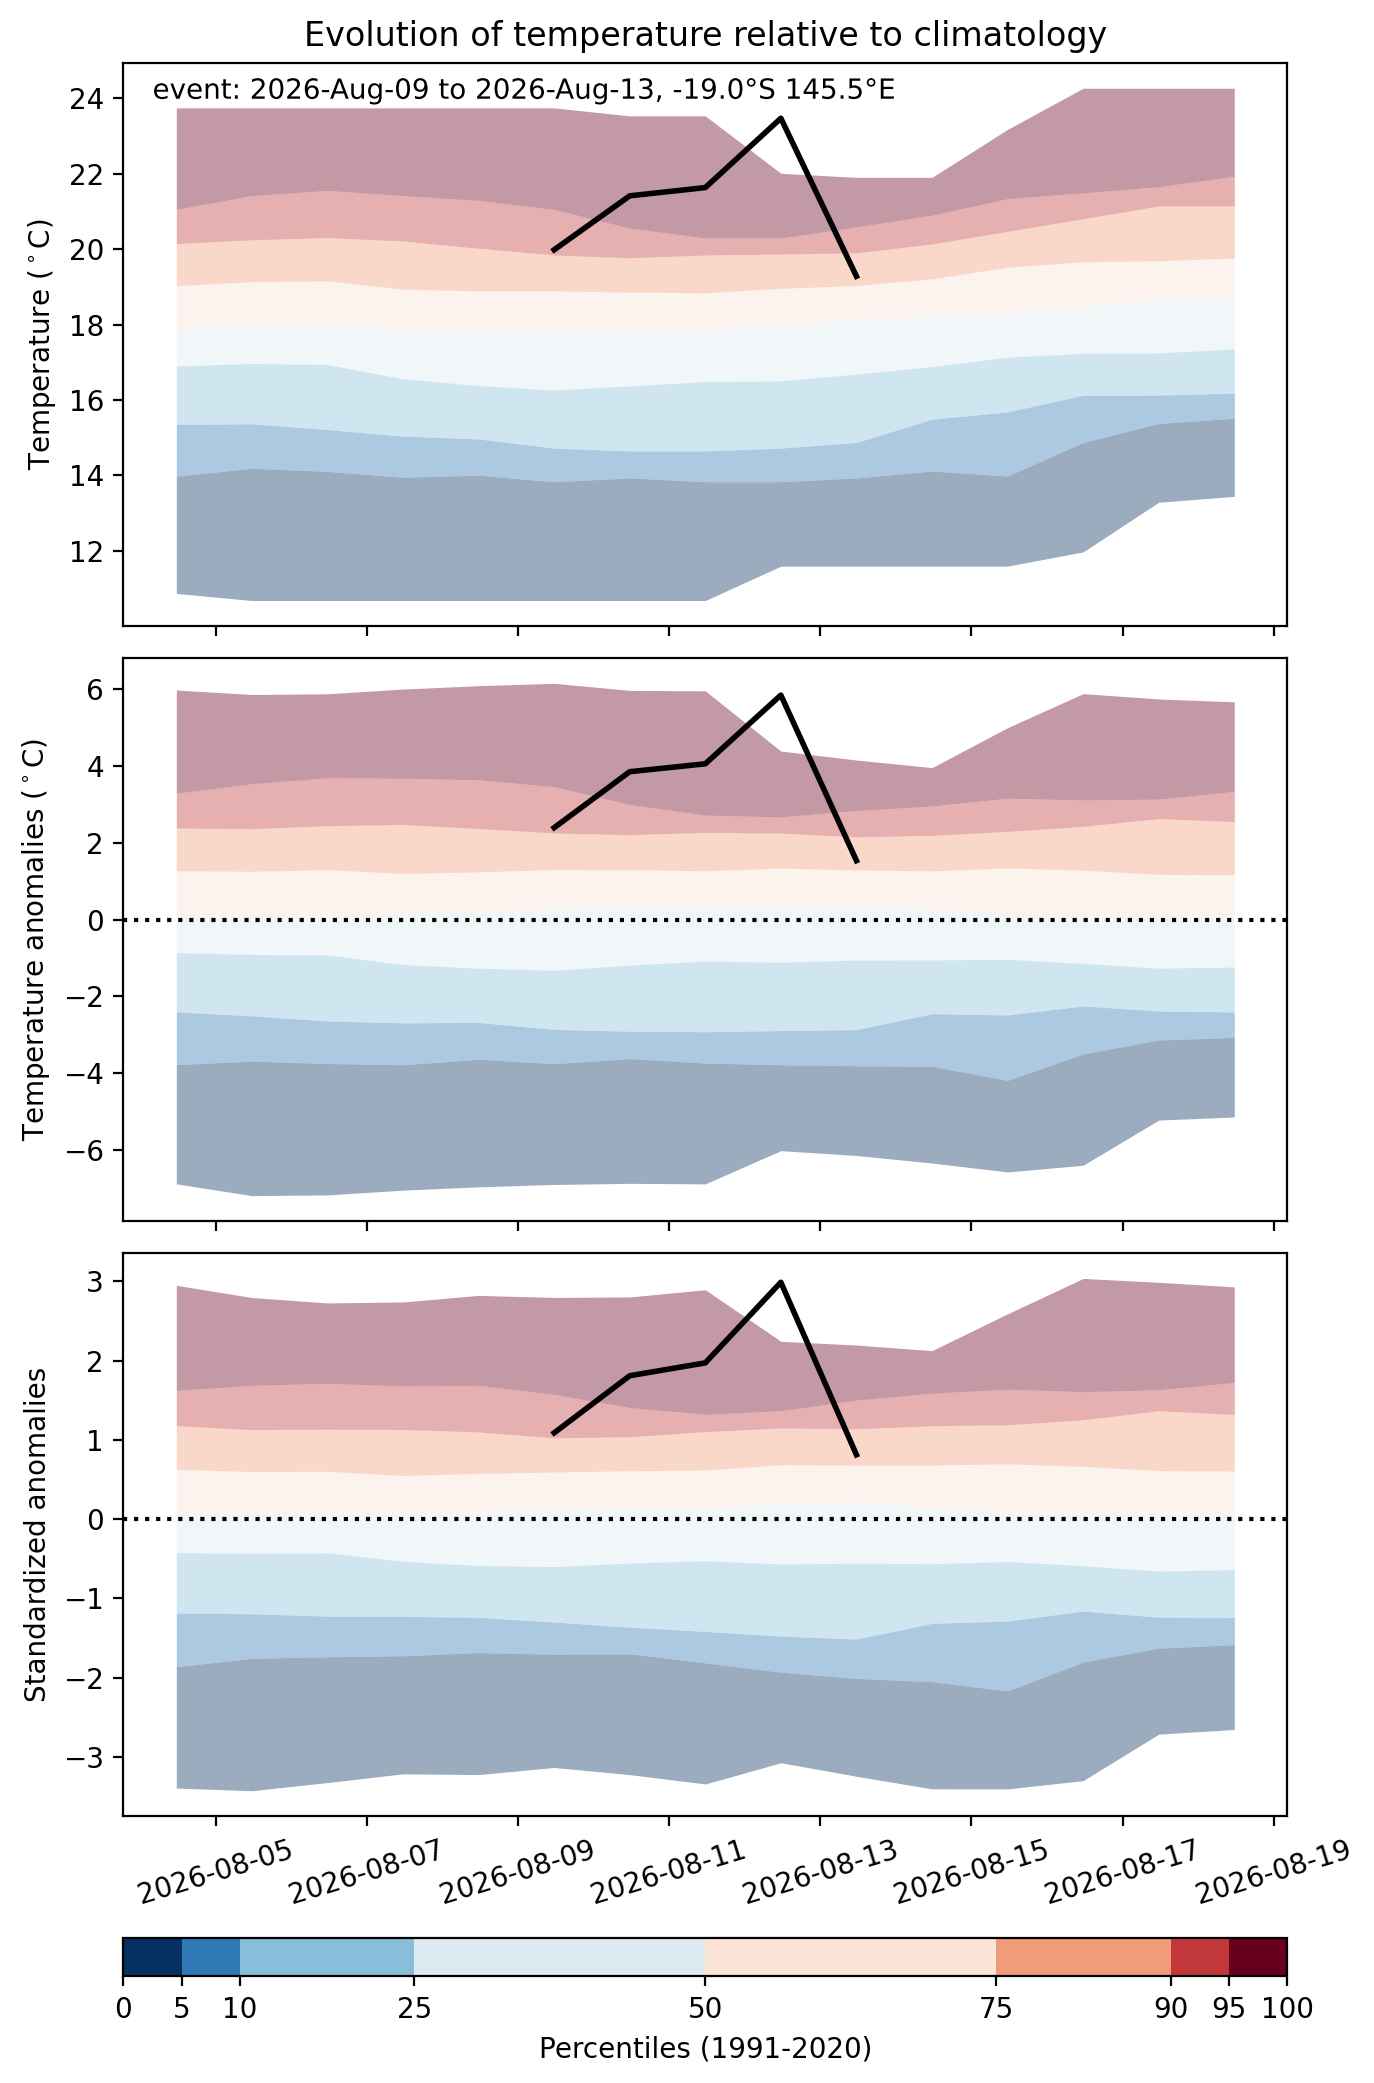
Fig. 2: Evolution of temperature at the center of the event. The climatological percentile distribution is illustrated with color shadings.
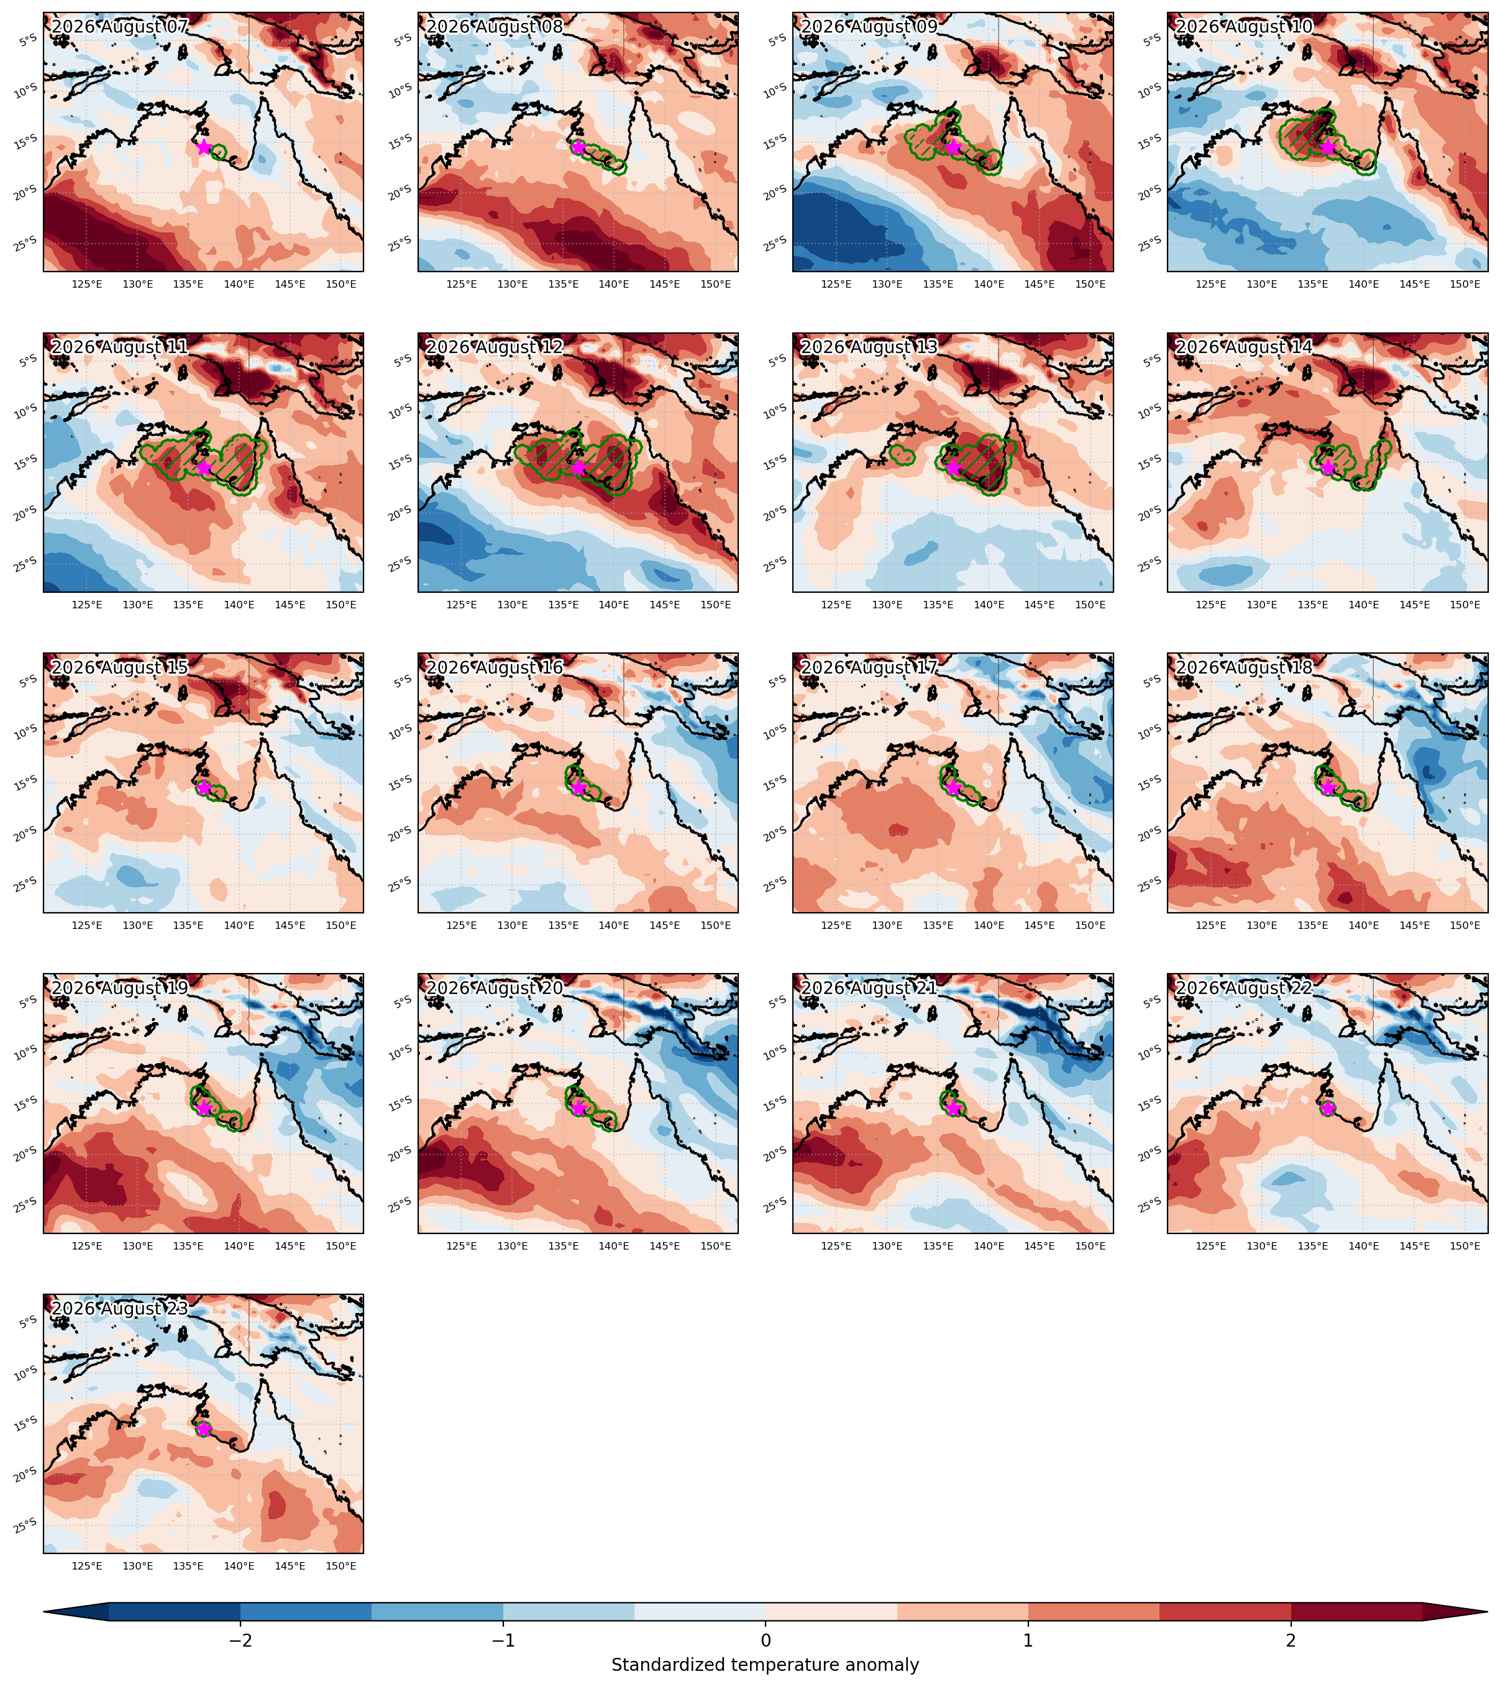


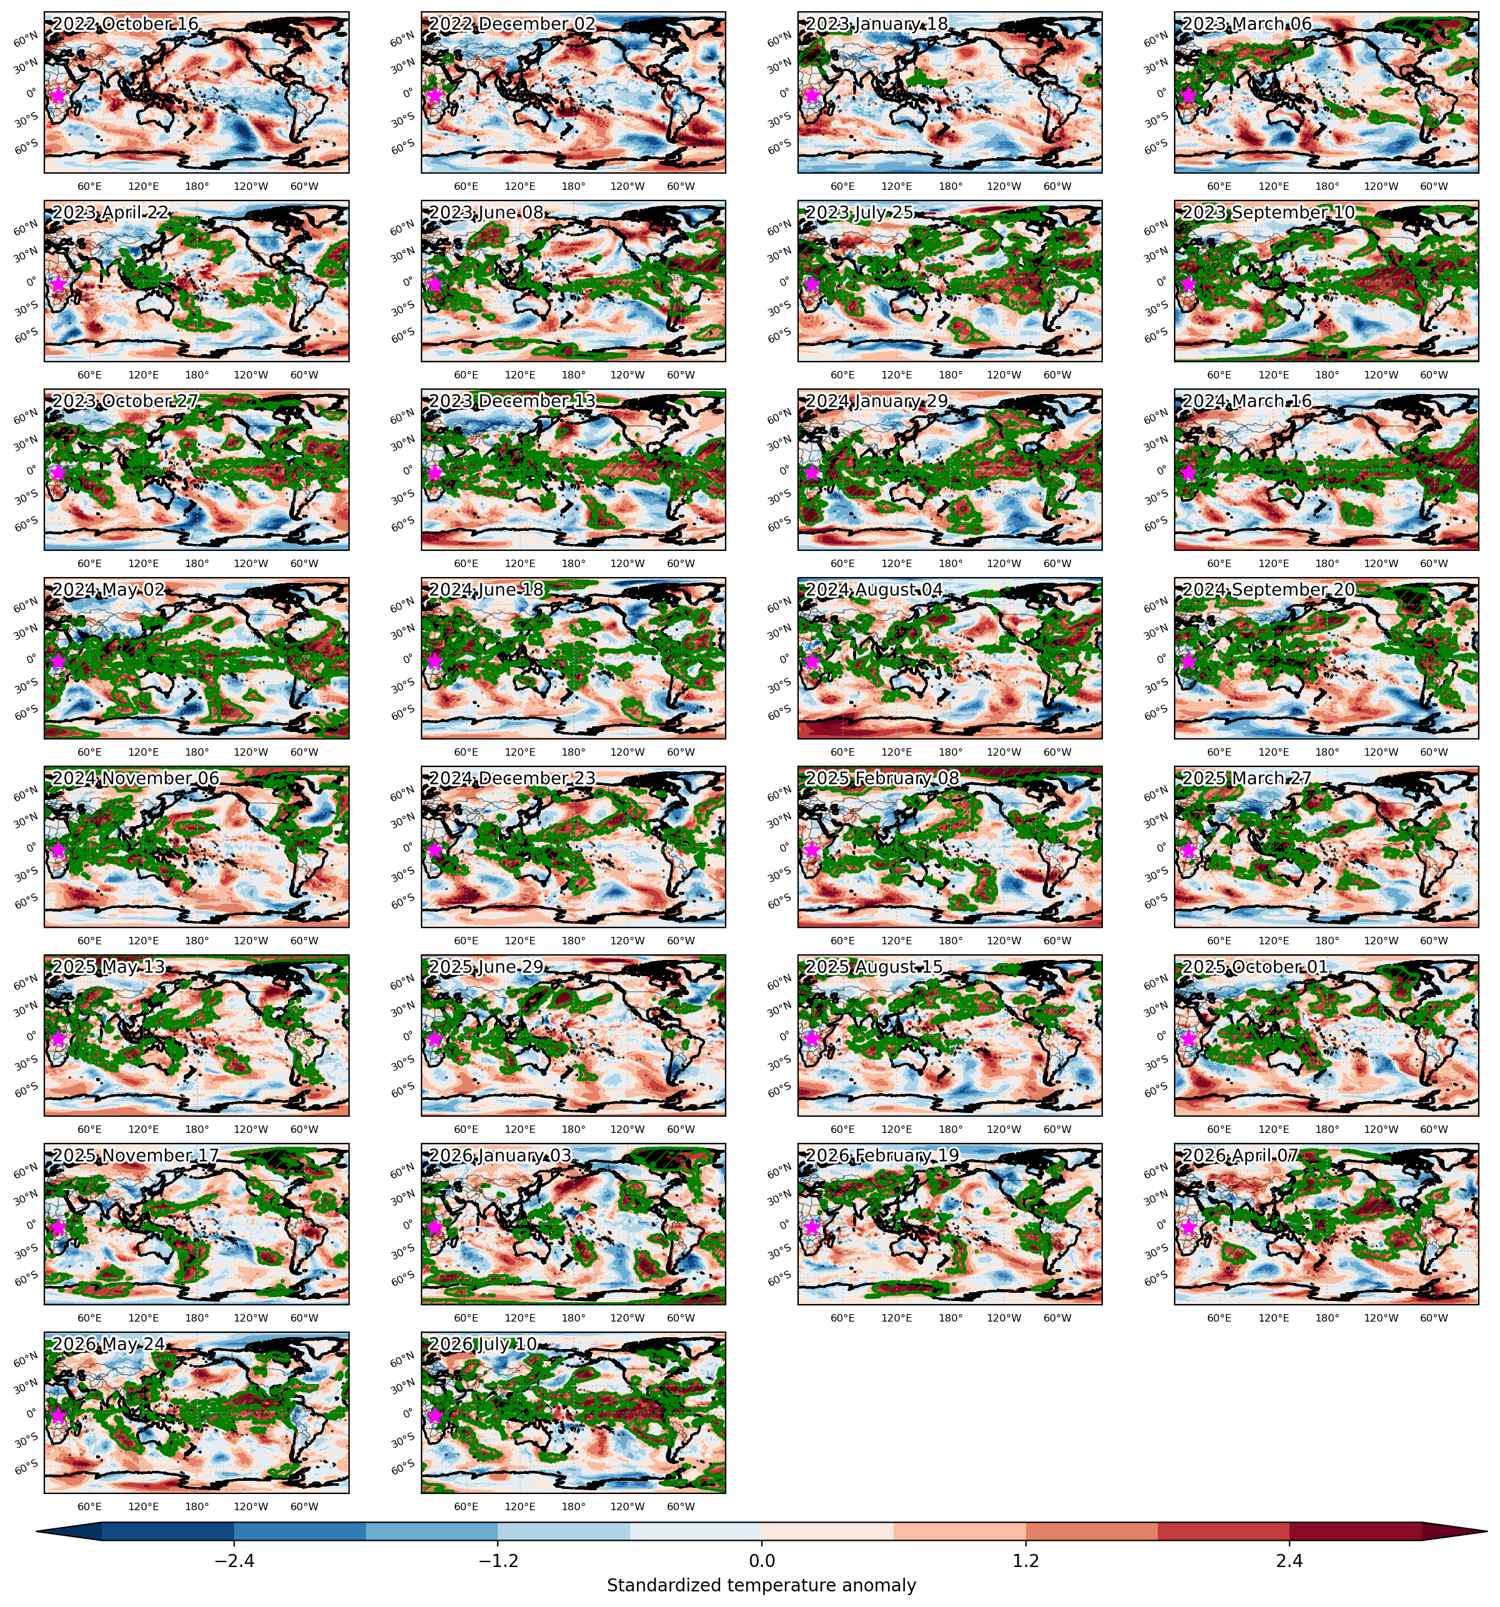
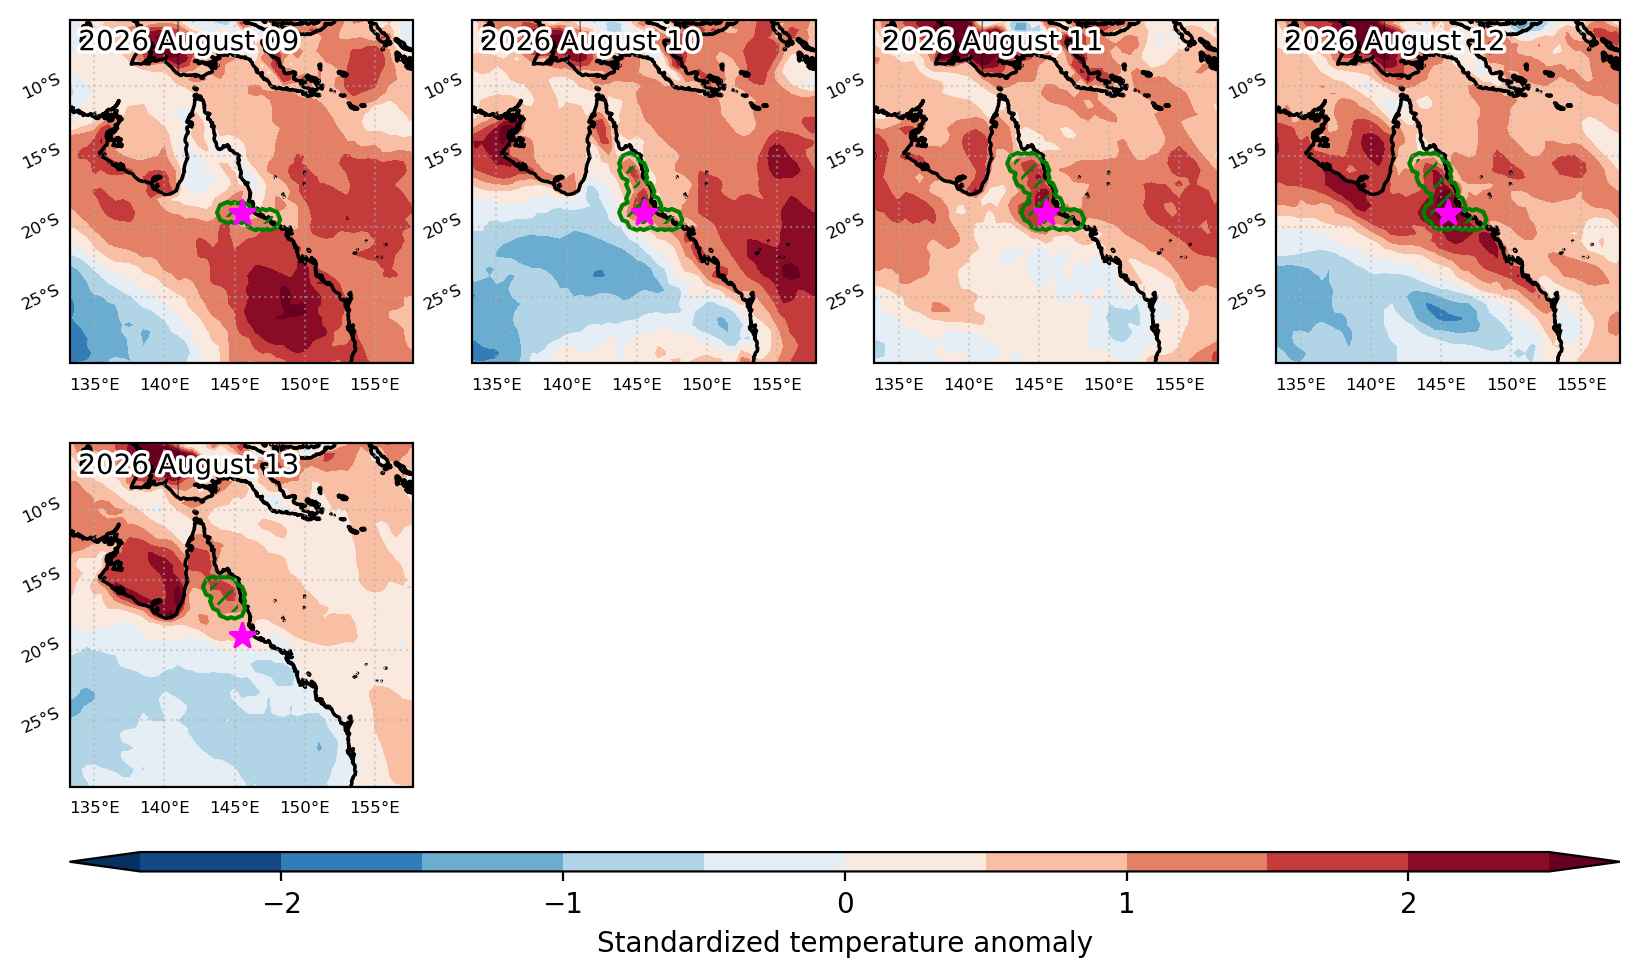
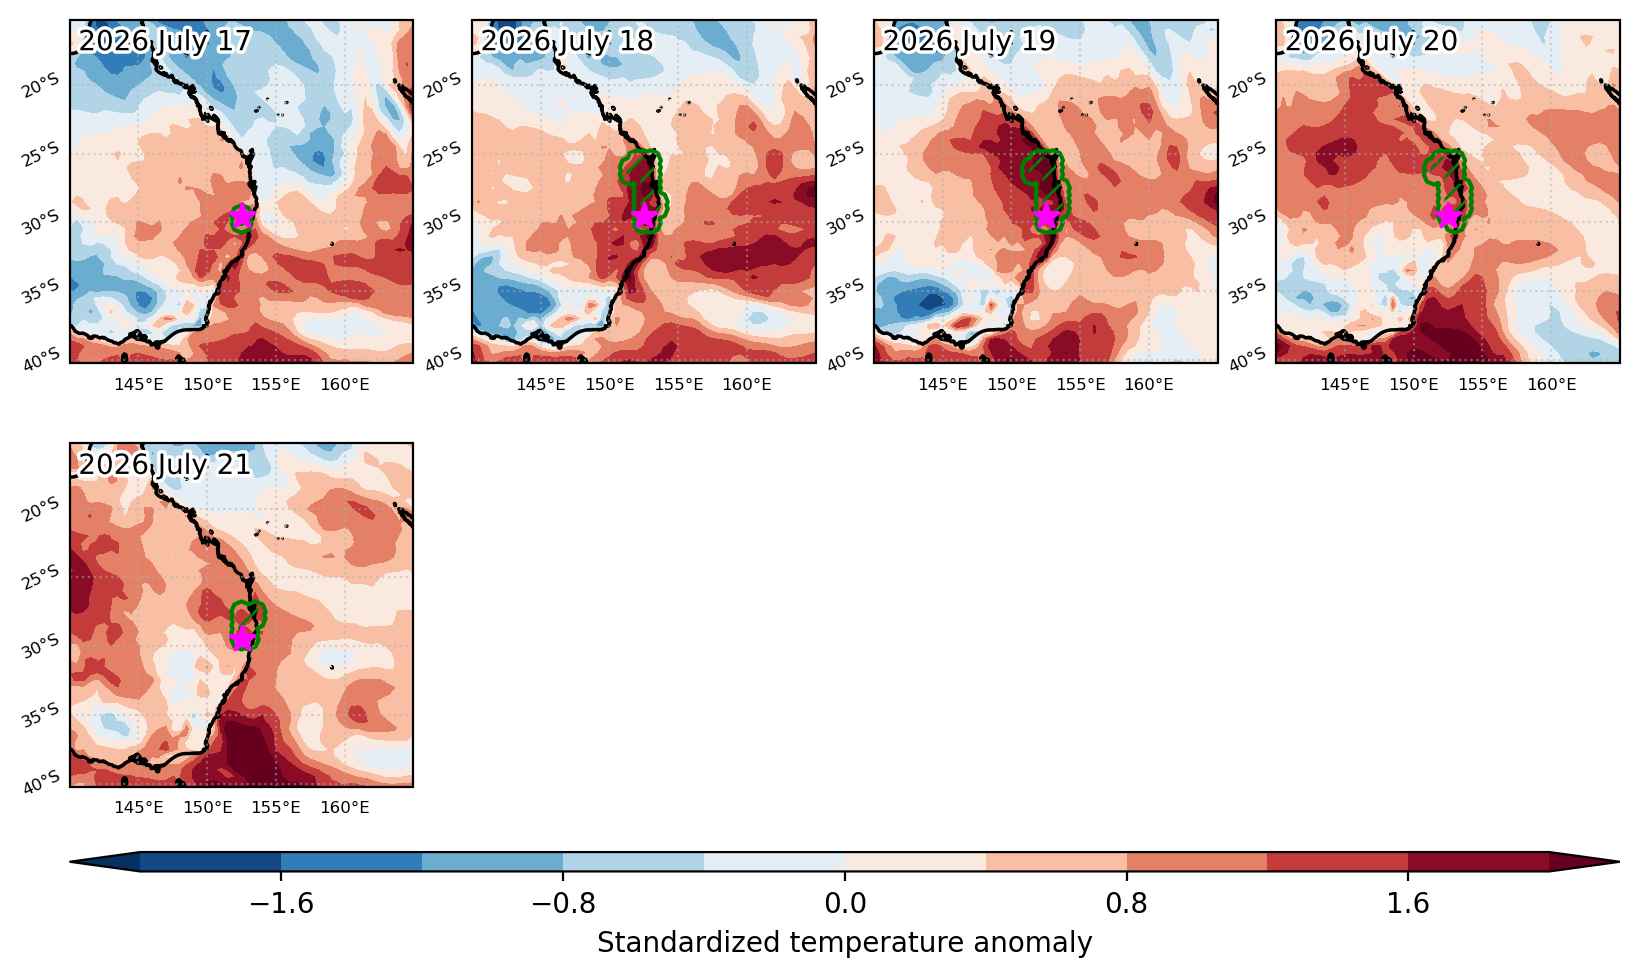
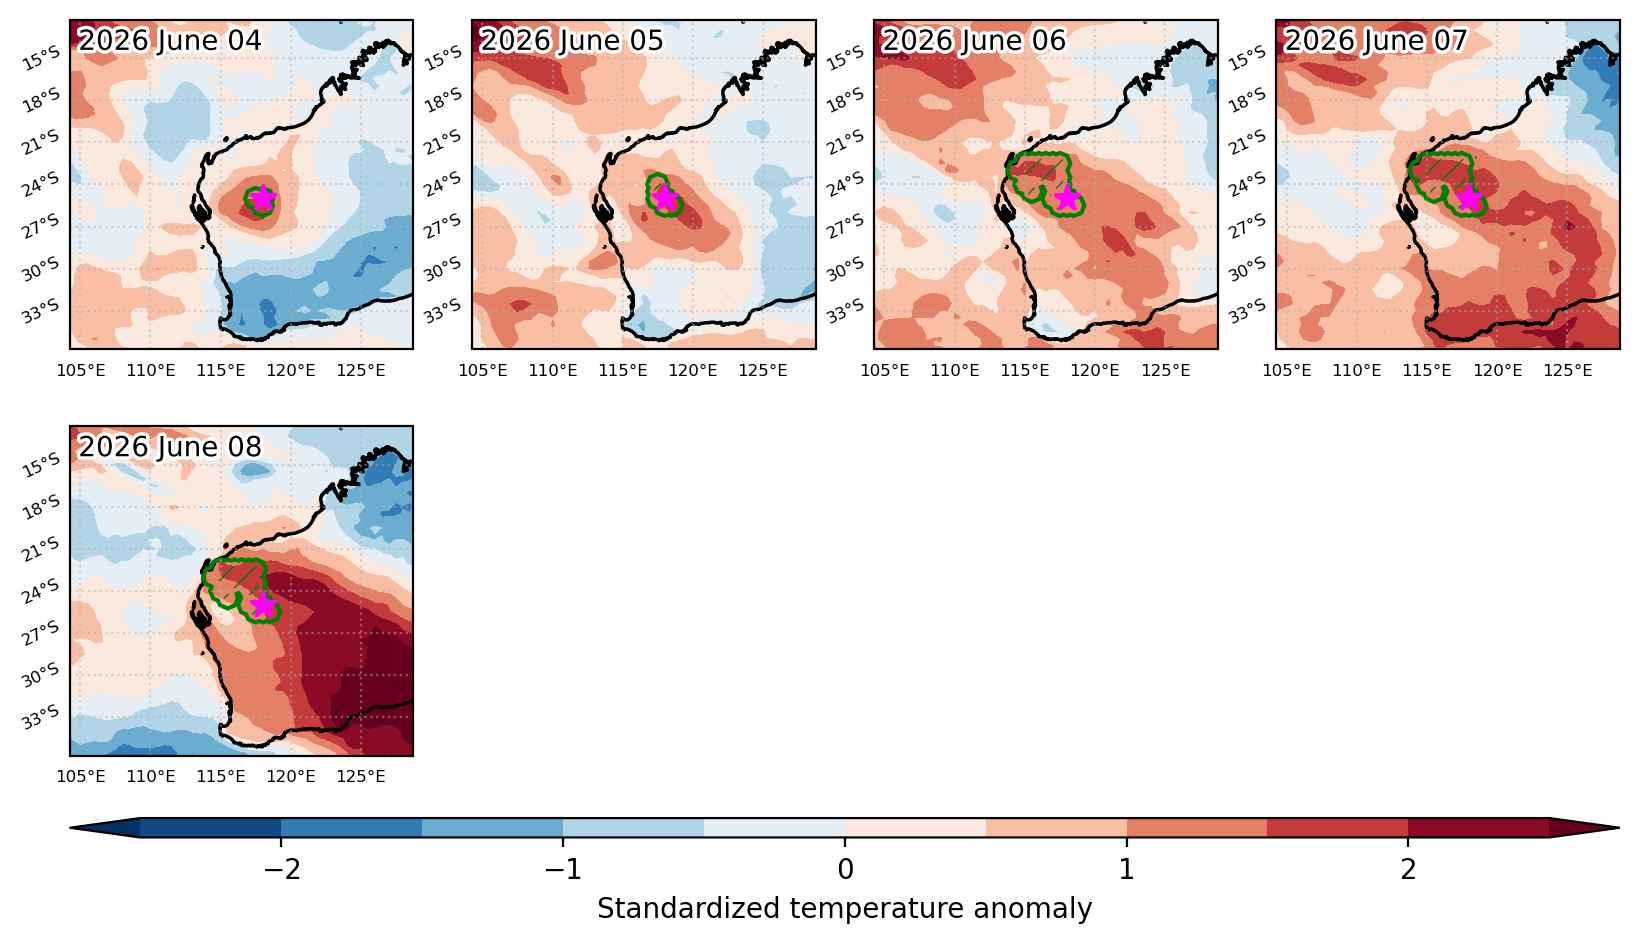
Fig. 3: Maps illustrating the evolution of standardized temperature anomalies during the event.

Event ID: Heat_wave_2026-Apr-22_to_2026-Apr-30_121.0_-26.0

Heat wave occuring from April 16 2026 to April 20 2026 at -27.0°S 127.5°E

Download data: JSON

Event type: Heat wave

Countries affected (identified with ArcGIS Online; provided only for geographical reference):

  • Australia

Duration: 5 days

Time span: April 16 2026 to April 20 2026

Statistics over entire affected area:

  • Mean temperature anomaly: 5.0 °C
  • Mean temperature: 26.7 °C
  • Maximum temperature anomaly: 6.7 °C
  • Maximum temperature: 28.5 °C

Event center: -27.0°S 127.5°E

Area affected: 85409 km$^2$


Fig. 1: Map of most extreme temperature anomalies (standardized) experienced during the event. The purple star indicates the center of the extreme event. Green hatching illustrates all areas under the effect of extremes at some time during the event.


Fig. 2: Evolution of temperature at the center of the event. The climatological percentile distribution is illustrated with color shadings.


Fig. 3: Maps illustrating the evolution of standardized temperature anomalies during the event.

Event ID: Heat_wave_2026-Apr-16_to_2026-Apr-20_127.5_-27.0

Heat wave occuring from March 31 2026 to April 11 2026 at -30.0°S 145.5°E

Download data: JSON

Event type: Heat wave

Countries affected (identified with ArcGIS Online; provided only for geographical reference):

  • Australia

Duration: 12 days

Time span: March 31 2026 to April 11 2026

Statistics over entire affected area:

  • Mean temperature anomaly: 4.0 °C
  • Mean temperature: 24.6 °C
  • Maximum temperature anomaly: 8.6 °C
  • Maximum temperature: 31.0 °C

Event center: -30.0°S 145.5°E

Area affected: 1210195 km$^2$


Fig. 1: Map of most extreme temperature anomalies (standardized) experienced during the event. The purple star indicates the center of the extreme event. Green hatching illustrates all areas under the effect of extremes at some time during the event.


Fig. 2: Evolution of temperature at the center of the event. The climatological percentile distribution is illustrated with color shadings.


Fig. 3: Maps illustrating the evolution of standardized temperature anomalies during the event.

Event ID: Heat_wave_2026-Mar-31_to_2026-Apr-11_145.5_-30.0

Heat wave occuring from March 31 2026 to April 09 2026 at -23.0°S 119.5°E

Download data: JSON

Event type: Heat wave

Countries affected (identified with ArcGIS Online; provided only for geographical reference):

  • Australia

Duration: 10 days

Time span: March 31 2026 to April 09 2026

Statistics over entire affected area:

  • Mean temperature anomaly: 5.3 °C
  • Mean temperature: 29.9 °C
  • Maximum temperature anomaly: 7.9 °C
  • Maximum temperature: 33.6 °C

Event center: -23.0°S 119.5°E

Area affected: 585304 km$^2$


Fig. 1: Map of most extreme temperature anomalies (standardized) experienced during the event. The purple star indicates the center of the extreme event. Green hatching illustrates all areas under the effect of extremes at some time during the event.


Fig. 2: Evolution of temperature at the center of the event. The climatological percentile distribution is illustrated with color shadings.


Fig. 3: Maps illustrating the evolution of standardized temperature anomalies during the event.

Event ID: Heat_wave_2026-Mar-31_to_2026-Apr-09_119.5_-23.0

Heat wave occuring from March 28 2026 to April 02 2026 at -39.5°S 135.0°E

Download data: JSON

Event type: Heat wave

Countries affected (identified with ArcGIS Online; provided only for geographical reference):

  • Australia

Duration: 6 days

Time span: March 28 2026 to April 02 2026

Statistics over entire affected area:

  • Mean temperature anomaly: 2.7 °C
  • Mean temperature: 17.7 °C
  • Maximum temperature anomaly: 6.4 °C
  • Maximum temperature: 25.4 °C

Event center: -39.5°S 135.0°E

Area affected: 1895275 km$^2$


Fig. 1: Map of most extreme temperature anomalies (standardized) experienced during the event. The purple star indicates the center of the extreme event. Green hatching illustrates all areas under the effect of extremes at some time during the event.


Fig. 2: Evolution of temperature at the center of the event. The climatological percentile distribution is illustrated with color shadings.


Fig. 3: Maps illustrating the evolution of standardized temperature anomalies during the event.

Event ID: Heat_wave_2026-Mar-28_to_2026-Apr-02_135.0_-39.5

Heat wave occuring from March 21 2026 to March 26 2026 at -42.5°S 149.0°E

Download data: JSON

Event type: Heat wave

Countries affected (identified with ArcGIS Online; provided only for geographical reference):

  • Australia

Duration: 6 days

Time span: March 21 2026 to March 26 2026

Statistics over entire affected area:

  • Mean temperature anomaly: 2.8 °C
  • Mean temperature: 19.9 °C
  • Maximum temperature anomaly: 4.5 °C
  • Maximum temperature: 23.7 °C

Event center: -42.5°S 149.0°E

Area affected: 421125 km$^2$


Fig. 1: Map of most extreme temperature anomalies (standardized) experienced during the event. The purple star indicates the center of the extreme event. Green hatching illustrates all areas under the effect of extremes at some time during the event.


Fig. 2: Evolution of temperature at the center of the event. The climatological percentile distribution is illustrated with color shadings.


Fig. 3: Maps illustrating the evolution of standardized temperature anomalies during the event.

Event ID: Heat_wave_2026-Mar-21_to_2026-Mar-26_149.0_-42.5

Heat wave occuring from March 15 2026 to March 26 2026 at -25.5°S 116.5°E

Download data: JSON

Event type: Heat wave

Countries affected (identified with ArcGIS Online; provided only for geographical reference):

  • Australia

Duration: 12 days

Time span: March 15 2026 to March 26 2026

Statistics over entire affected area:

  • Mean temperature anomaly: 4.0 °C
  • Mean temperature: 24.4 °C
  • Maximum temperature anomaly: 8.7 °C
  • Maximum temperature: 36.9 °C

Event center: -25.5°S 116.5°E

Area affected: 1418647 km$^2$


Fig. 1: Map of most extreme temperature anomalies (standardized) experienced during the event. The purple star indicates the center of the extreme event. Green hatching illustrates all areas under the effect of extremes at some time during the event.


Fig. 2: Evolution of temperature at the center of the event. The climatological percentile distribution is illustrated with color shadings.


Fig. 3: Maps illustrating the evolution of standardized temperature anomalies during the event.

Event ID: Heat_wave_2026-Mar-15_to_2026-Mar-26_116.5_-25.5