Heat wave occuring from February 24 2019 to February 28 2019 at 50.5°N 6.0°E

Download data: JSON

Event type: Heat wave

Countries affected (identified with ArcGIS Online; provided only for geographical reference):

  • Belgium
  • France
  • Germany
  • Luxembourg

Duration: 5 days

Time span: February 24 2019 to February 28 2019

Statistics over entire affected area:

  • Mean temperature anomaly: 6.0 °C
  • Mean temperature: 9.6 °C
  • Maximum temperature anomaly: 8.9 °C
  • Maximum temperature: 11.8 °C

Event center: 50.5°N 6.0°E

Area affected: 93828 km$^2$
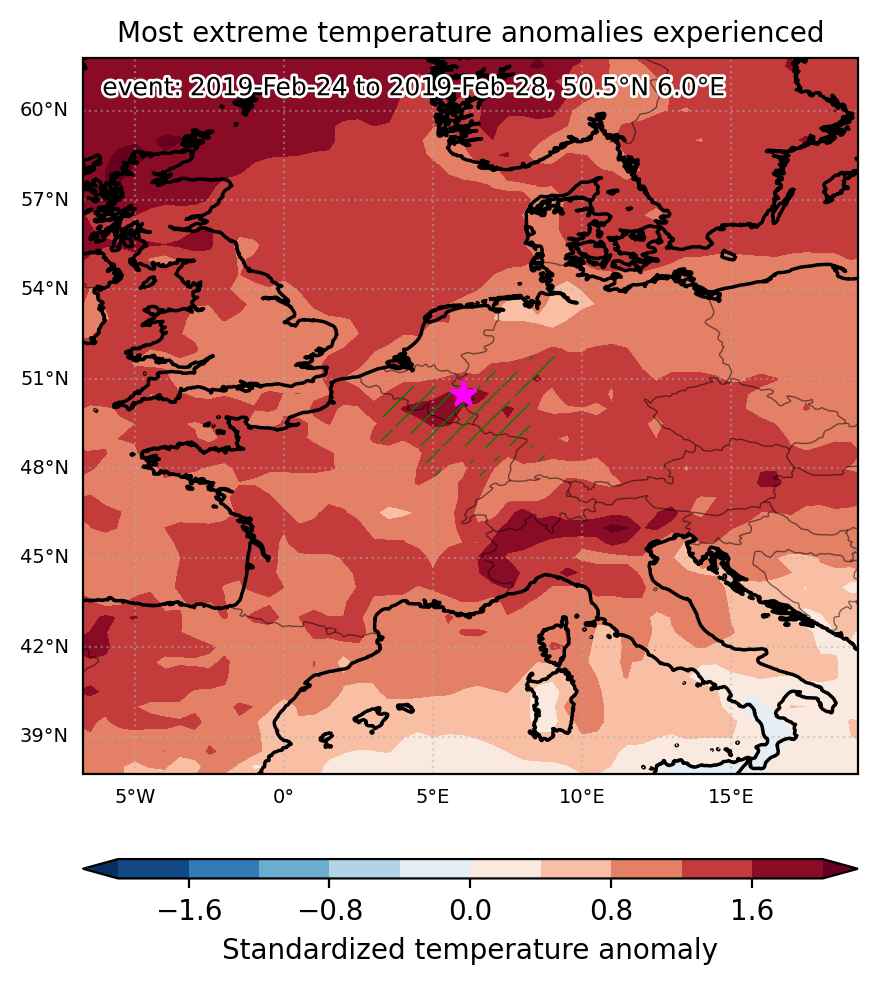

Fig. 1: Map of most extreme temperature anomalies (standardized) experienced during the event. The purple star indicates the center of the extreme event. Green hatching illustrates all areas under the effect of extremes at some time during the event.
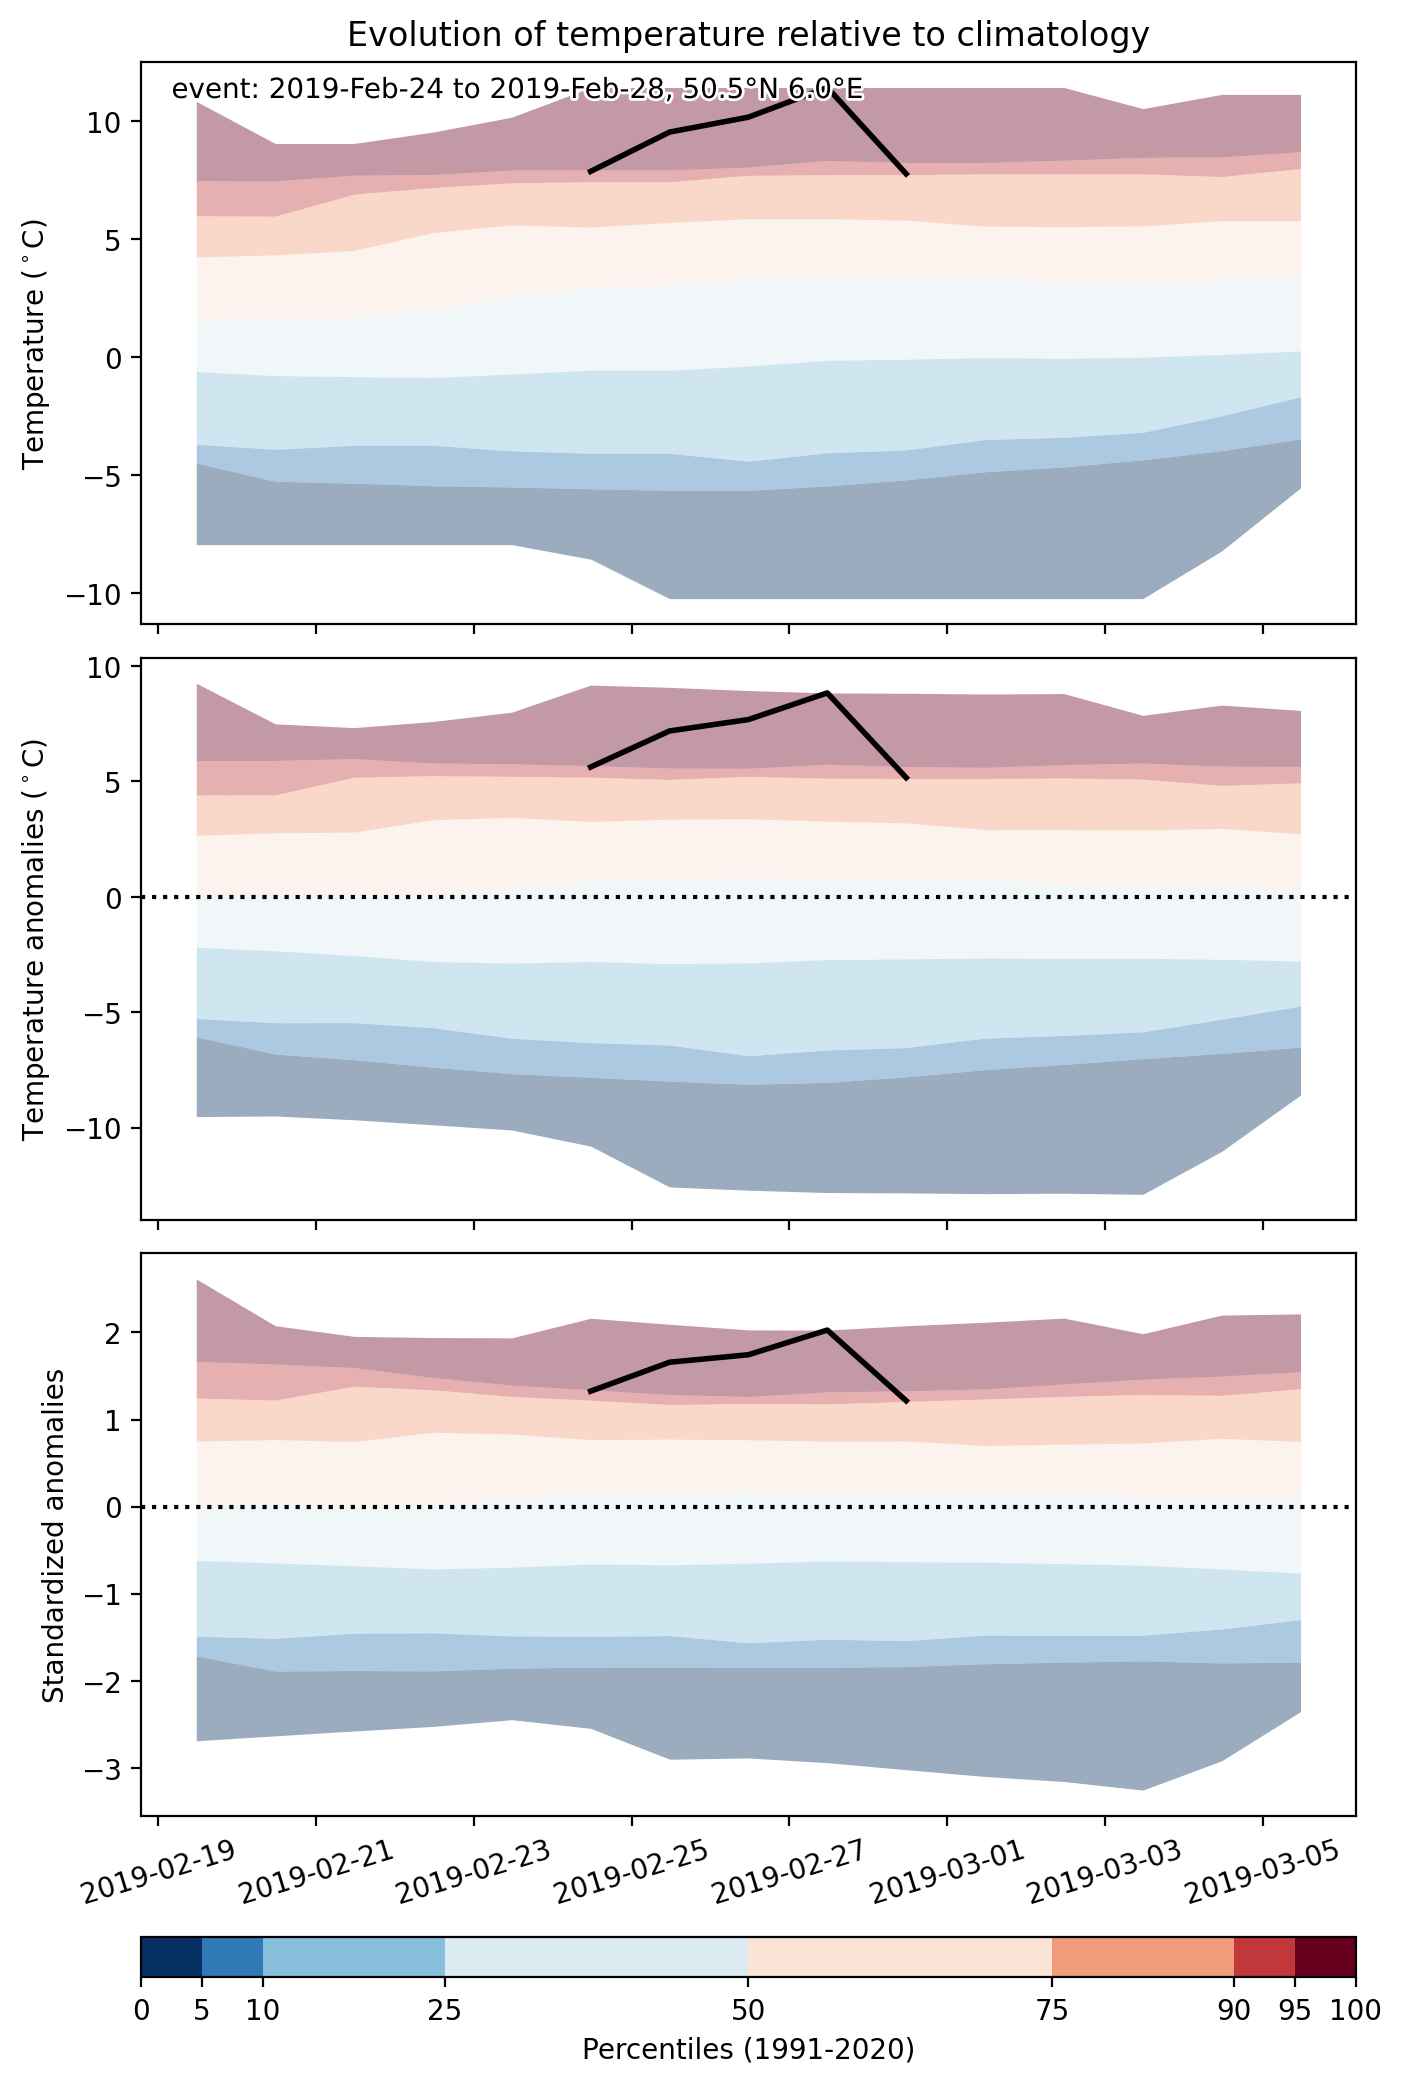


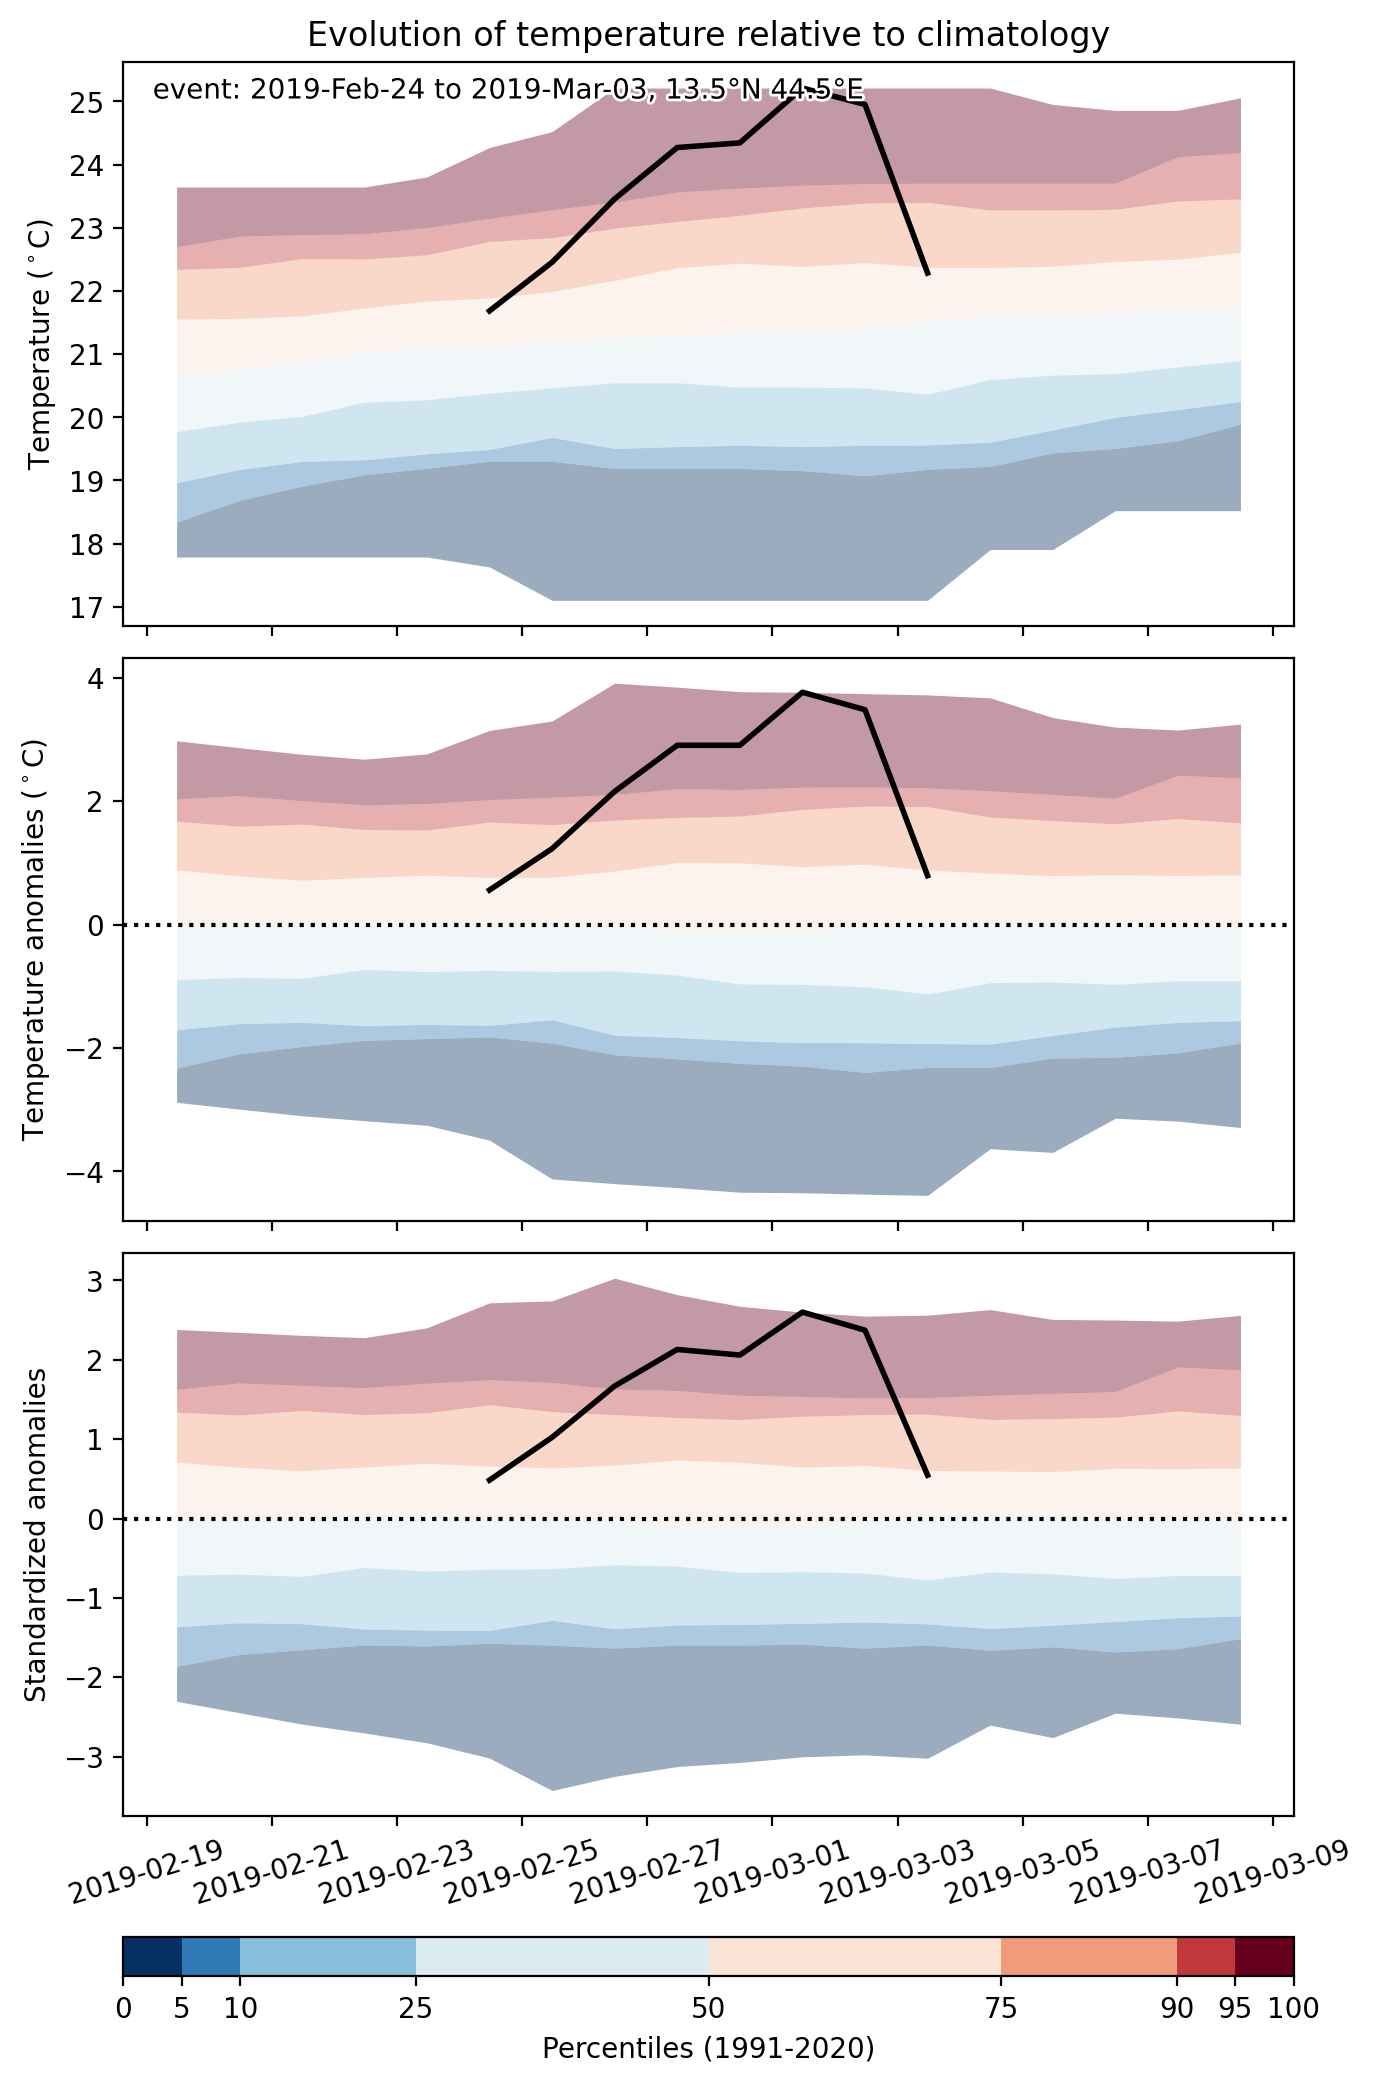
Fig. 2: Evolution of temperature at the center of the event. The climatological percentile distribution is illustrated with color shadings.
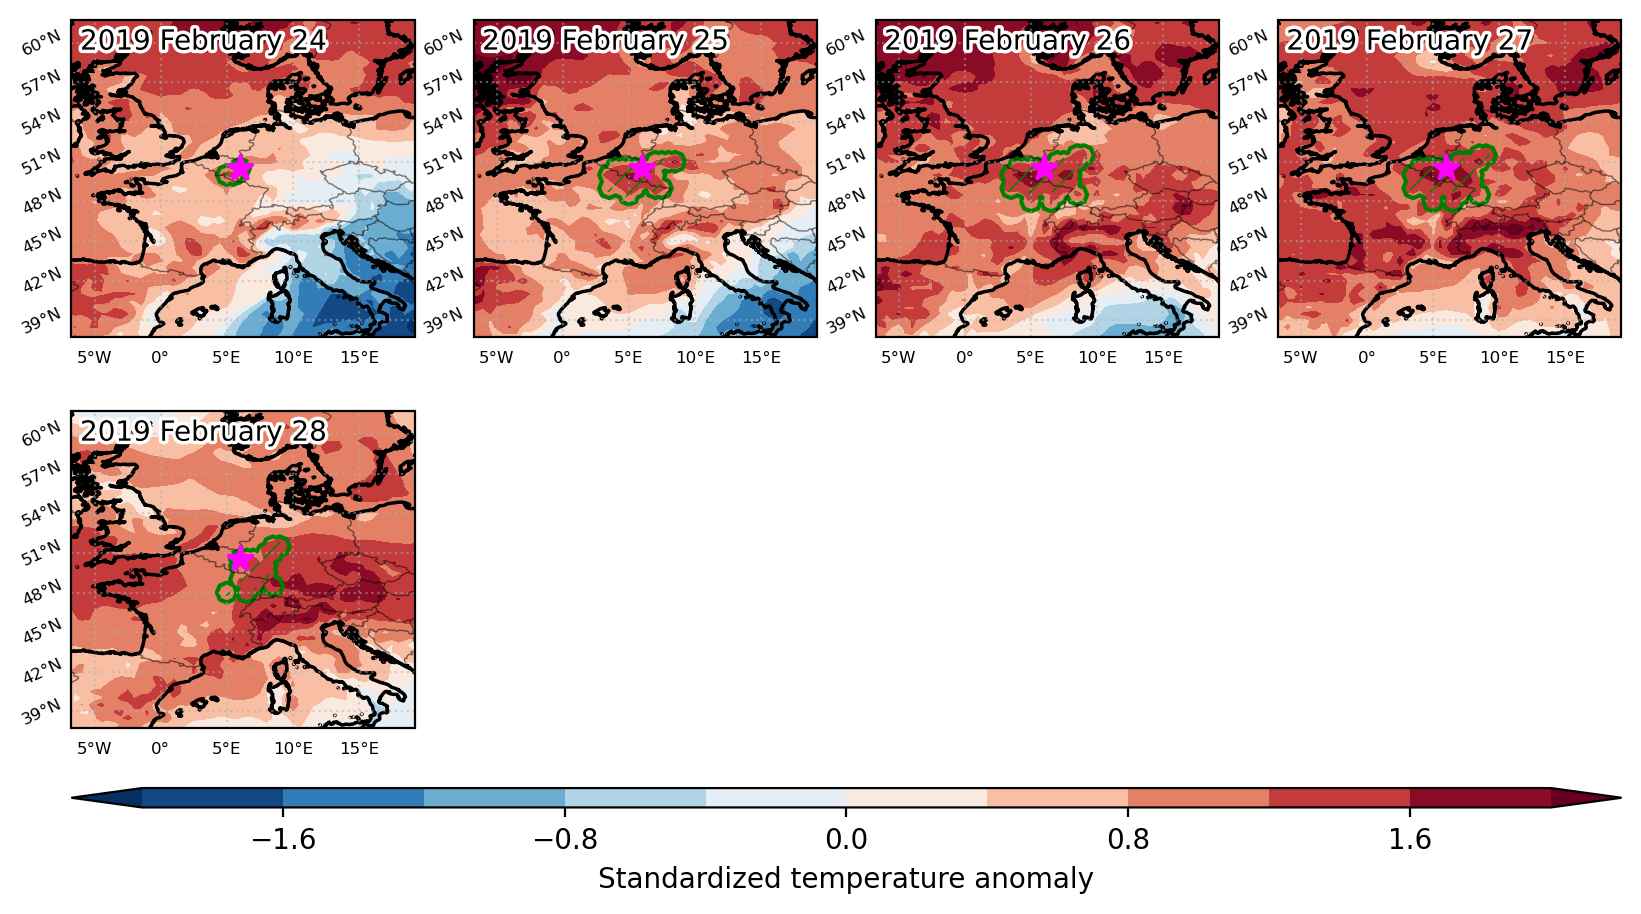


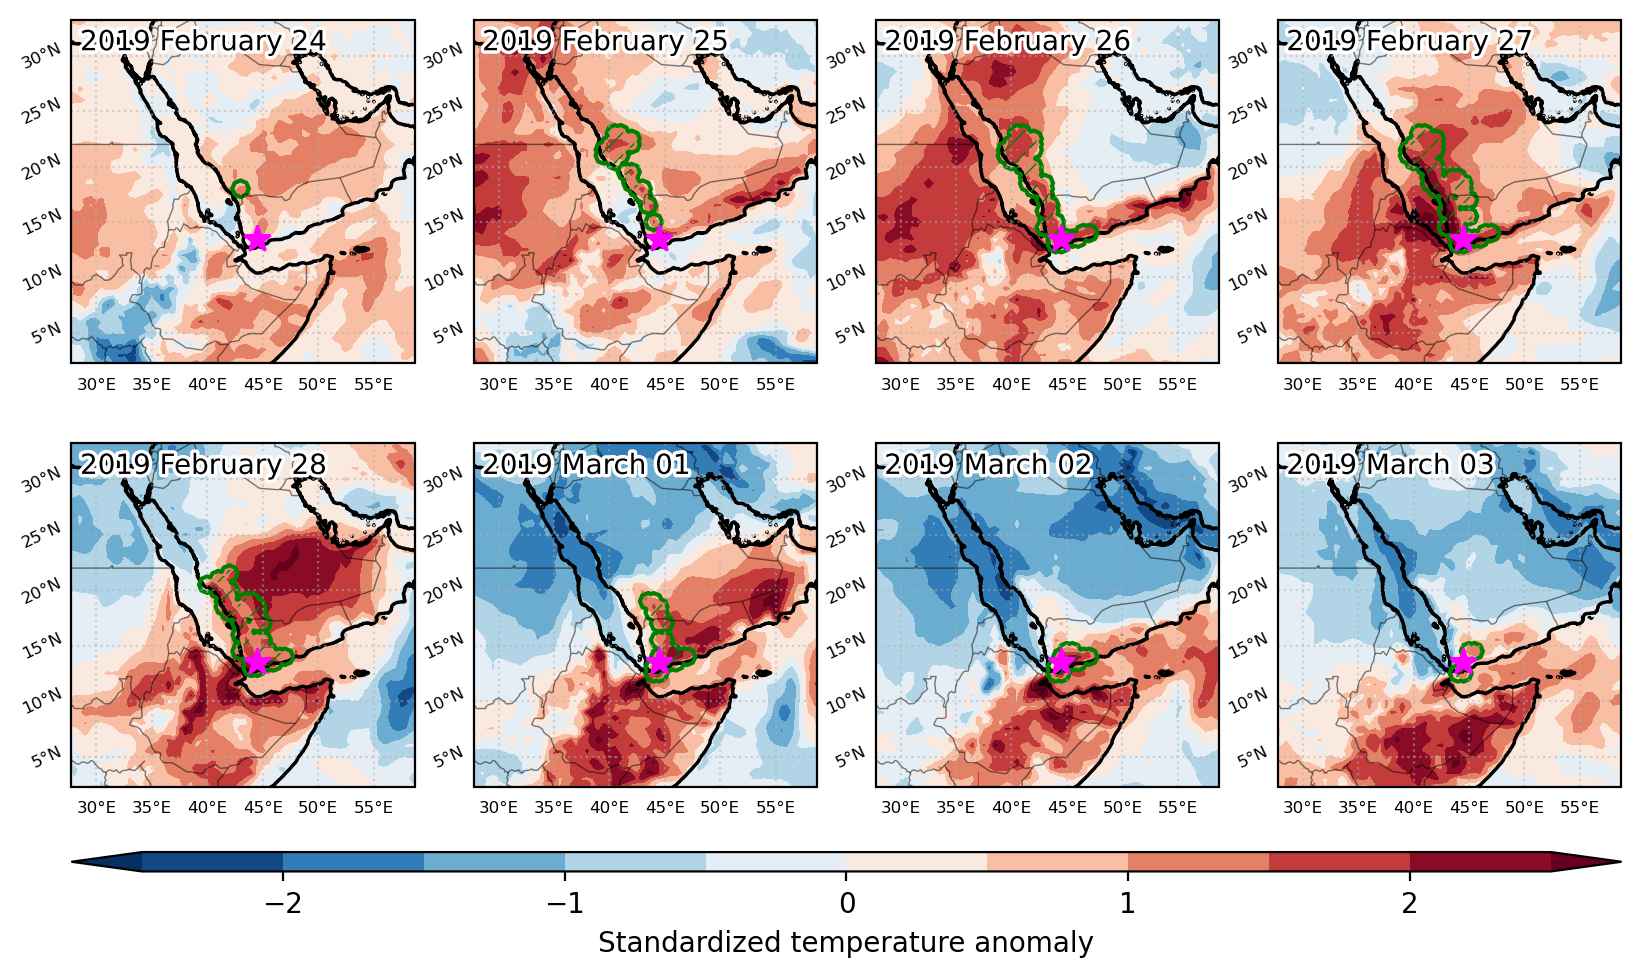
Fig. 3: Maps illustrating the evolution of standardized temperature anomalies during the event.

Event ID: Heat_wave_2019-Feb-24_to_2019-Feb-28_6.0_50.5
Heat wave occuring from February 24 2019 to March 03 2019 at 13.5°N 44.5°E

Download data: JSON

Event type: Heat wave

Countries affected (identified with ArcGIS Online; provided only for geographical reference):

  • Saudi Arabia
  • Yemen

Duration: 8 days

Time span: February 24 2019 to March 03 2019

Statistics over entire affected area:

  • Mean temperature anomaly: 3.1 °C
  • Mean temperature: 25.3 °C
  • Maximum temperature anomaly: 7.0 °C
  • Maximum temperature: 30.1 °C

Event center: 13.5°N 44.5°E

Area affected: 217369 km$^2$


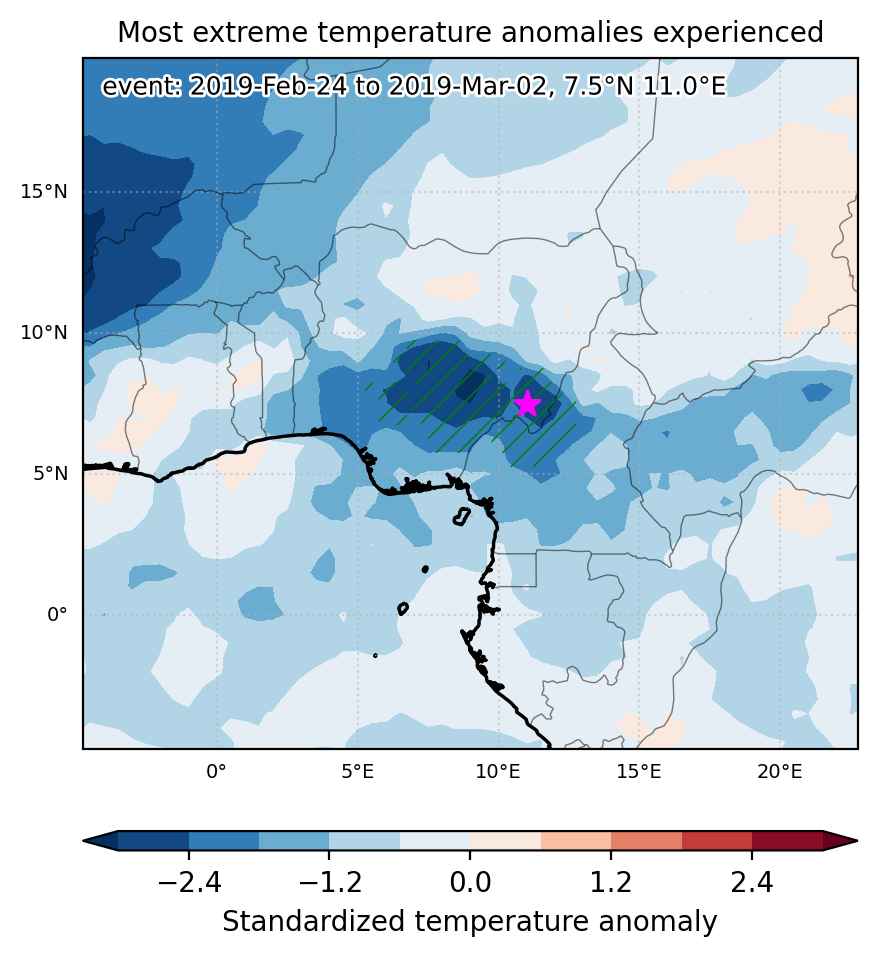
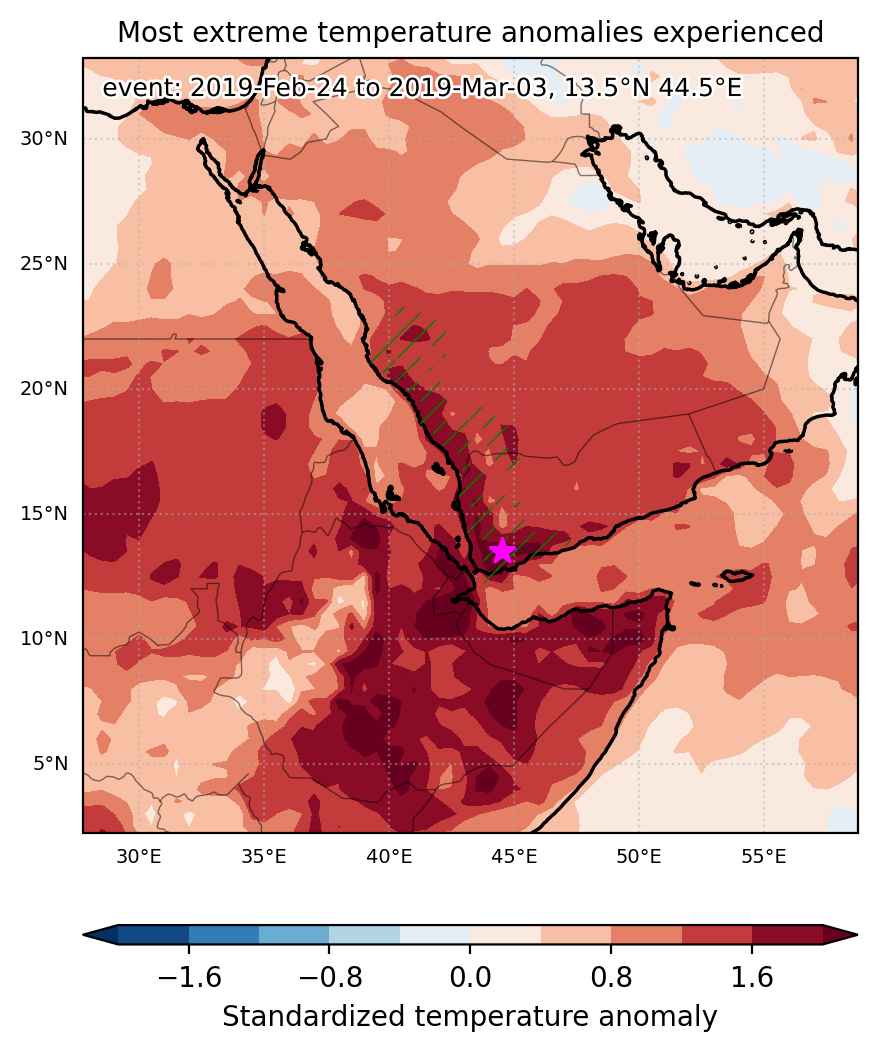
Fig. 1: Map of most extreme temperature anomalies (standardized) experienced during the event. The purple star indicates the center of the extreme event. Green hatching illustrates all areas under the effect of extremes at some time during the event.


Fig. 2: Evolution of temperature at the center of the event. The climatological percentile distribution is illustrated with color shadings.


Fig. 3: Maps illustrating the evolution of standardized temperature anomalies during the event.

Event ID: Heat_wave_2019-Feb-24_to_2019-Mar-03_44.5_13.5

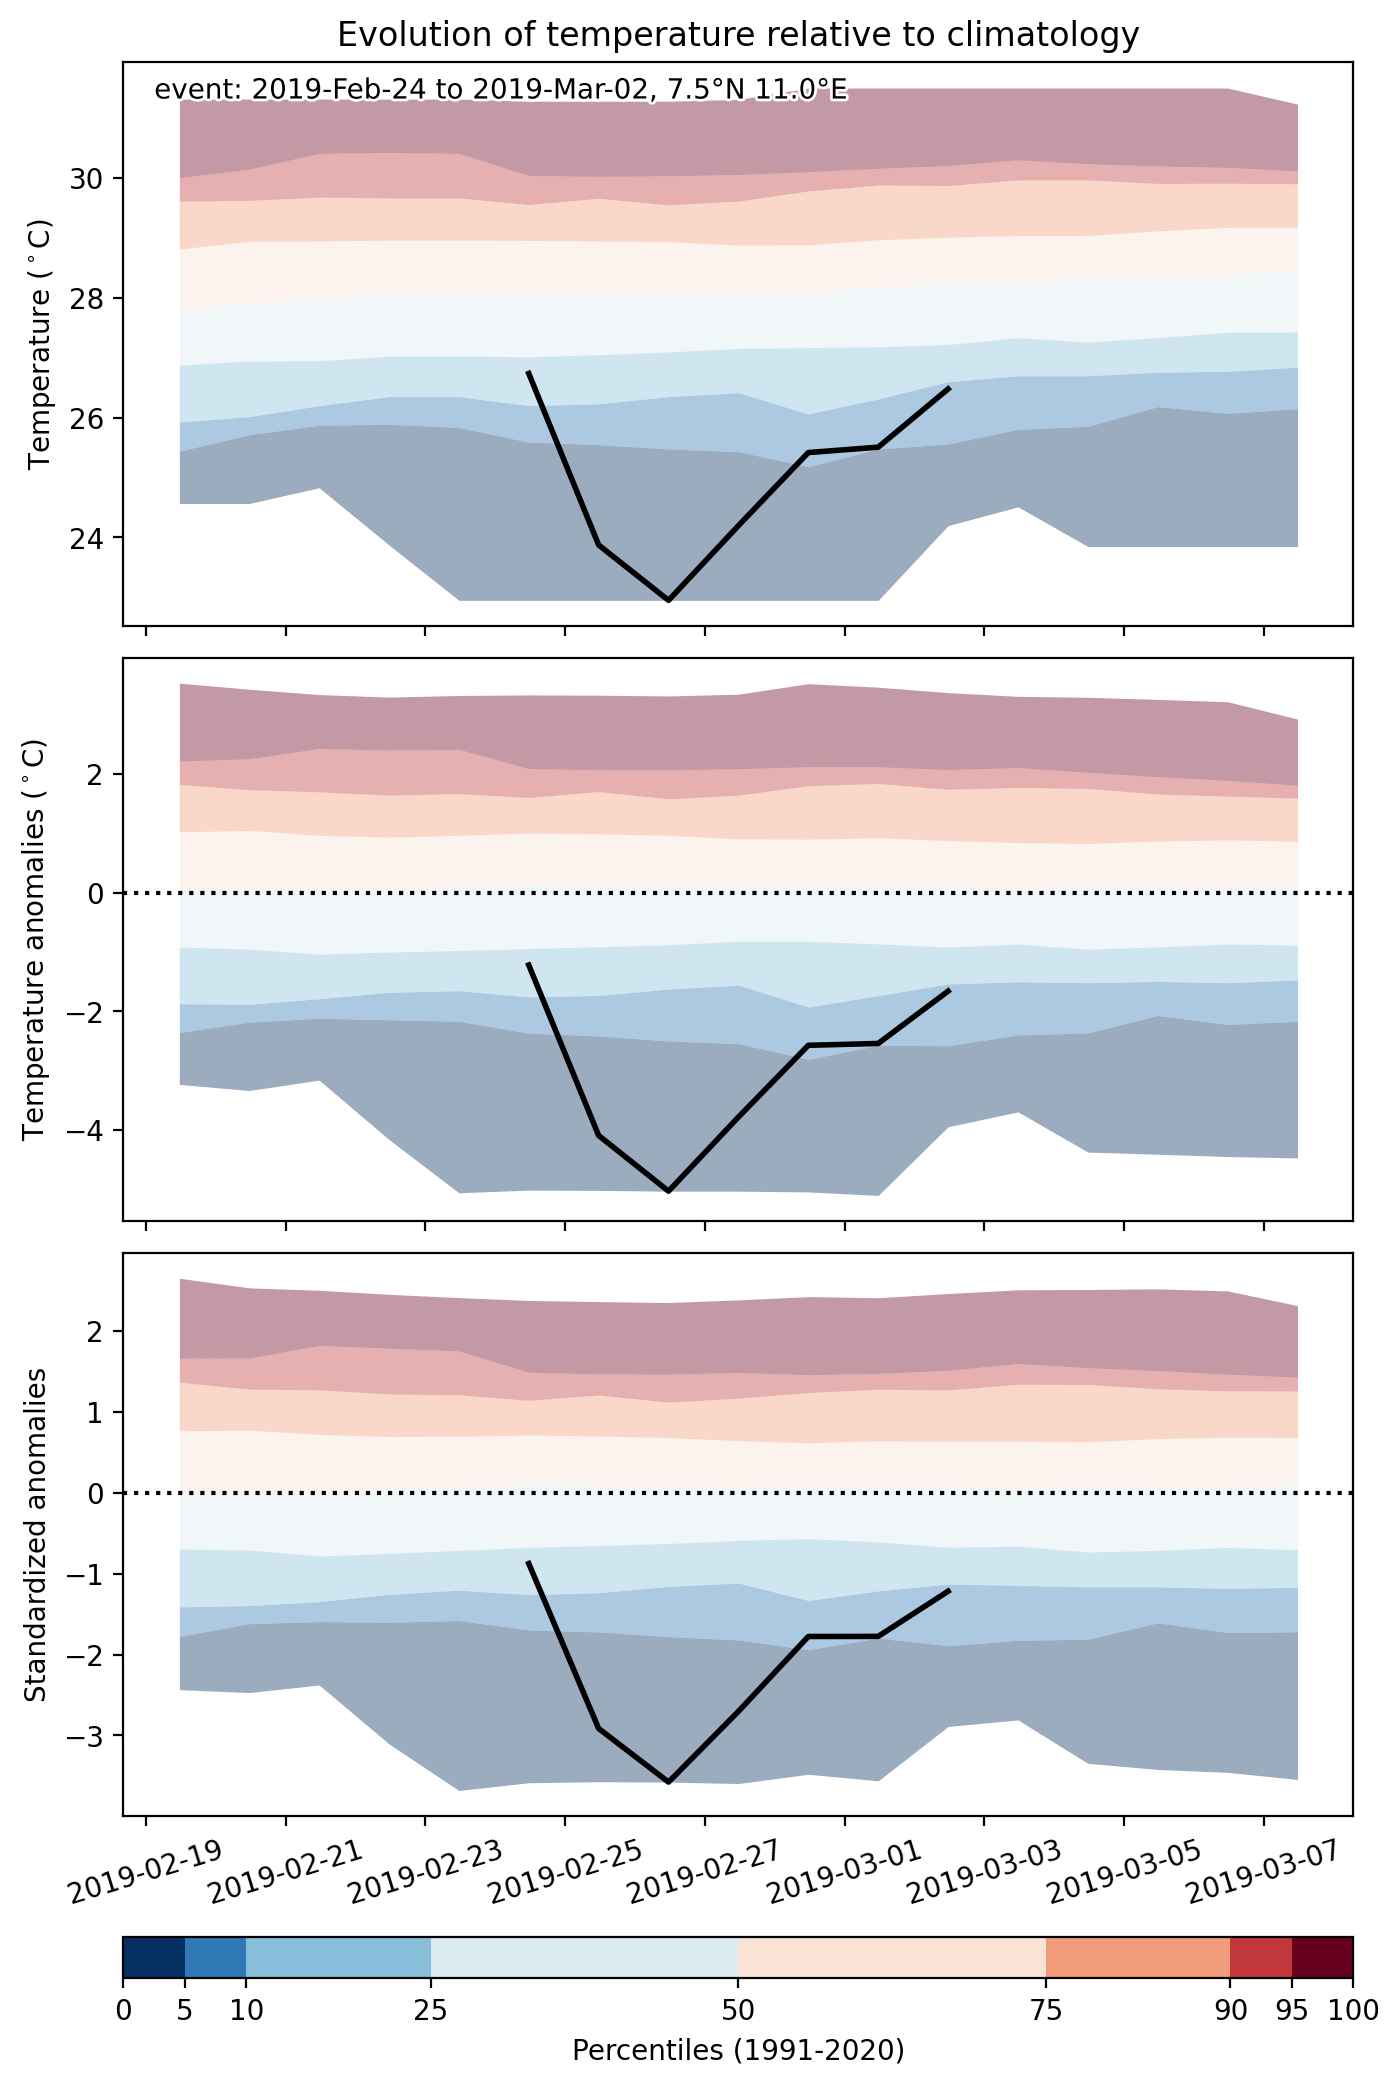
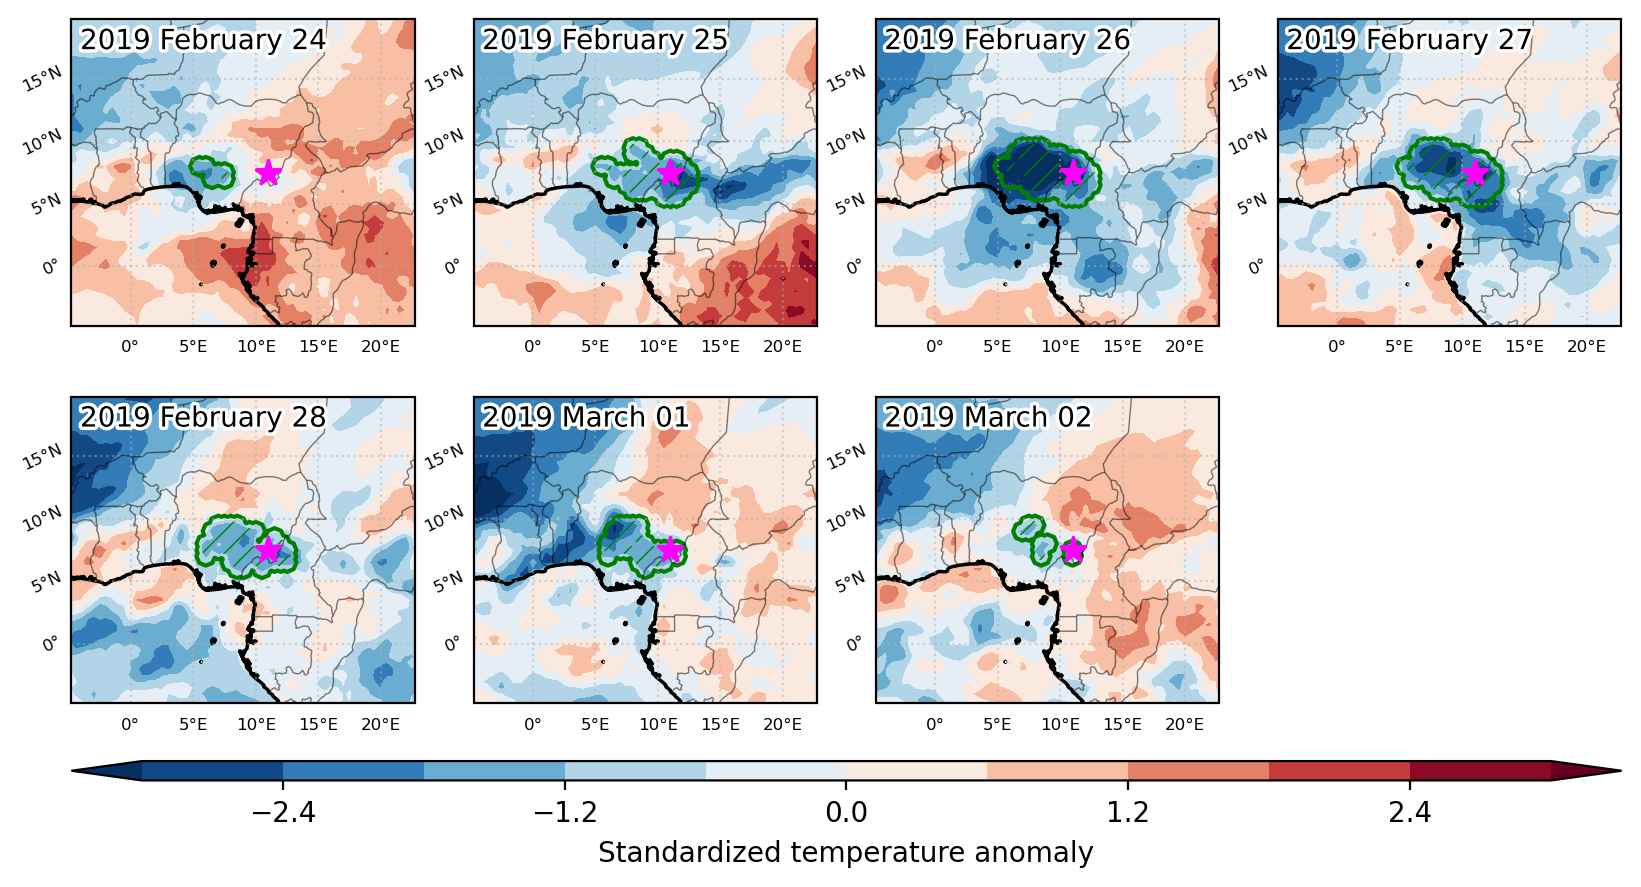
Cold spell occuring from February 24 2019 to March 02 2019 at 7.5°N 11.0°E

Download data: JSON

Event type: Cold spell

Countries affected (identified with ArcGIS Online; provided only for geographical reference):

  • Cameroon
  • Nigeria

Duration: 7 days

Time span: February 24 2019 to March 02 2019

Statistics over entire affected area:

  • Mean temperature anomaly: -2.9 °C
  • Mean temperature: 25.8 °C
  • Minimum temperature anomaly: -6.3 °C
  • Minimum temperature: 19.1 °C

Event center: 7.5°N 11.0°E

Area affected: 251265 km$^2$


Fig. 1: Map of most extreme temperature anomalies (standardized) experienced during the event. The purple star indicates the center of the extreme event. Green hatching illustrates all areas under the effect of extremes at some time during the event.


Fig. 2: Evolution of temperature at the center of the event. The climatological percentile distribution is illustrated with color shadings.


Fig. 3: Maps illustrating the evolution of standardized temperature anomalies during the event.

Event ID: Cold_spell_2019-Feb-24_to_2019-Mar-02_11.0_7.5

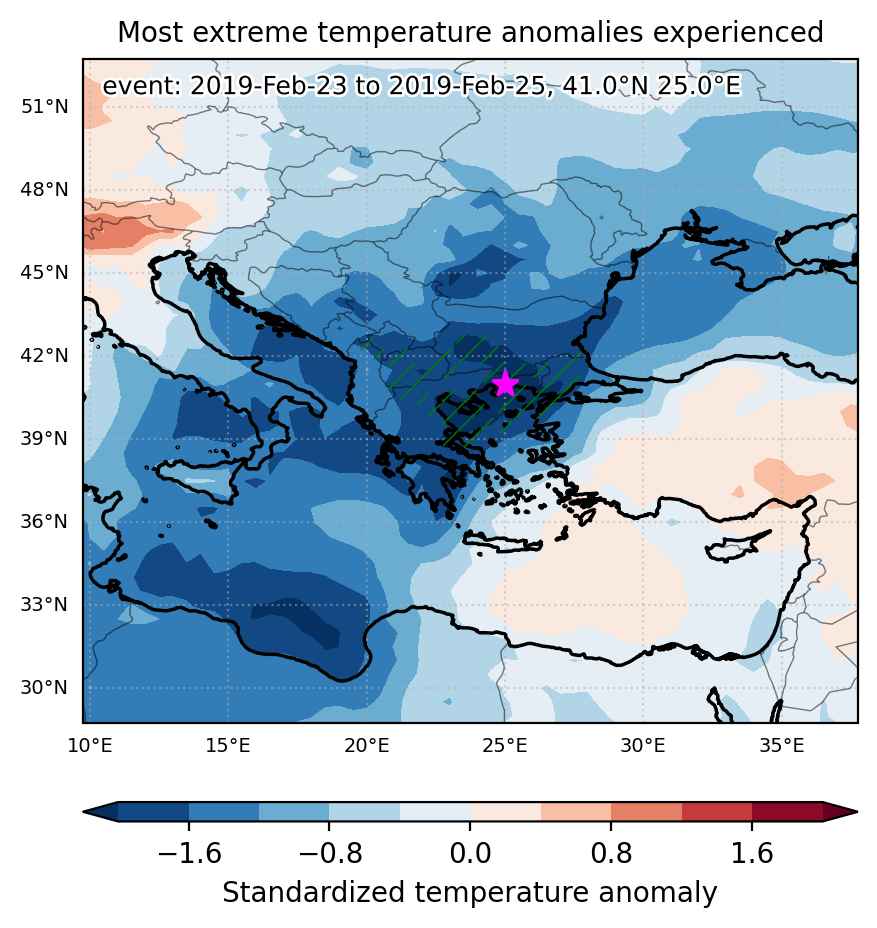
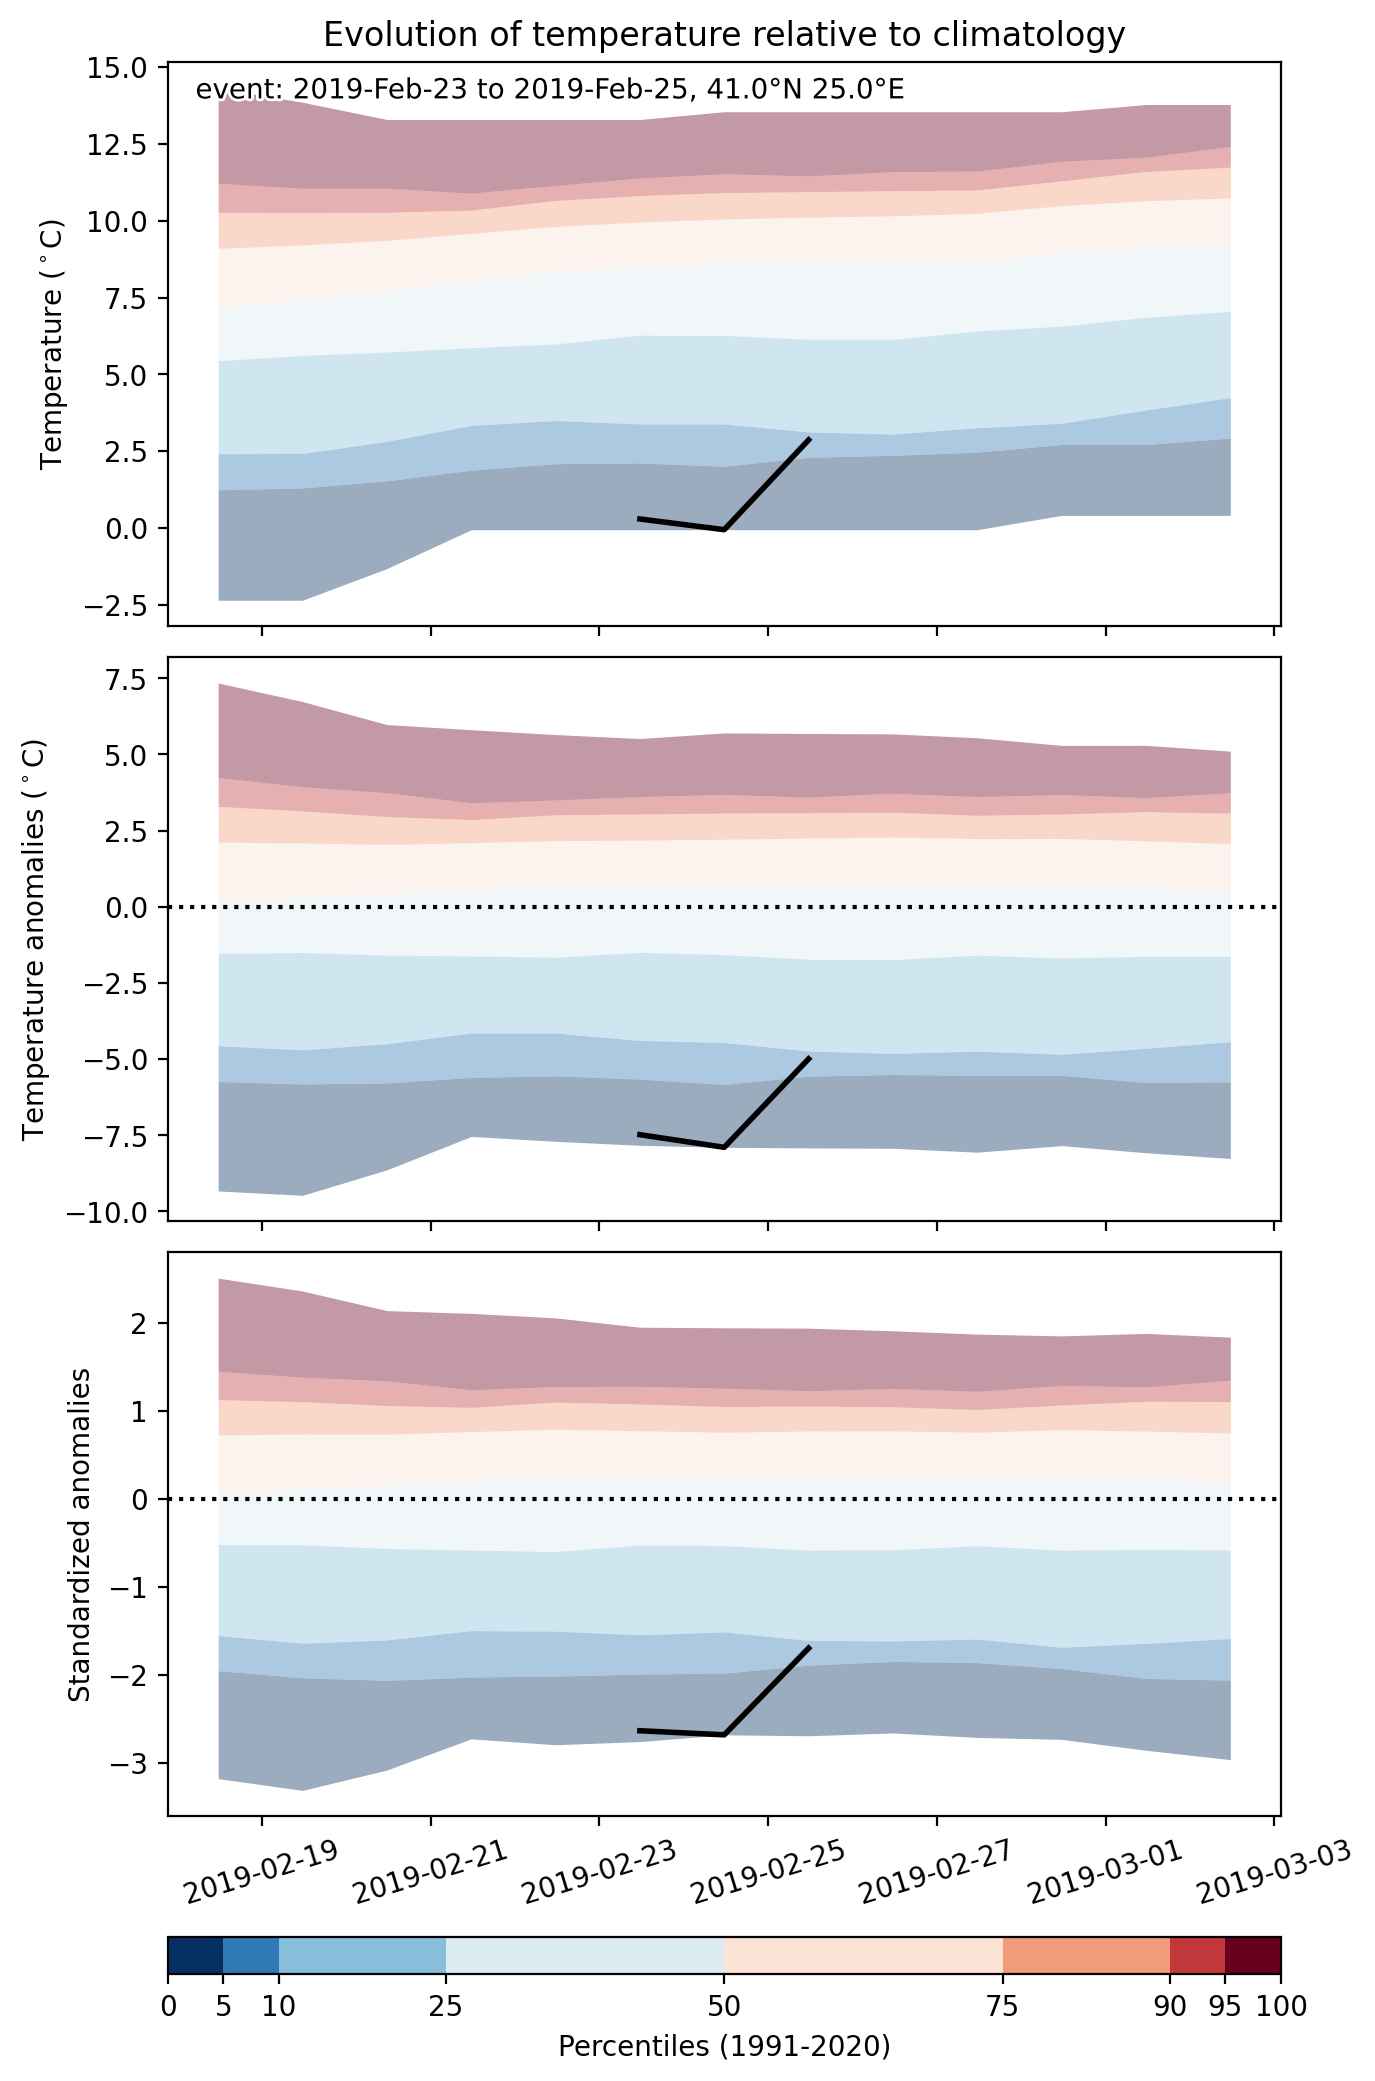
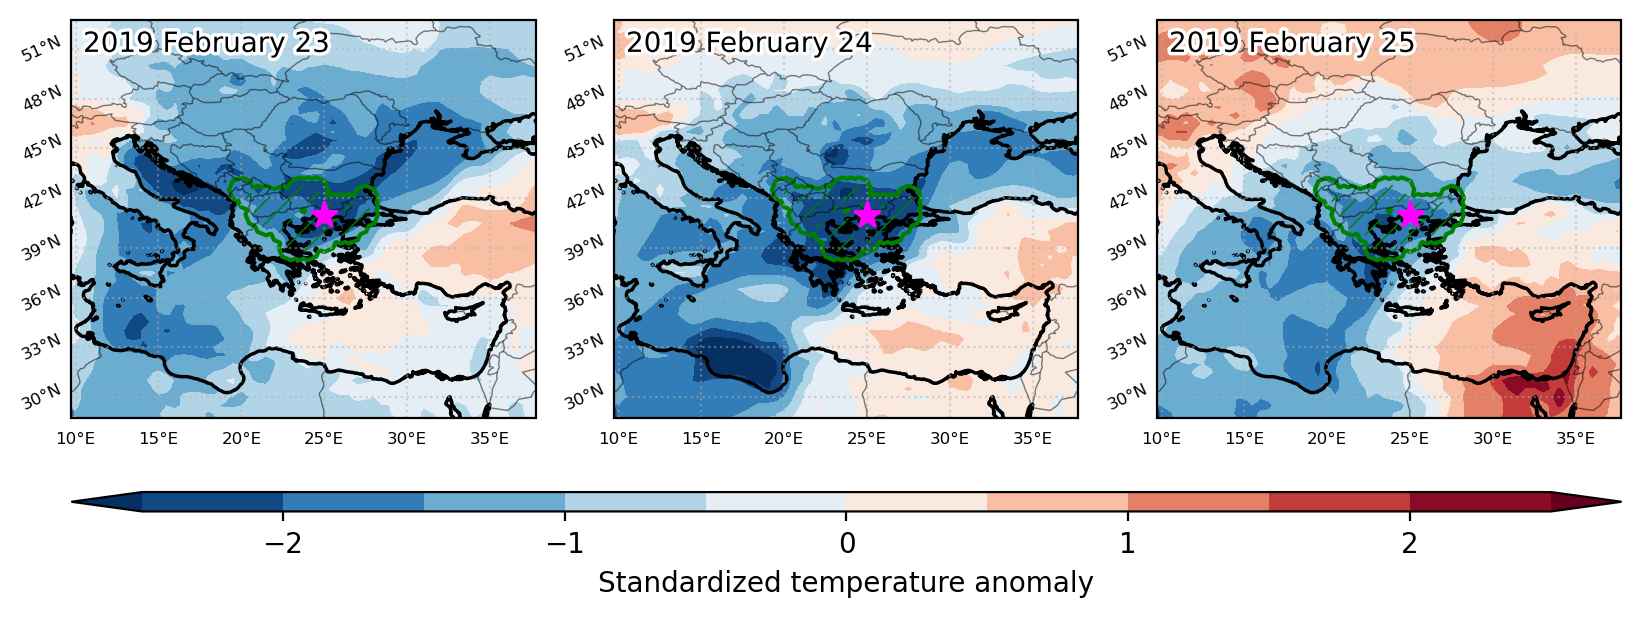
Cold spell occuring from February 23 2019 to February 25 2019 at 41.0°N 25.0°E

Download data: JSON

Event type: Cold spell

Countries affected (identified with ArcGIS Online; provided only for geographical reference):

  • Albania
  • Bulgaria
  • Greece
  • North Macedonia
  • Turkiye

Duration: 3 days

Time span: February 23 2019 to February 25 2019

Statistics over entire affected area:

  • Mean temperature anomaly: -7.0 °C
  • Mean temperature: -0.7 °C
  • Minimum temperature anomaly: -11.5 °C
  • Minimum temperature: -12.2 °C

Event center: 41.0°N 25.0°E

Area affected: 140147 km$^2$


Fig. 1: Map of most extreme temperature anomalies (standardized) experienced during the event. The purple star indicates the center of the extreme event. Green hatching illustrates all areas under the effect of extremes at some time during the event.


Fig. 2: Evolution of temperature at the center of the event. The climatological percentile distribution is illustrated with color shadings.


Fig. 3: Maps illustrating the evolution of standardized temperature anomalies during the event.

Event ID: Cold_spell_2019-Feb-23_to_2019-Feb-25_25.0_41.0

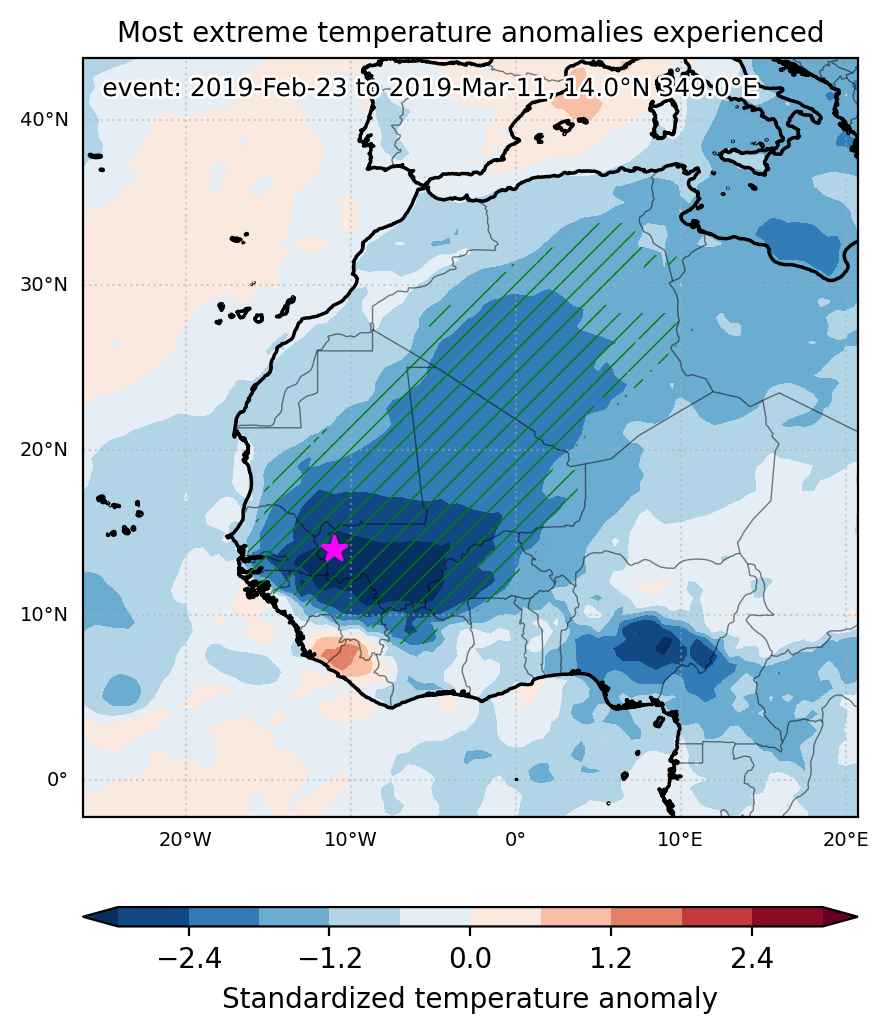
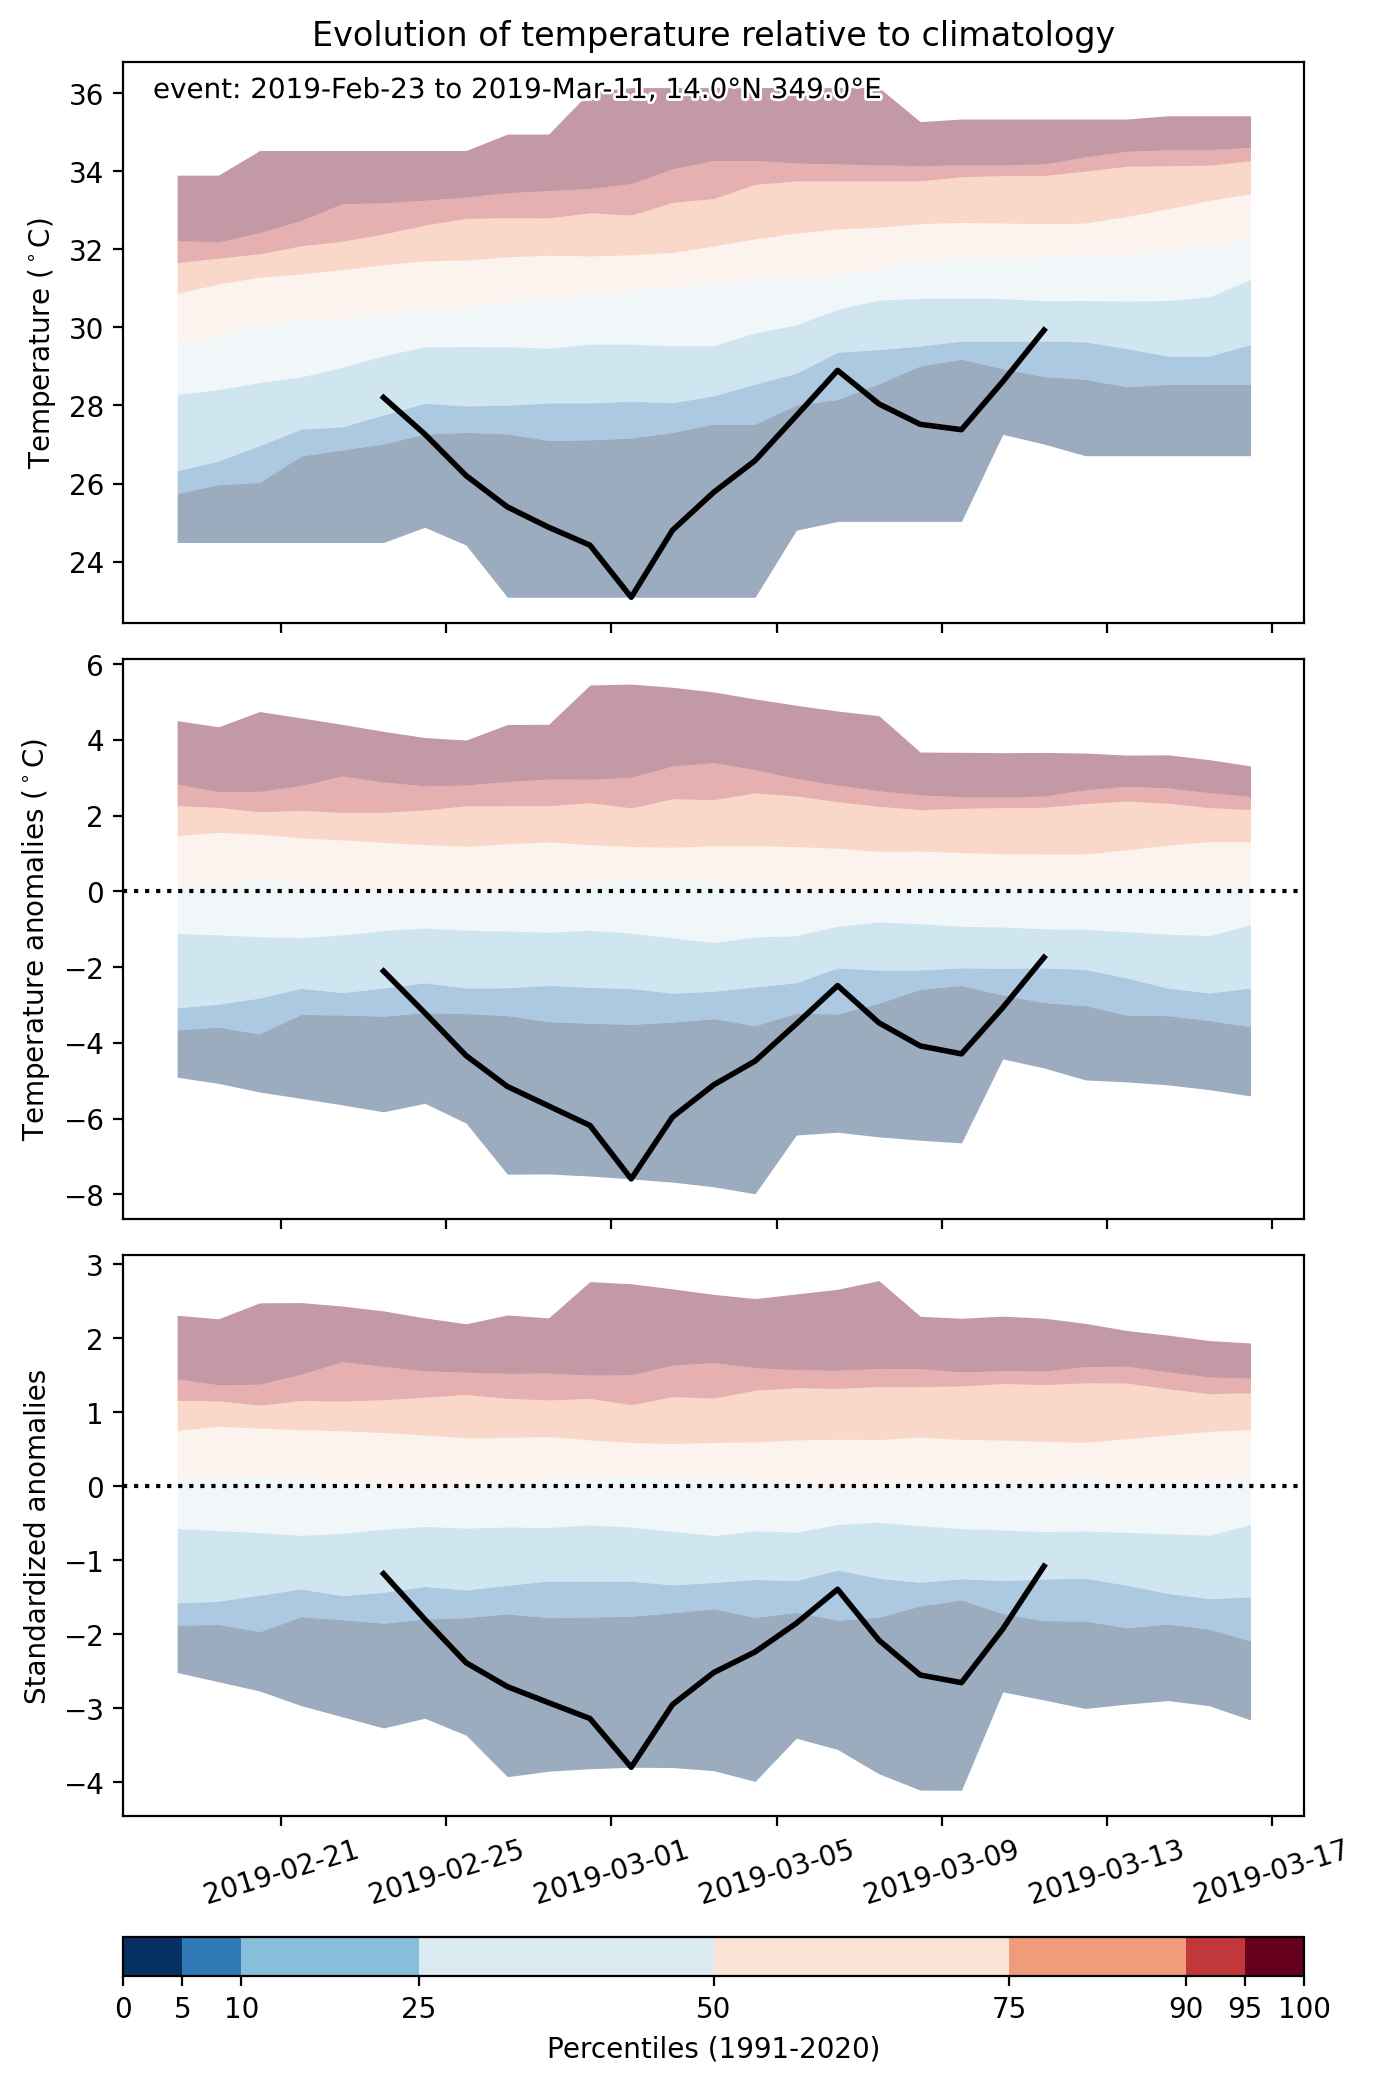
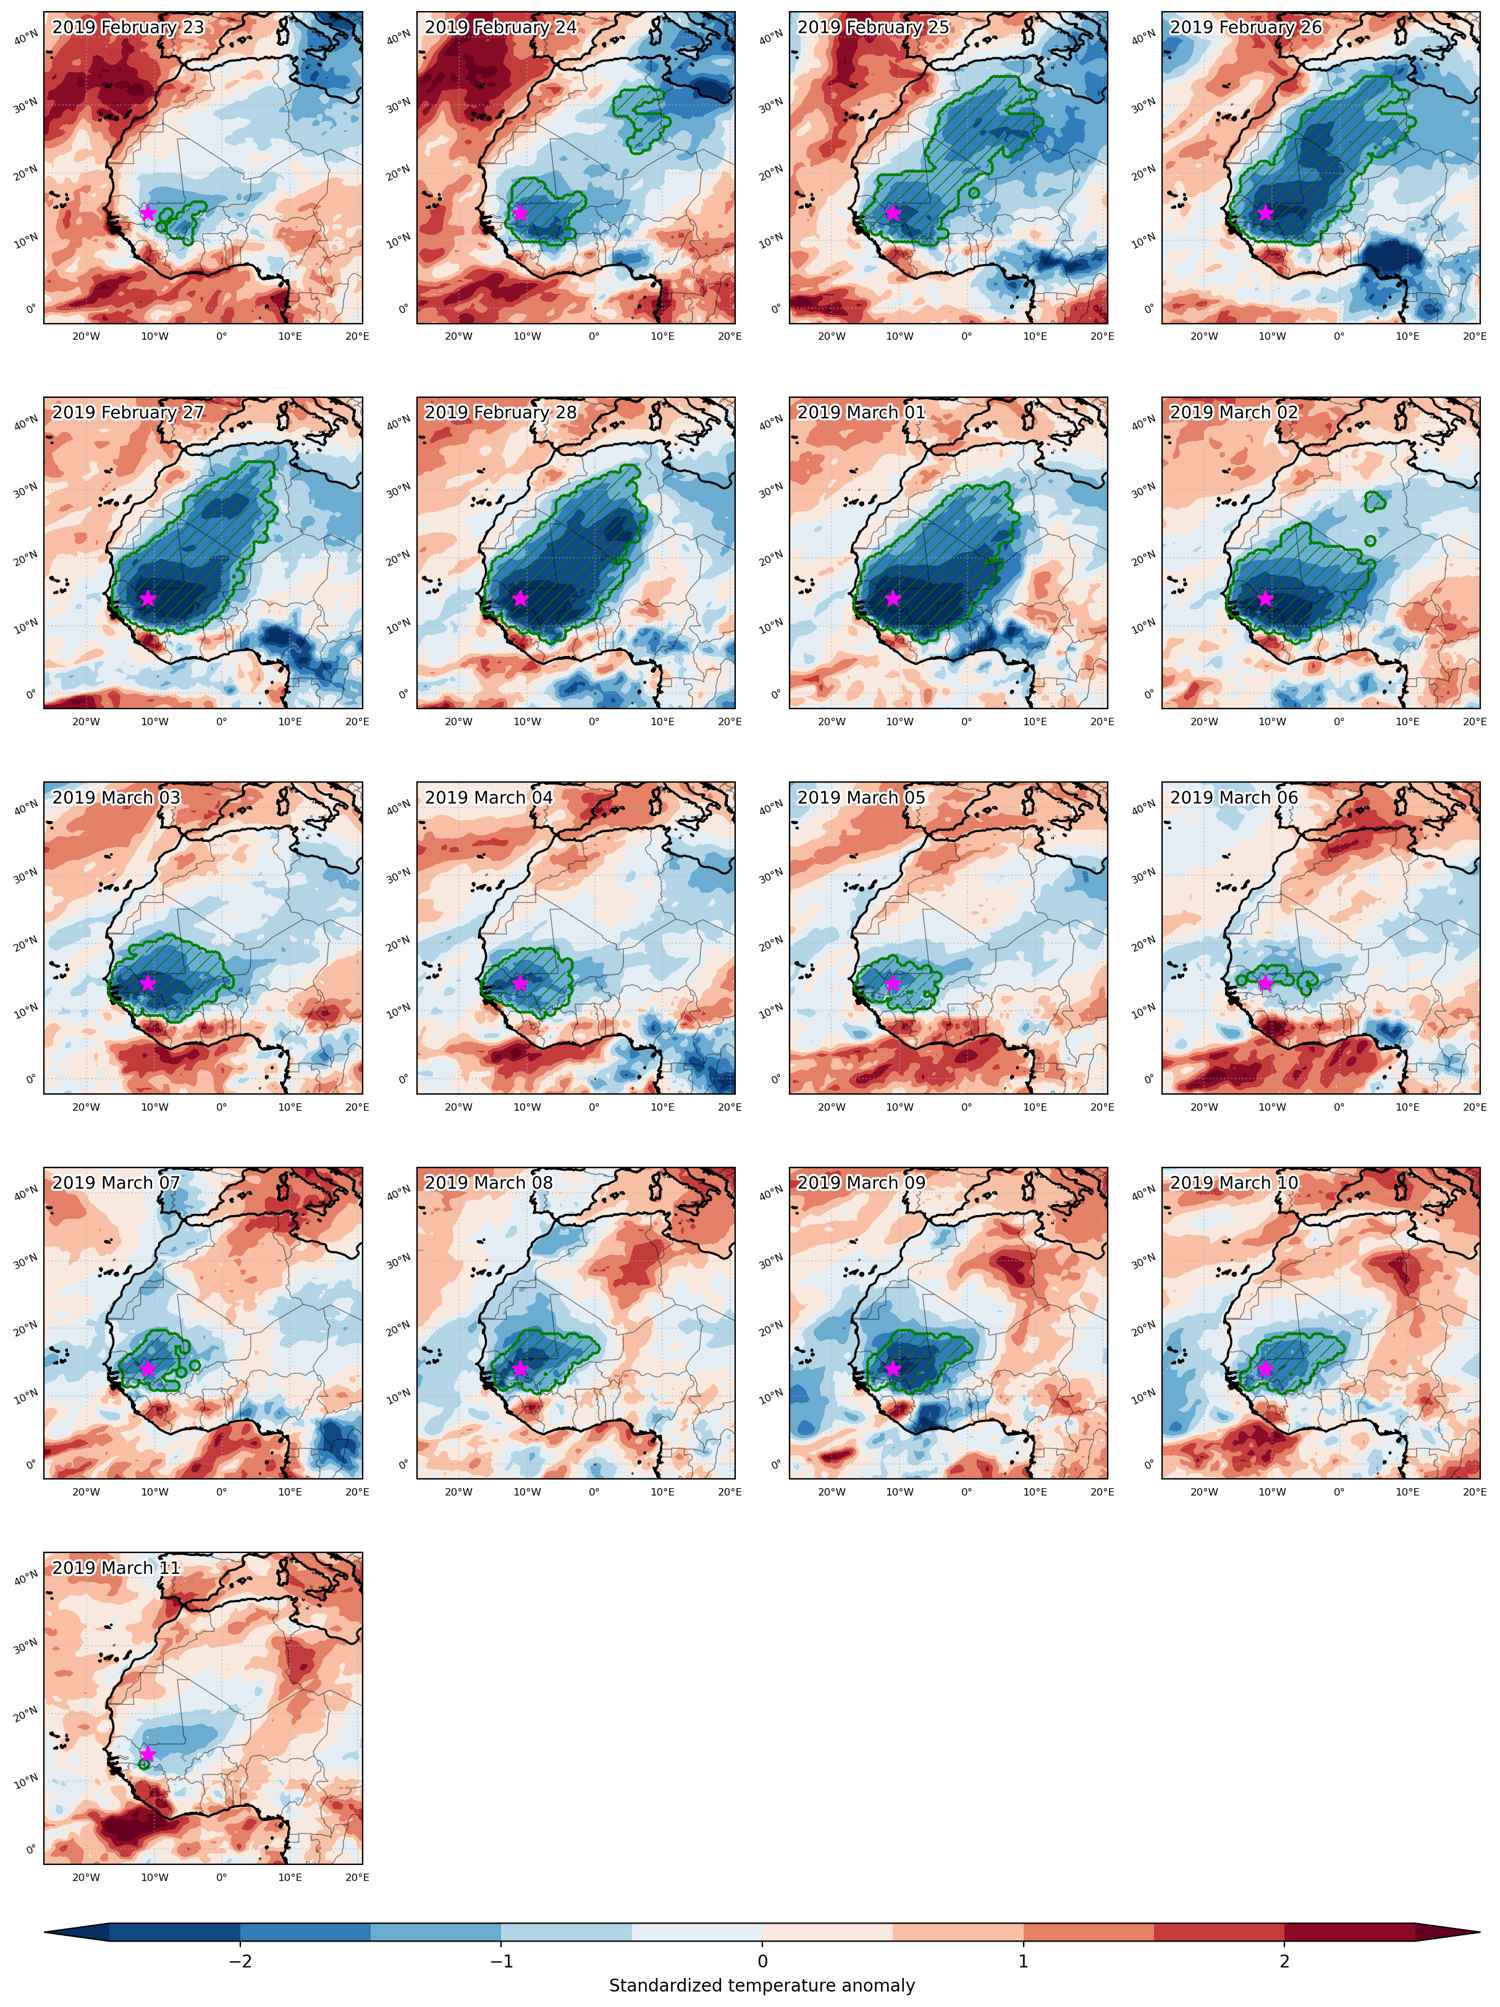
Cold spell occuring from February 23 2019 to March 11 2019 at 14.0°N 349.0°E

Download data: JSON

Event type: Cold spell

Countries affected (identified with ArcGIS Online; provided only for geographical reference):

  • Algeria
  • Burkina Faso
  • Côte d’Ivoire
  • Gambia
  • Ghana
  • Guinea
  • Guinea-Bissau
  • Libya
  • Mali
  • Mauritania
  • Niger
  • Senegal
  • Tunisia

Duration: 17 days

Time span: February 23 2019 to March 11 2019

Statistics over entire affected area:

  • Mean temperature anomaly: -4.8 °C
  • Mean temperature: 19.7 °C
  • Minimum temperature anomaly: -9.6 °C
  • Minimum temperature: 6.3 °C

Event center: 14.0°N 349.0°E

Area affected: 3873238 km$^2$


Fig. 1: Map of most extreme temperature anomalies (standardized) experienced during the event. The purple star indicates the center of the extreme event. Green hatching illustrates all areas under the effect of extremes at some time during the event.


Fig. 2: Evolution of temperature at the center of the event. The climatological percentile distribution is illustrated with color shadings.


Fig. 3: Maps illustrating the evolution of standardized temperature anomalies during the event.

Event ID: Cold_spell_2019-Feb-23_to_2019-Mar-11_349.0_14.0

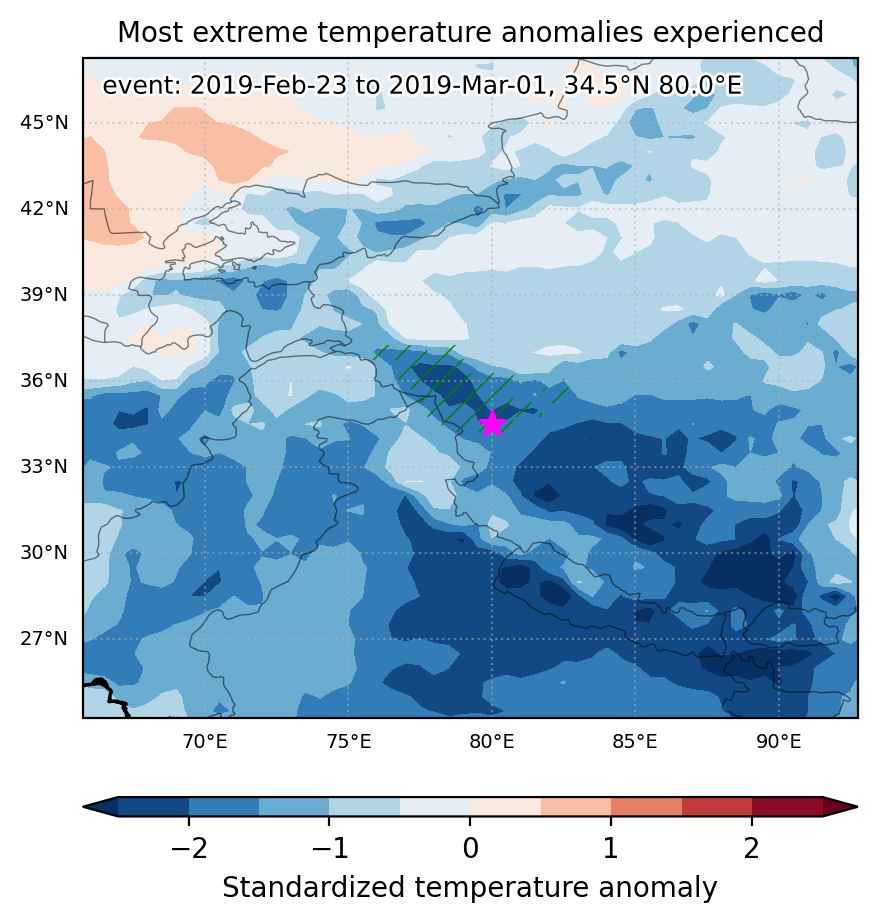
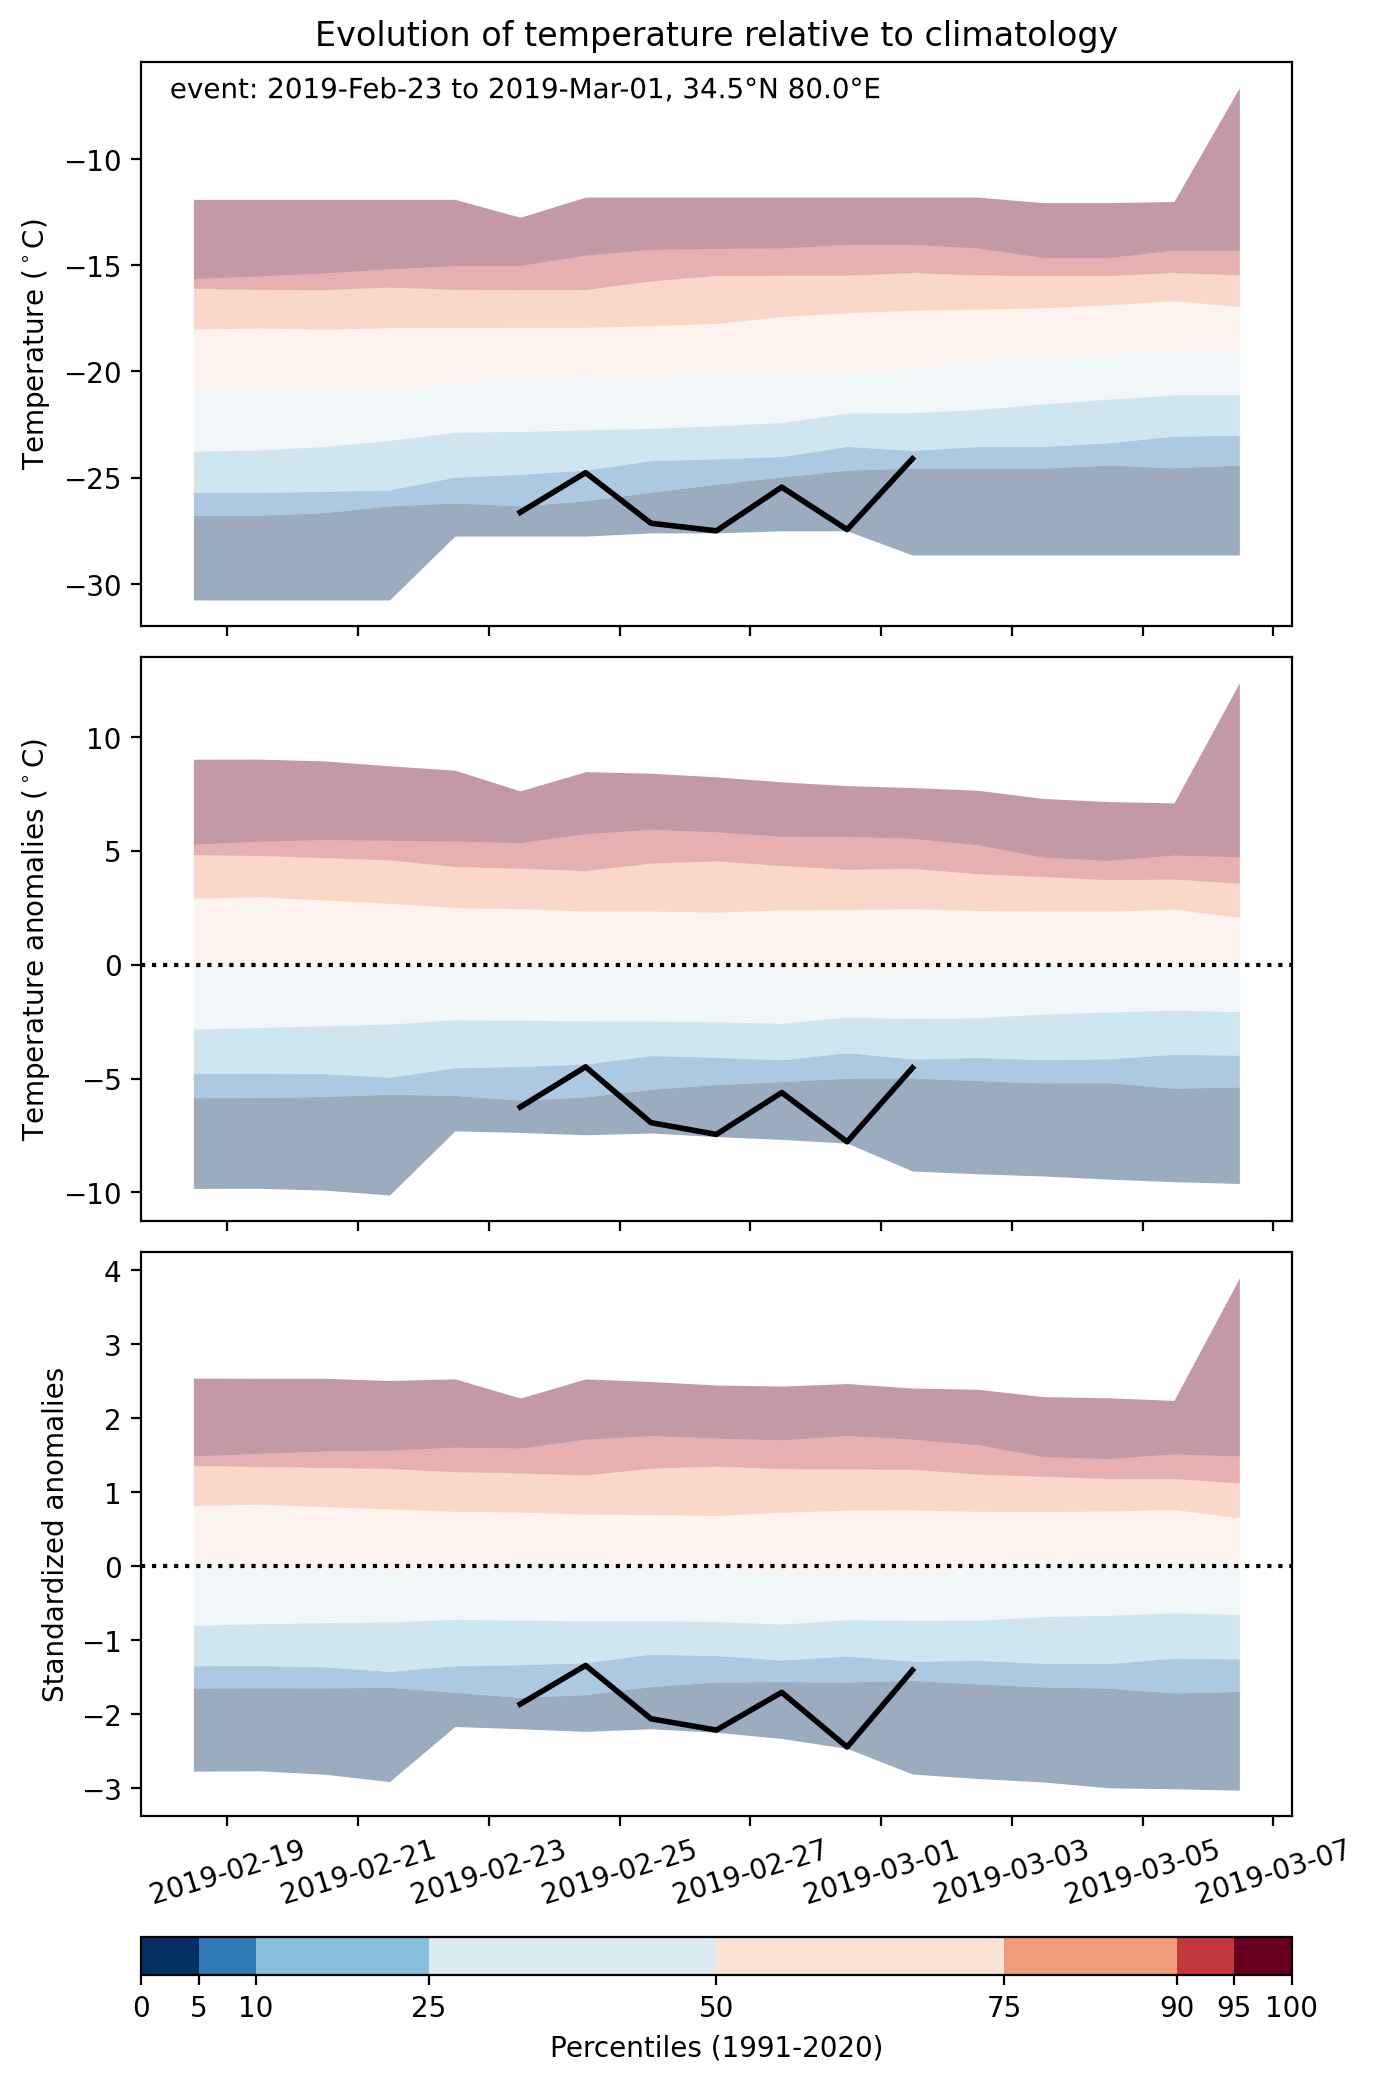
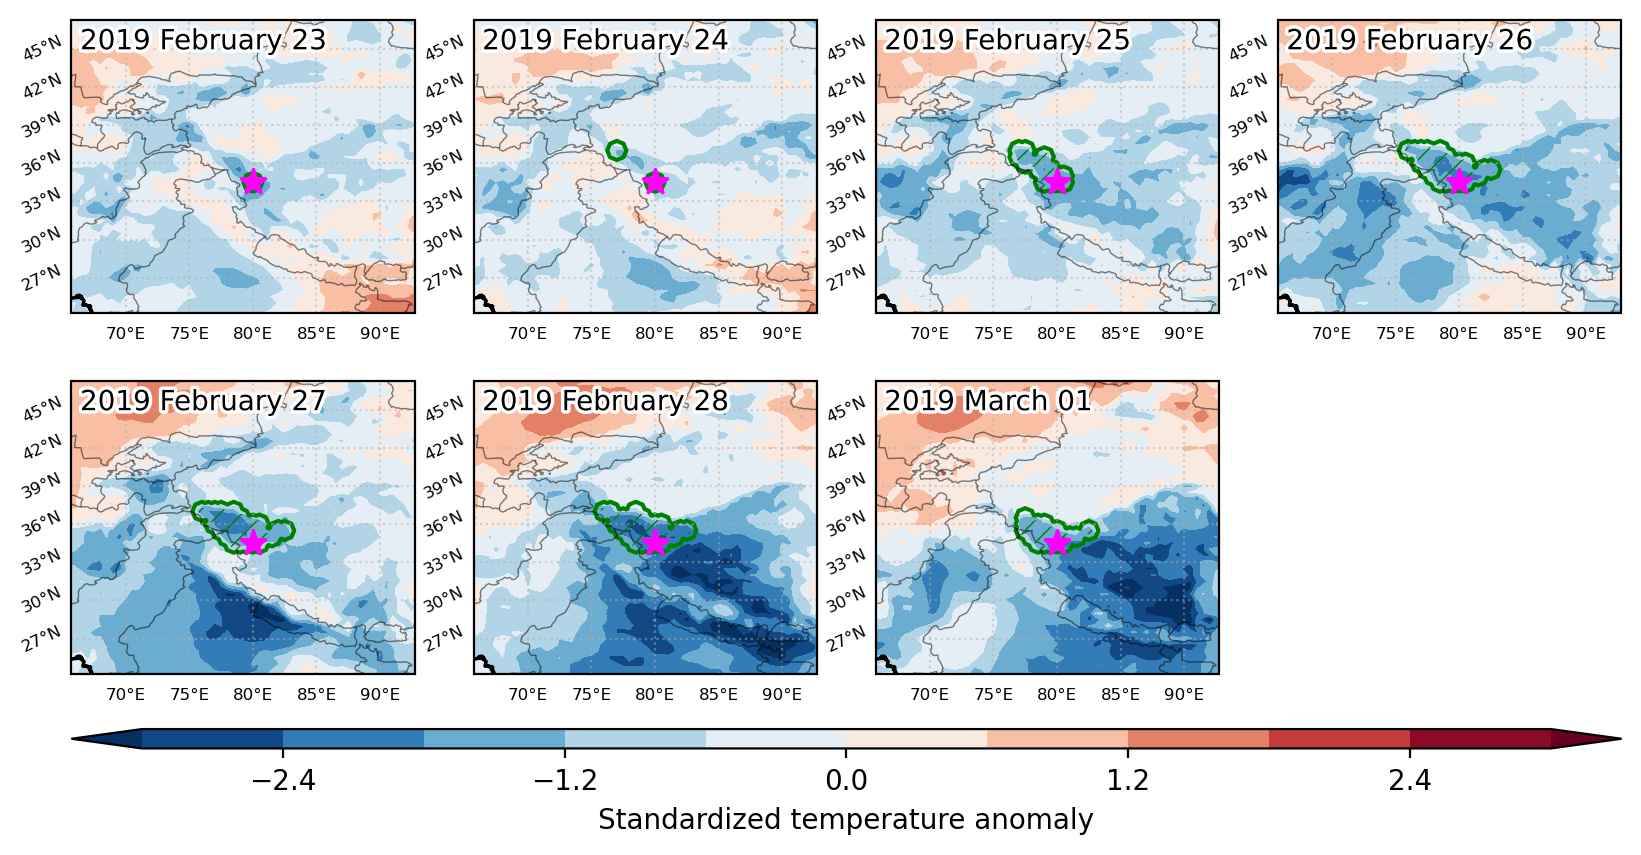
Cold spell occuring from February 23 2019 to March 01 2019 at 34.5°N 80.0°E

Download data: JSON

Event type: Cold spell

Countries affected (identified with ArcGIS Online; provided only for geographical reference):

  • China
  • India

Duration: 7 days

Time span: February 23 2019 to March 01 2019

Statistics over entire affected area:

  • Mean temperature anomaly: -6.2 °C
  • Mean temperature: -24.7 °C
  • Minimum temperature anomaly: -9.5 °C
  • Minimum temperature: -33.4 °C

Event center: 34.5°N 80.0°E

Area affected: 100415 km$^2$


Fig. 1: Map of most extreme temperature anomalies (standardized) experienced during the event. The purple star indicates the center of the extreme event. Green hatching illustrates all areas under the effect of extremes at some time during the event.


Fig. 2: Evolution of temperature at the center of the event. The climatological percentile distribution is illustrated with color shadings.


Fig. 3: Maps illustrating the evolution of standardized temperature anomalies during the event.

Event ID: Cold_spell_2019-Feb-23_to_2019-Mar-01_80.0_34.5

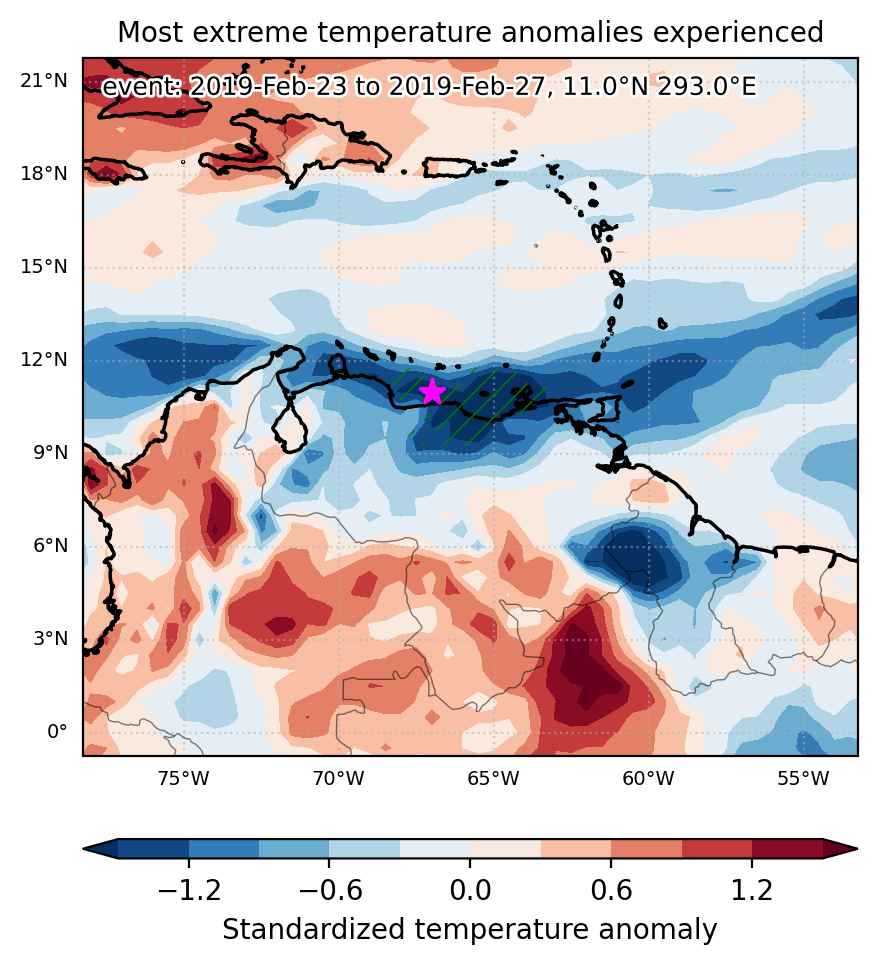
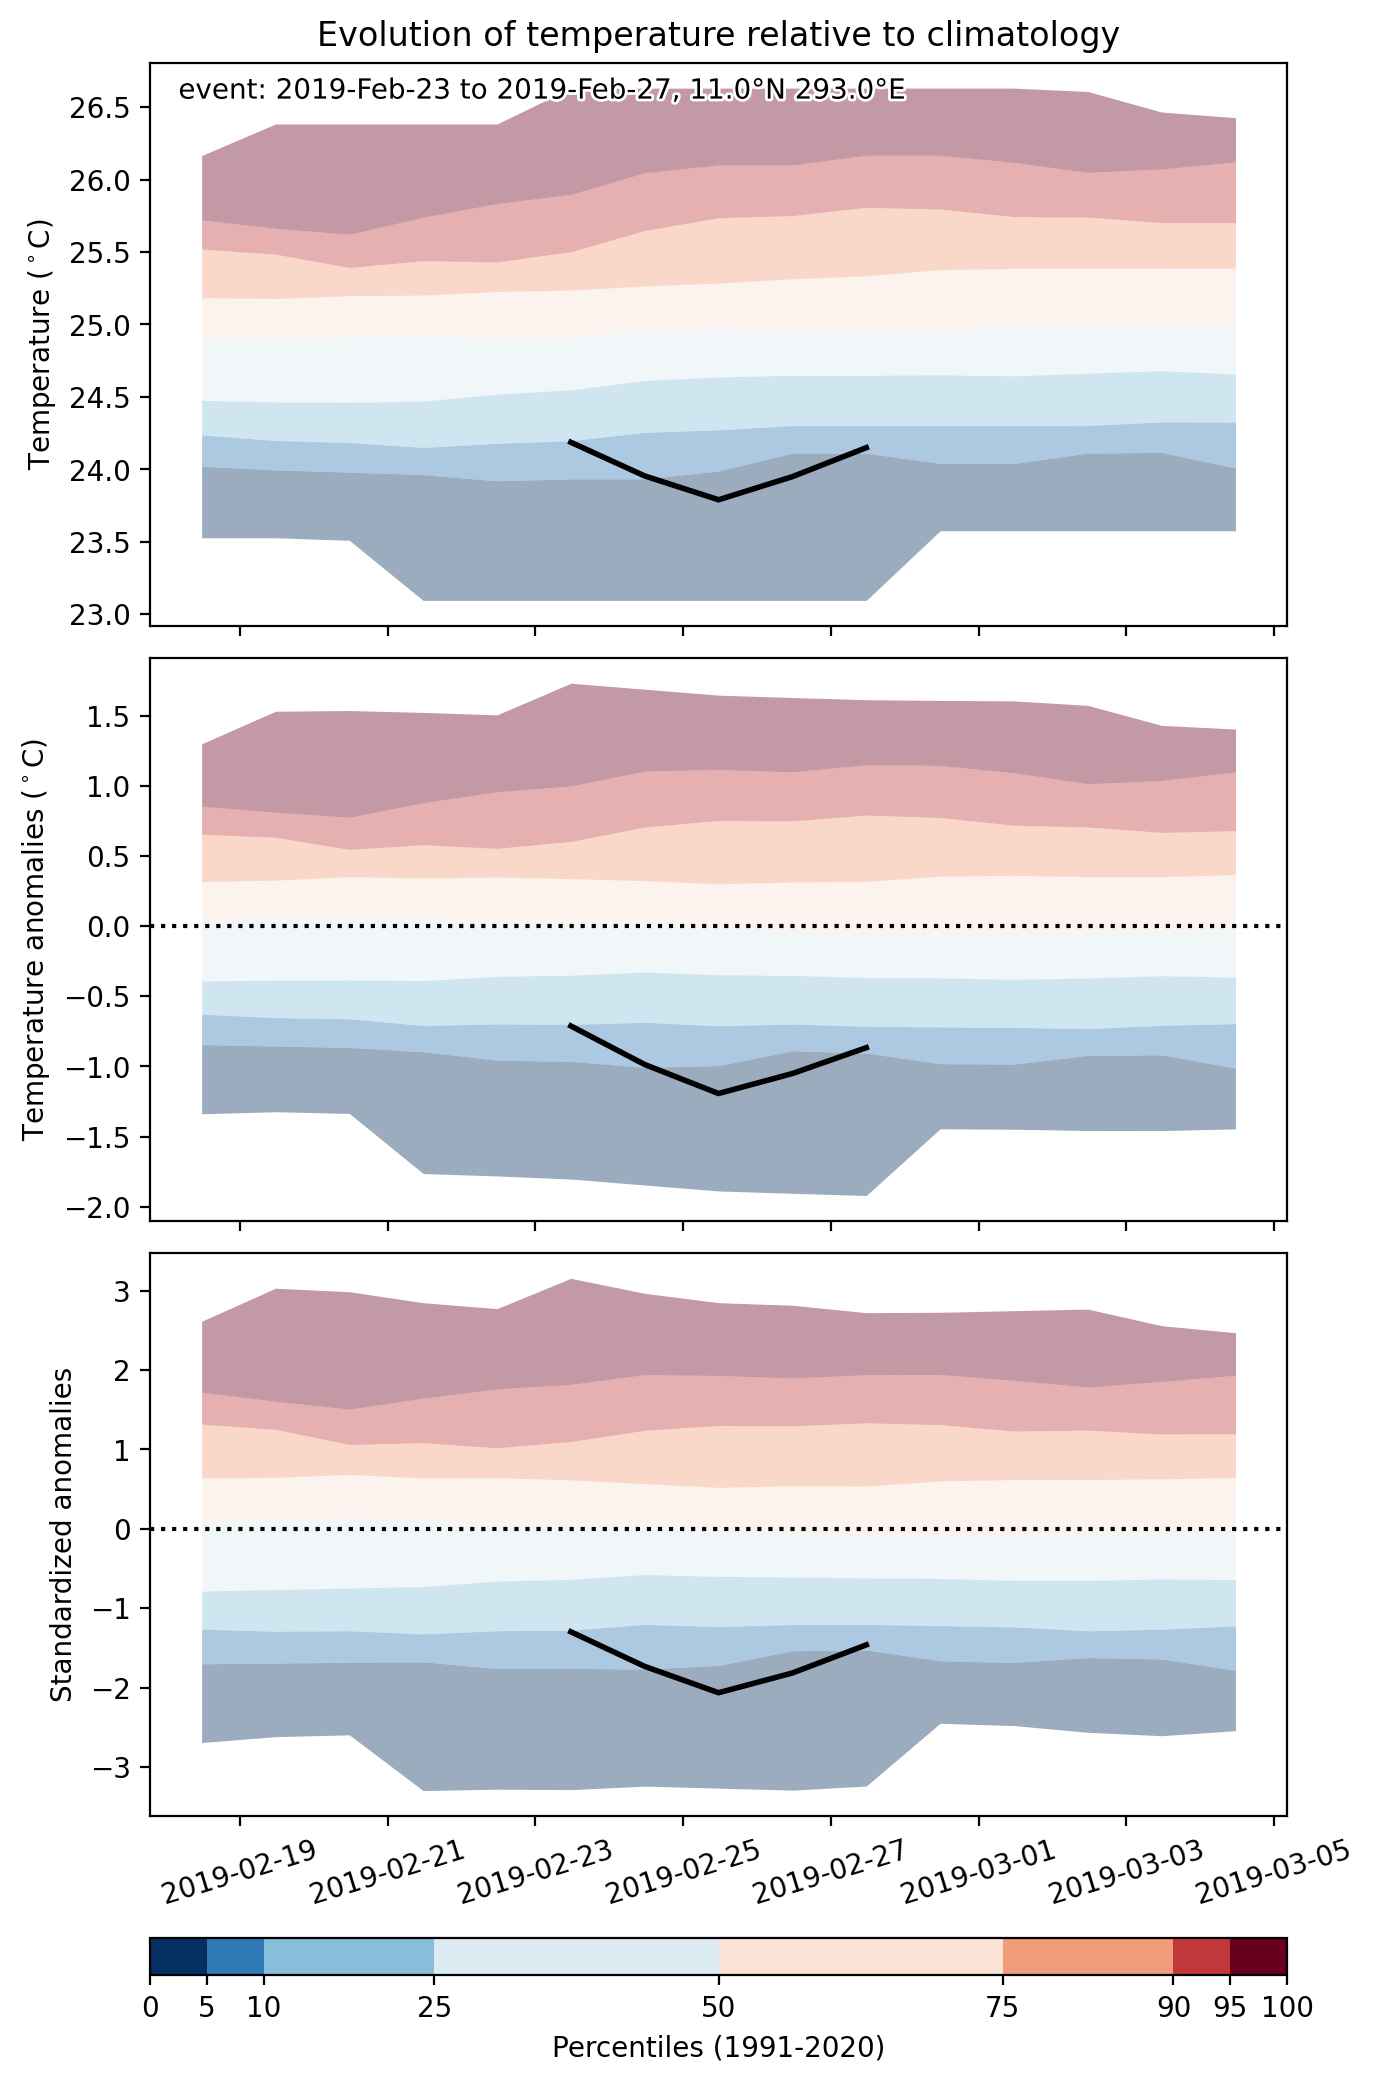
Cold spell occuring from February 23 2019 to February 27 2019 at 11.0°N 293.0°E

Download data: JSON

Event type: Cold spell

Countries affected (identified with ArcGIS Online; provided only for geographical reference):

  • Venezuela

Duration: 5 days

Time span: February 23 2019 to February 27 2019

Statistics over entire affected area:

  • Mean temperature anomaly: -1.1 °C
  • Mean temperature: 24.0 °C
  • Minimum temperature anomaly: -2.0 °C
  • Minimum temperature: 21.0 °C

Event center: 11.0°N 293.0°E

Area affected: 91139 km$^2$


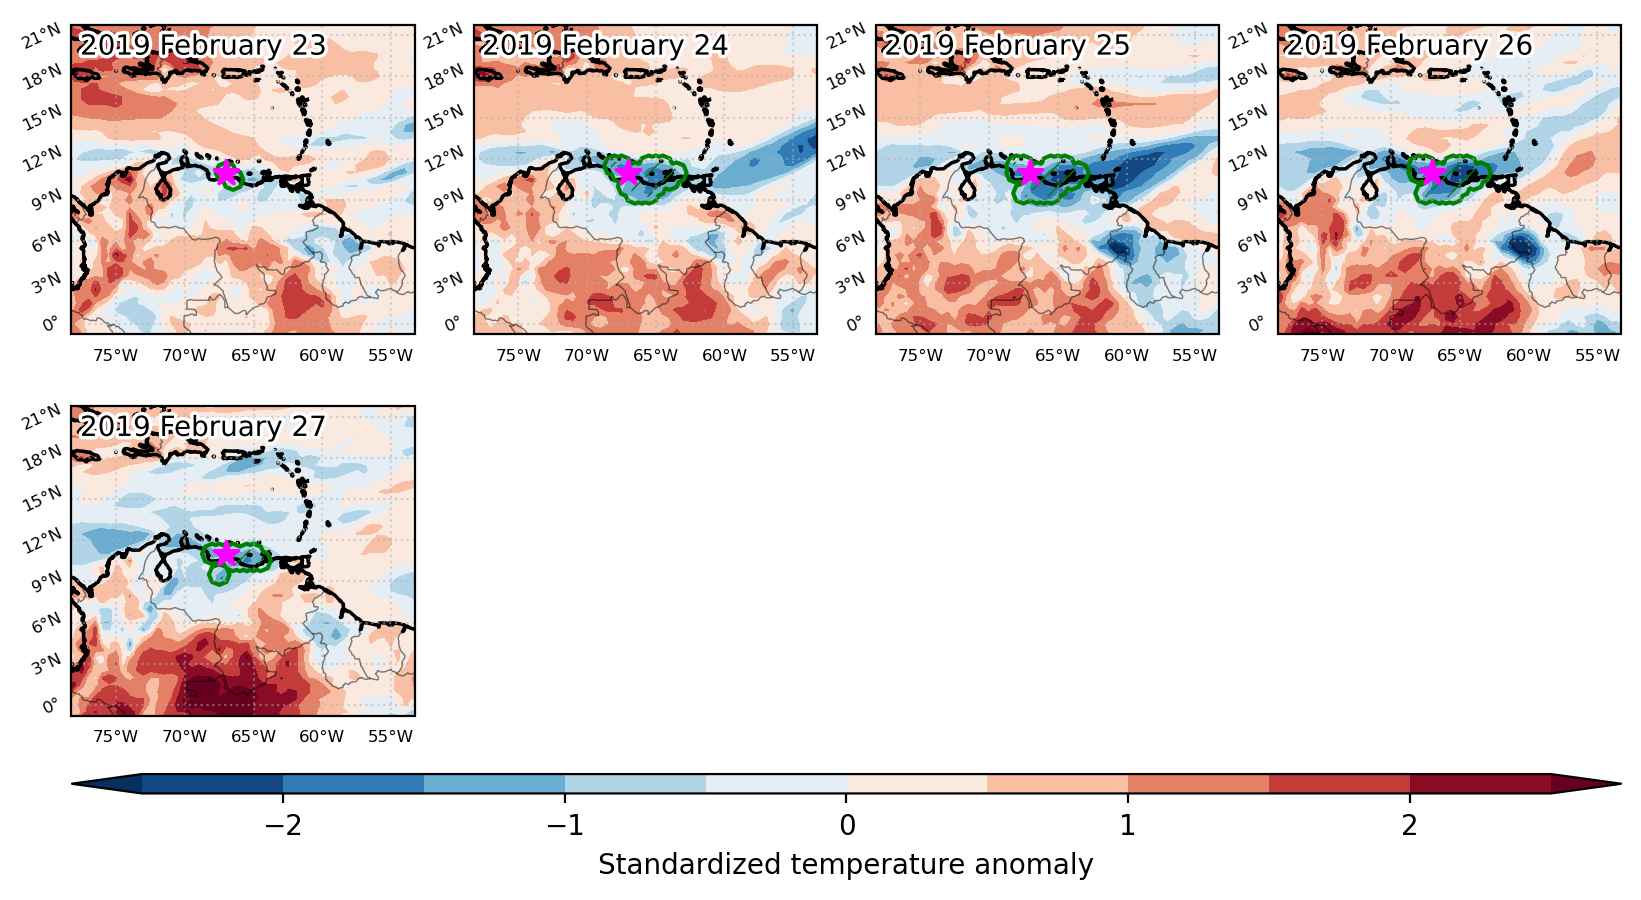
Fig. 1: Map of most extreme temperature anomalies (standardized) experienced during the event. The purple star indicates the center of the extreme event. Green hatching illustrates all areas under the effect of extremes at some time during the event.


Fig. 2: Evolution of temperature at the center of the event. The climatological percentile distribution is illustrated with color shadings.


Fig. 3: Maps illustrating the evolution of standardized temperature anomalies during the event.

Event ID: Cold_spell_2019-Feb-23_to_2019-Feb-27_293.0_11.0

Heat wave occuring from February 22 2019 to February 25 2019 at 69.5°N 34.5°E

Download data: JSON

Event type: Heat wave

Countries affected (identified with ArcGIS Online; provided only for geographical reference):

  • Russian Federation

Duration: 4 days

Time span: February 22 2019 to February 25 2019

Statistics over entire affected area:

  • Mean temperature anomaly: 7.4 °C
  • Mean temperature: 0.4 °C
  • Maximum temperature anomaly: 11.5 °C
  • Maximum temperature: 3.8 °C

Event center: 69.5°N 34.5°E

Area affected: 88110 km$^2$


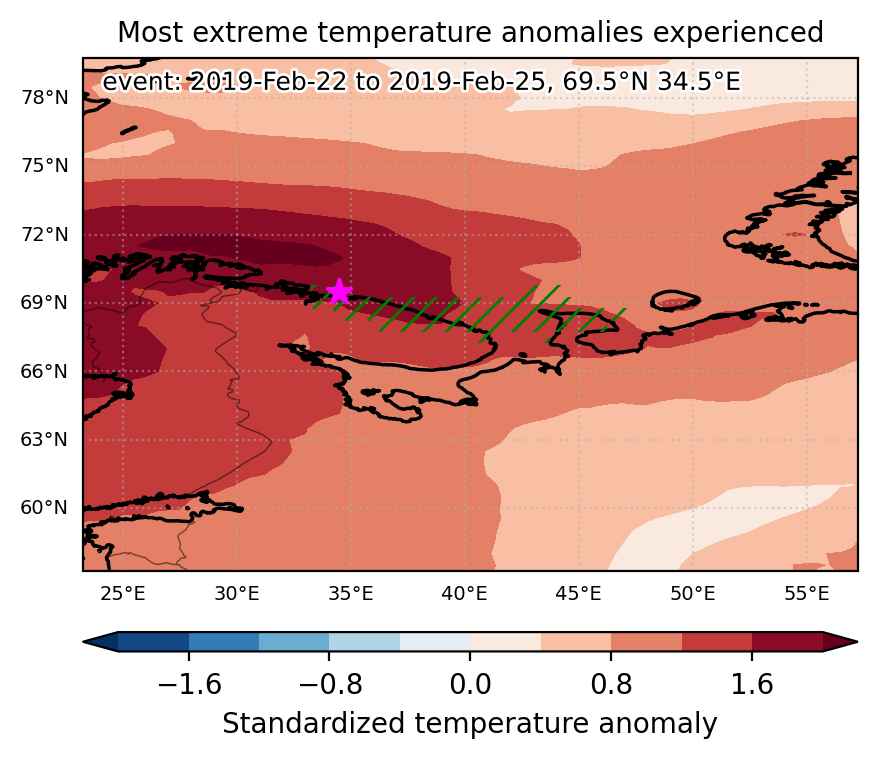
Fig. 1: Map of most extreme temperature anomalies (standardized) experienced during the event. The purple star indicates the center of the extreme event. Green hatching illustrates all areas under the effect of extremes at some time during the event.


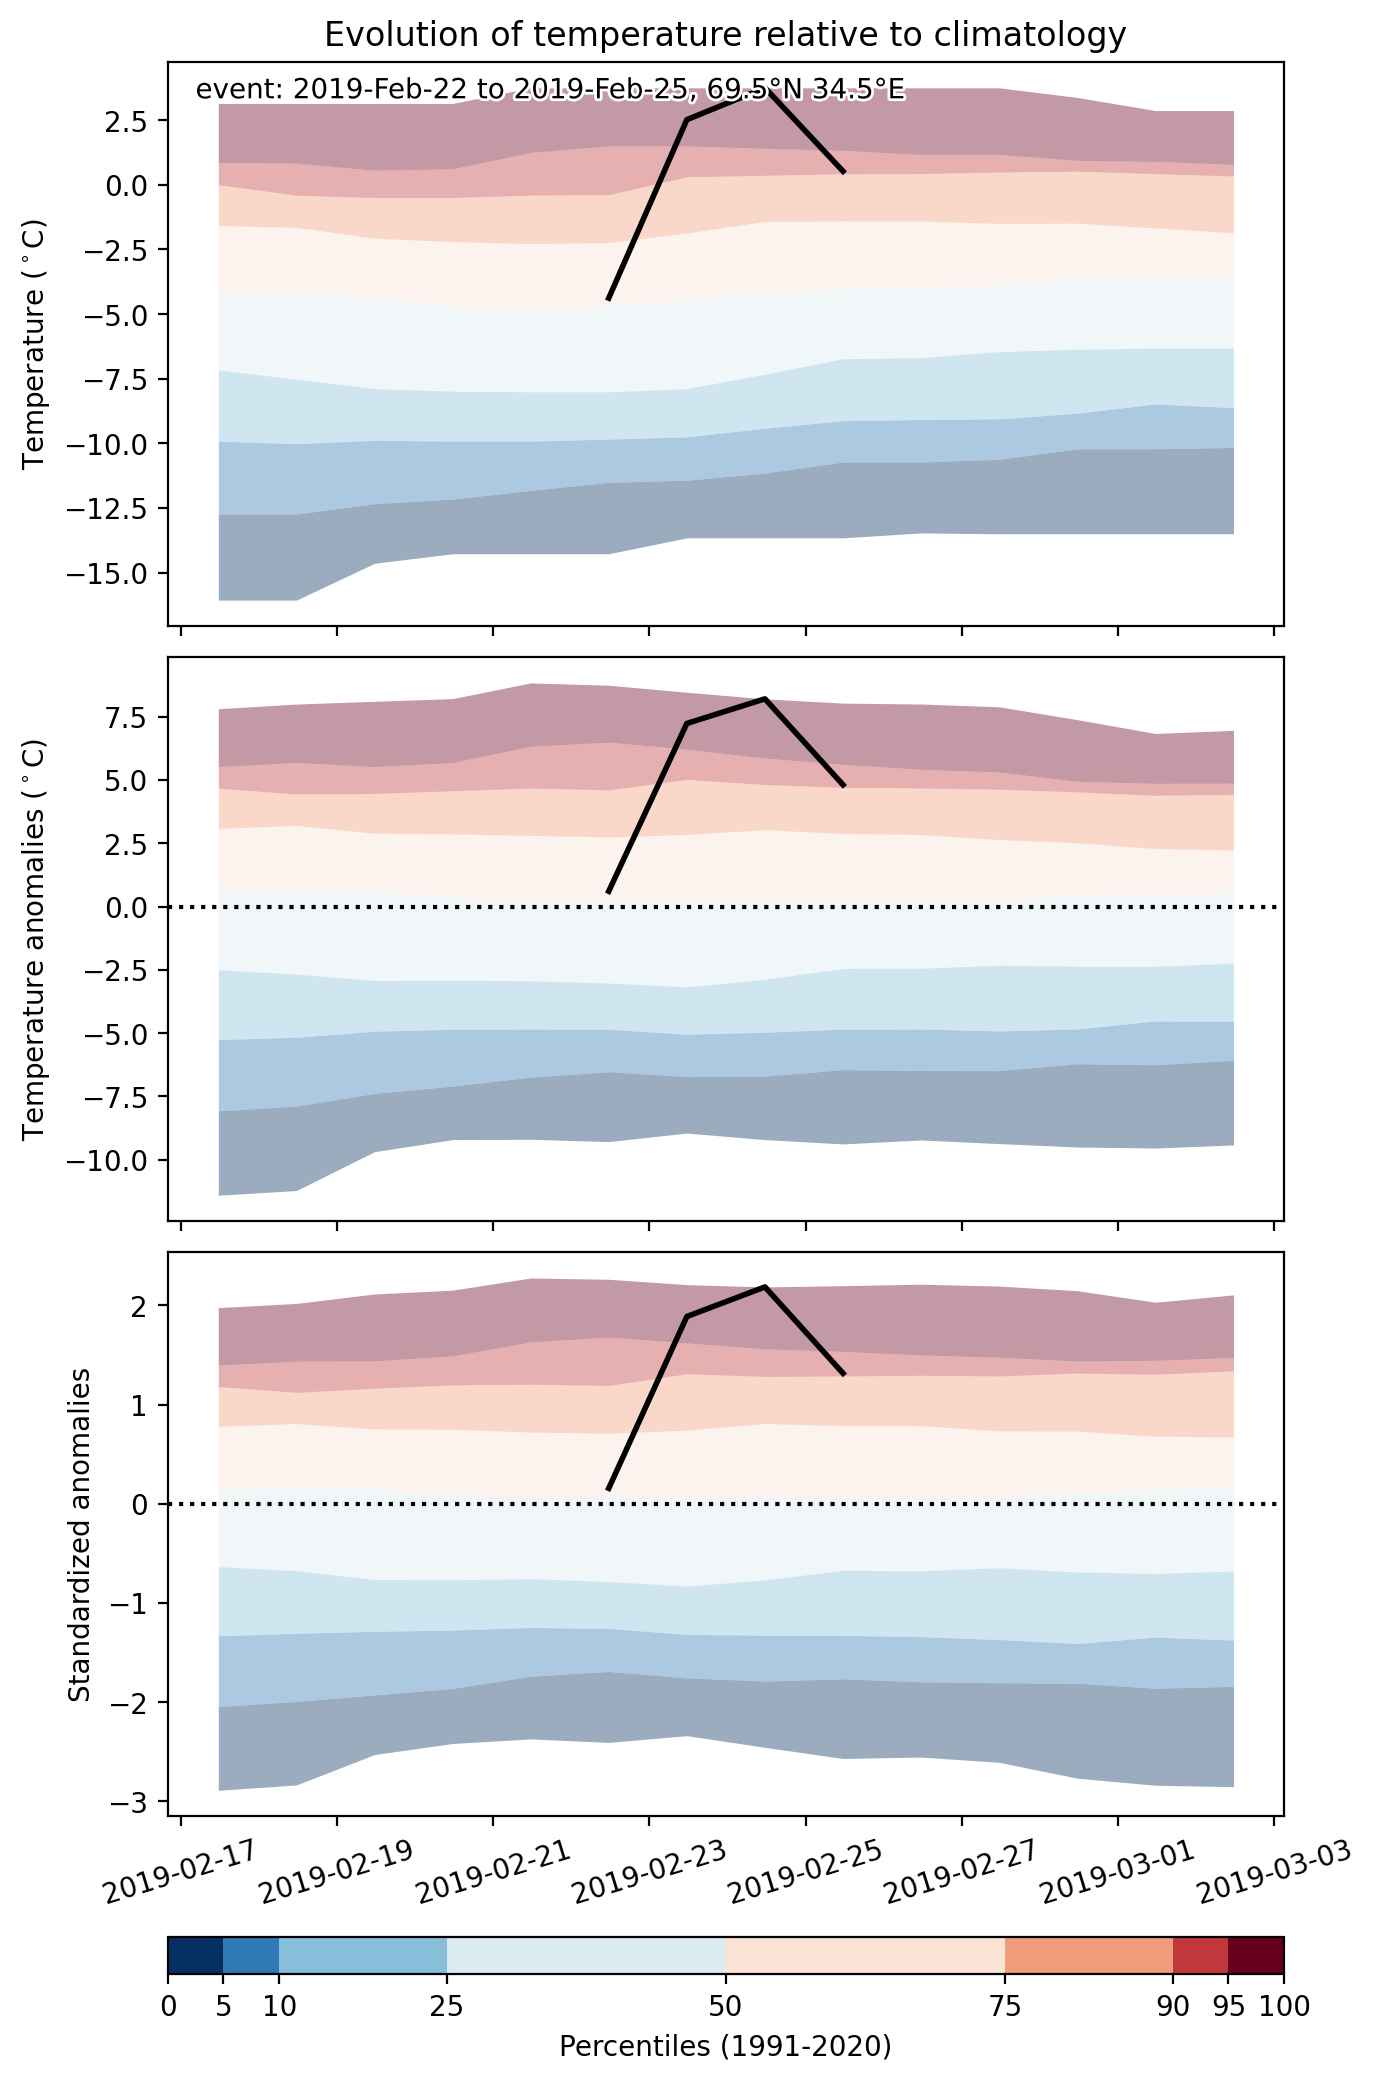
Fig. 2: Evolution of temperature at the center of the event. The climatological percentile distribution is illustrated with color shadings.


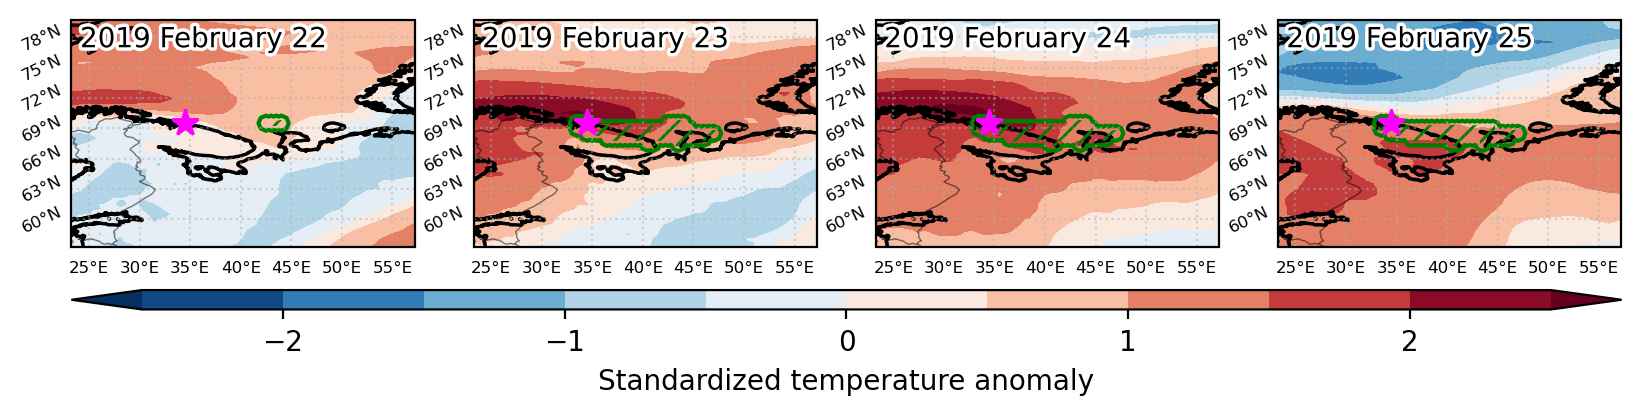
Fig. 3: Maps illustrating the evolution of standardized temperature anomalies during the event.

Event ID: Heat_wave_2019-Feb-22_to_2019-Feb-25_34.5_69.5

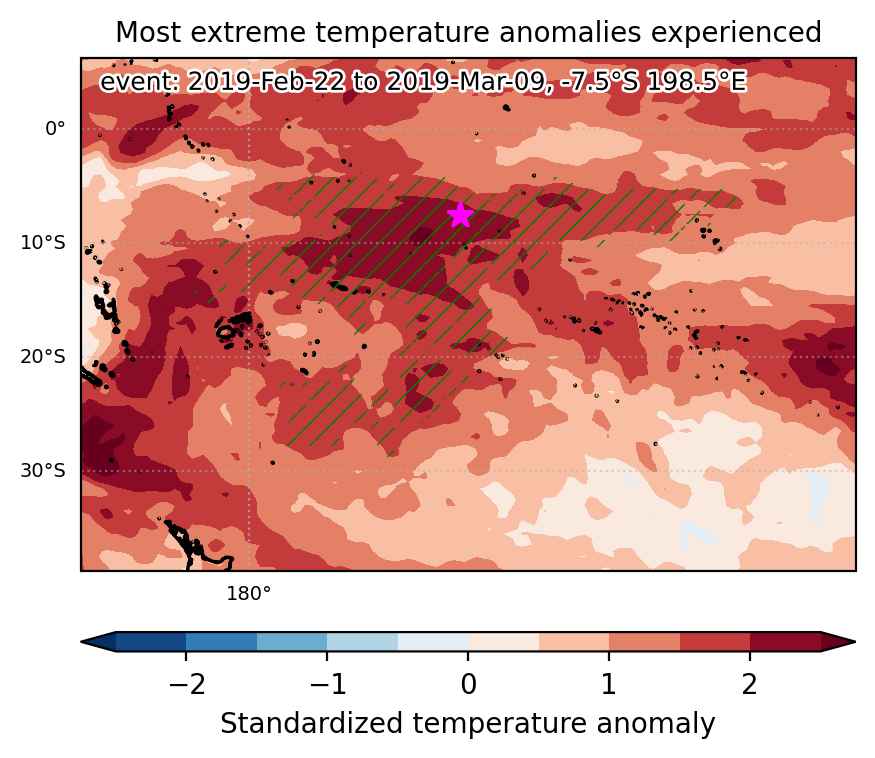
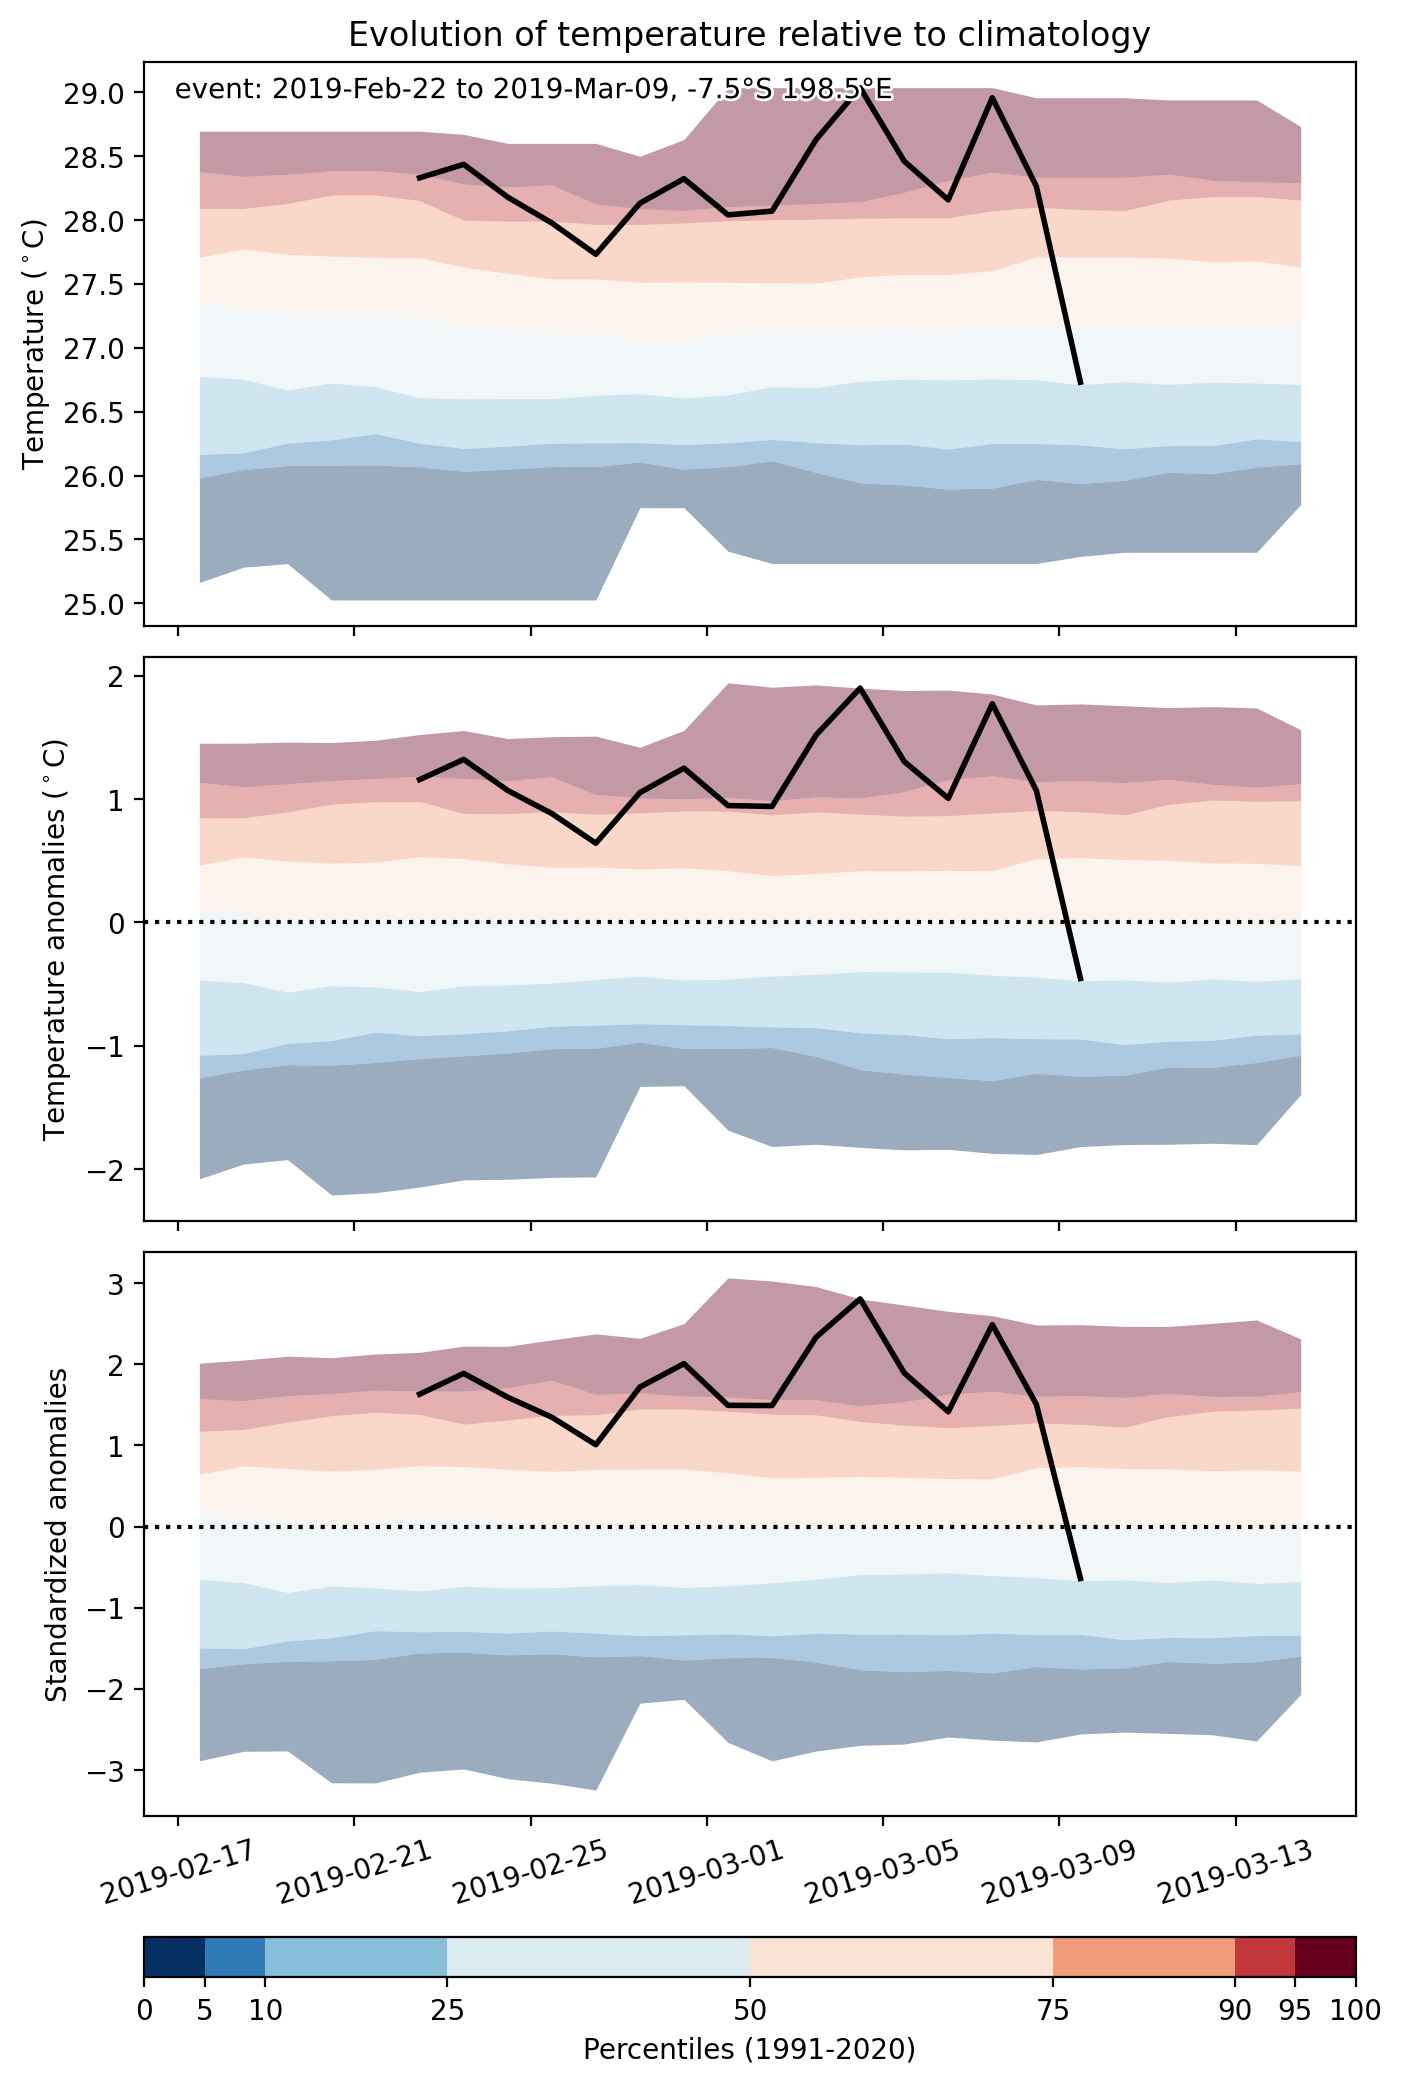
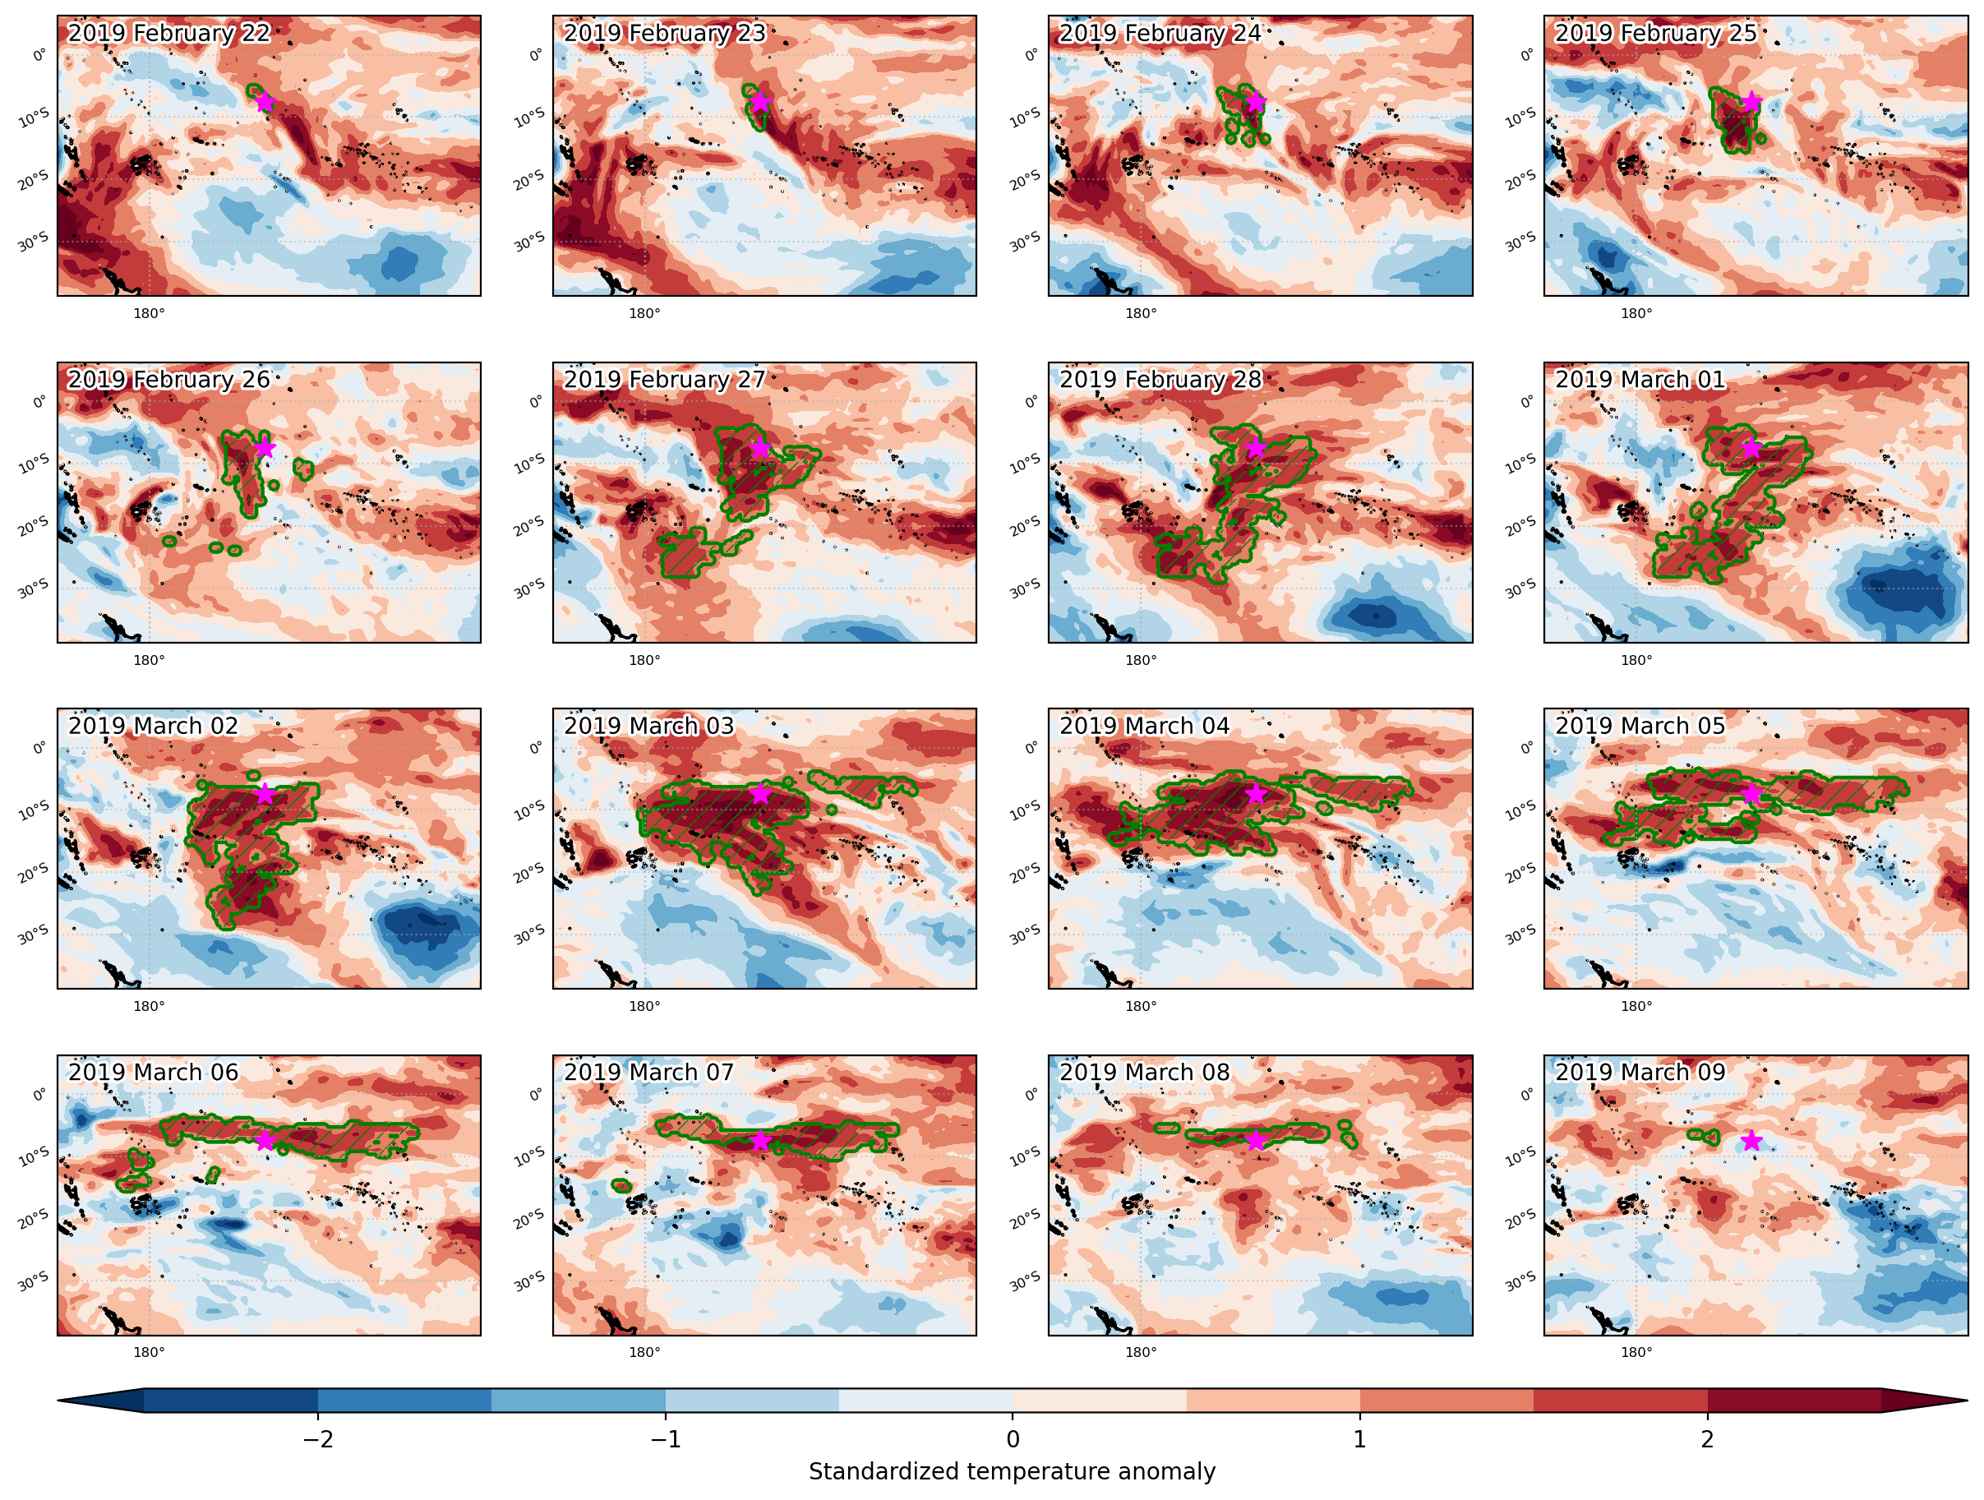
Heat wave occuring from February 22 2019 to March 09 2019 at -7.5°S 198.5°E

Download data: JSON

Event type: Heat wave

Countries affected (identified with ArcGIS Online; provided only for geographical reference):

  • Samoa

Duration: 16 days

Time span: February 22 2019 to March 09 2019

Statistics over entire affected area:

  • Mean temperature anomaly: 1.2 °C
  • Mean temperature: 28.1 °C
  • Maximum temperature anomaly: 2.4 °C
  • Maximum temperature: 29.1 °C

Event center: -7.5°S 198.5°E

Area affected: 4627119 km$^2$


Fig. 1: Map of most extreme temperature anomalies (standardized) experienced during the event. The purple star indicates the center of the extreme event. Green hatching illustrates all areas under the effect of extremes at some time during the event.


Fig. 2: Evolution of temperature at the center of the event. The climatological percentile distribution is illustrated with color shadings.


Fig. 3: Maps illustrating the evolution of standardized temperature anomalies during the event.

Event ID: Heat_wave_2019-Feb-22_to_2019-Mar-09_198.5_-7.5

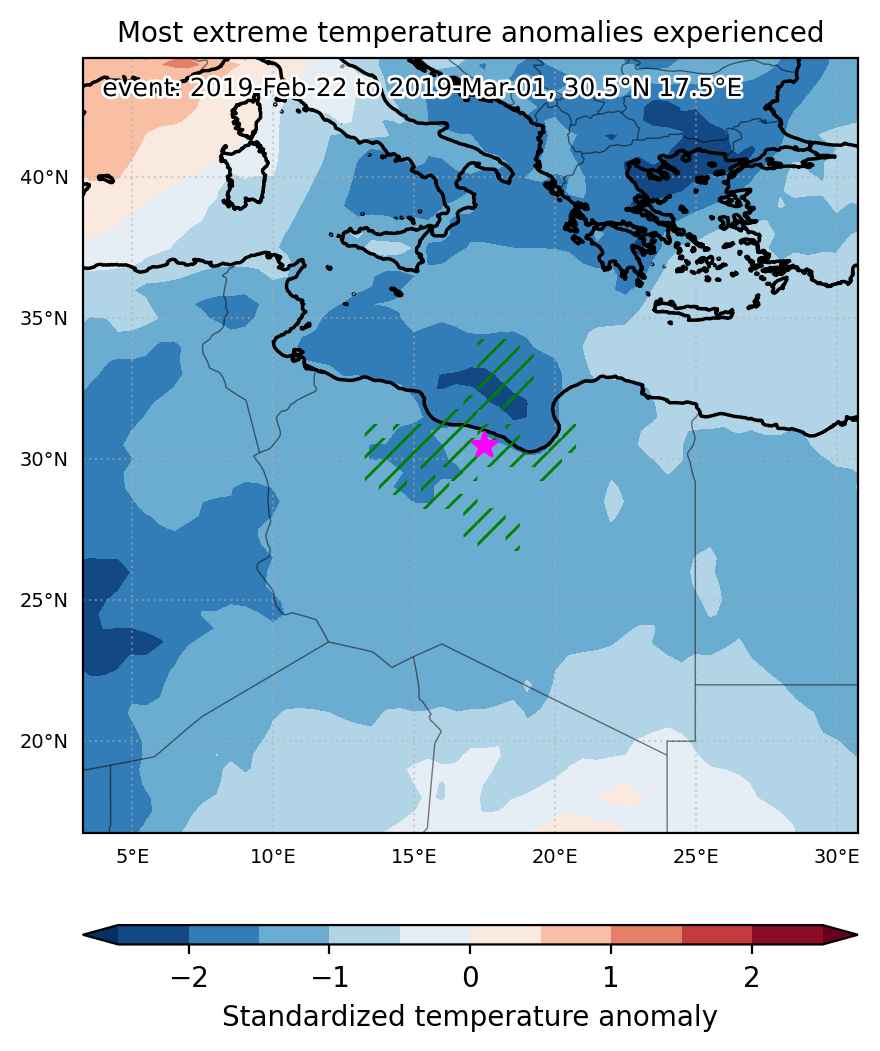
Cold spell occuring from February 22 2019 to March 01 2019 at 30.5°N 17.5°E

Download data: JSON

Event type: Cold spell

Countries affected (identified with ArcGIS Online; provided only for geographical reference):

  • Libya

Duration: 8 days

Time span: February 22 2019 to March 01 2019

Statistics over entire affected area:

  • Mean temperature anomaly: -4.2 °C
  • Mean temperature: 10.7 °C
  • Minimum temperature anomaly: -6.5 °C
  • Minimum temperature: 7.0 °C

Event center: 30.5°N 17.5°E

Area affected: 221001 km$^2$


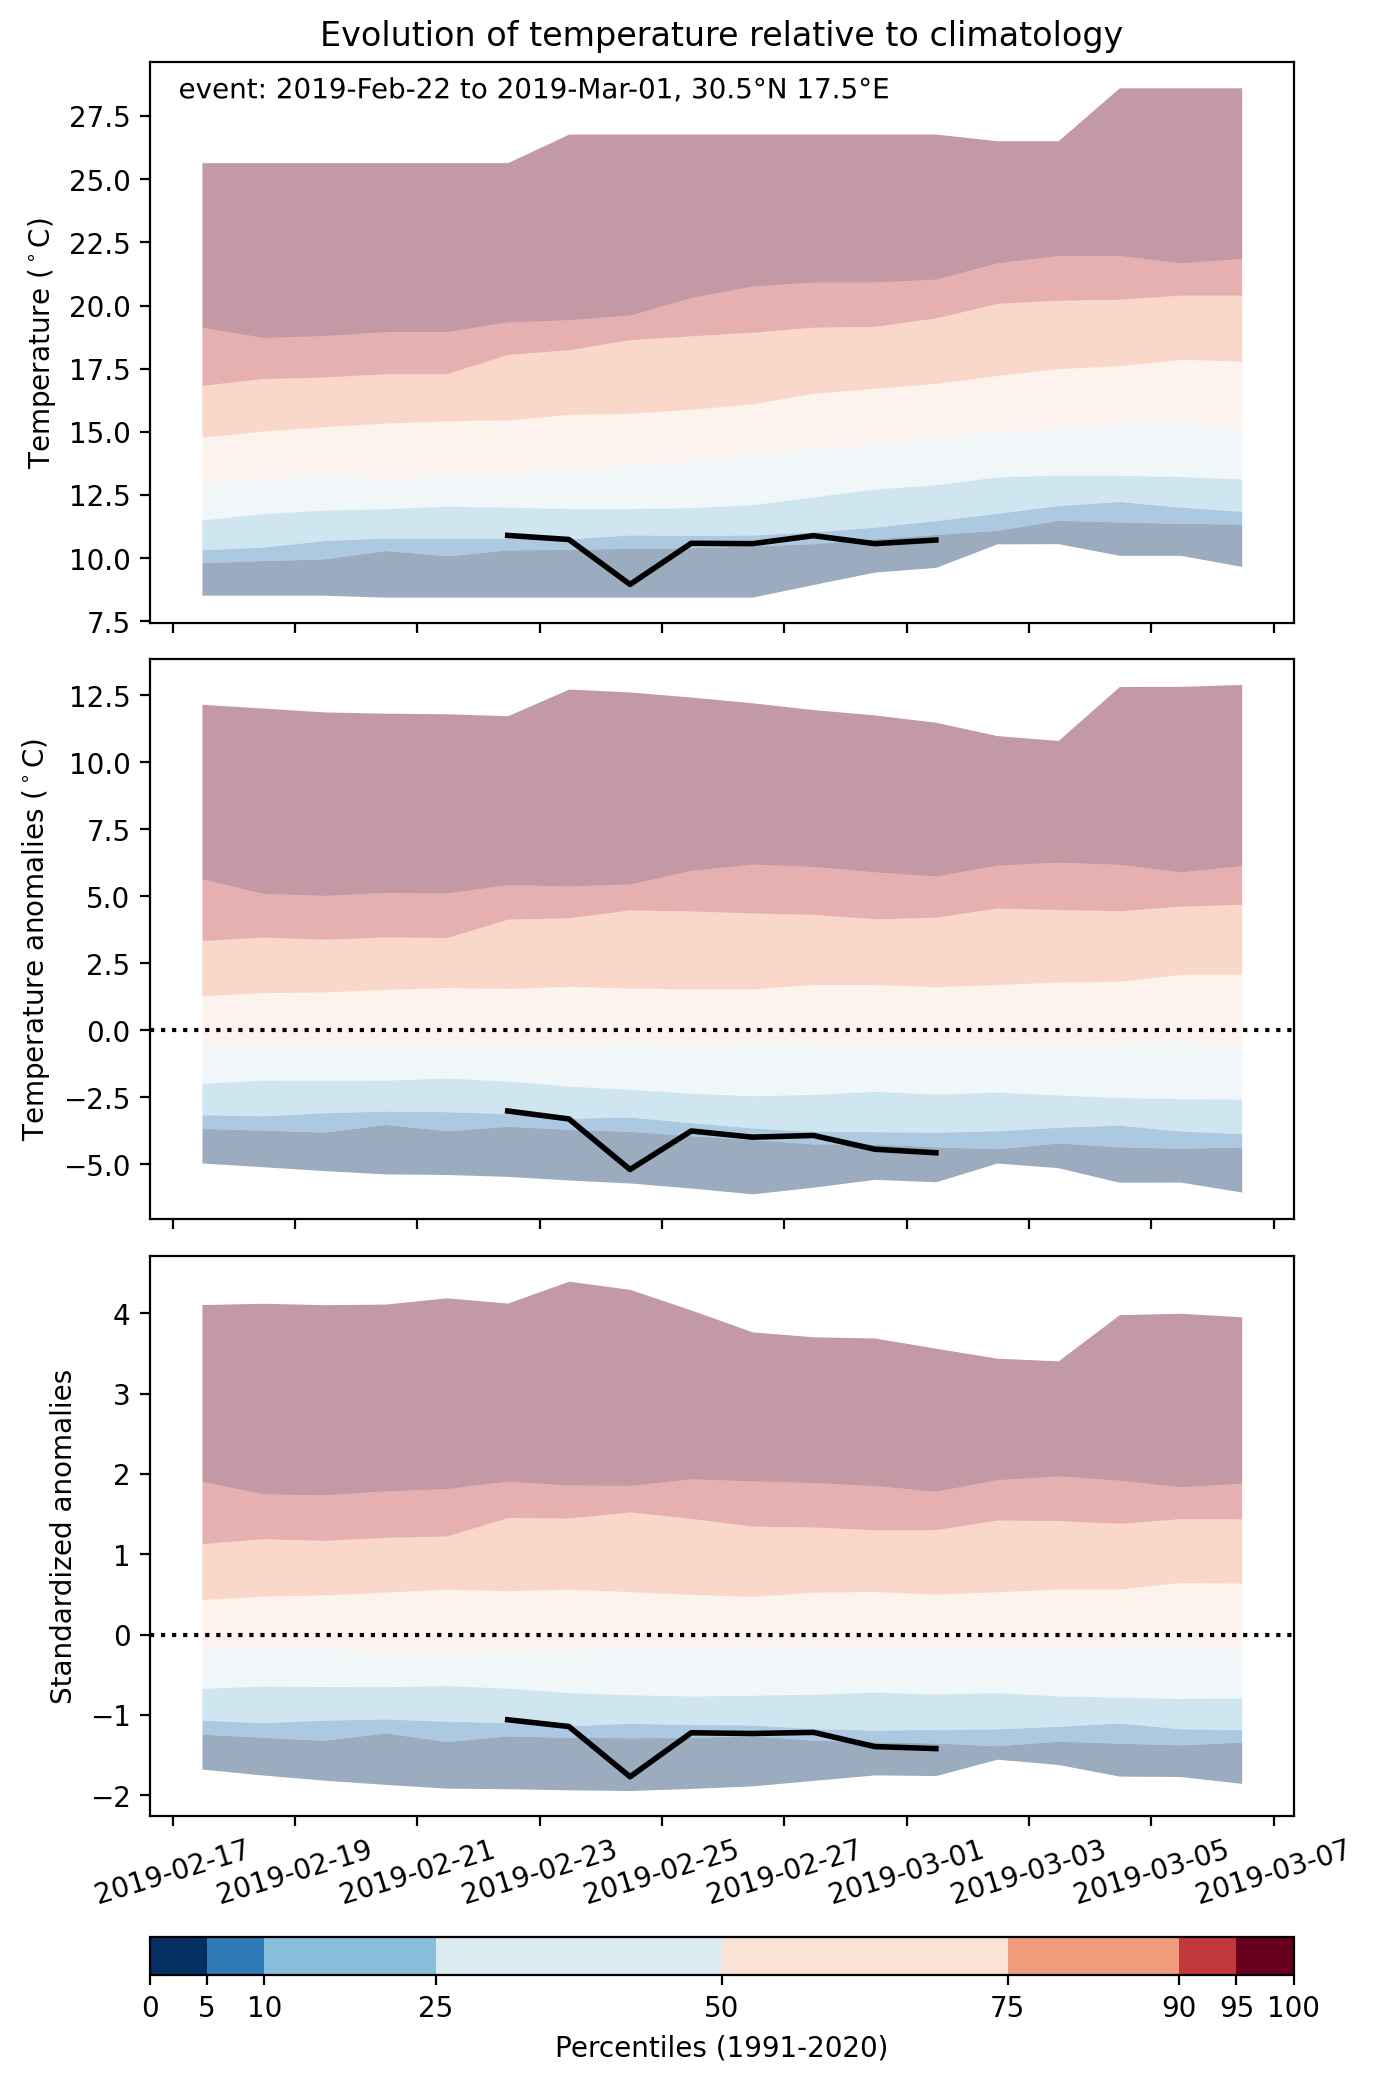
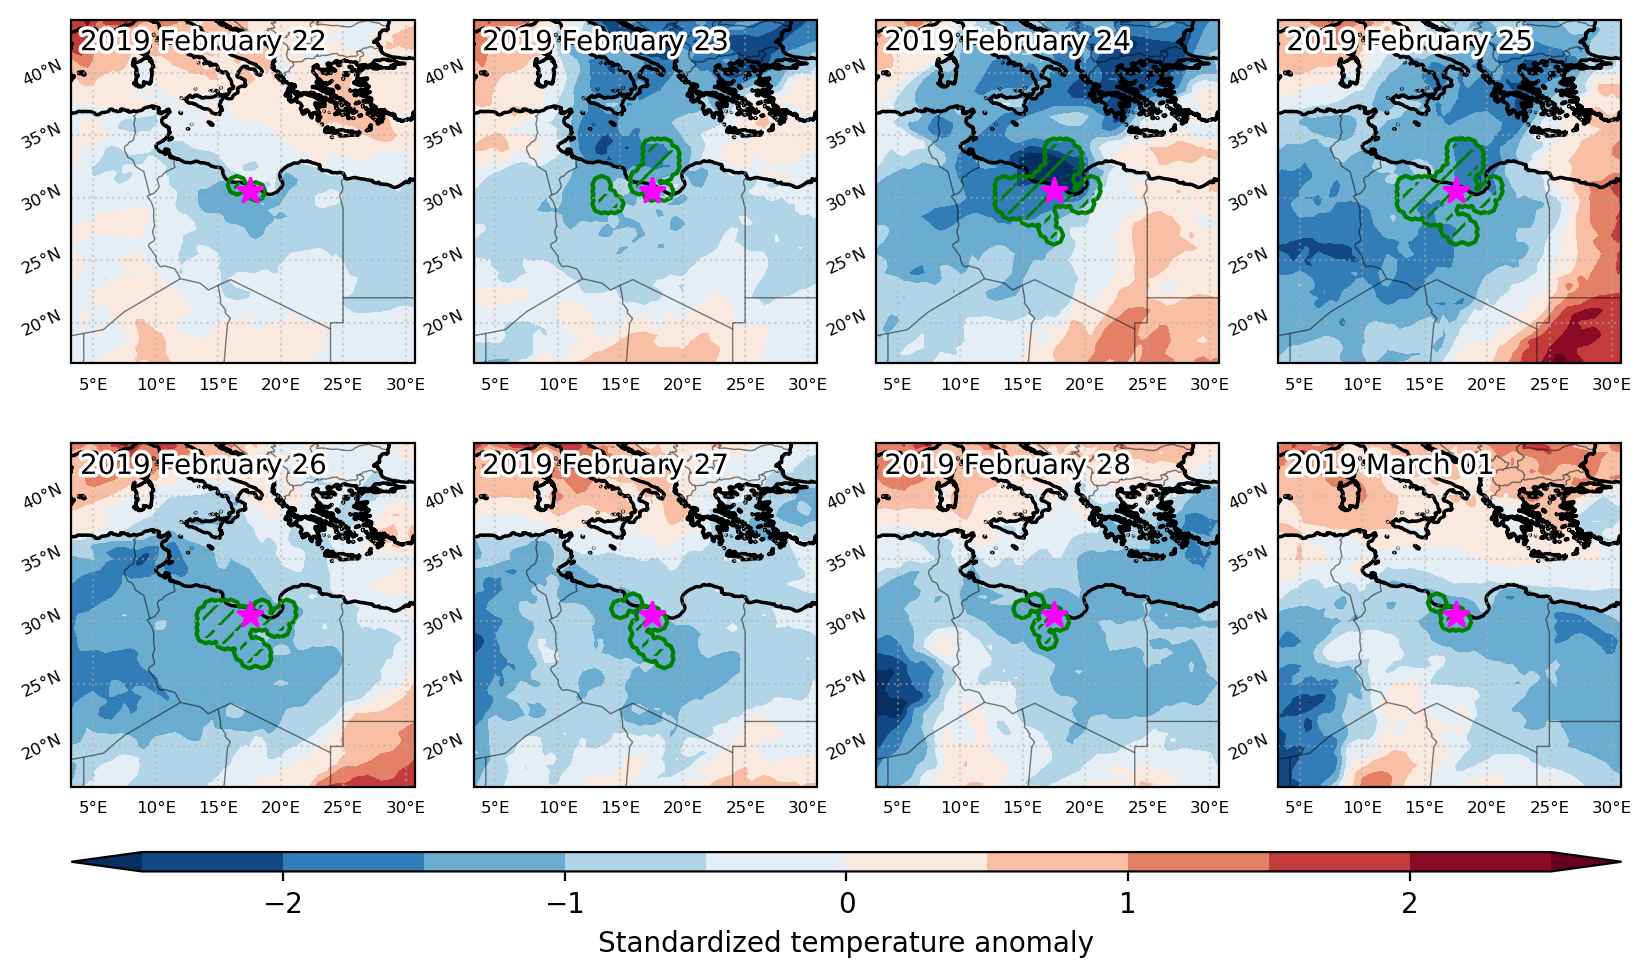
Fig. 1: Map of most extreme temperature anomalies (standardized) experienced during the event. The purple star indicates the center of the extreme event. Green hatching illustrates all areas under the effect of extremes at some time during the event.


Fig. 2: Evolution of temperature at the center of the event. The climatological percentile distribution is illustrated with color shadings.


Fig. 3: Maps illustrating the evolution of standardized temperature anomalies during the event.

Event ID: Cold_spell_2019-Feb-22_to_2019-Mar-01_17.5_30.5