Heat wave occuring from February 11 2019 to February 14 2019 at 12.0°N 54.0°E

Download data: JSON

Event type: Heat wave

Countries affected (identified with ArcGIS Online; provided only for geographical reference):

  • Yemen

Duration: 4 days

Time span: February 11 2019 to February 14 2019

Statistics over entire affected area:

  • Mean temperature anomaly: 1.0 °C
  • Mean temperature: 25.6 °C
  • Maximum temperature anomaly: 1.6 °C
  • Maximum temperature: 26.5 °C

Event center: 12.0°N 54.0°E

Area affected: 54487 km$^2$
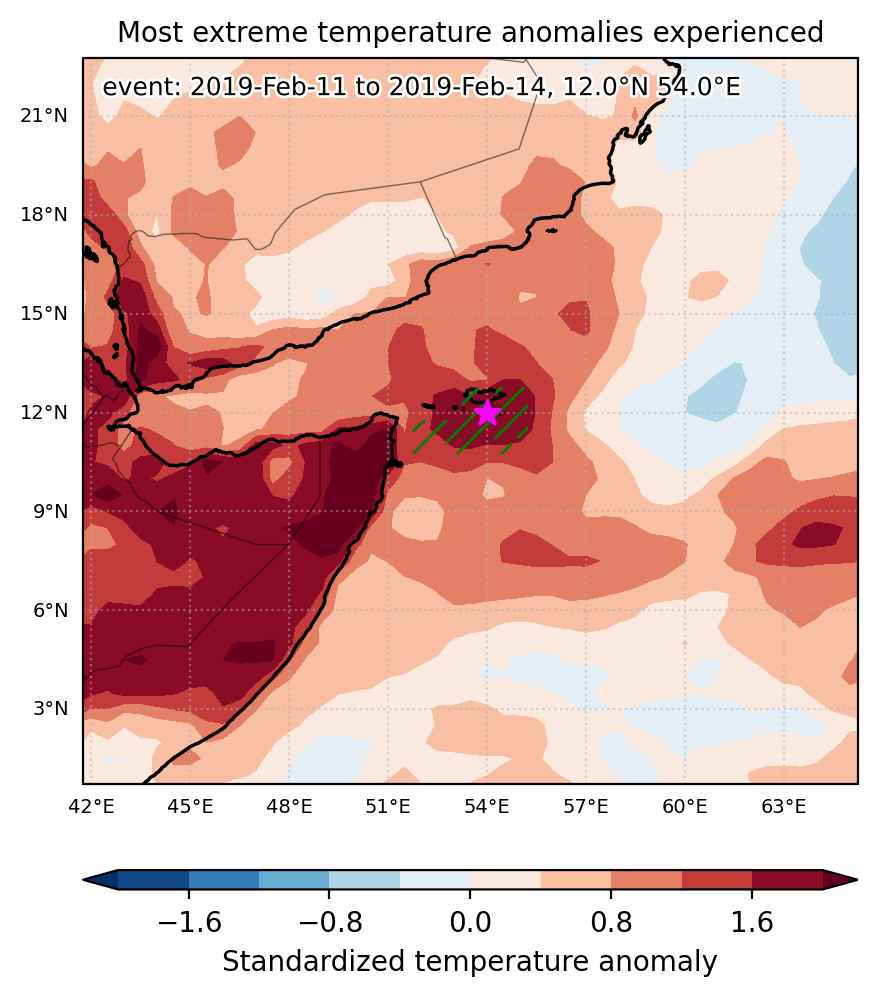

Fig. 1: Map of most extreme temperature anomalies (standardized) experienced during the event. The purple star indicates the center of the extreme event. Green hatching illustrates all areas under the effect of extremes at some time during the event.
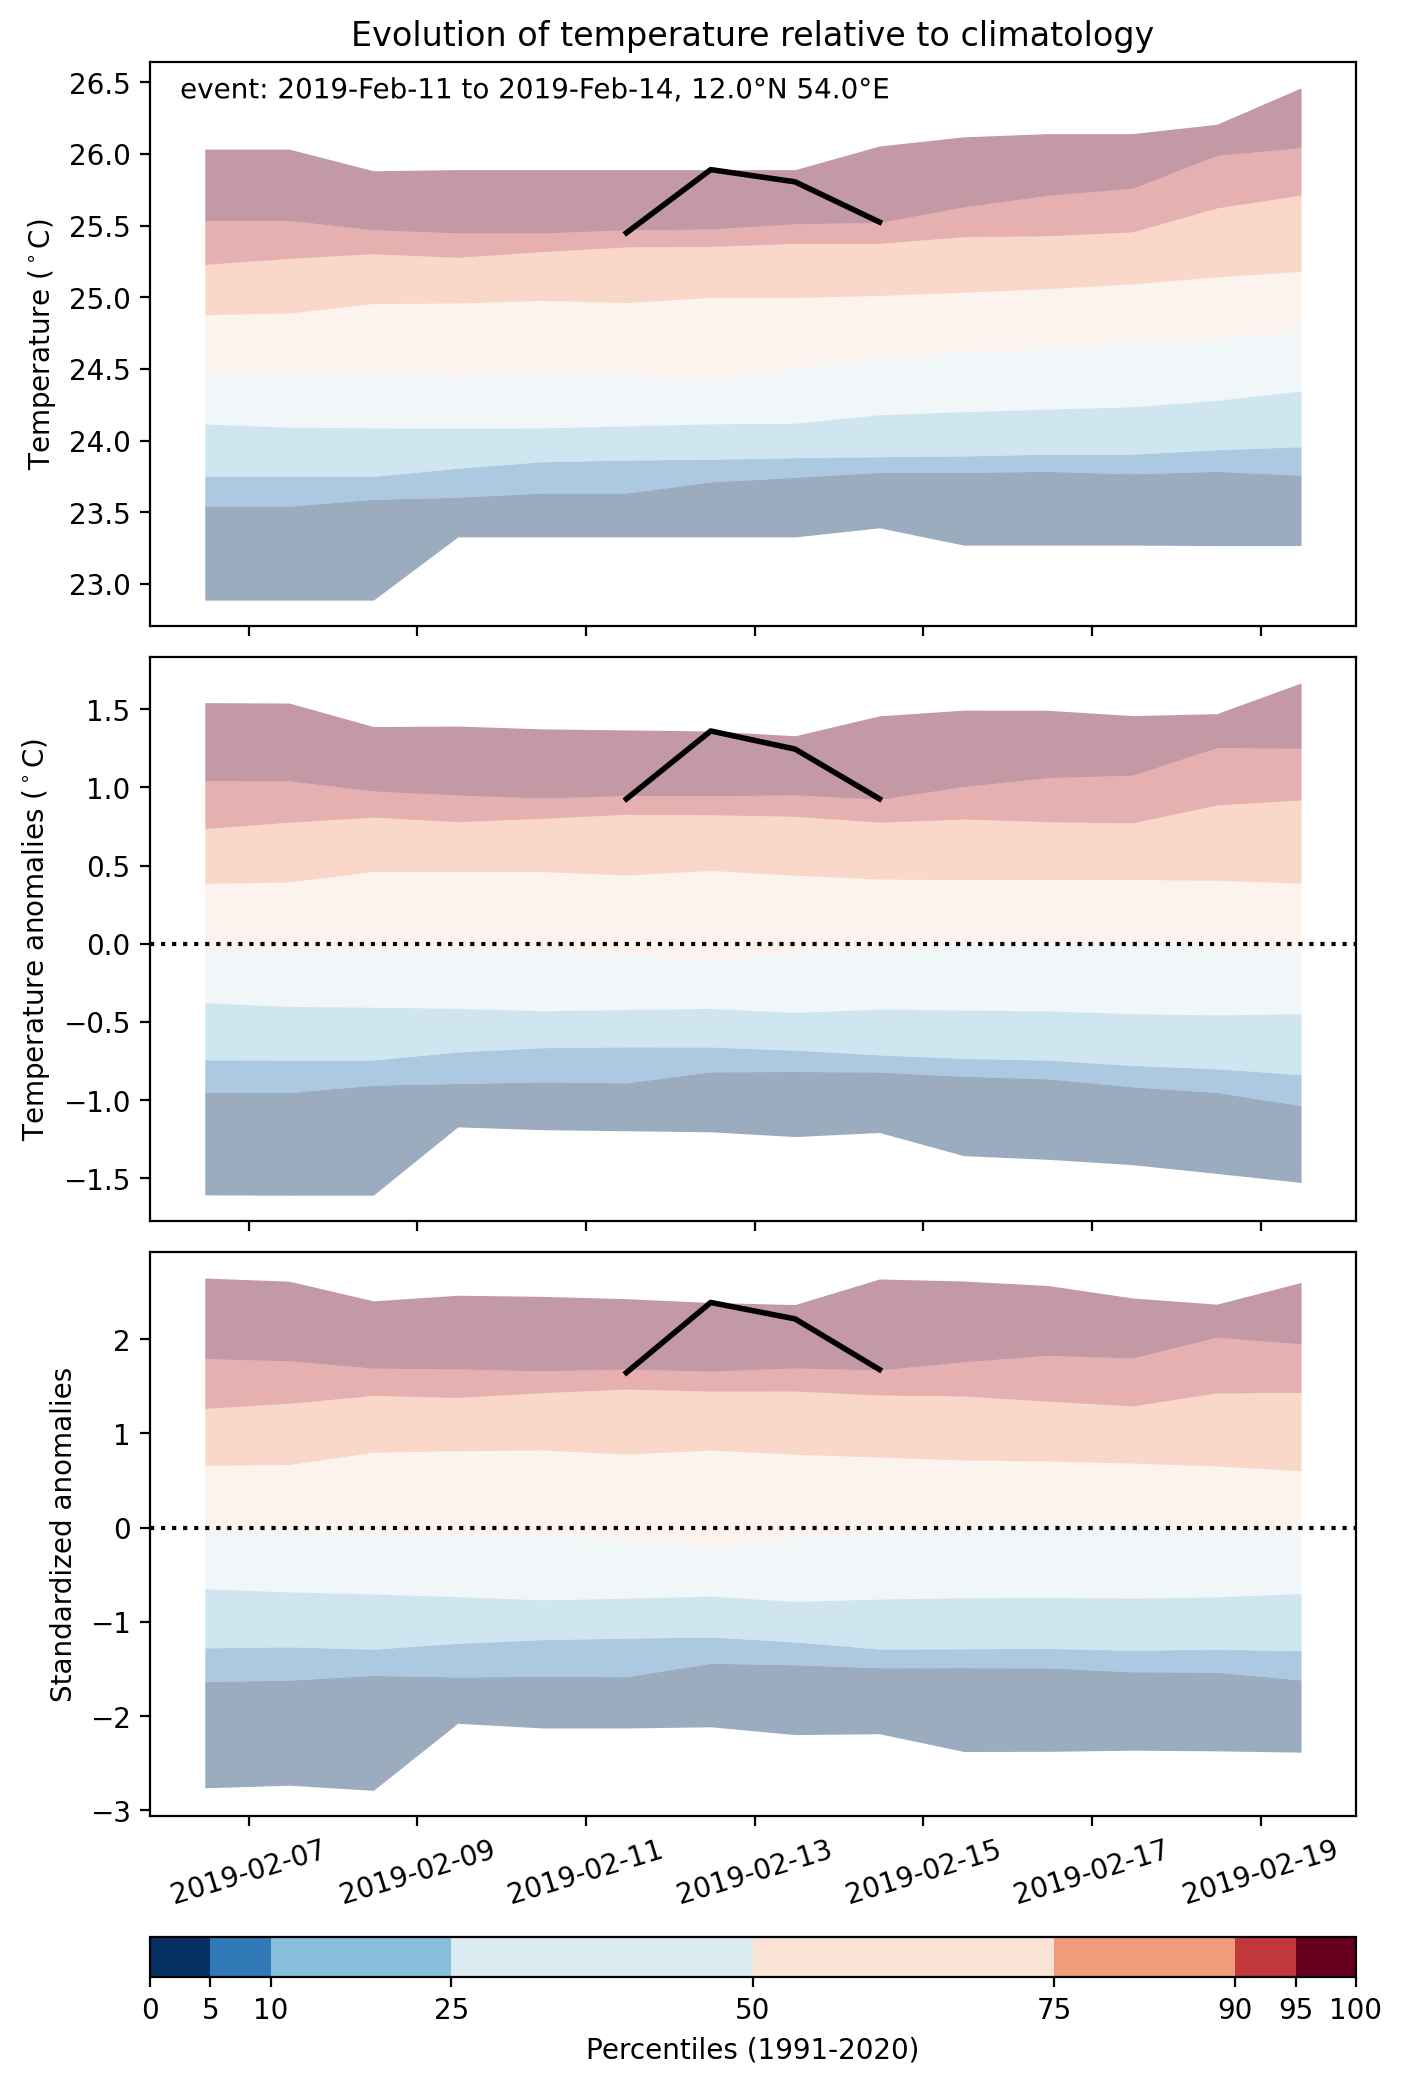


Fig. 2: Evolution of temperature at the center of the event. The climatological percentile distribution is illustrated with color shadings.
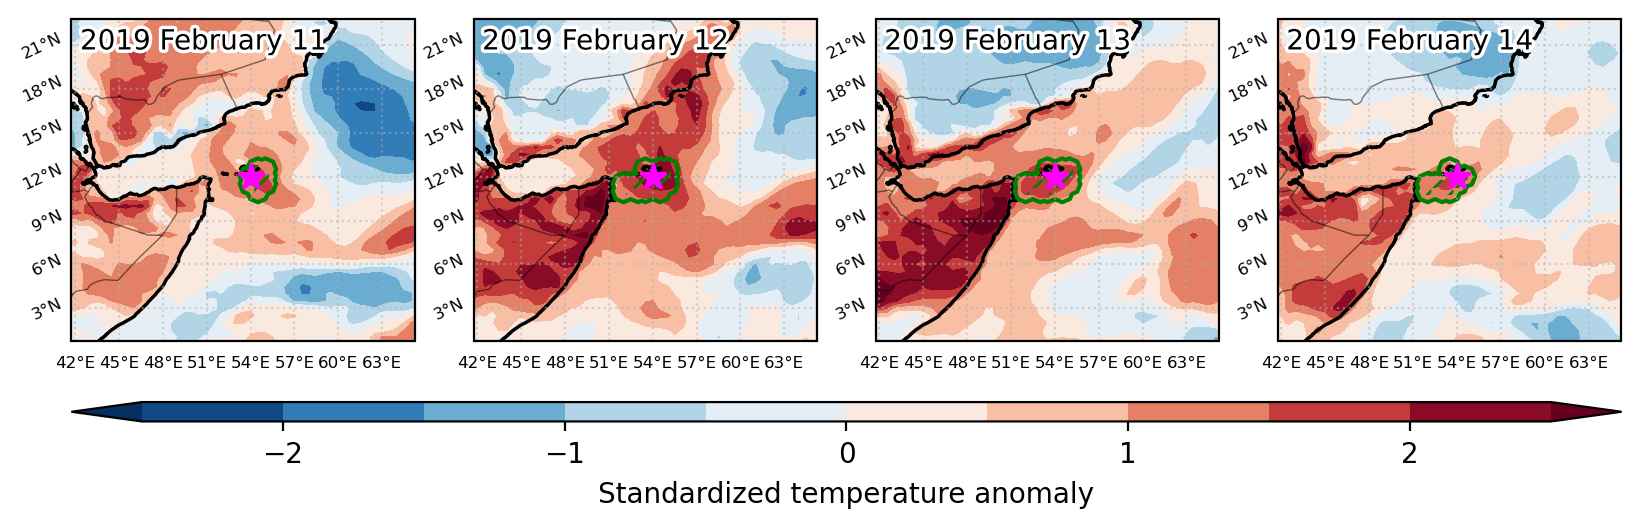


Fig. 3: Maps illustrating the evolution of standardized temperature anomalies during the event.

Event ID: Heat_wave_2019-Feb-11_to_2019-Feb-14_54.0_12.0
Heat wave occuring from February 11 2019 to February 18 2019 at 3.0°N 325.5°E

Download data: JSON

Event type: Heat wave

Countries affected (identified with ArcGIS Online; provided only for geographical reference):

  • Brazil
  • French Guiana

Duration: 8 days

Time span: February 11 2019 to February 18 2019

Statistics over entire affected area:

  • Mean temperature anomaly: 0.9 °C
  • Mean temperature: 26.8 °C
  • Maximum temperature anomaly: 2.0 °C
  • Maximum temperature: 27.4 °C

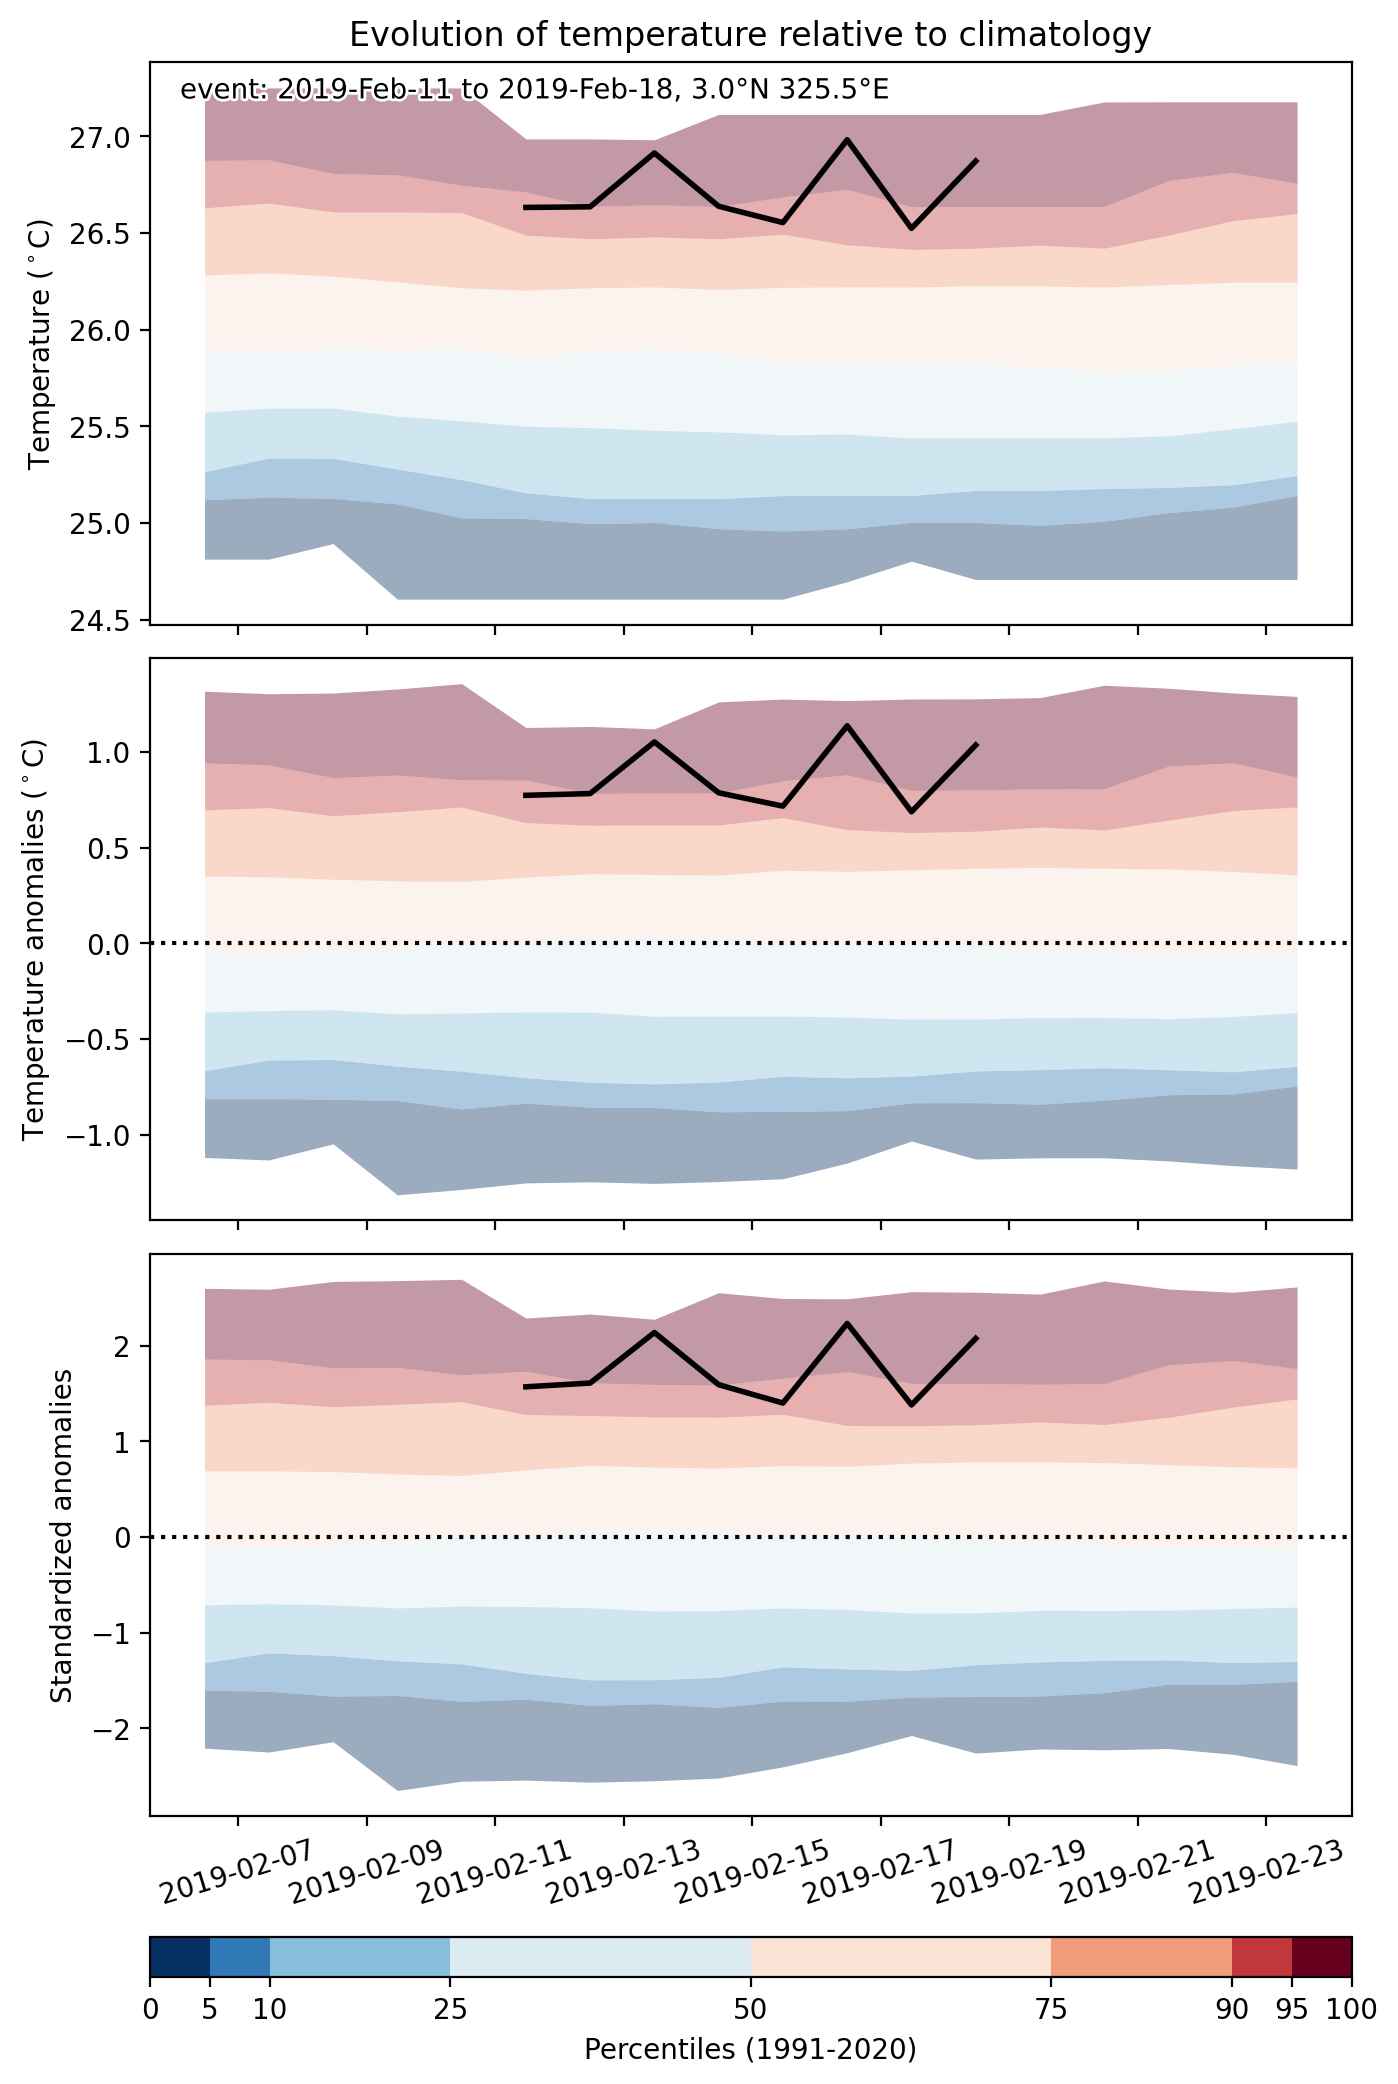
Event center: 3.0°N 325.5°E

Area affected: 688775 km$^2$


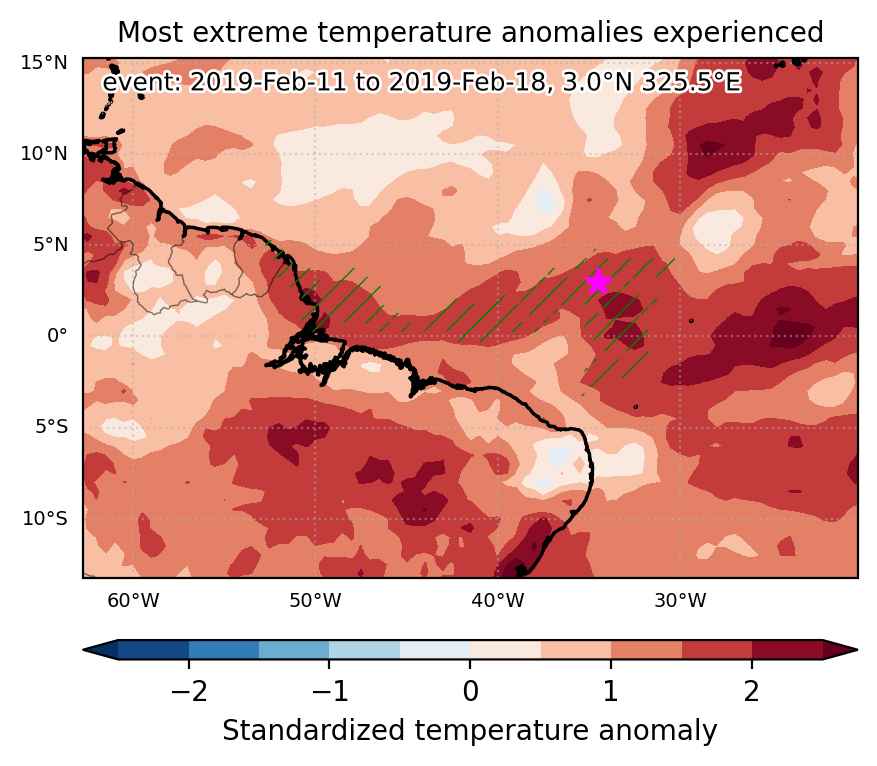
Fig. 1: Map of most extreme temperature anomalies (standardized) experienced during the event. The purple star indicates the center of the extreme event. Green hatching illustrates all areas under the effect of extremes at some time during the event.


Fig. 2: Evolution of temperature at the center of the event. The climatological percentile distribution is illustrated with color shadings.


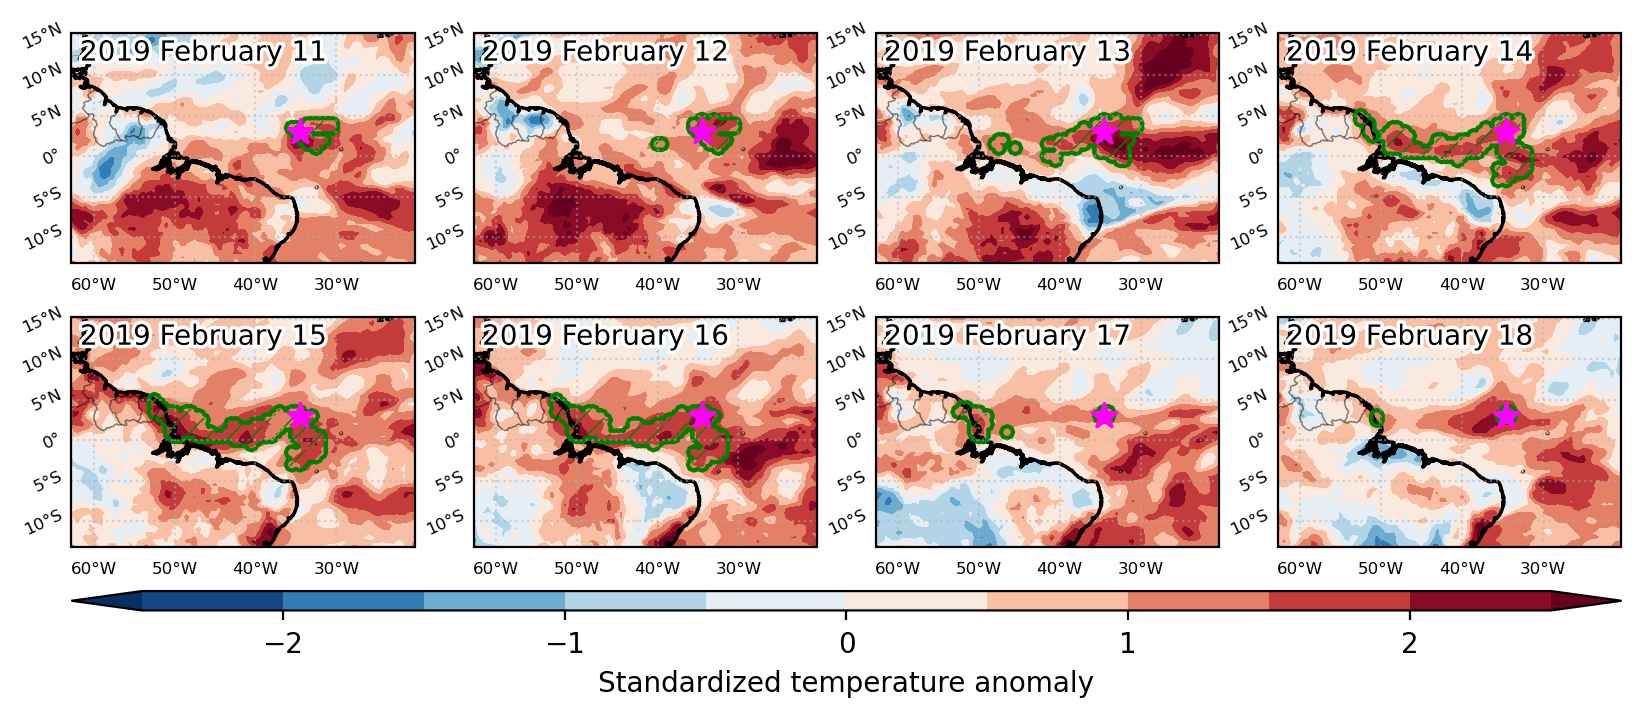
Fig. 3: Maps illustrating the evolution of standardized temperature anomalies during the event.

Event ID: Heat_wave_2019-Feb-11_to_2019-Feb-18_325.5_3.0

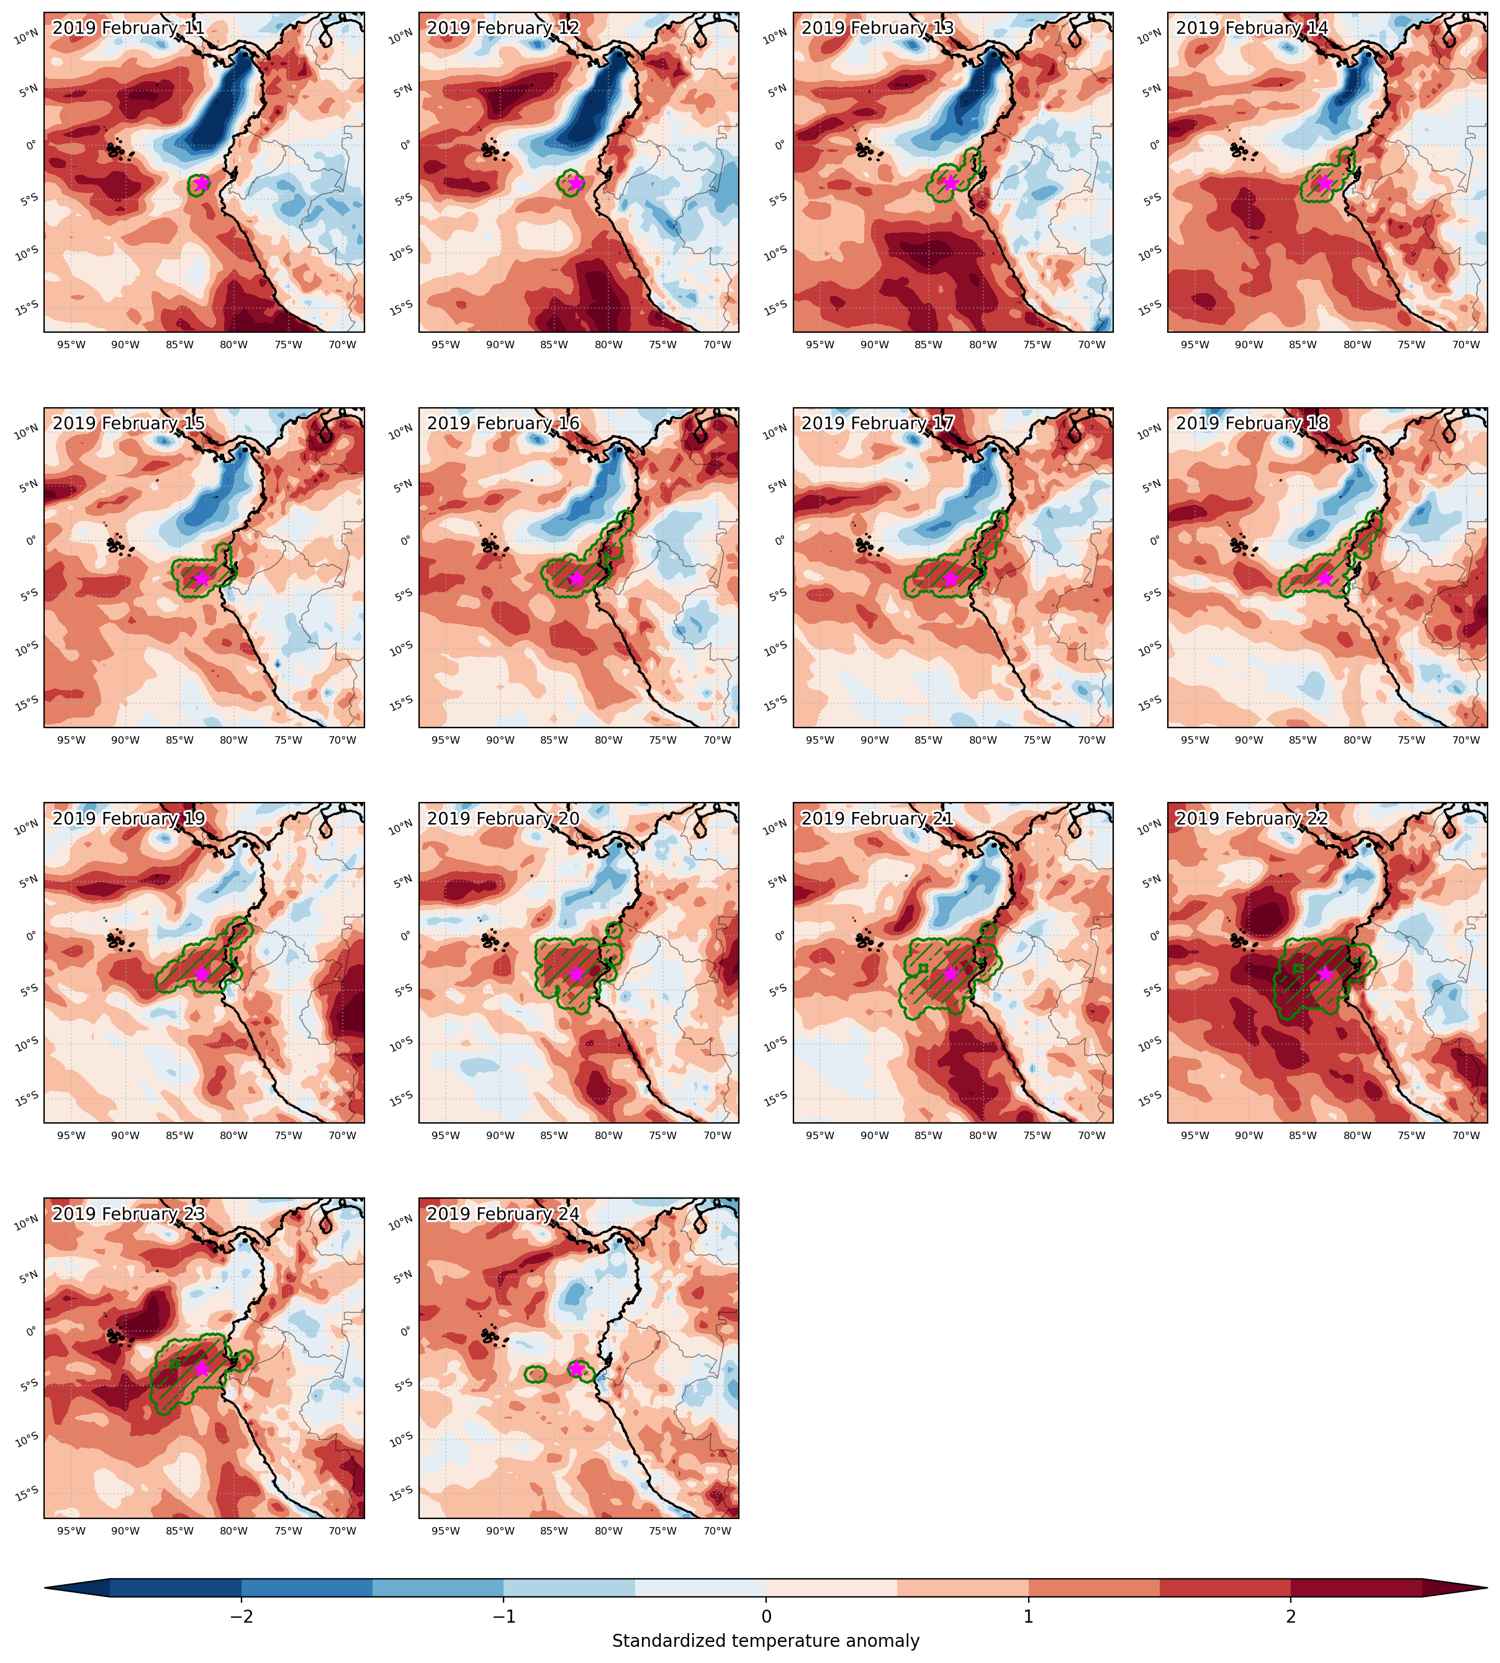
Heat wave occuring from February 11 2019 to February 24 2019 at -3.5°S 277.0°E

Download data: JSON

Event type: Heat wave

Countries affected (identified with ArcGIS Online; provided only for geographical reference):

  • Colombia
  • Ecuador

Duration: 14 days

Time span: February 11 2019 to February 24 2019

Statistics over entire affected area:

  • Mean temperature anomaly: 1.5 °C
  • Mean temperature: 26.6 °C
  • Maximum temperature anomaly: 2.2 °C
  • Maximum temperature: 27.7 °C

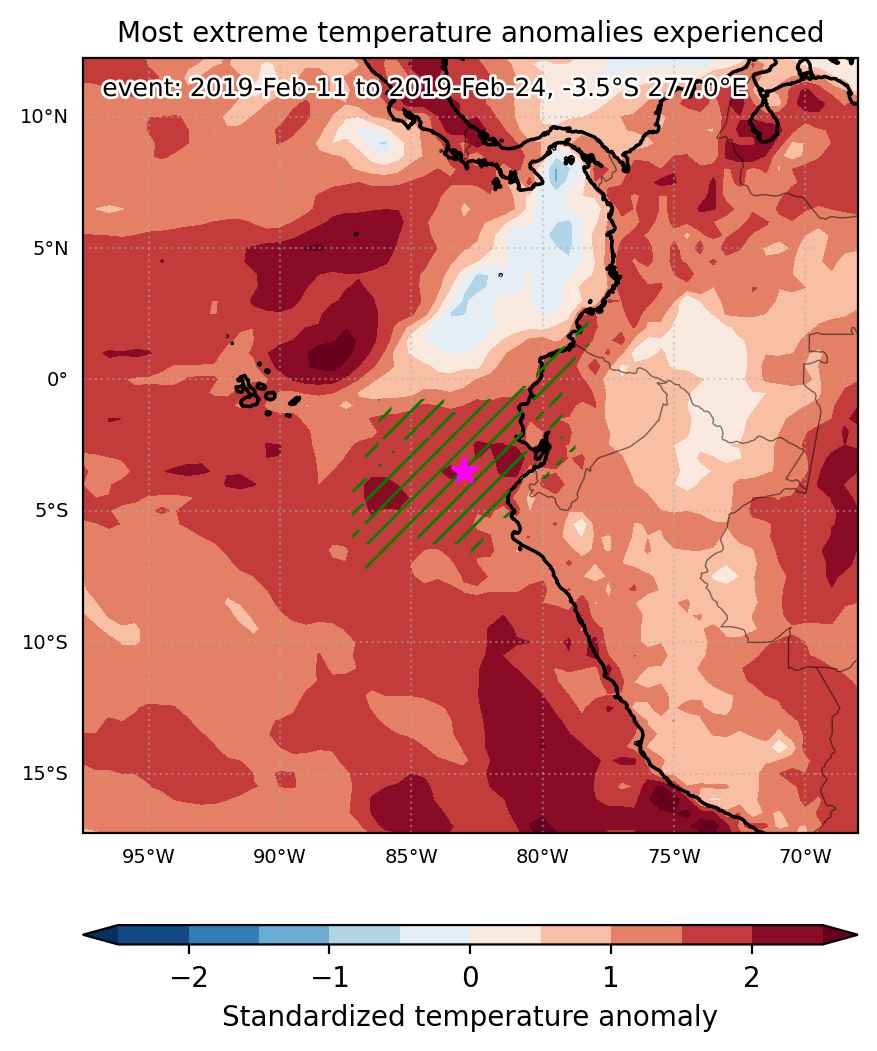
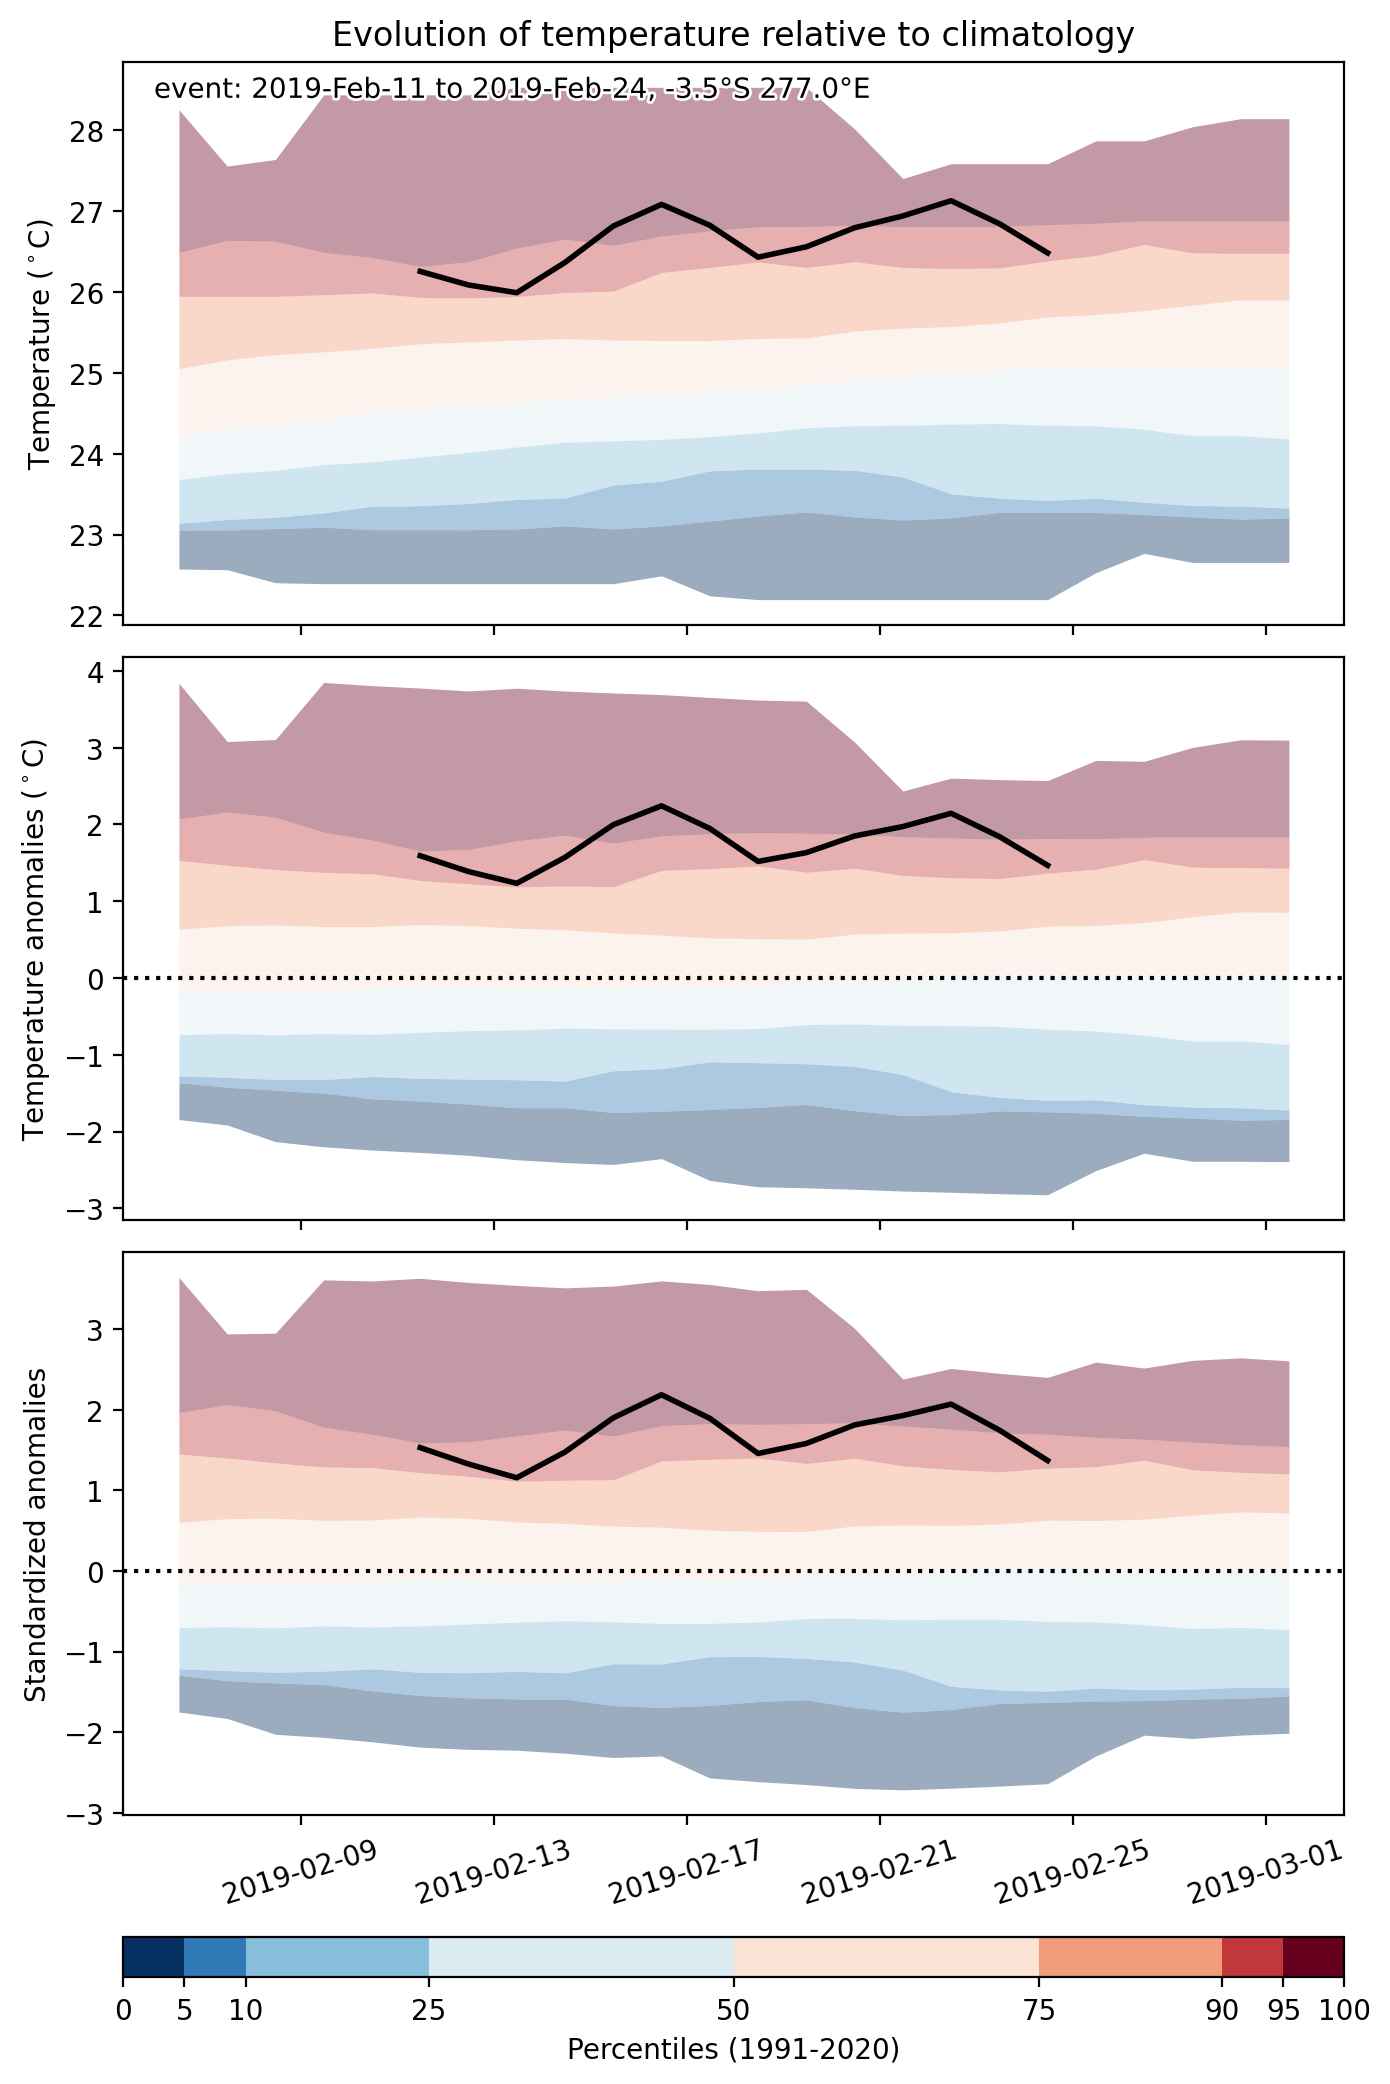
Event center: -3.5°S 277.0°E

Area affected: 425689 km$^2$


Fig. 1: Map of most extreme temperature anomalies (standardized) experienced during the event. The purple star indicates the center of the extreme event. Green hatching illustrates all areas under the effect of extremes at some time during the event.


Fig. 2: Evolution of temperature at the center of the event. The climatological percentile distribution is illustrated with color shadings.


Fig. 3: Maps illustrating the evolution of standardized temperature anomalies during the event.

Event ID: Heat_wave_2019-Feb-11_to_2019-Feb-24_277.0_-3.5

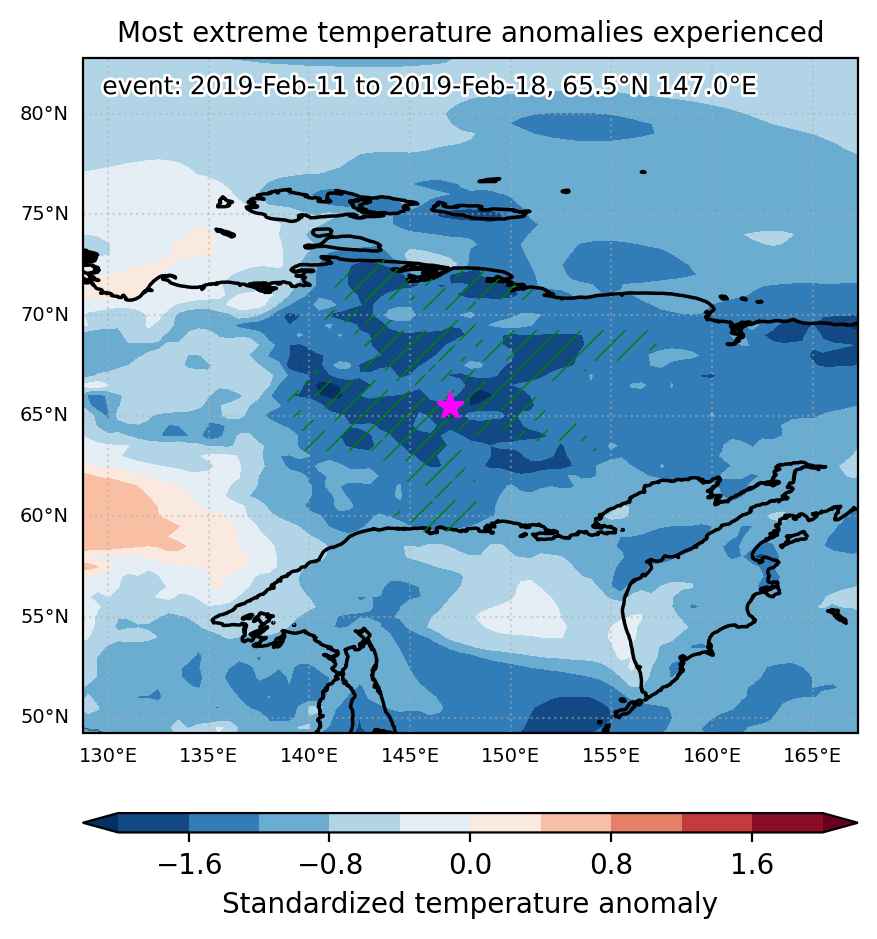
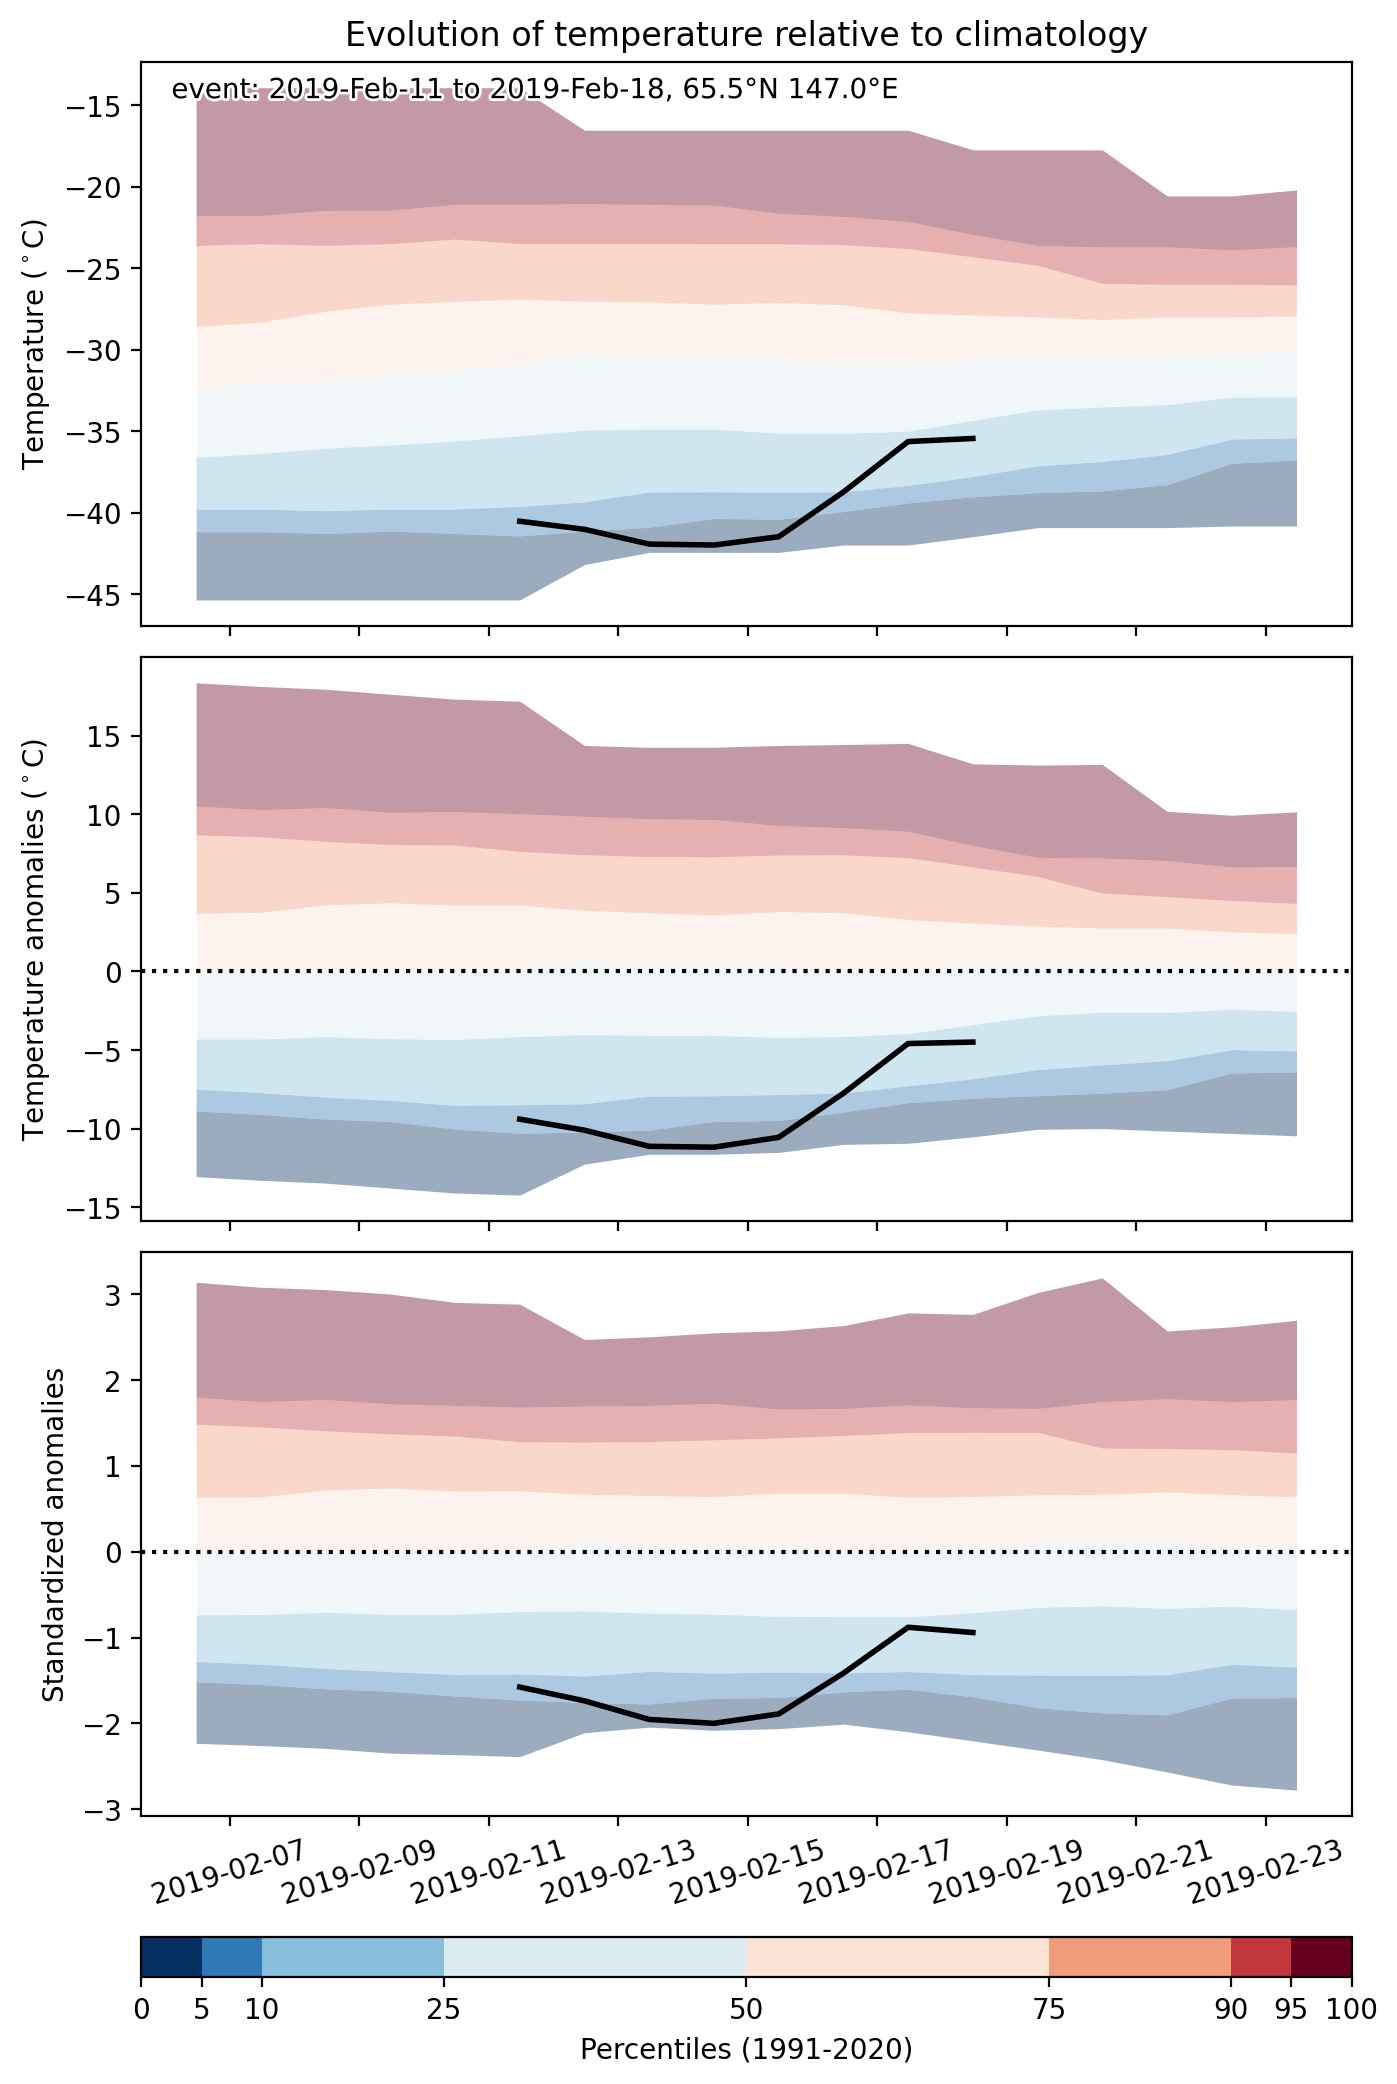
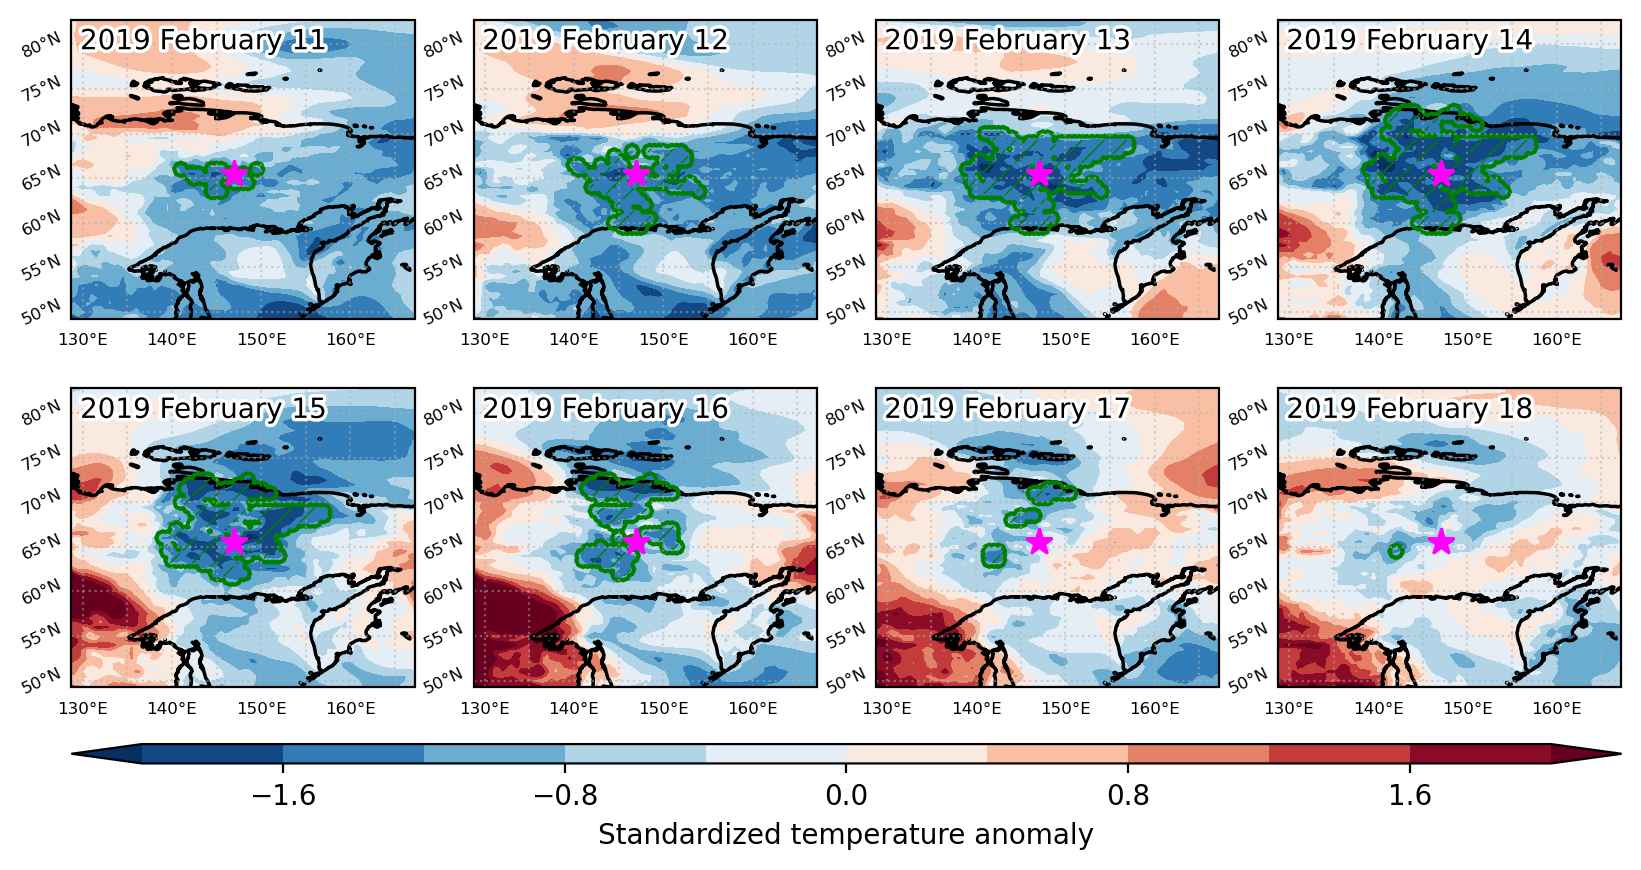
Cold spell occuring from February 11 2019 to February 18 2019 at 65.5°N 147.0°E

Download data: JSON

Event type: Cold spell

Countries affected (identified with ArcGIS Online; provided only for geographical reference):

  • Russian Federation

Duration: 8 days

Time span: February 11 2019 to February 18 2019

Statistics over entire affected area:

  • Mean temperature anomaly: -9.8 °C
  • Mean temperature: -42.3 °C
  • Minimum temperature anomaly: -14.3 °C
  • Minimum temperature: -49.6 °C

Event center: 65.5°N 147.0°E

Area affected: 427750 km$^2$


Fig. 1: Map of most extreme temperature anomalies (standardized) experienced during the event. The purple star indicates the center of the extreme event. Green hatching illustrates all areas under the effect of extremes at some time during the event.


Fig. 2: Evolution of temperature at the center of the event. The climatological percentile distribution is illustrated with color shadings.


Fig. 3: Maps illustrating the evolution of standardized temperature anomalies during the event.

Event ID: Cold_spell_2019-Feb-11_to_2019-Feb-18_147.0_65.5

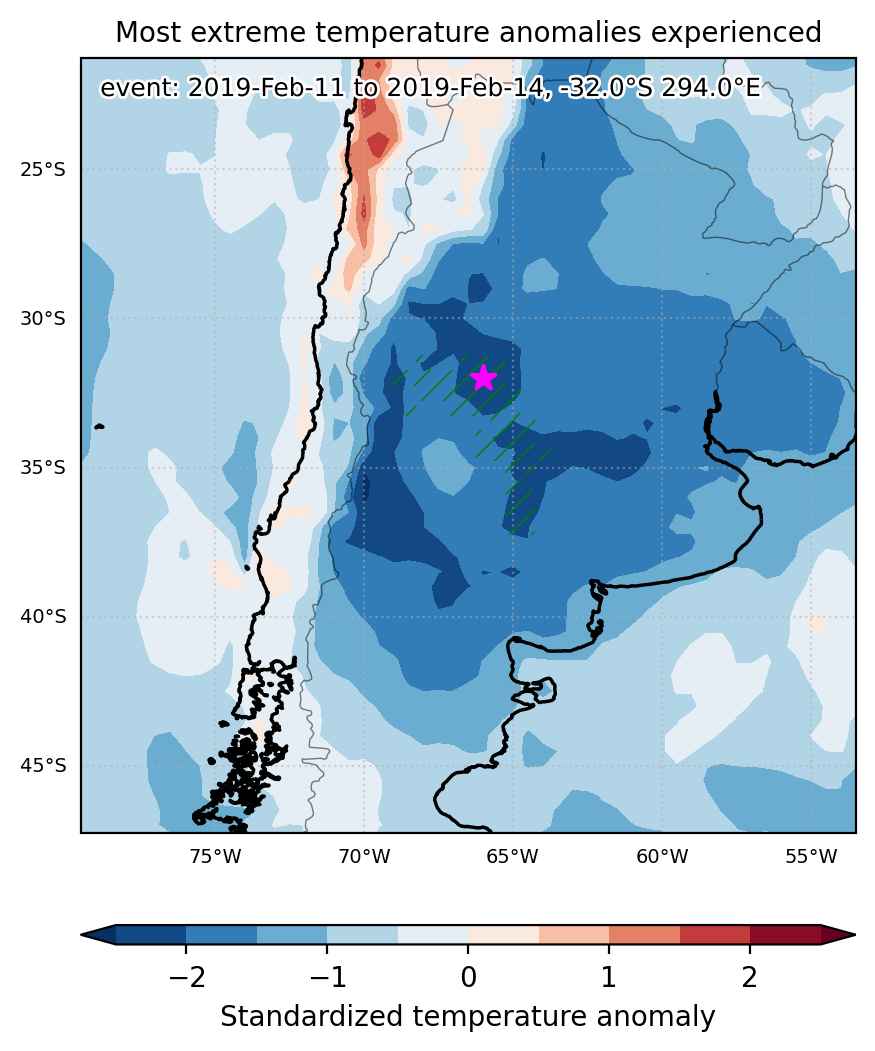
Cold spell occuring from February 11 2019 to February 14 2019 at -32.0°S 294.0°E

Download data: JSON

Event type: Cold spell

Countries affected (identified with ArcGIS Online; provided only for geographical reference):

  • Argentina

Duration: 4 days

Time span: February 11 2019 to February 14 2019

Statistics over entire affected area:

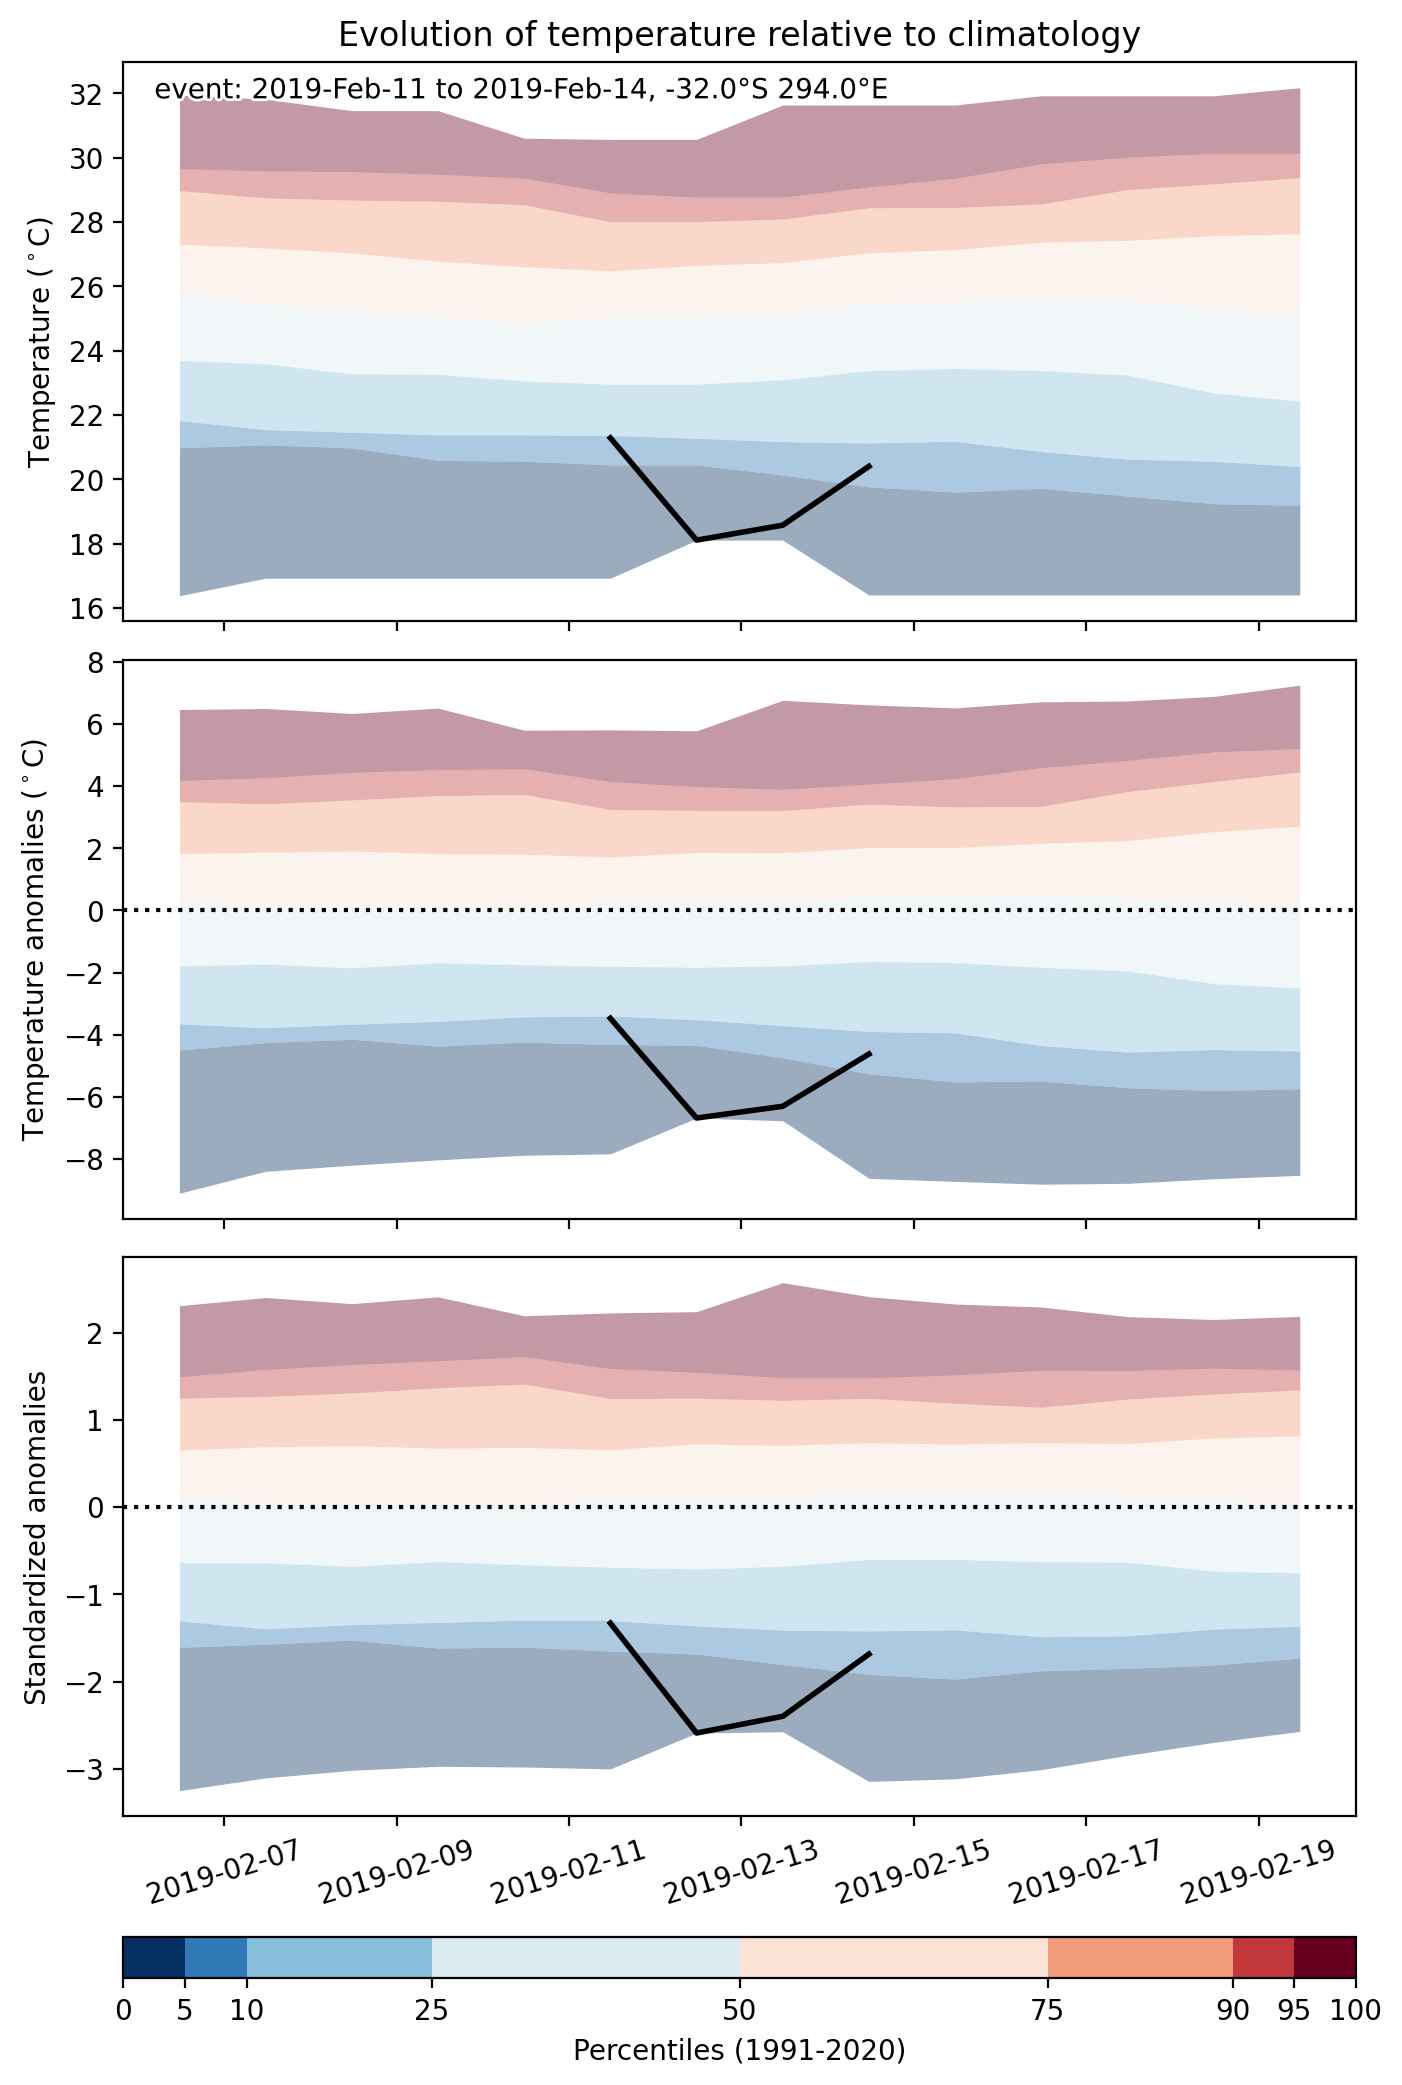
  • Mean temperature anomaly: -5.5 °C
  • Mean temperature: 17.4 °C
  • Minimum temperature anomaly: -8.4 °C
  • Minimum temperature: 5.0 °C

Event center: -32.0°S 294.0°E

Area affected: 118526 km$^2$


Fig. 1: Map of most extreme temperature anomalies (standardized) experienced during the event. The purple star indicates the center of the extreme event. Green hatching illustrates all areas under the effect of extremes at some time during the event.


Fig. 2: Evolution of temperature at the center of the event. The climatological percentile distribution is illustrated with color shadings.


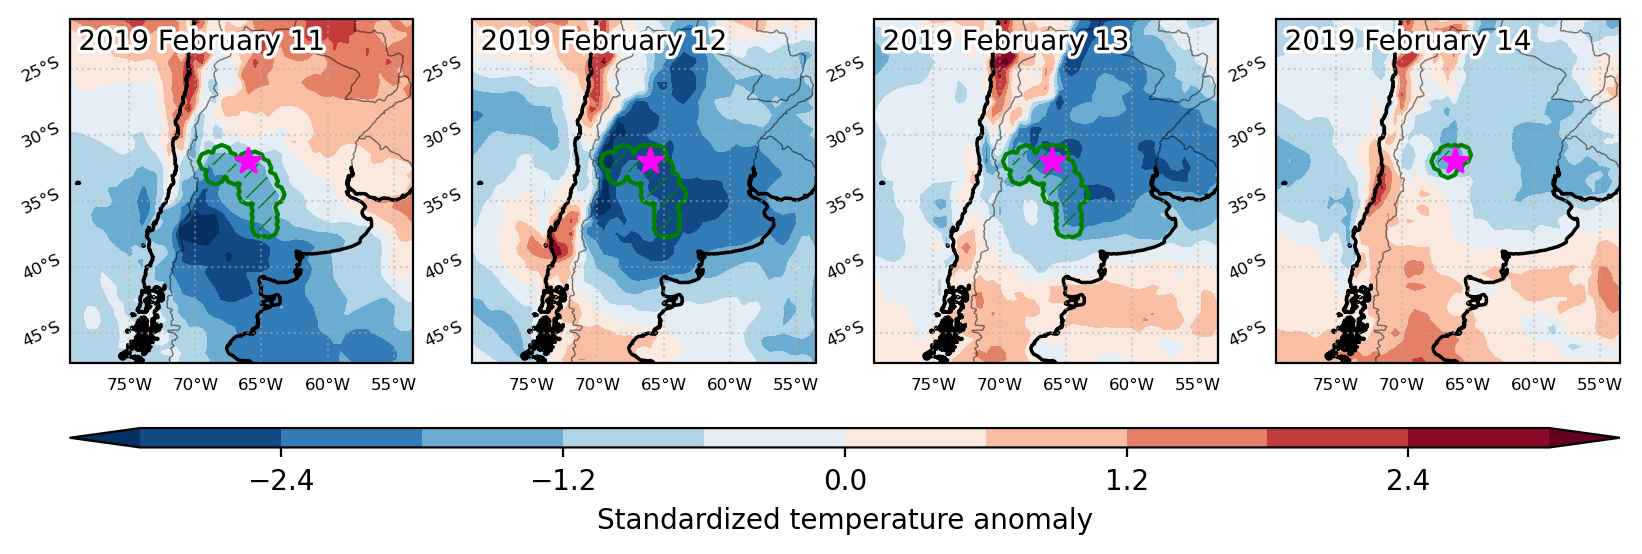
Fig. 3: Maps illustrating the evolution of standardized temperature anomalies during the event.

Event ID: Cold_spell_2019-Feb-11_to_2019-Feb-14_294.0_-32.0

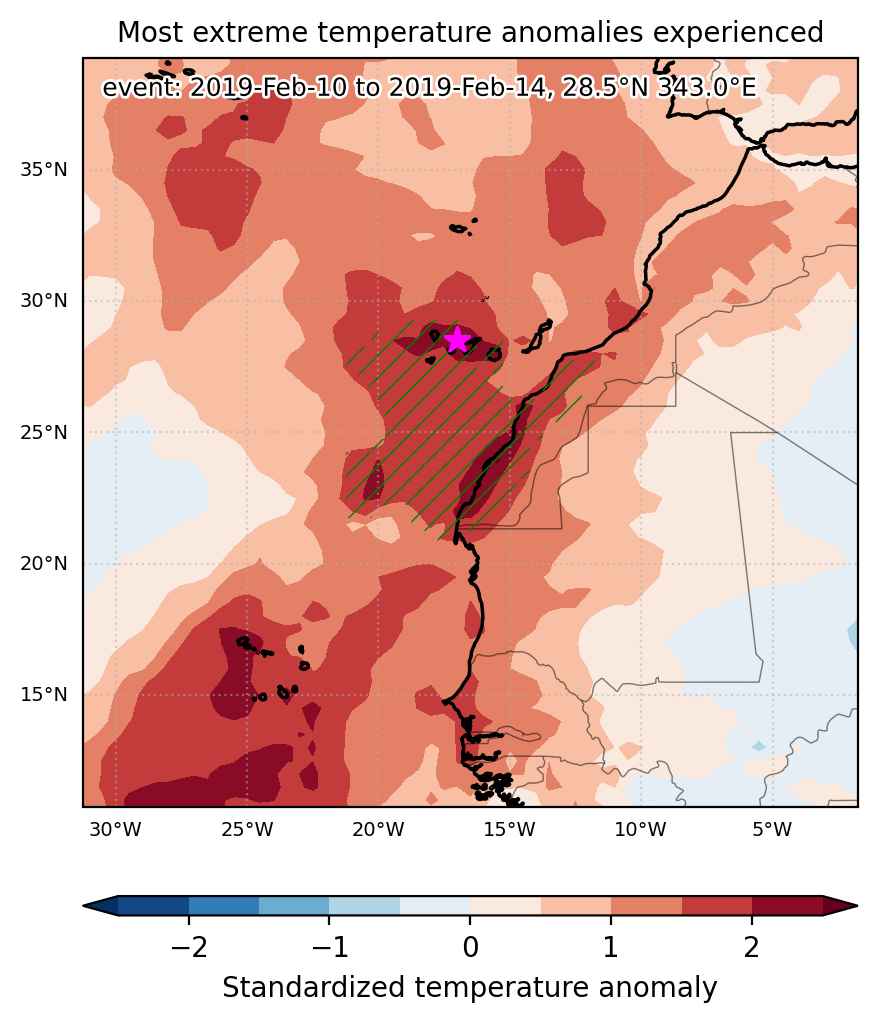
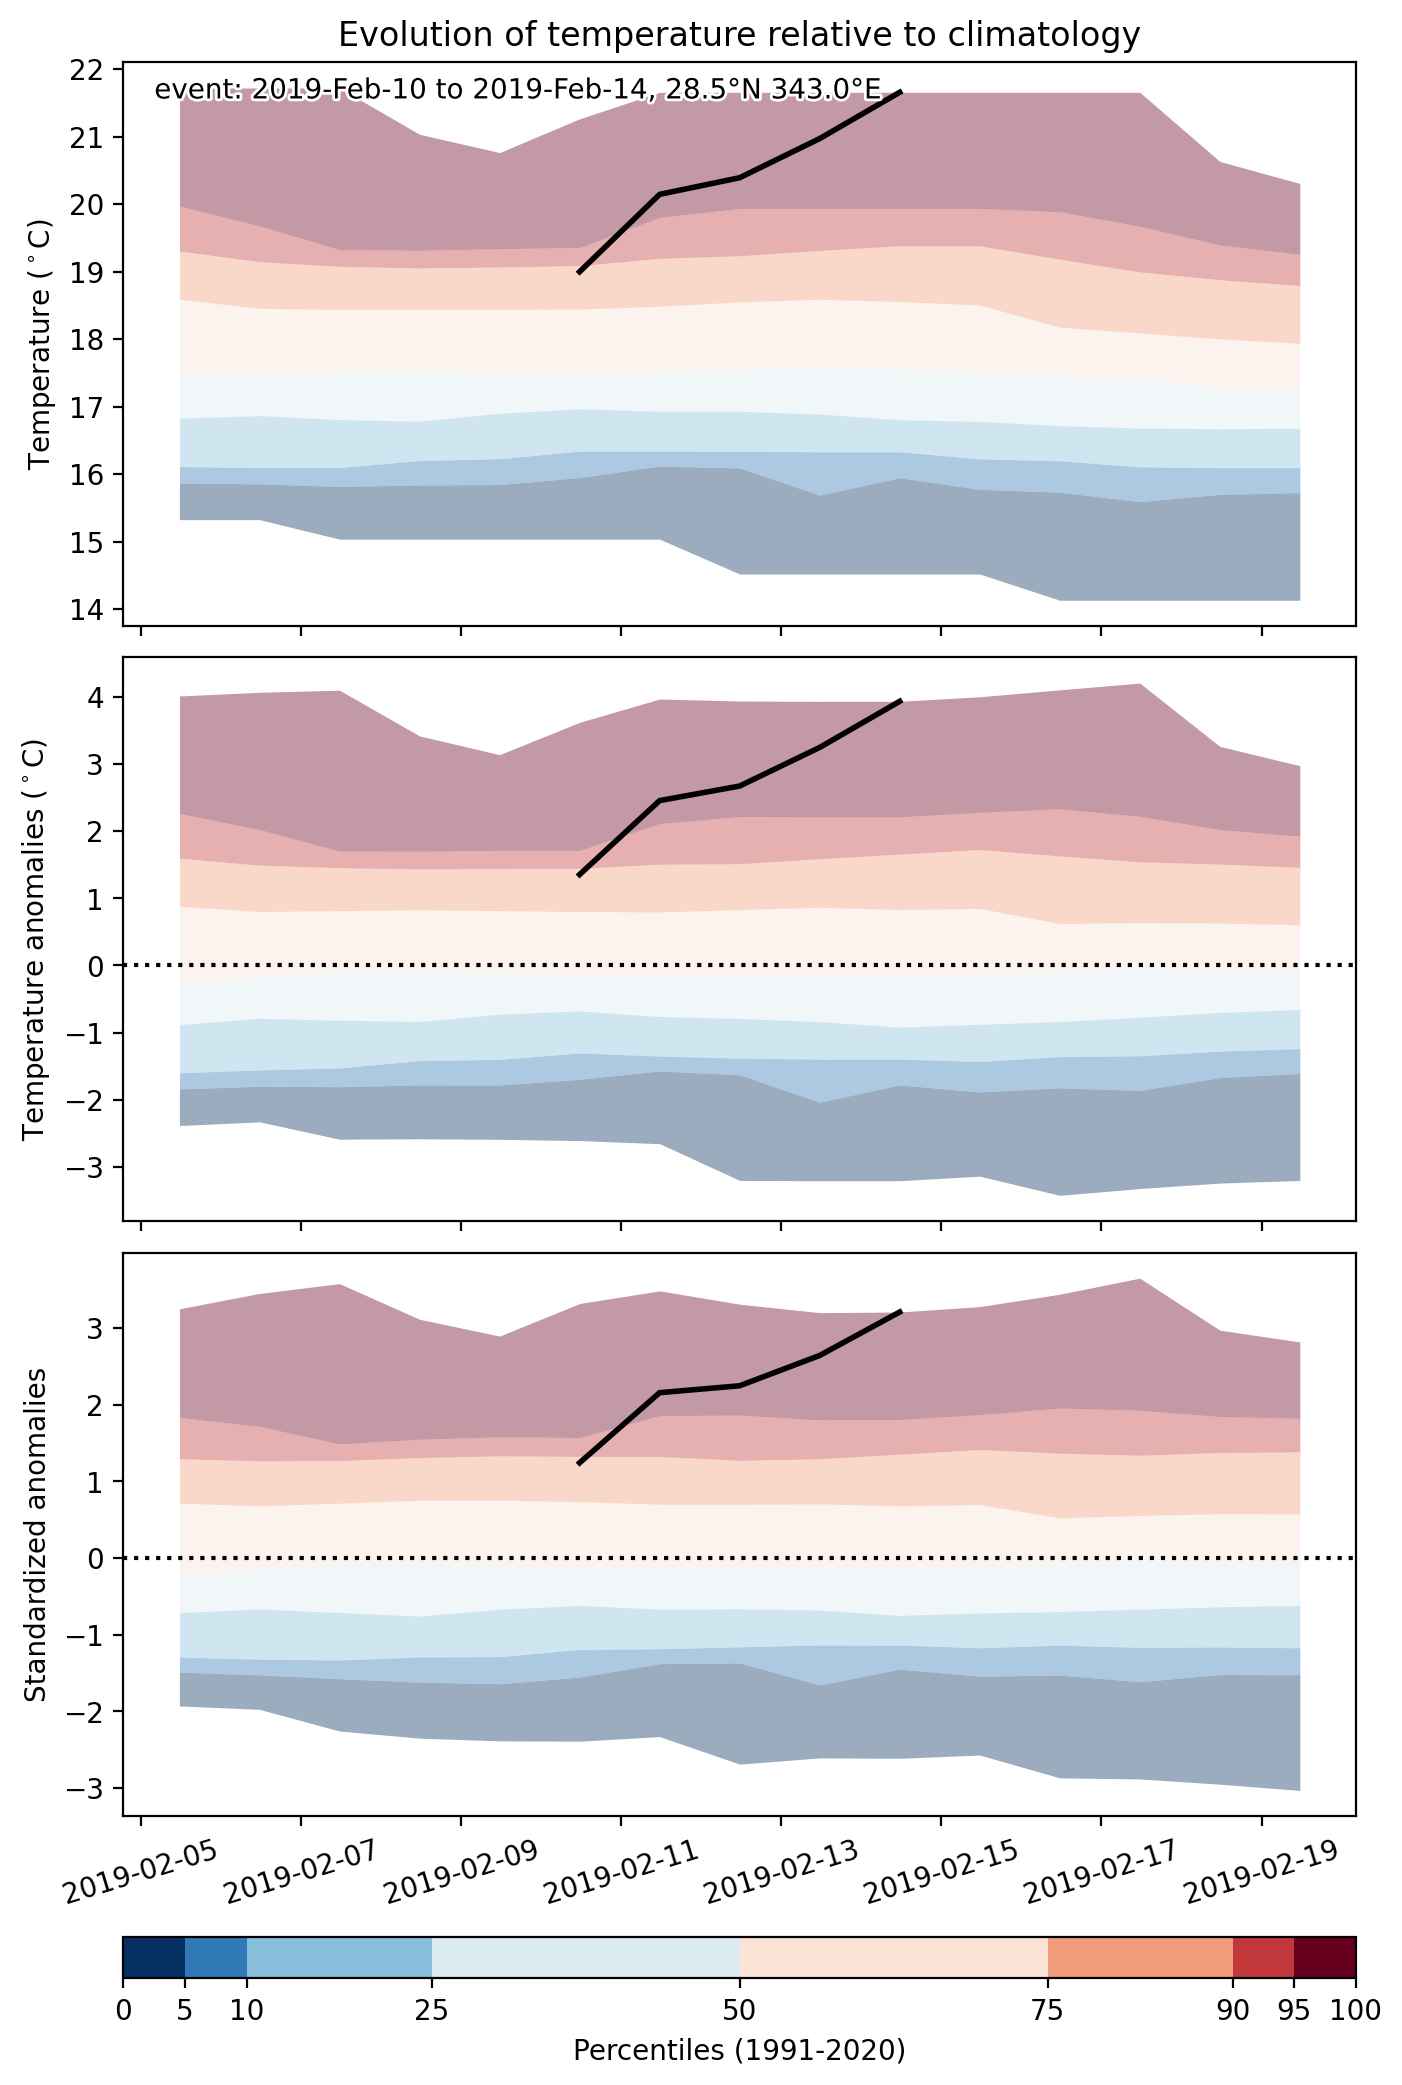
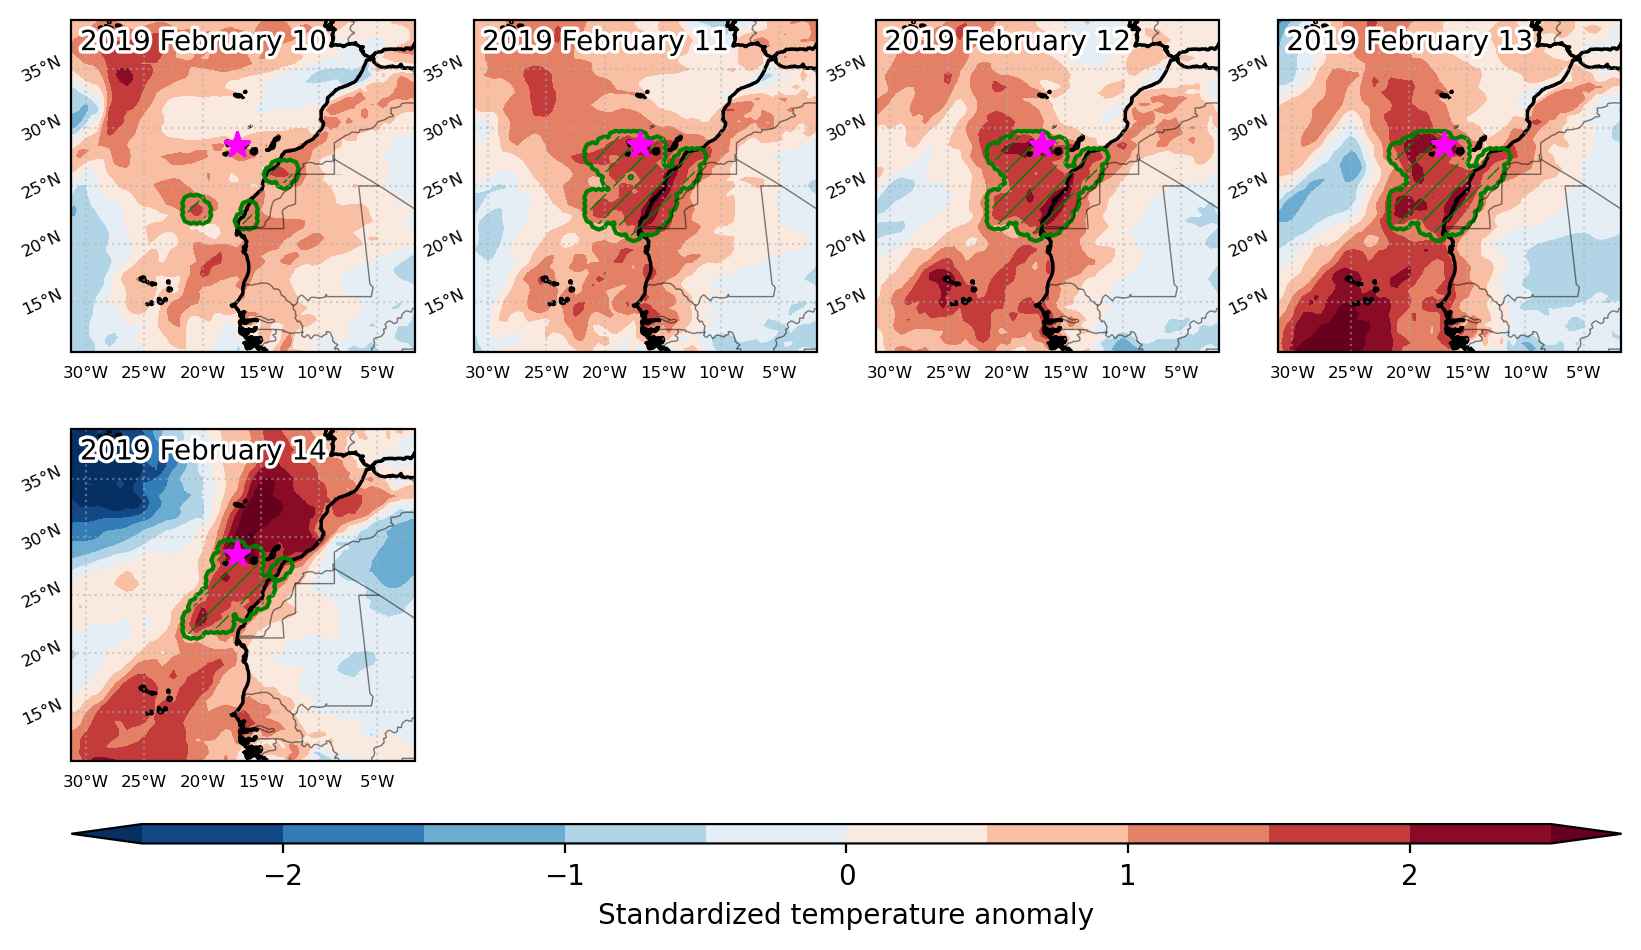
Heat wave occuring from February 10 2019 to February 14 2019 at 28.5°N 343.0°E

Download data: JSON

Event type: Heat wave

Countries affected (identified with ArcGIS Online; provided only for geographical reference):

  • Canarias
  • Morocco

Duration: 5 days

Time span: February 10 2019 to February 14 2019

Statistics over entire affected area:

  • Mean temperature anomaly: 2.3 °C
  • Mean temperature: 20.8 °C
  • Maximum temperature anomaly: 6.3 °C
  • Maximum temperature: 25.8 °C

Event center: 28.5°N 343.0°E

Area affected: 525452 km$^2$


Fig. 1: Map of most extreme temperature anomalies (standardized) experienced during the event. The purple star indicates the center of the extreme event. Green hatching illustrates all areas under the effect of extremes at some time during the event.


Fig. 2: Evolution of temperature at the center of the event. The climatological percentile distribution is illustrated with color shadings.


Fig. 3: Maps illustrating the evolution of standardized temperature anomalies during the event.

Event ID: Heat_wave_2019-Feb-10_to_2019-Feb-14_343.0_28.5

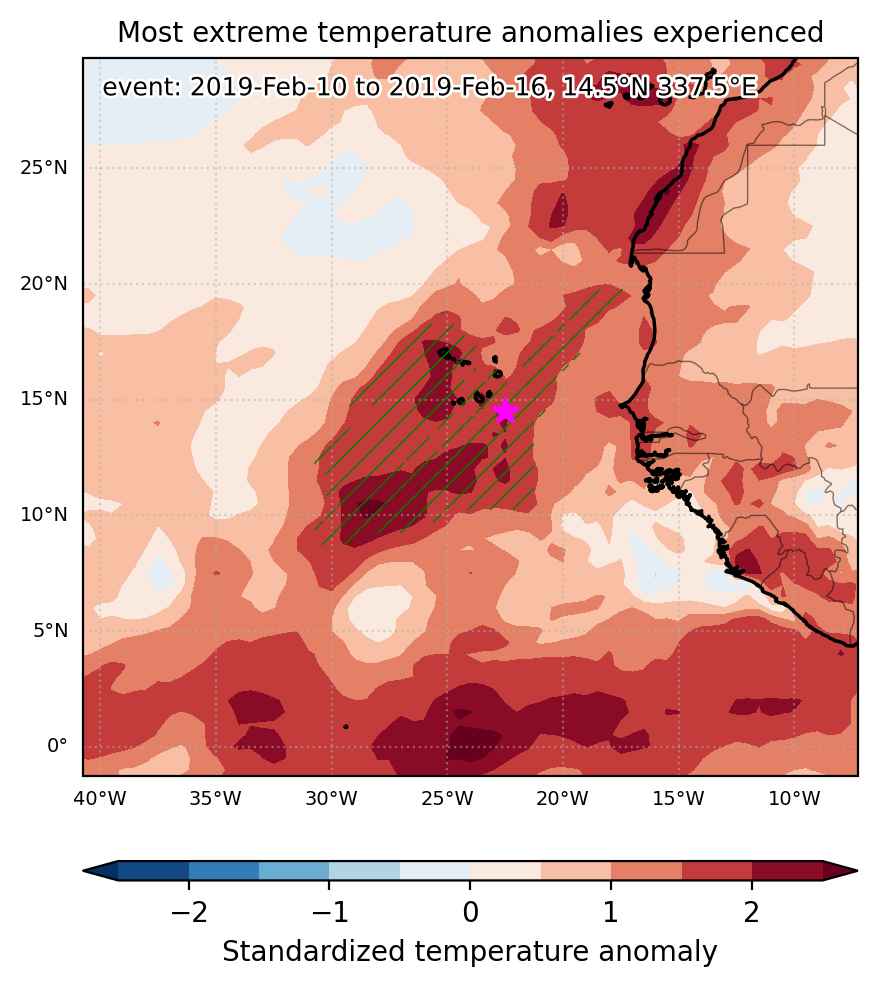
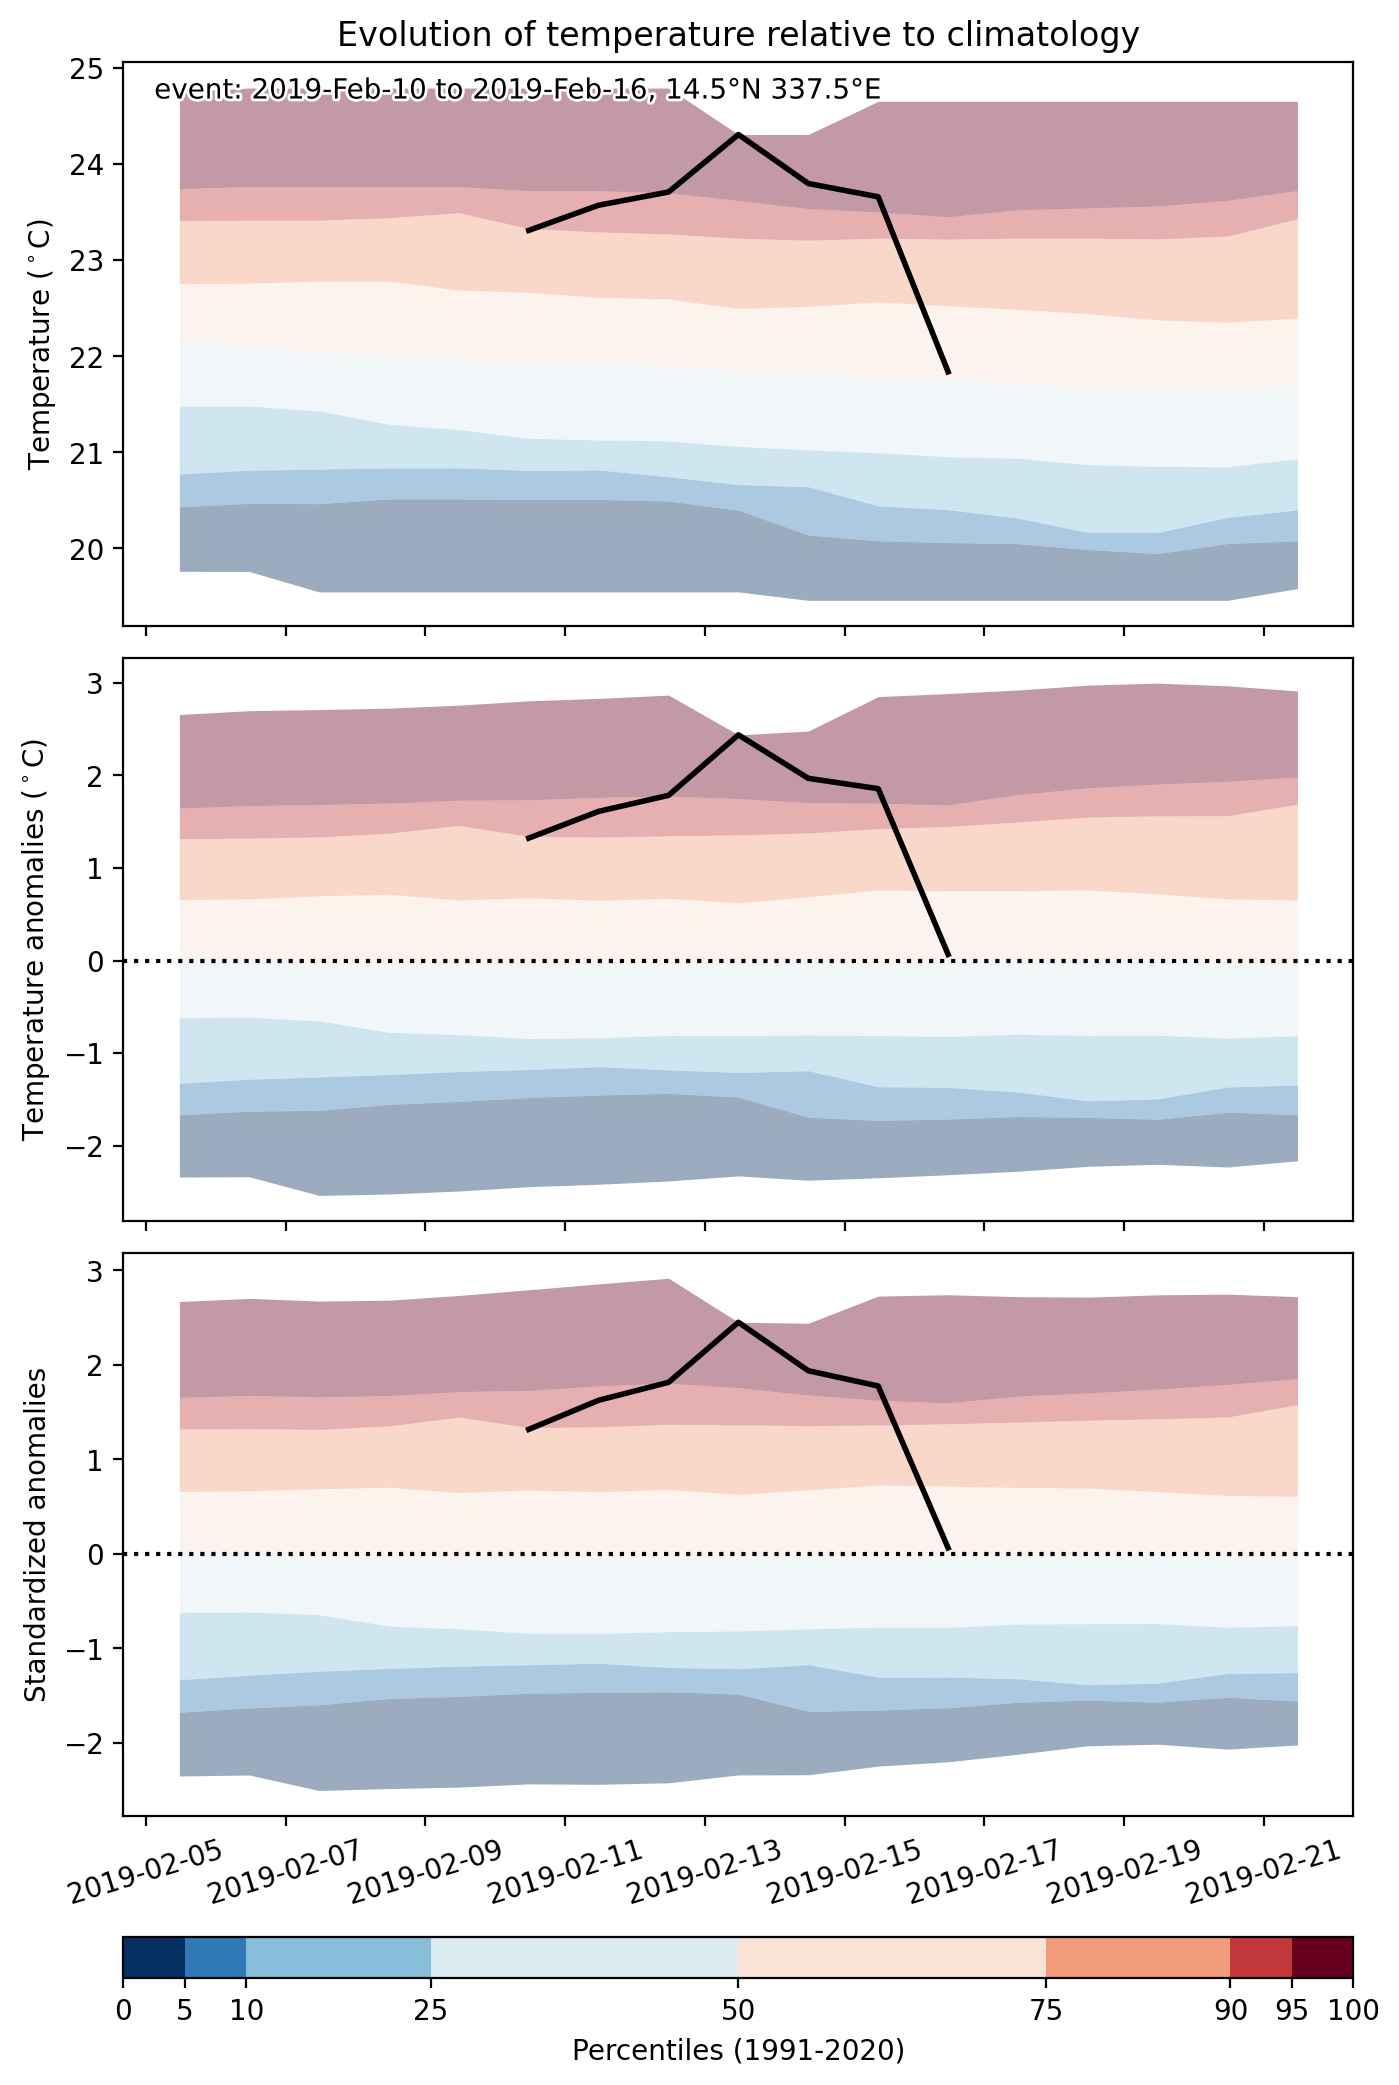
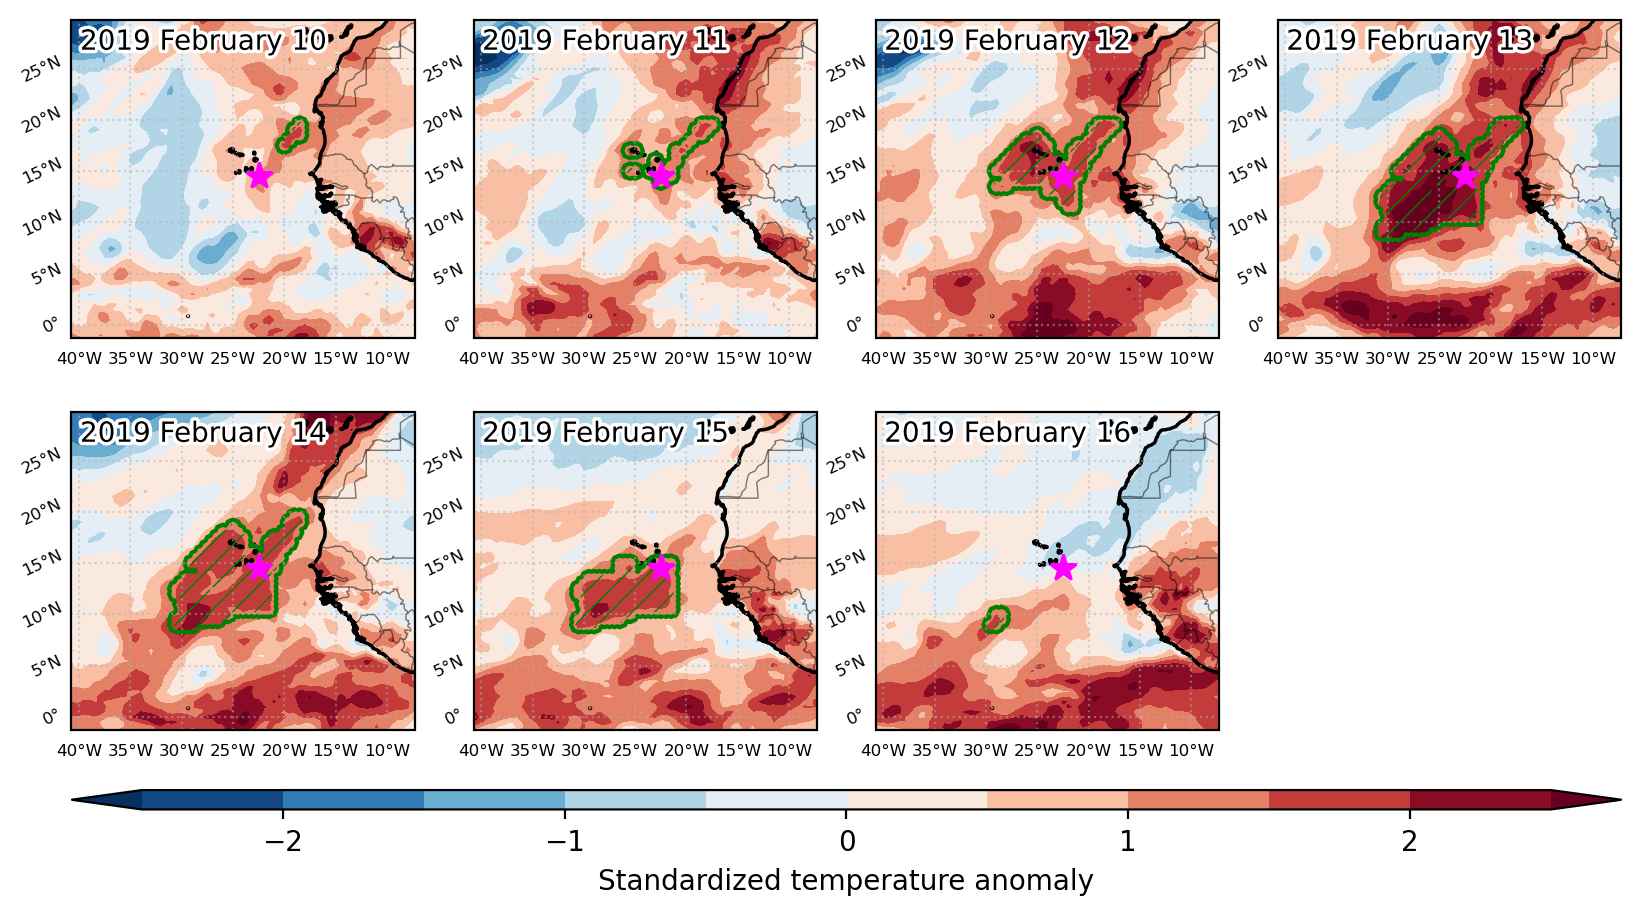
Heat wave occuring from February 10 2019 to February 16 2019 at 14.5°N 337.5°E

Download data: JSON

Event type: Heat wave

Countries affected (identified with ArcGIS Online; provided only for geographical reference):

  • Cabo Verde

Duration: 7 days

Time span: February 10 2019 to February 16 2019

Statistics over entire affected area:

  • Mean temperature anomaly: 1.7 °C
  • Mean temperature: 24.0 °C
  • Maximum temperature anomaly: 2.8 °C
  • Maximum temperature: 26.3 °C

Event center: 14.5°N 337.5°E

Area affected: 813078 km$^2$


Fig. 1: Map of most extreme temperature anomalies (standardized) experienced during the event. The purple star indicates the center of the extreme event. Green hatching illustrates all areas under the effect of extremes at some time during the event.


Fig. 2: Evolution of temperature at the center of the event. The climatological percentile distribution is illustrated with color shadings.


Fig. 3: Maps illustrating the evolution of standardized temperature anomalies during the event.

Event ID: Heat_wave_2019-Feb-10_to_2019-Feb-16_337.5_14.5

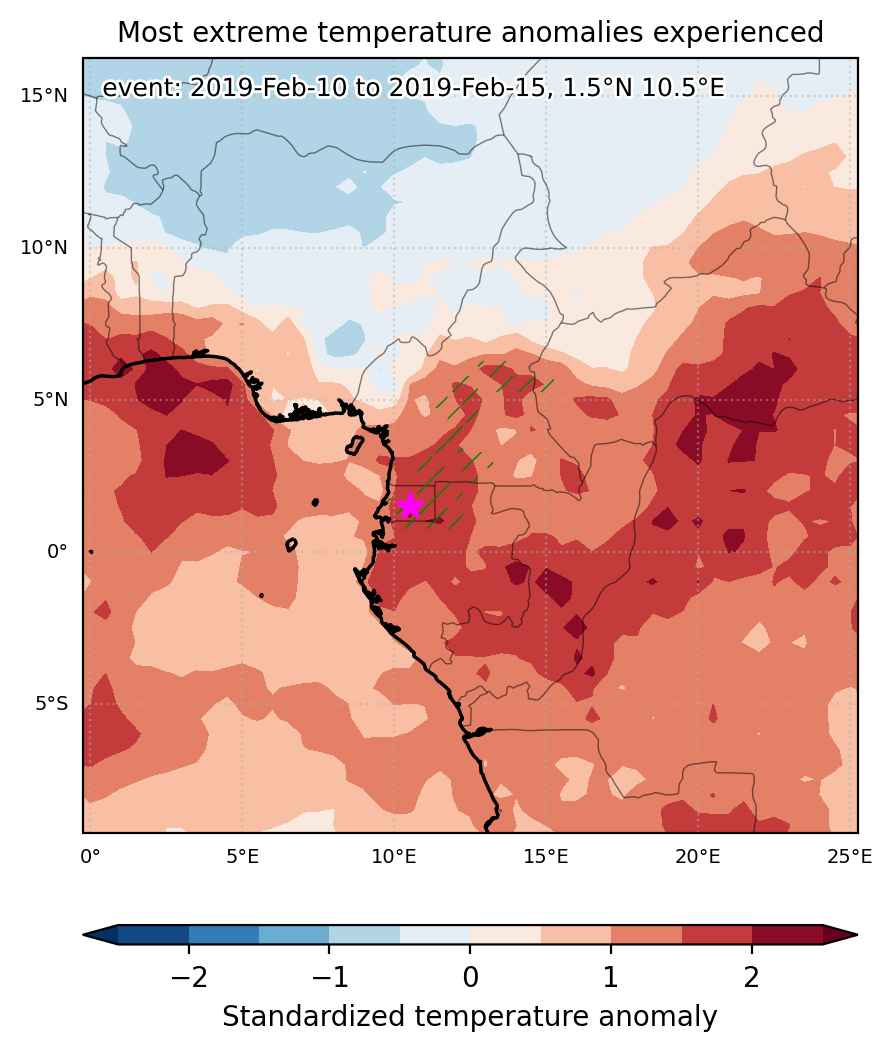
Heat wave occuring from February 10 2019 to February 15 2019 at 1.5°N 10.5°E

Download data: JSON

Event type: Heat wave

Countries affected (identified with ArcGIS Online; provided only for geographical reference):

  • Cameroon
  • Central African Republic
  • Equatorial Guinea
  • Gabon

Duration: 6 days

Time span: February 10 2019 to February 15 2019

Statistics over entire affected area:

  • Mean temperature anomaly: 1.5 °C
  • Mean temperature: 26.6 °C
  • Maximum temperature anomaly: 2.4 °C
  • Maximum temperature: 29.3 °C

Event center: 1.5°N 10.5°E

Area affected: 98700 km$^2$


Fig. 1: Map of most extreme temperature anomalies (standardized) experienced during the event. The purple star indicates the center of the extreme event. Green hatching illustrates all areas under the effect of extremes at some time during the event.


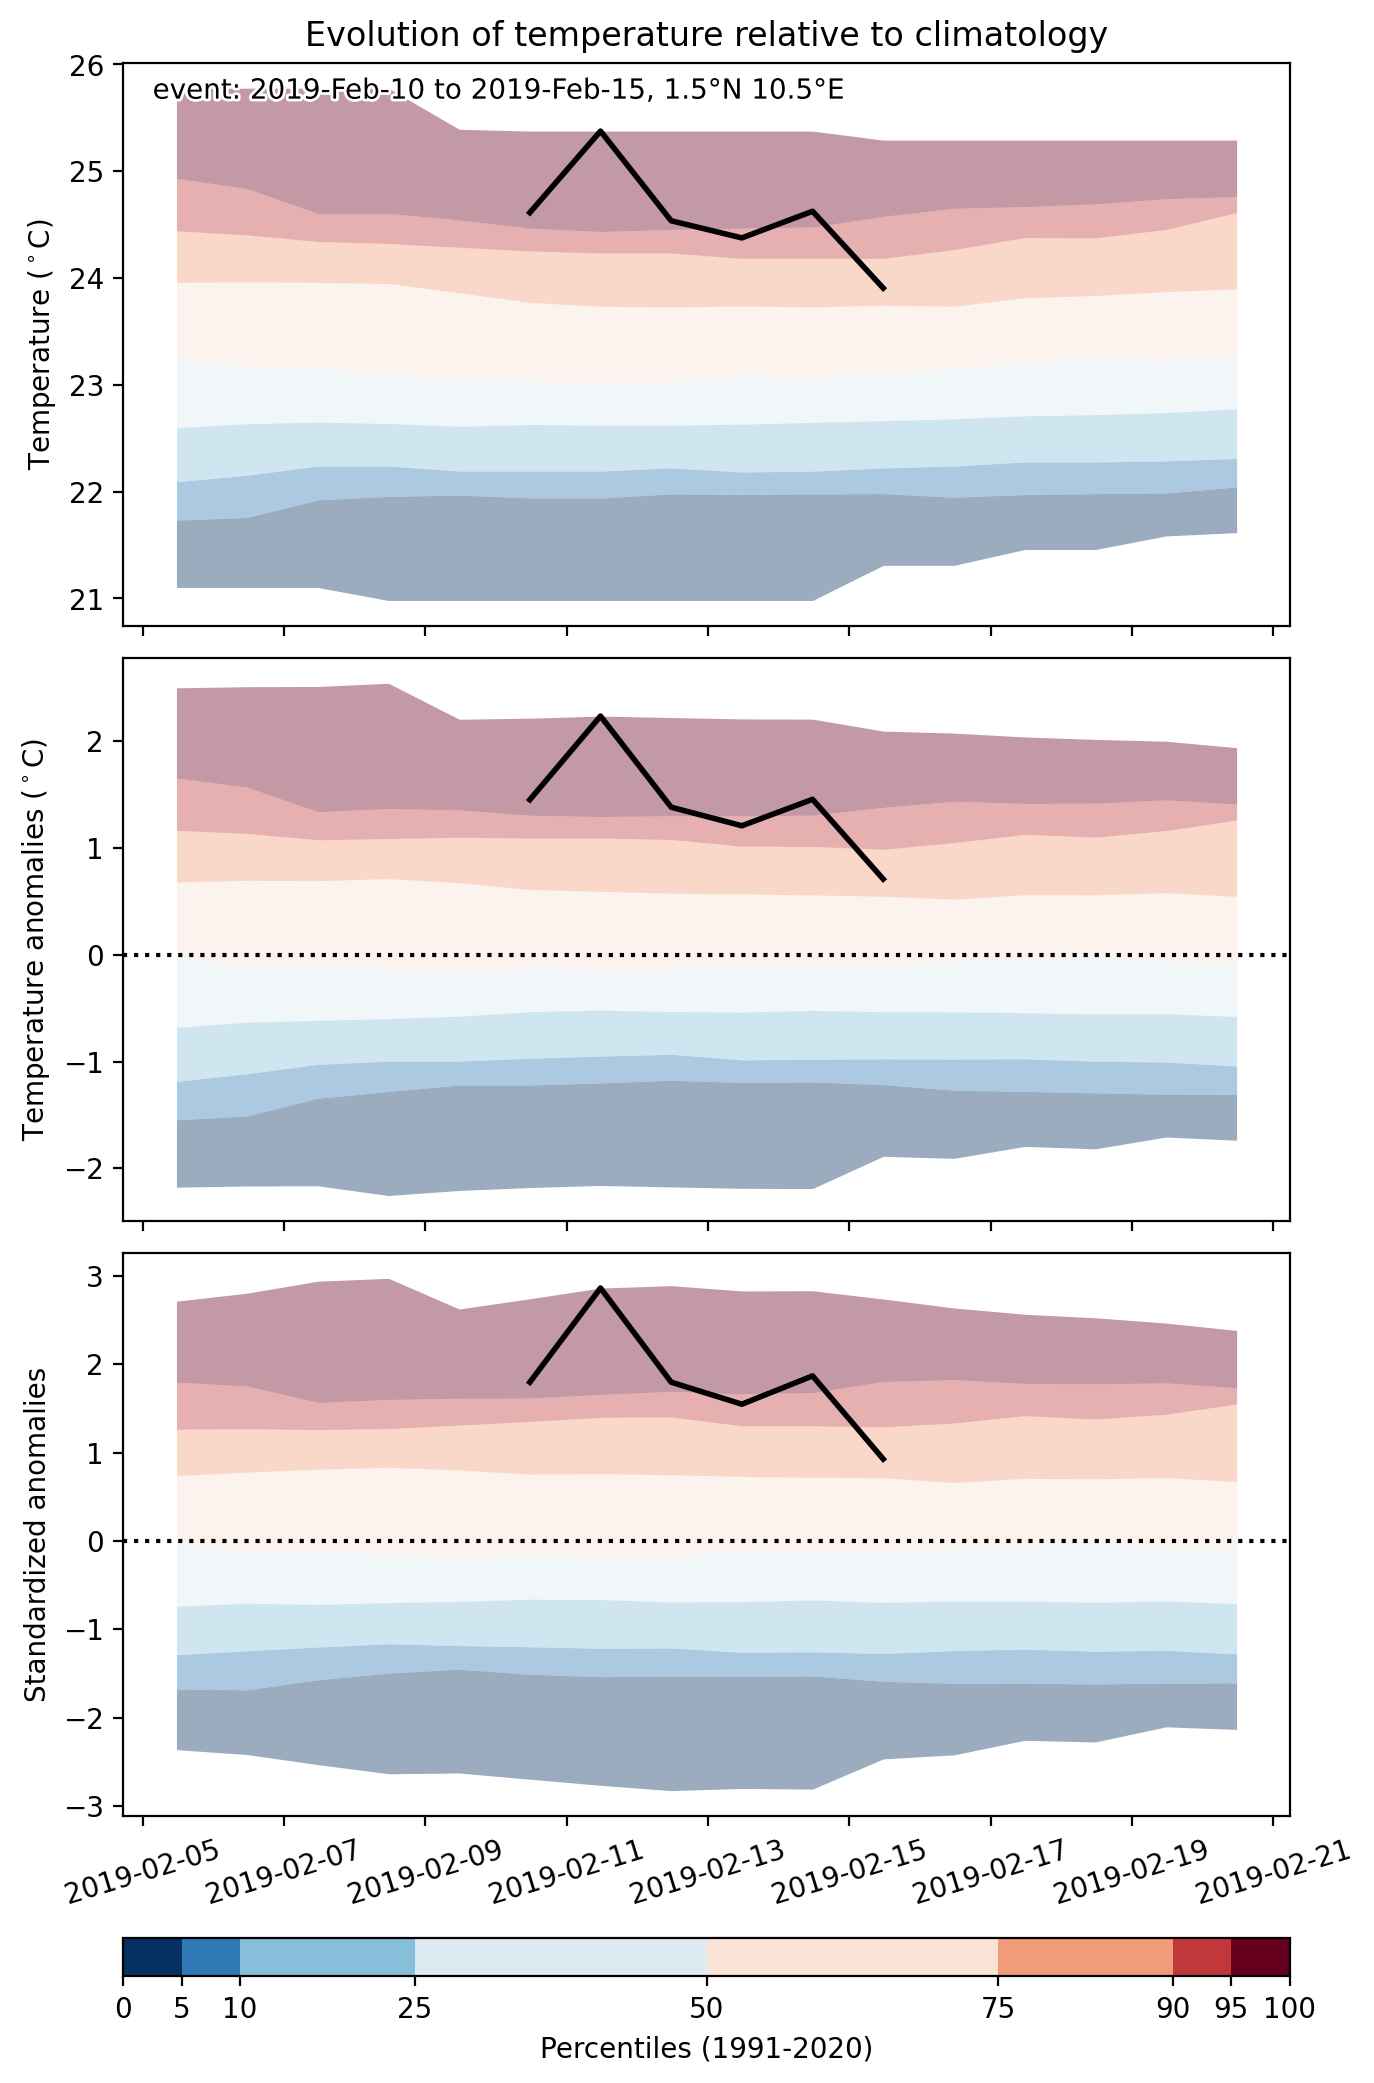
Fig. 2: Evolution of temperature at the center of the event. The climatological percentile distribution is illustrated with color shadings.


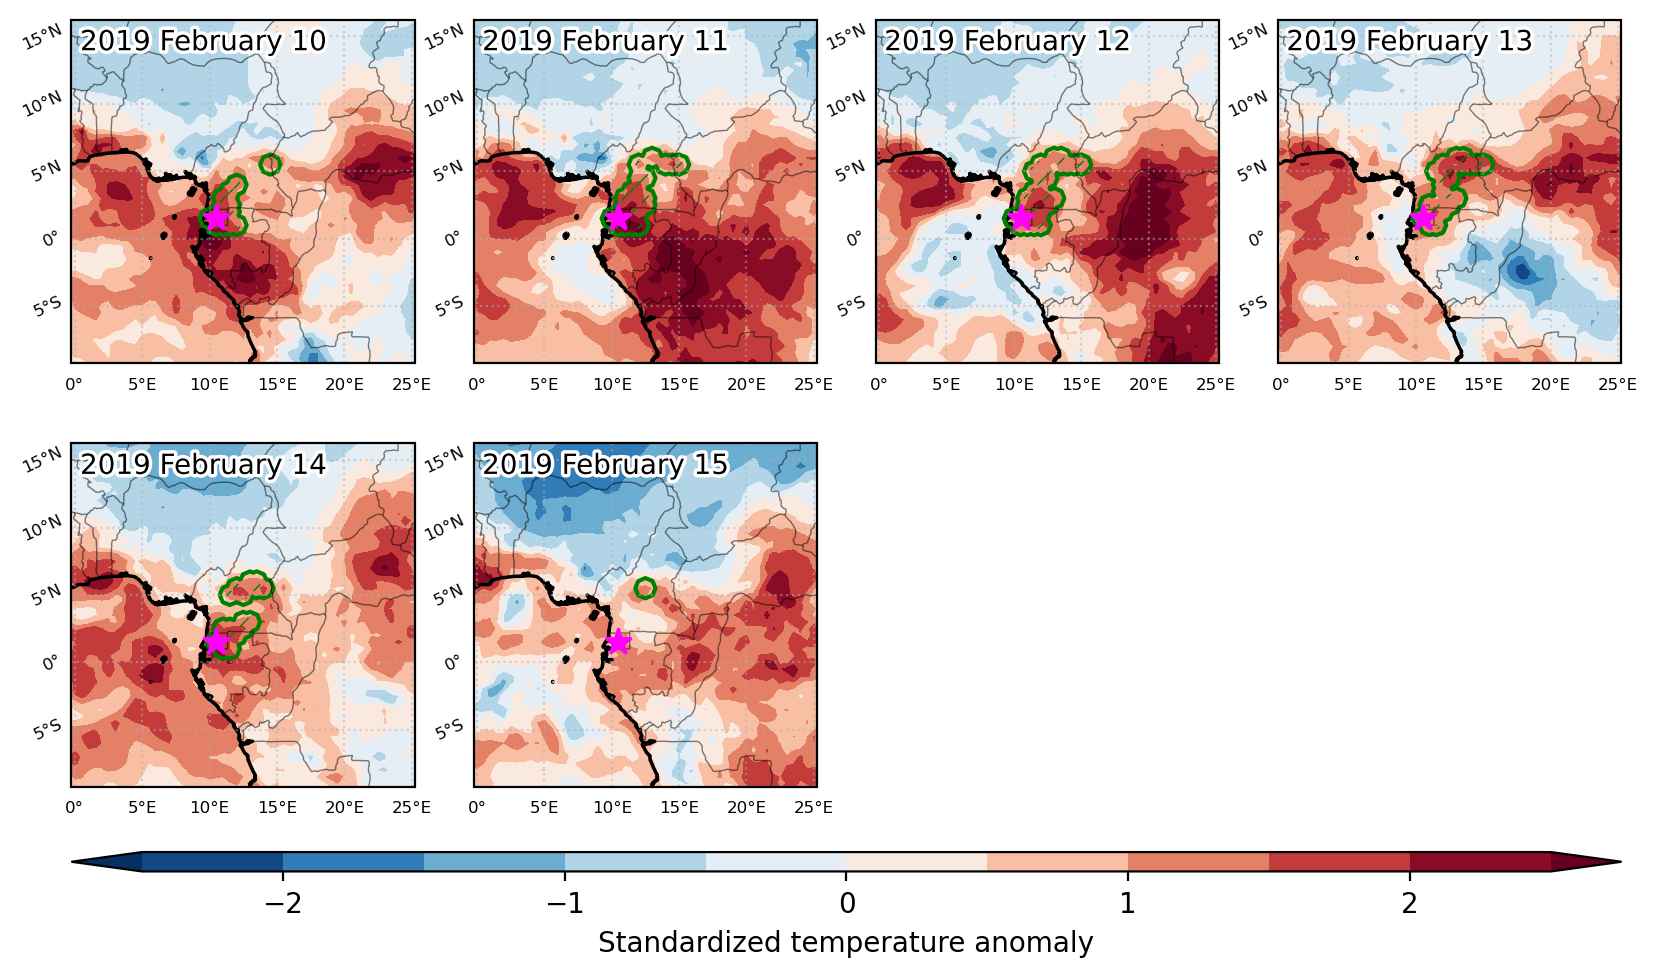
Fig. 3: Maps illustrating the evolution of standardized temperature anomalies during the event.

Event ID: Heat_wave_2019-Feb-10_to_2019-Feb-15_10.5_1.5

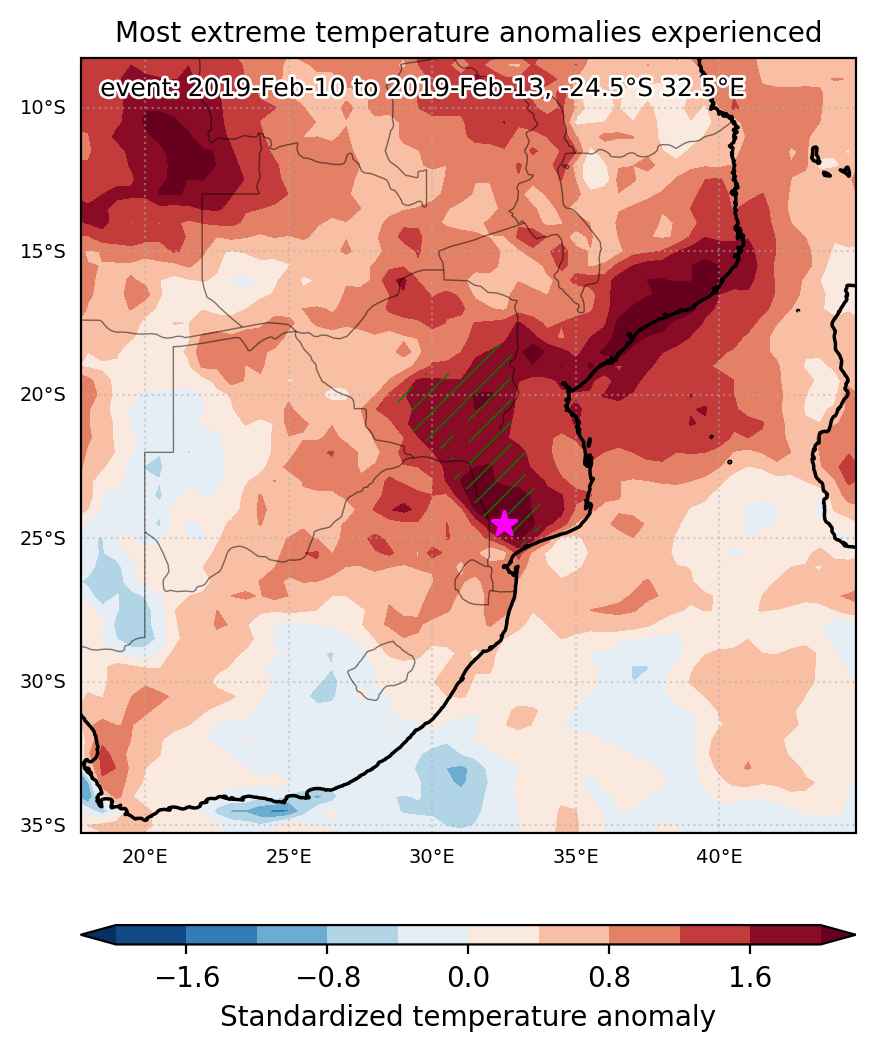
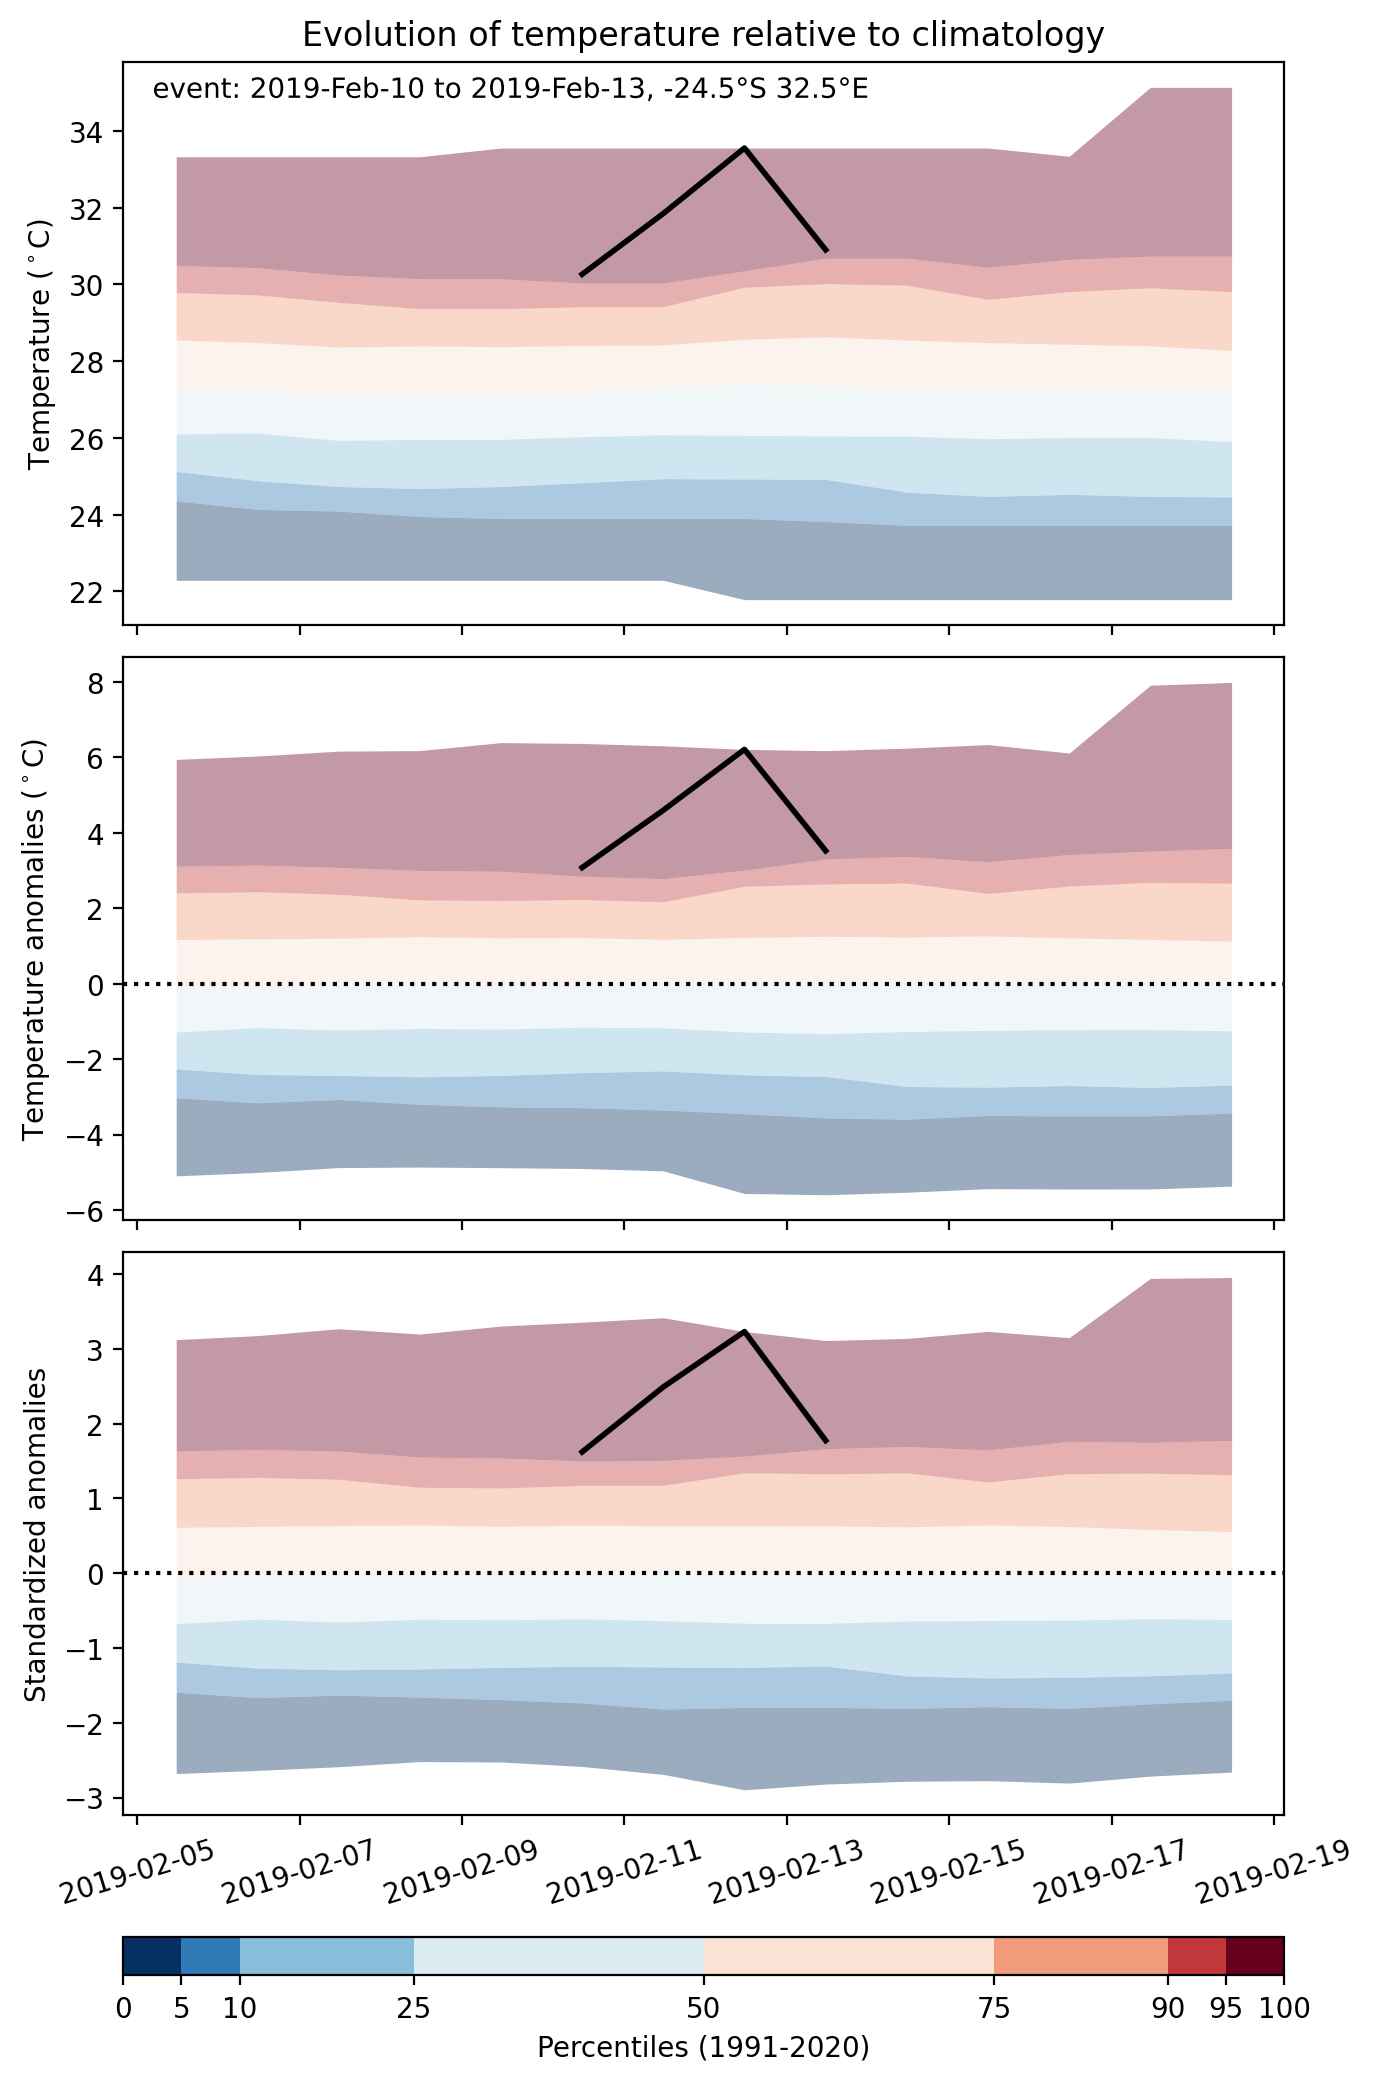
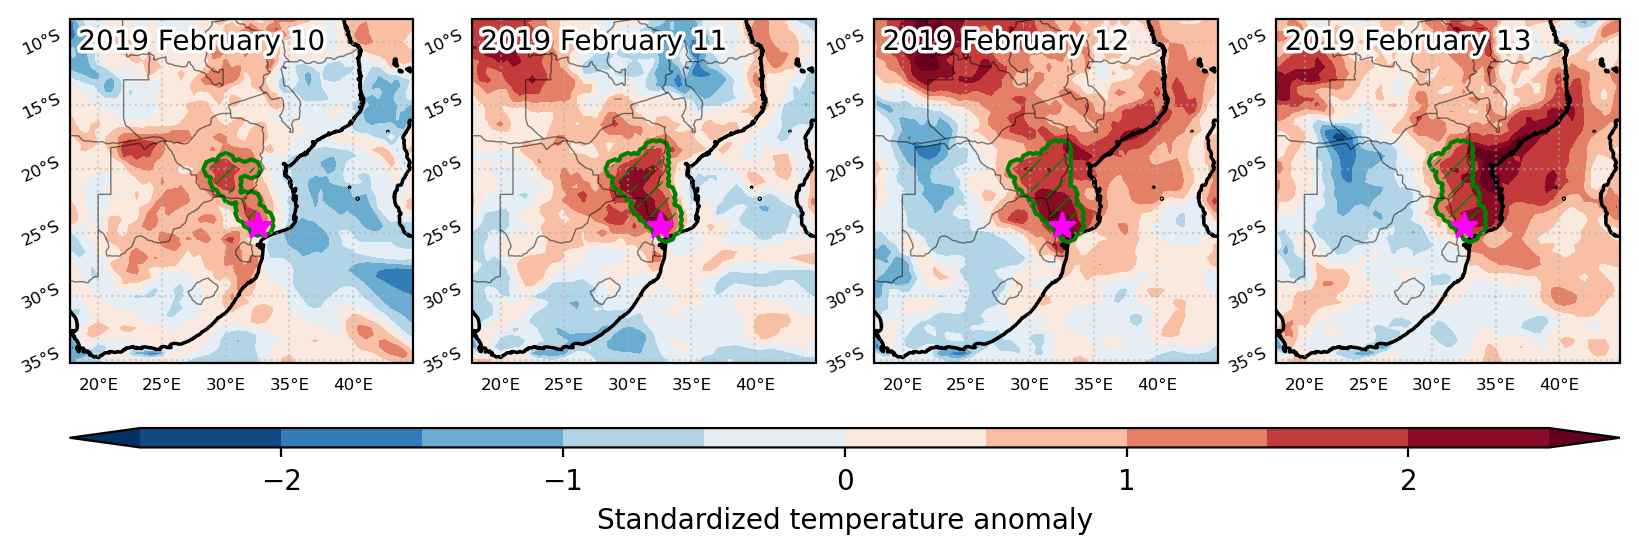
Heat wave occuring from February 10 2019 to February 13 2019 at -24.5°S 32.5°E

Download data: JSON

Event type: Heat wave

Countries affected (identified with ArcGIS Online; provided only for geographical reference):

  • Mozambique
  • South Africa
  • Zimbabwe

Duration: 4 days

Time span: February 10 2019 to February 13 2019

Statistics over entire affected area:

  • Mean temperature anomaly: 3.9 °C
  • Mean temperature: 29.3 °C
  • Maximum temperature anomaly: 6.2 °C
  • Maximum temperature: 33.6 °C

Event center: -24.5°S 32.5°E

Area affected: 184001 km$^2$


Fig. 1: Map of most extreme temperature anomalies (standardized) experienced during the event. The purple star indicates the center of the extreme event. Green hatching illustrates all areas under the effect of extremes at some time during the event.


Fig. 2: Evolution of temperature at the center of the event. The climatological percentile distribution is illustrated with color shadings.


Fig. 3: Maps illustrating the evolution of standardized temperature anomalies during the event.

Event ID: Heat_wave_2019-Feb-10_to_2019-Feb-13_32.5_-24.5

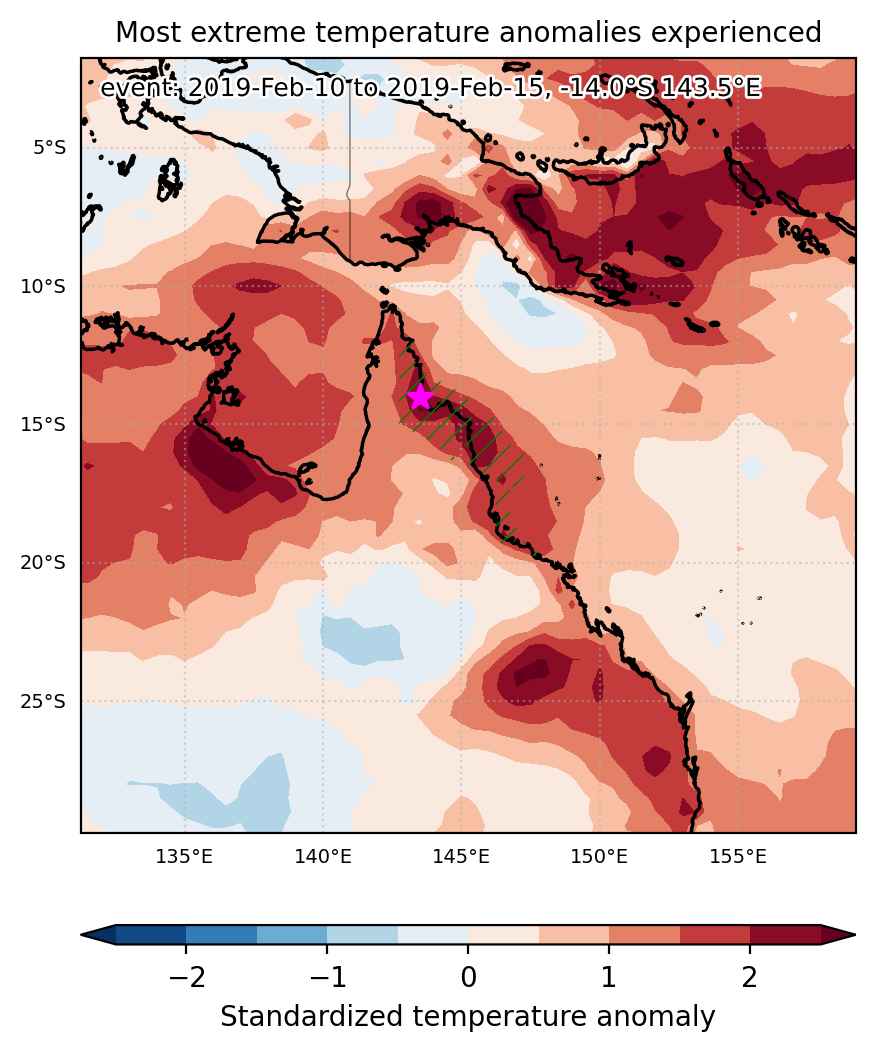
Heat wave occuring from February 10 2019 to February 15 2019 at -14.0°S 143.5°E

Download data: JSON

Event type: Heat wave

Countries affected (identified with ArcGIS Online; provided only for geographical reference):

  • Australia

Duration: 6 days

Time span: February 10 2019 to February 15 2019

Statistics over entire affected area:

  • Mean temperature anomaly: 1.9 °C
  • Mean temperature: 29.1 °C
  • Maximum temperature anomaly: 3.1 °C
  • Maximum temperature: 30.1 °C

Event center: -14.0°S 143.5°E

Area affected: 140015 km$^2$


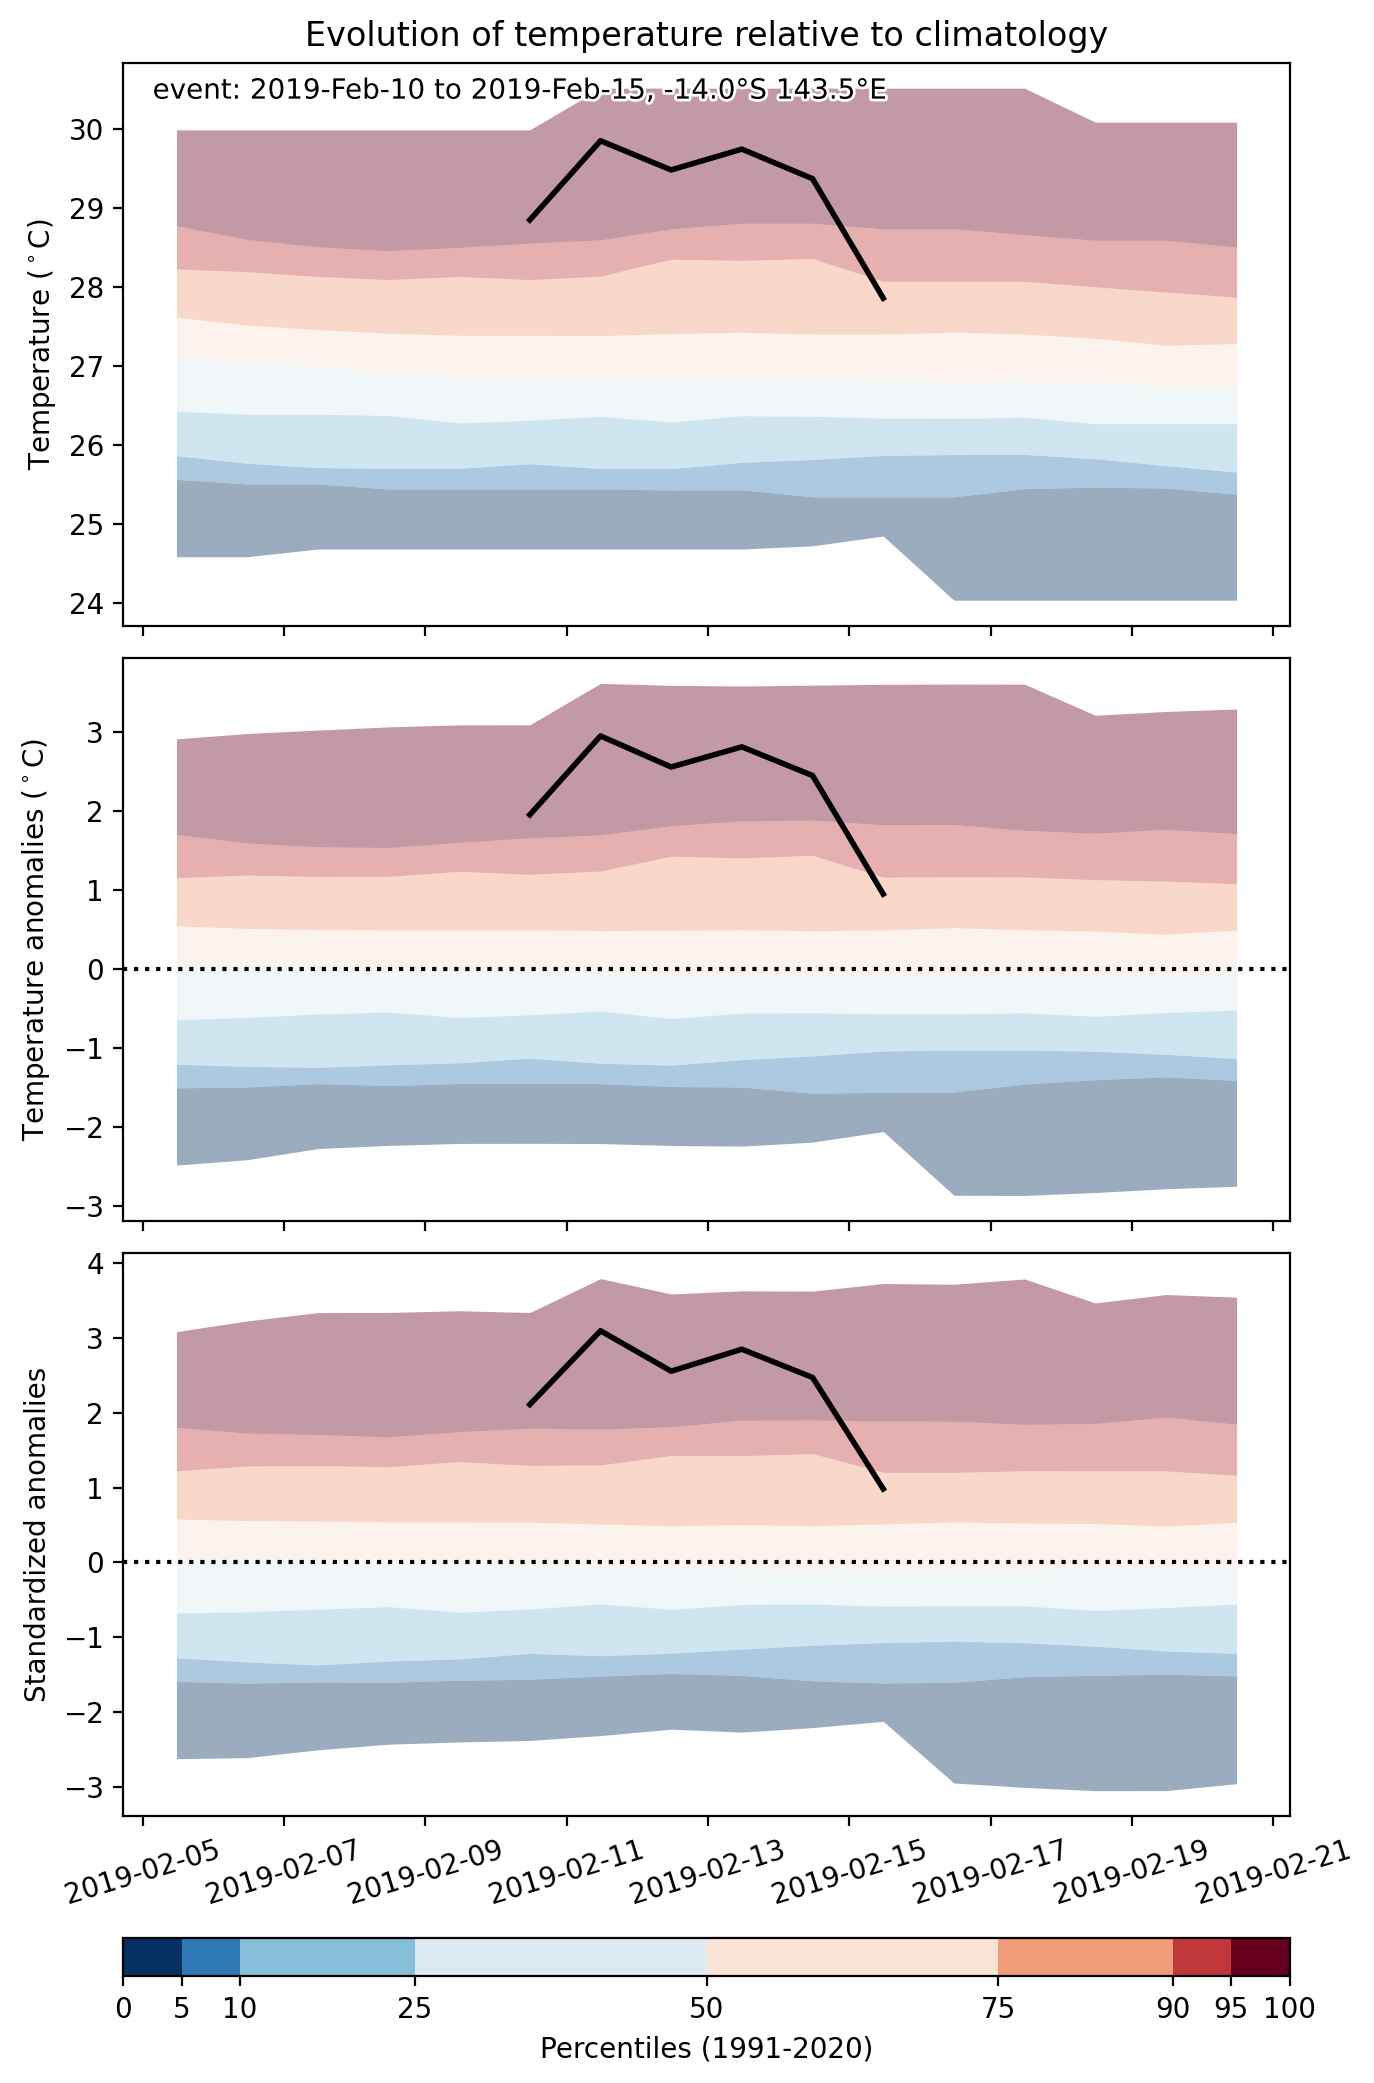
Fig. 1: Map of most extreme temperature anomalies (standardized) experienced during the event. The purple star indicates the center of the extreme event. Green hatching illustrates all areas under the effect of extremes at some time during the event.


Fig. 2: Evolution of temperature at the center of the event. The climatological percentile distribution is illustrated with color shadings.


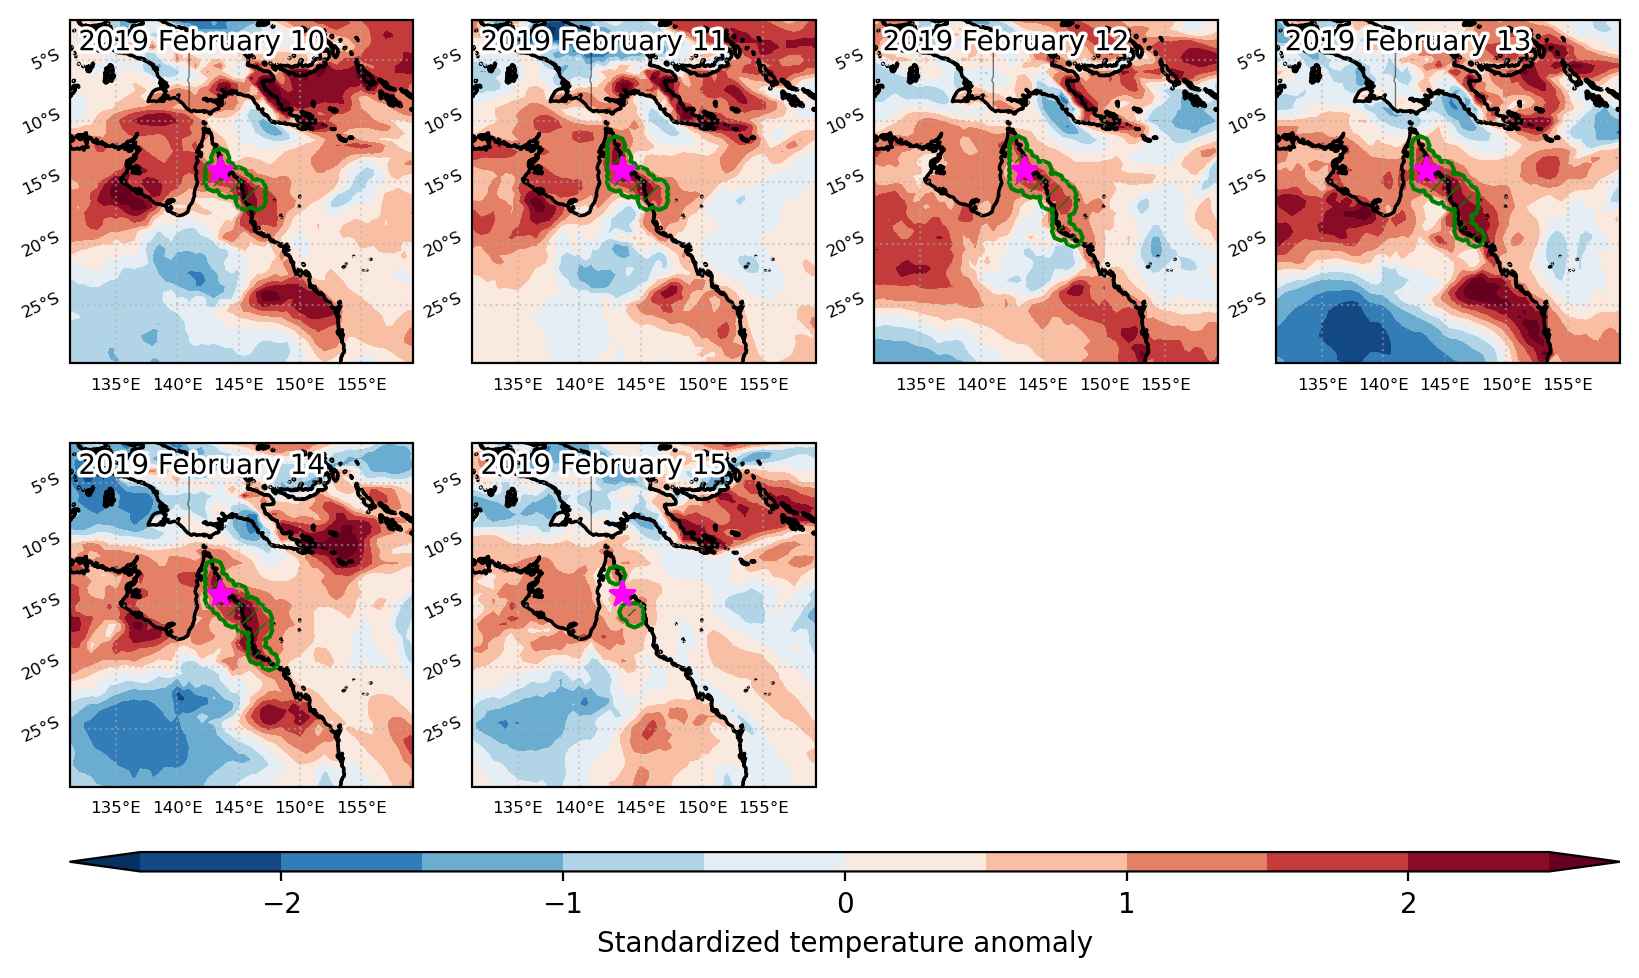
Fig. 3: Maps illustrating the evolution of standardized temperature anomalies during the event.

Event ID: Heat_wave_2019-Feb-10_to_2019-Feb-15_143.5_-14.0