Heat wave occuring from December 26 2018 to January 07 2019 at 17.0°N 270.0°E

Download data: JSON

Event type: Heat wave

Countries affected (identified with ArcGIS Online; provided only for geographical reference):

  • Belize
  • Cuba
  • Guatemala
  • Mexico

Duration: 13 days

Time span: December 26 2018 to January 07 2019

Statistics over entire affected area:

  • Mean temperature anomaly: 2.5 °C
  • Mean temperature: 25.4 °C
  • Maximum temperature anomaly: 4.3 °C
  • Maximum temperature: 28.2 °C

Event center: 17.0°N 270.0°E

Area affected: 581720 km$^2$
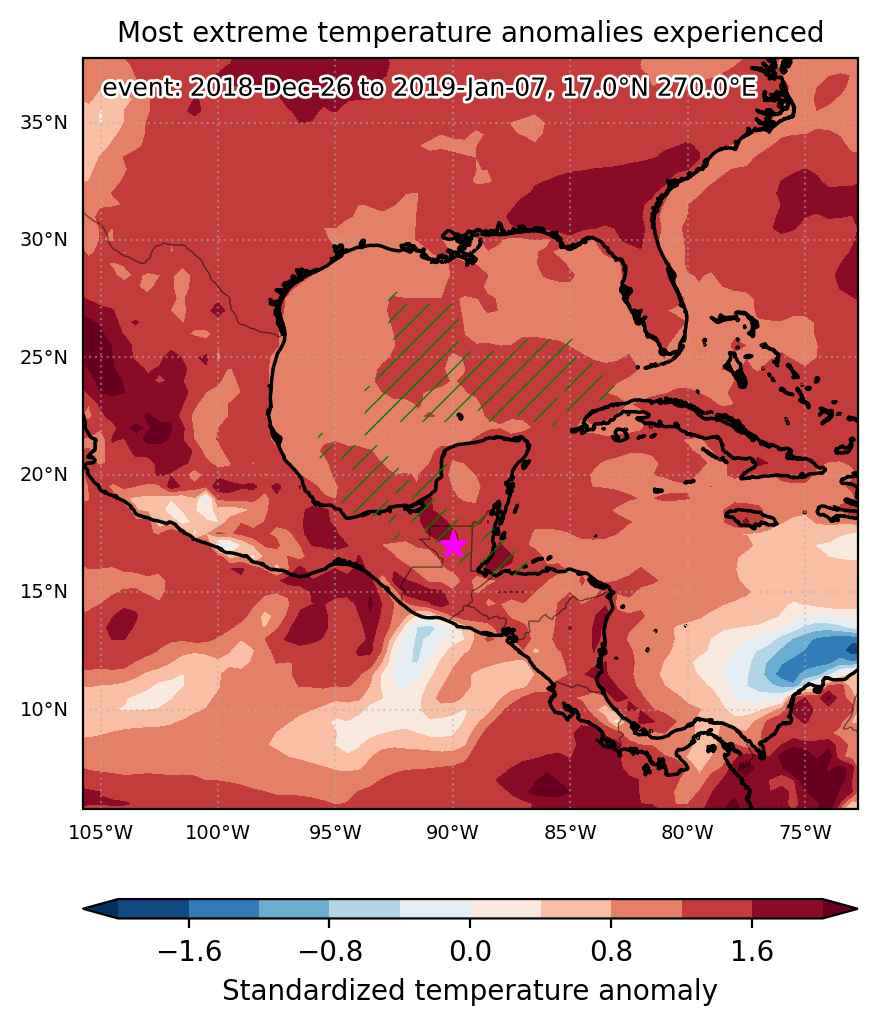

Fig. 1: Map of most extreme temperature anomalies (standardized) experienced during the event. The purple star indicates the center of the extreme event. Green hatching illustrates all areas under the effect of extremes at some time during the event.
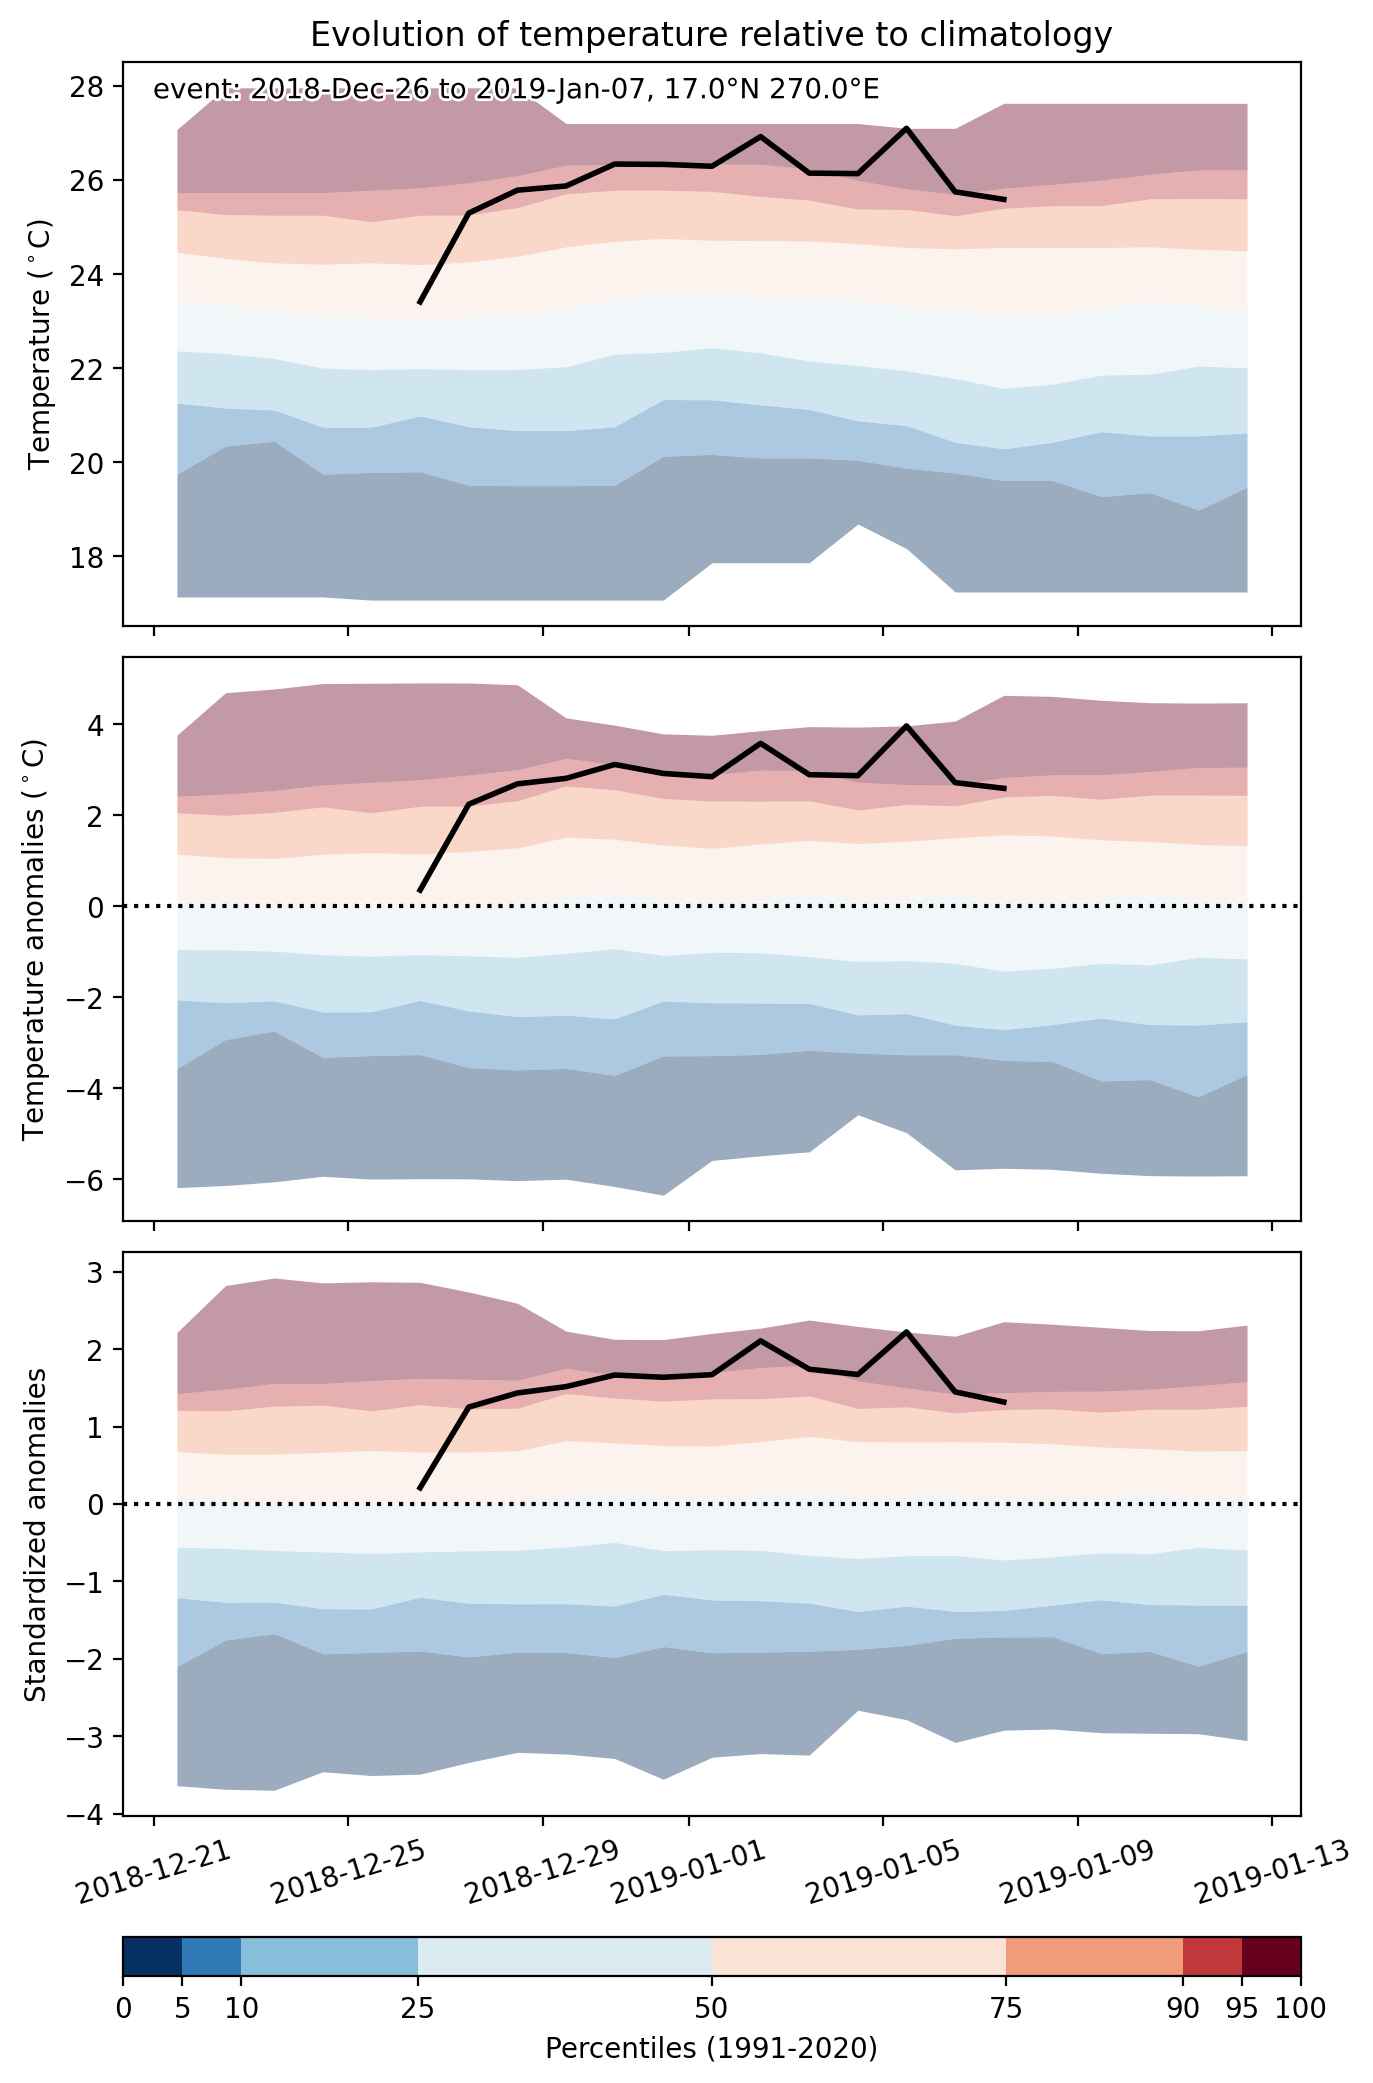


Fig. 2: Evolution of temperature at the center of the event. The climatological percentile distribution is illustrated with color shadings.
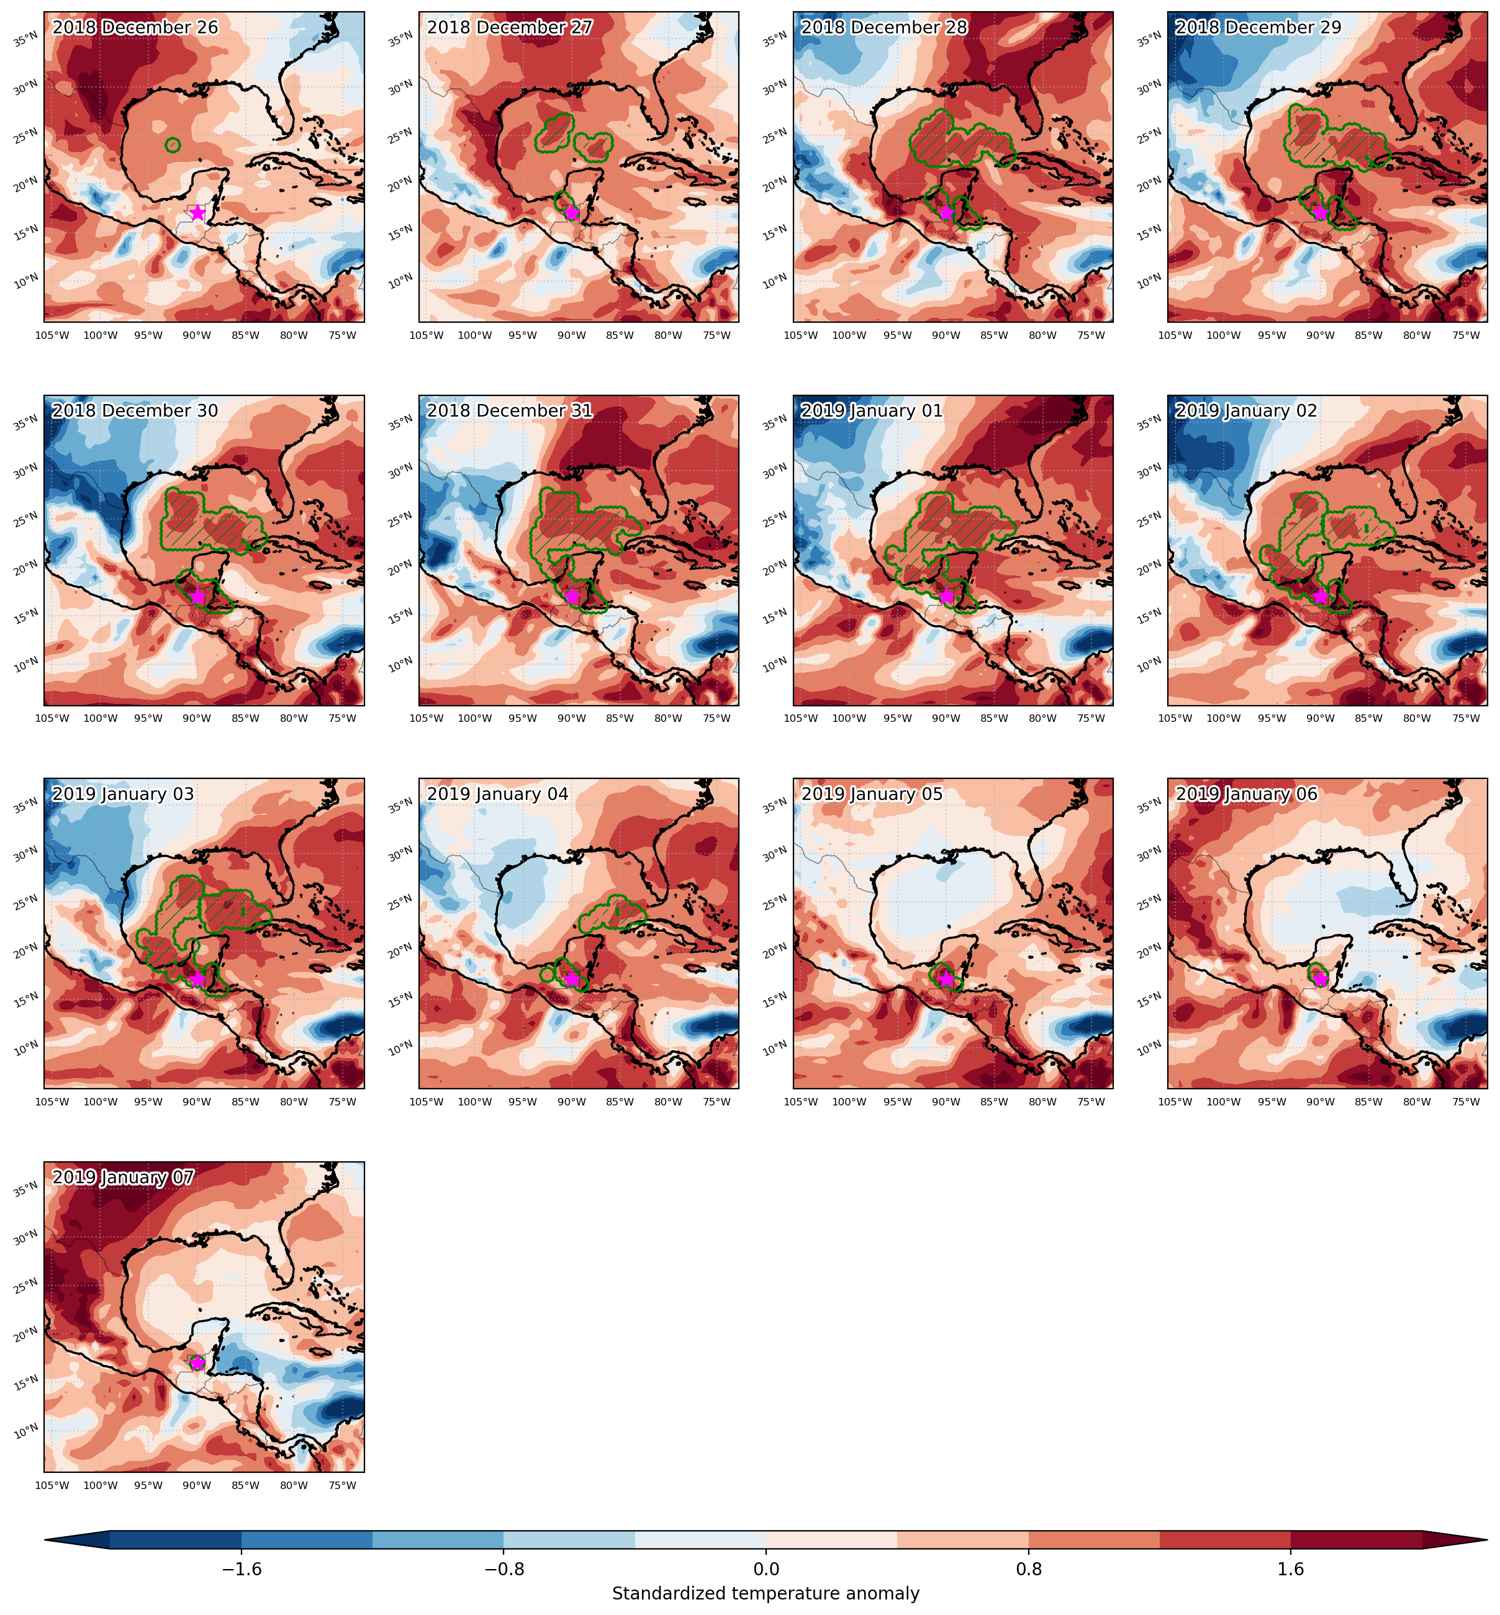


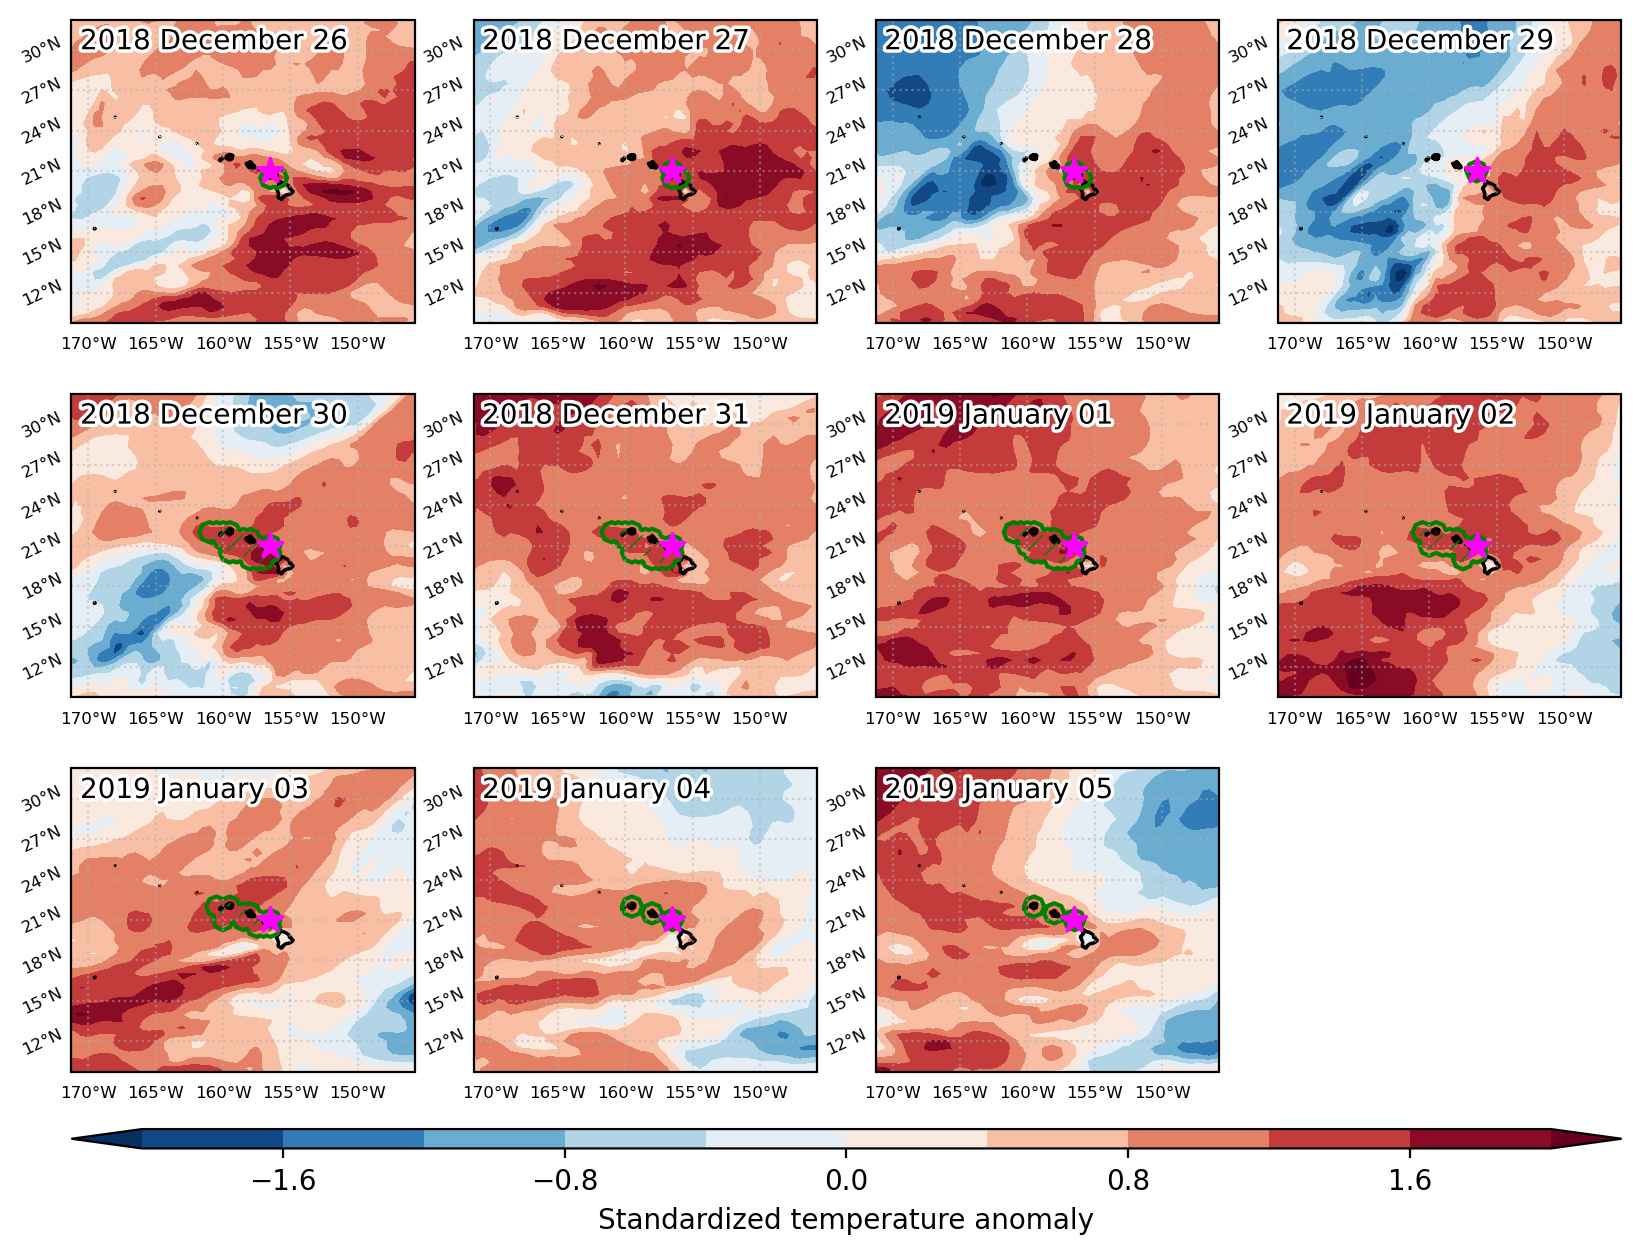
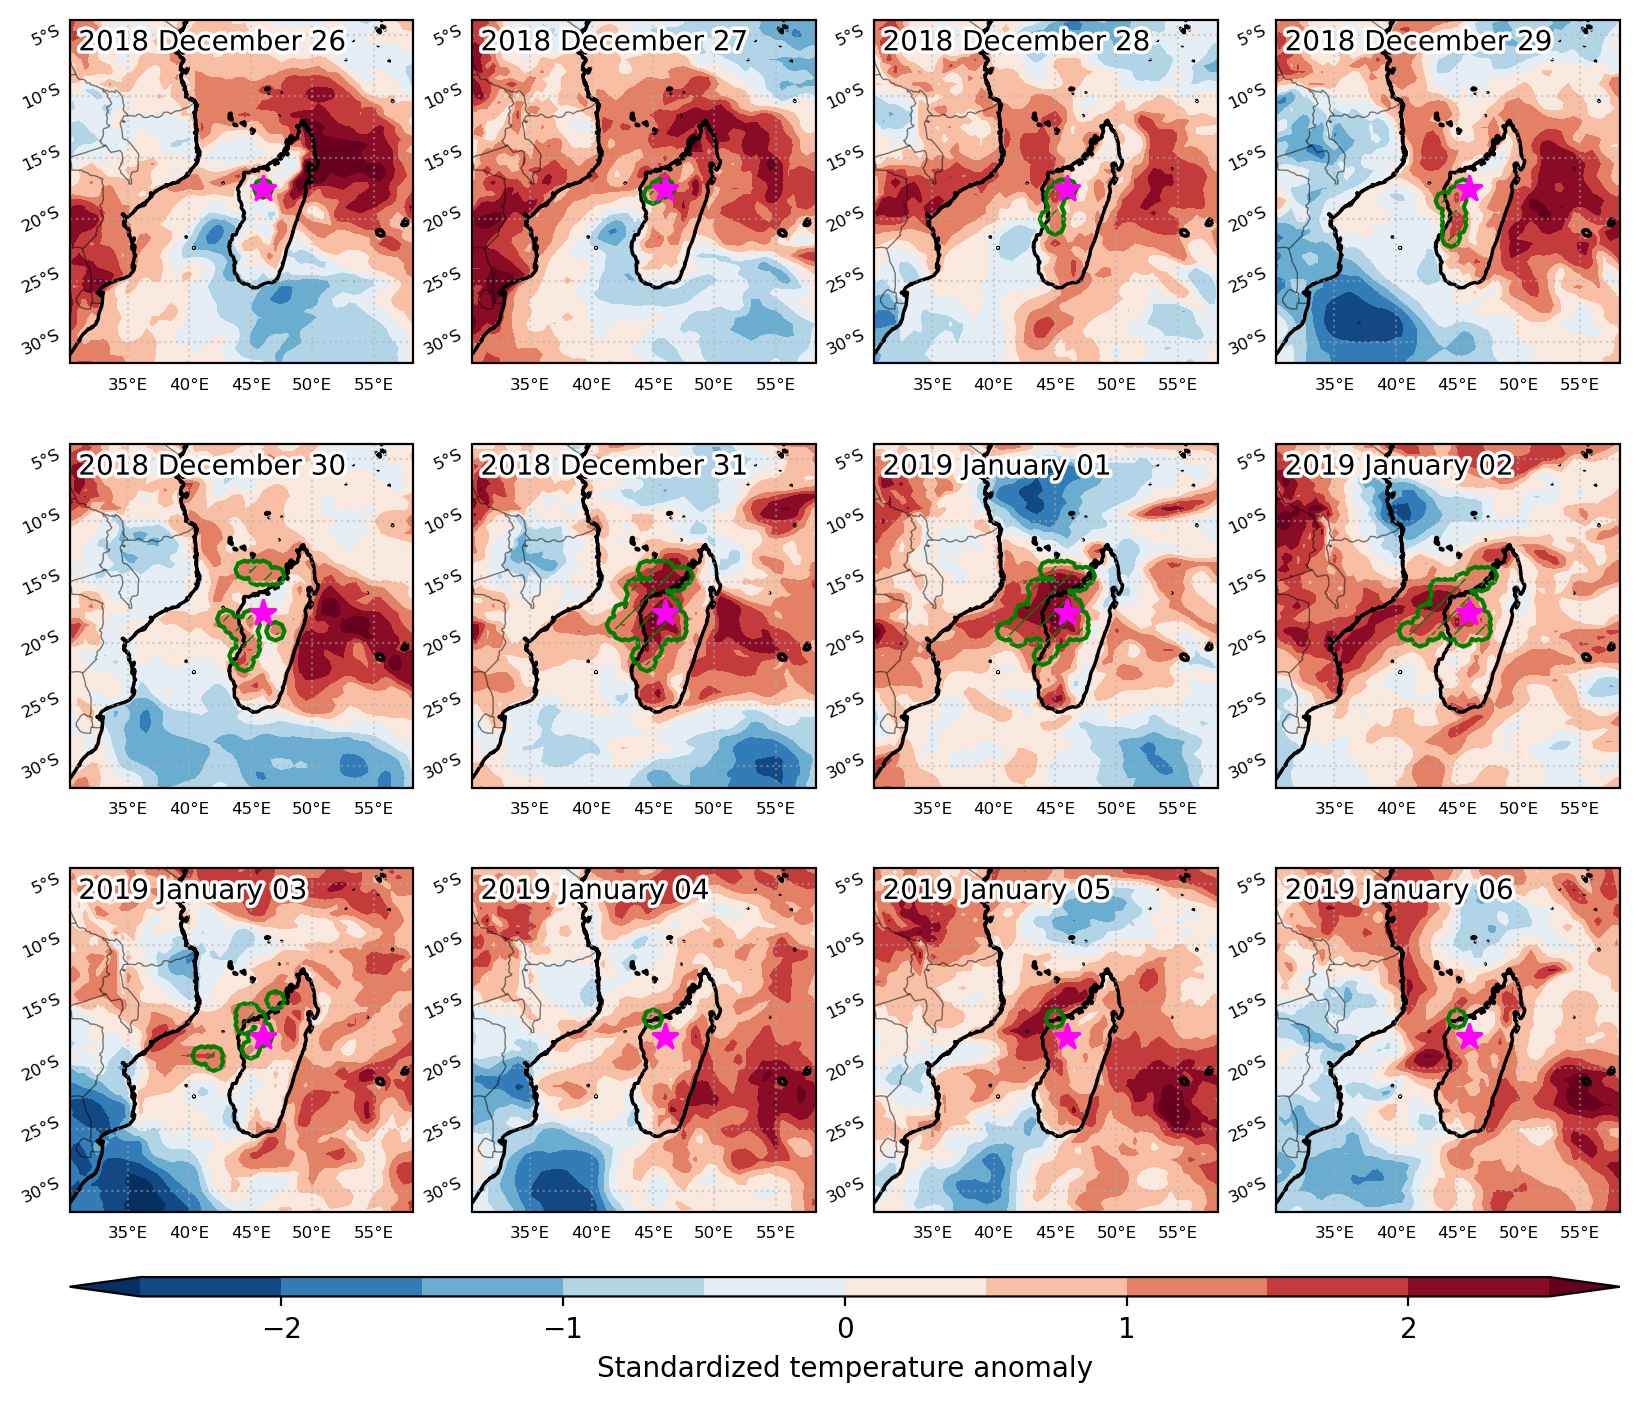
Fig. 3: Maps illustrating the evolution of standardized temperature anomalies during the event.

Event ID: Heat_wave_2018-Dec-26_to_2019-Jan-07_270.0_17.0
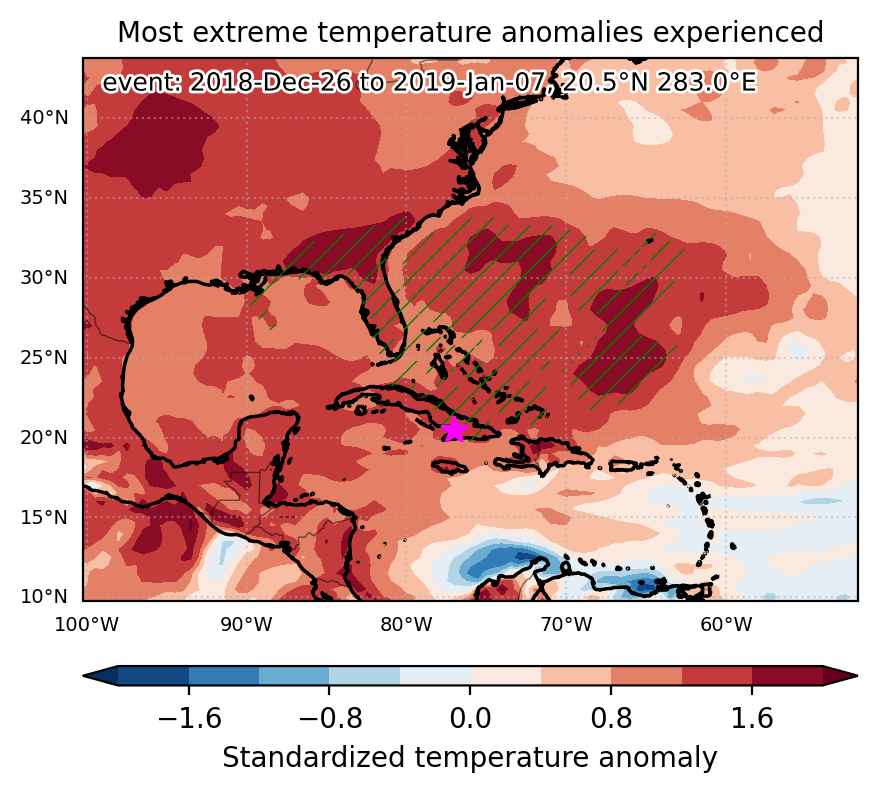
Heat wave occuring from December 26 2018 to January 07 2019 at 20.5°N 283.0°E

Download data: JSON

Event type: Heat wave

Countries affected (identified with ArcGIS Online; provided only for geographical reference):

  • Bahamas
  • Cuba
  • Turks and Caicos Islands
  • United States

Duration: 13 days

Time span: December 26 2018 to January 07 2019

Statistics over entire affected area:

  • Mean temperature anomaly: 3.7 °C
  • Mean temperature: 23.6 °C
  • Maximum temperature anomaly: 11.6 °C
  • Maximum temperature: 28.0 °C

Event center: 20.5°N 283.0°E

Area affected: 2014863 km$^2$


Fig. 1: Map of most extreme temperature anomalies (standardized) experienced during the event. The purple star indicates the center of the extreme event. Green hatching illustrates all areas under the effect of extremes at some time during the event.


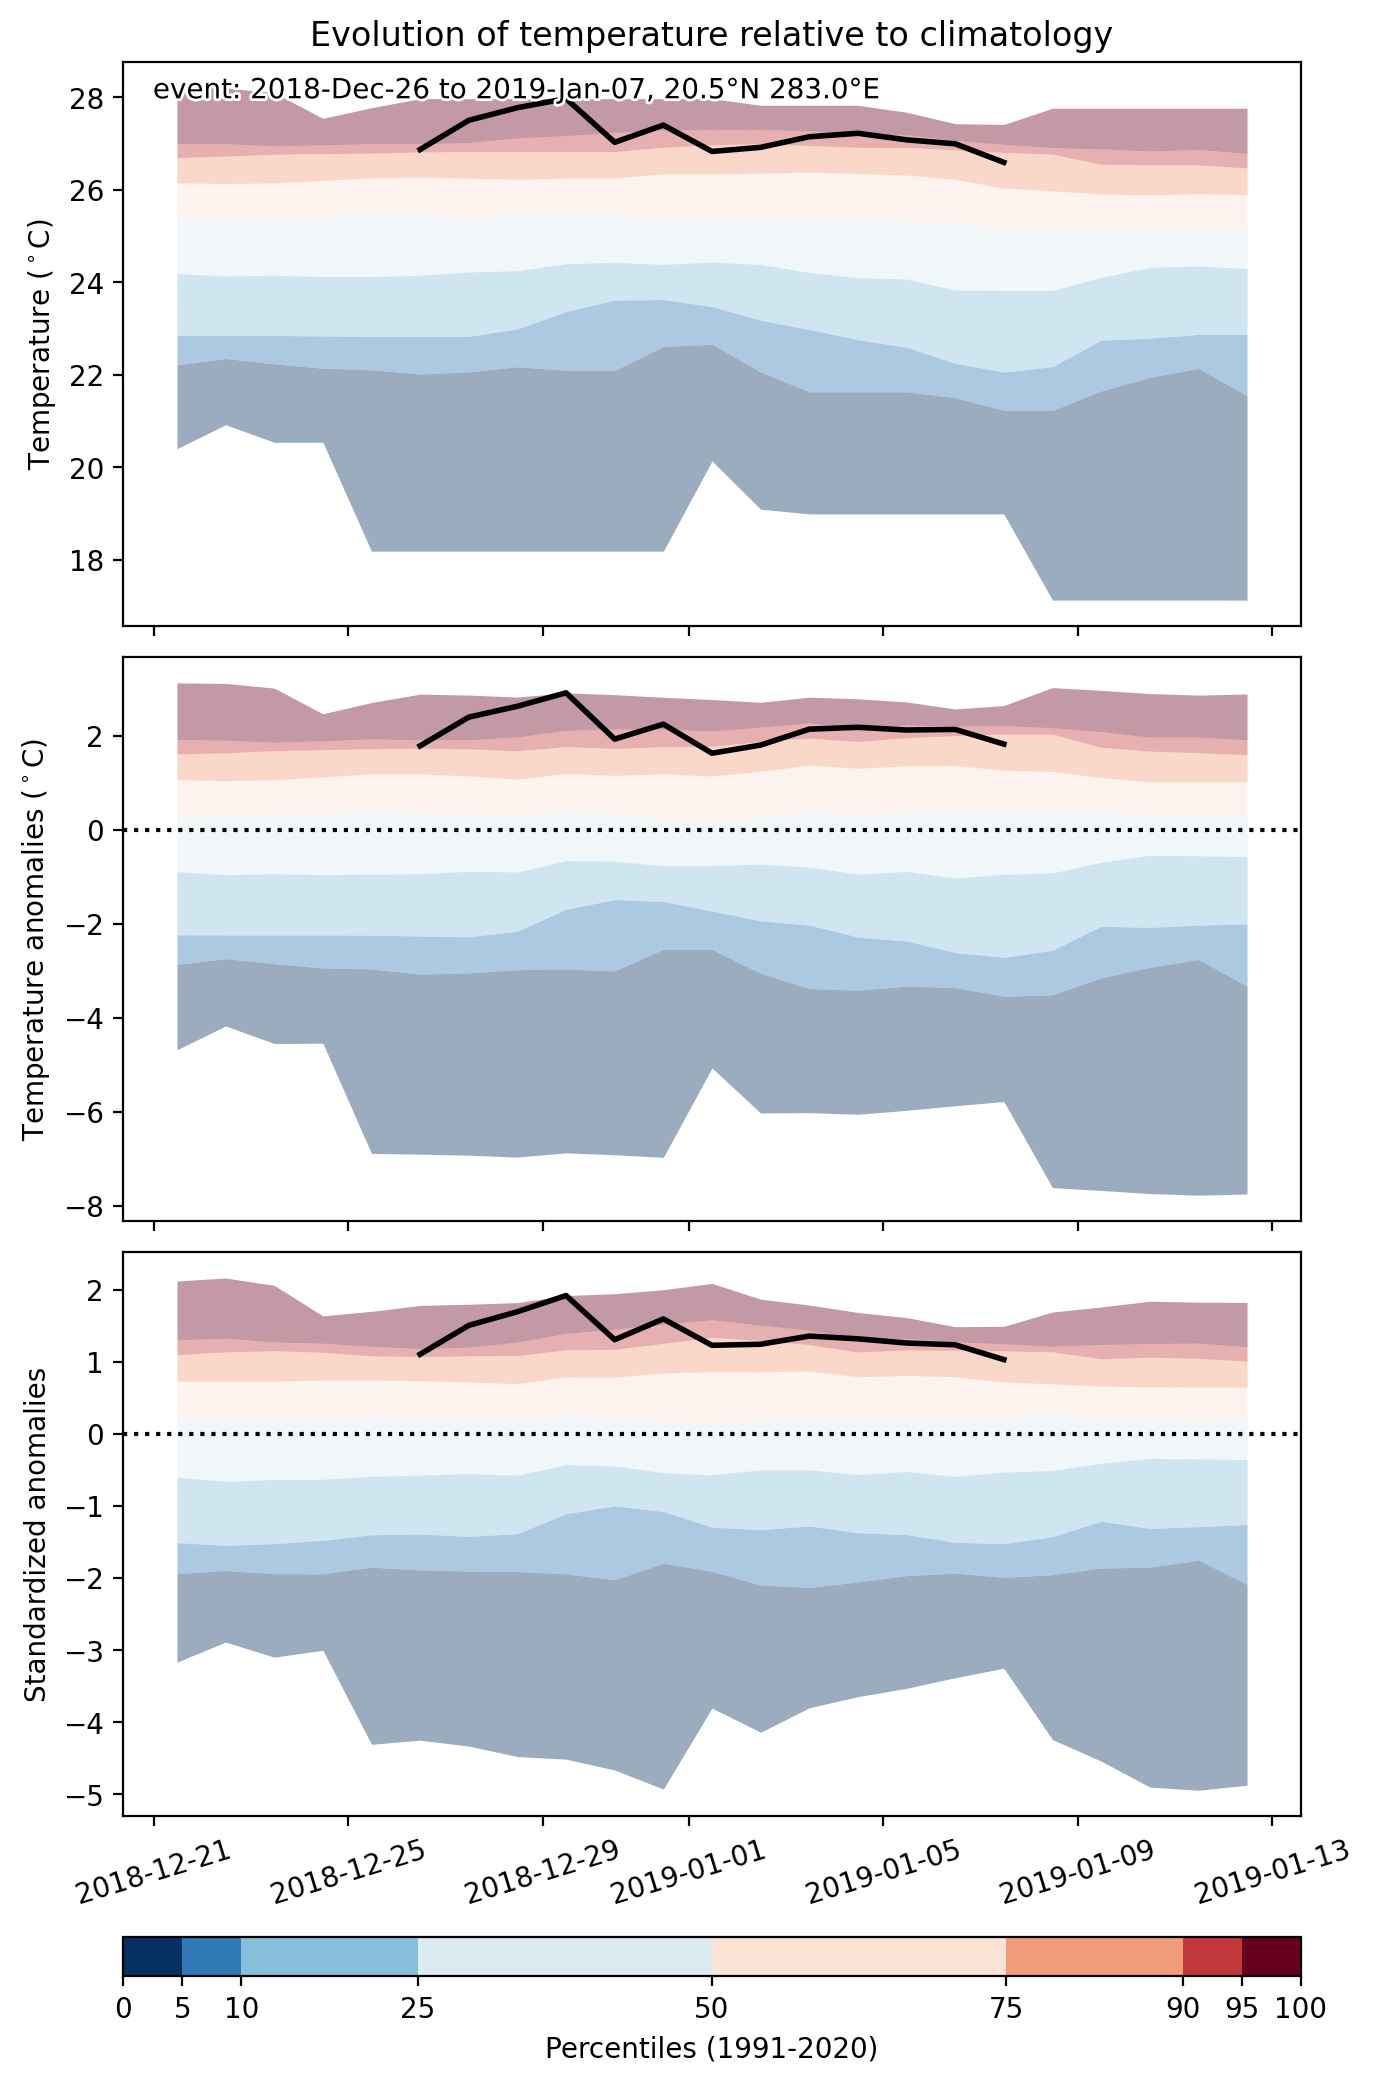
Fig. 2: Evolution of temperature at the center of the event. The climatological percentile distribution is illustrated with color shadings.


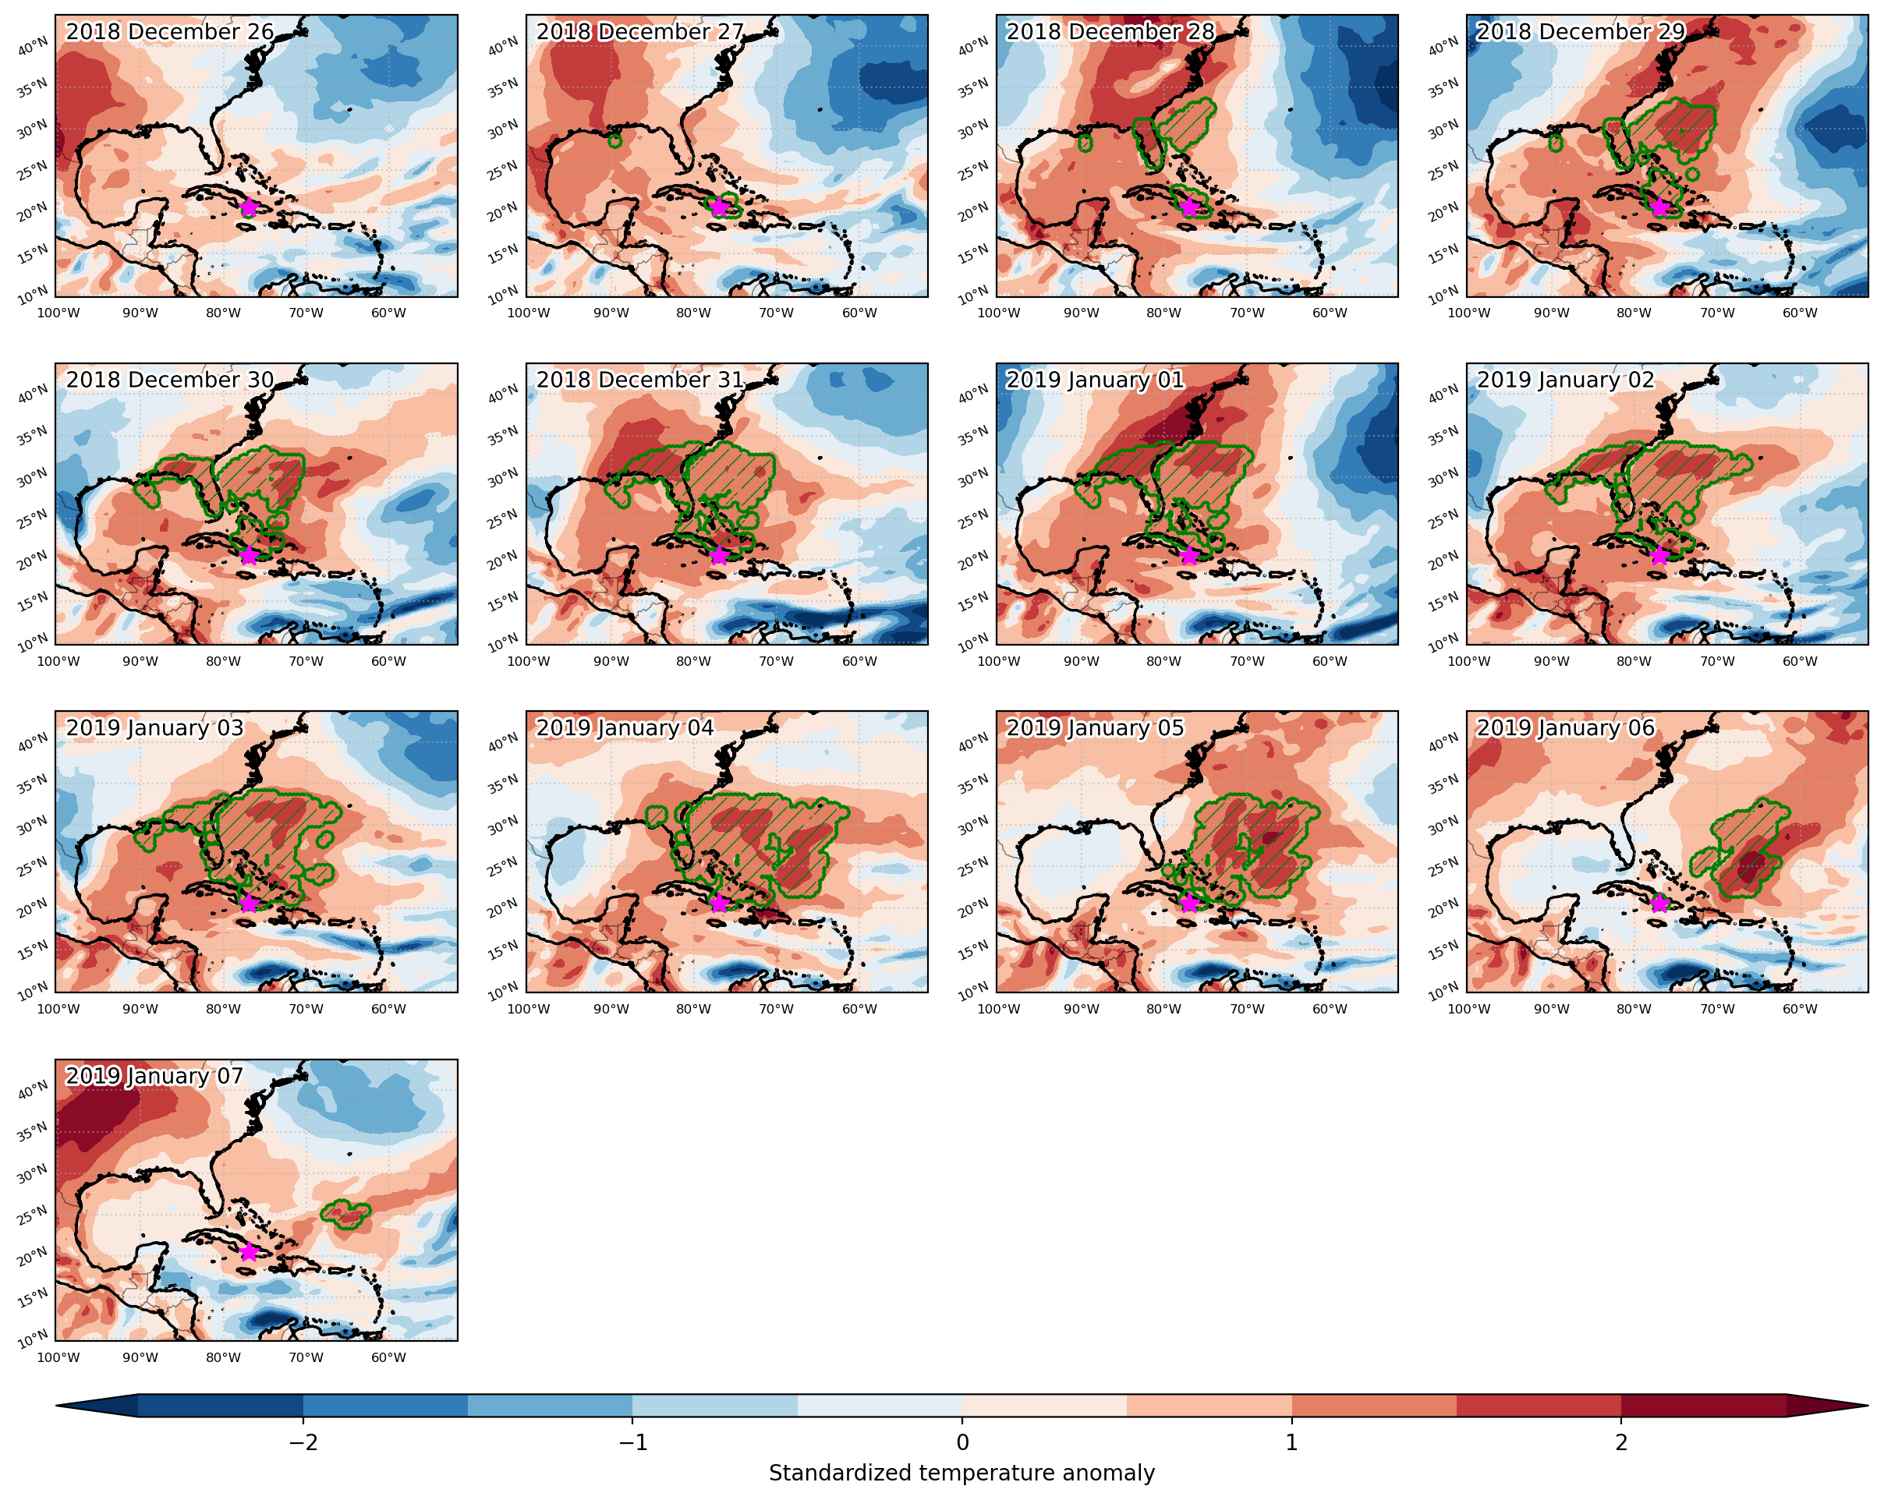
Fig. 3: Maps illustrating the evolution of standardized temperature anomalies during the event.

Event ID: Heat_wave_2018-Dec-26_to_2019-Jan-07_283.0_20.5

Heat wave occuring from December 26 2018 to January 05 2019 at 21.0°N 203.5°E

Download data: JSON

Event type: Heat wave

Countries affected (identified with ArcGIS Online; provided only for geographical reference):

  • United States

Duration: 11 days

Time span: December 26 2018 to January 05 2019

Statistics over entire affected area:

  • Mean temperature anomaly: 1.2 °C
  • Mean temperature: 24.3 °C
  • Maximum temperature anomaly: 2.0 °C
  • Maximum temperature: 25.2 °C

Event center: 21.0°N 203.5°E

Area affected: 77920 km$^2$


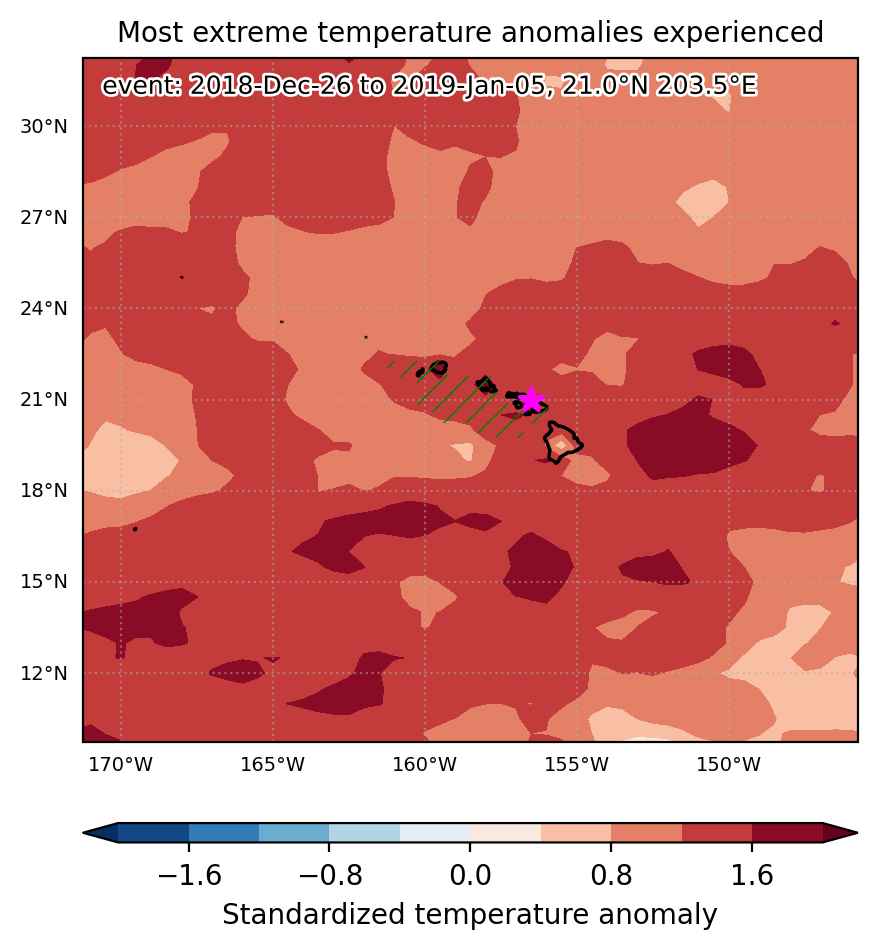
Fig. 1: Map of most extreme temperature anomalies (standardized) experienced during the event. The purple star indicates the center of the extreme event. Green hatching illustrates all areas under the effect of extremes at some time during the event.


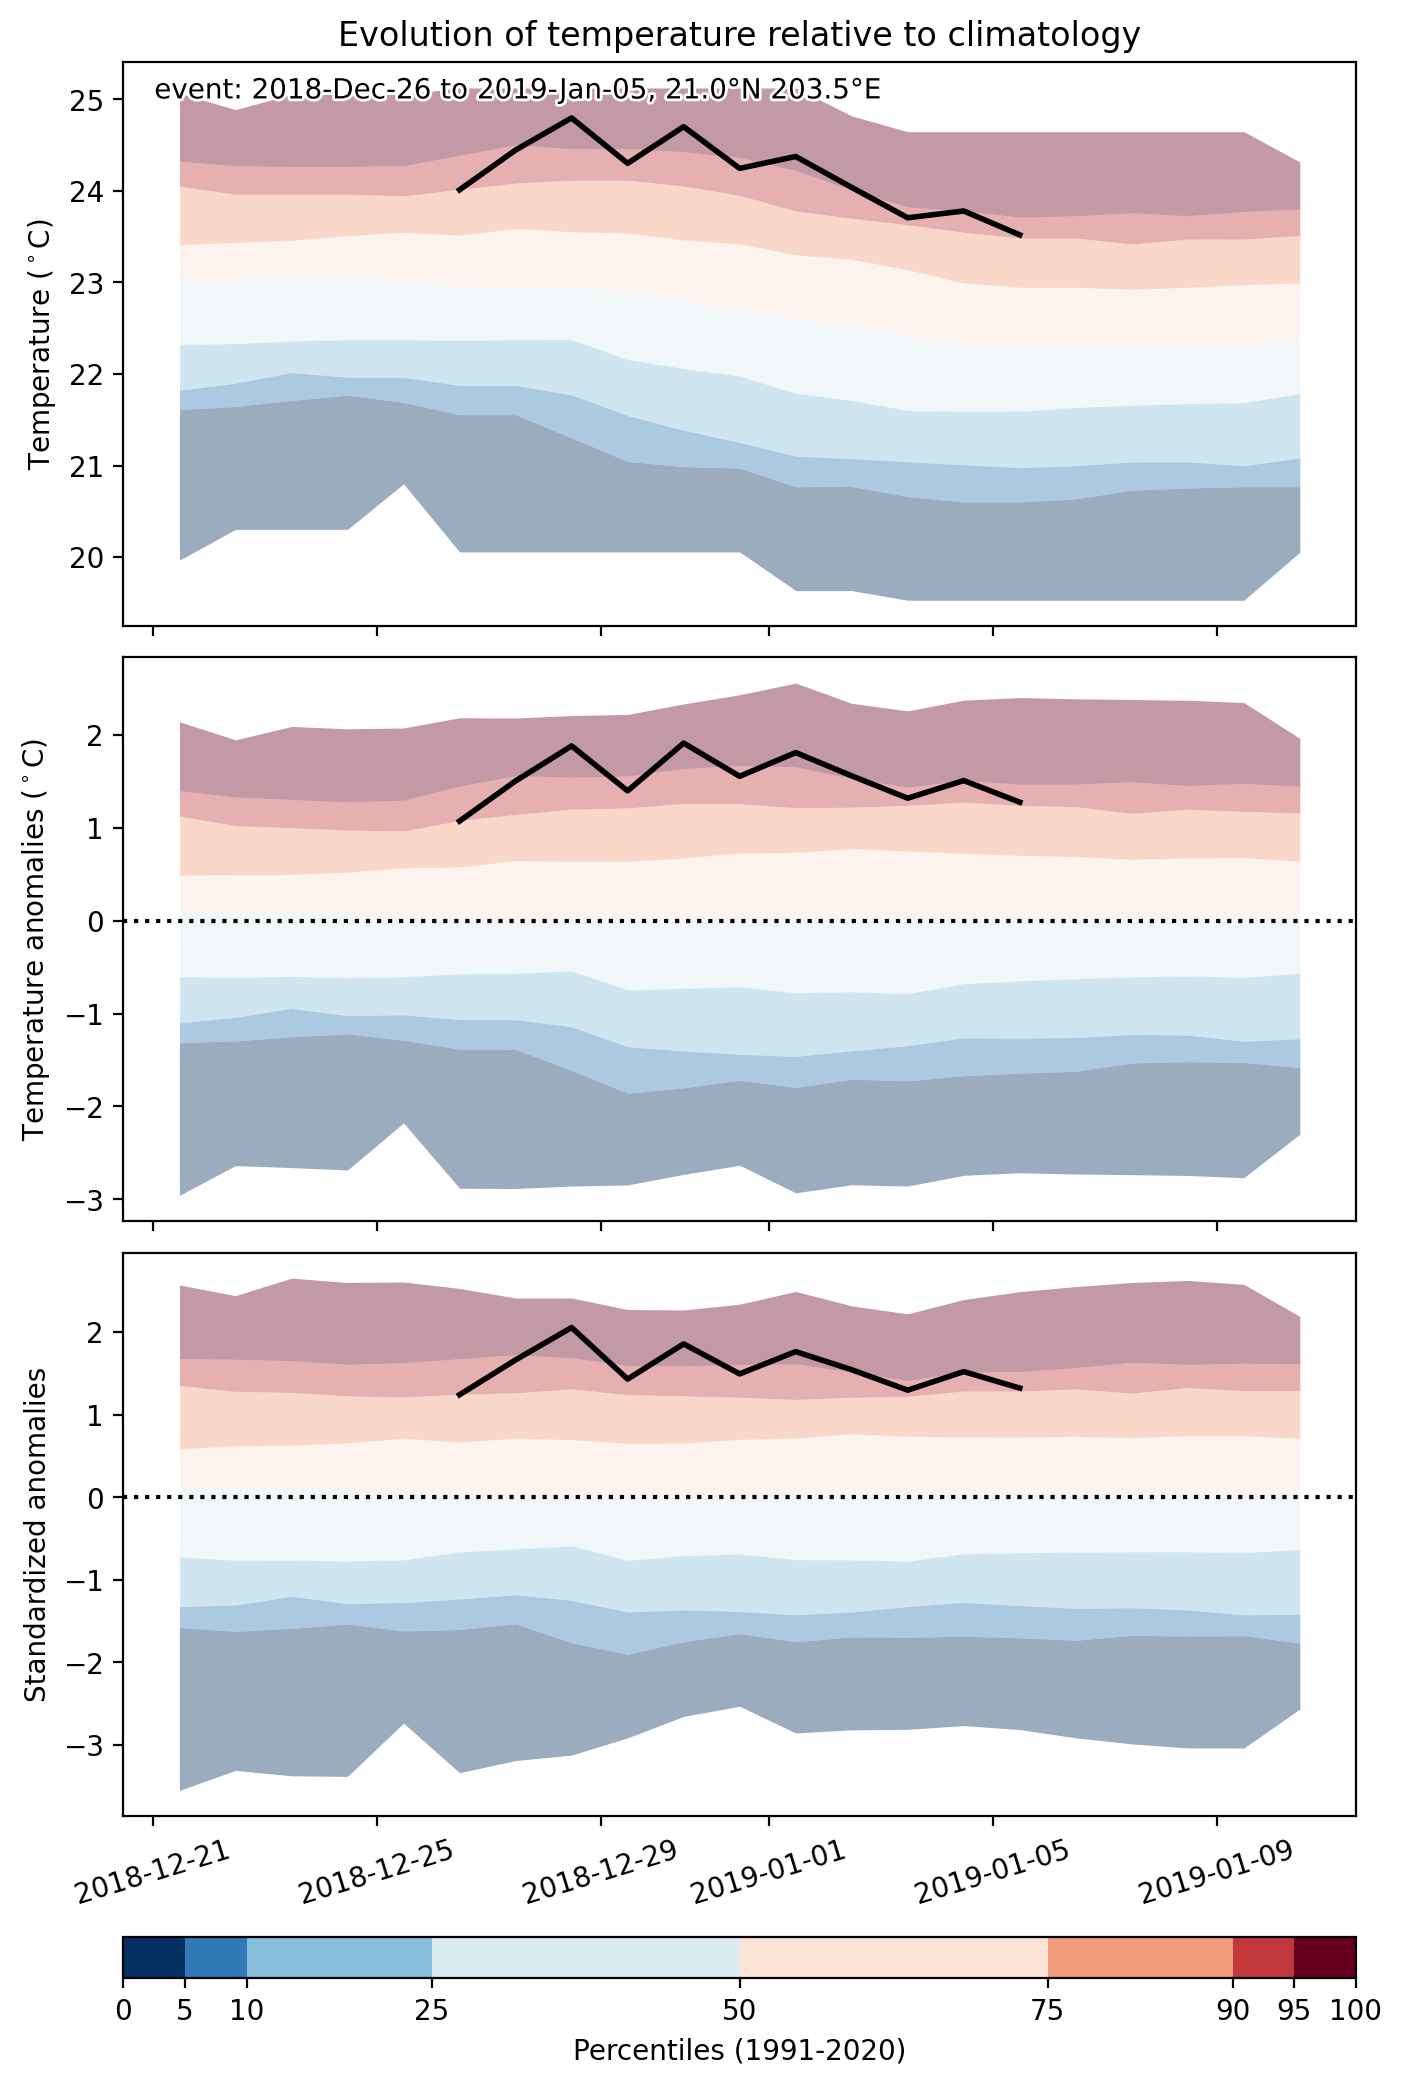
Fig. 2: Evolution of temperature at the center of the event. The climatological percentile distribution is illustrated with color shadings.


Fig. 3: Maps illustrating the evolution of standardized temperature anomalies during the event.

Event ID: Heat_wave_2018-Dec-26_to_2019-Jan-05_203.5_21.0

Heat wave occuring from December 26 2018 to January 04 2019 at 4.0°N 290.0°E

Download data: JSON

Event type: Heat wave

Countries affected (identified with ArcGIS Online; provided only for geographical reference):

  • Colombia

Duration: 10 days

Time span: December 26 2018 to January 04 2019

Statistics over entire affected area:

  • Mean temperature anomaly: 1.4 °C
  • Mean temperature: 27.1 °C
  • Maximum temperature anomaly: 2.3 °C
  • Maximum temperature: 28.9 °C

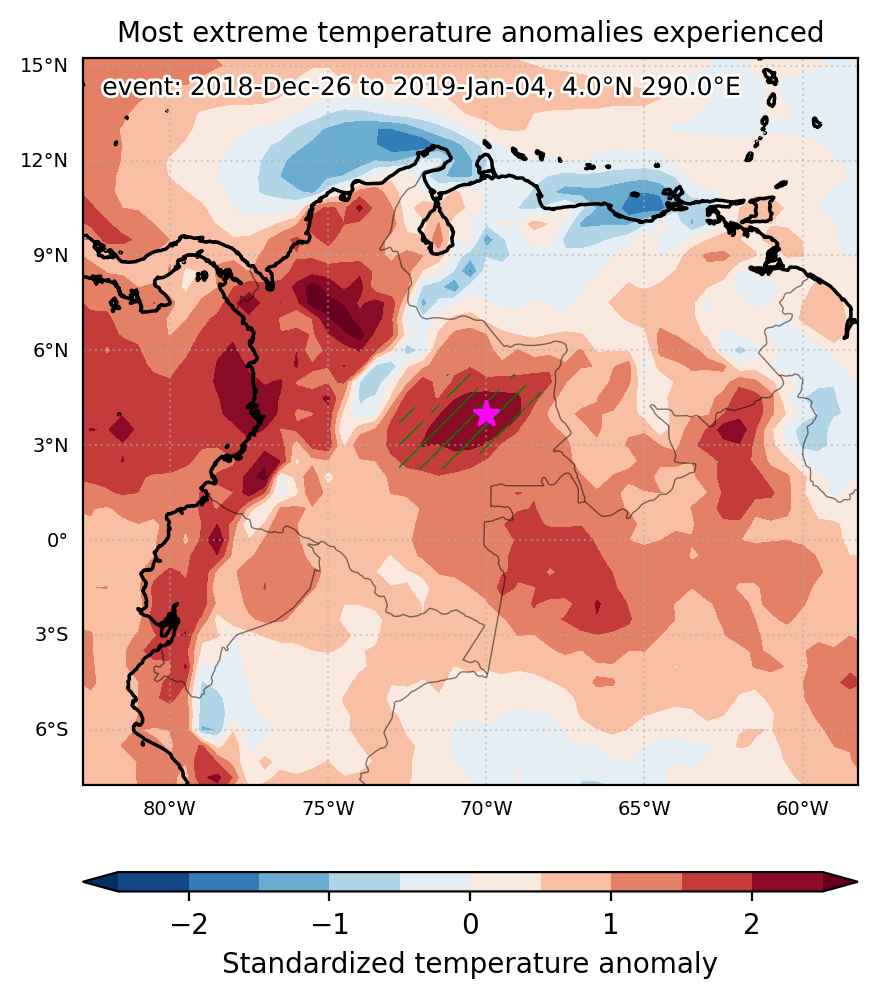
Event center: 4.0°N 290.0°E

Area affected: 101782 km$^2$


Fig. 1: Map of most extreme temperature anomalies (standardized) experienced during the event. The purple star indicates the center of the extreme event. Green hatching illustrates all areas under the effect of extremes at some time during the event.


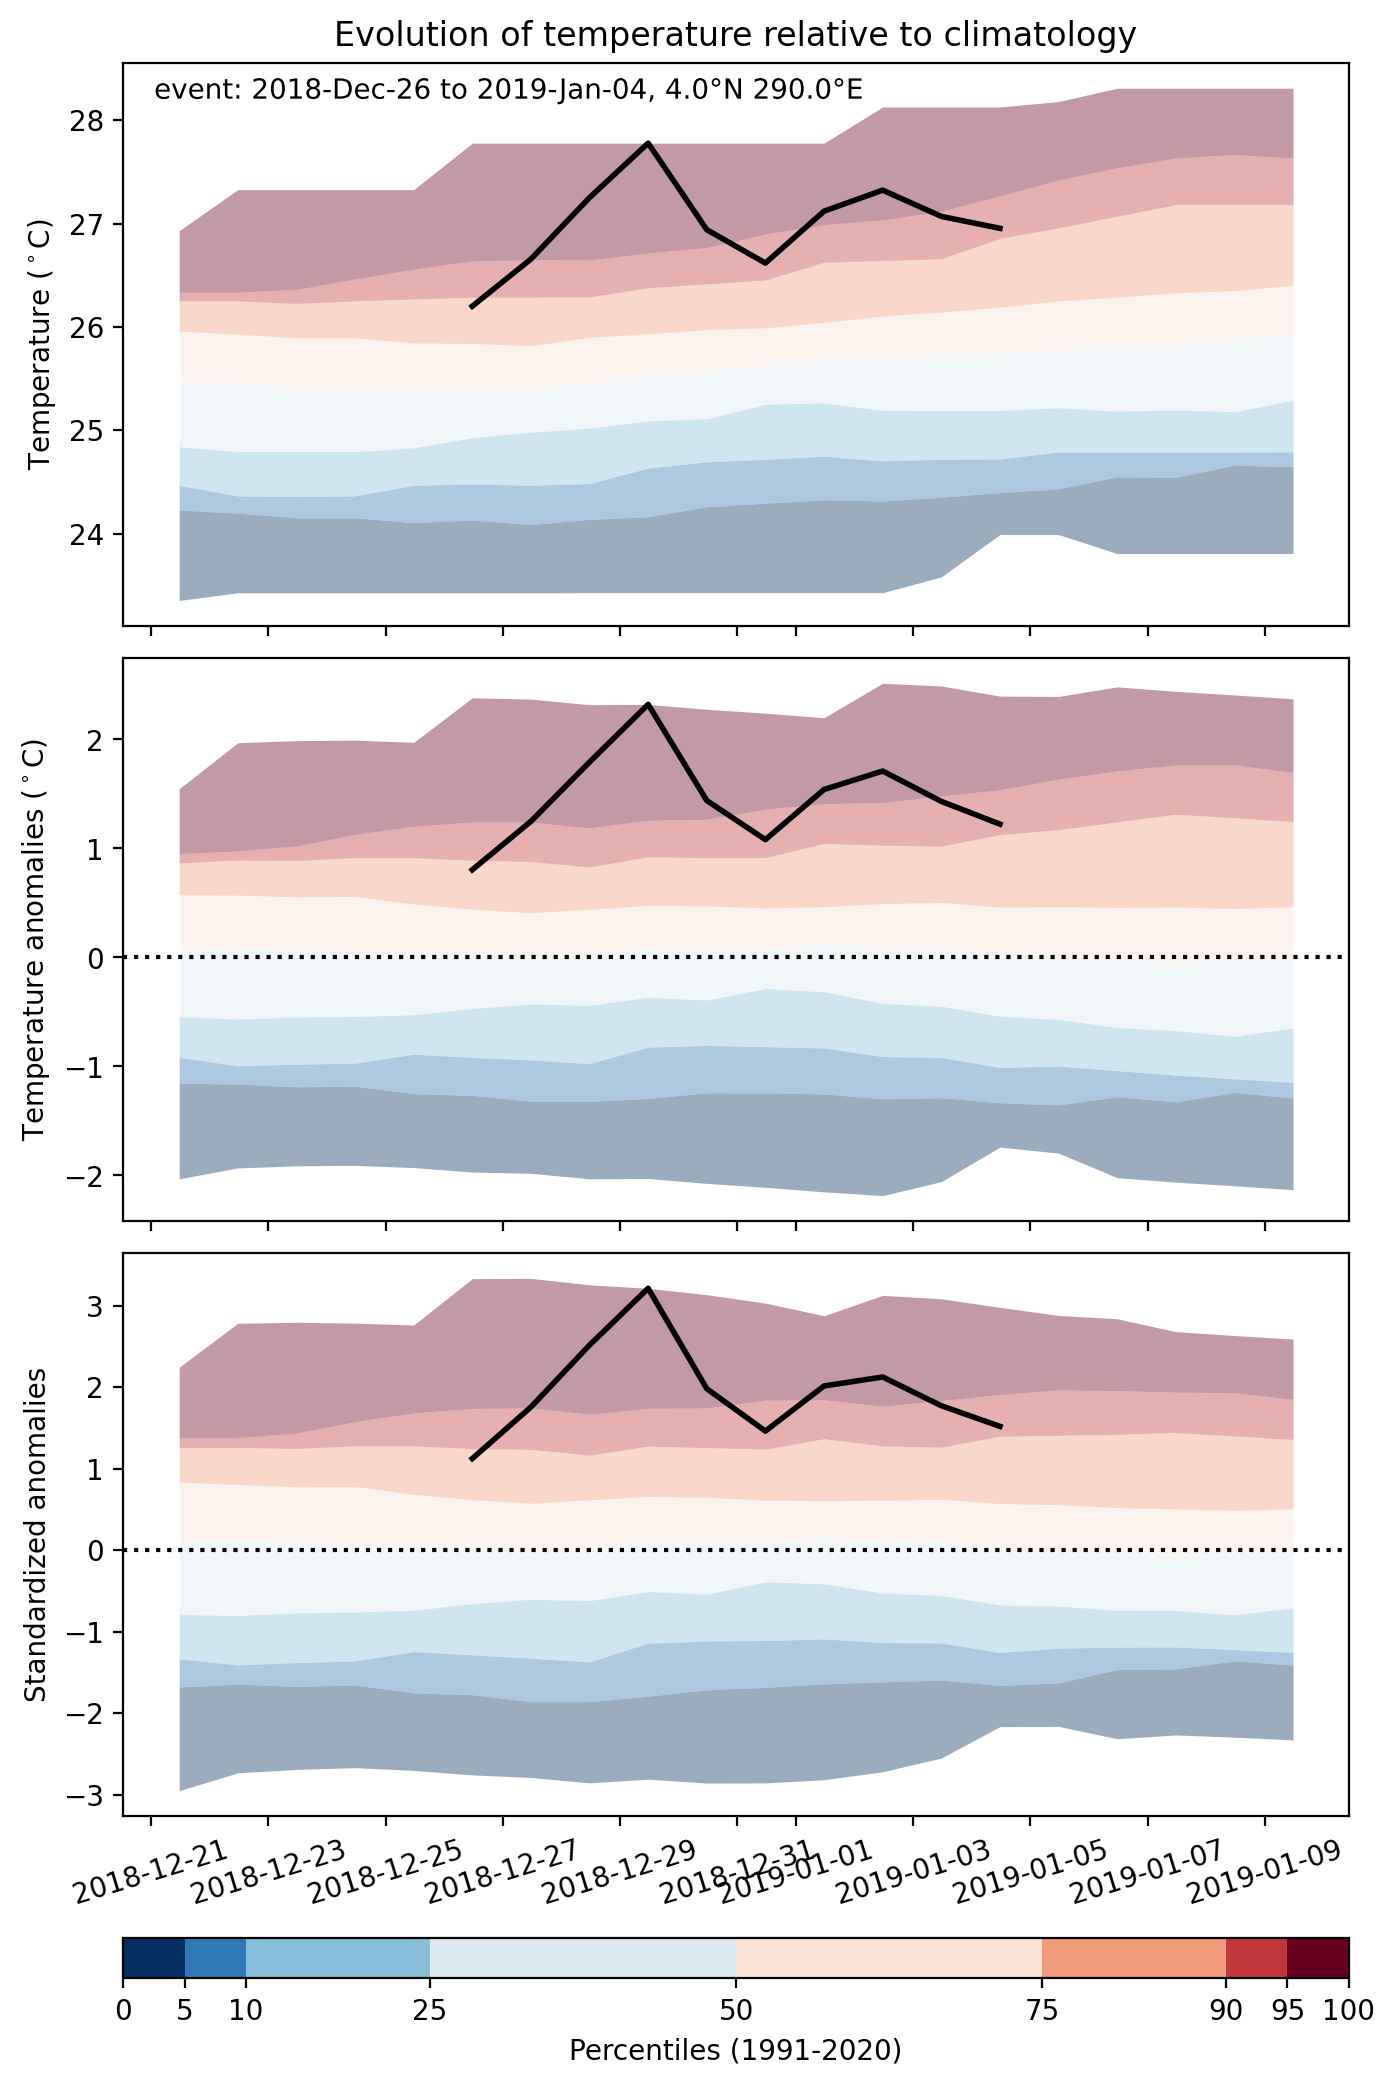
Fig. 2: Evolution of temperature at the center of the event. The climatological percentile distribution is illustrated with color shadings.


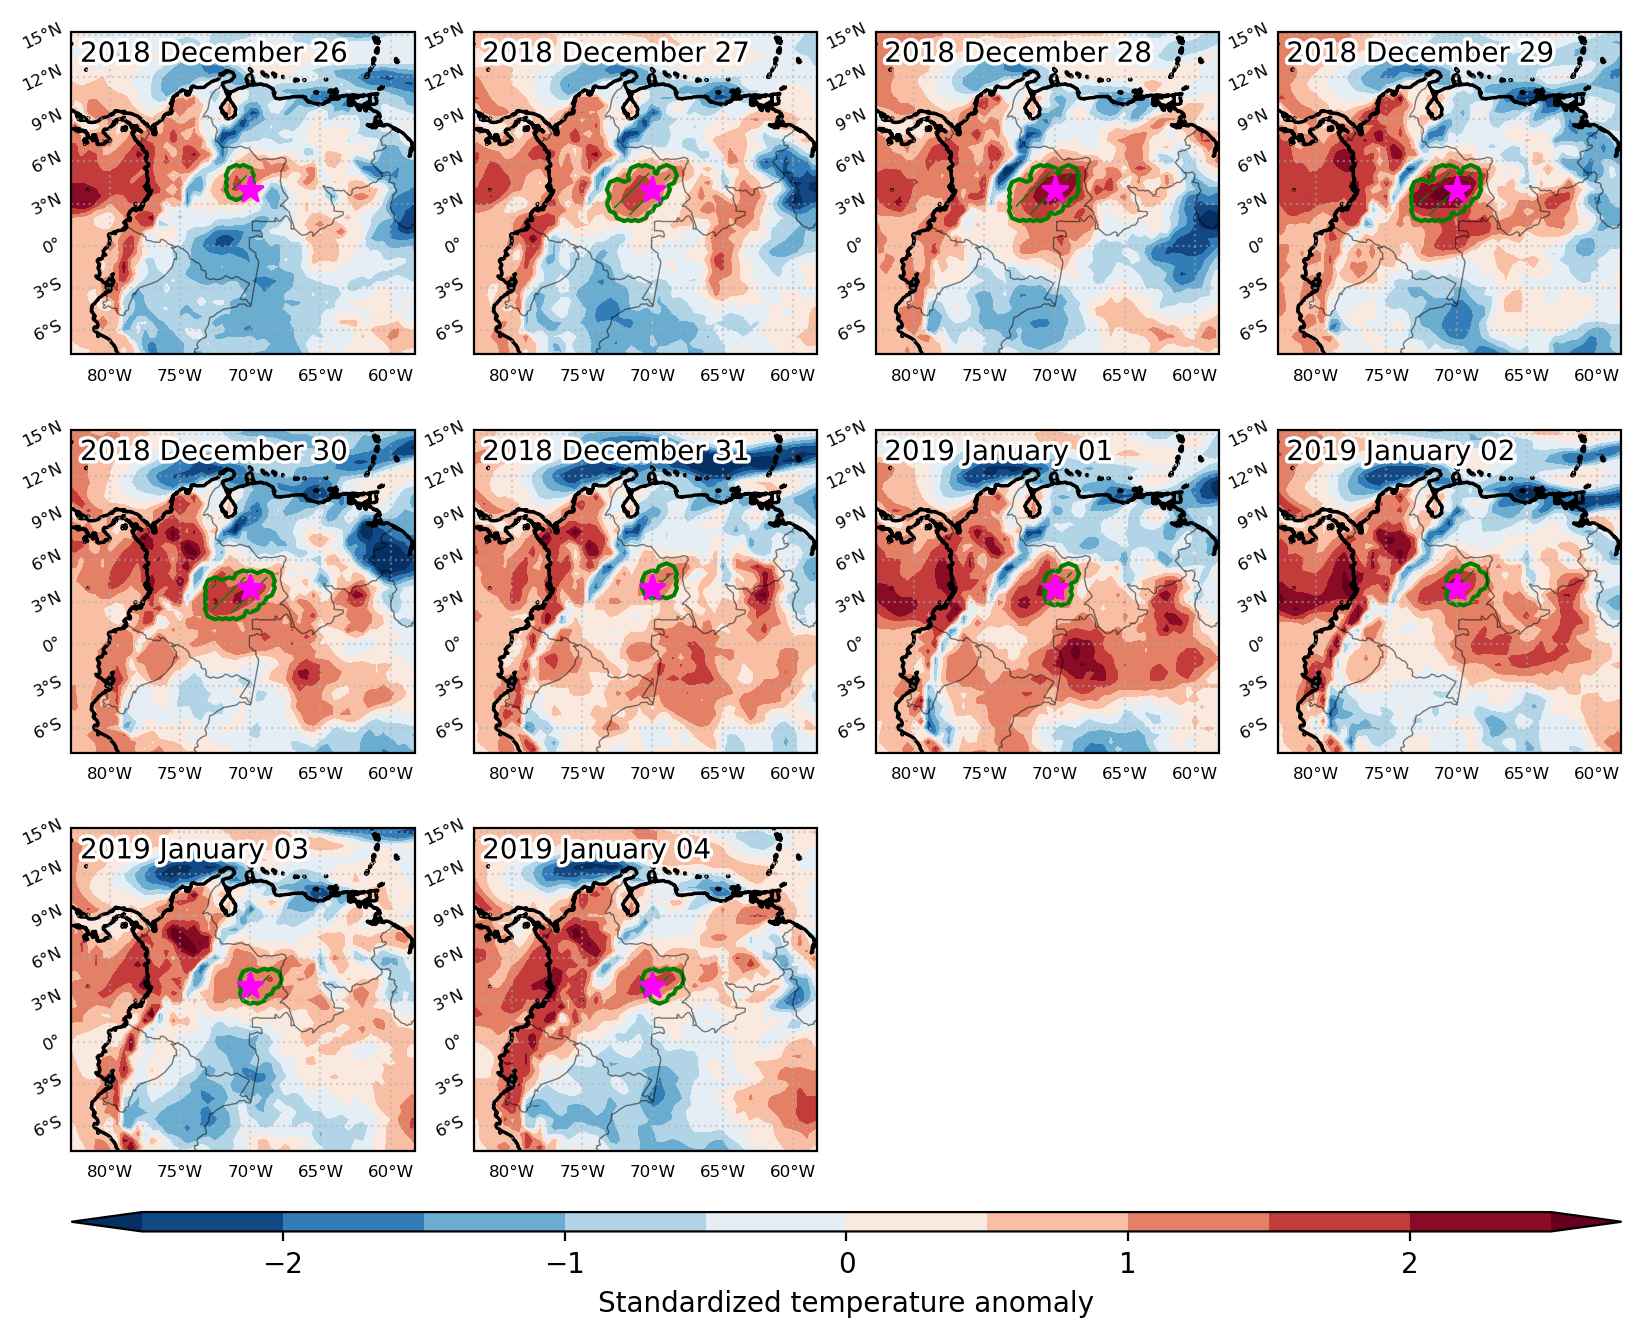
Fig. 3: Maps illustrating the evolution of standardized temperature anomalies during the event.

Event ID: Heat_wave_2018-Dec-26_to_2019-Jan-04_290.0_4.0

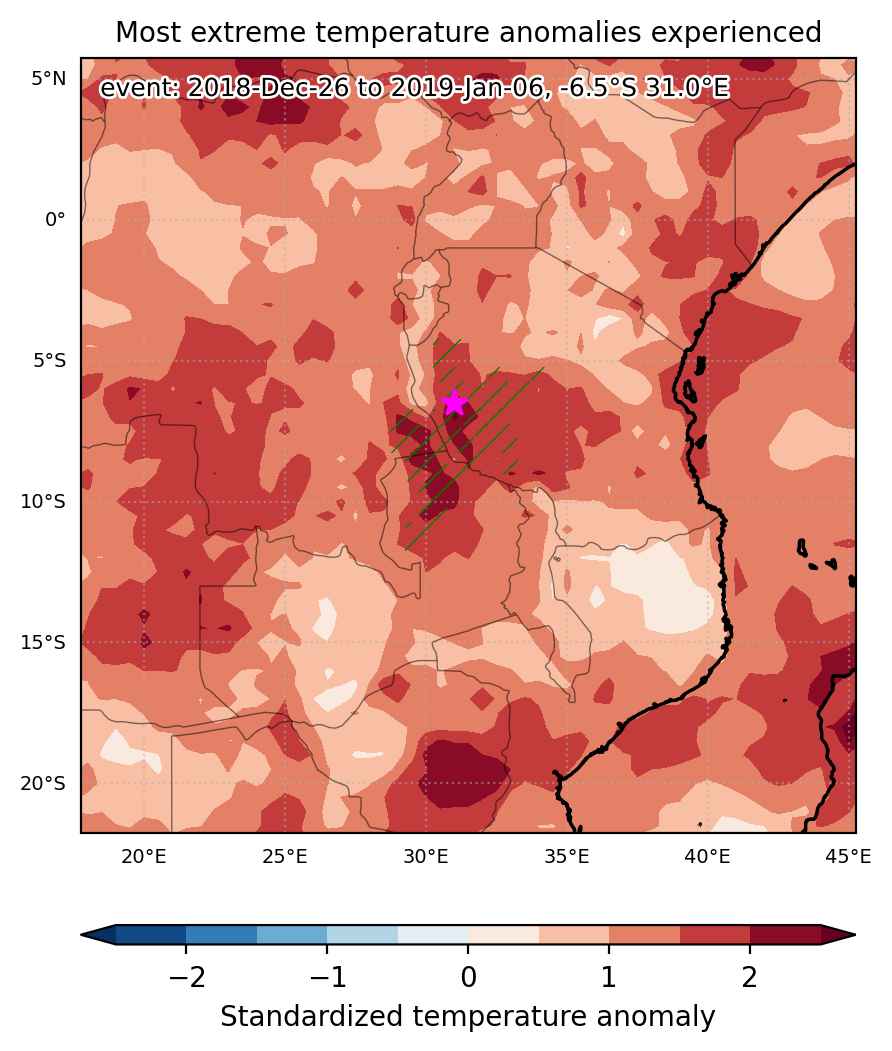
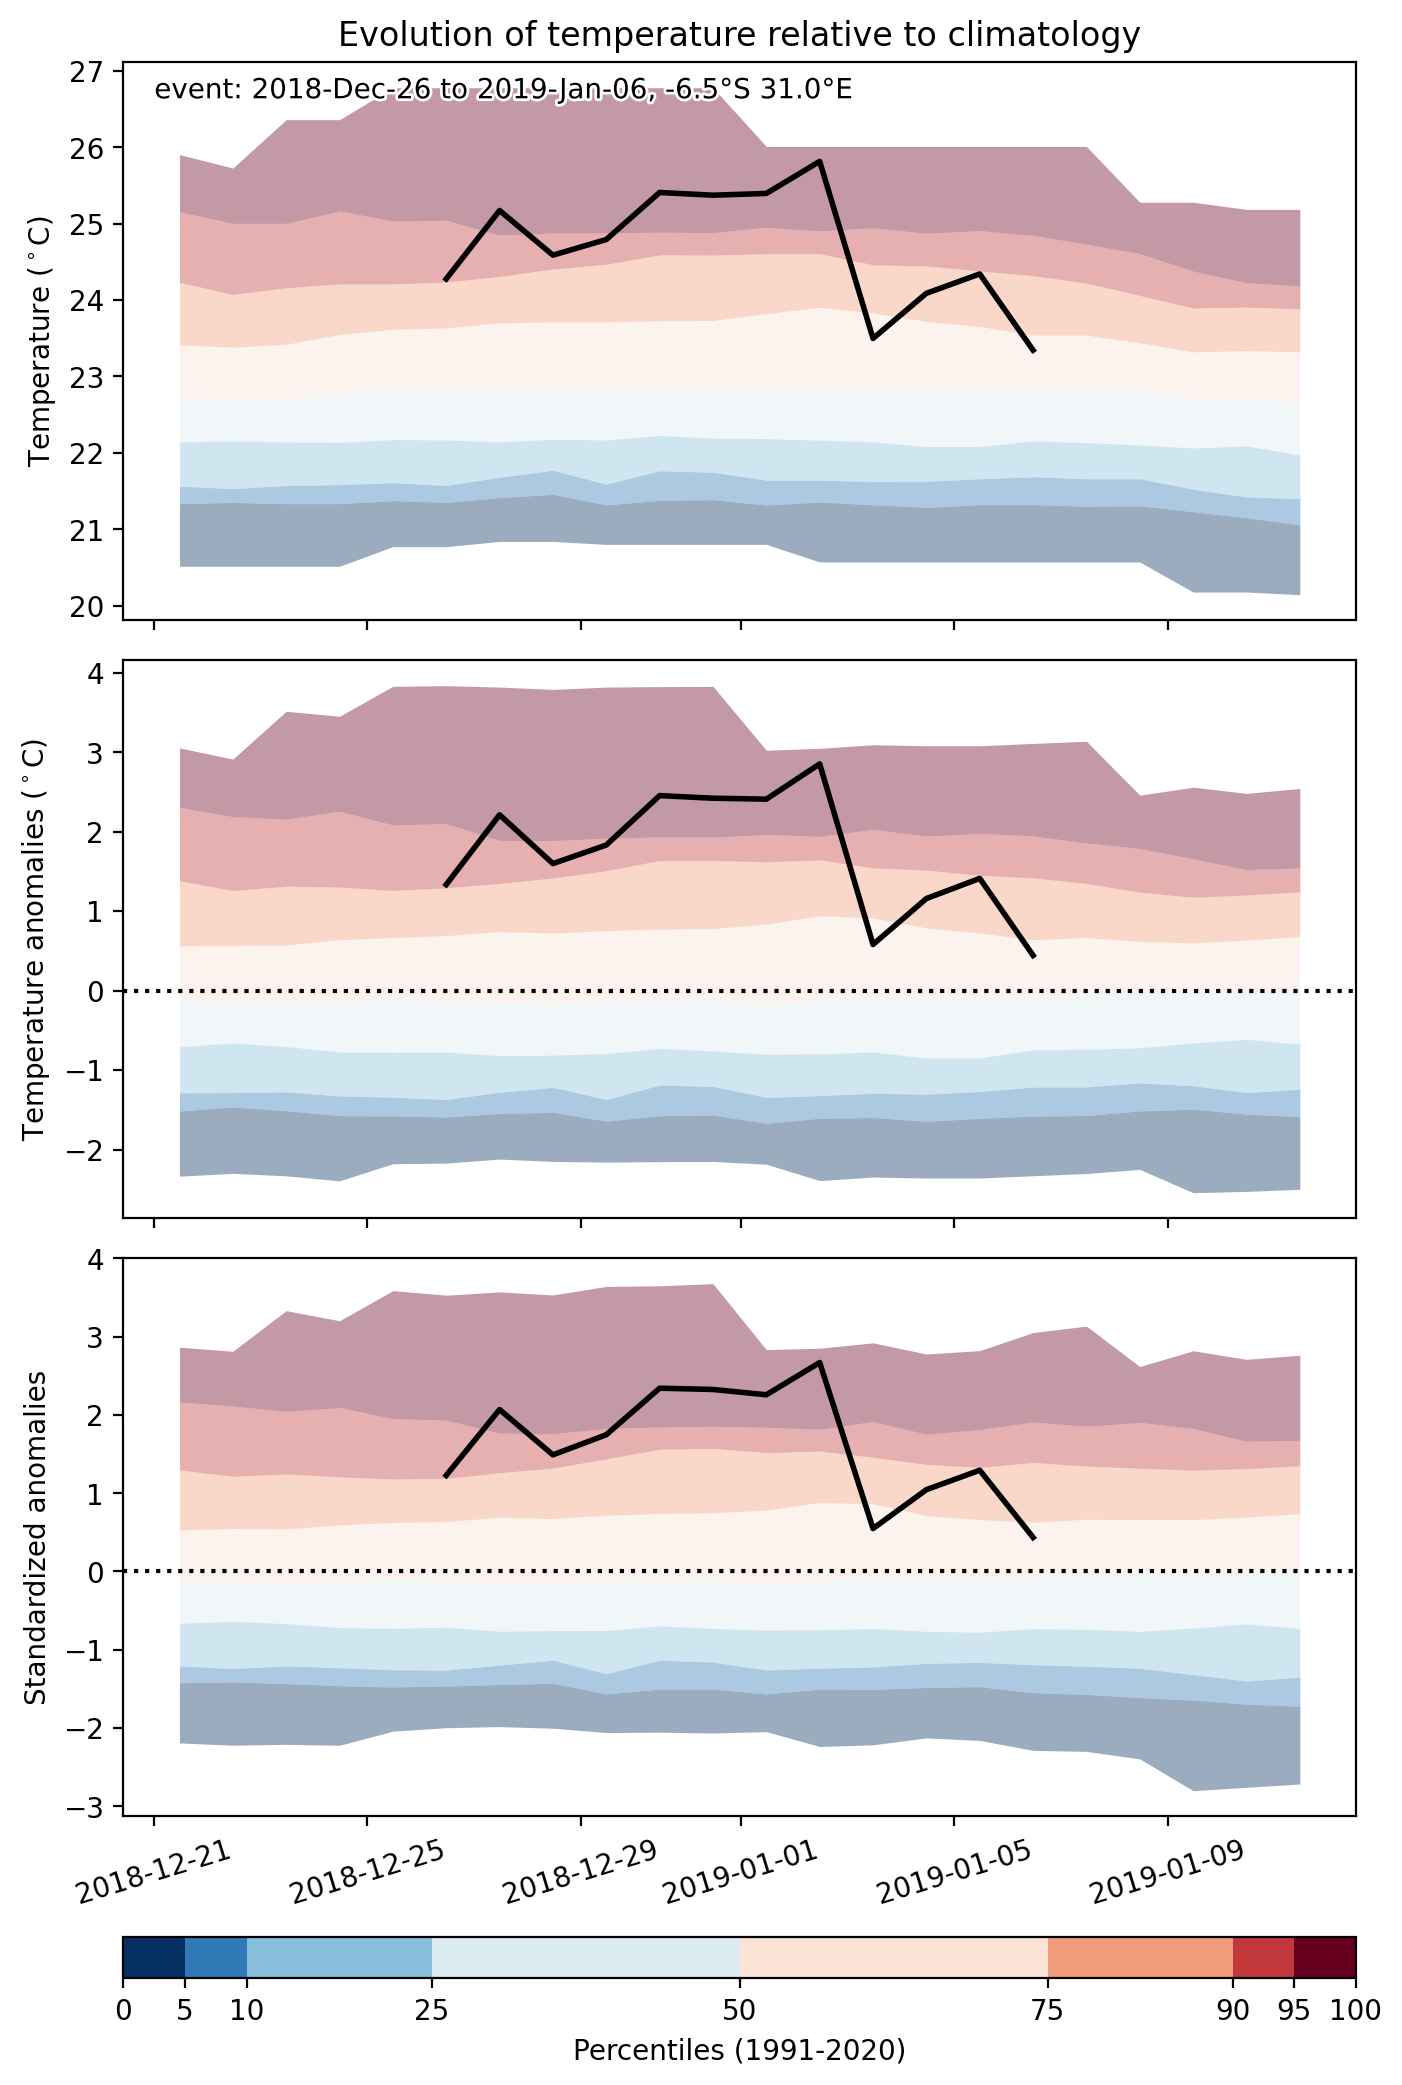
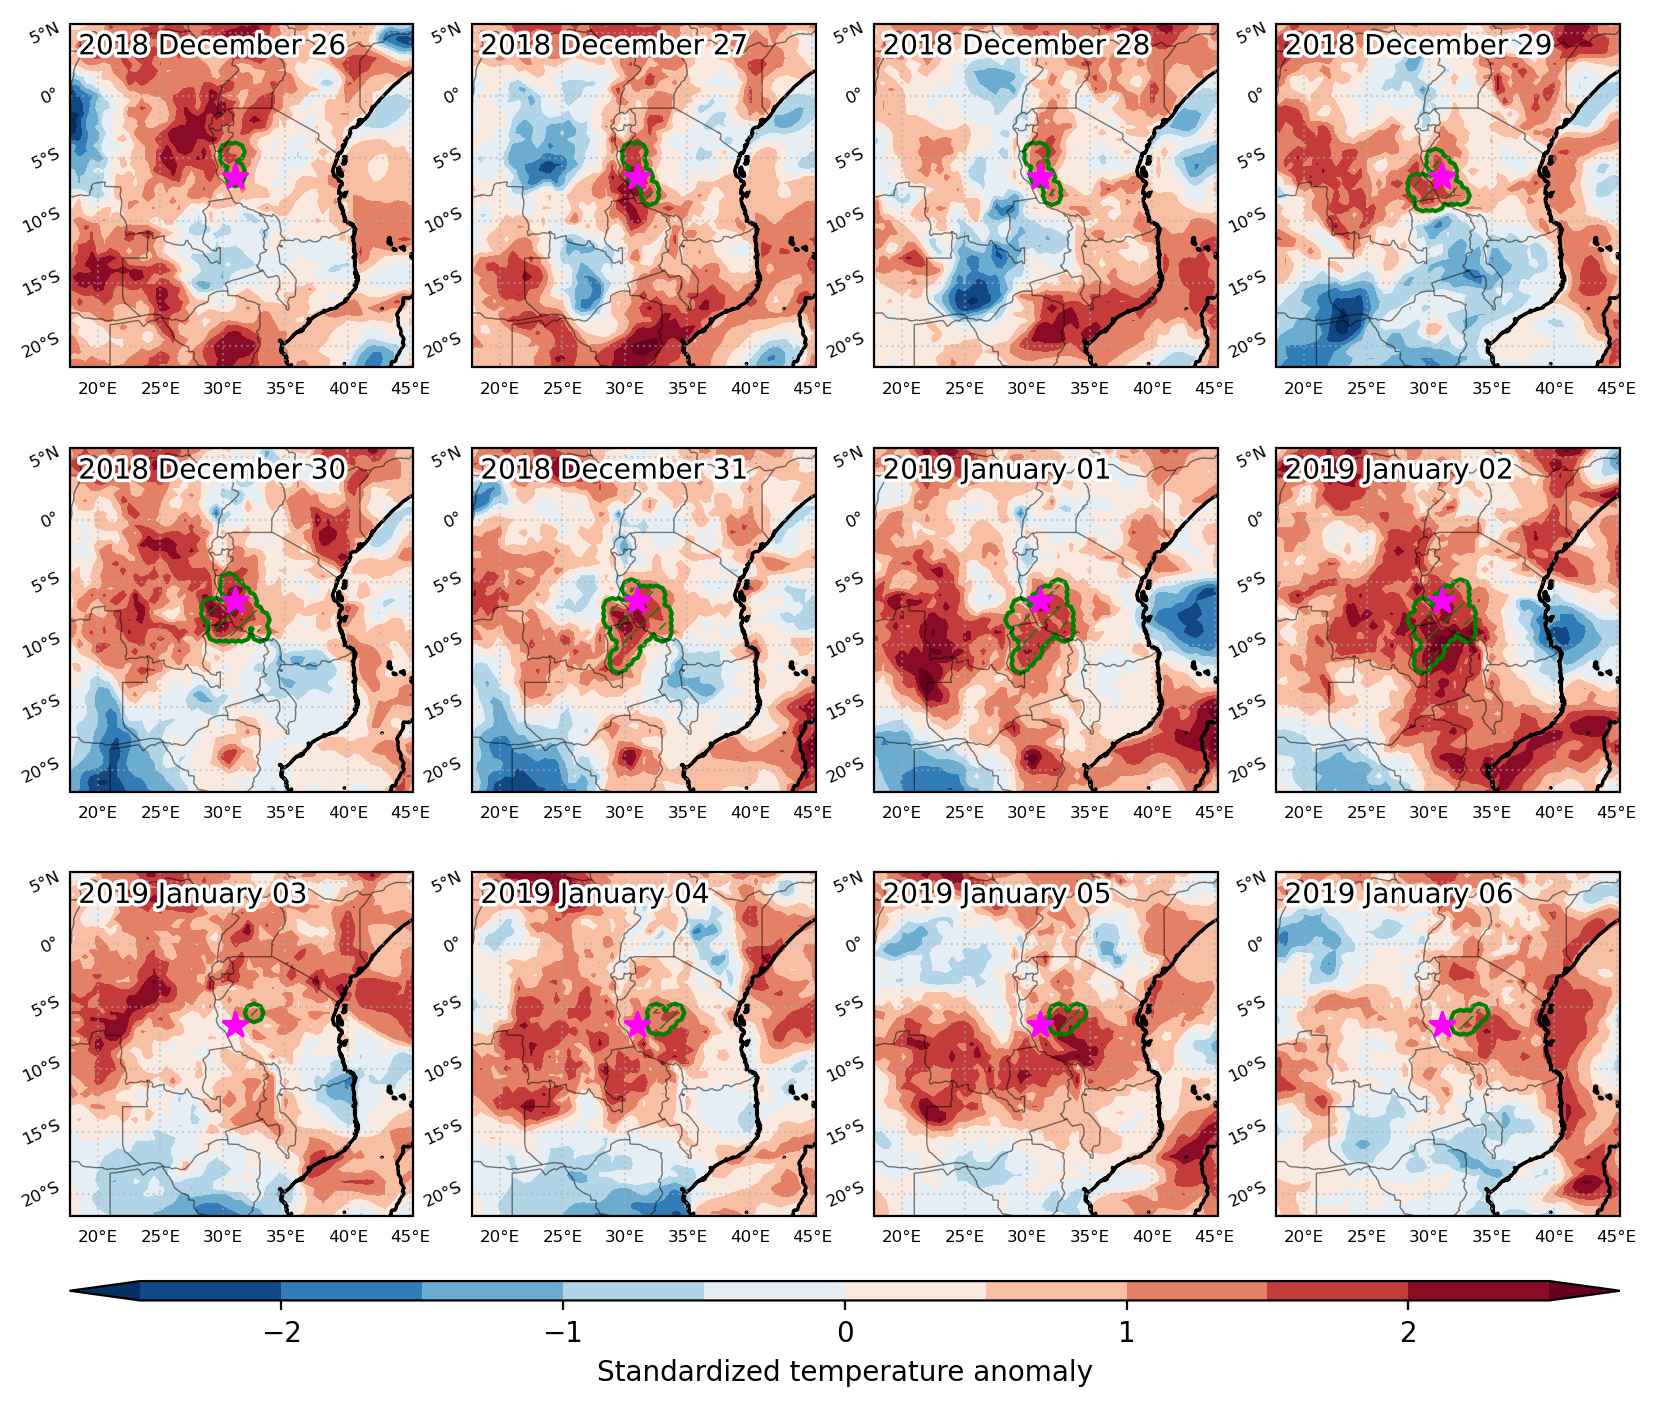
Heat wave occuring from December 26 2018 to January 06 2019 at -6.5°S 31.0°E

Download data: JSON

Event type: Heat wave

Countries affected (identified with ArcGIS Online; provided only for geographical reference):

  • Congo DRC
  • Tanzania
  • Zambia

Duration: 12 days

Time span: December 26 2018 to January 06 2019

Statistics over entire affected area:

  • Mean temperature anomaly: 1.9 °C
  • Mean temperature: 23.6 °C
  • Maximum temperature anomaly: 3.2 °C
  • Maximum temperature: 26.9 °C

Event center: -6.5°S 31.0°E

Area affected: 195964 km$^2$


Fig. 1: Map of most extreme temperature anomalies (standardized) experienced during the event. The purple star indicates the center of the extreme event. Green hatching illustrates all areas under the effect of extremes at some time during the event.


Fig. 2: Evolution of temperature at the center of the event. The climatological percentile distribution is illustrated with color shadings.


Fig. 3: Maps illustrating the evolution of standardized temperature anomalies during the event.

Event ID: Heat_wave_2018-Dec-26_to_2019-Jan-06_31.0_-6.5

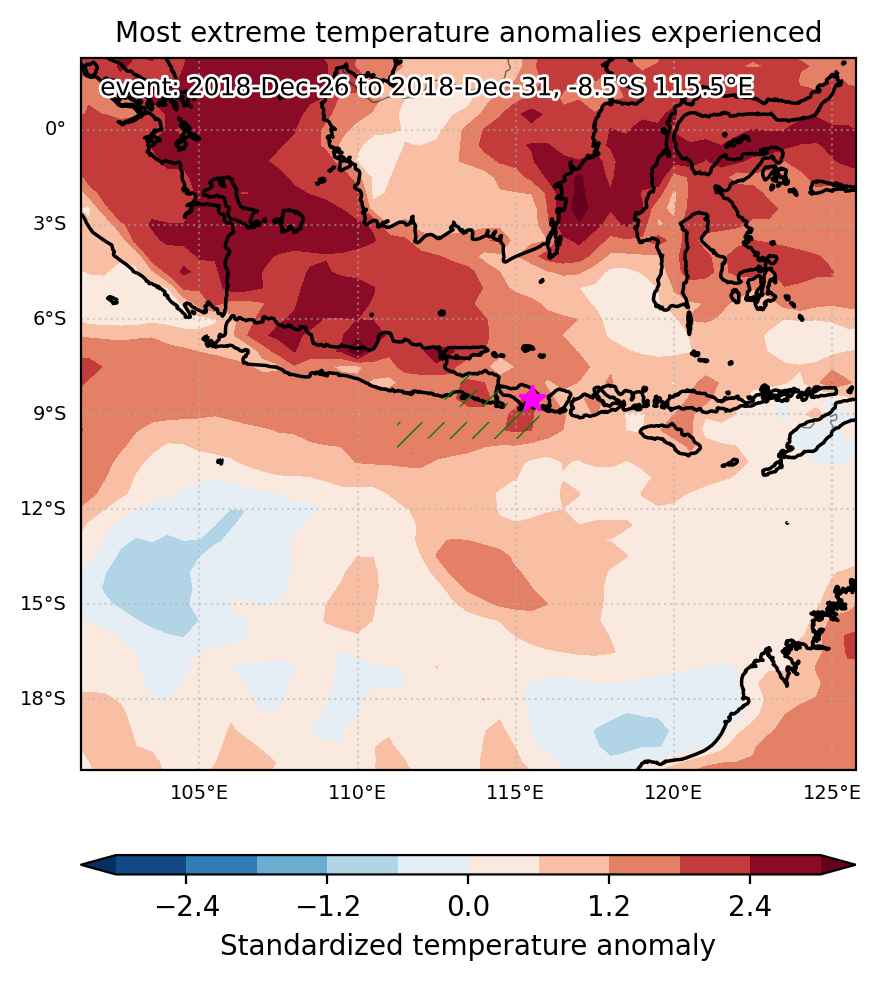
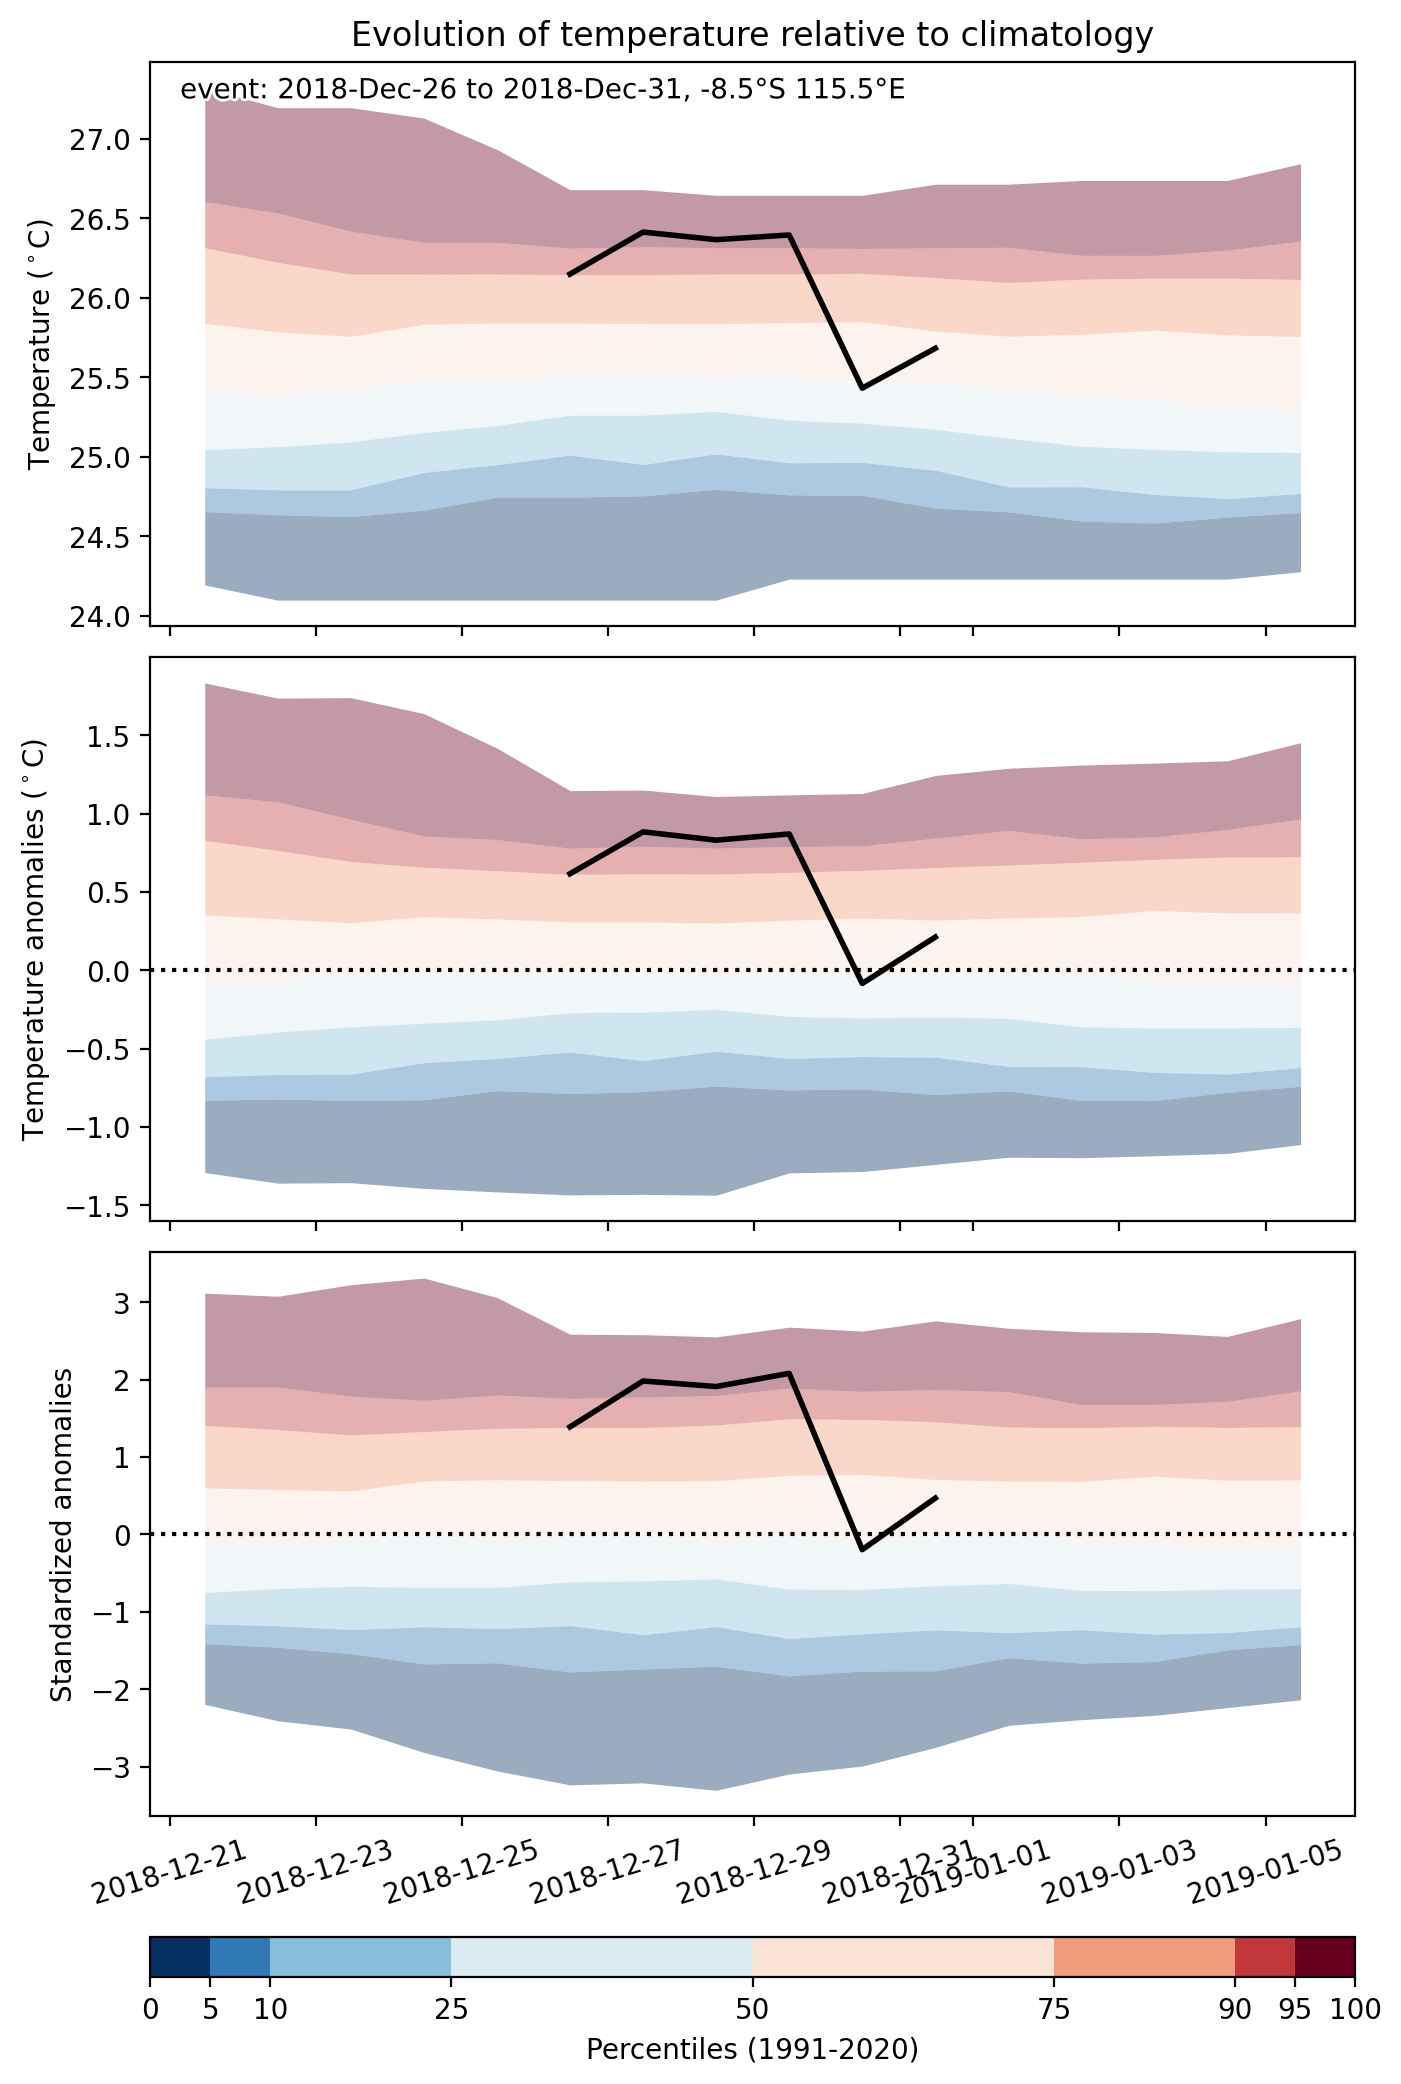
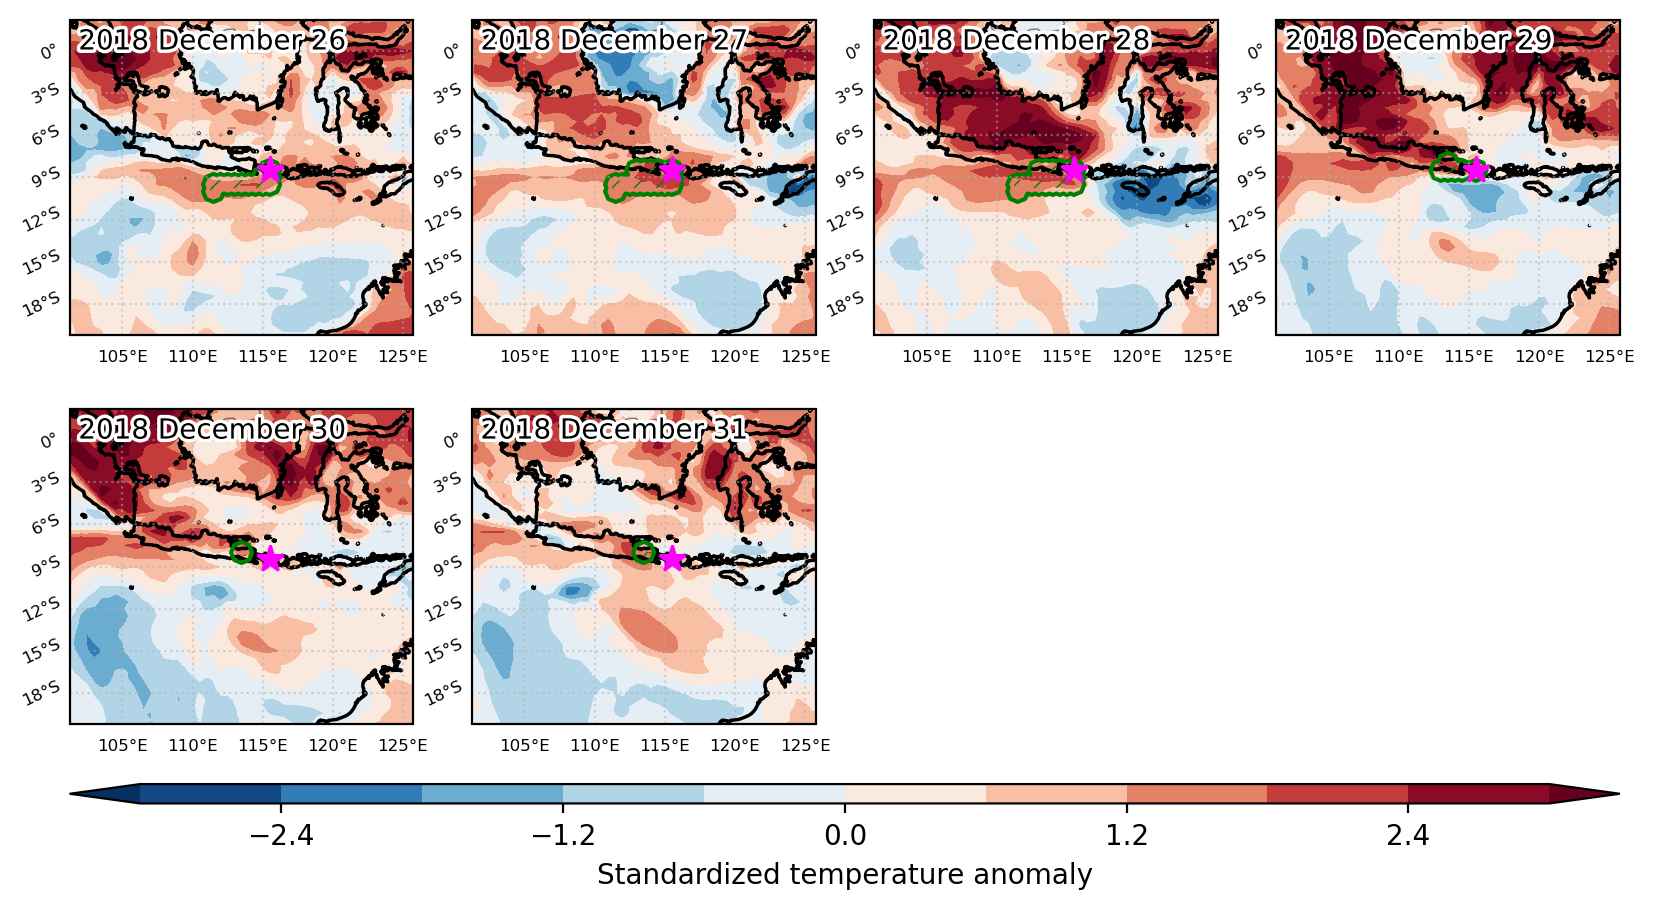
Heat wave occuring from December 26 2018 to December 31 2018 at -8.5°S 115.5°E

Download data: JSON

Event type: Heat wave

Countries affected (identified with ArcGIS Online; provided only for geographical reference):

  • Indonesia

Duration: 6 days

Time span: December 26 2018 to December 31 2018

Statistics over entire affected area:

  • Mean temperature anomaly: 0.9 °C
  • Mean temperature: 27.7 °C
  • Maximum temperature anomaly: 1.3 °C
  • Maximum temperature: 28.7 °C

Event center: -8.5°S 115.5°E

Area affected: 54934 km$^2$


Fig. 1: Map of most extreme temperature anomalies (standardized) experienced during the event. The purple star indicates the center of the extreme event. Green hatching illustrates all areas under the effect of extremes at some time during the event.


Fig. 2: Evolution of temperature at the center of the event. The climatological percentile distribution is illustrated with color shadings.


Fig. 3: Maps illustrating the evolution of standardized temperature anomalies during the event.

Event ID: Heat_wave_2018-Dec-26_to_2018-Dec-31_115.5_-8.5

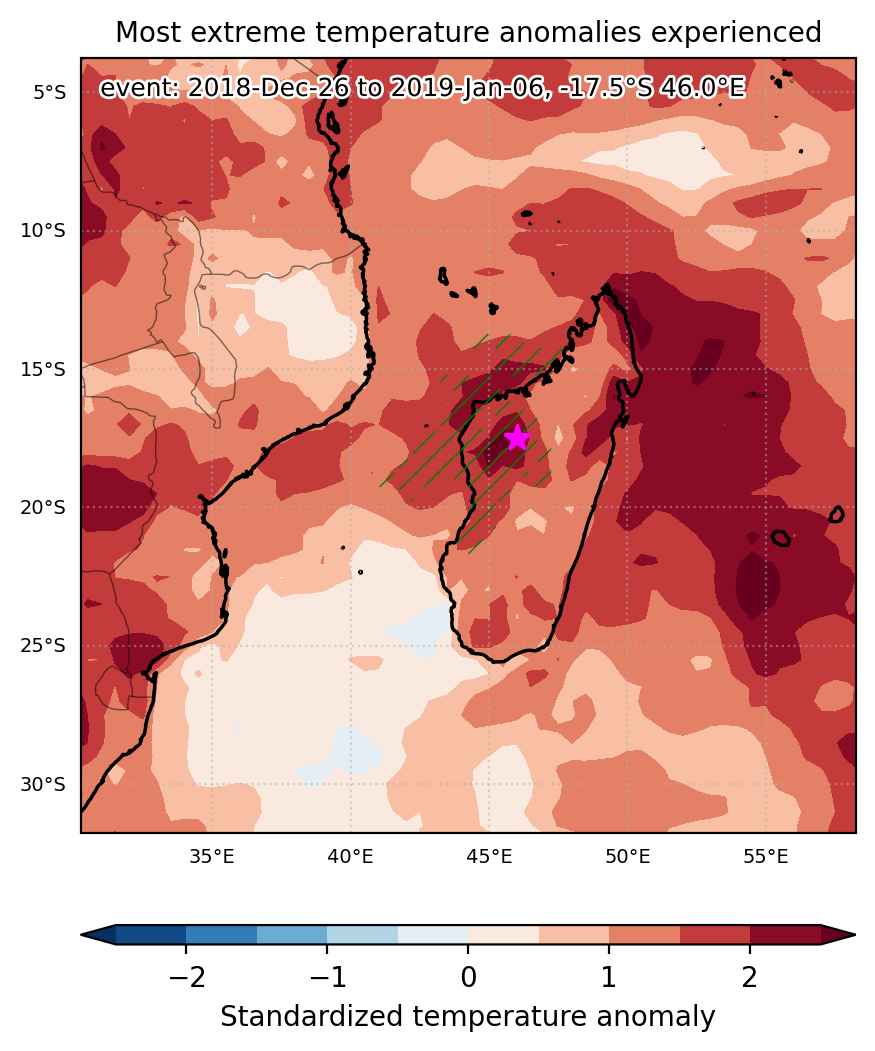
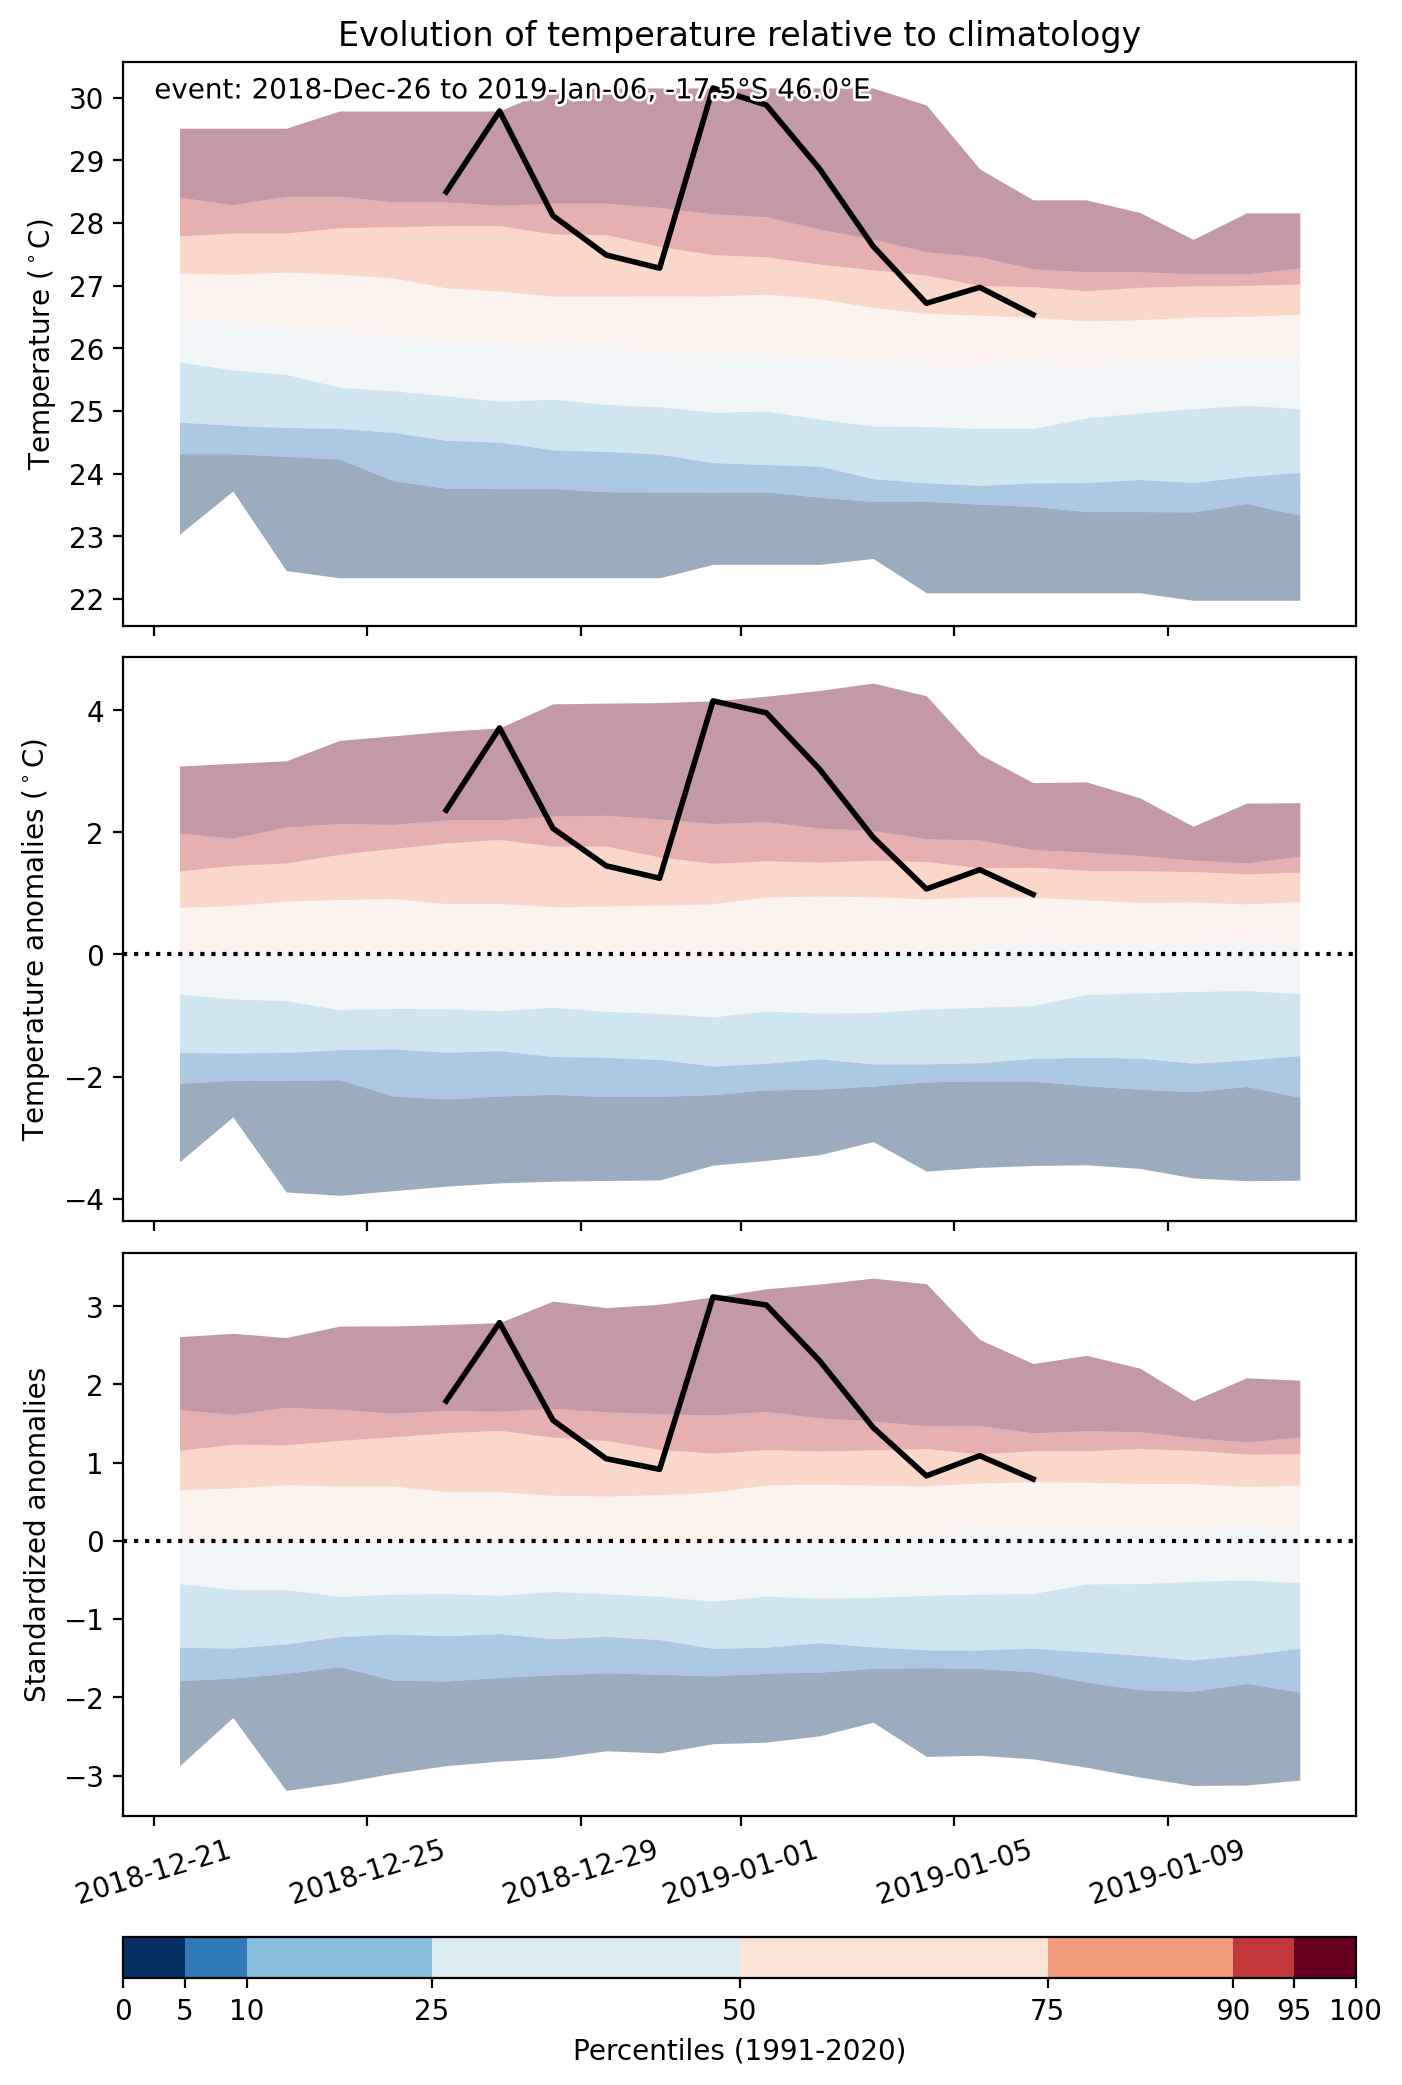
Heat wave occuring from December 26 2018 to January 06 2019 at -17.5°S 46.0°E

Download data: JSON

Event type: Heat wave

Countries affected (identified with ArcGIS Online; provided only for geographical reference):

  • Madagascar

Duration: 12 days

Time span: December 26 2018 to January 06 2019

Statistics over entire affected area:

  • Mean temperature anomaly: 1.6 °C
  • Mean temperature: 28.2 °C
  • Maximum temperature anomaly: 4.2 °C
  • Maximum temperature: 30.8 °C

Event center: -17.5°S 46.0°E

Area affected: 244553 km$^2$


Fig. 1: Map of most extreme temperature anomalies (standardized) experienced during the event. The purple star indicates the center of the extreme event. Green hatching illustrates all areas under the effect of extremes at some time during the event.


Fig. 2: Evolution of temperature at the center of the event. The climatological percentile distribution is illustrated with color shadings.


Fig. 3: Maps illustrating the evolution of standardized temperature anomalies during the event.

Event ID: Heat_wave_2018-Dec-26_to_2019-Jan-06_46.0_-17.5

Cold spell occuring from December 26 2018 to December 30 2018 at 40.0°N 33.0°E

Download data: JSON

Event type: Cold spell

Countries affected (identified with ArcGIS Online; provided only for geographical reference):

  • Turkiye

Duration: 5 days

Time span: December 26 2018 to December 30 2018

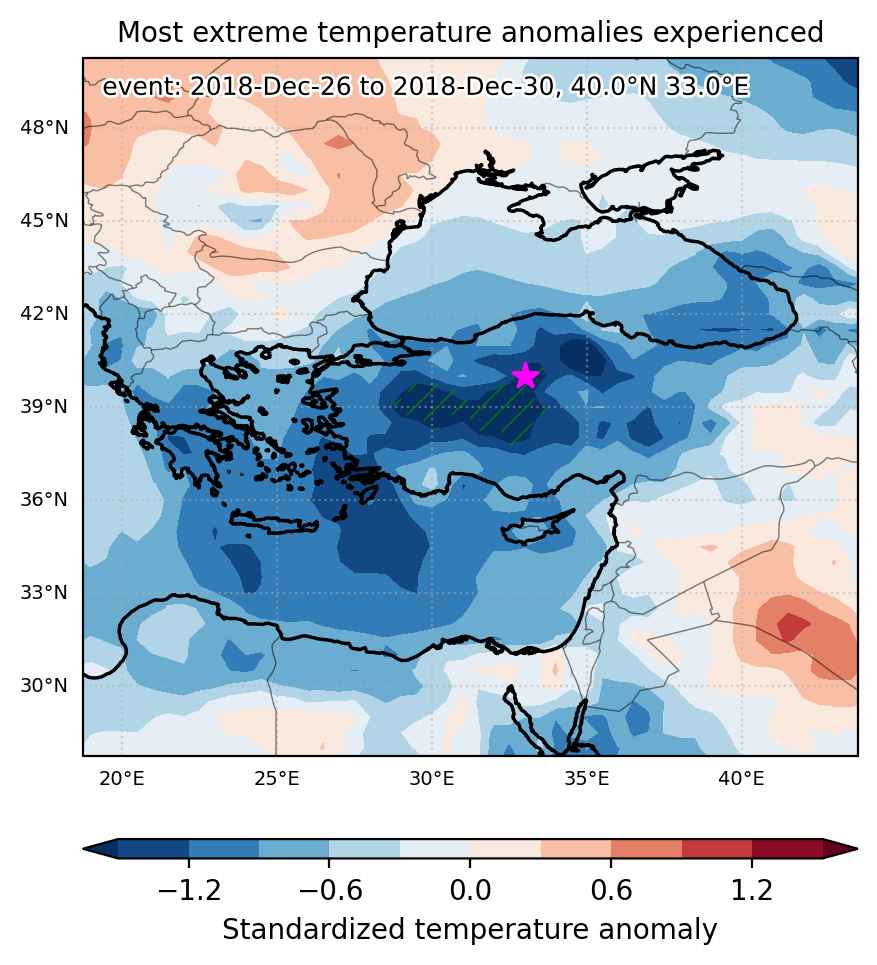
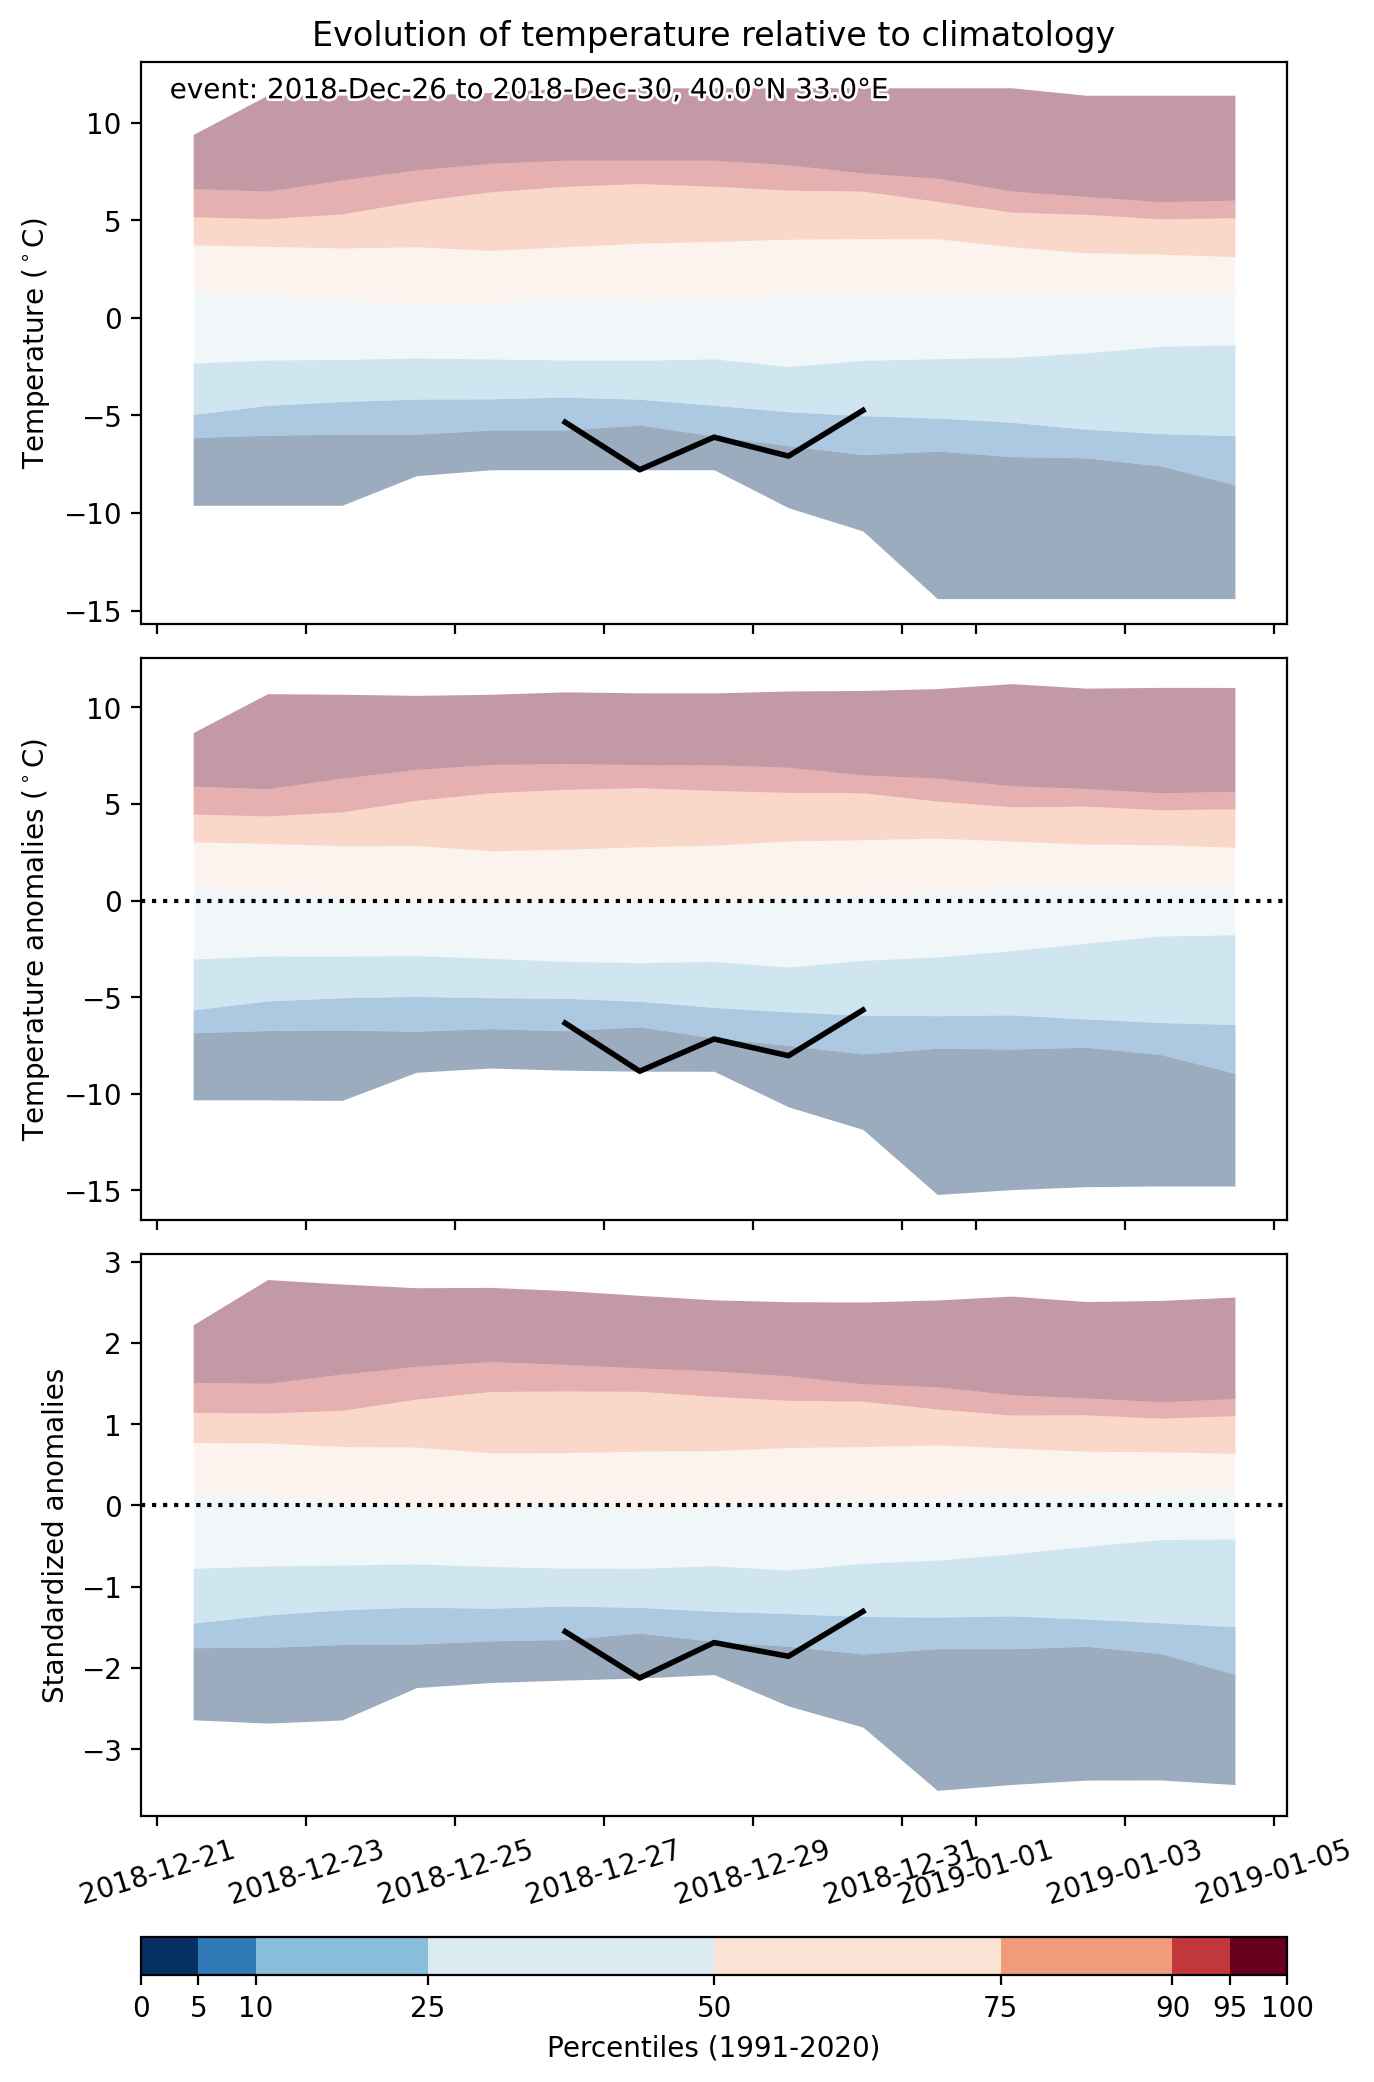
Statistics over entire affected area:

  • Mean temperature anomaly: -7.9 °C
  • Mean temperature: -6.1 °C
  • Minimum temperature anomaly: -11.2 °C
  • Minimum temperature: -9.5 °C

Event center: 40.0°N 33.0°E

Area affected: 60036 km$^2$


Fig. 1: Map of most extreme temperature anomalies (standardized) experienced during the event. The purple star indicates the center of the extreme event. Green hatching illustrates all areas under the effect of extremes at some time during the event.


Fig. 2: Evolution of temperature at the center of the event. The climatological percentile distribution is illustrated with color shadings.


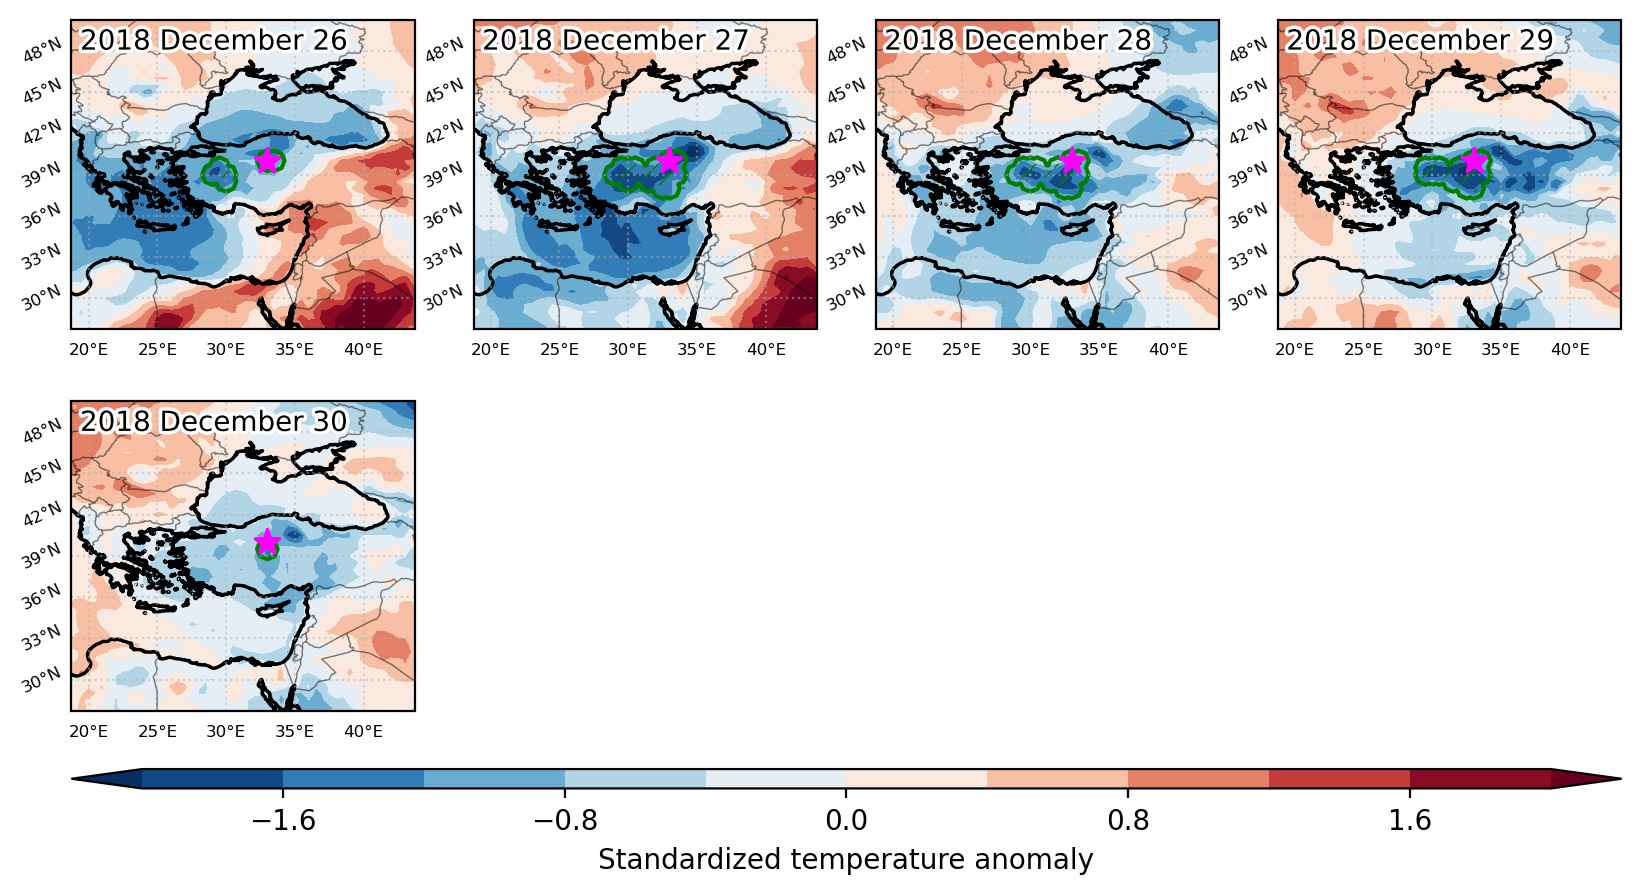
Fig. 3: Maps illustrating the evolution of standardized temperature anomalies during the event.

Event ID: Cold_spell_2018-Dec-26_to_2018-Dec-30_33.0_40.0

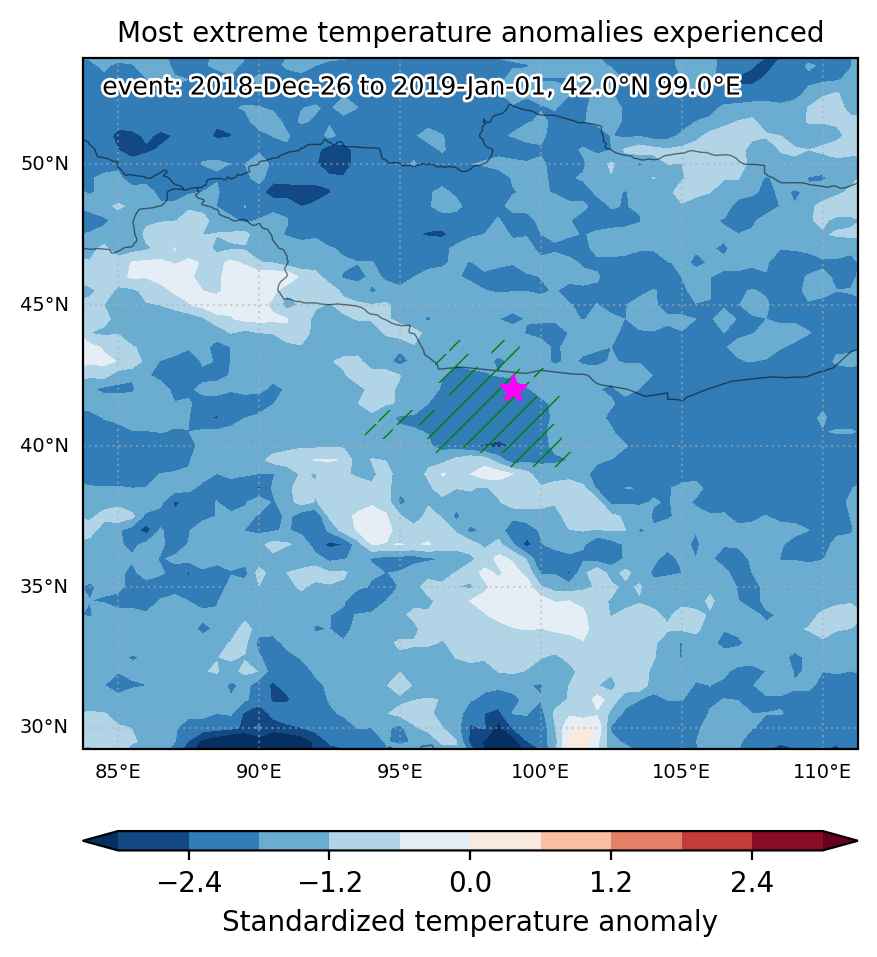
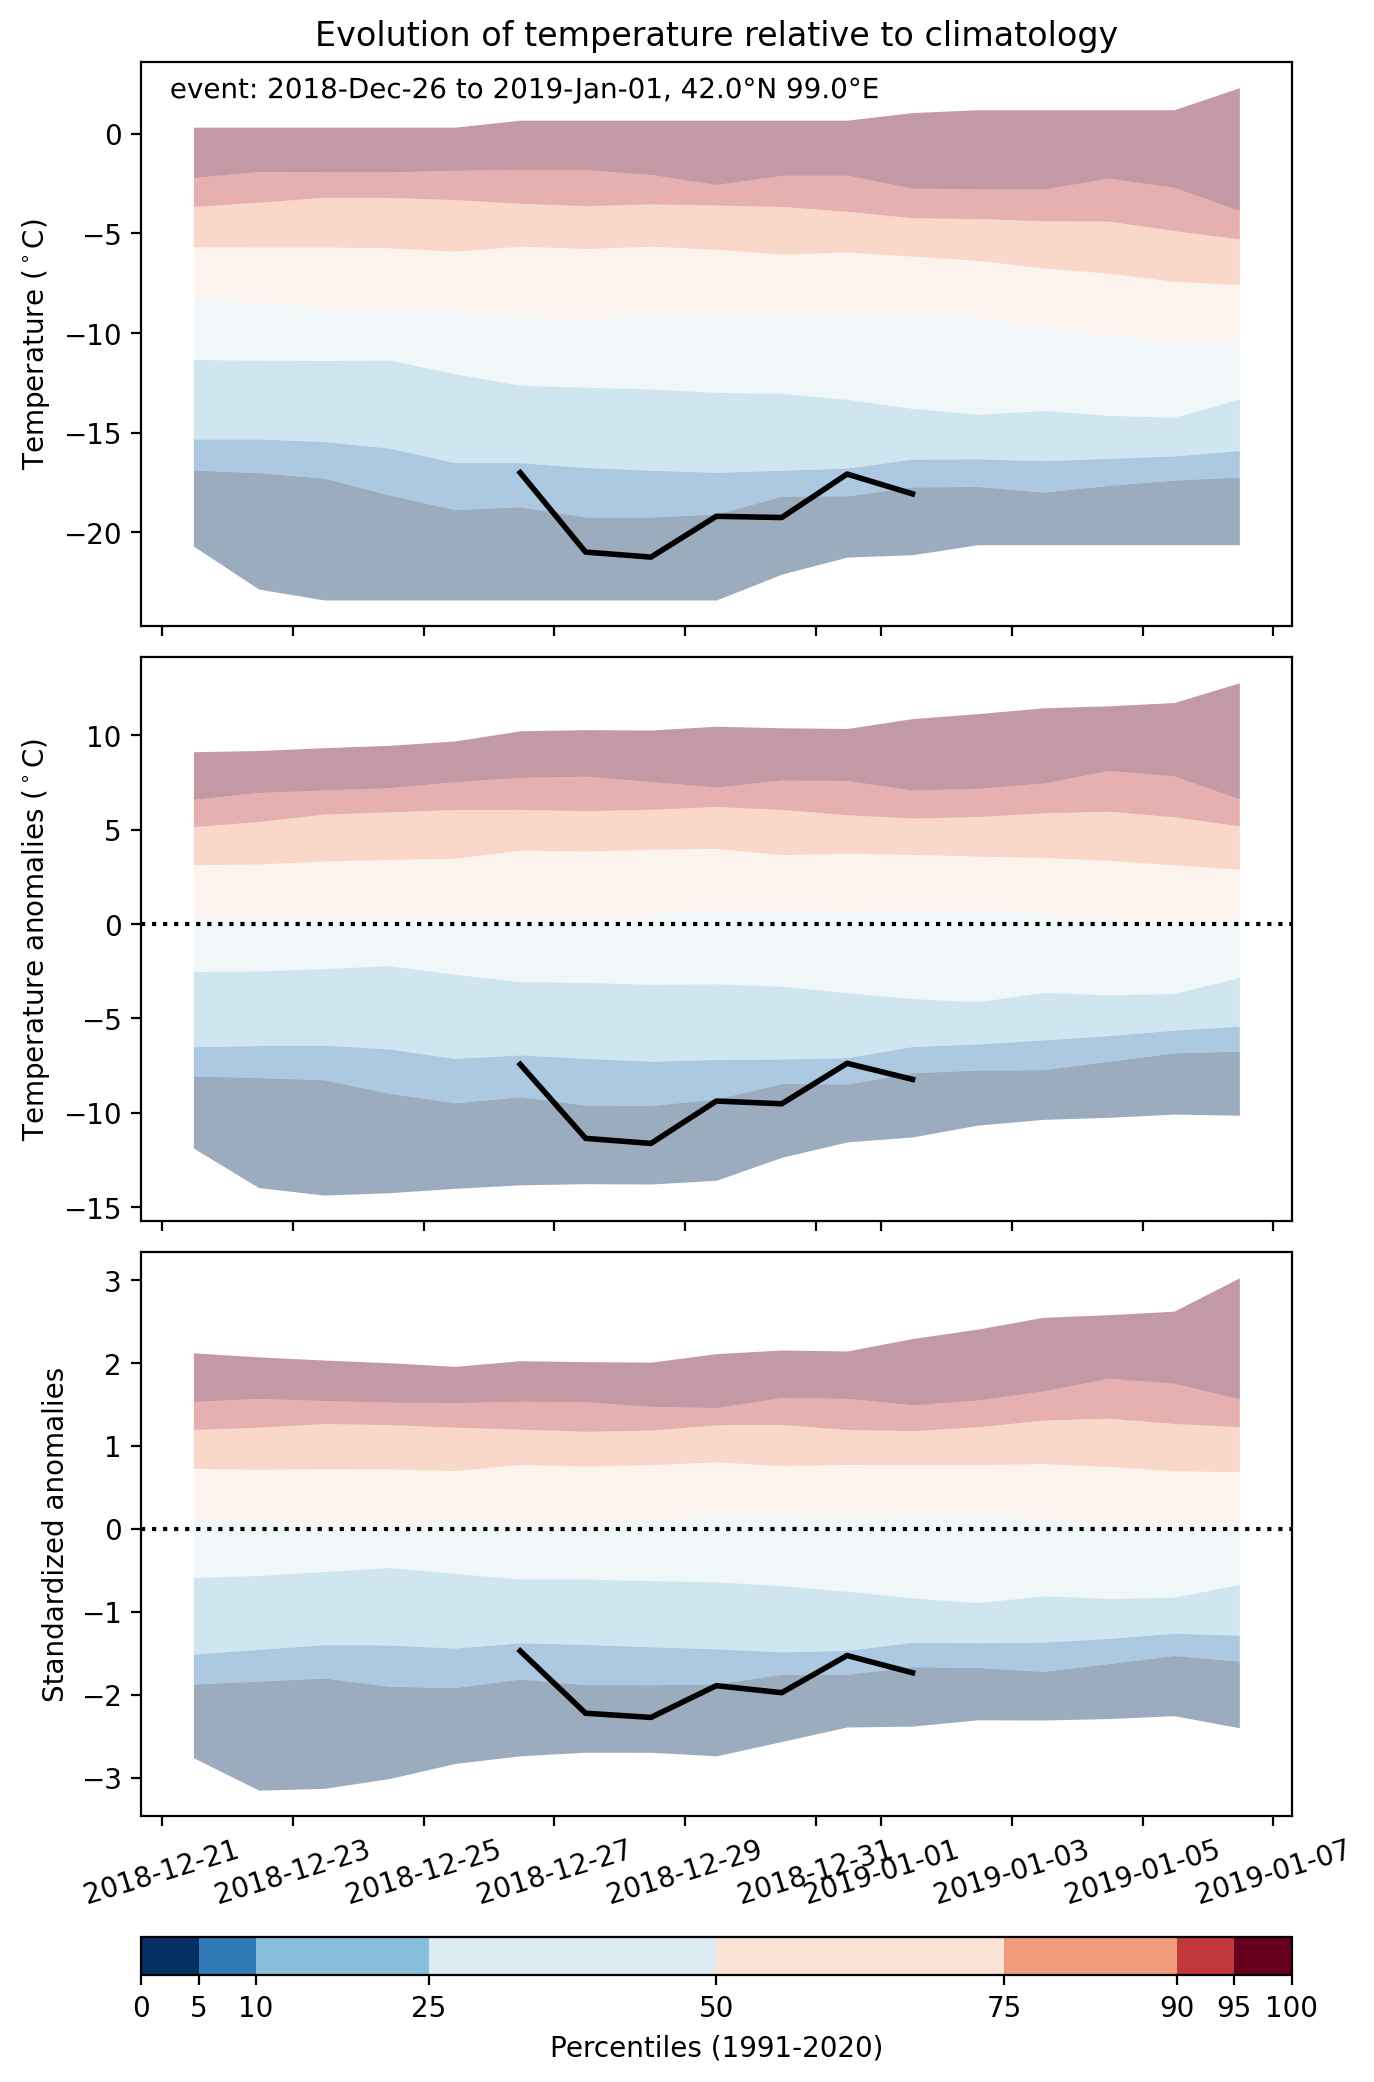
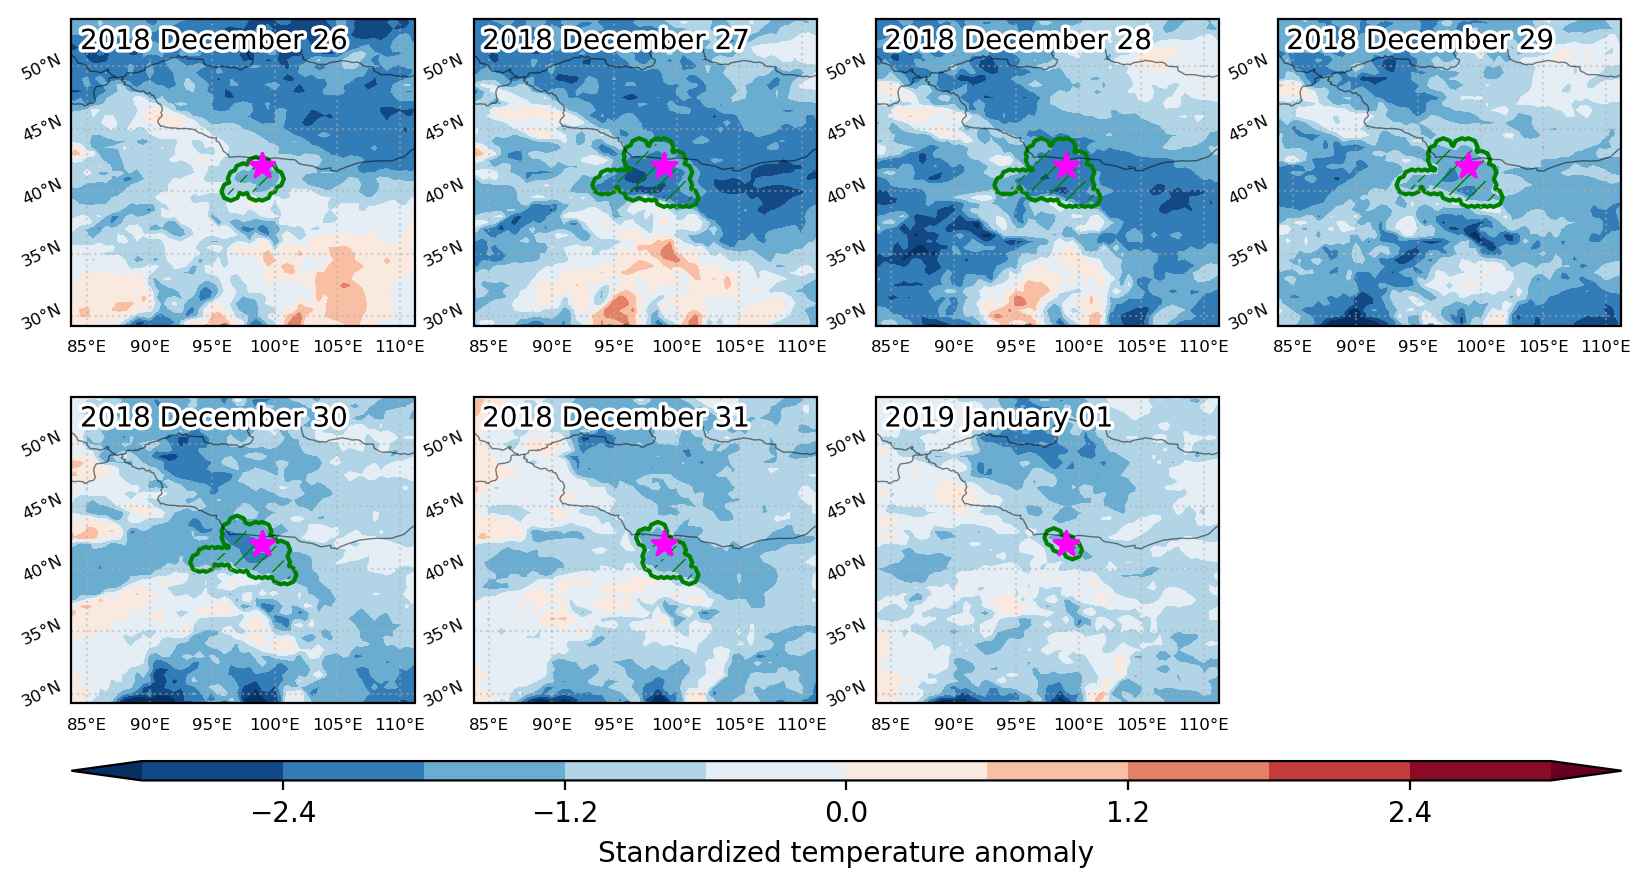
Cold spell occuring from December 26 2018 to January 01 2019 at 42.0°N 99.0°E

Download data: JSON

Event type: Cold spell

Countries affected (identified with ArcGIS Online; provided only for geographical reference):

  • China
  • Mongolia

Duration: 7 days

Time span: December 26 2018 to January 01 2019

Statistics over entire affected area:

  • Mean temperature anomaly: -8.3 °C
  • Mean temperature: -18.1 °C
  • Minimum temperature anomaly: -12.7 °C
  • Minimum temperature: -23.9 °C

Event center: 42.0°N 99.0°E

Area affected: 153355 km$^2$


Fig. 1: Map of most extreme temperature anomalies (standardized) experienced during the event. The purple star indicates the center of the extreme event. Green hatching illustrates all areas under the effect of extremes at some time during the event.


Fig. 2: Evolution of temperature at the center of the event. The climatological percentile distribution is illustrated with color shadings.


Fig. 3: Maps illustrating the evolution of standardized temperature anomalies during the event.

Event ID: Cold_spell_2018-Dec-26_to_2019-Jan-01_99.0_42.0

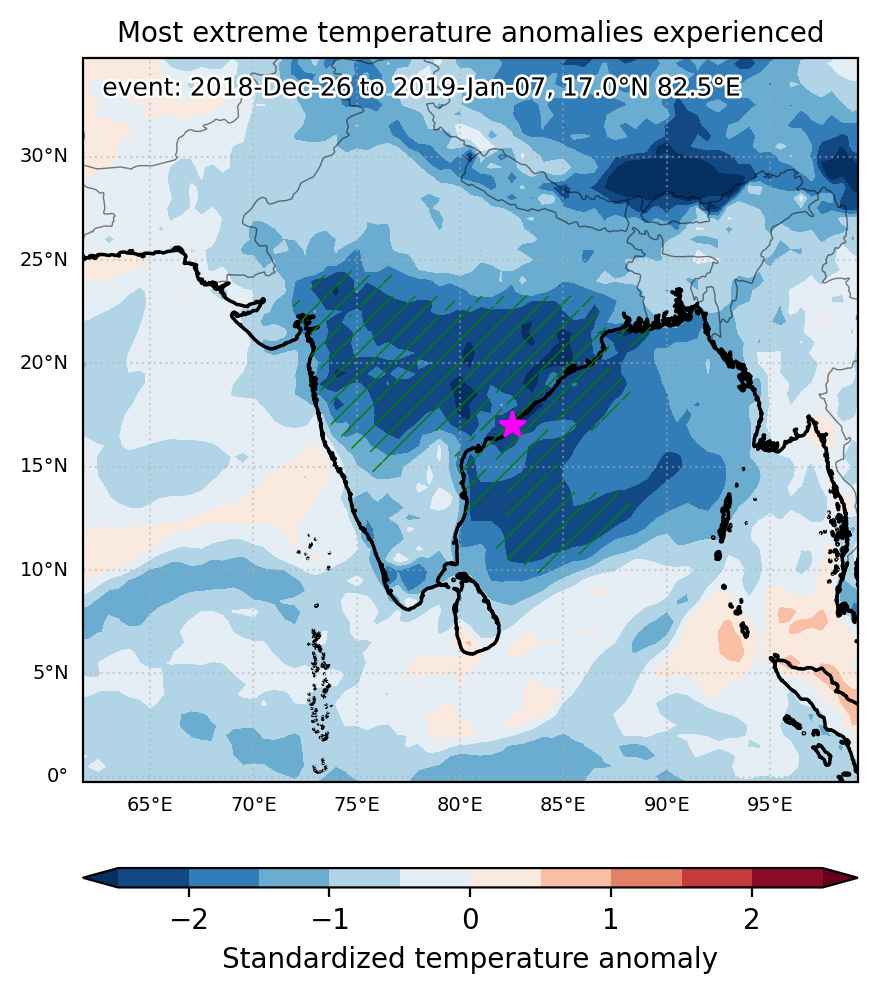
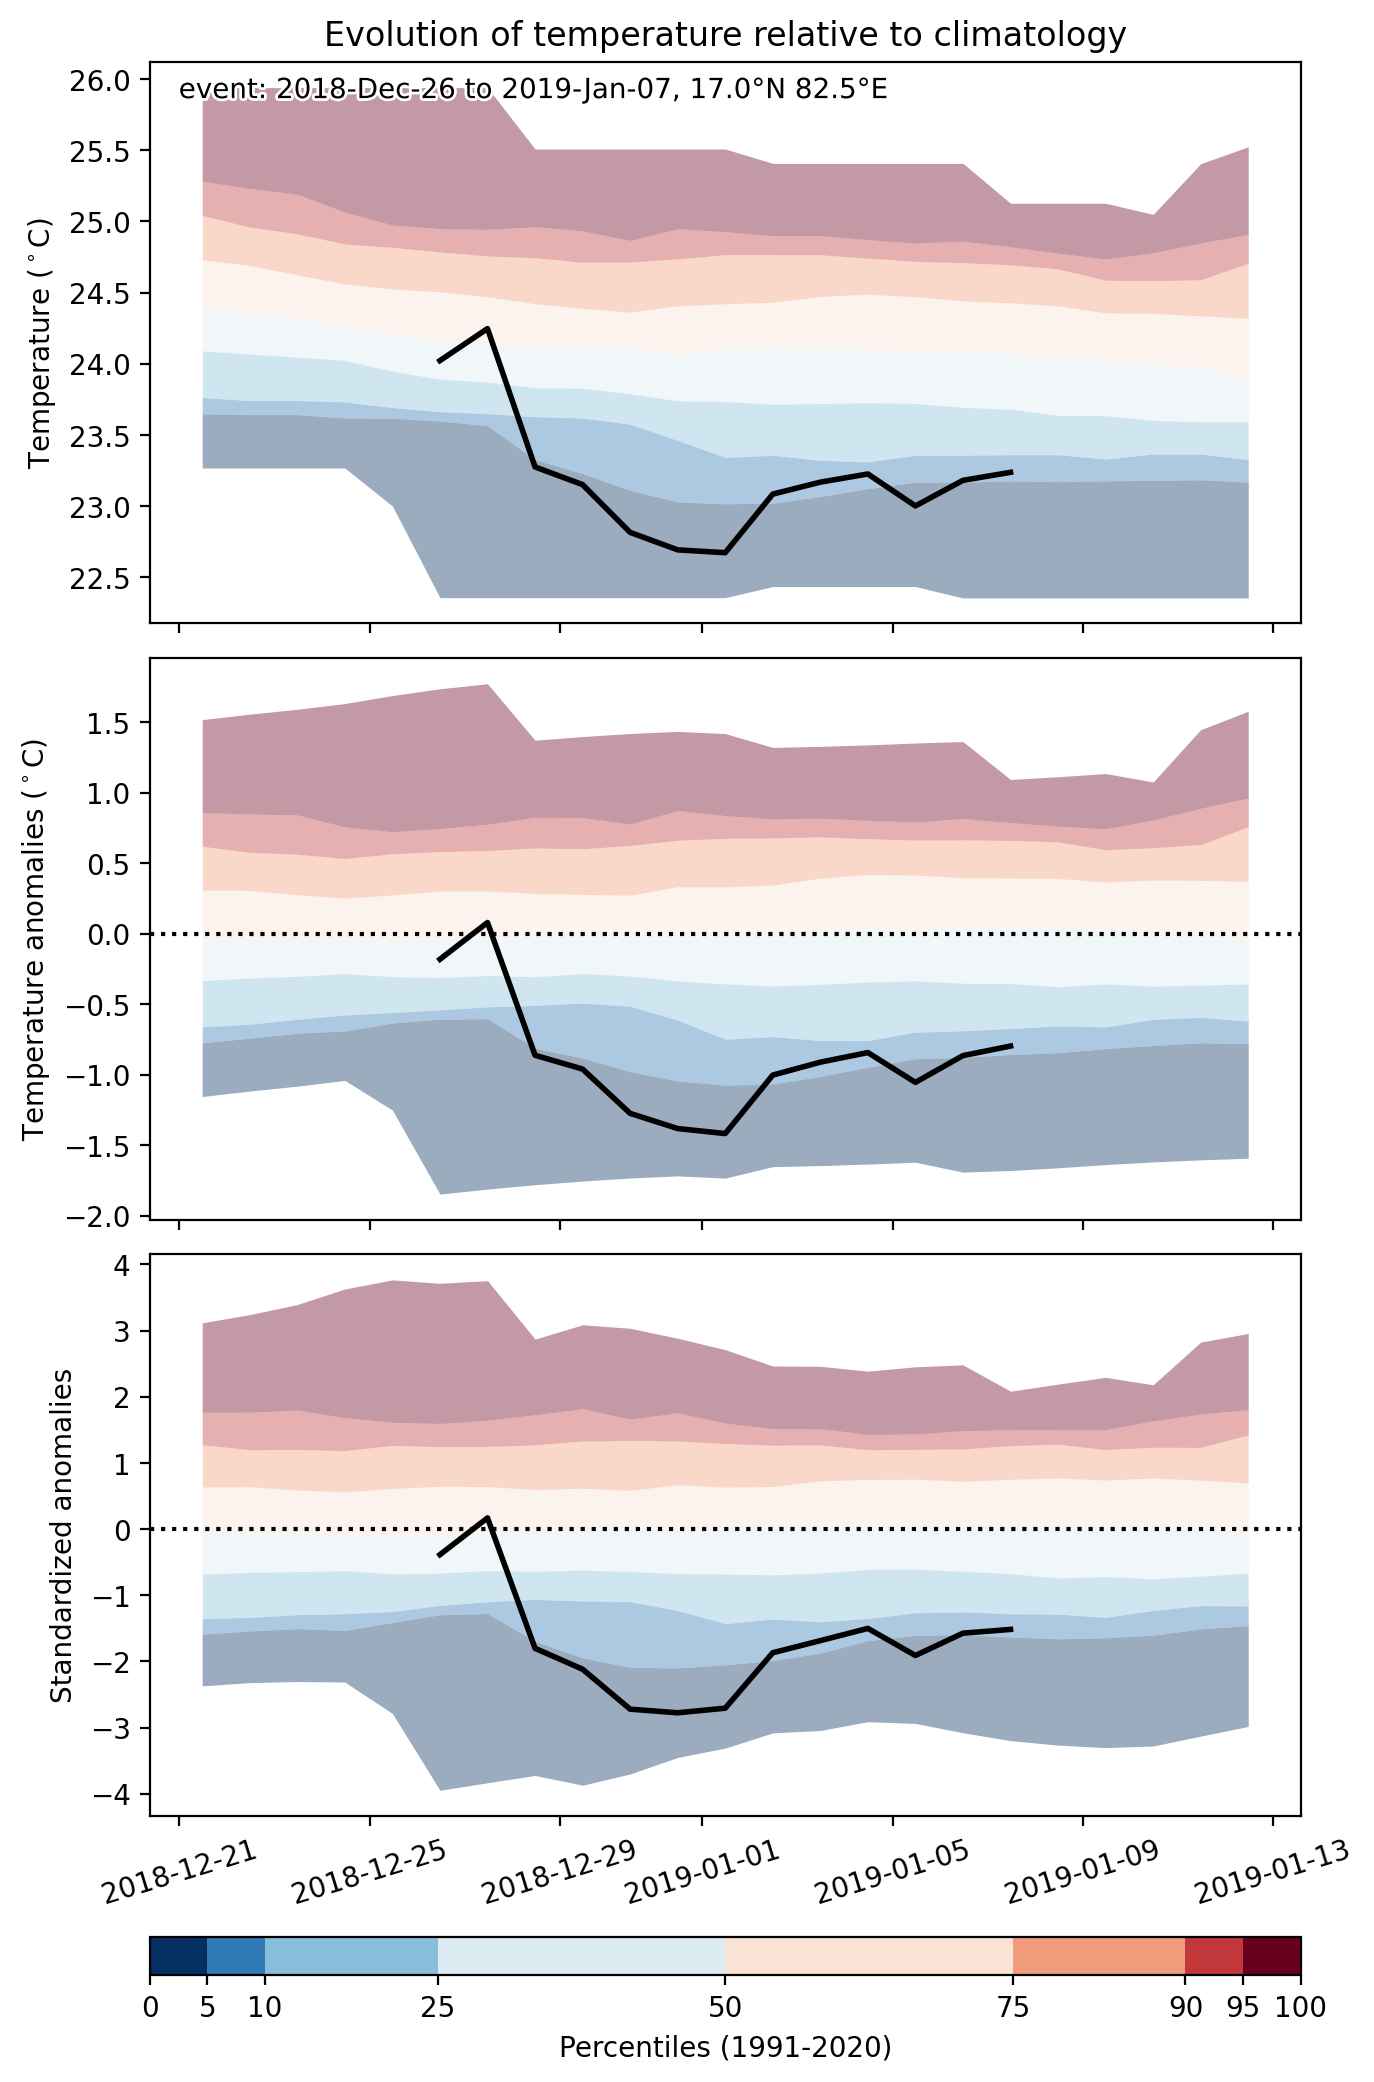
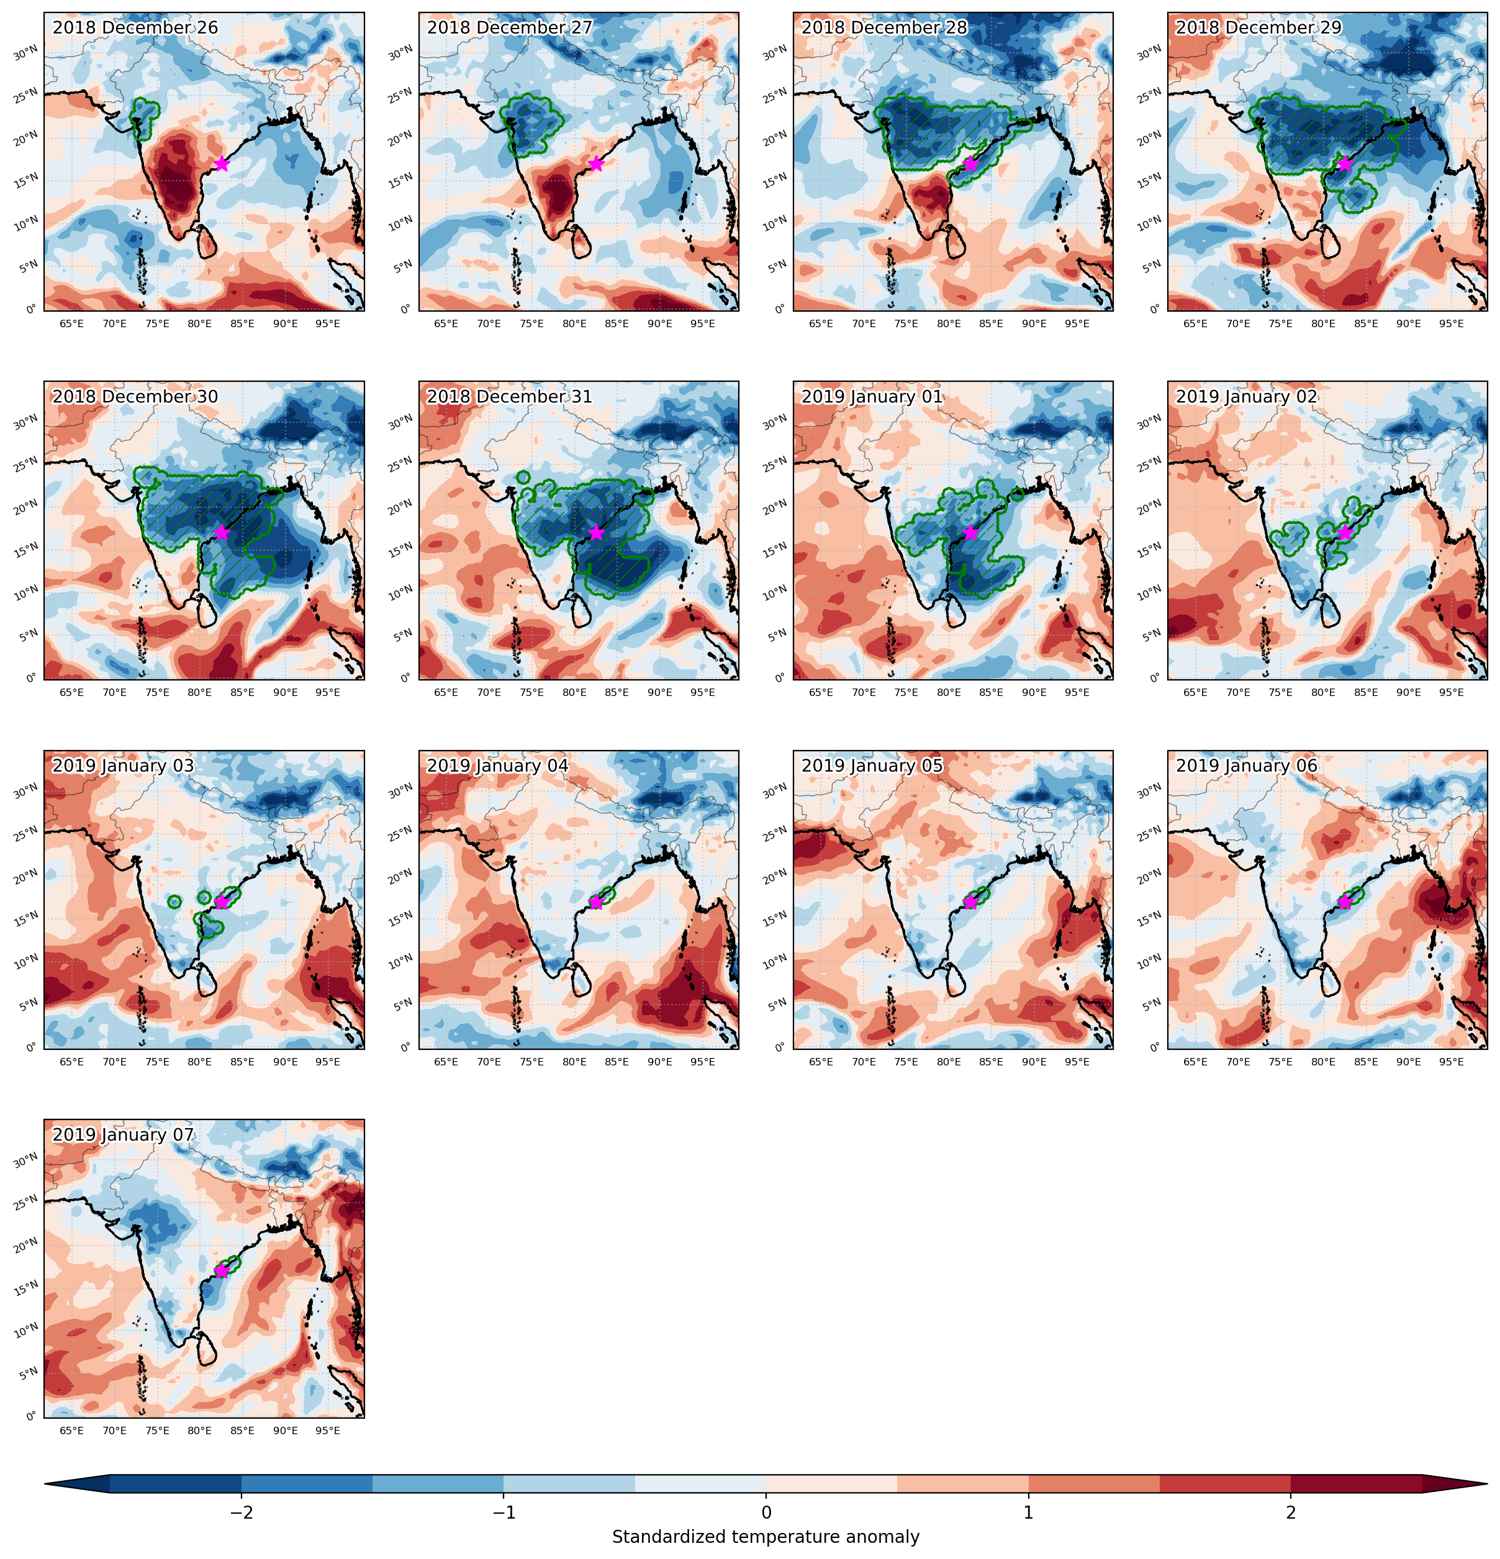
Cold spell occuring from December 26 2018 to January 07 2019 at 17.0°N 82.5°E

Download data: JSON

Event type: Cold spell

Countries affected (identified with ArcGIS Online; provided only for geographical reference):

  • India

Duration: 13 days

Time span: December 26 2018 to January 07 2019

Statistics over entire affected area:

  • Mean temperature anomaly: -2.5 °C
  • Mean temperature: 19.2 °C
  • Minimum temperature anomaly: -5.4 °C
  • Minimum temperature: 10.7 °C

Event center: 17.0°N 82.5°E

Area affected: 1536413 km$^2$


Fig. 1: Map of most extreme temperature anomalies (standardized) experienced during the event. The purple star indicates the center of the extreme event. Green hatching illustrates all areas under the effect of extremes at some time during the event.


Fig. 2: Evolution of temperature at the center of the event. The climatological percentile distribution is illustrated with color shadings.


Fig. 3: Maps illustrating the evolution of standardized temperature anomalies during the event.

Event ID: Cold_spell_2018-Dec-26_to_2019-Jan-07_82.5_17.0