Cold spell occuring from April 05 2026 to April 29 2026 at -68.5°S 238.5°E

Download data: JSON

Event type: Cold spell

Countries affected (identified with ArcGIS Online; provided only for geographical reference):

  • Antarctica

Duration: 25 days

Time span: April 05 2026 to April 29 2026

Statistics over entire affected area:

  • Mean temperature anomaly: -7.0 °C
  • Mean temperature: -15.1 °C
  • Minimum temperature anomaly: -18.2 °C
  • Minimum temperature: -49.6 °C

Event center: -68.5°S 238.5°E

Area affected: 4563527 km$^2$


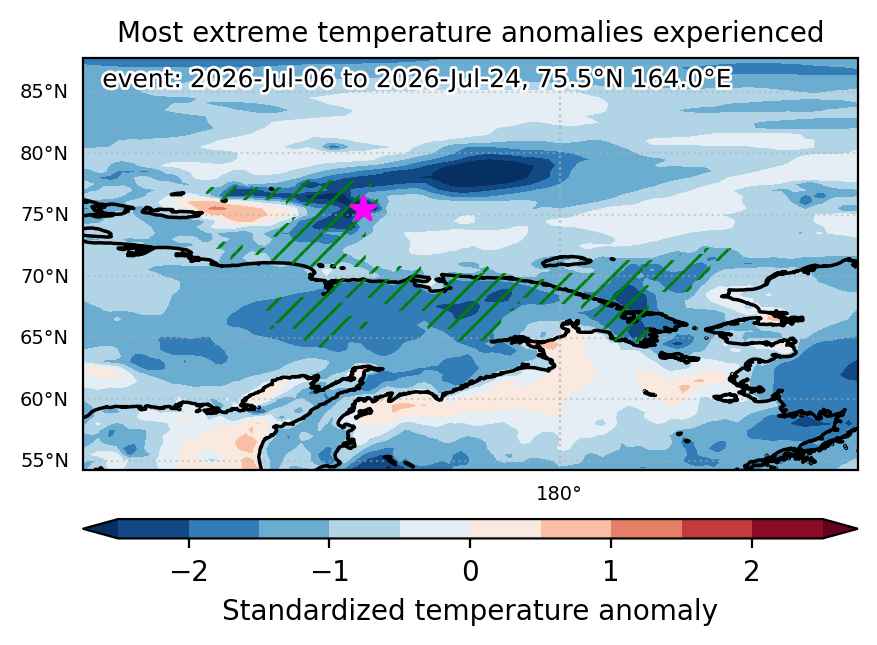
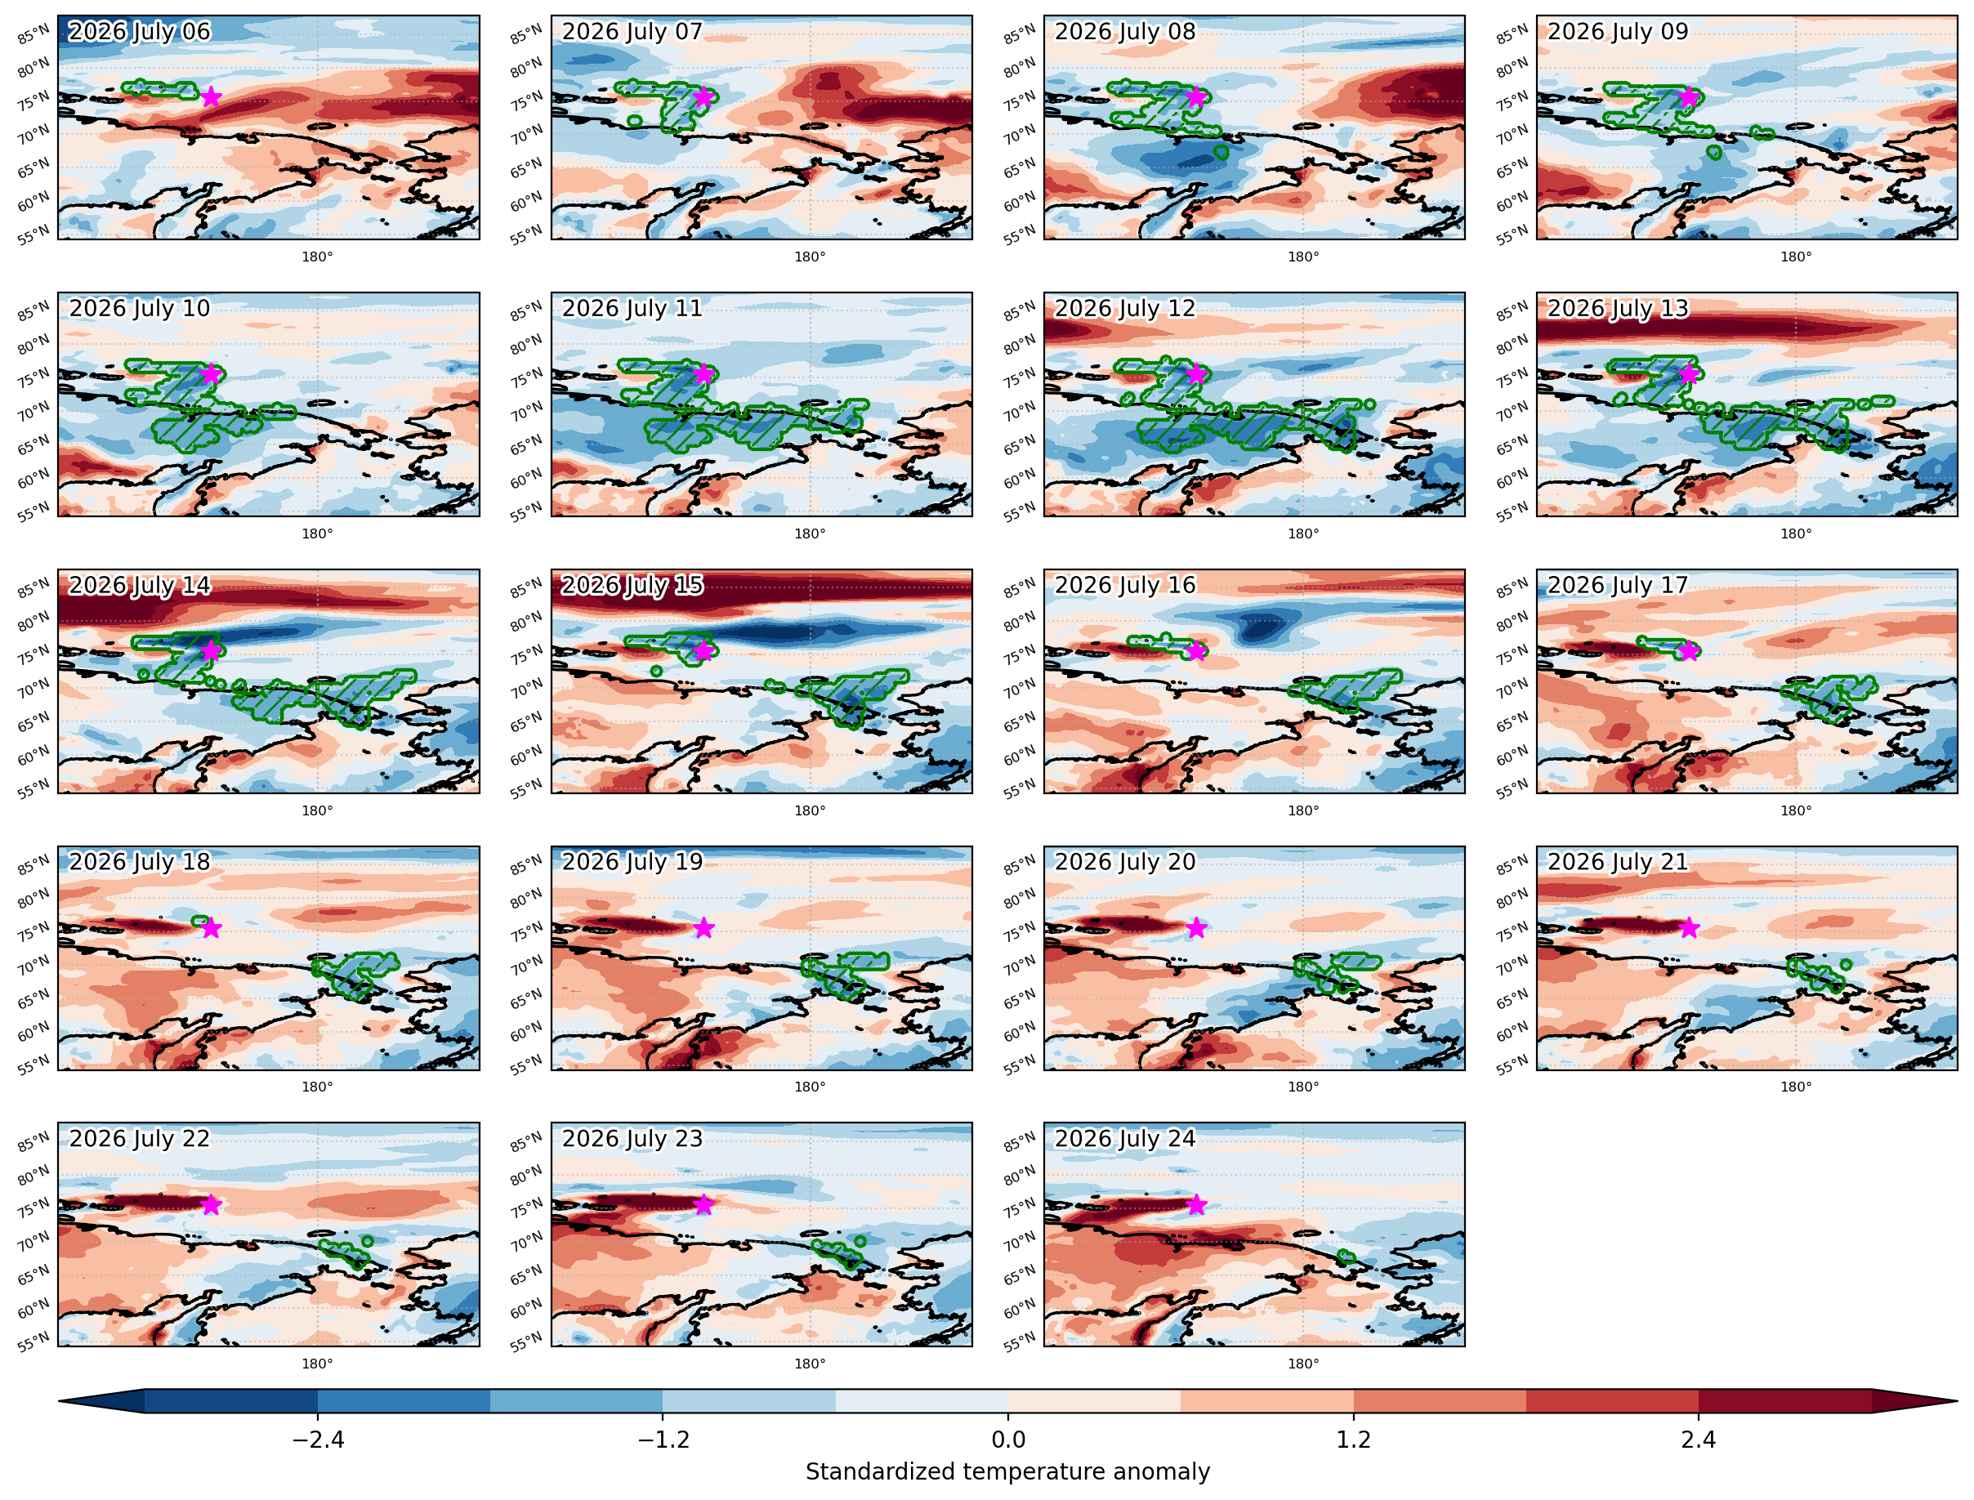
Fig. 1: Map of most extreme temperature anomalies (standardized) experienced during the event. The purple star indicates the center of the extreme event. Green hatching illustrates all areas under the effect of extremes at some time during the event.


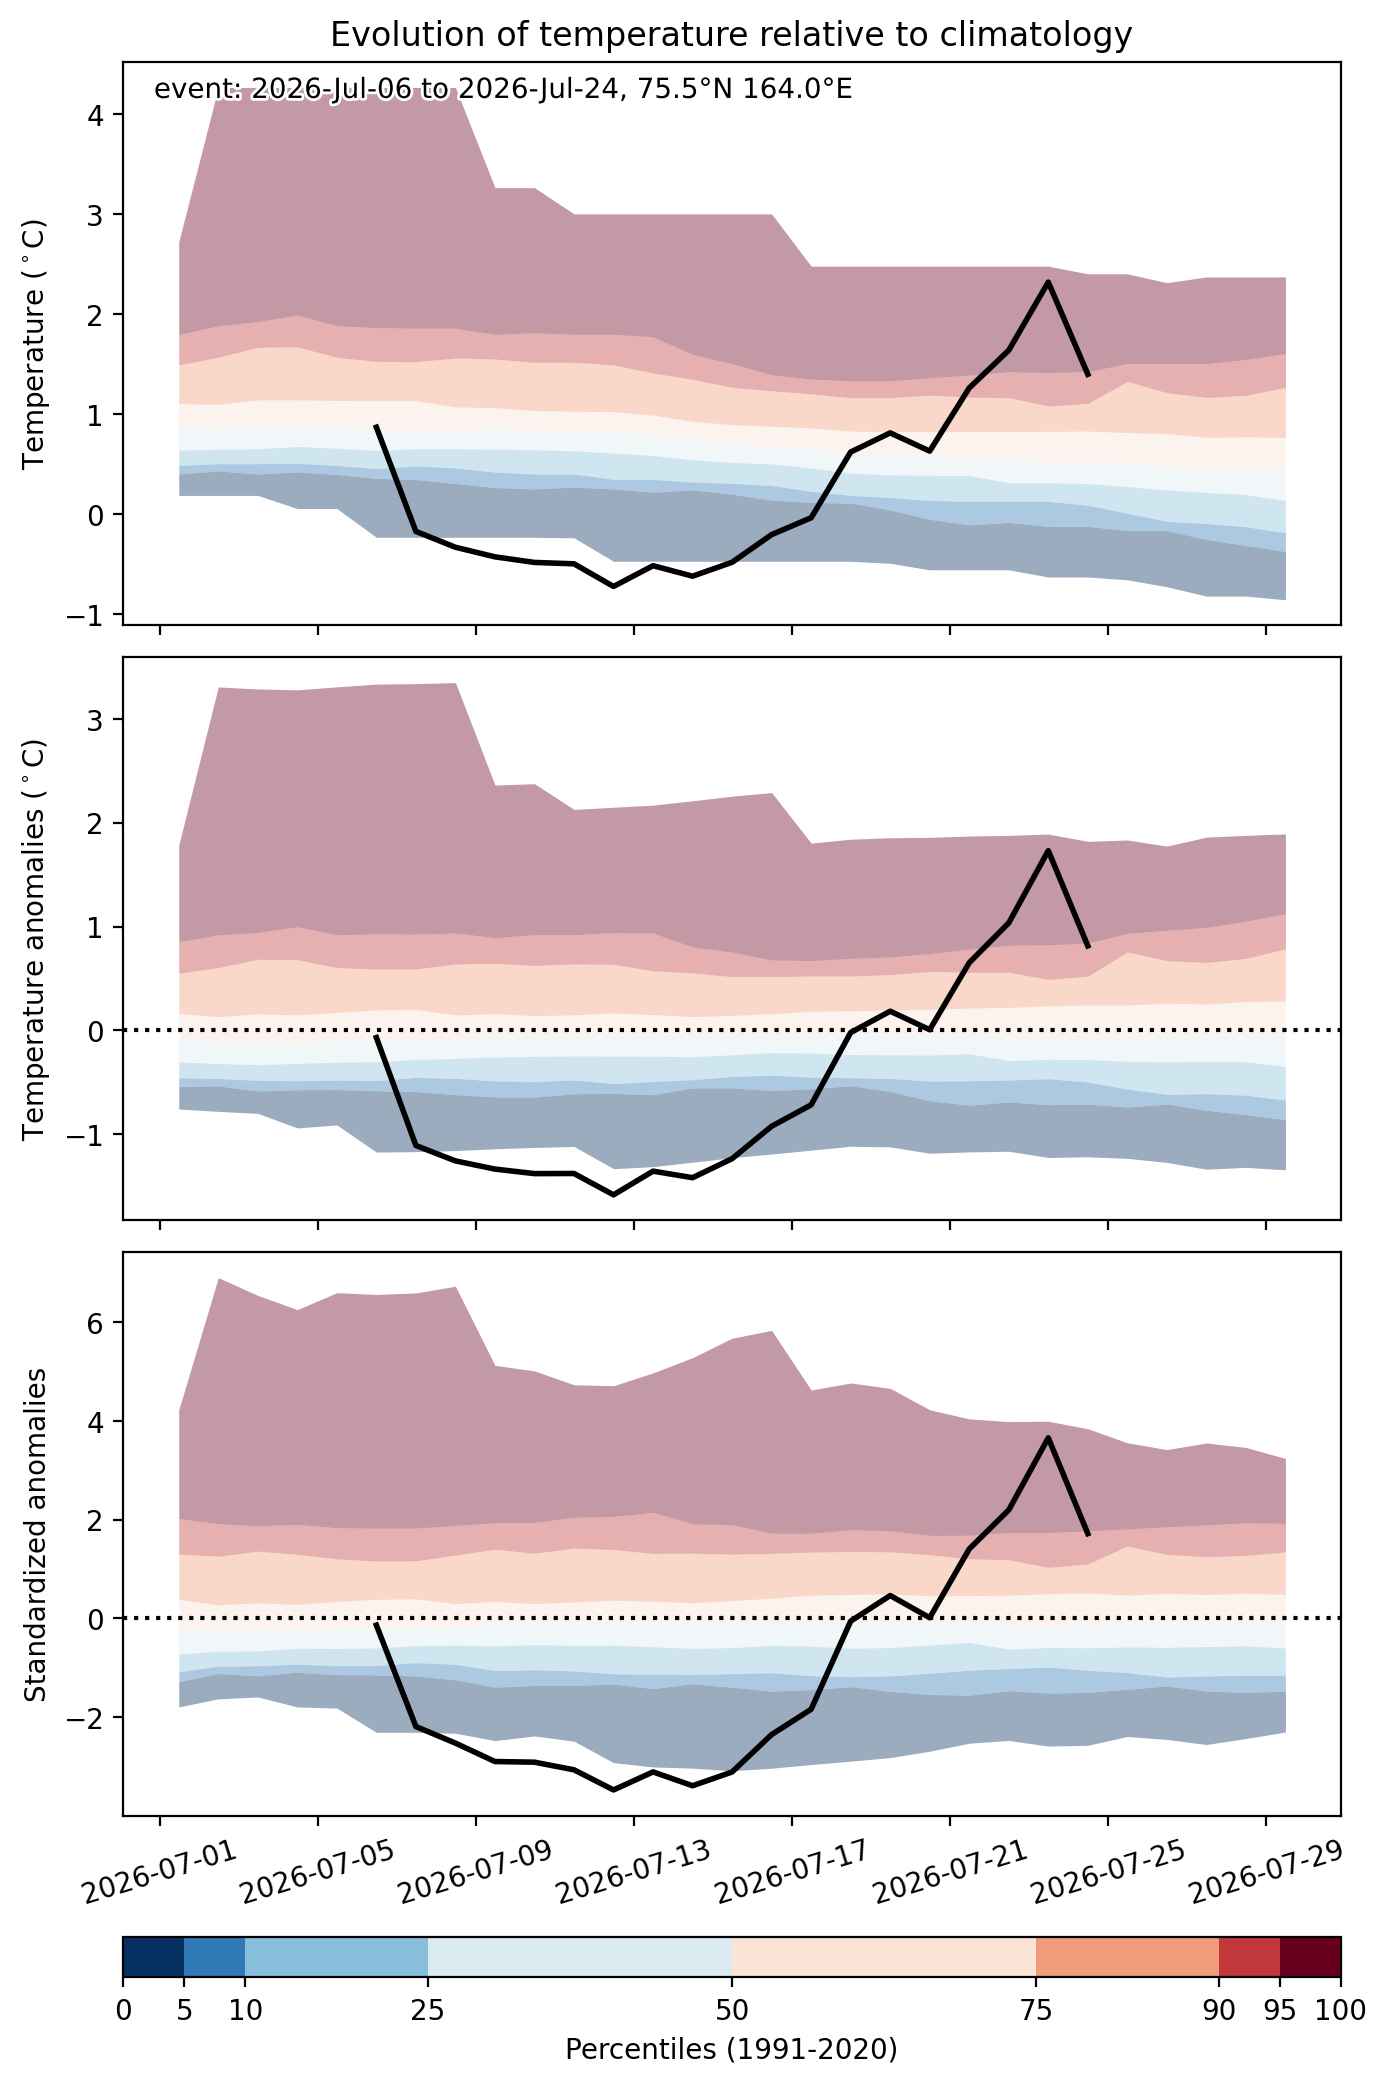
Fig. 2: Evolution of temperature at the center of the event. The climatological percentile distribution is illustrated with color shadings.


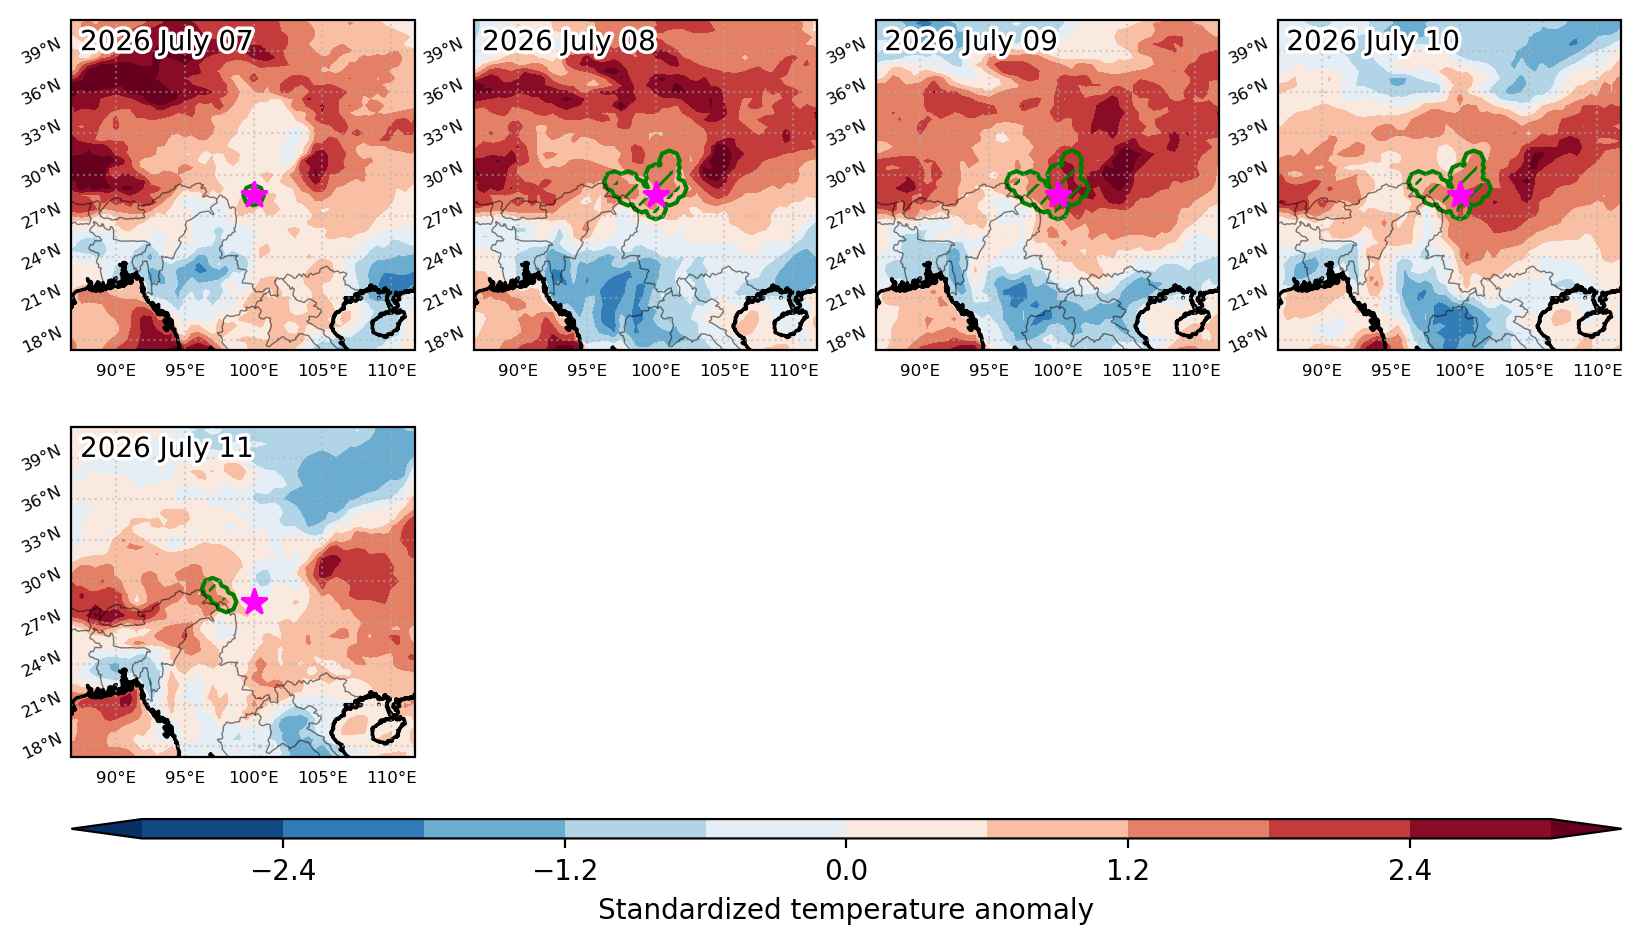
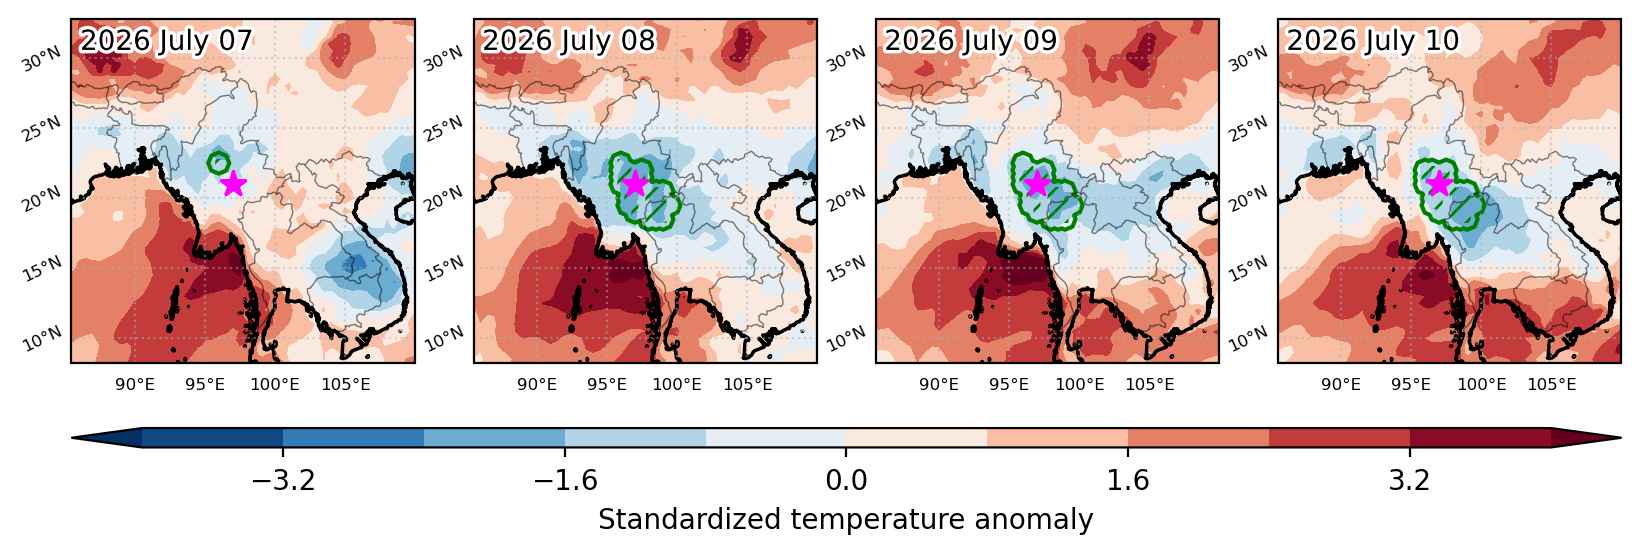
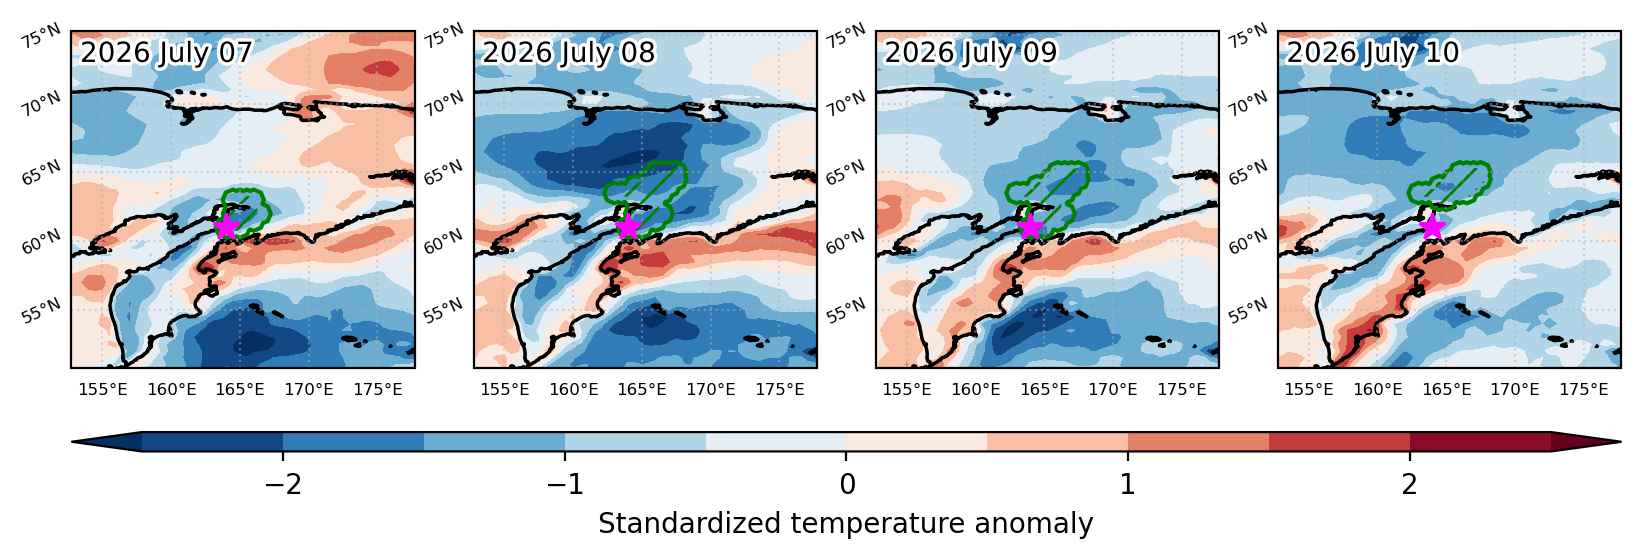
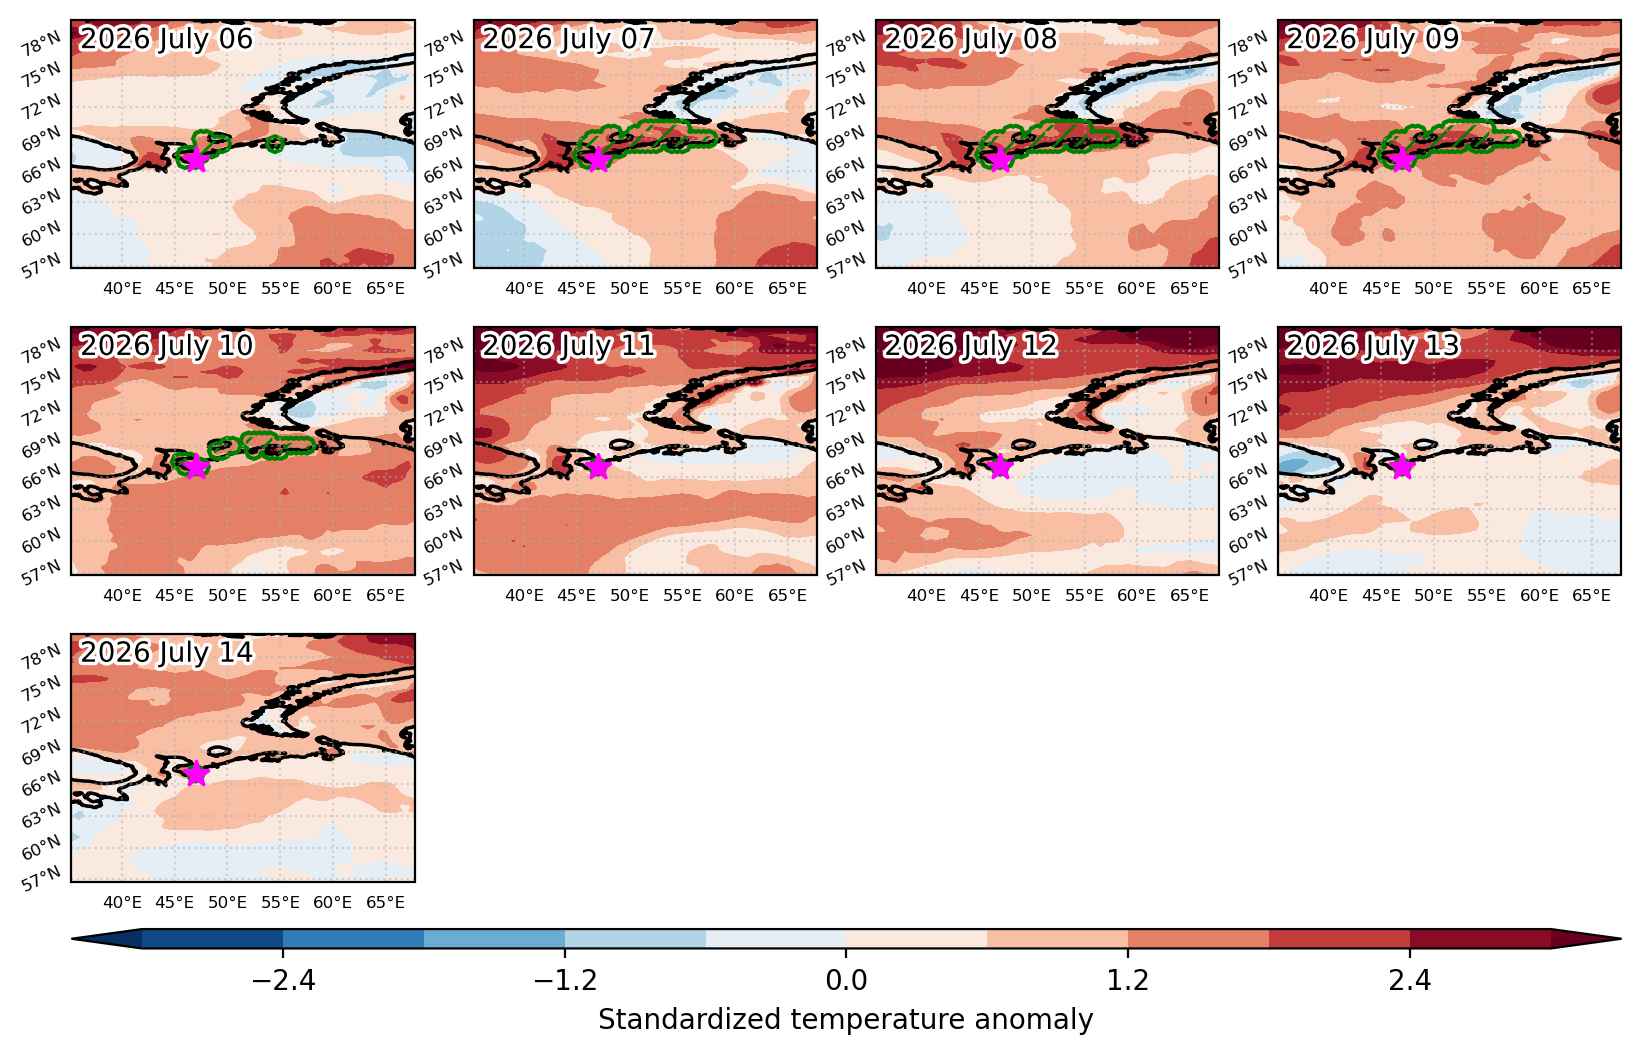
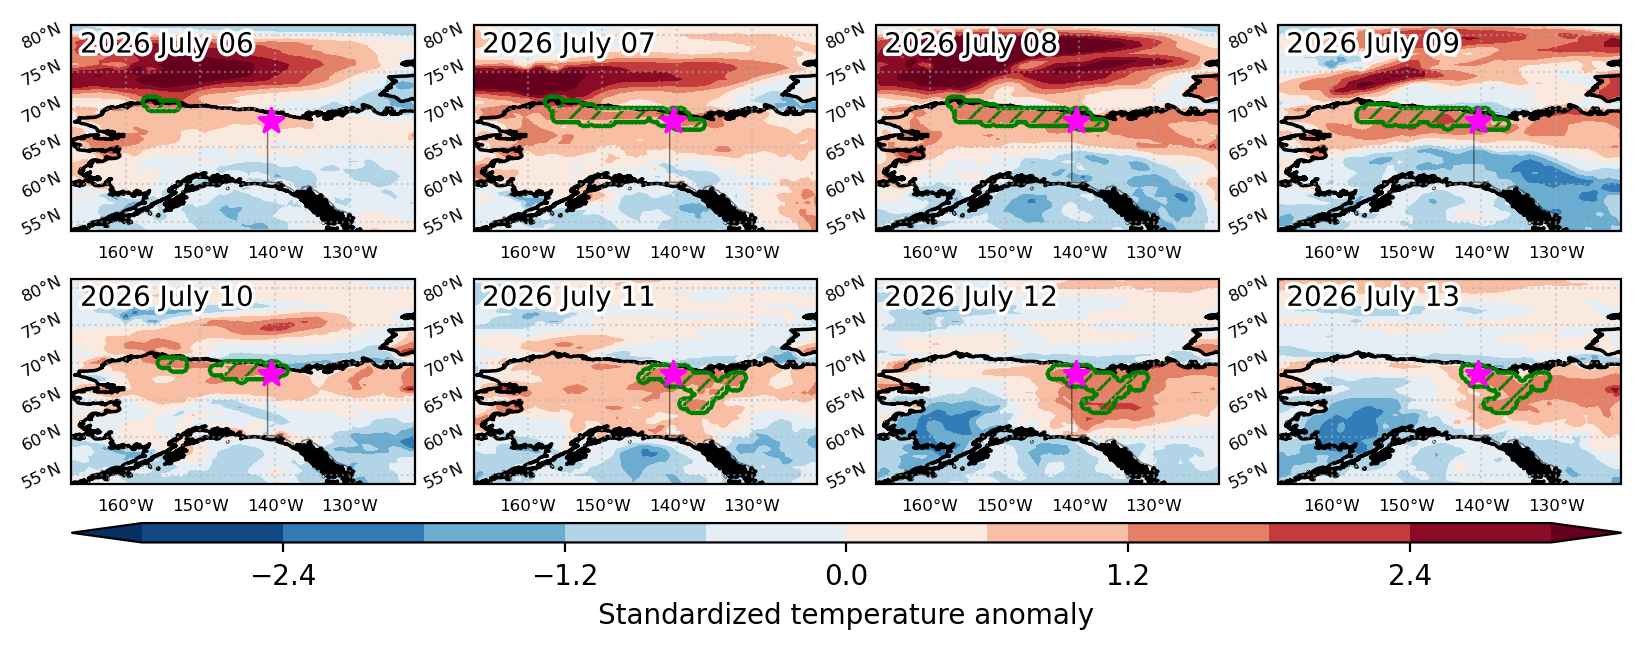
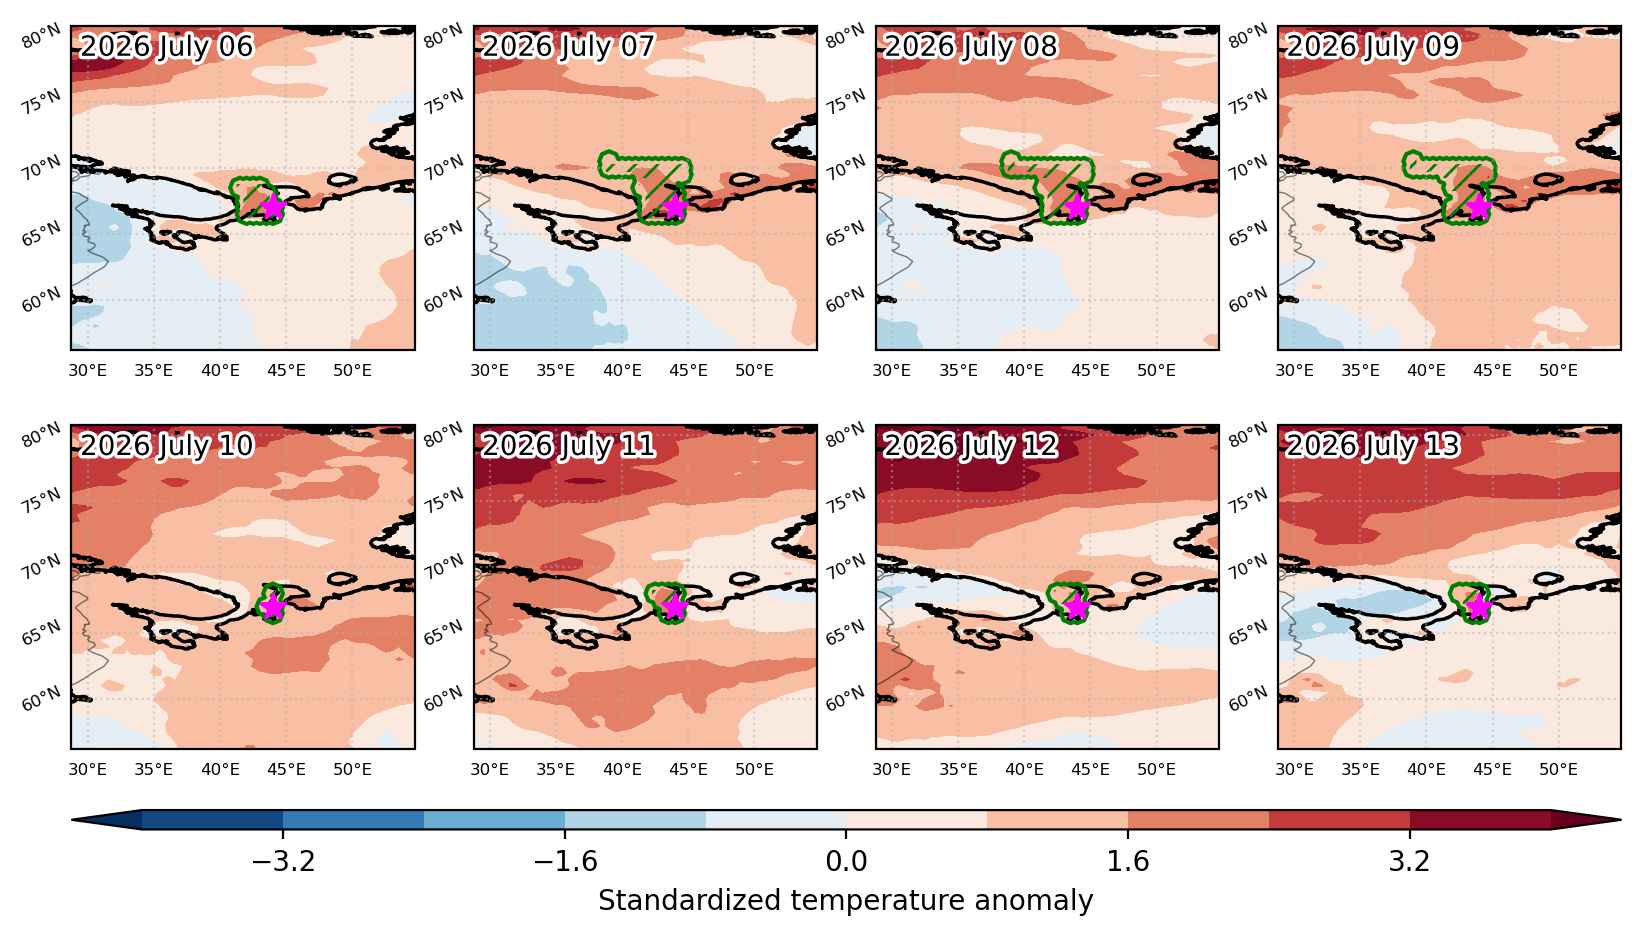
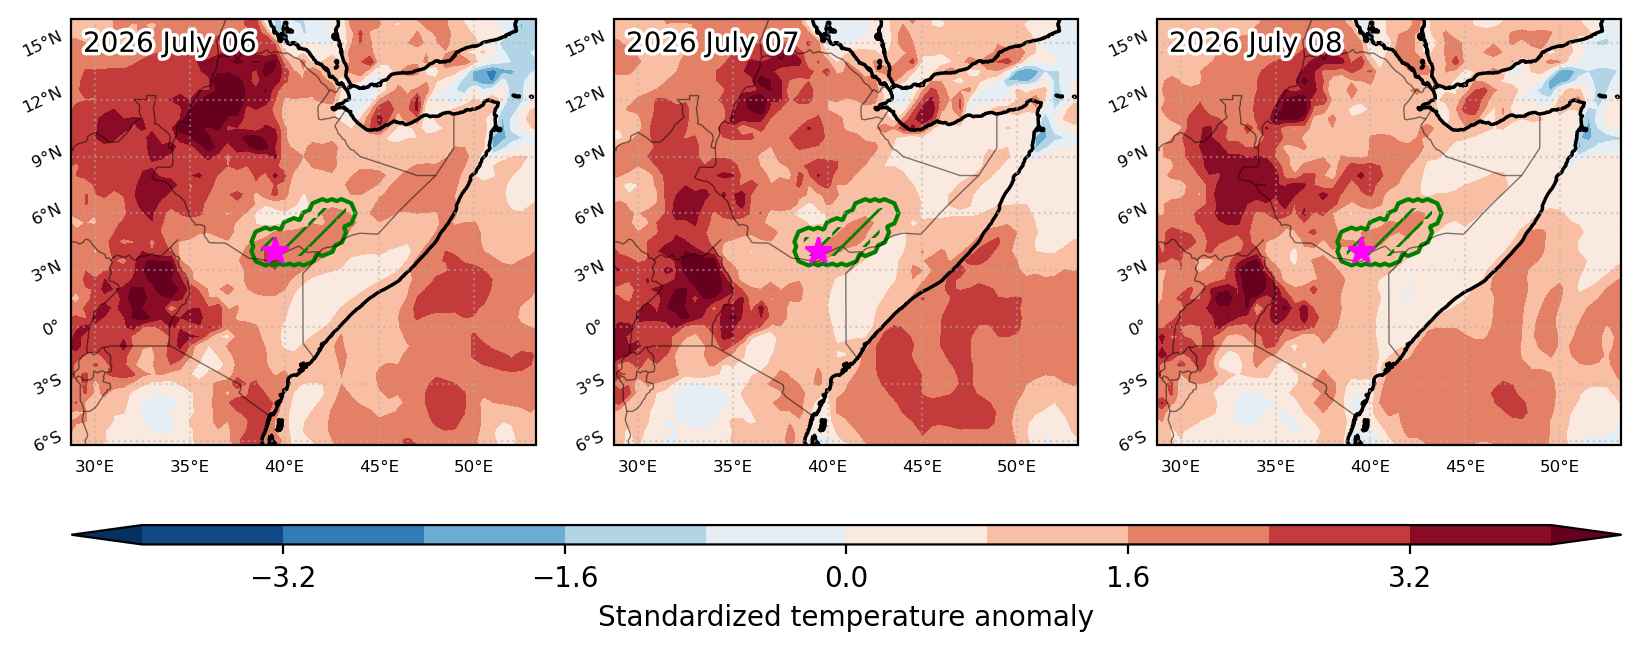
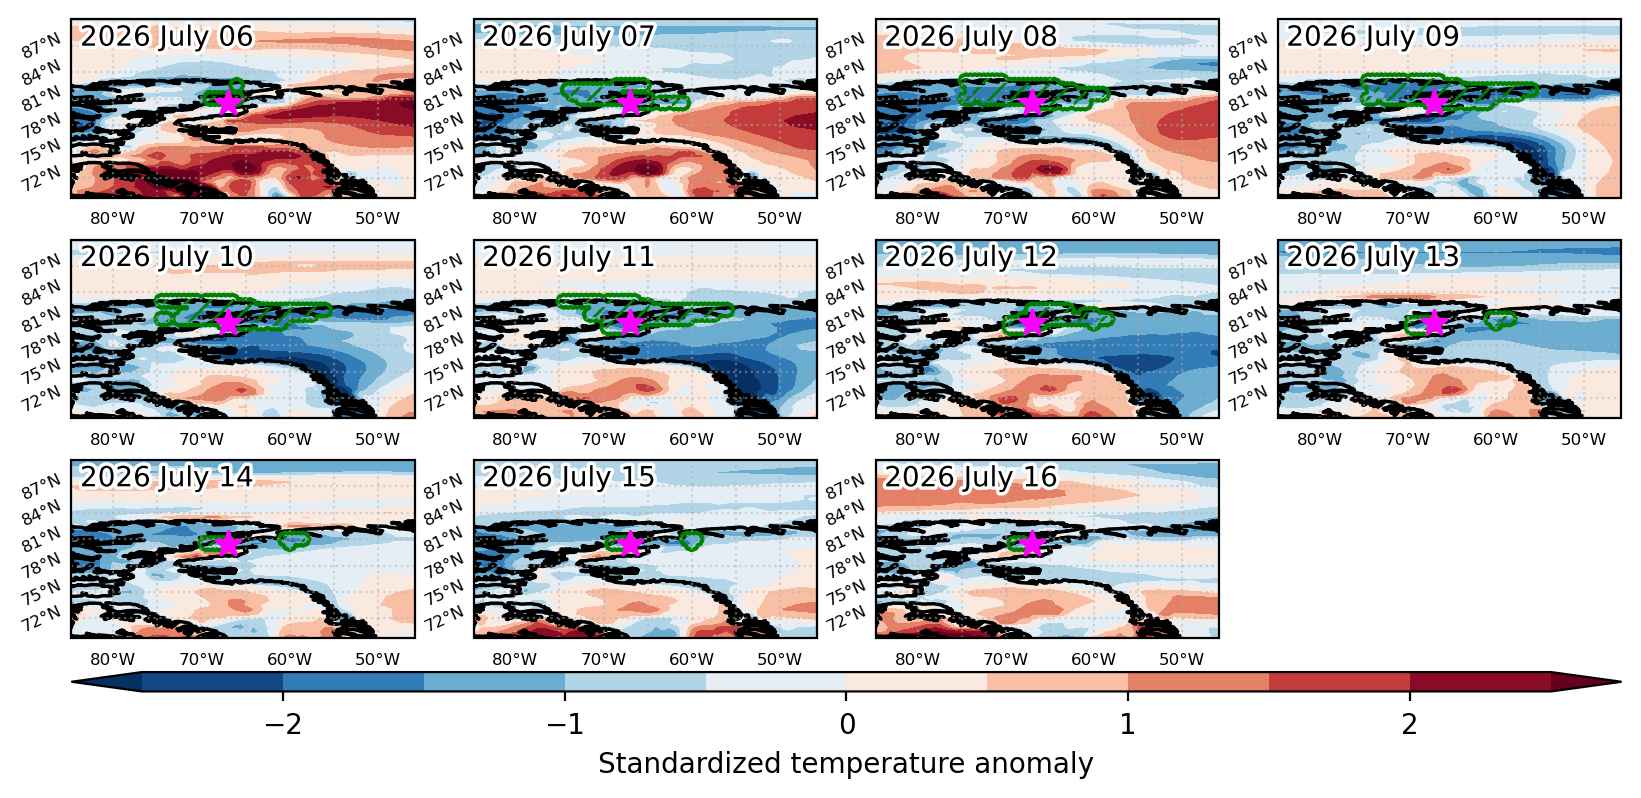
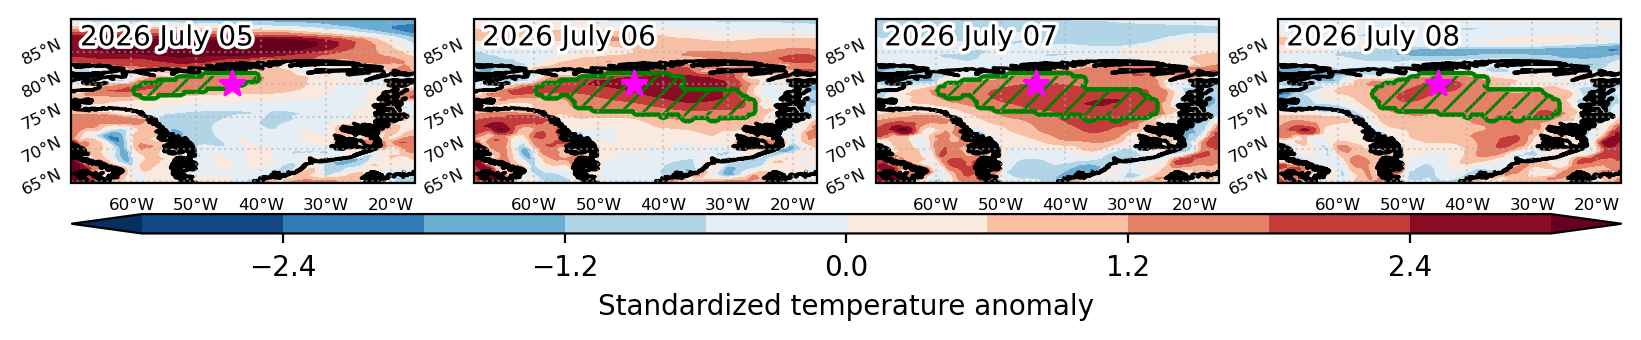
Fig. 3: Maps illustrating the evolution of standardized temperature anomalies during the event.

Event ID: Cold_spell_2026-Apr-05_to_2026-Apr-29_238.5_-68.5

Cold spell occuring from April 04 2026 to April 17 2026 at 34.5°N 43.0°E

Download data: JSON

Event type: Cold spell

Countries affected (identified with ArcGIS Online; provided only for geographical reference):

  • Armenia
  • Azerbaijan
  • Georgia
  • Iran
  • Iraq
  • Russian Federation
  • Syria
  • Turkiye

Duration: 14 days

Time span: April 04 2026 to April 17 2026

Statistics over entire affected area:

  • Mean temperature anomaly: -5.5 °C
  • Mean temperature: 6.9 °C
  • Minimum temperature anomaly: -9.1 °C
  • Minimum temperature: -7.4 °C

Event center: 34.5°N 43.0°E

Area affected: 858615 km$^2$


Fig. 1: Map of most extreme temperature anomalies (standardized) experienced during the event. The purple star indicates the center of the extreme event. Green hatching illustrates all areas under the effect of extremes at some time during the event.


Fig. 2: Evolution of temperature at the center of the event. The climatological percentile distribution is illustrated with color shadings.


Fig. 3: Maps illustrating the evolution of standardized temperature anomalies during the event.

Event ID: Cold_spell_2026-Apr-04_to_2026-Apr-17_43.0_34.5

Heat wave occuring from April 04 2026 to April 17 2026 at 9.5°N 273.0°E

Download data: JSON

Event type: Heat wave

Countries affected (identified with ArcGIS Online; provided only for geographical reference):

  • Costa Rica

Duration: 14 days

Time span: April 04 2026 to April 17 2026

Statistics over entire affected area:

  • Mean temperature anomaly: 1.2 °C
  • Mean temperature: 28.5 °C
  • Maximum temperature anomaly: 2.5 °C
  • Maximum temperature: 29.7 °C

Event center: 9.5°N 273.0°E

Area affected: 134441 km$^2$


Fig. 1: Map of most extreme temperature anomalies (standardized) experienced during the event. The purple star indicates the center of the extreme event. Green hatching illustrates all areas under the effect of extremes at some time during the event.


Fig. 2: Evolution of temperature at the center of the event. The climatological percentile distribution is illustrated with color shadings.


Fig. 3: Maps illustrating the evolution of standardized temperature anomalies during the event.

Event ID: Heat_wave_2026-Apr-04_to_2026-Apr-17_273.0_9.5

Heat wave occuring from April 04 2026 to April 07 2026 at 49.5°N 241.5°E

Download data: JSON

Event type: Heat wave

Countries affected (identified with ArcGIS Online; provided only for geographical reference):

  • Canada
  • United States

Duration: 4 days

Time span: April 04 2026 to April 07 2026

Statistics over entire affected area:

  • Mean temperature anomaly: 5.8 °C
  • Mean temperature: 8.4 °C
  • Maximum temperature anomaly: 9.0 °C
  • Maximum temperature: 14.3 °C

Event center: 49.5°N 241.5°E

Area affected: 120426 km$^2$


Fig. 1: Map of most extreme temperature anomalies (standardized) experienced during the event. The purple star indicates the center of the extreme event. Green hatching illustrates all areas under the effect of extremes at some time during the event.


Fig. 2: Evolution of temperature at the center of the event. The climatological percentile distribution is illustrated with color shadings.


Fig. 3: Maps illustrating the evolution of standardized temperature anomalies during the event.

Event ID: Heat_wave_2026-Apr-04_to_2026-Apr-07_241.5_49.5

Cold spell occuring from April 03 2026 to April 07 2026 at 7.5°N 29.0°E

Download data: JSON

Event type: Cold spell

Countries affected (identified with ArcGIS Online; provided only for geographical reference):

  • Central African Republic
  • Ethiopia
  • South Sudan

Duration: 5 days

Time span: April 03 2026 to April 07 2026

Statistics over entire affected area:

  • Mean temperature anomaly: -3.6 °C
  • Mean temperature: 26.7 °C
  • Minimum temperature anomaly: -5.7 °C
  • Minimum temperature: 20.2 °C

Event center: 7.5°N 29.0°E

Area affected: 337195 km$^2$


Fig. 1: Map of most extreme temperature anomalies (standardized) experienced during the event. The purple star indicates the center of the extreme event. Green hatching illustrates all areas under the effect of extremes at some time during the event.


Fig. 2: Evolution of temperature at the center of the event. The climatological percentile distribution is illustrated with color shadings.


Fig. 3: Maps illustrating the evolution of standardized temperature anomalies during the event.

Event ID: Cold_spell_2026-Apr-03_to_2026-Apr-07_29.0_7.5

Cold spell occuring from April 03 2026 to April 06 2026 at -83.0°S 252.5°E

Download data: JSON

Event type: Cold spell

Countries affected (identified with ArcGIS Online; provided only for geographical reference):

  • Antarctica

Duration: 4 days

Time span: April 03 2026 to April 06 2026

Statistics over entire affected area:

  • Mean temperature anomaly: -7.9 °C
  • Mean temperature: -37.9 °C
  • Minimum temperature anomaly: -10.7 °C
  • Minimum temperature: -45.1 °C

Event center: -83.0°S 252.5°E

Area affected: 113276 km$^2$


Fig. 1: Map of most extreme temperature anomalies (standardized) experienced during the event. The purple star indicates the center of the extreme event. Green hatching illustrates all areas under the effect of extremes at some time during the event.


Fig. 2: Evolution of temperature at the center of the event. The climatological percentile distribution is illustrated with color shadings.


Fig. 3: Maps illustrating the evolution of standardized temperature anomalies during the event.

Event ID: Cold_spell_2026-Apr-03_to_2026-Apr-06_252.5_-83.0

Heat wave occuring from April 03 2026 to April 09 2026 at 6.5°N 120.0°E

Download data: JSON

Event type: Heat wave

Countries affected (identified with ArcGIS Online; provided only for geographical reference):

  • Malaysia
  • Philippines

Duration: 7 days

Time span: April 03 2026 to April 09 2026

Statistics over entire affected area:

  • Mean temperature anomaly: 0.6 °C
  • Mean temperature: 28.0 °C
  • Maximum temperature anomaly: 1.3 °C
  • Maximum temperature: 28.6 °C

Event center: 6.5°N 120.0°E

Area affected: 64369 km$^2$


Fig. 1: Map of most extreme temperature anomalies (standardized) experienced during the event. The purple star indicates the center of the extreme event. Green hatching illustrates all areas under the effect of extremes at some time during the event.


Fig. 2: Evolution of temperature at the center of the event. The climatological percentile distribution is illustrated with color shadings.


Fig. 3: Maps illustrating the evolution of standardized temperature anomalies during the event.

Event ID: Heat_wave_2026-Apr-03_to_2026-Apr-09_120.0_6.5

Cold spell occuring from April 02 2026 to April 17 2026 at -10.0°S 149.5°E

Download data: JSON

Event type: Cold spell

Countries affected (identified with ArcGIS Online; provided only for geographical reference):

  • Papua New Guinea

Duration: 16 days

Time span: April 02 2026 to April 17 2026

Statistics over entire affected area:

  • Mean temperature anomaly: -1.5 °C
  • Mean temperature: 21.5 °C
  • Minimum temperature anomaly: -3.0 °C
  • Minimum temperature: 12.6 °C

Event center: -10.0°S 149.5°E

Area affected: 125084 km$^2$


Fig. 1: Map of most extreme temperature anomalies (standardized) experienced during the event. The purple star indicates the center of the extreme event. Green hatching illustrates all areas under the effect of extremes at some time during the event.


Fig. 2: Evolution of temperature at the center of the event. The climatological percentile distribution is illustrated with color shadings.


Fig. 3: Maps illustrating the evolution of standardized temperature anomalies during the event.

Event ID: Cold_spell_2026-Apr-02_to_2026-Apr-17_149.5_-10.0

Cold spell occuring from April 02 2026 to April 06 2026 at 58.0°N 202.0°E

Download data: JSON

Event type: Cold spell

Countries affected (identified with ArcGIS Online; provided only for geographical reference):

  • United States

Duration: 5 days

Time span: April 02 2026 to April 06 2026

Statistics over entire affected area:

  • Mean temperature anomaly: -5.3 °C
  • Mean temperature: -5.6 °C
  • Minimum temperature anomaly: -8.8 °C
  • Minimum temperature: -10.0 °C

Event center: 58.0°N 202.0°E

Area affected: 52993 km$^2$


Fig. 1: Map of most extreme temperature anomalies (standardized) experienced during the event. The purple star indicates the center of the extreme event. Green hatching illustrates all areas under the effect of extremes at some time during the event.


Fig. 2: Evolution of temperature at the center of the event. The climatological percentile distribution is illustrated with color shadings.


Fig. 3: Maps illustrating the evolution of standardized temperature anomalies during the event.

Event ID: Cold_spell_2026-Apr-02_to_2026-Apr-06_202.0_58.0

Heat wave occuring from April 01 2026 to April 04 2026 at 24.0°N 38.0°E

Download data: JSON

Event type: Heat wave

Countries affected (identified with ArcGIS Online; provided only for geographical reference):

  • Saudi Arabia

Duration: 4 days

Time span: April 01 2026 to April 04 2026

Statistics over entire affected area:

  • Mean temperature anomaly: 3.0 °C
  • Mean temperature: 27.9 °C
  • Maximum temperature anomaly: 5.1 °C
  • Maximum temperature: 32.8 °C

Event center: 24.0°N 38.0°E

Area affected: 76678 km$^2$


Fig. 1: Map of most extreme temperature anomalies (standardized) experienced during the event. The purple star indicates the center of the extreme event. Green hatching illustrates all areas under the effect of extremes at some time during the event.


Fig. 2: Evolution of temperature at the center of the event. The climatological percentile distribution is illustrated with color shadings.


Fig. 3: Maps illustrating the evolution of standardized temperature anomalies during the event.

Event ID: Heat_wave_2026-Apr-01_to_2026-Apr-04_38.0_24.0