Heat wave occuring from July 27 2018 to August 09 2018 at 5.5°N 35.5°E

Download data: JSON

Event type: Heat wave

Countries affected (identified with ArcGIS Online; provided only for geographical reference):

  • Ethiopia
  • Kenya
  • South Sudan
  • Uganda

Duration: 14 days

Time span: July 27 2018 to August 09 2018

Statistics over entire affected area:

  • Mean temperature anomaly: 2.0 °C
  • Mean temperature: 27.9 °C
  • Maximum temperature anomaly: 3.7 °C
  • Maximum temperature: 32.3 °C

Event center: 5.5°N 35.5°E

Area affected: 92560 km$^2$
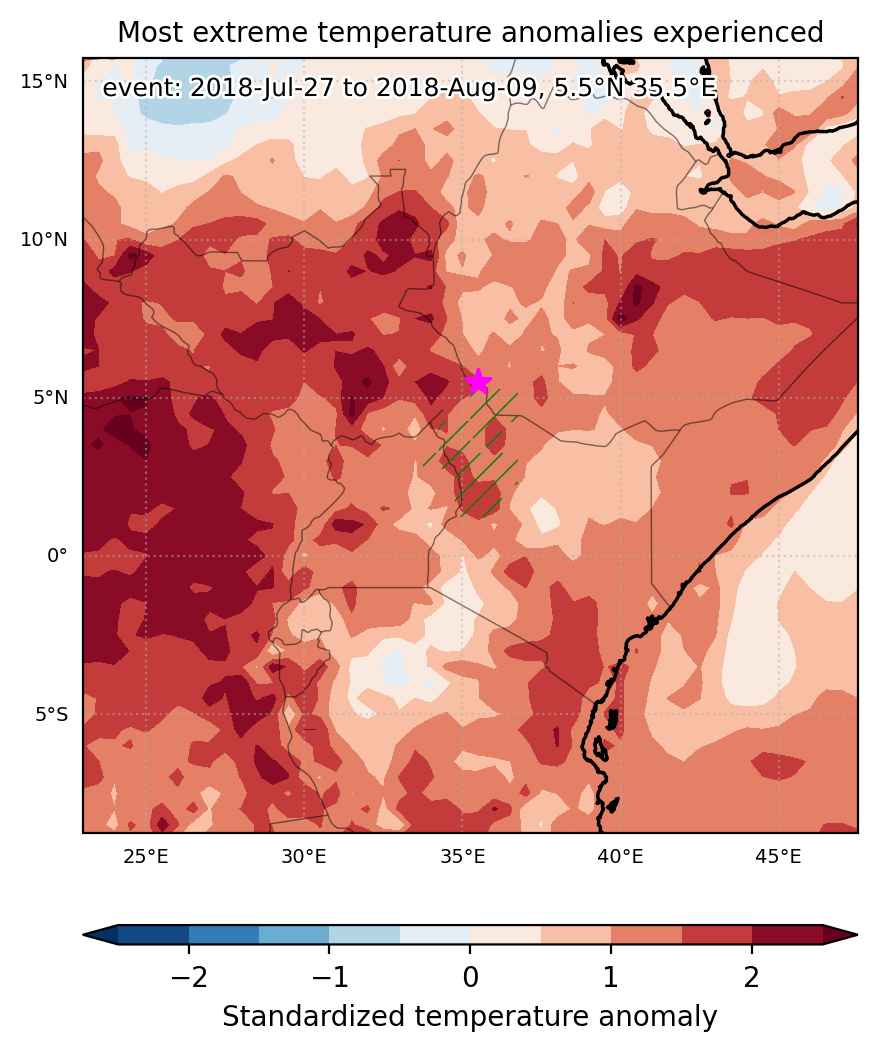

Fig. 1: Map of most extreme temperature anomalies (standardized) experienced during the event. The purple star indicates the center of the extreme event. Green hatching illustrates all areas under the effect of extremes at some time during the event.
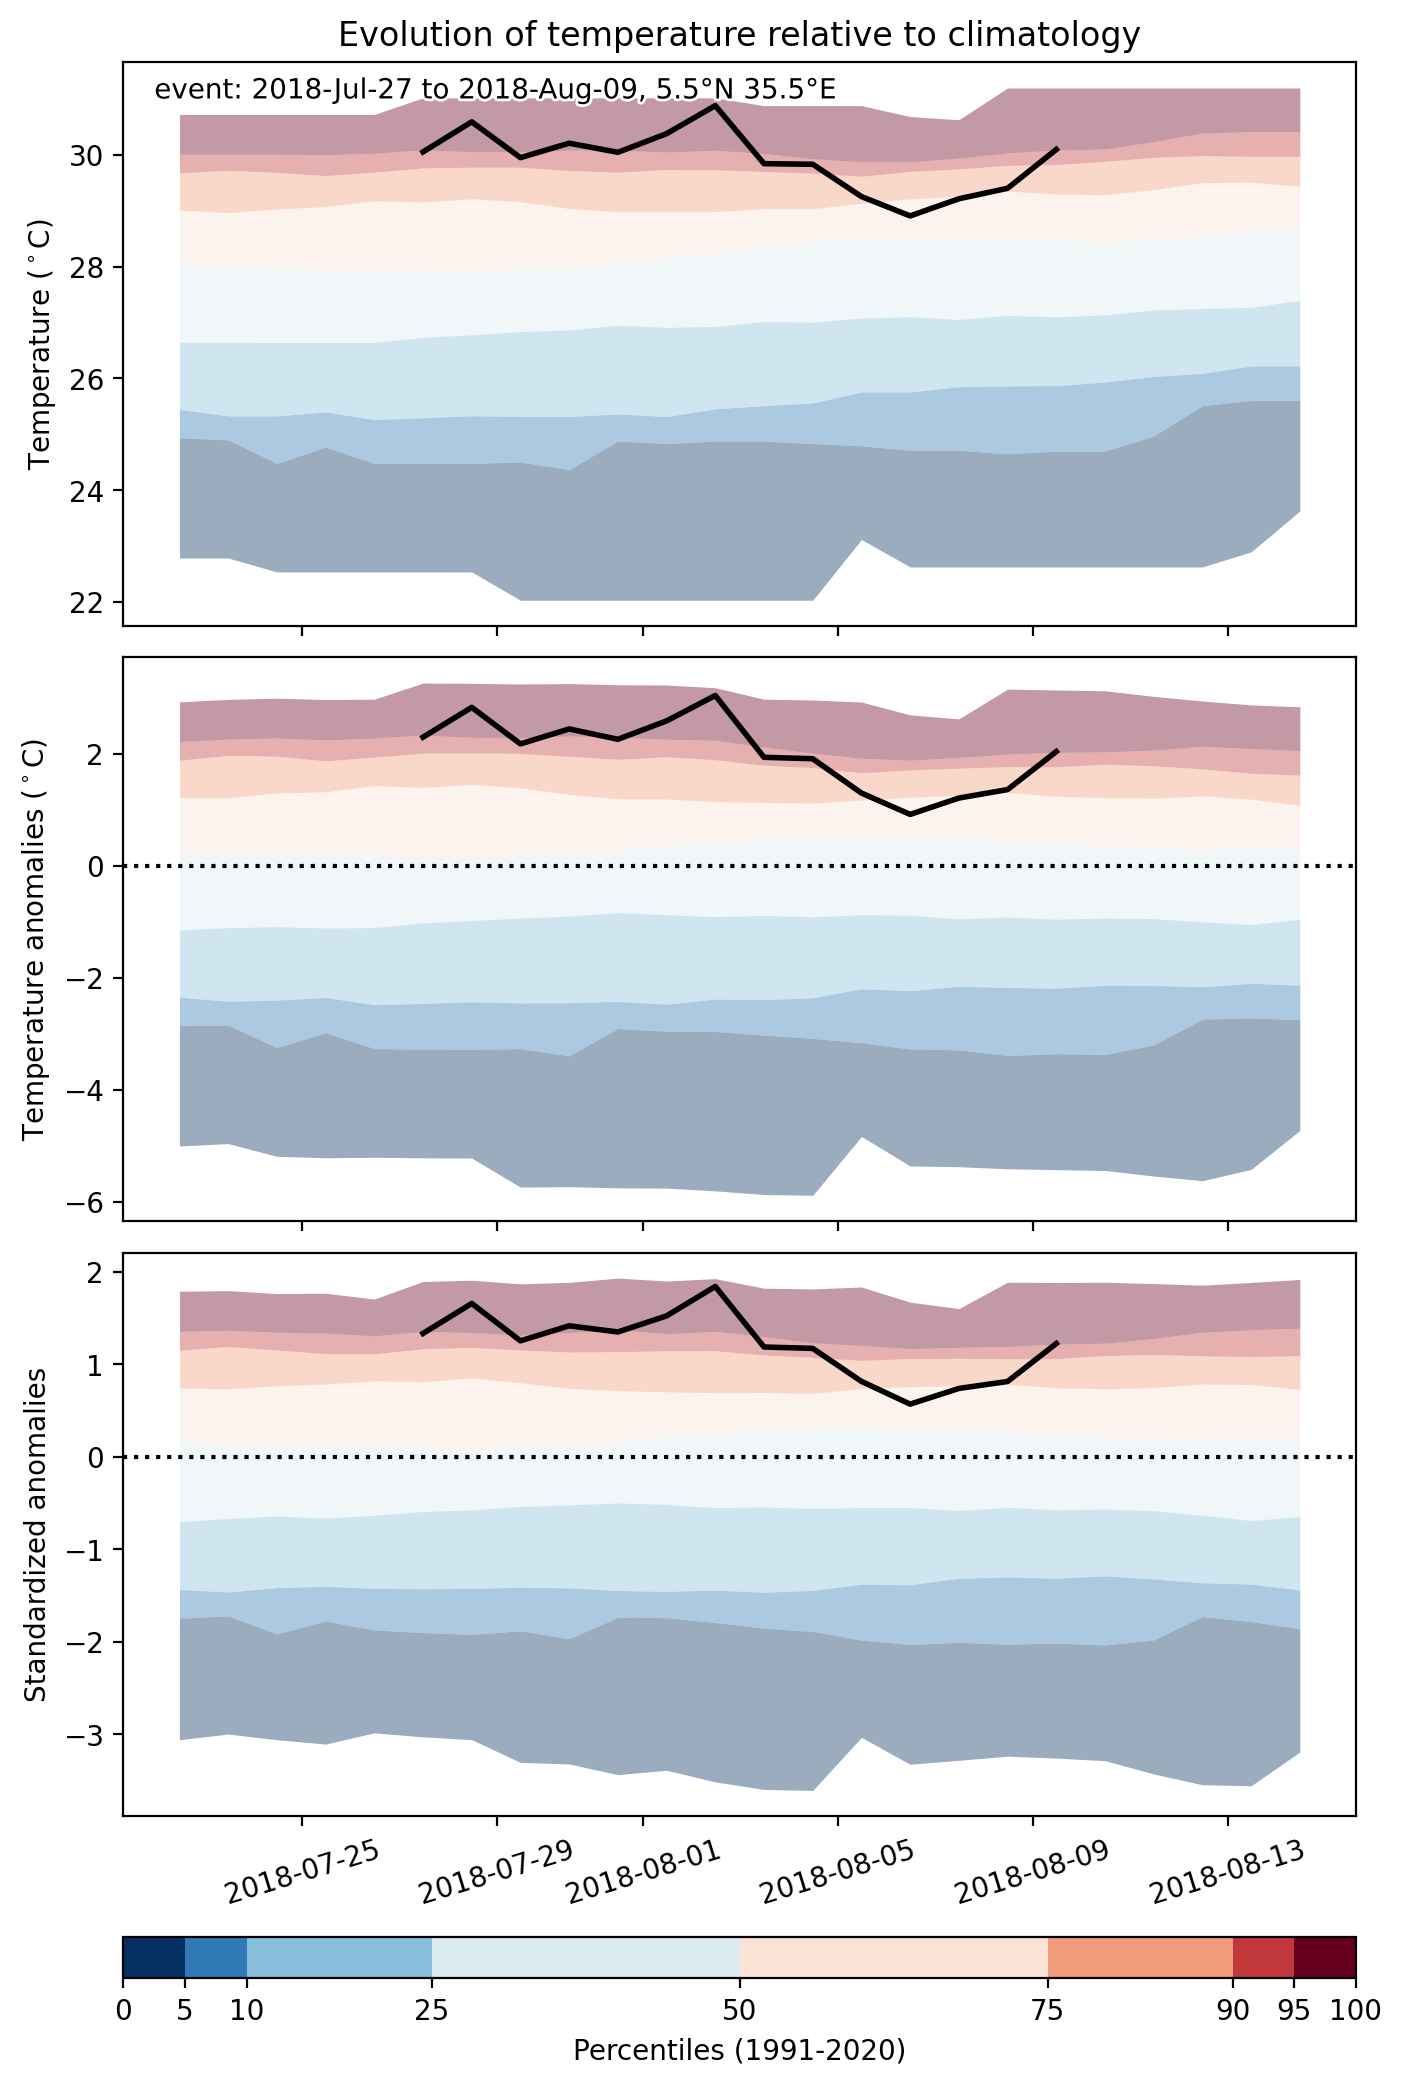


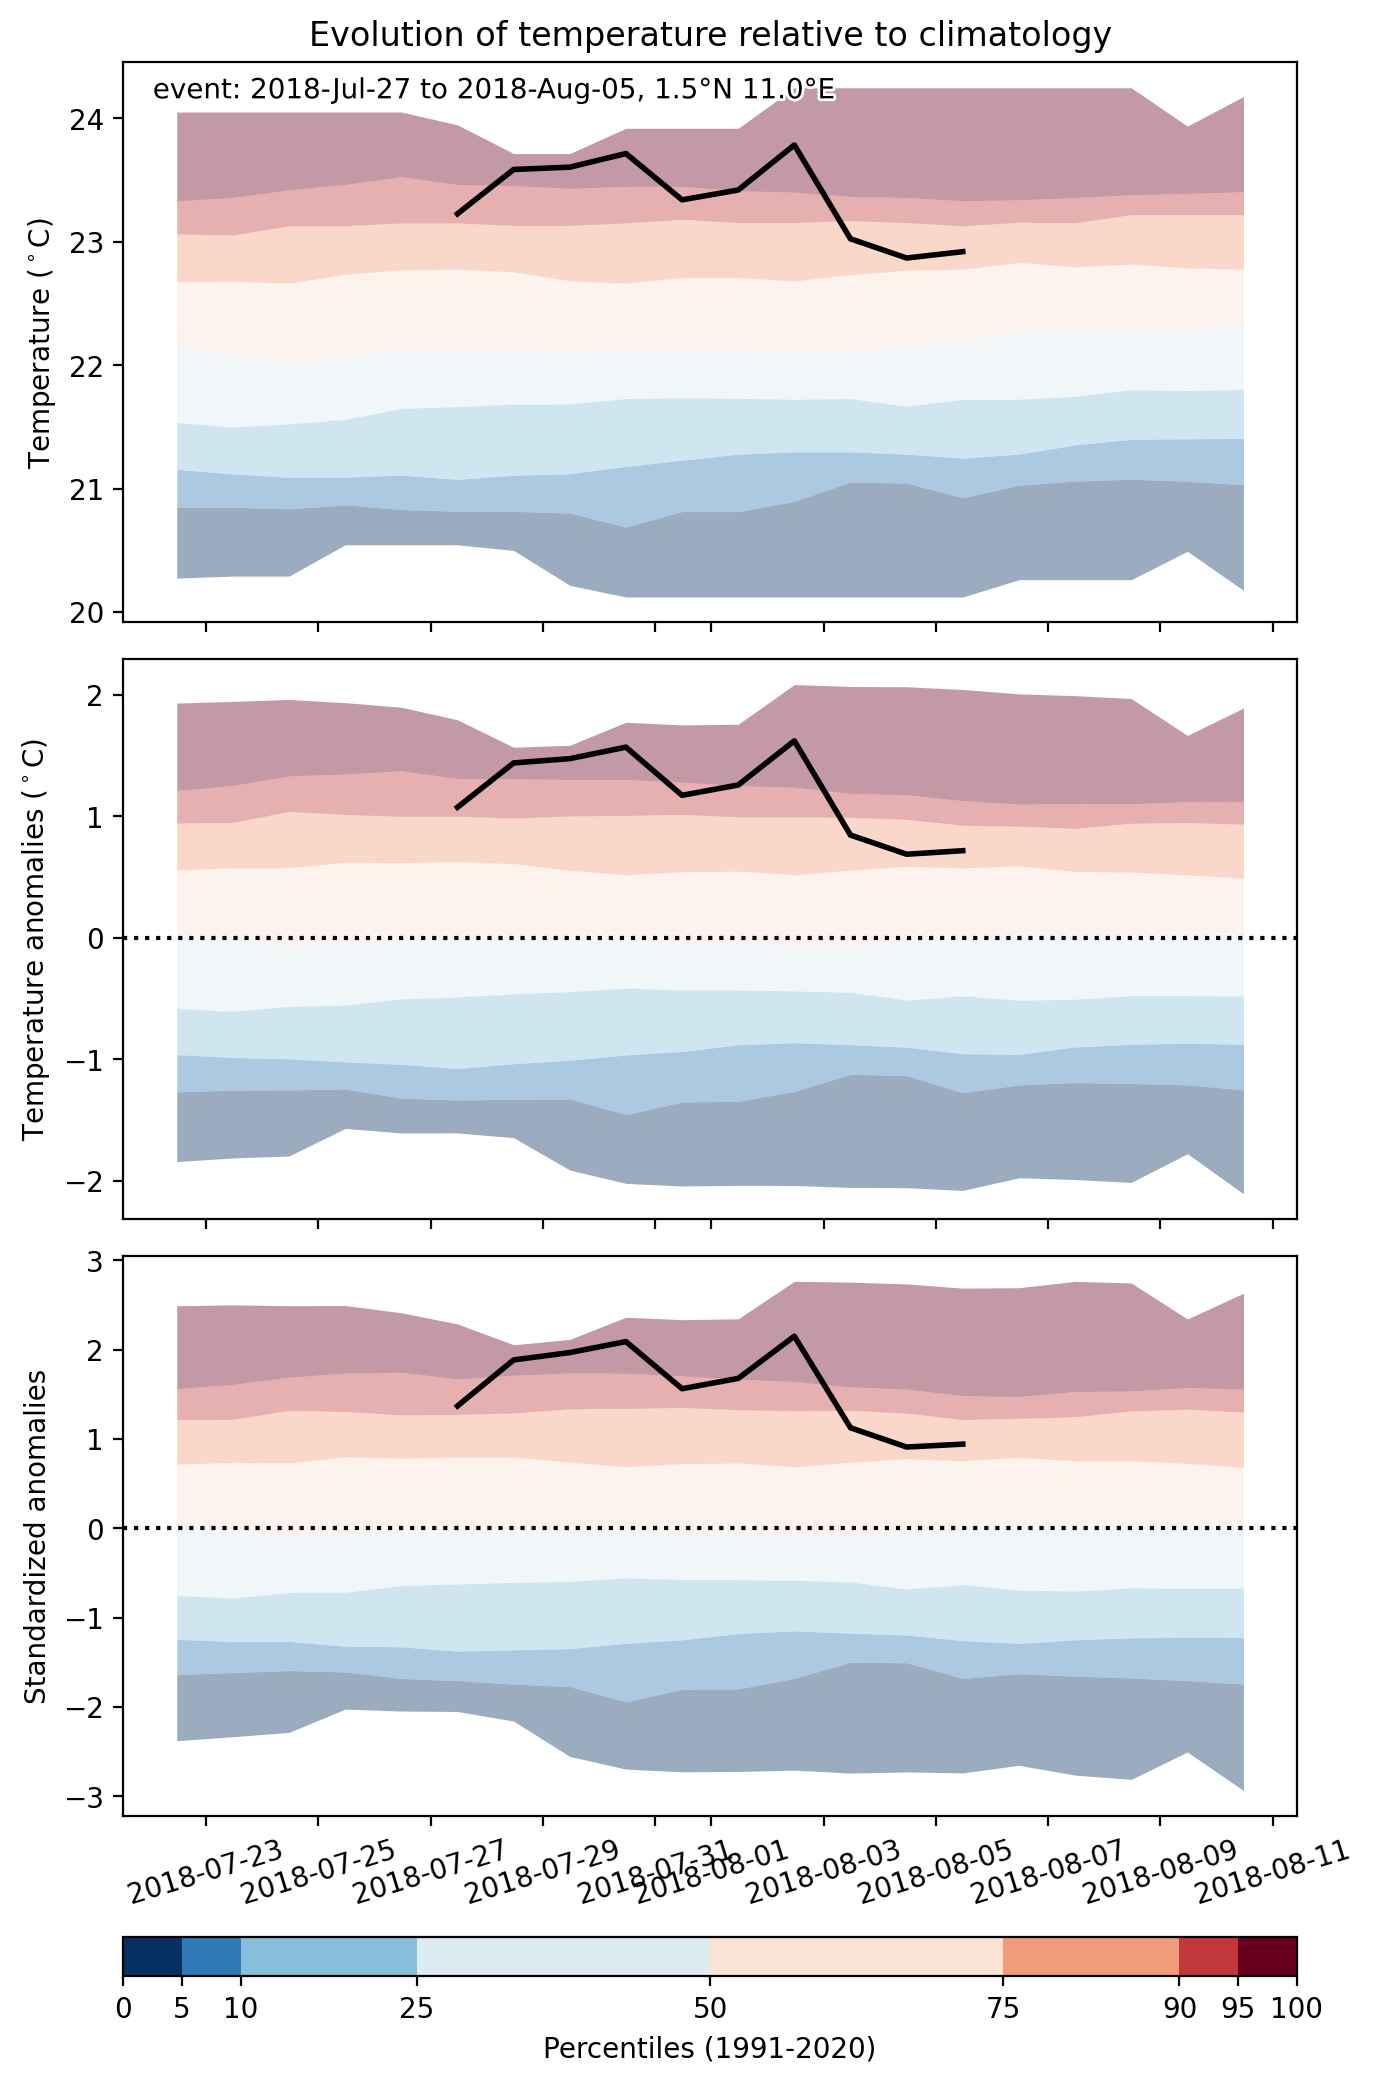
Fig. 2: Evolution of temperature at the center of the event. The climatological percentile distribution is illustrated with color shadings.
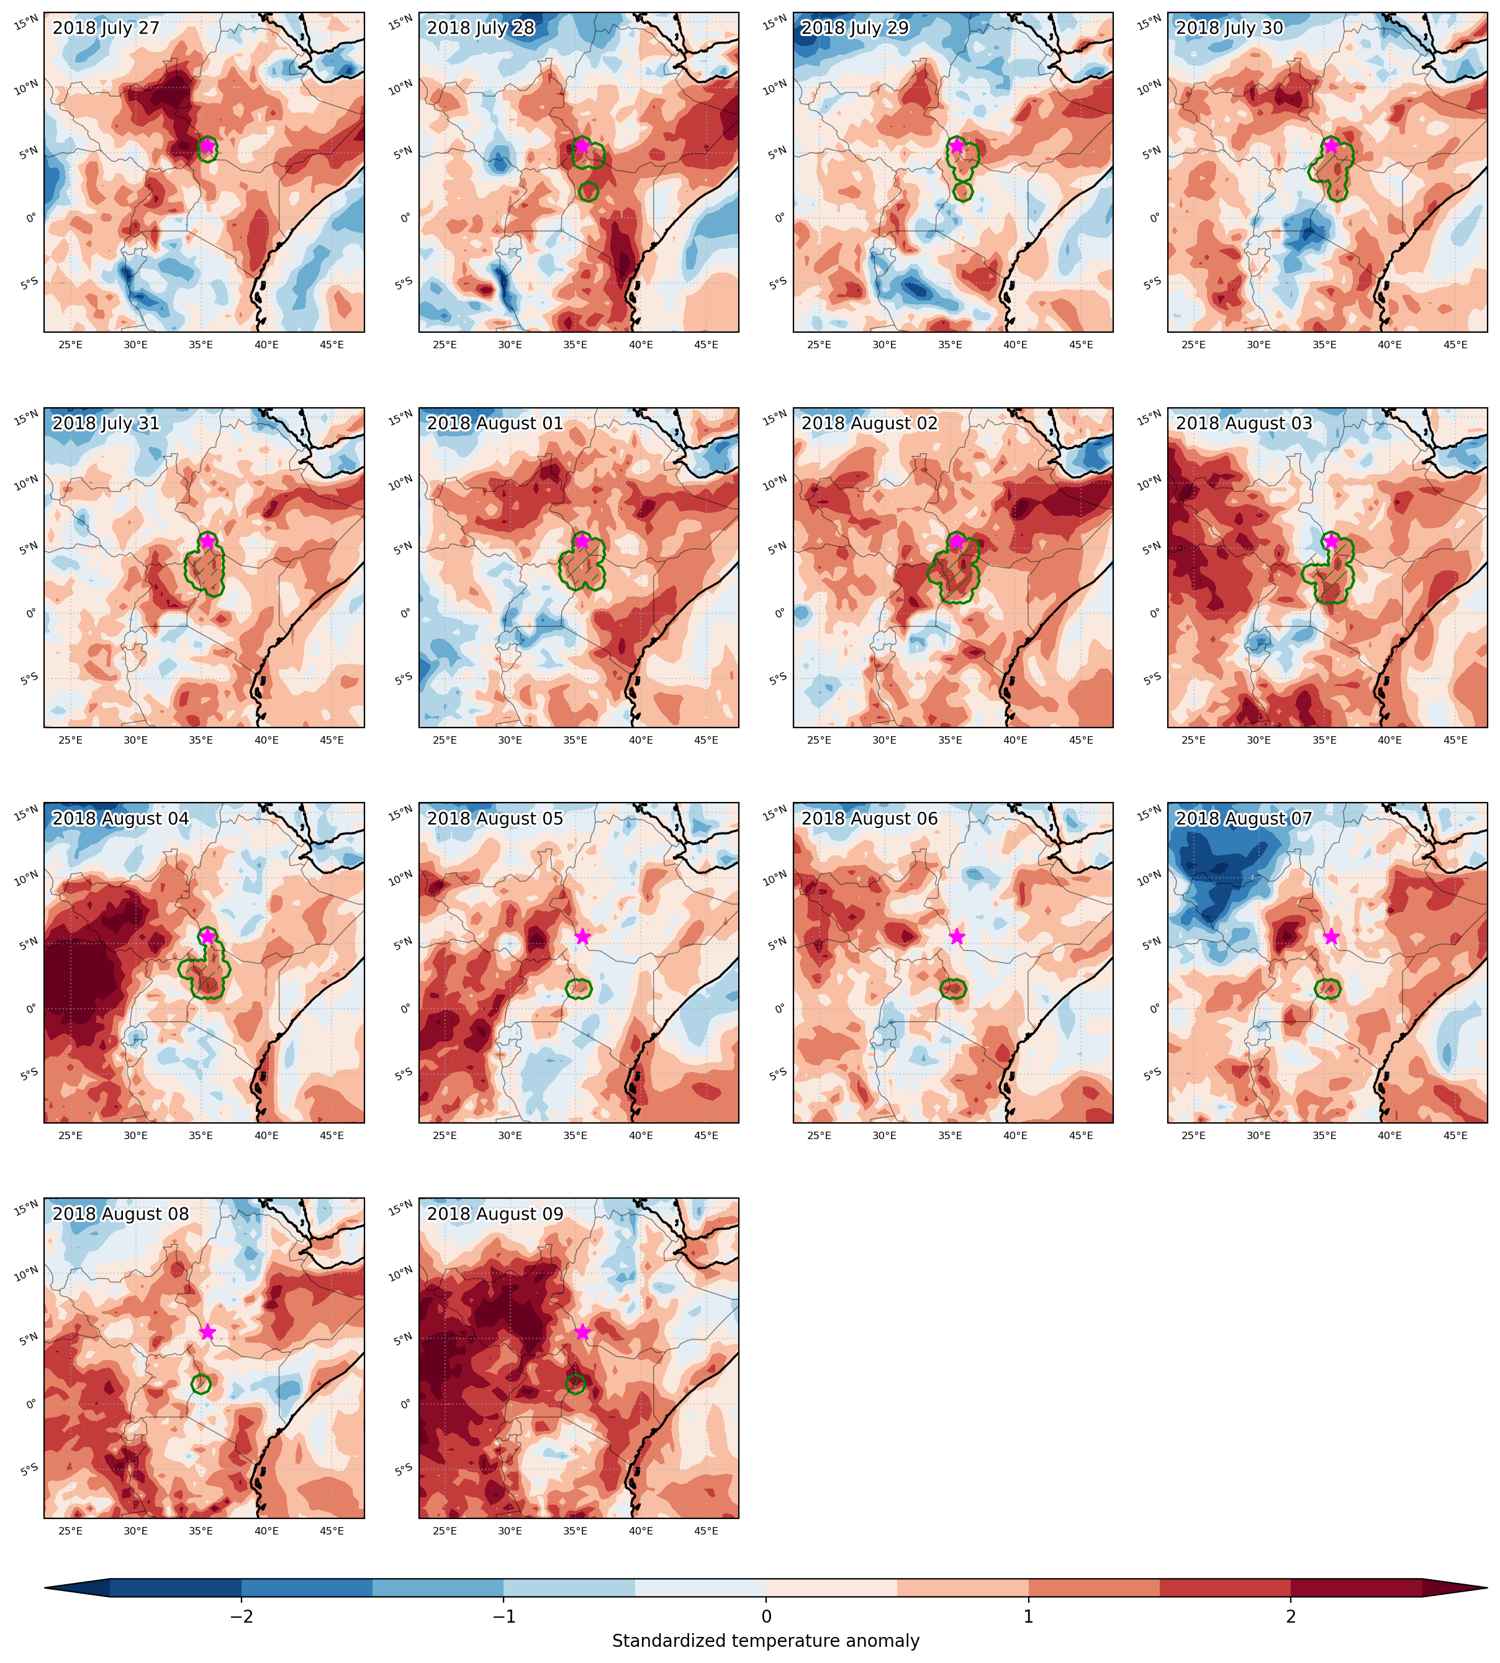


Fig. 3: Maps illustrating the evolution of standardized temperature anomalies during the event.

Event ID: Heat_wave_2018-Jul-27_to_2018-Aug-09_35.5_5.5
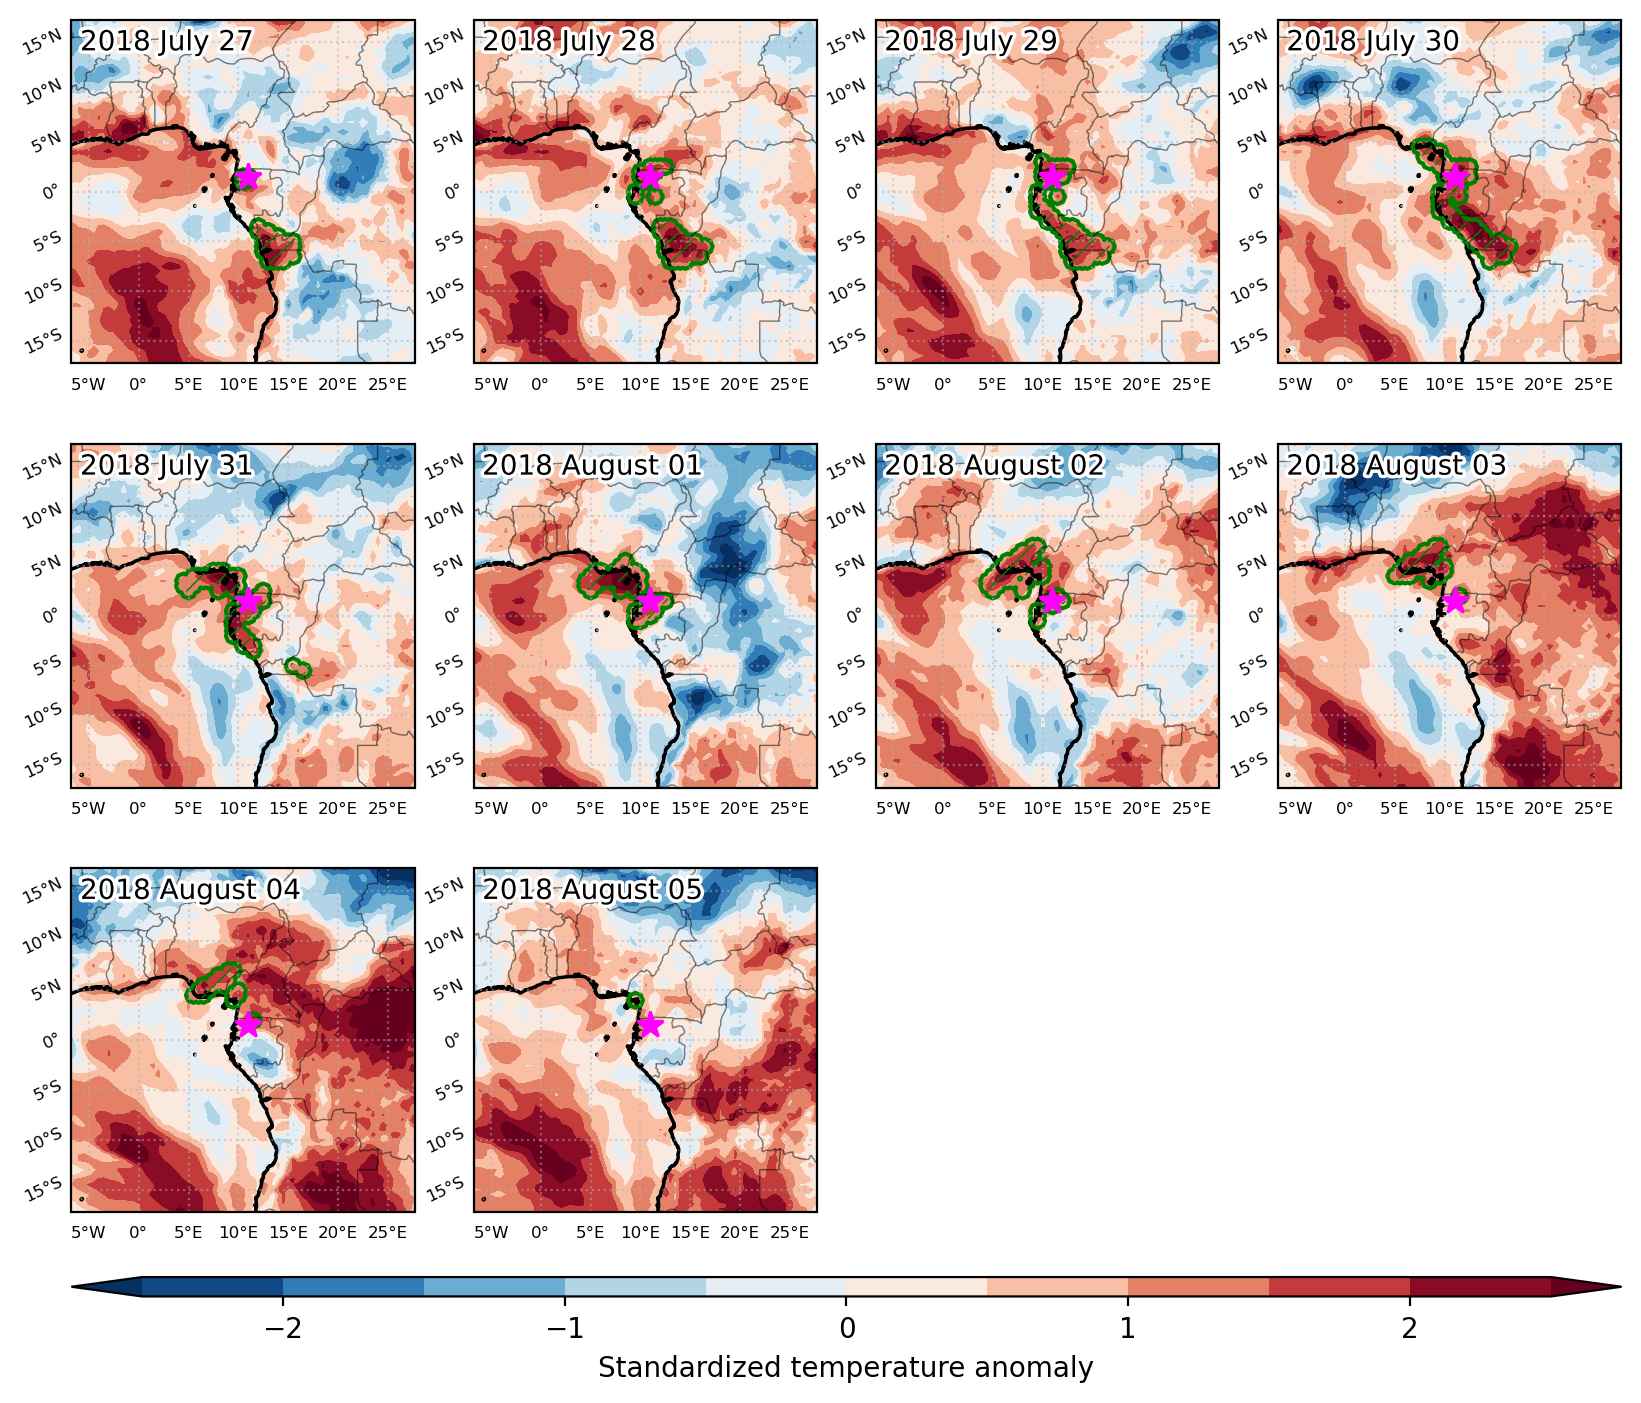
Heat wave occuring from July 27 2018 to August 05 2018 at 1.5°N 11.0°E

Download data: JSON

Event type: Heat wave

Countries affected (identified with ArcGIS Online; provided only for geographical reference):

  • Angola
  • Cameroon
  • Congo
  • Congo DRC
  • Equatorial Guinea
  • Gabon
  • Nigeria

Duration: 10 days

Time span: July 27 2018 to August 05 2018

Statistics over entire affected area:

  • Mean temperature anomaly: 1.3 °C
  • Mean temperature: 24.5 °C
  • Maximum temperature anomaly: 2.3 °C
  • Maximum temperature: 27.2 °C

Event center: 1.5°N 11.0°E

Area affected: 428449 km$^2$


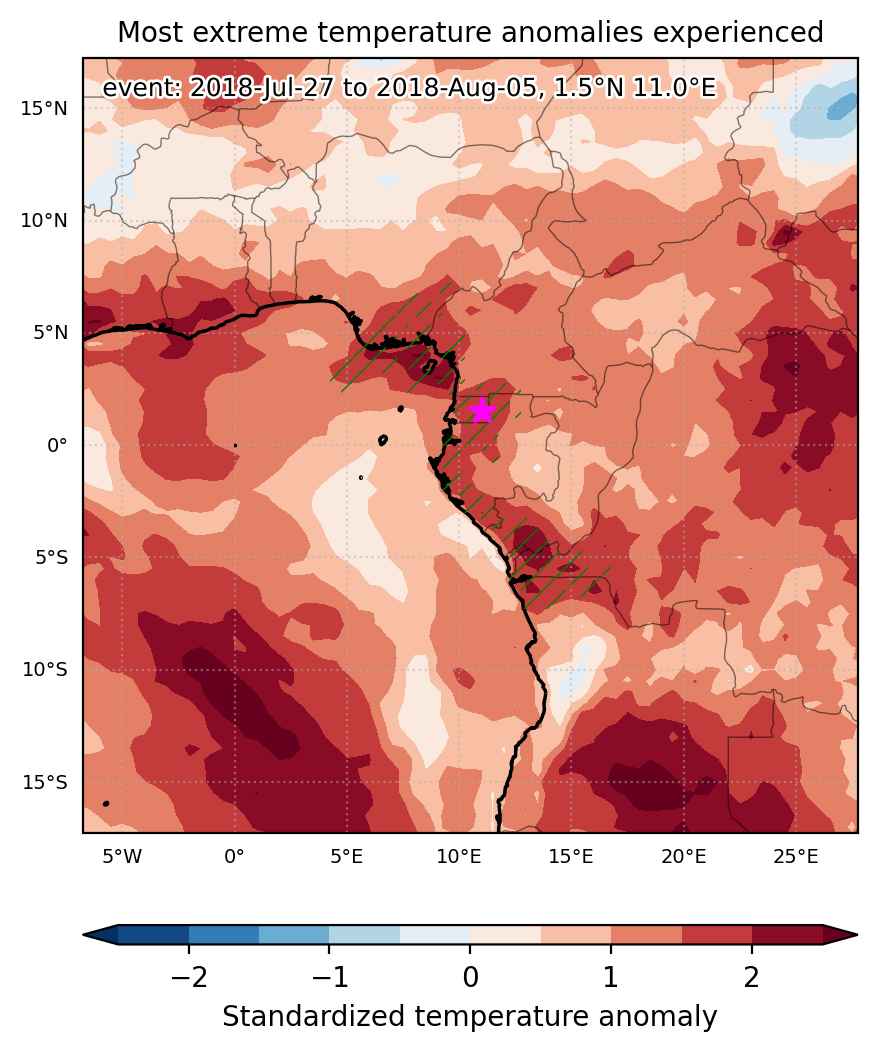
Fig. 1: Map of most extreme temperature anomalies (standardized) experienced during the event. The purple star indicates the center of the extreme event. Green hatching illustrates all areas under the effect of extremes at some time during the event.


Fig. 2: Evolution of temperature at the center of the event. The climatological percentile distribution is illustrated with color shadings.


Fig. 3: Maps illustrating the evolution of standardized temperature anomalies during the event.

Event ID: Heat_wave_2018-Jul-27_to_2018-Aug-05_11.0_1.5

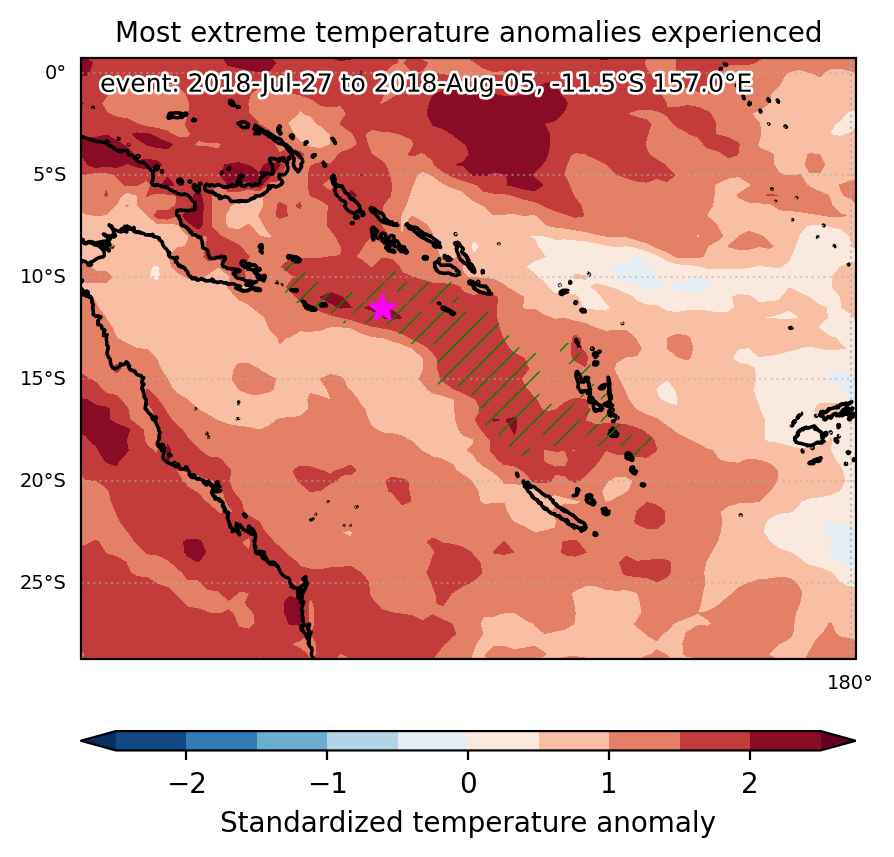
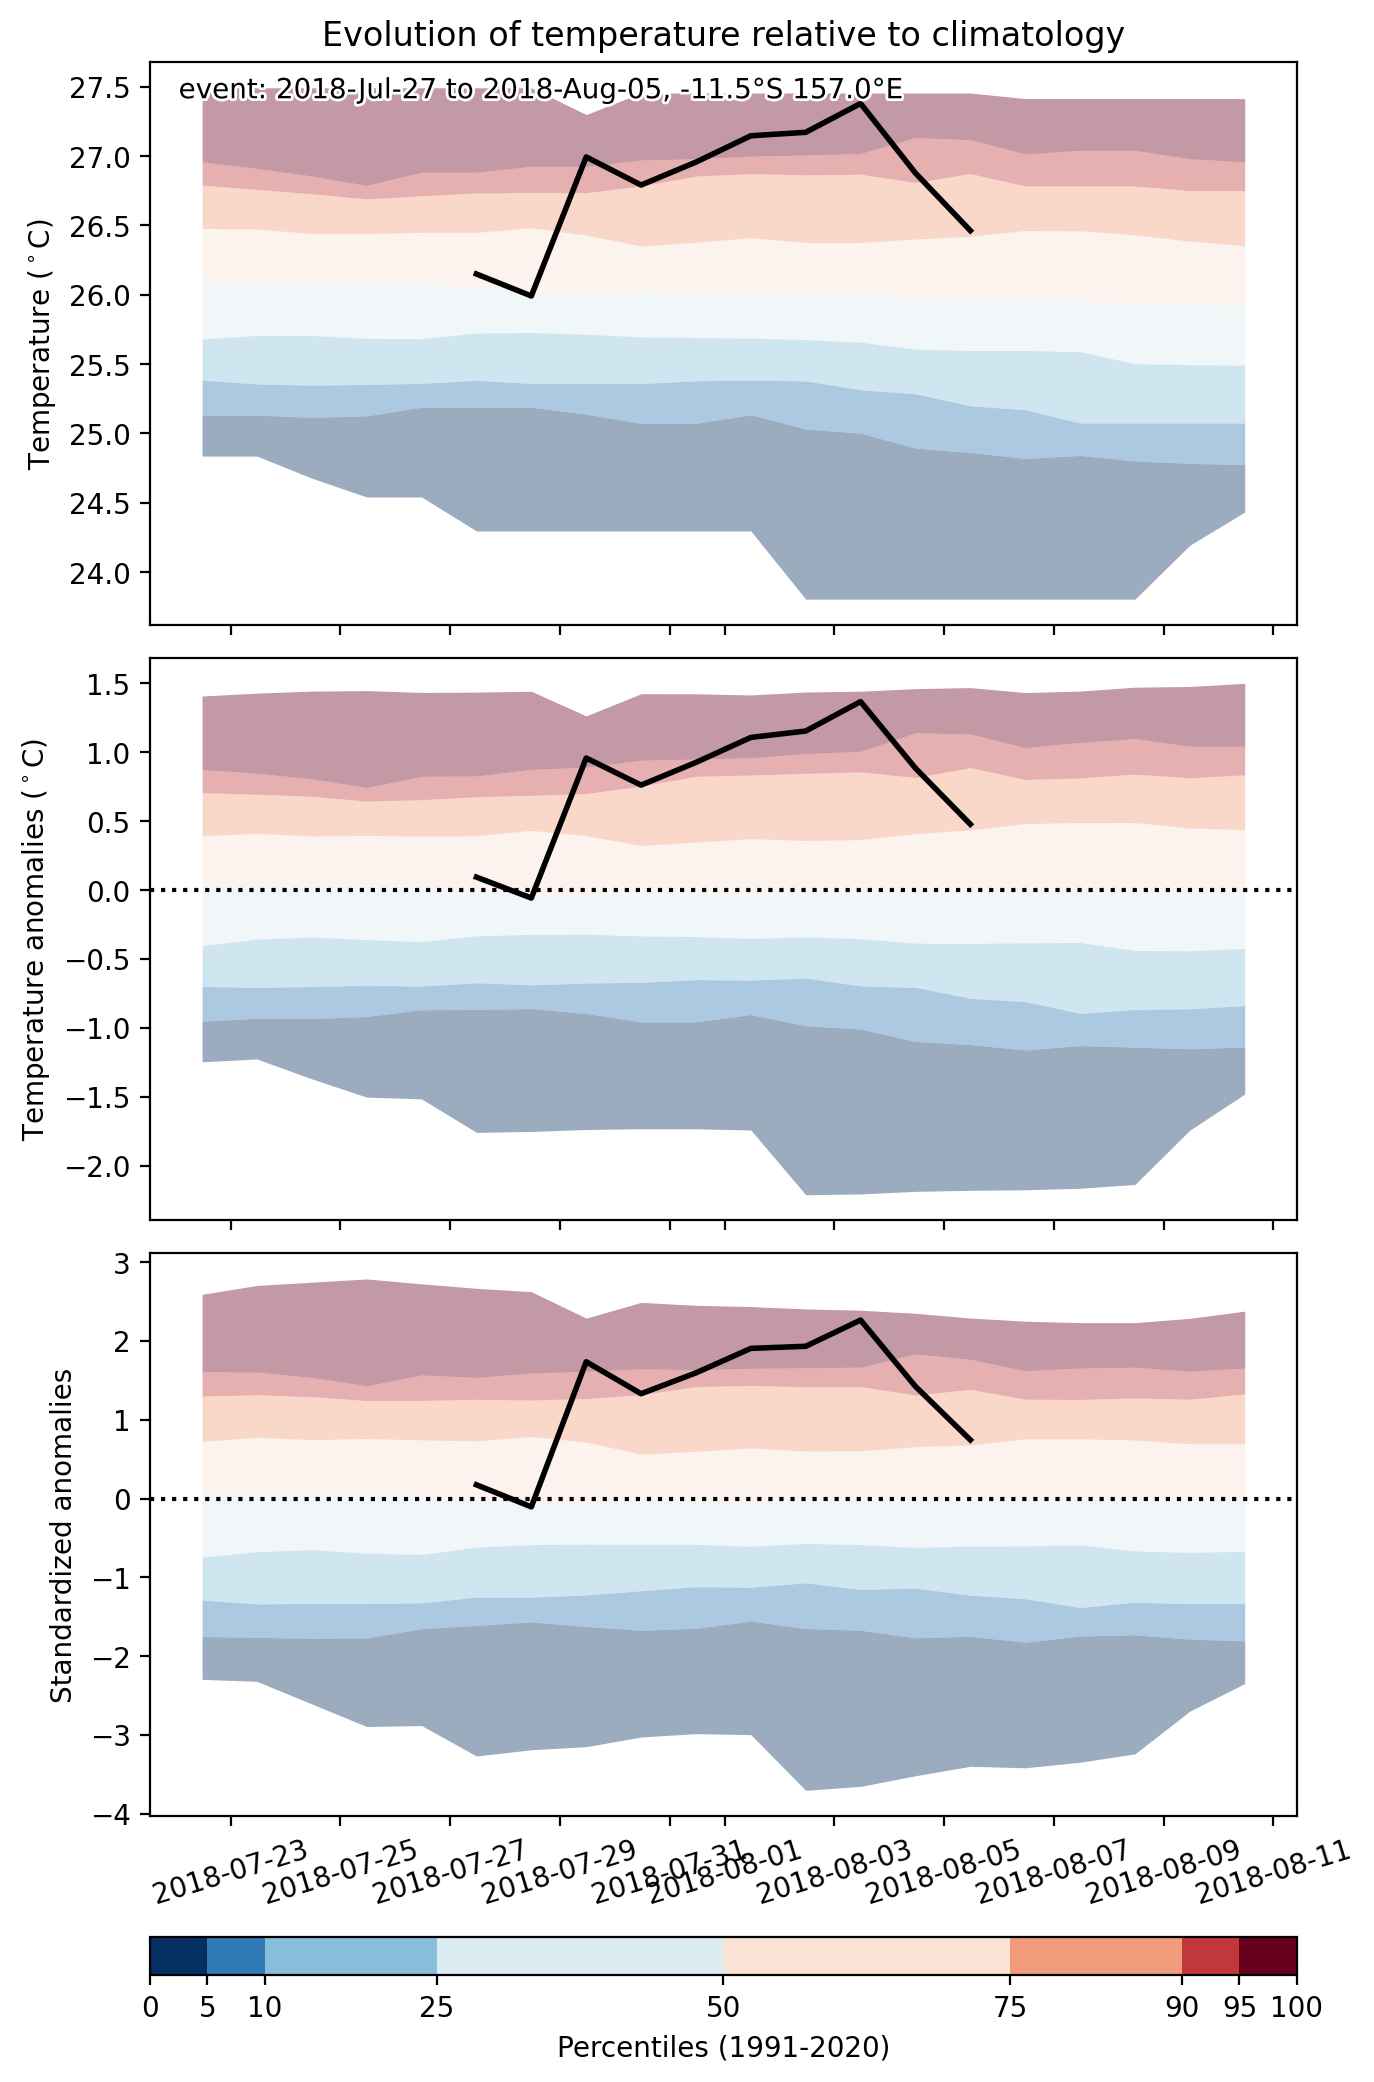
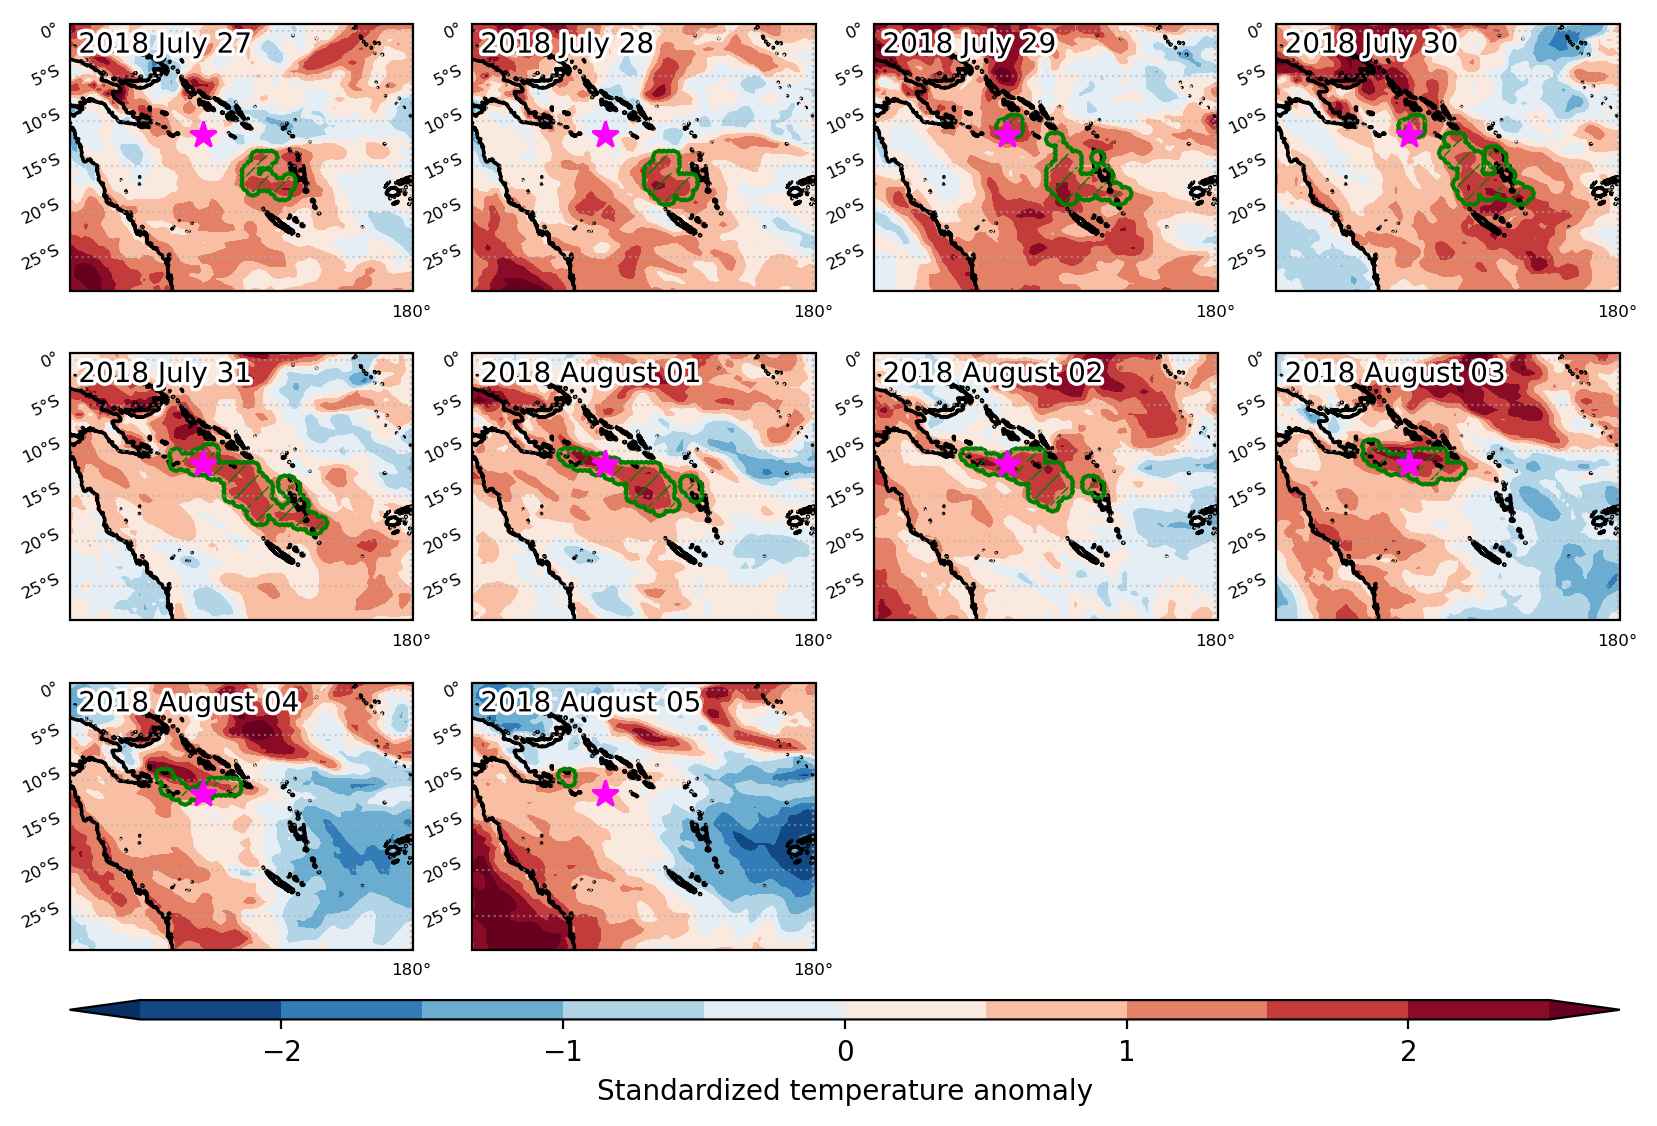
Heat wave occuring from July 27 2018 to August 05 2018 at -11.5°S 157.0°E

Download data: JSON

Event type: Heat wave

Countries affected (identified with ArcGIS Online; provided only for geographical reference):

  • Vanuatu

Duration: 10 days

Time span: July 27 2018 to August 05 2018

Statistics over entire affected area:

  • Mean temperature anomaly: 1.1 °C
  • Mean temperature: 26.3 °C
  • Maximum temperature anomaly: 1.8 °C
  • Maximum temperature: 27.6 °C

Event center: -11.5°S 157.0°E

Area affected: 563016 km$^2$


Fig. 1: Map of most extreme temperature anomalies (standardized) experienced during the event. The purple star indicates the center of the extreme event. Green hatching illustrates all areas under the effect of extremes at some time during the event.


Fig. 2: Evolution of temperature at the center of the event. The climatological percentile distribution is illustrated with color shadings.


Fig. 3: Maps illustrating the evolution of standardized temperature anomalies during the event.

Event ID: Heat_wave_2018-Jul-27_to_2018-Aug-05_157.0_-11.5

Heat wave occuring from July 27 2018 to July 29 2018 at -14.5°S 134.5°E

Download data: JSON

Event type: Heat wave

Countries affected (identified with ArcGIS Online; provided only for geographical reference):

  • Australia

Duration: 3 days

Time span: July 27 2018 to July 29 2018

Statistics over entire affected area:

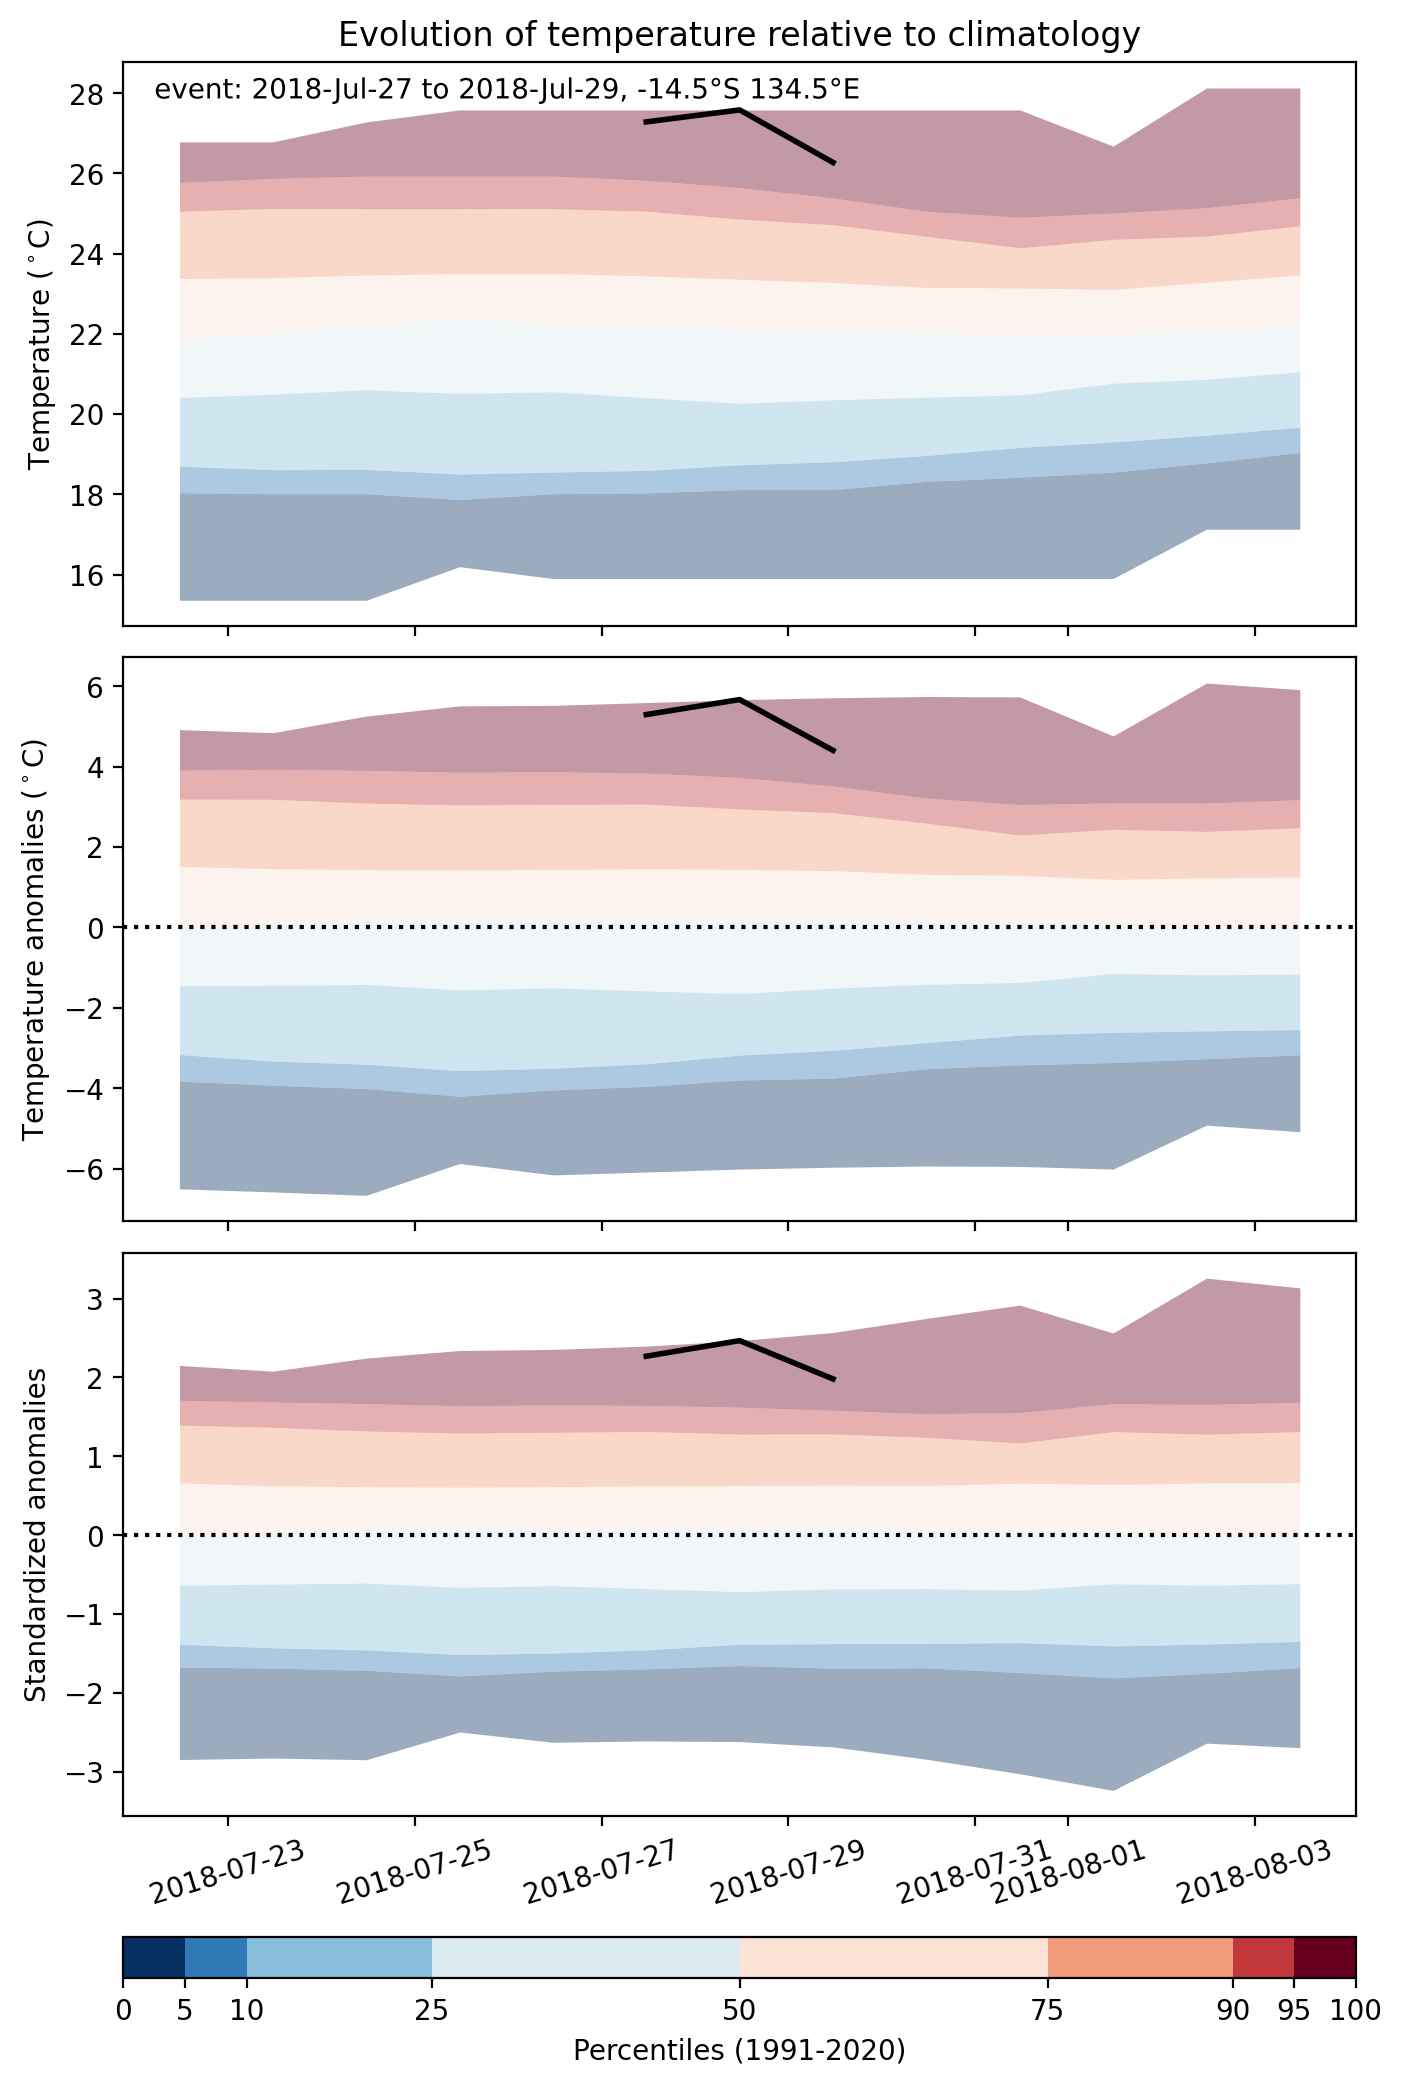
  • Mean temperature anomaly: 3.9 °C
  • Mean temperature: 25.8 °C
  • Maximum temperature anomaly: 5.7 °C
  • Maximum temperature: 27.8 °C

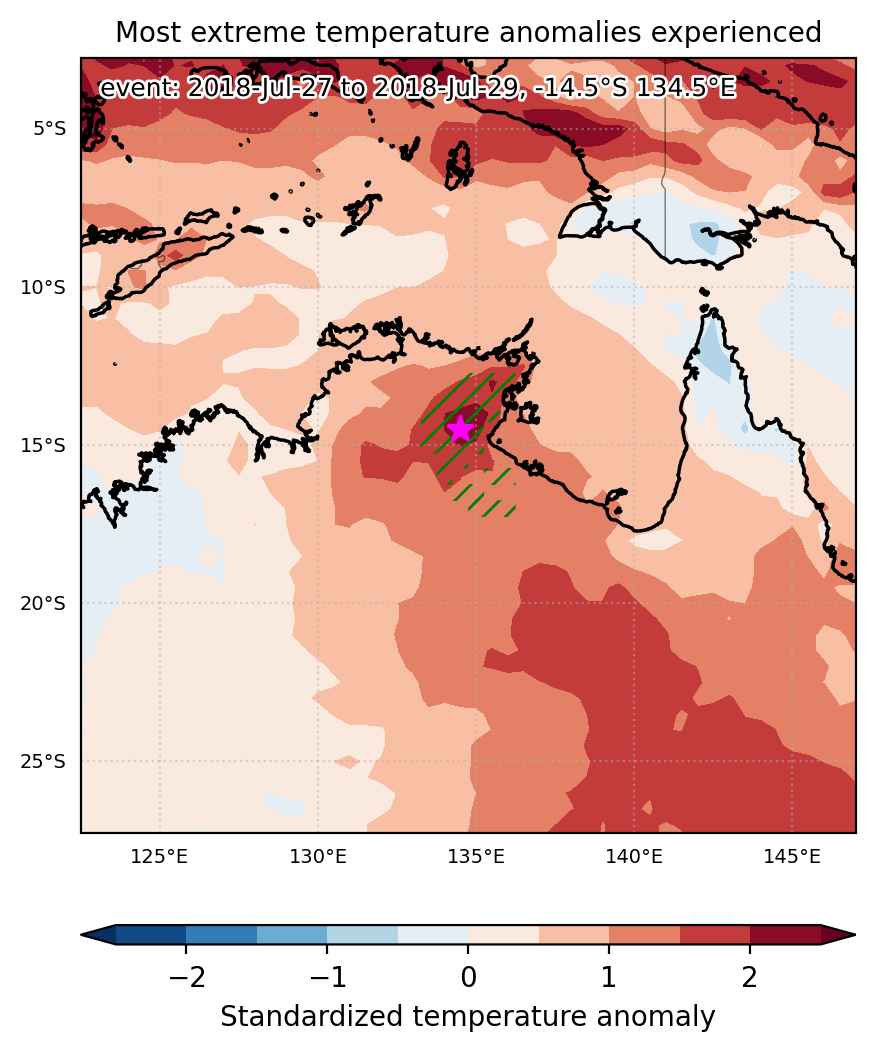
Event center: -14.5°S 134.5°E

Area affected: 92646 km$^2$


Fig. 1: Map of most extreme temperature anomalies (standardized) experienced during the event. The purple star indicates the center of the extreme event. Green hatching illustrates all areas under the effect of extremes at some time during the event.


Fig. 2: Evolution of temperature at the center of the event. The climatological percentile distribution is illustrated with color shadings.


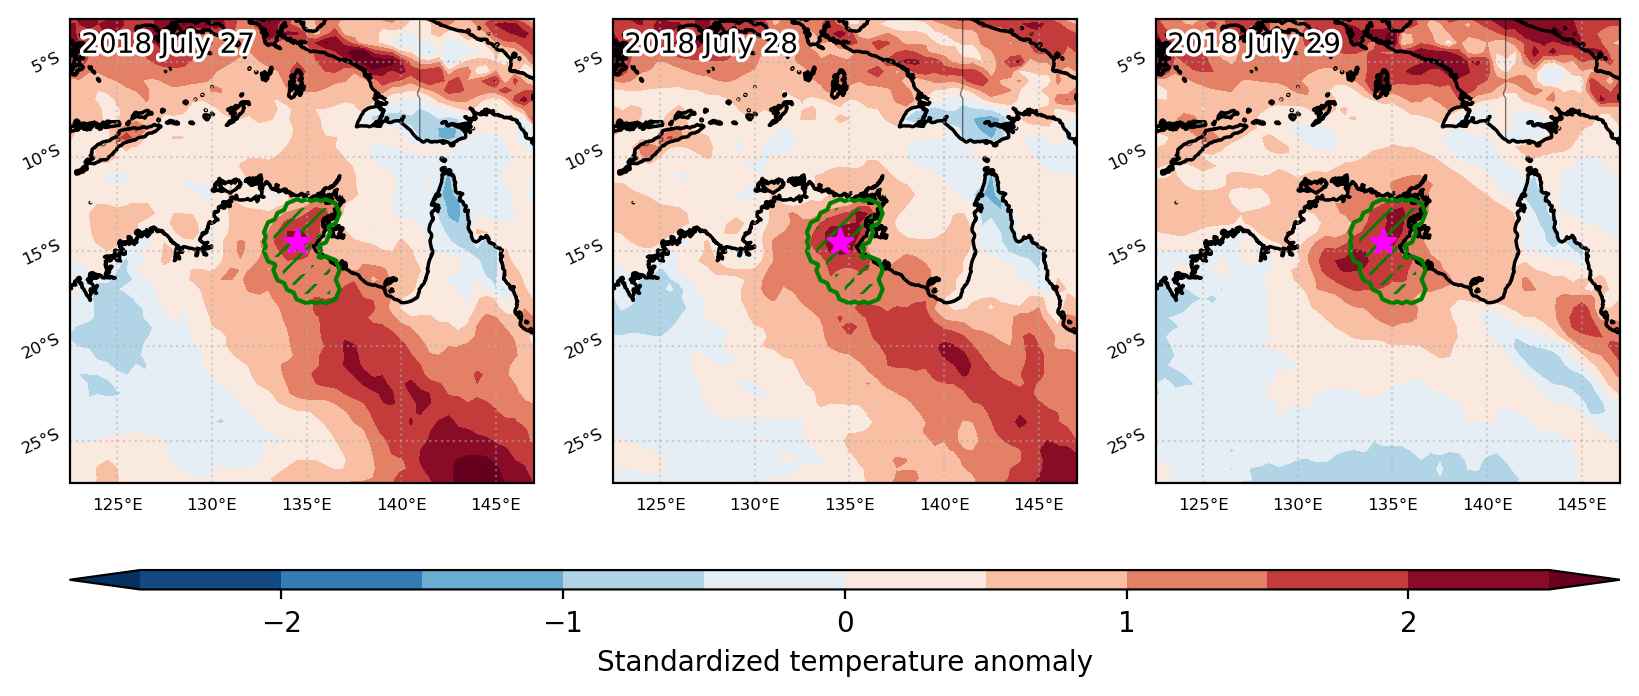
Fig. 3: Maps illustrating the evolution of standardized temperature anomalies during the event.

Event ID: Heat_wave_2018-Jul-27_to_2018-Jul-29_134.5_-14.5

Heat wave occuring from July 27 2018 to July 30 2018 at -23.0°S 310.0°E

Download data: JSON

Event type: Heat wave

Countries affected (identified with ArcGIS Online; provided only for geographical reference):

  • Brazil

Duration: 4 days

Time span: July 27 2018 to July 30 2018

Statistics over entire affected area:

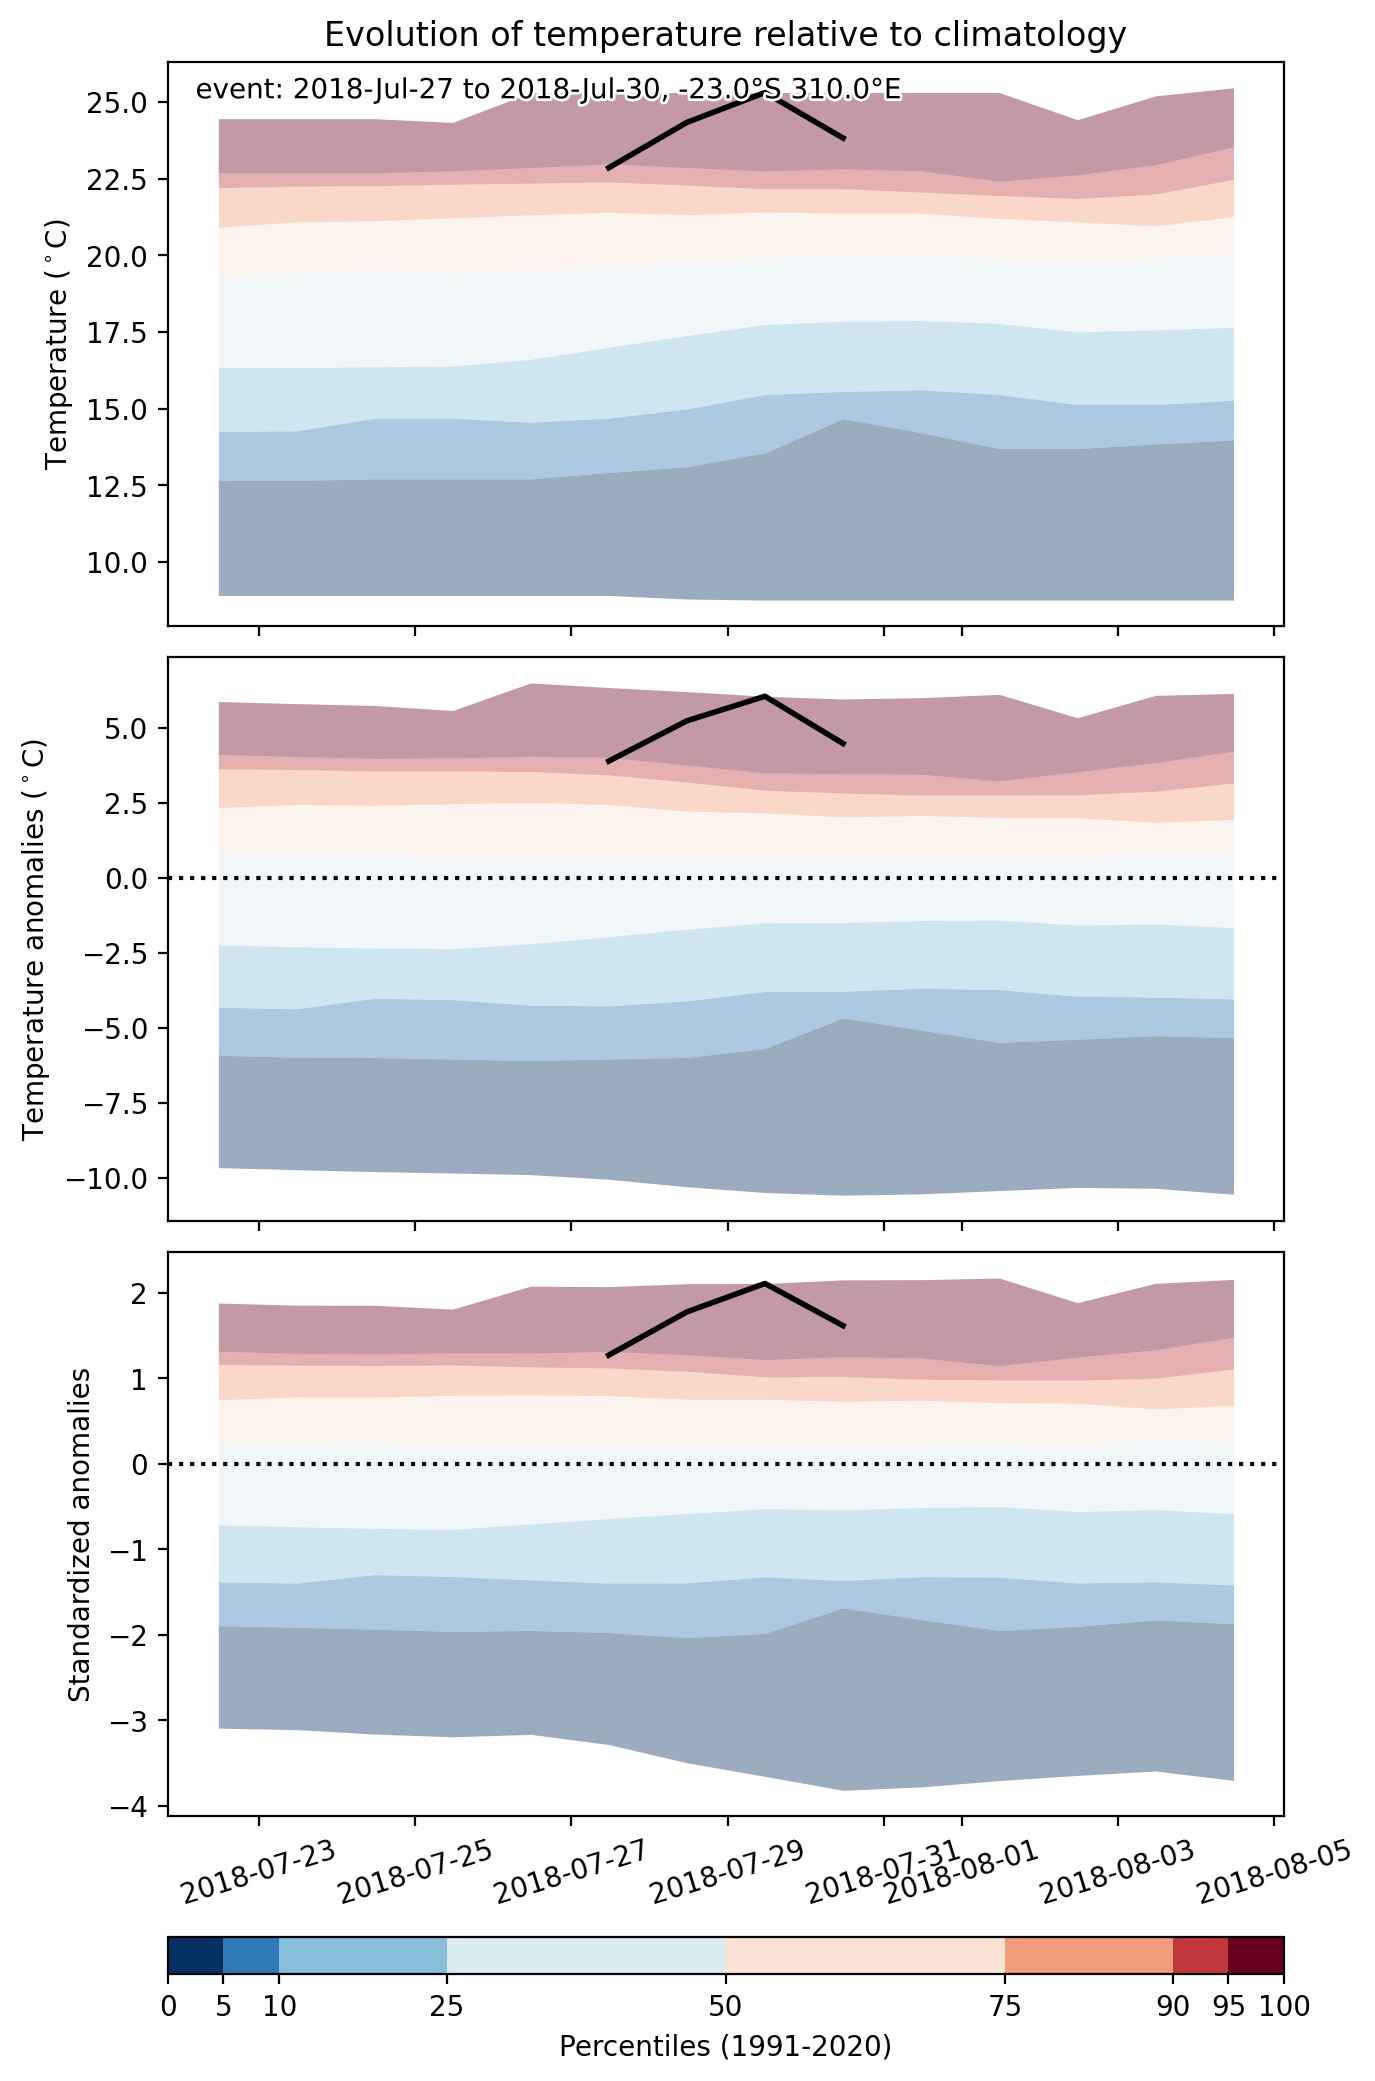
  • Mean temperature anomaly: 4.0 °C
  • Mean temperature: 23.5 °C
  • Maximum temperature anomaly: 6.1 °C
  • Maximum temperature: 26.8 °C

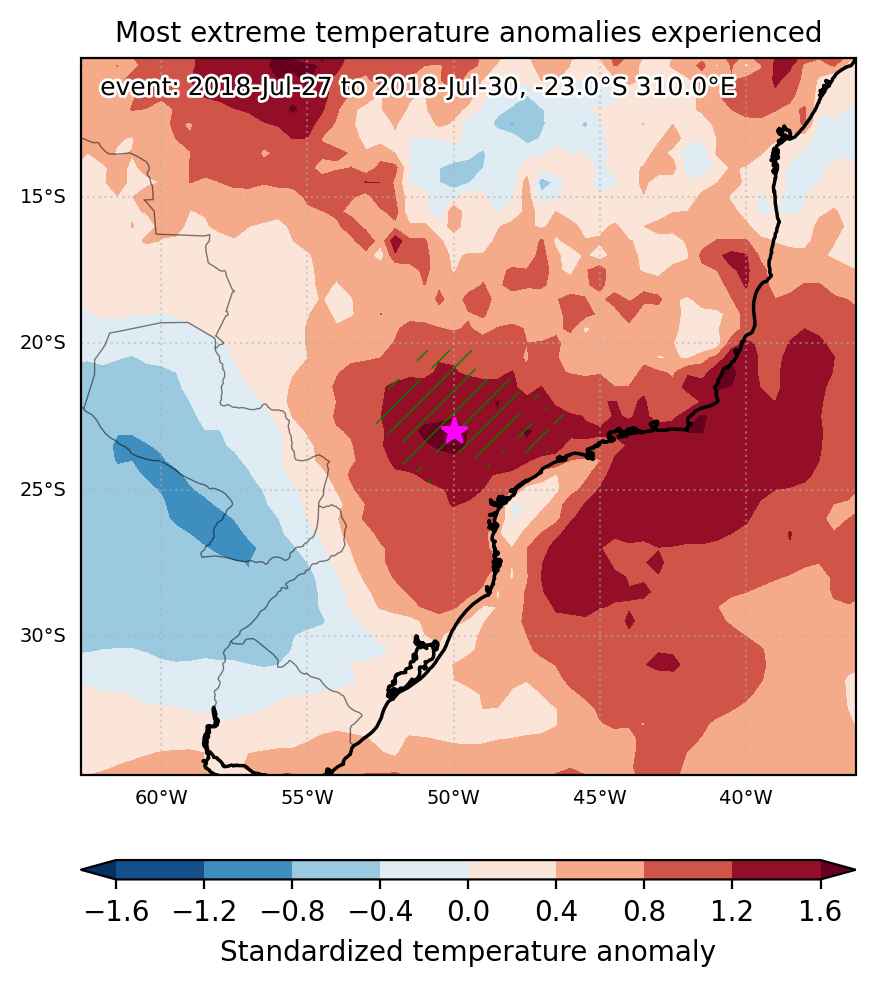
Event center: -23.0°S 310.0°E

Area affected: 171467 km$^2$


Fig. 1: Map of most extreme temperature anomalies (standardized) experienced during the event. The purple star indicates the center of the extreme event. Green hatching illustrates all areas under the effect of extremes at some time during the event.


Fig. 2: Evolution of temperature at the center of the event. The climatological percentile distribution is illustrated with color shadings.


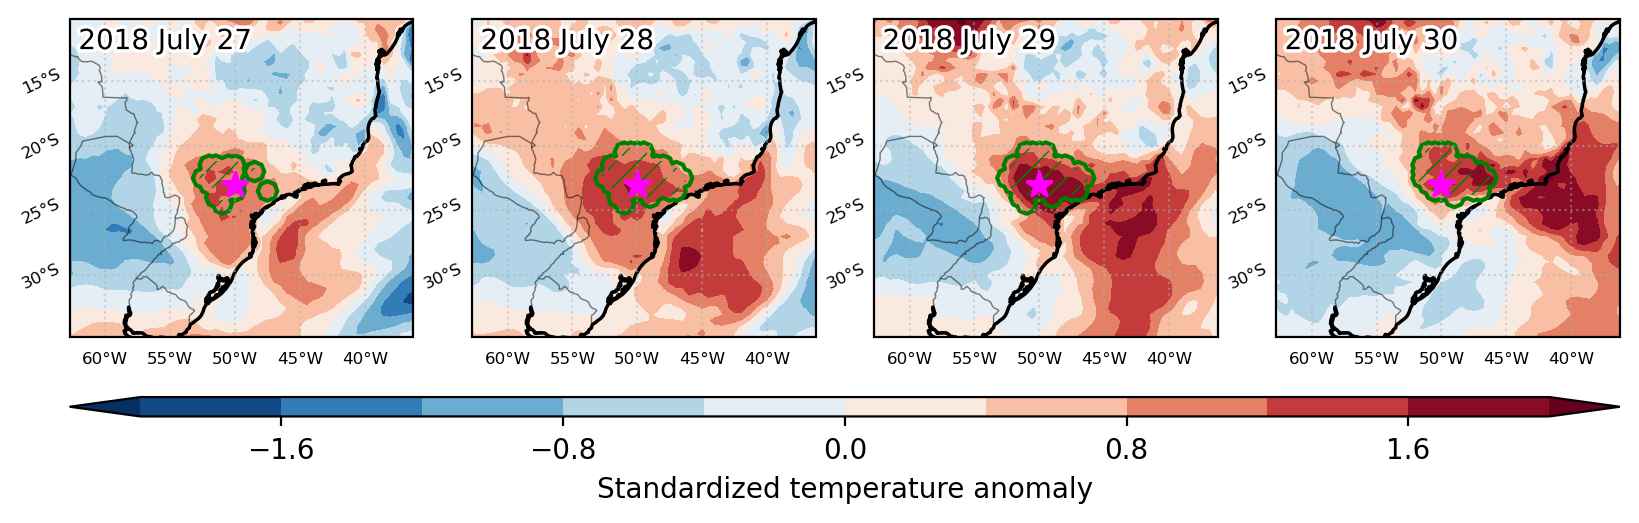
Fig. 3: Maps illustrating the evolution of standardized temperature anomalies during the event.

Event ID: Heat_wave_2018-Jul-27_to_2018-Jul-30_310.0_-23.0

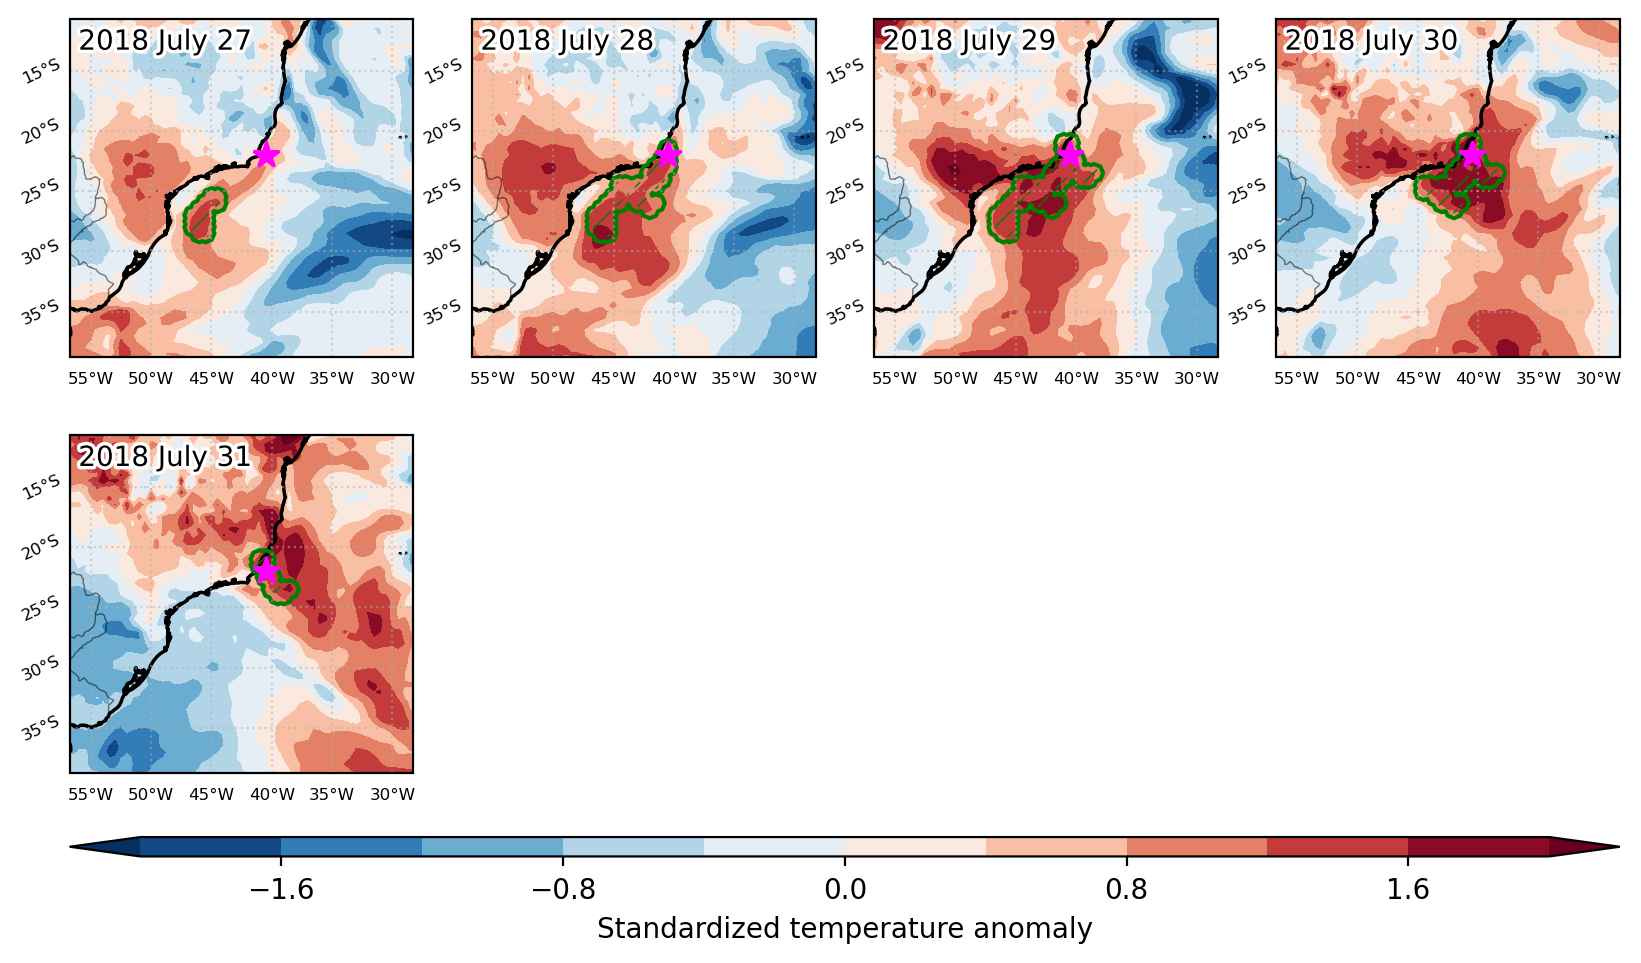
Heat wave occuring from July 27 2018 to July 31 2018 at -22.0°S 319.5°E

Download data: JSON

Event type: Heat wave

Countries affected (identified with ArcGIS Online; provided only for geographical reference):

  • Brazil

Duration: 5 days

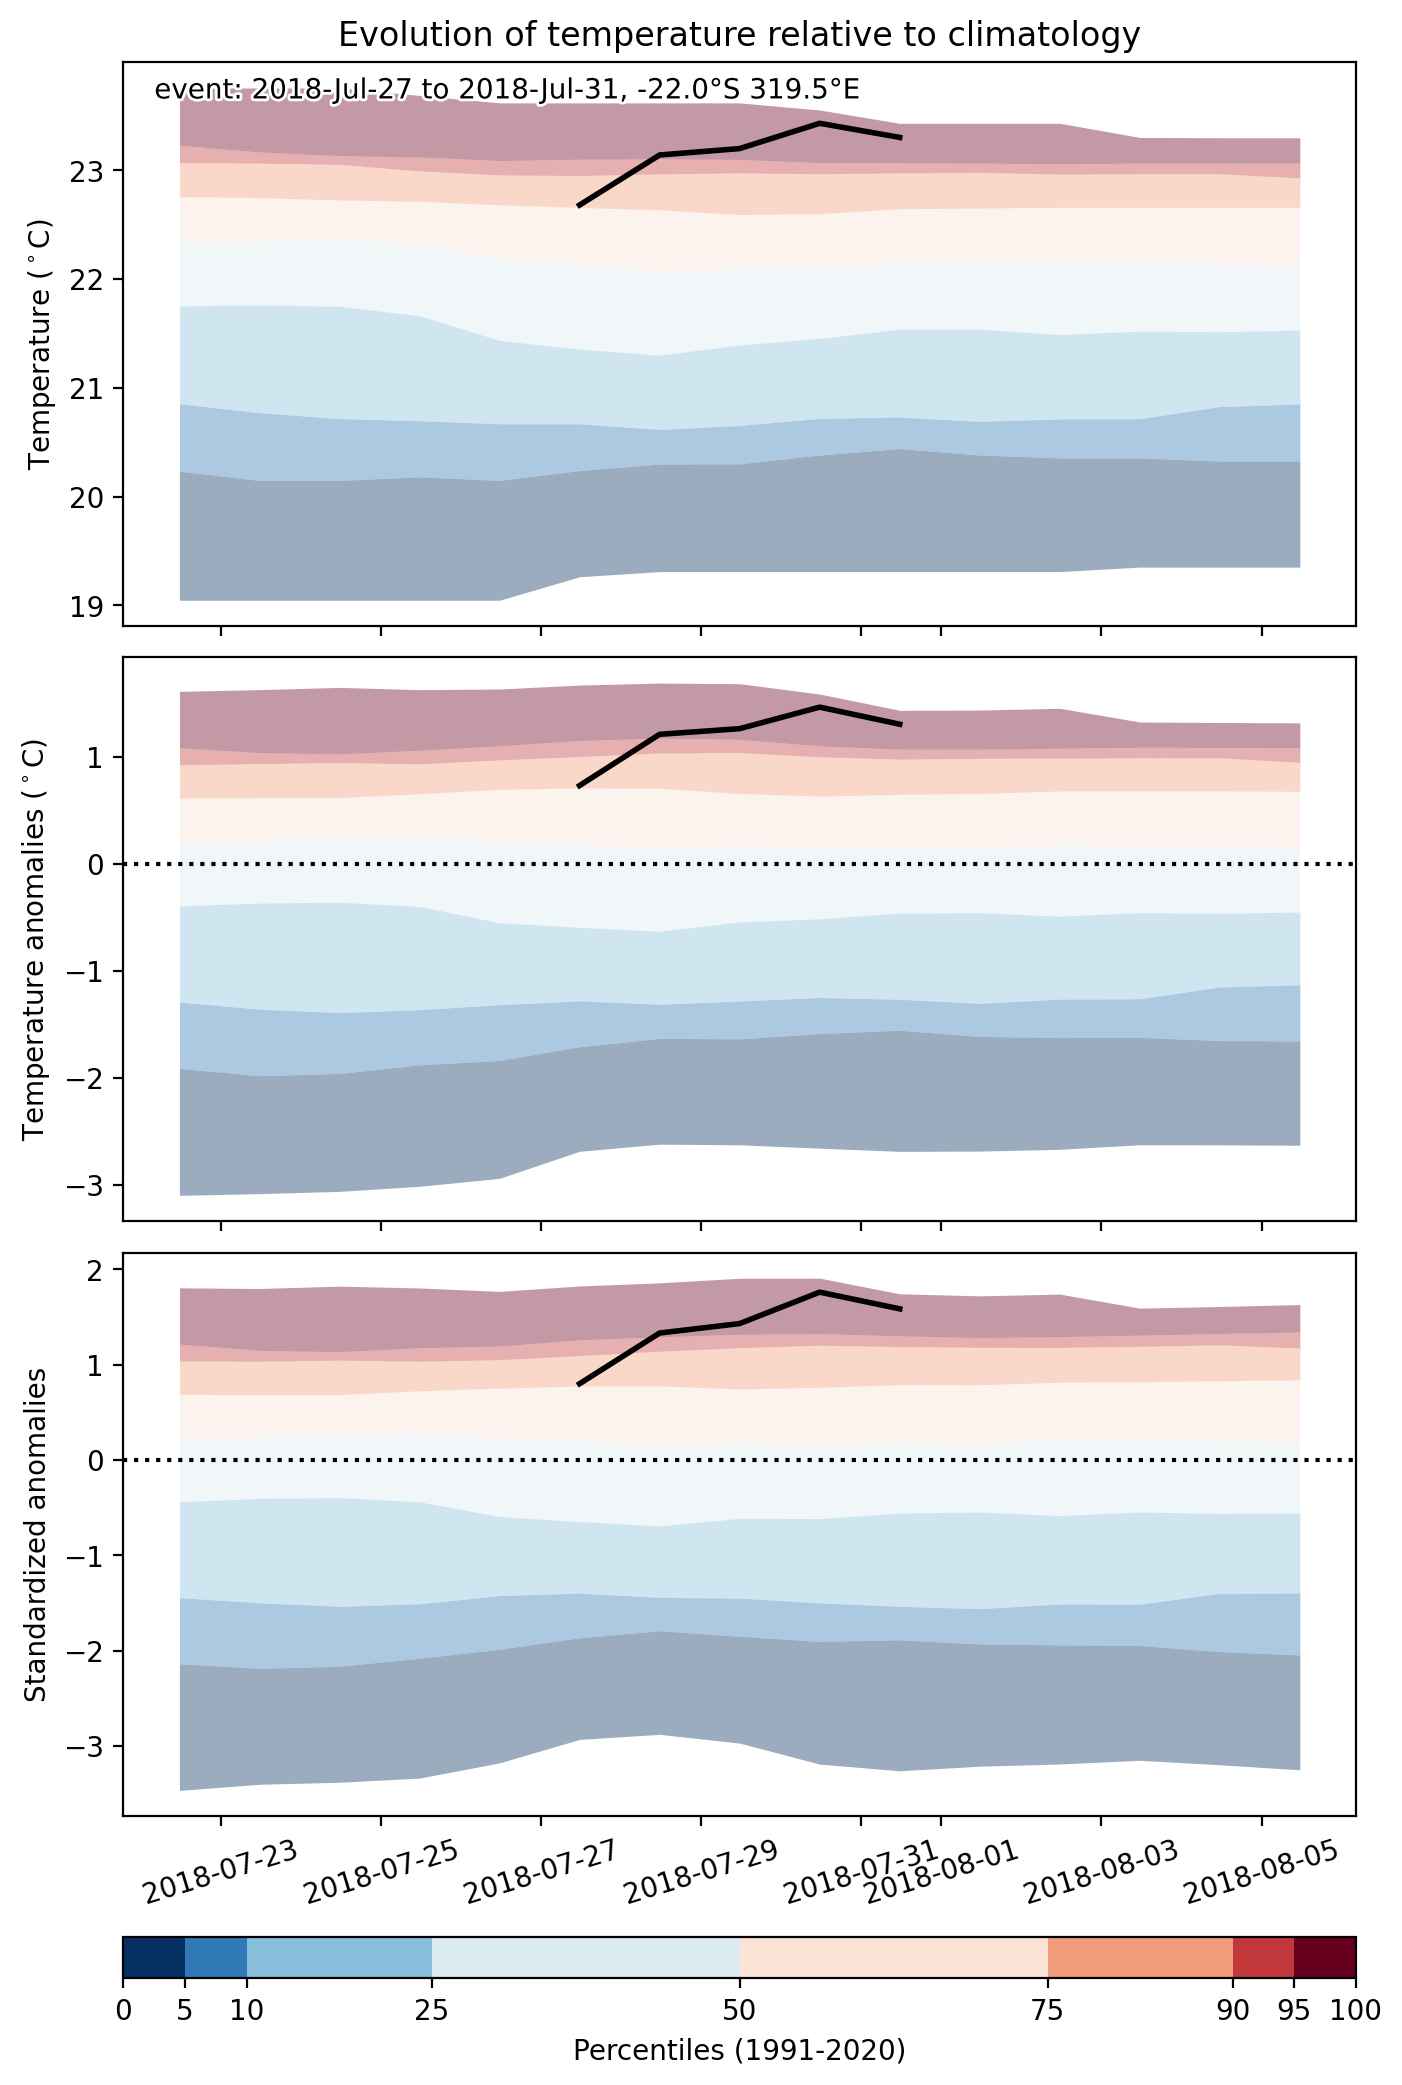
Time span: July 27 2018 to July 31 2018

Statistics over entire affected area:

  • Mean temperature anomaly: 1.8 °C
  • Mean temperature: 23.0 °C
  • Maximum temperature anomaly: 3.1 °C
  • Maximum temperature: 24.0 °C

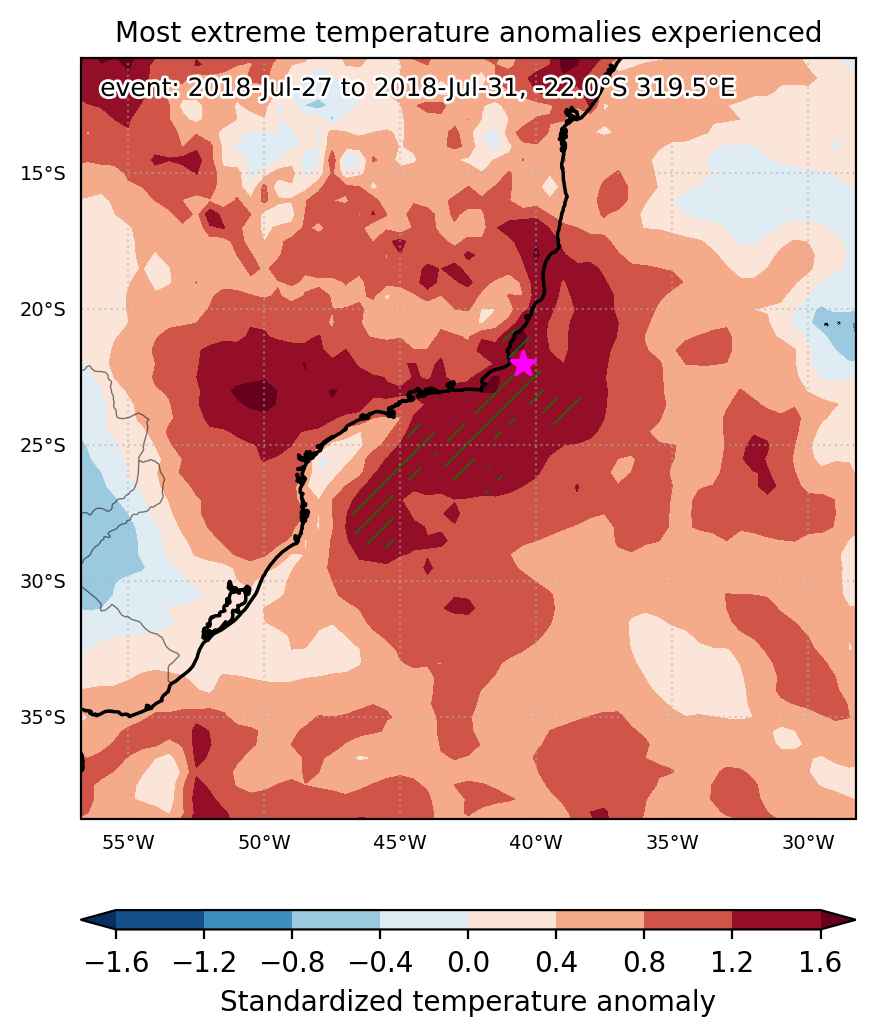
Event center: -22.0°S 319.5°E

Area affected: 165409 km$^2$


Fig. 1: Map of most extreme temperature anomalies (standardized) experienced during the event. The purple star indicates the center of the extreme event. Green hatching illustrates all areas under the effect of extremes at some time during the event.


Fig. 2: Evolution of temperature at the center of the event. The climatological percentile distribution is illustrated with color shadings.


Fig. 3: Maps illustrating the evolution of standardized temperature anomalies during the event.

Event ID: Heat_wave_2018-Jul-27_to_2018-Jul-31_319.5_-22.0

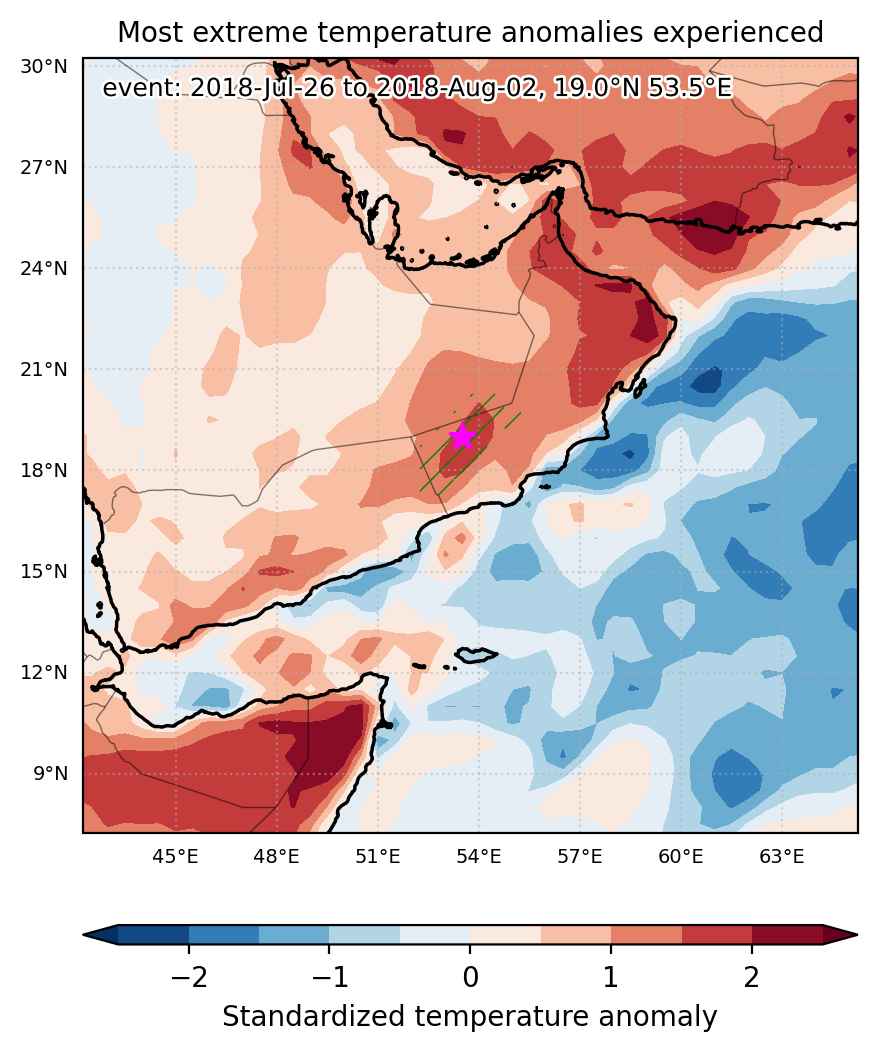
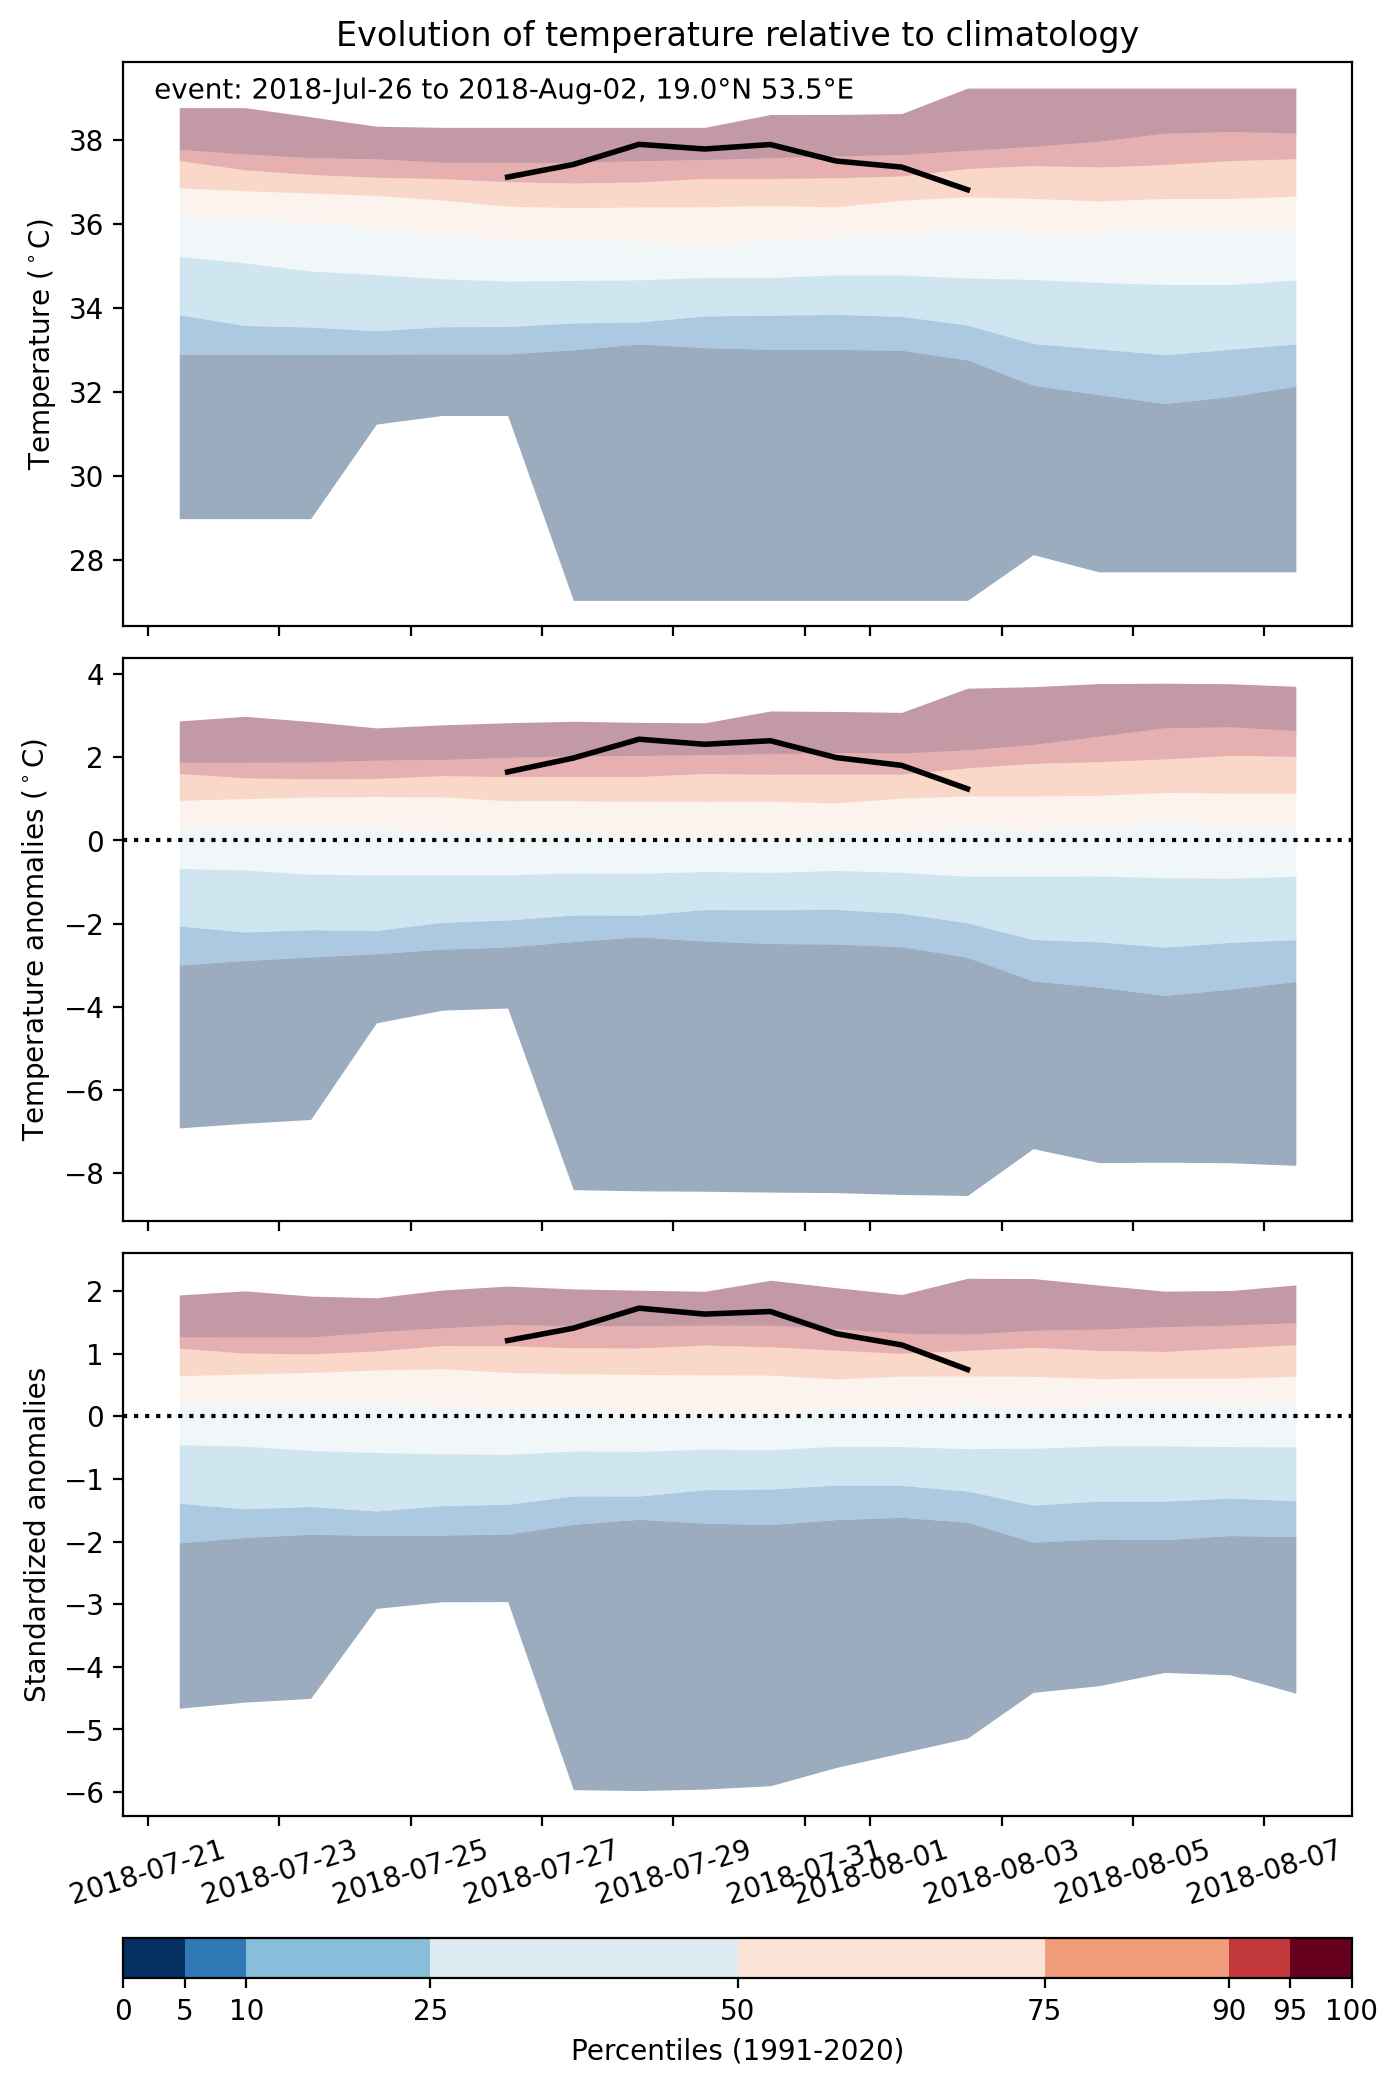
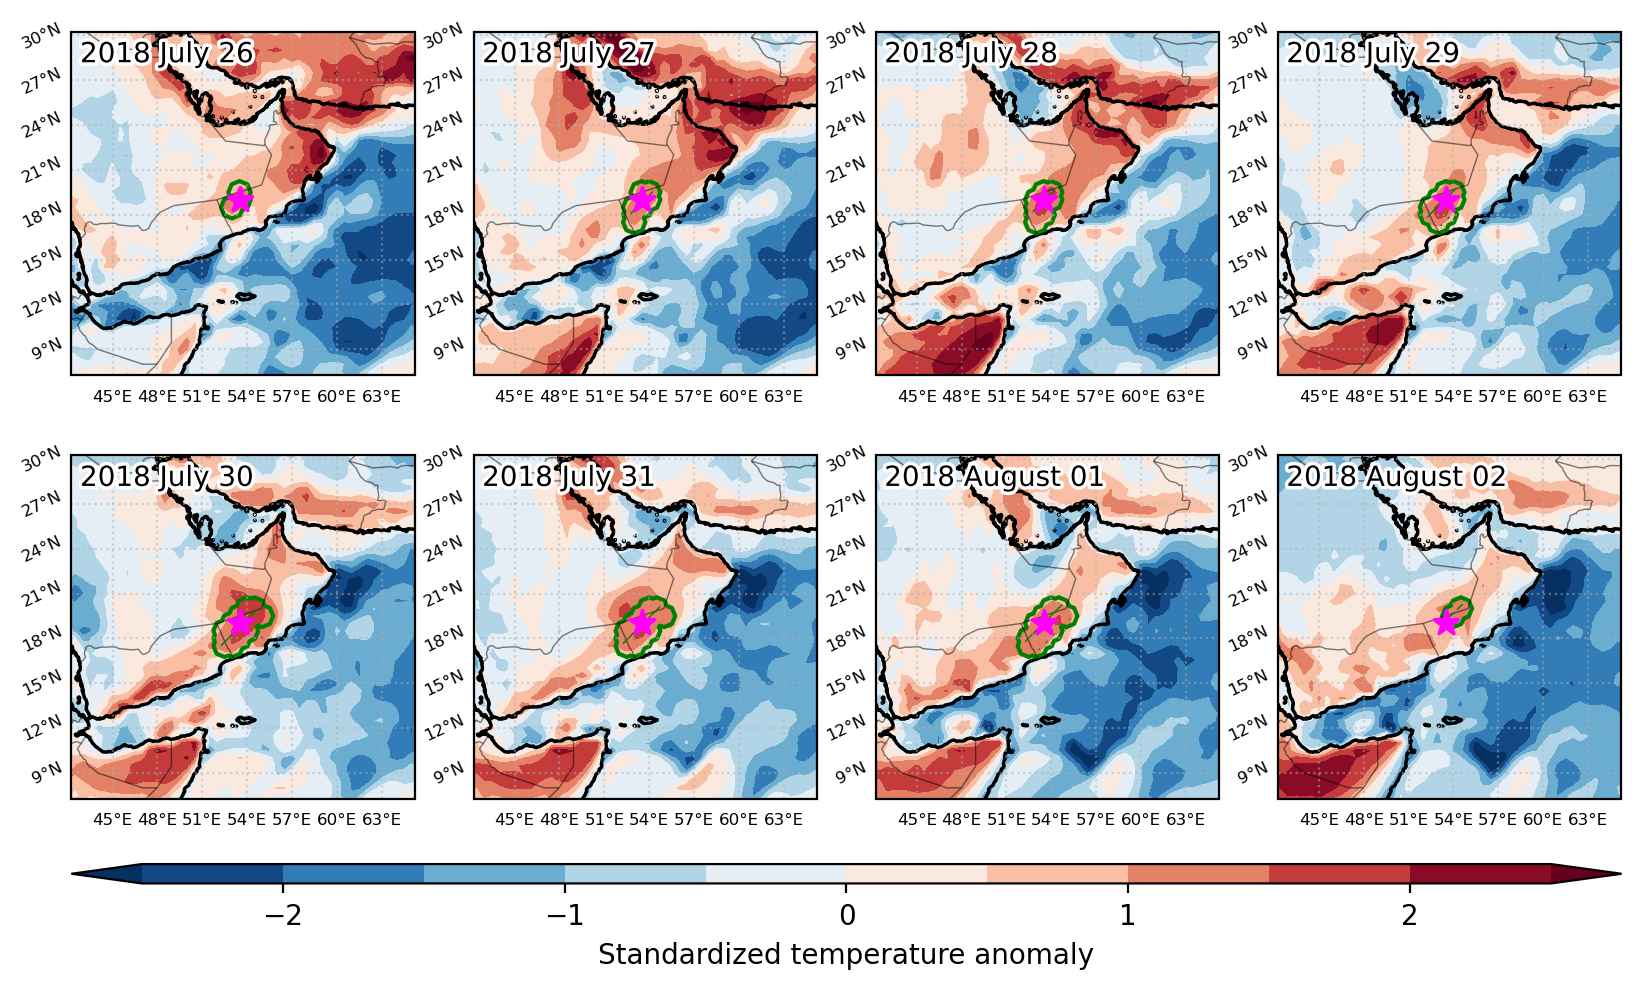
Heat wave occuring from July 26 2018 to August 02 2018 at 19.0°N 53.5°E

Download data: JSON

Event type: Heat wave

Countries affected (identified with ArcGIS Online; provided only for geographical reference):

  • Oman
  • Saudi Arabia
  • Yemen

Duration: 8 days

Time span: July 26 2018 to August 02 2018

Statistics over entire affected area:

  • Mean temperature anomaly: 2.1 °C
  • Mean temperature: 36.9 °C
  • Maximum temperature anomaly: 2.7 °C
  • Maximum temperature: 39.2 °C

Event center: 19.0°N 53.5°E

Area affected: 52673 km$^2$


Fig. 1: Map of most extreme temperature anomalies (standardized) experienced during the event. The purple star indicates the center of the extreme event. Green hatching illustrates all areas under the effect of extremes at some time during the event.


Fig. 2: Evolution of temperature at the center of the event. The climatological percentile distribution is illustrated with color shadings.


Fig. 3: Maps illustrating the evolution of standardized temperature anomalies during the event.

Event ID: Heat_wave_2018-Jul-26_to_2018-Aug-02_53.5_19.0

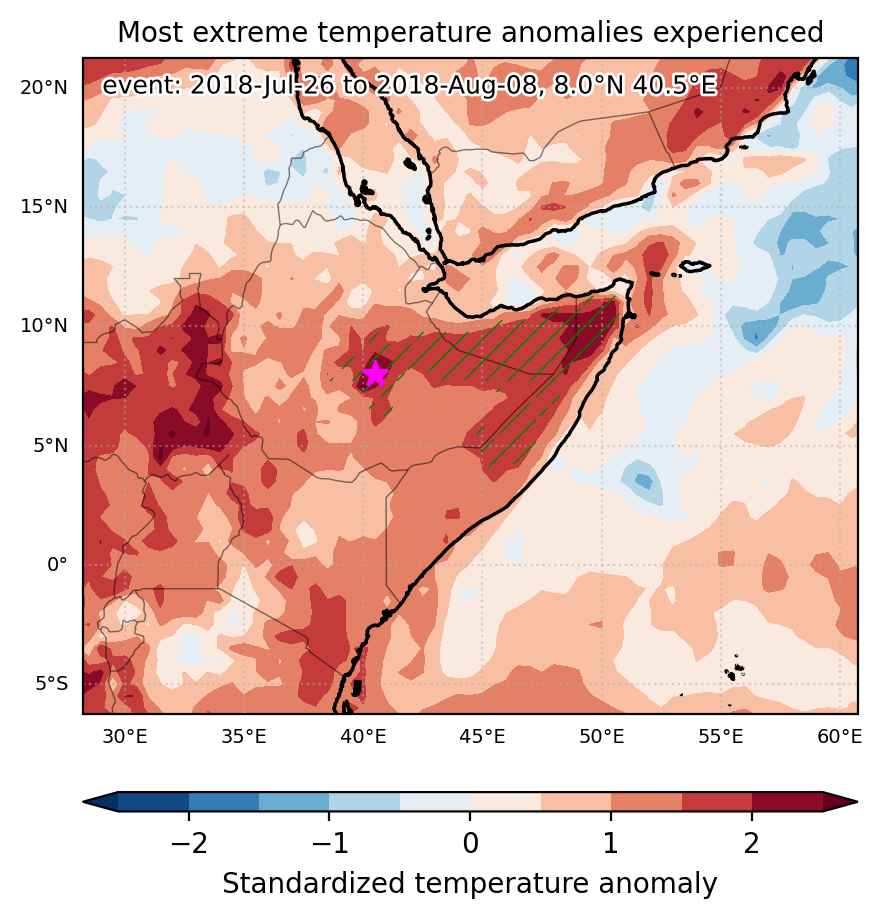
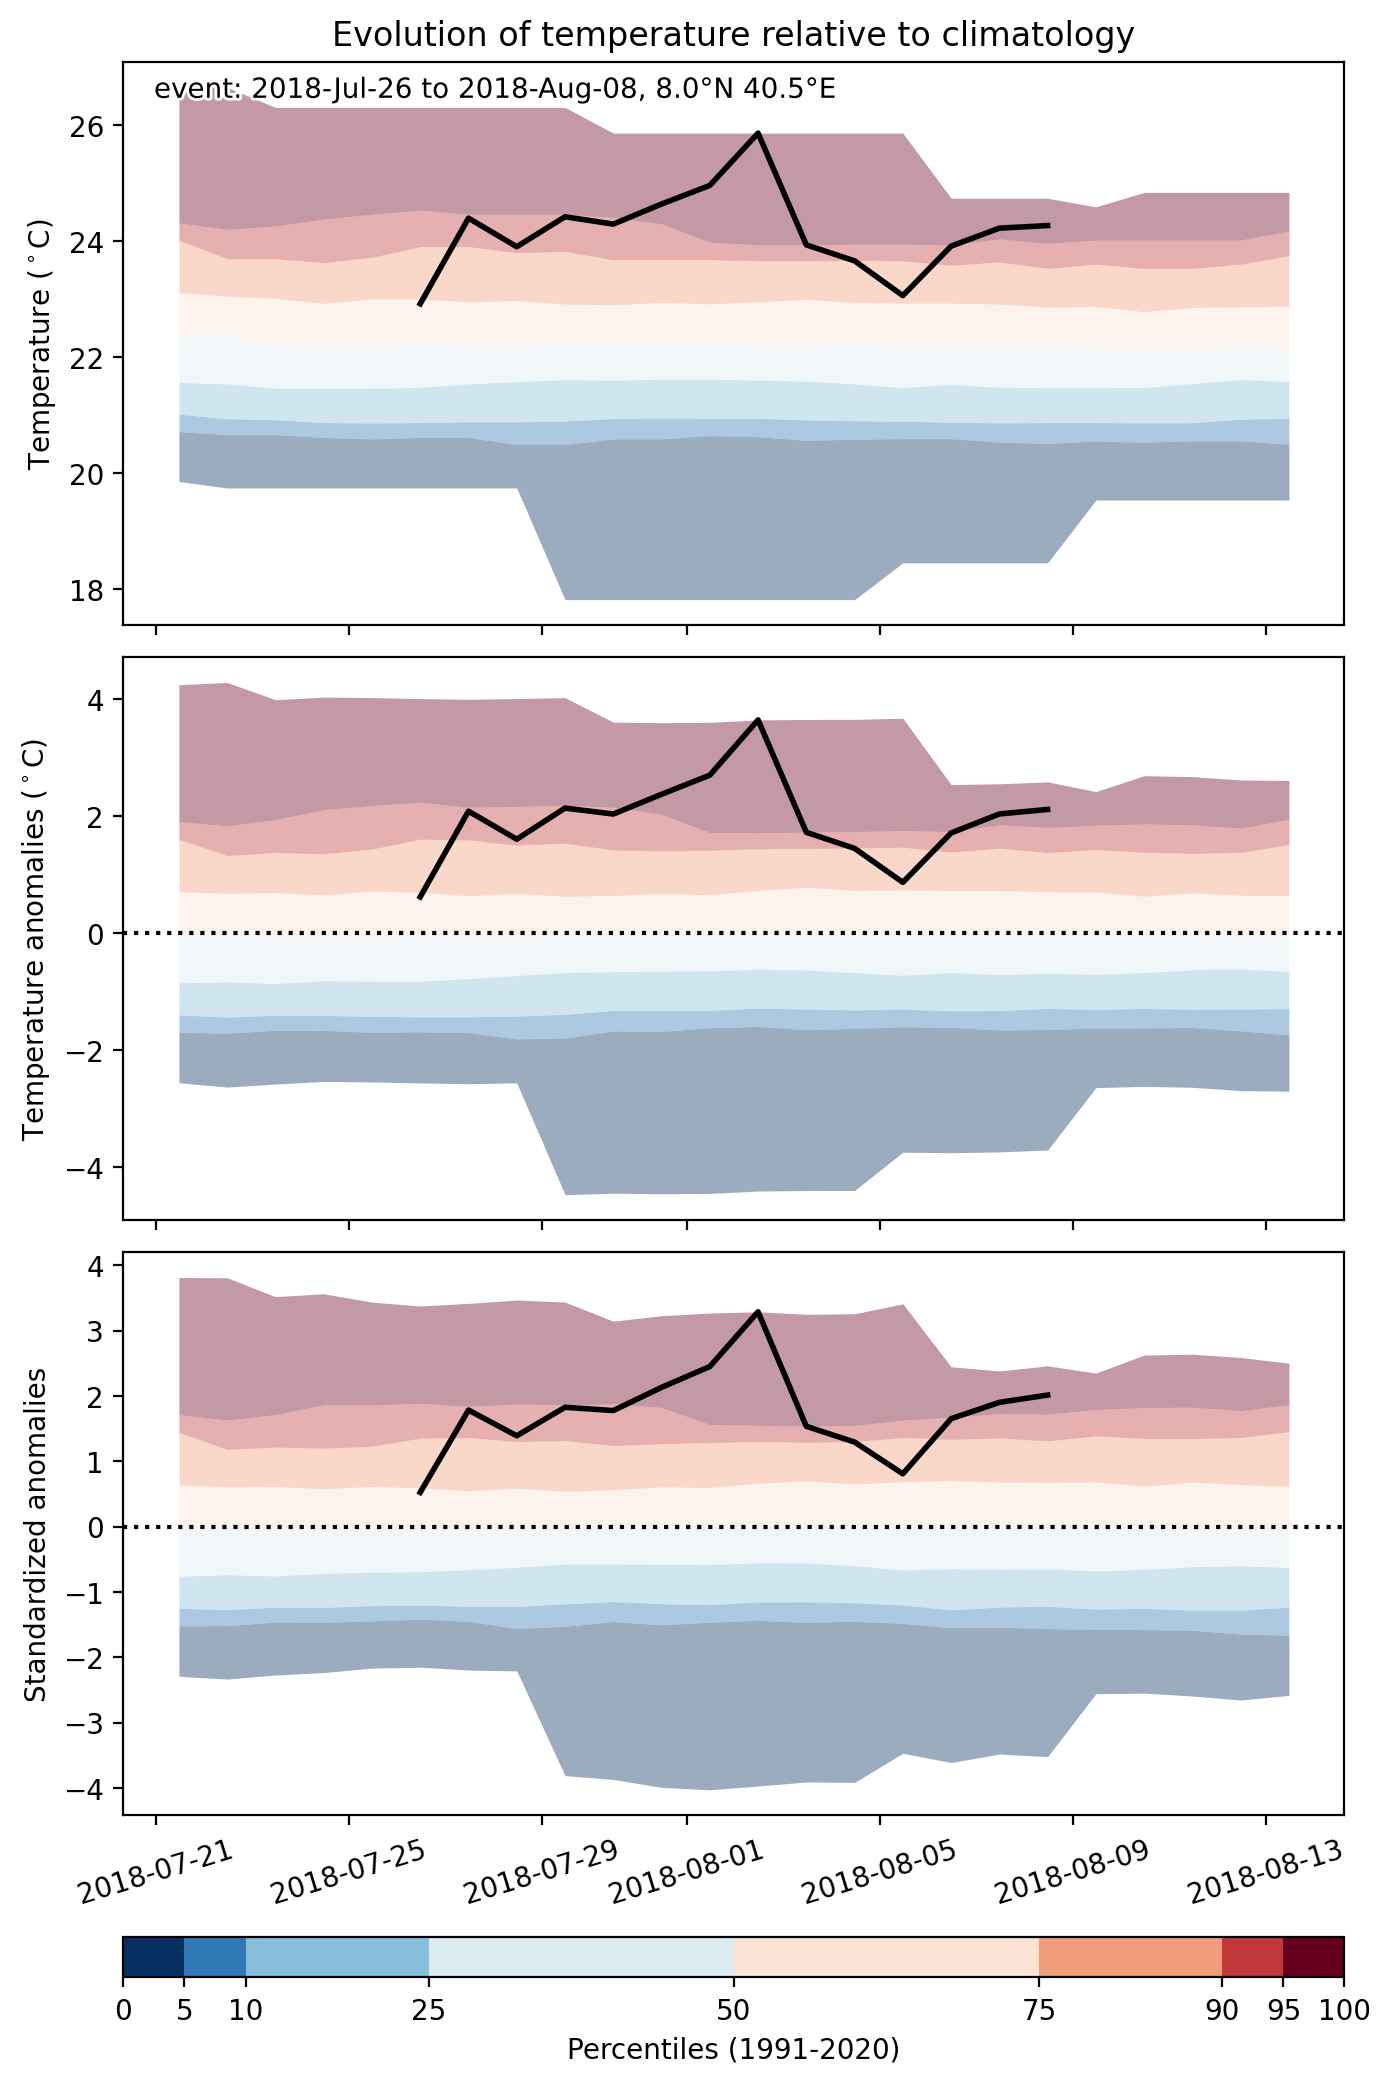
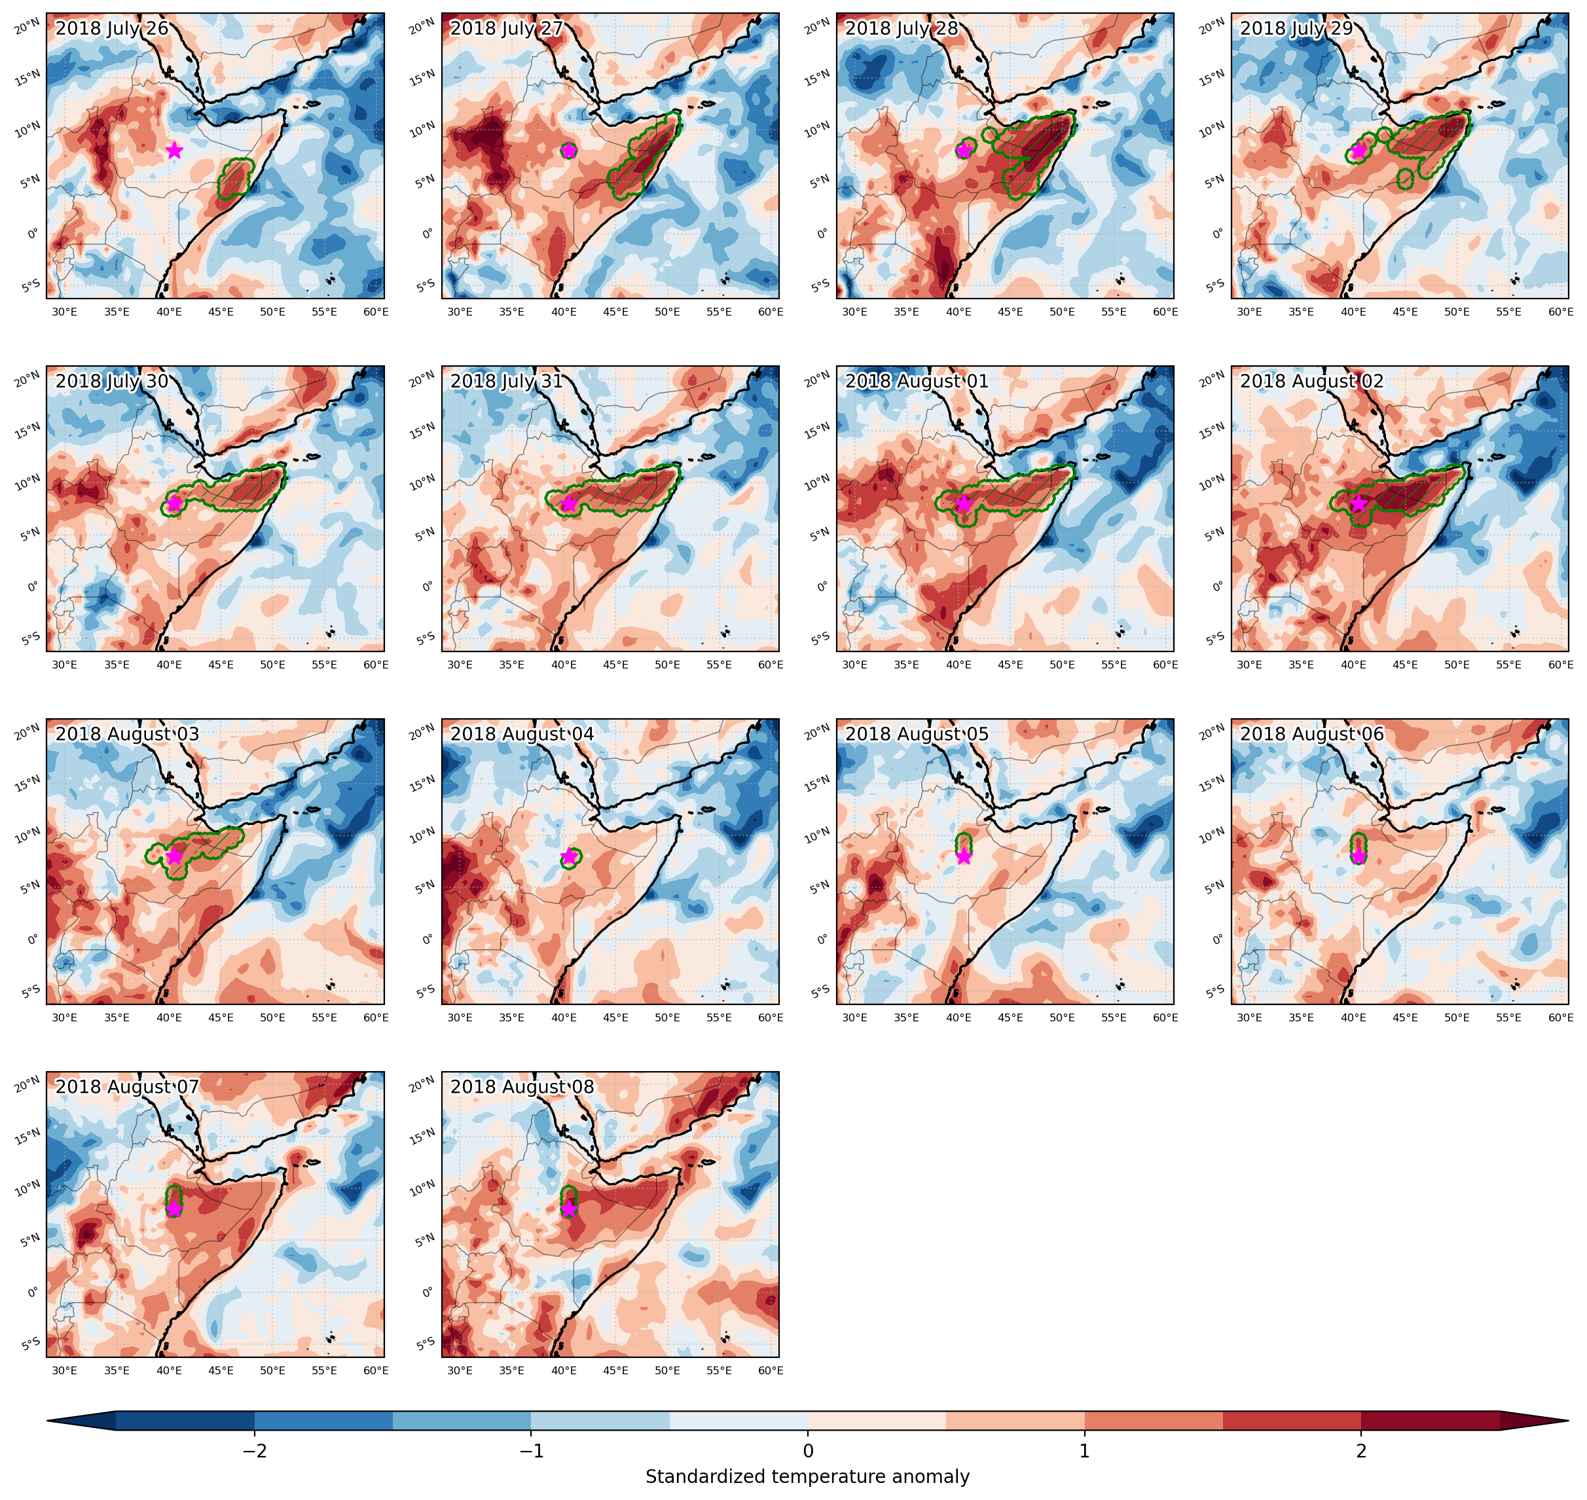
Heat wave occuring from July 26 2018 to August 08 2018 at 8.0°N 40.5°E

Download data: JSON

Event type: Heat wave

Countries affected (identified with ArcGIS Online; provided only for geographical reference):

  • Ethiopia
  • Somalia

Duration: 14 days

Time span: July 26 2018 to August 08 2018

Statistics over entire affected area:

  • Mean temperature anomaly: 1.7 °C
  • Mean temperature: 26.5 °C
  • Maximum temperature anomaly: 3.8 °C
  • Maximum temperature: 33.4 °C

Event center: 8.0°N 40.5°E

Area affected: 385222 km$^2$


Fig. 1: Map of most extreme temperature anomalies (standardized) experienced during the event. The purple star indicates the center of the extreme event. Green hatching illustrates all areas under the effect of extremes at some time during the event.


Fig. 2: Evolution of temperature at the center of the event. The climatological percentile distribution is illustrated with color shadings.


Fig. 3: Maps illustrating the evolution of standardized temperature anomalies during the event.

Event ID: Heat_wave_2018-Jul-26_to_2018-Aug-08_40.5_8.0

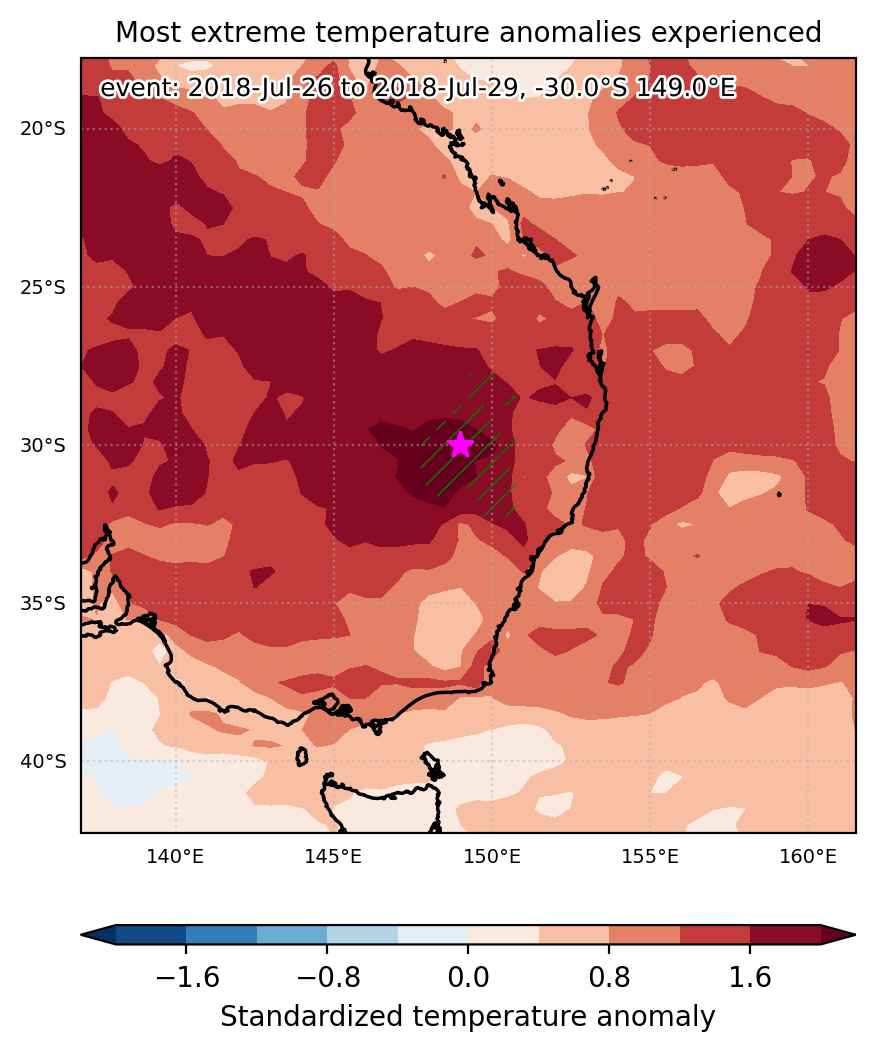
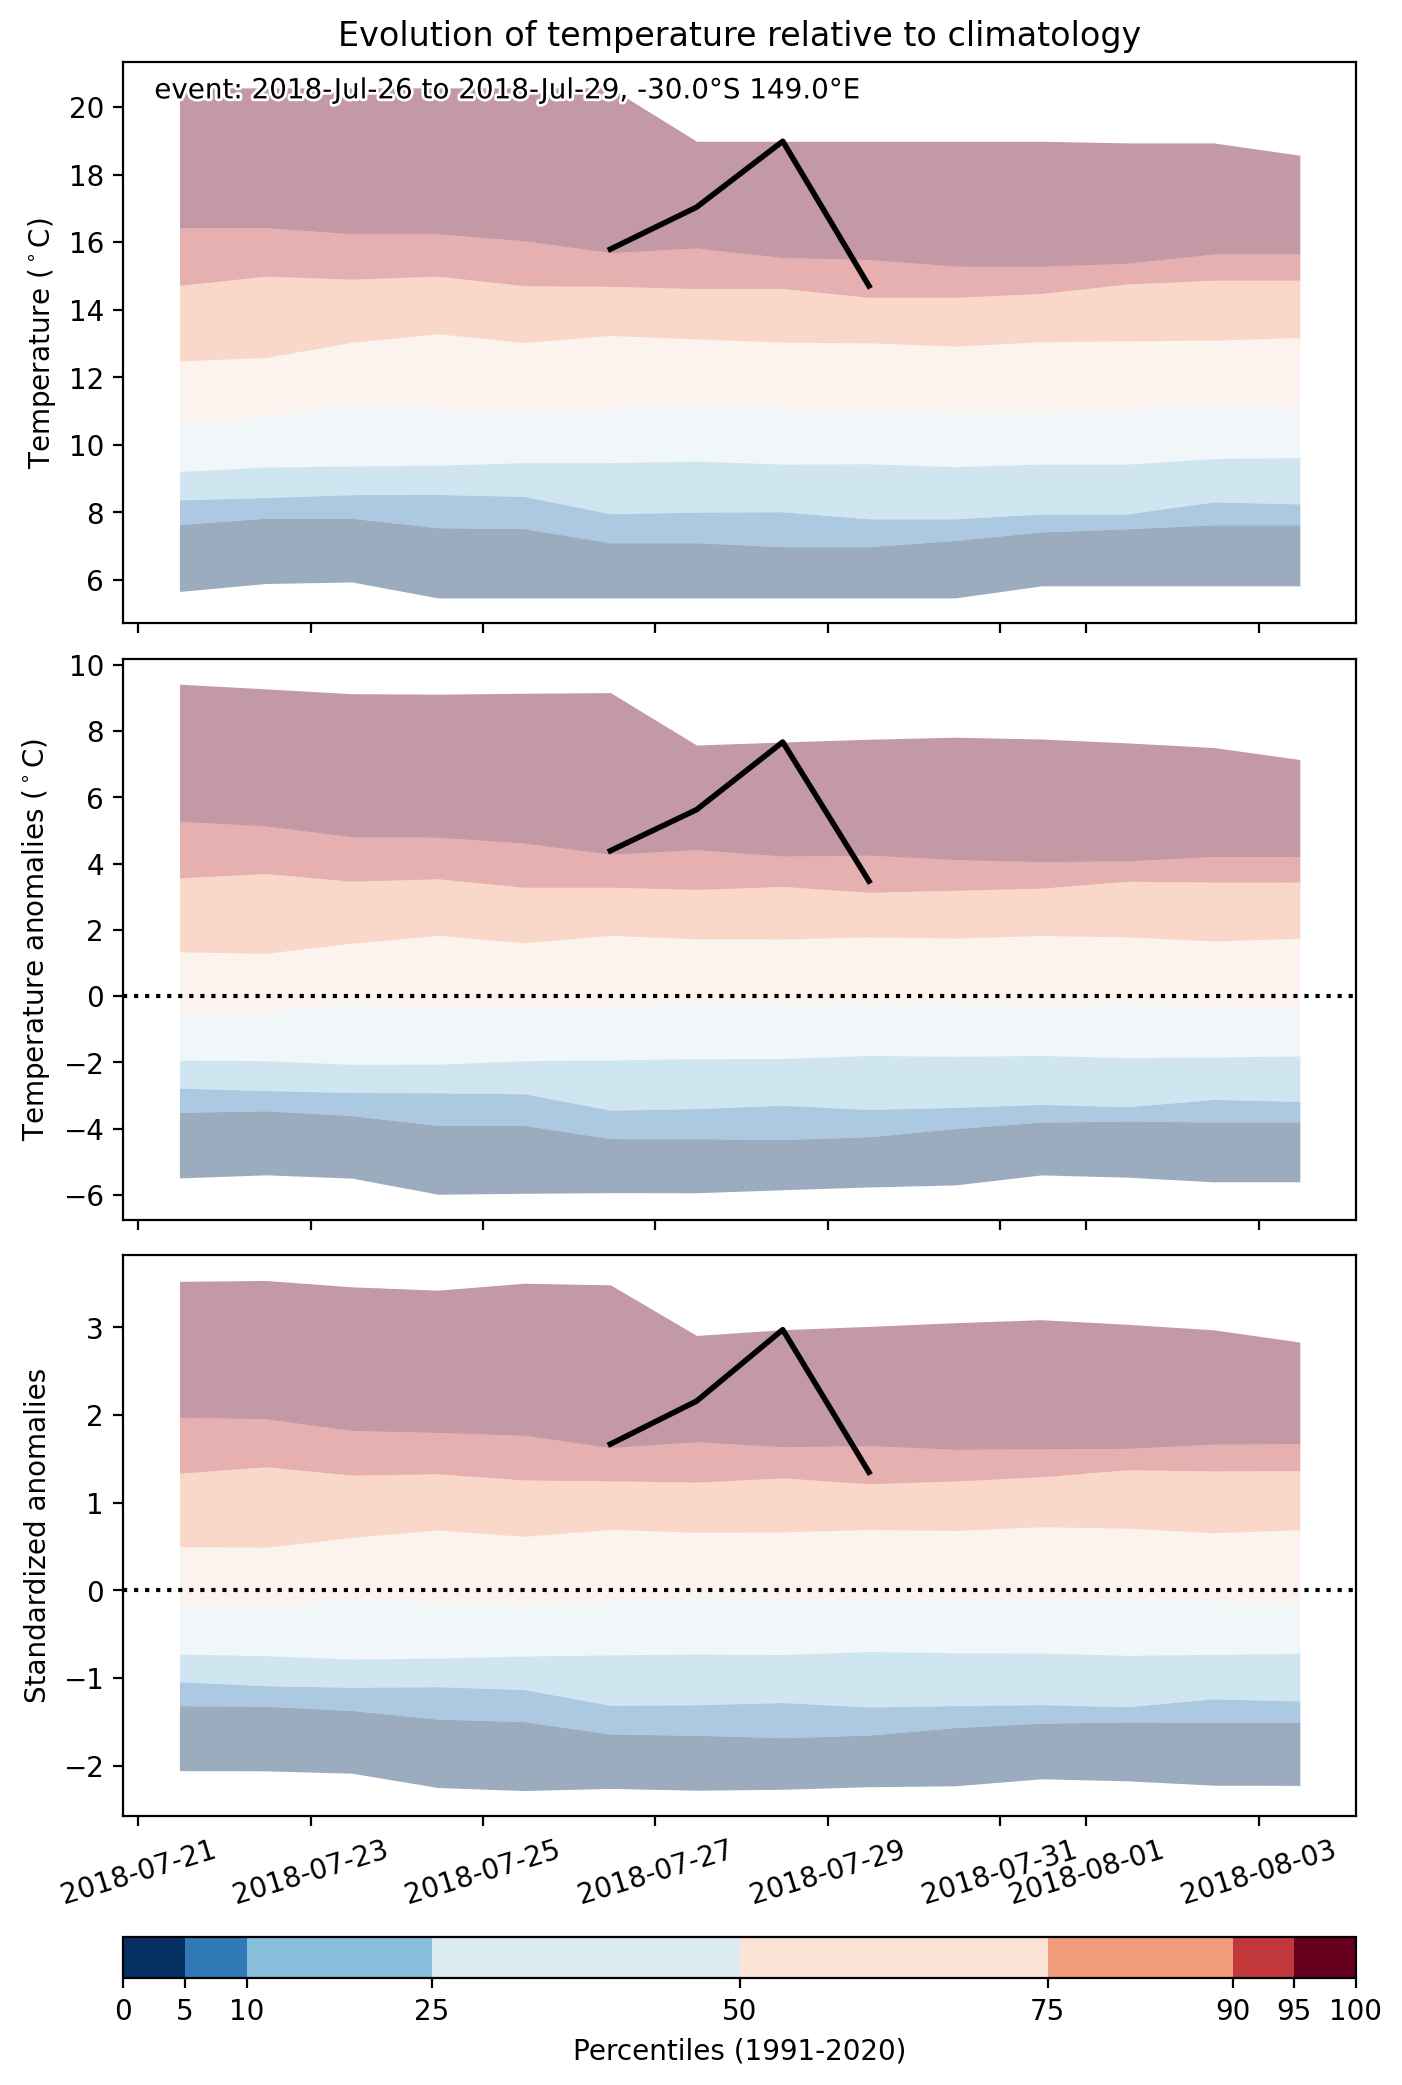
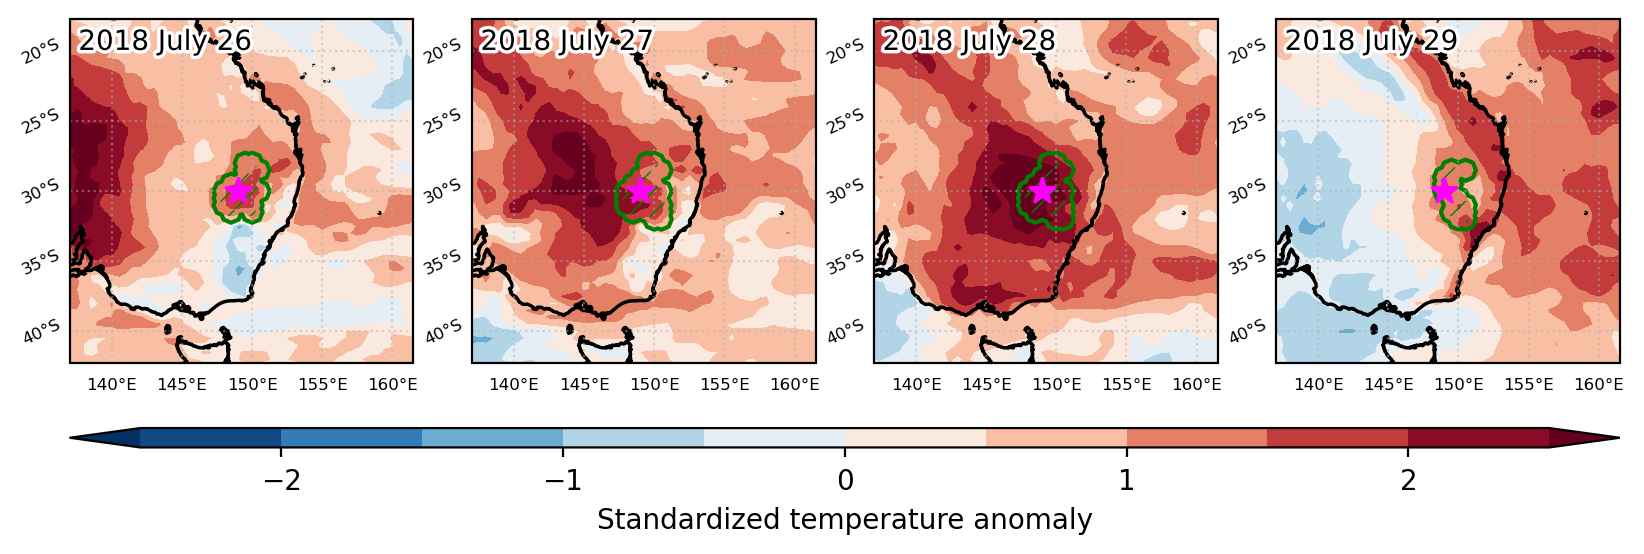
Heat wave occuring from July 26 2018 to July 29 2018 at -30.0°S 149.0°E

Download data: JSON

Event type: Heat wave

Countries affected (identified with ArcGIS Online; provided only for geographical reference):

  • Australia

Duration: 4 days

Time span: July 26 2018 to July 29 2018

Statistics over entire affected area:

  • Mean temperature anomaly: 4.9 °C
  • Mean temperature: 15.6 °C
  • Maximum temperature anomaly: 8.3 °C
  • Maximum temperature: 20.2 °C

Event center: -30.0°S 149.0°E

Area affected: 88120 km$^2$


Fig. 1: Map of most extreme temperature anomalies (standardized) experienced during the event. The purple star indicates the center of the extreme event. Green hatching illustrates all areas under the effect of extremes at some time during the event.


Fig. 2: Evolution of temperature at the center of the event. The climatological percentile distribution is illustrated with color shadings.


Fig. 3: Maps illustrating the evolution of standardized temperature anomalies during the event.

Event ID: Heat_wave_2018-Jul-26_to_2018-Jul-29_149.0_-30.0

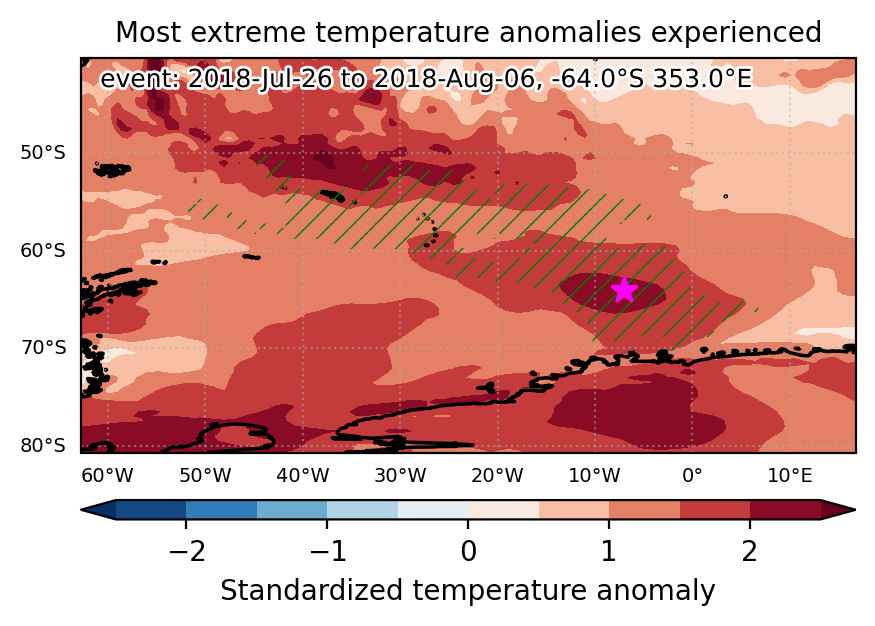
Heat wave occuring from July 26 2018 to August 06 2018 at -64.0°S 353.0°E

Download data: JSON

Event type: Heat wave

Countries affected (identified with ArcGIS Online; provided only for geographical reference):

  • Antarctica
  • South Georgia and the South Sandwich Islands

Duration: 12 days

Time span: July 26 2018 to August 06 2018

Statistics over entire affected area:

  • Mean temperature anomaly: 6.9 °C
  • Mean temperature: -1.7 °C
  • Maximum temperature anomaly: 14.0 °C
  • Maximum temperature: 5.5 °C

Event center: -64.0°S 353.0°E

Area affected: 2557264 km$^2$


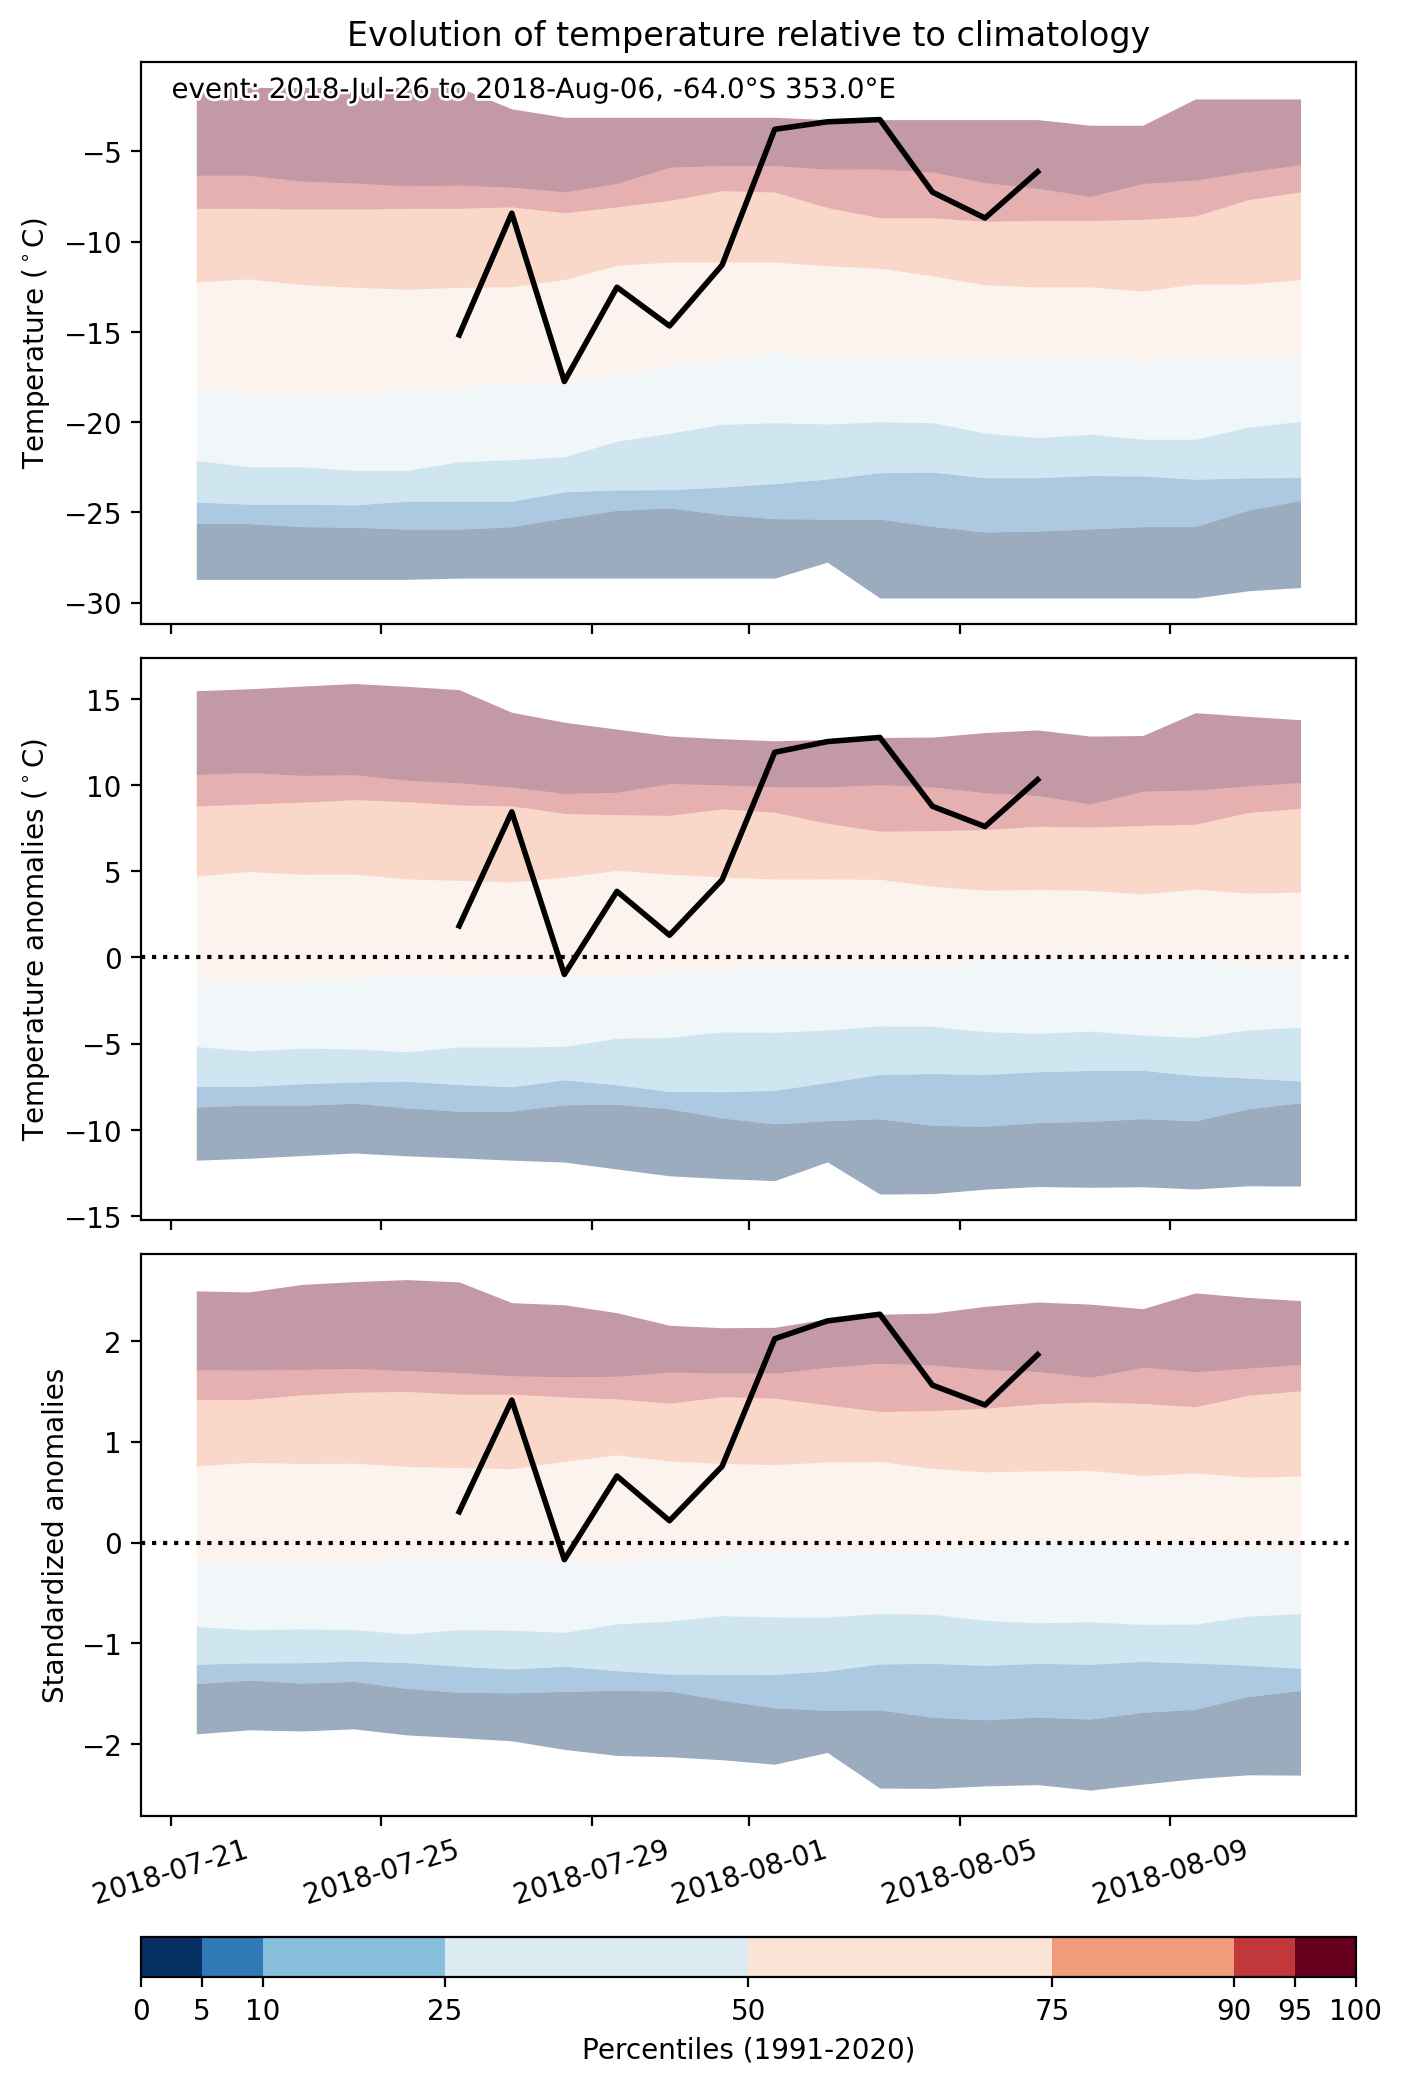
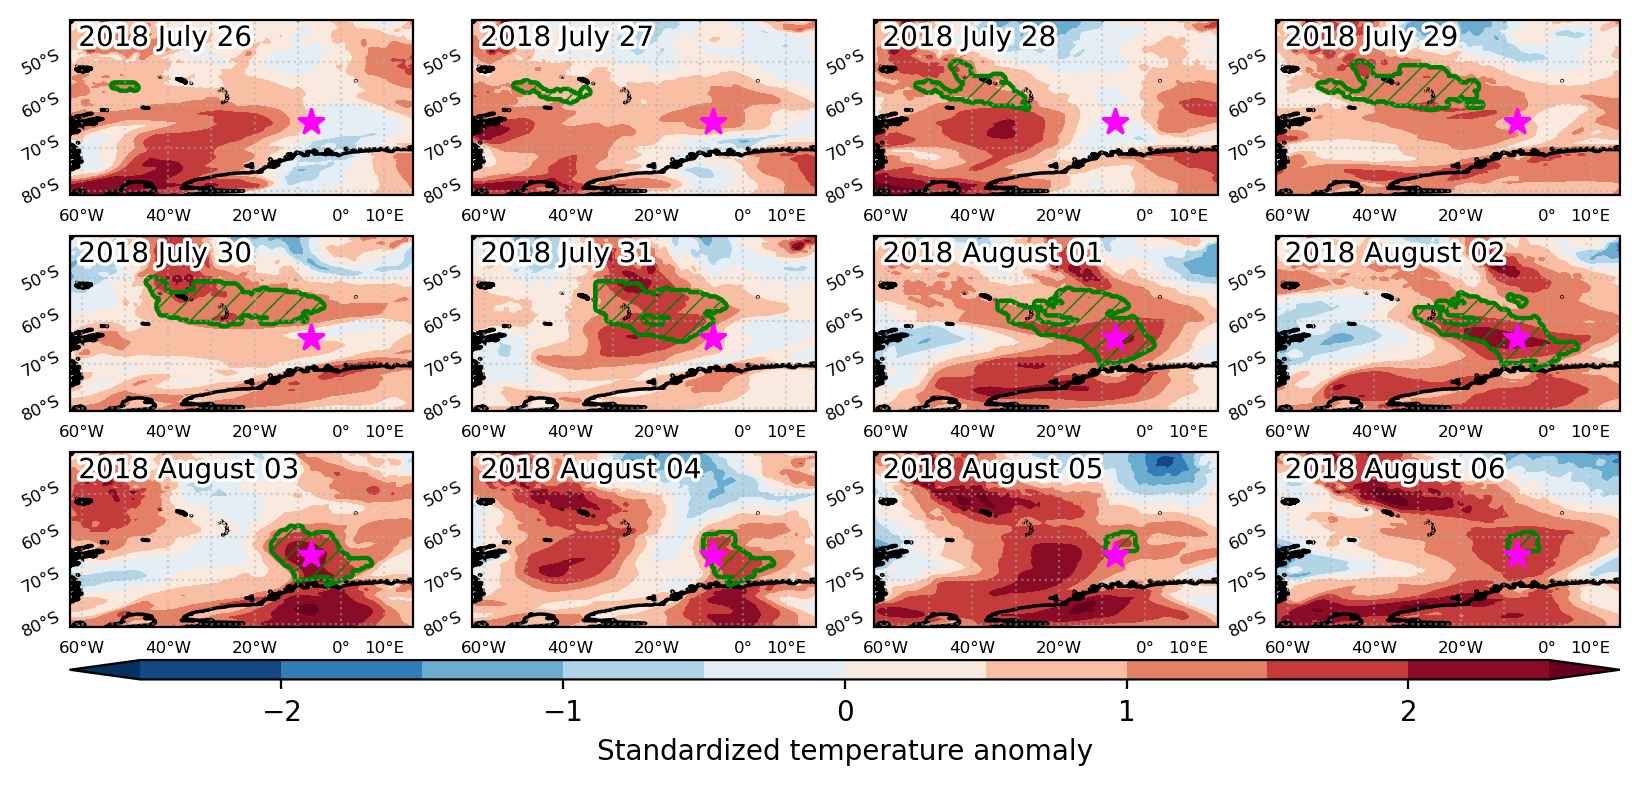
Fig. 1: Map of most extreme temperature anomalies (standardized) experienced during the event. The purple star indicates the center of the extreme event. Green hatching illustrates all areas under the effect of extremes at some time during the event.


Fig. 2: Evolution of temperature at the center of the event. The climatological percentile distribution is illustrated with color shadings.


Fig. 3: Maps illustrating the evolution of standardized temperature anomalies during the event.

Event ID: Heat_wave_2018-Jul-26_to_2018-Aug-06_353.0_-64.0