Cold spell occuring from June 30 2018 to July 04 2018 at 52.5°N 29.5°E

Download data: JSON

Event type: Cold spell

Countries affected (identified with ArcGIS Online; provided only for geographical reference):

  • Belarus
  • Estonia
  • Latvia
  • Lithuania
  • Poland
  • Russian Federation
  • Ukraine

Duration: 5 days

Time span: June 30 2018 to July 04 2018

Statistics over entire affected area:

  • Mean temperature anomaly: -5.5 °C
  • Mean temperature: 12.3 °C
  • Minimum temperature anomaly: -9.4 °C
  • Minimum temperature: 9.2 °C

Event center: 52.5°N 29.5°E

Area affected: 641392 km$^2$
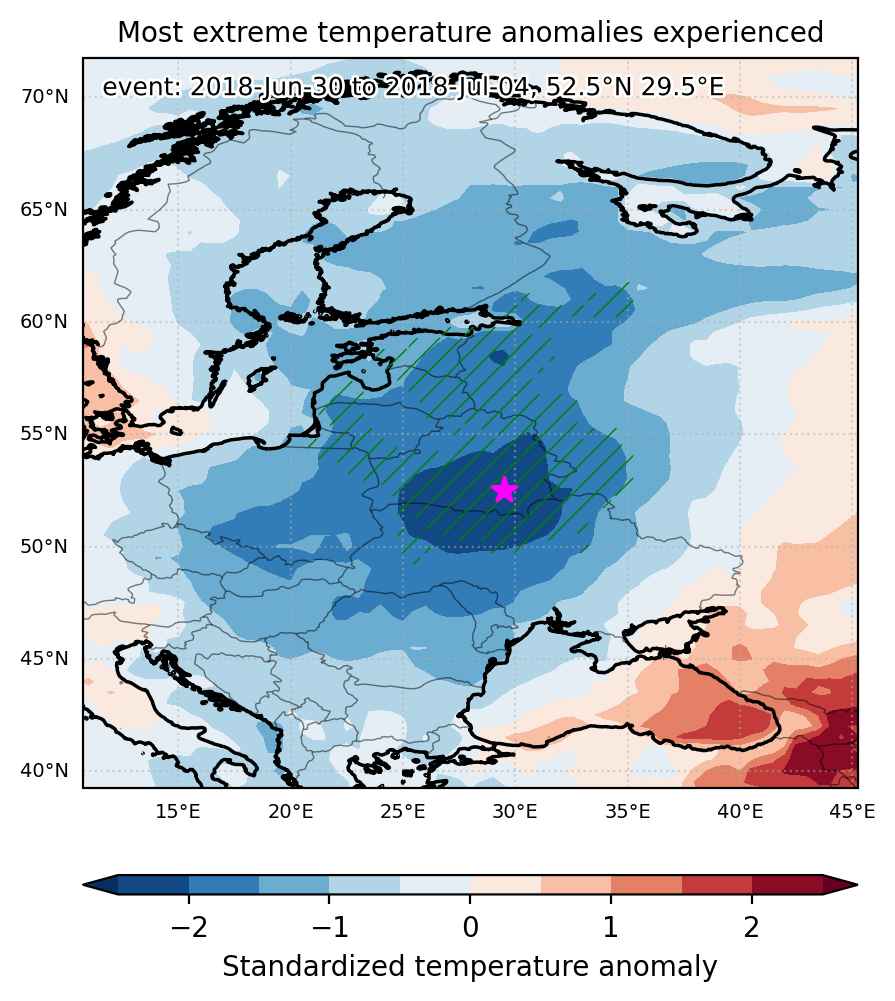

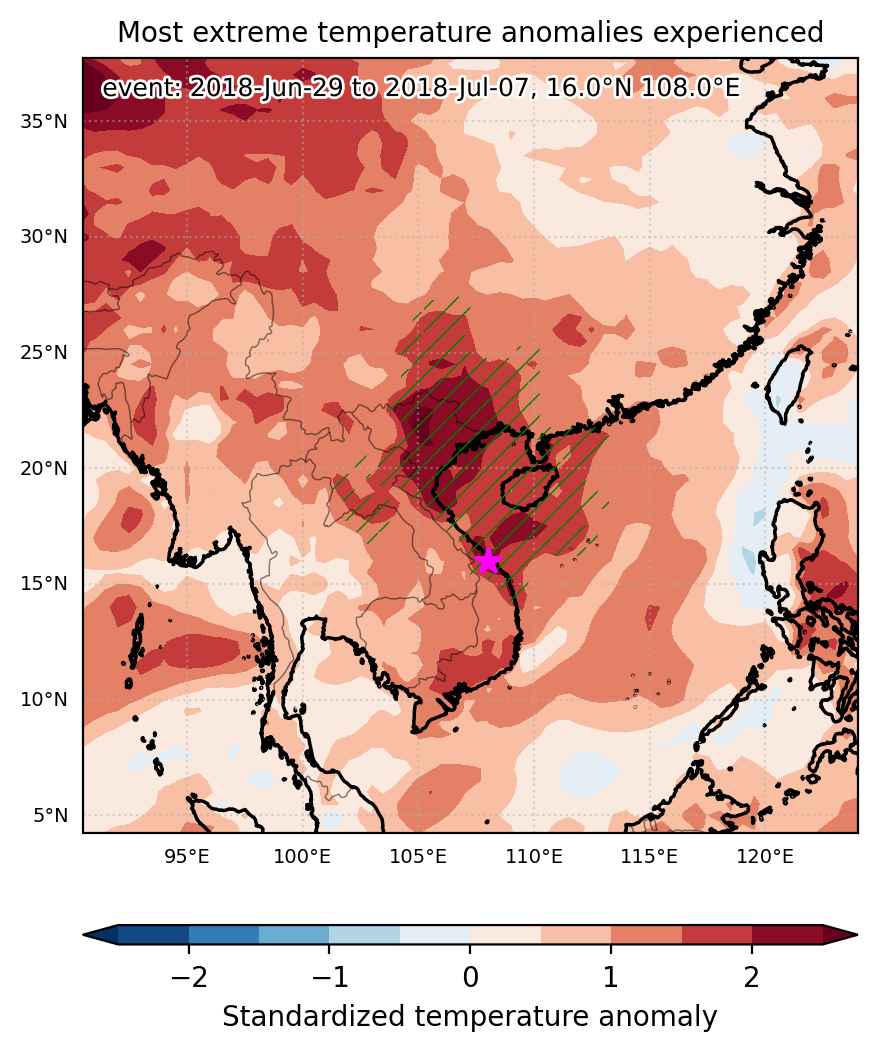
Fig. 1: Map of most extreme temperature anomalies (standardized) experienced during the event. The purple star indicates the center of the extreme event. Green hatching illustrates all areas under the effect of extremes at some time during the event.
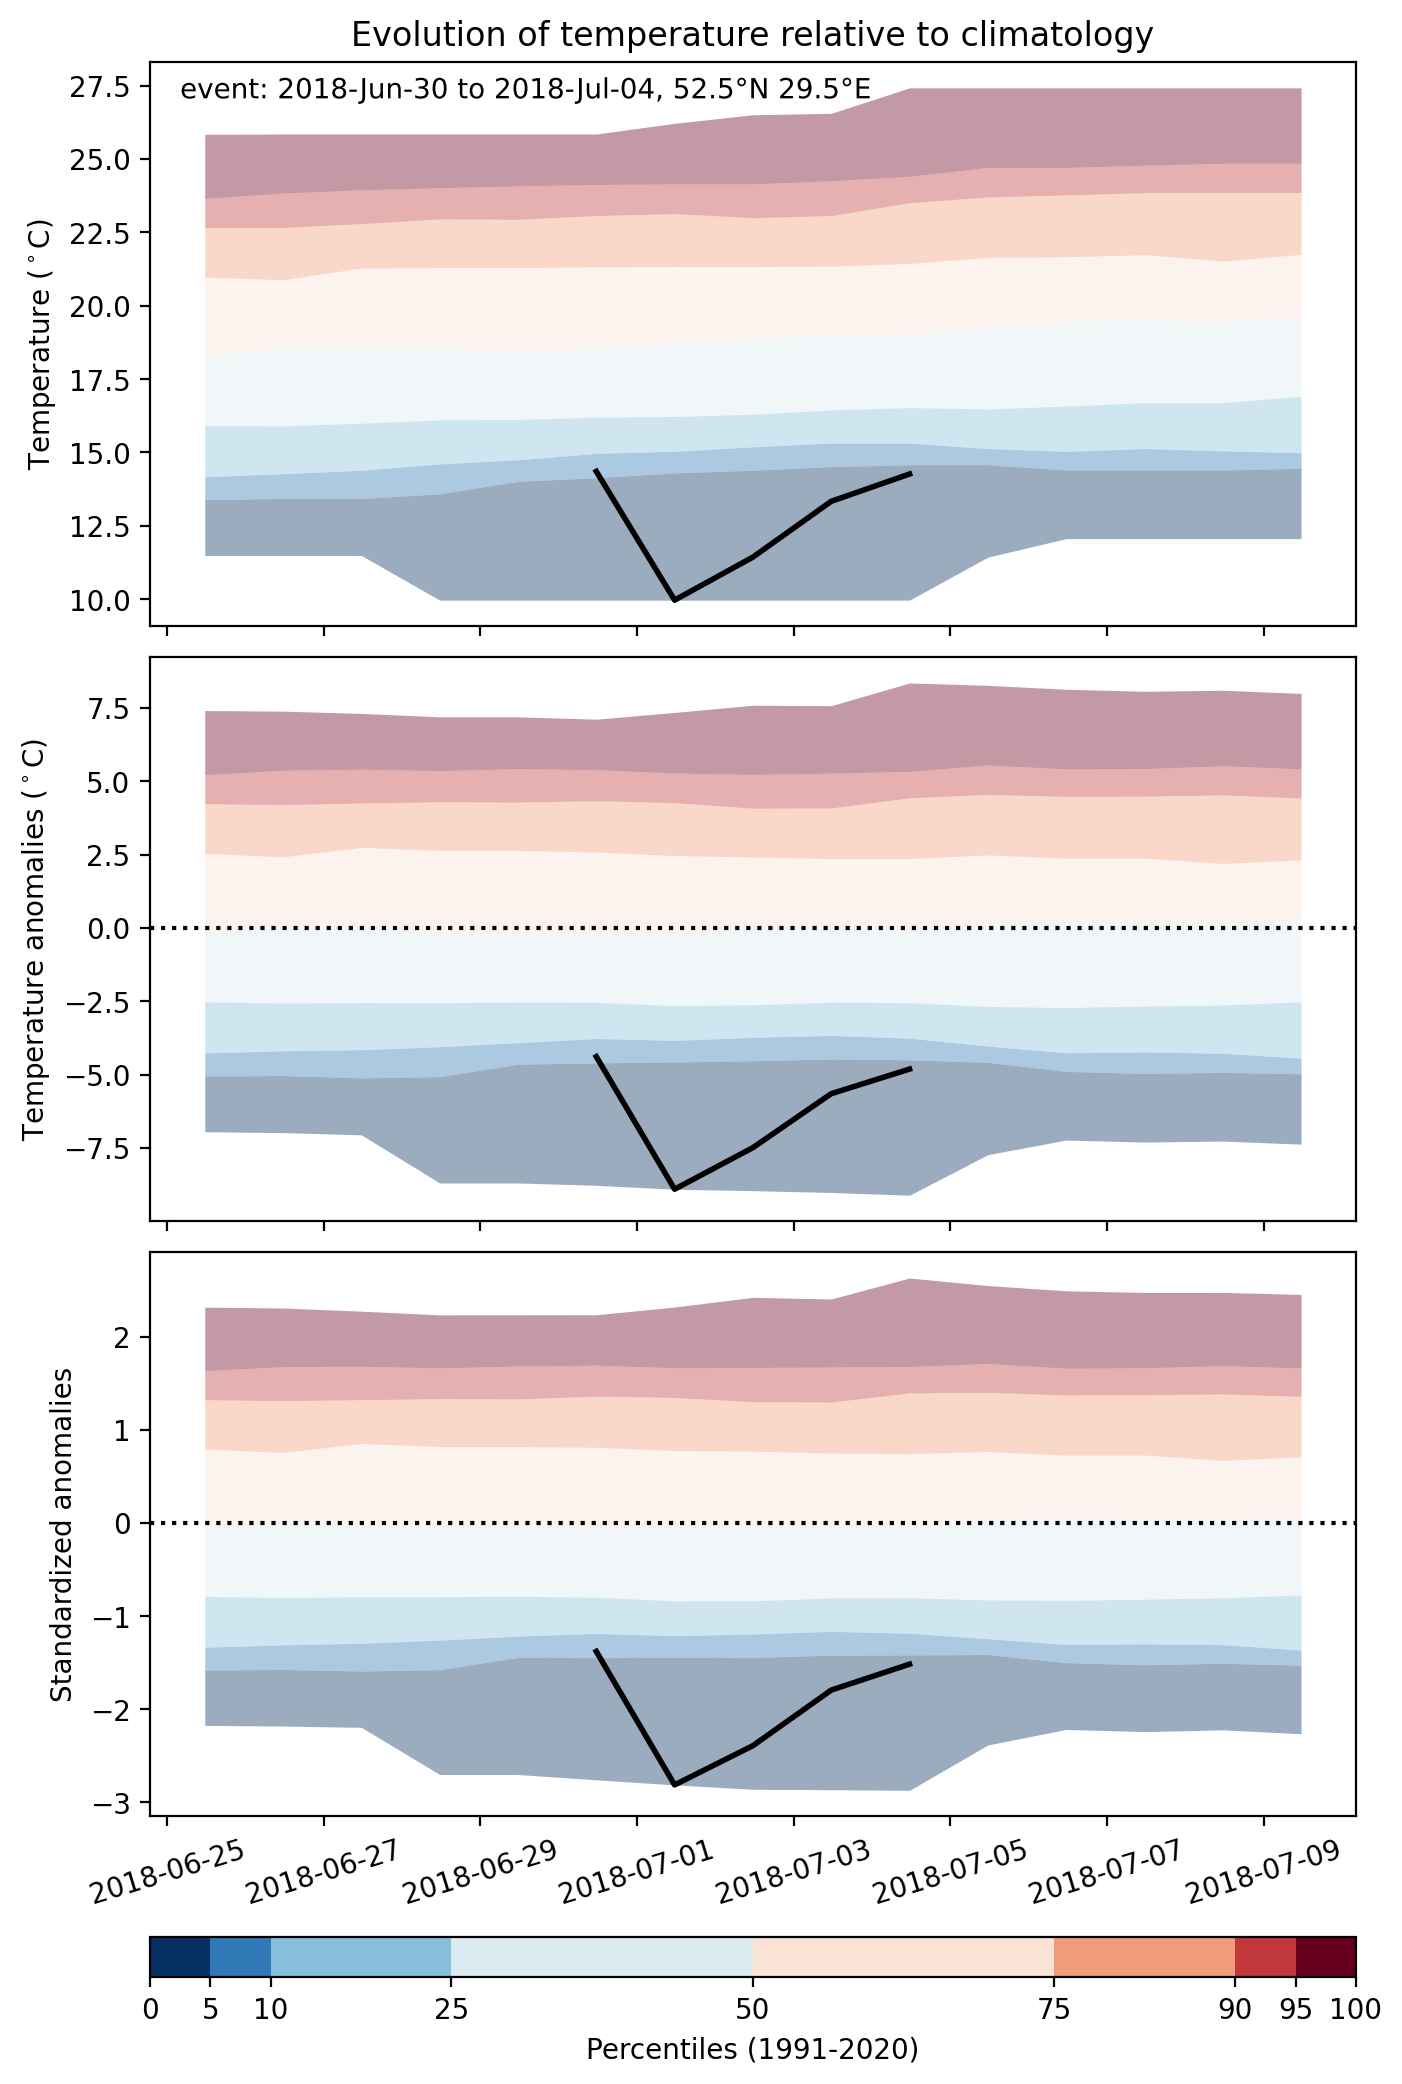


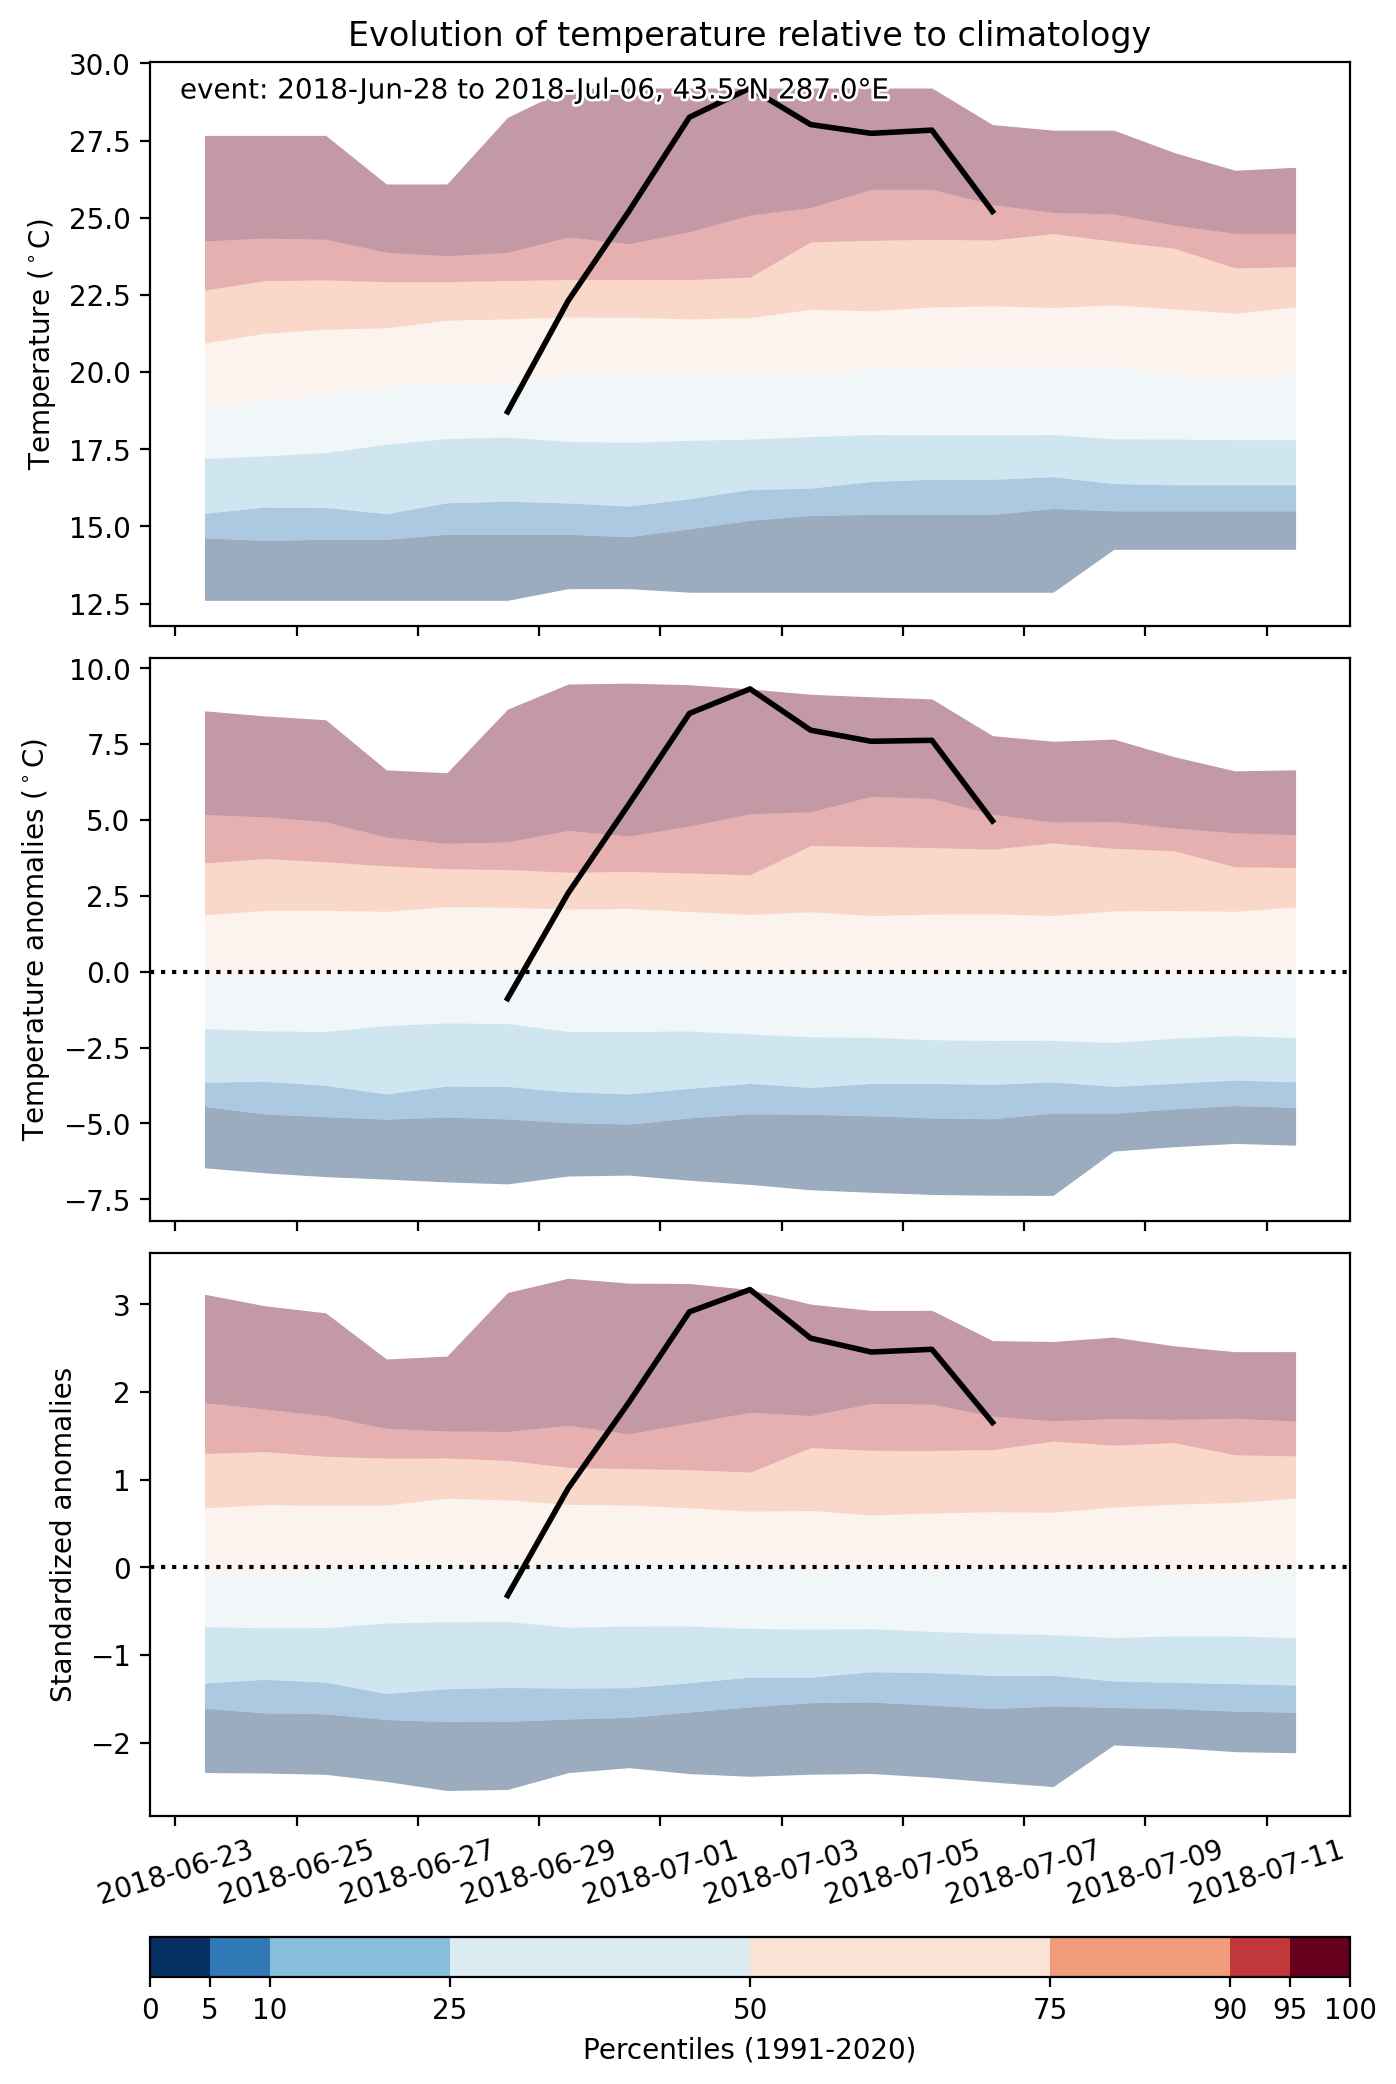
Fig. 2: Evolution of temperature at the center of the event. The climatological percentile distribution is illustrated with color shadings.
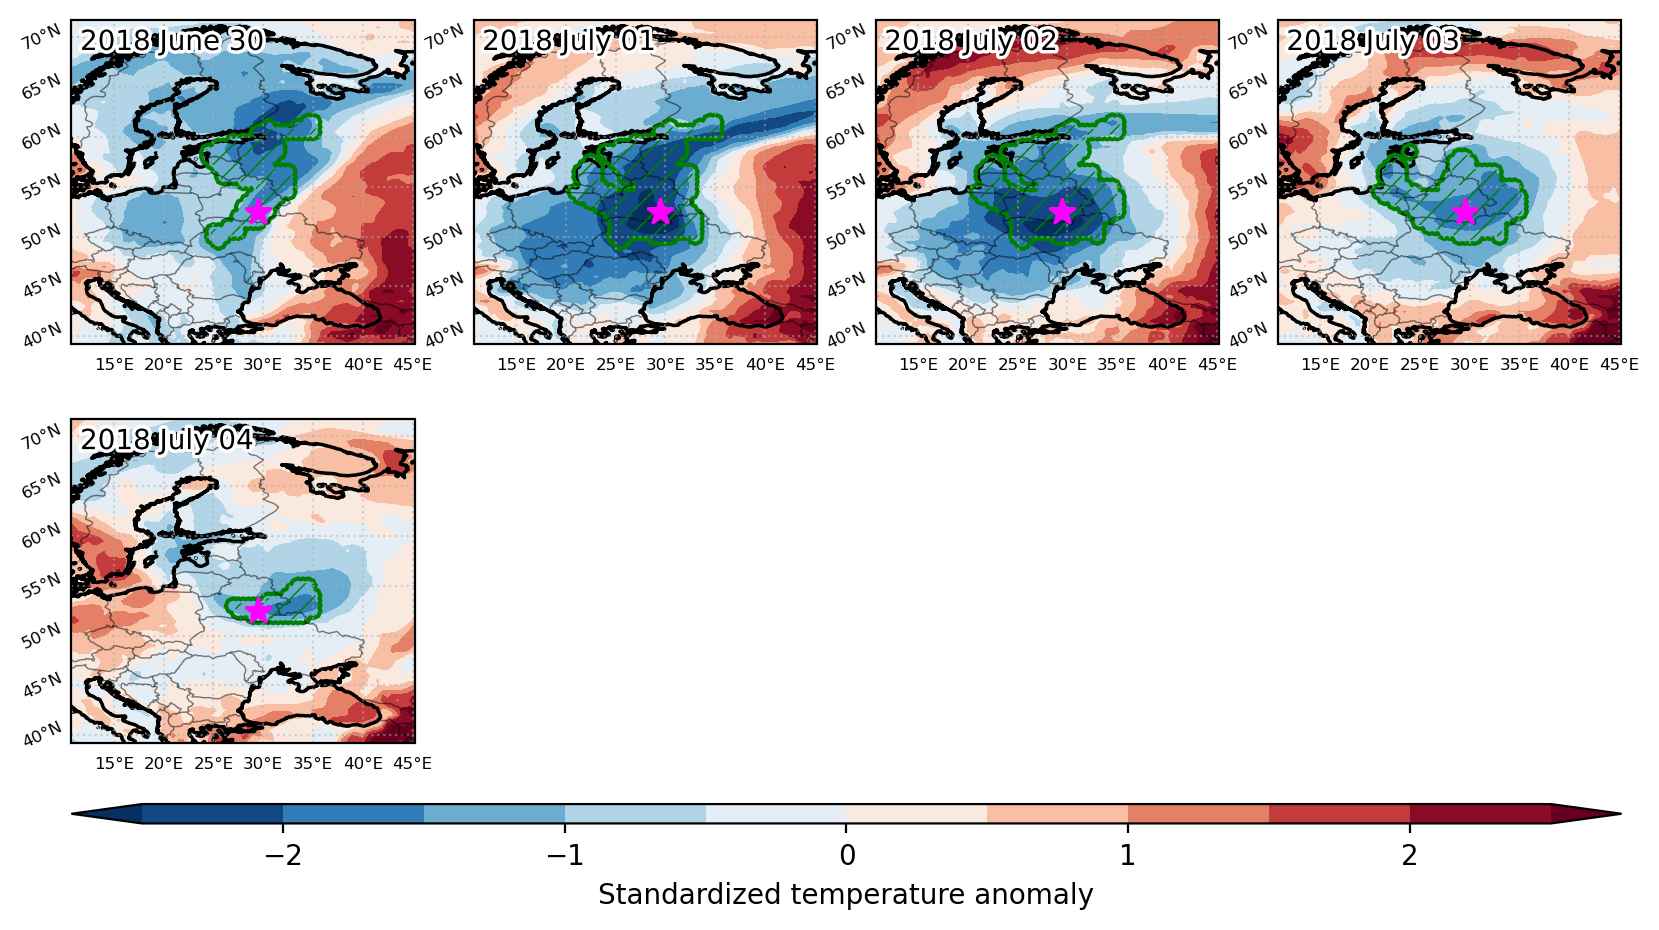


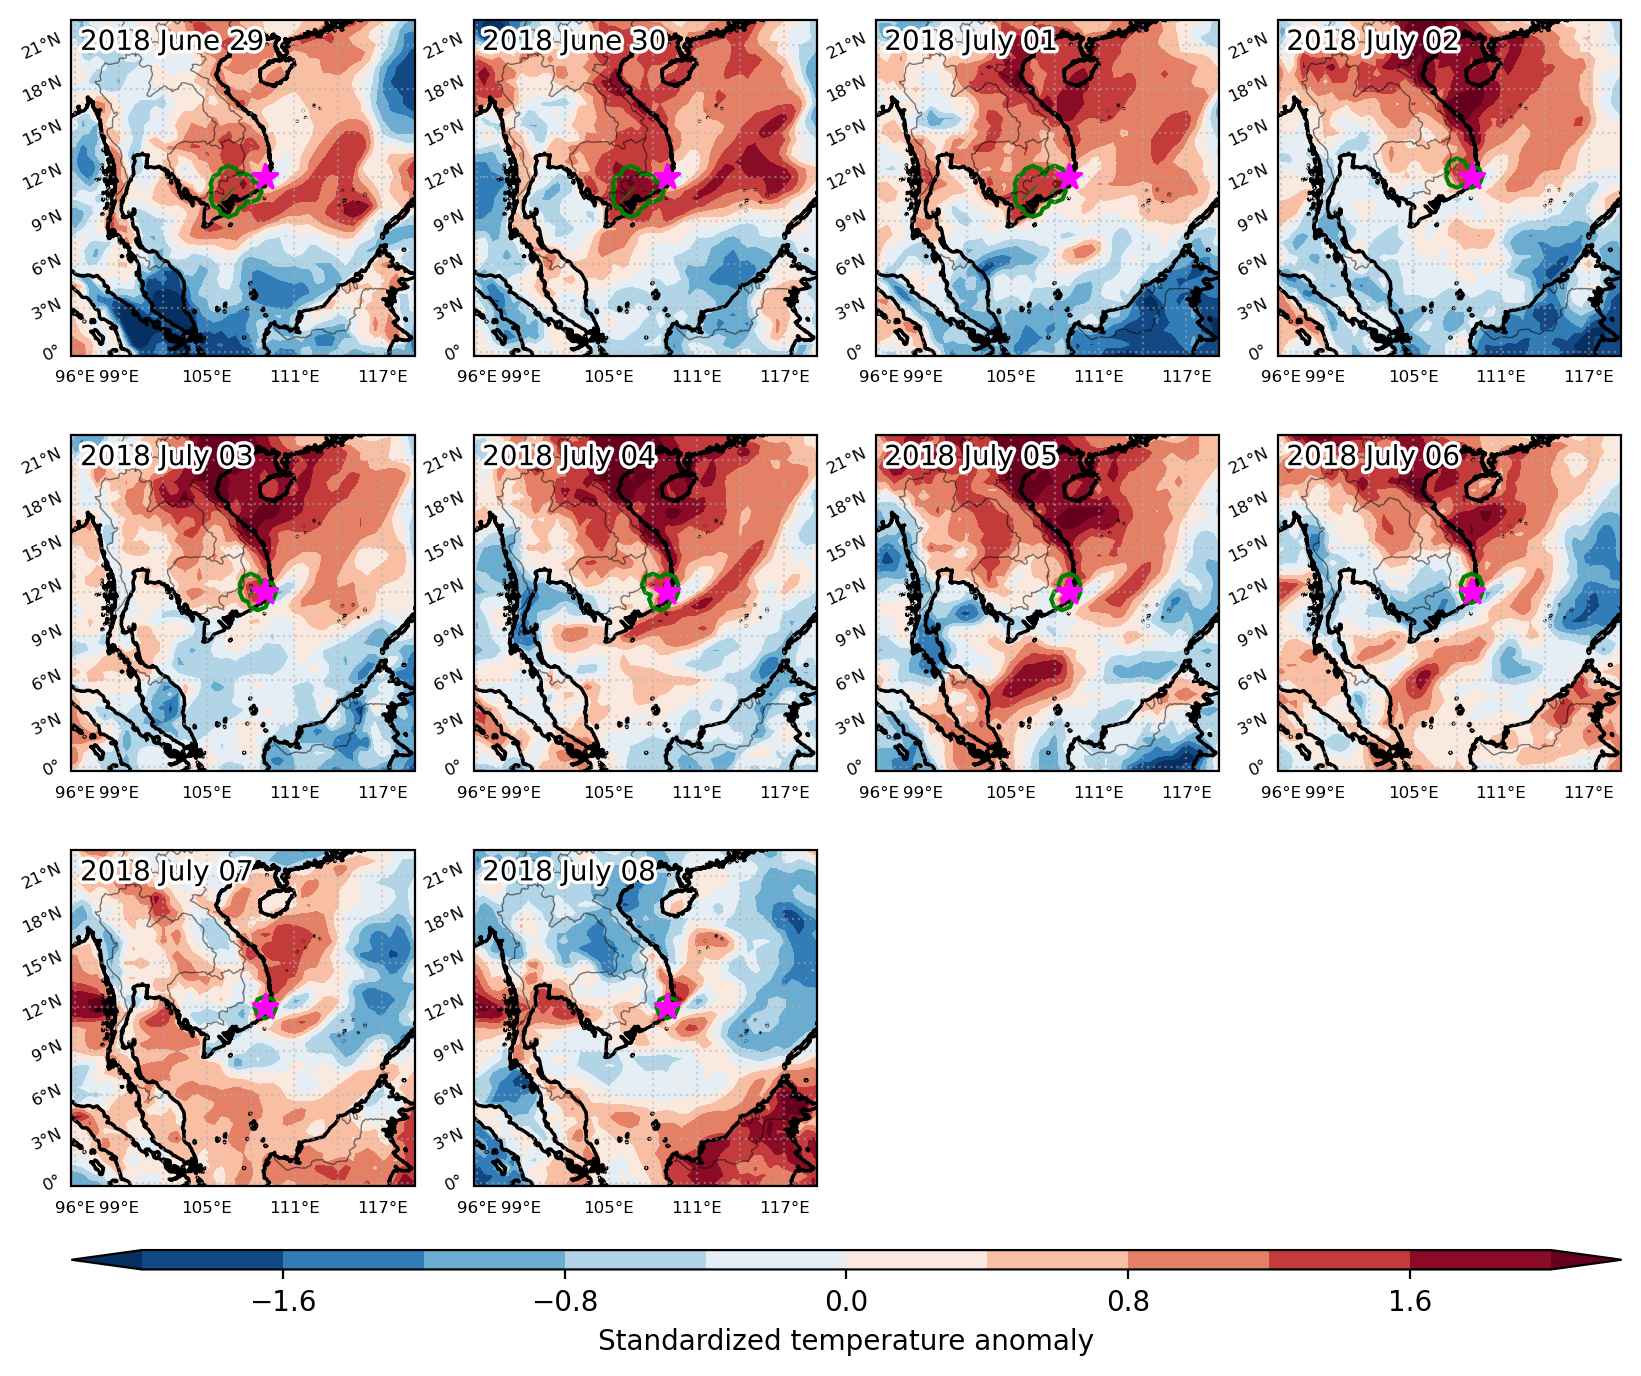
Fig. 3: Maps illustrating the evolution of standardized temperature anomalies during the event.

Event ID: Cold_spell_2018-Jun-30_to_2018-Jul-04_29.5_52.5
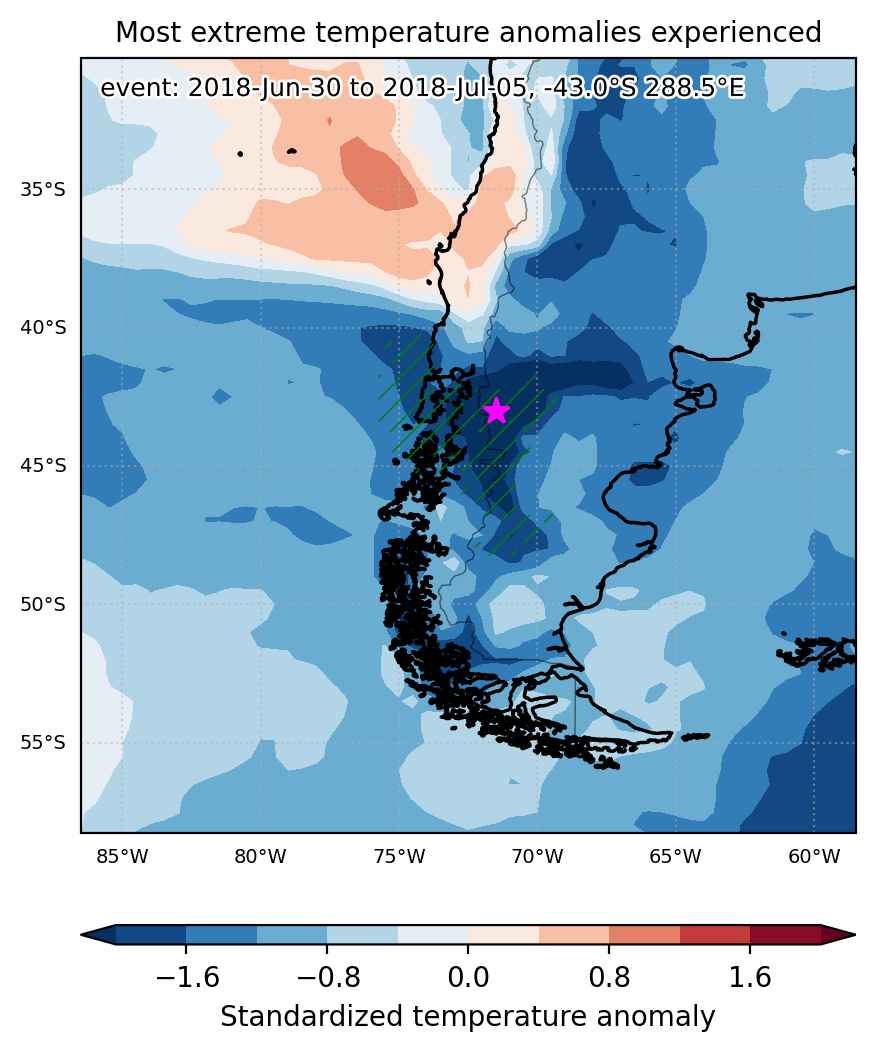
Cold spell occuring from June 30 2018 to July 05 2018 at -43.0°S 288.5°E

Download data: JSON

Event type: Cold spell

Countries affected (identified with ArcGIS Online; provided only for geographical reference):

  • Argentina
  • Chile

Duration: 6 days

Time span: June 30 2018 to July 05 2018

Statistics over entire affected area:

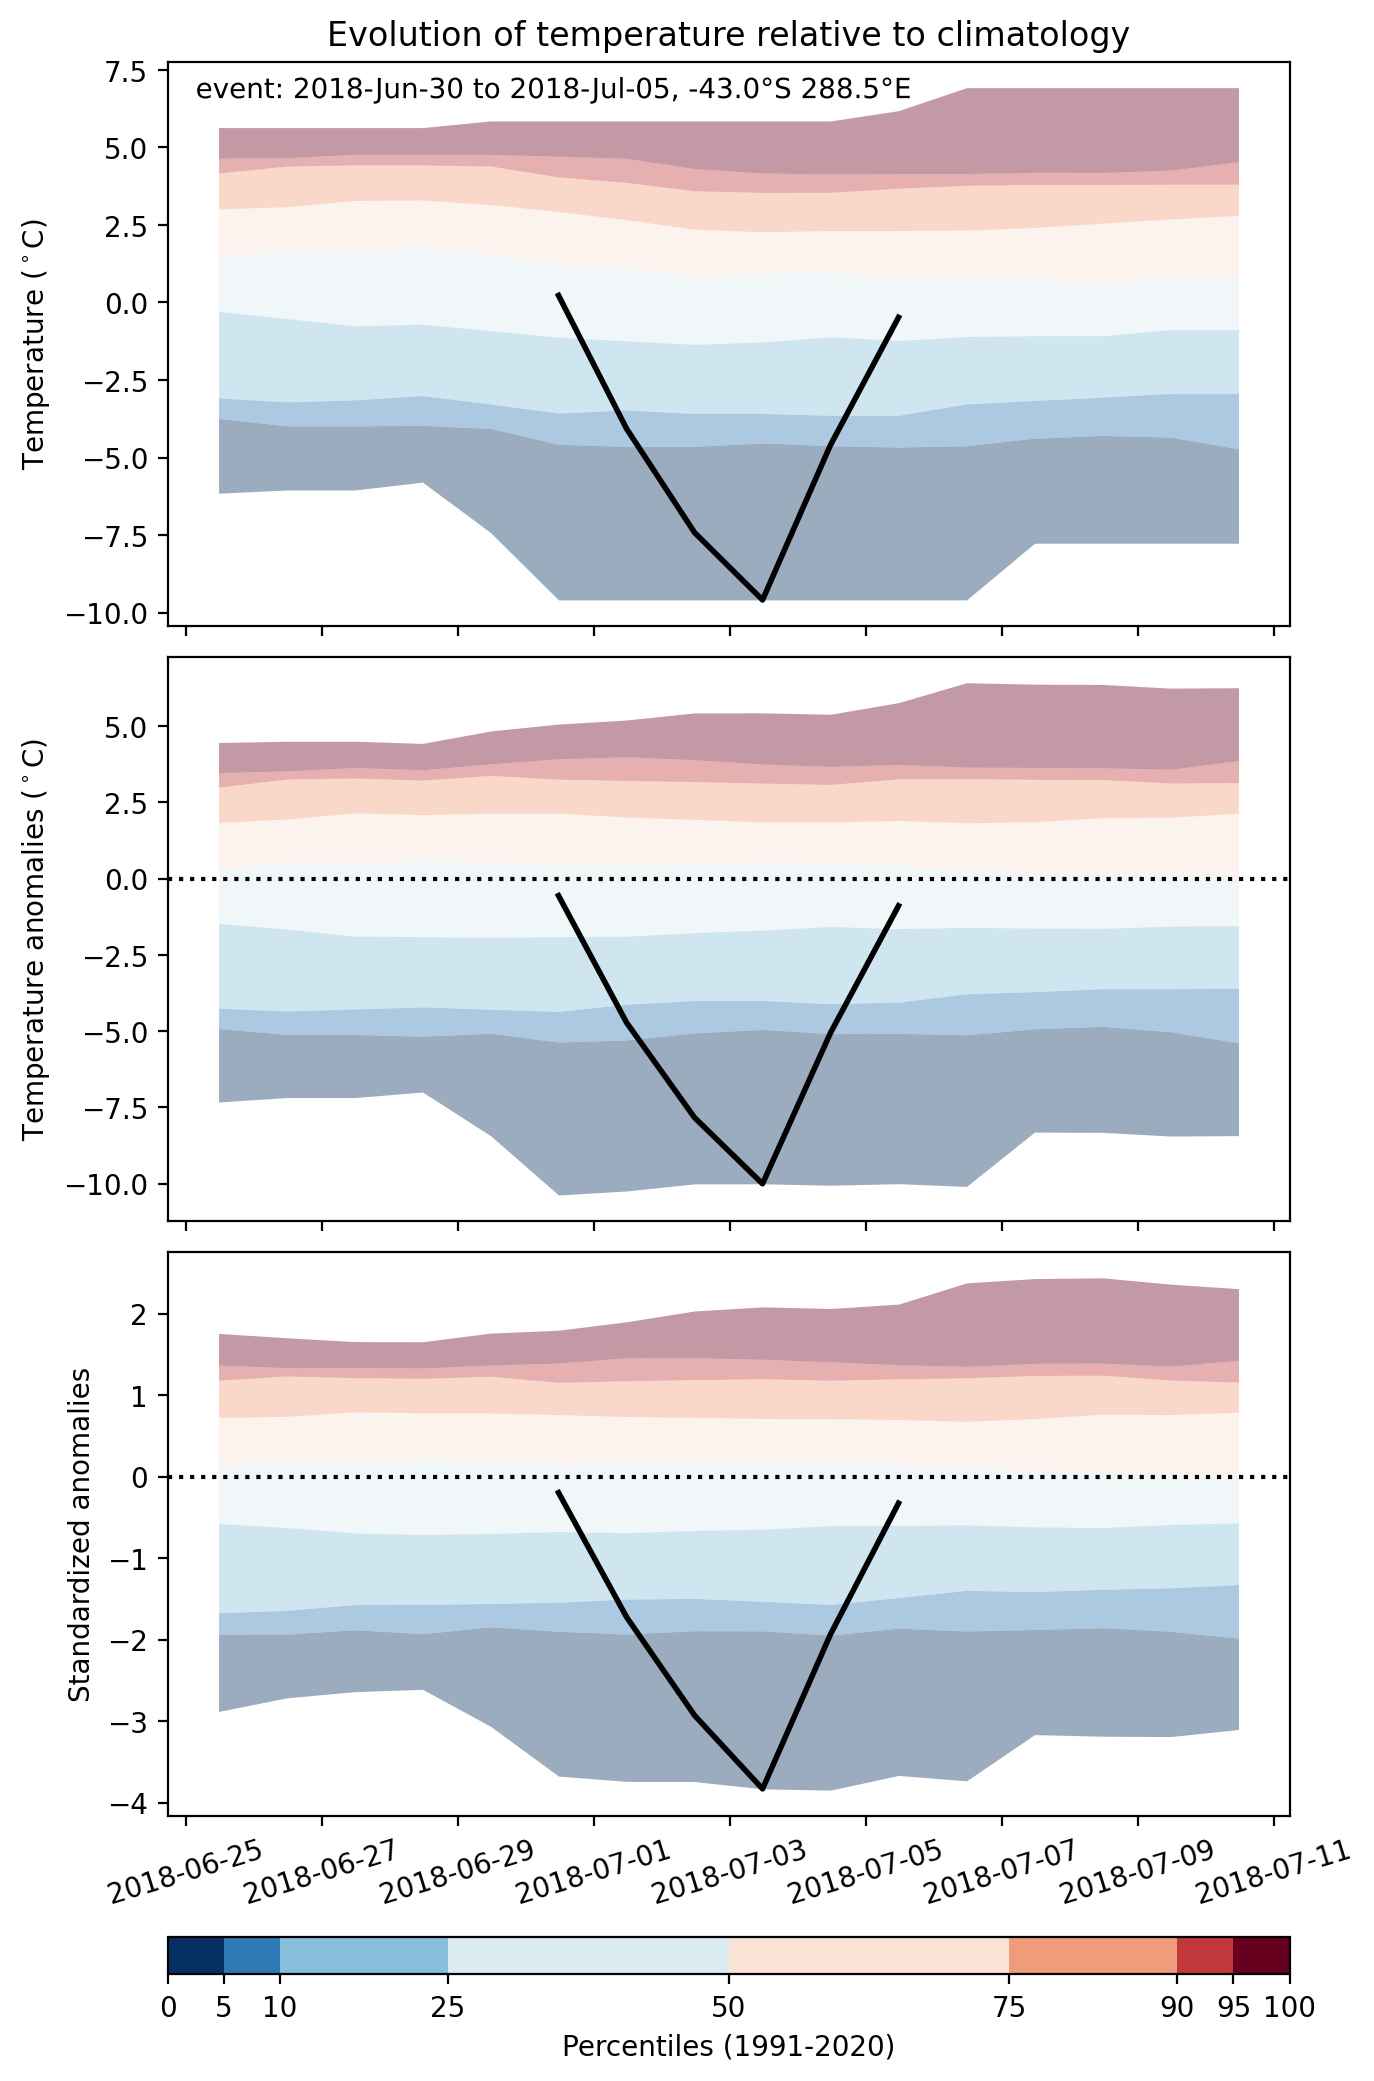
  • Mean temperature anomaly: -5.0 °C
  • Mean temperature: -1.2 °C
  • Minimum temperature anomaly: -11.3 °C
  • Minimum temperature: -14.5 °C

Event center: -43.0°S 288.5°E

Area affected: 207300 km$^2$


Fig. 1: Map of most extreme temperature anomalies (standardized) experienced during the event. The purple star indicates the center of the extreme event. Green hatching illustrates all areas under the effect of extremes at some time during the event.


Fig. 2: Evolution of temperature at the center of the event. The climatological percentile distribution is illustrated with color shadings.


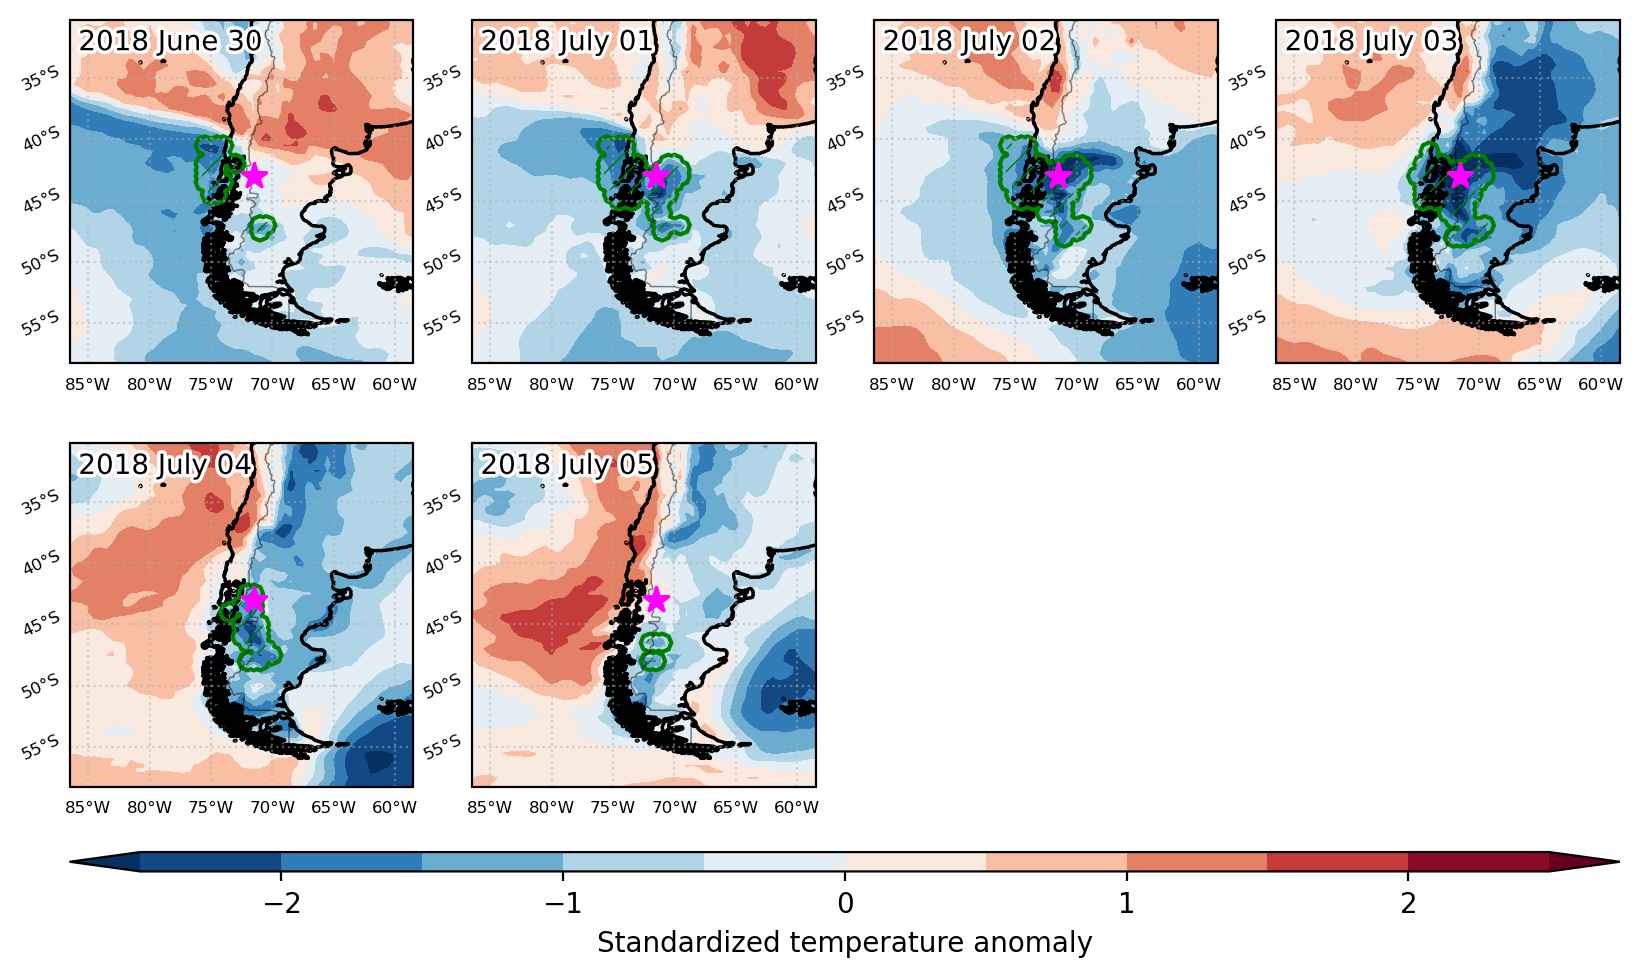
Fig. 3: Maps illustrating the evolution of standardized temperature anomalies during the event.

Event ID: Cold_spell_2018-Jun-30_to_2018-Jul-05_288.5_-43.0

Heat wave occuring from June 29 2018 to July 08 2018 at 12.0°N 109.0°E

Download data: JSON

Event type: Heat wave

Countries affected (identified with ArcGIS Online; provided only for geographical reference):

  • Cambodia
  • Vietnam

Duration: 10 days

Time span: June 29 2018 to July 08 2018

Statistics over entire affected area:

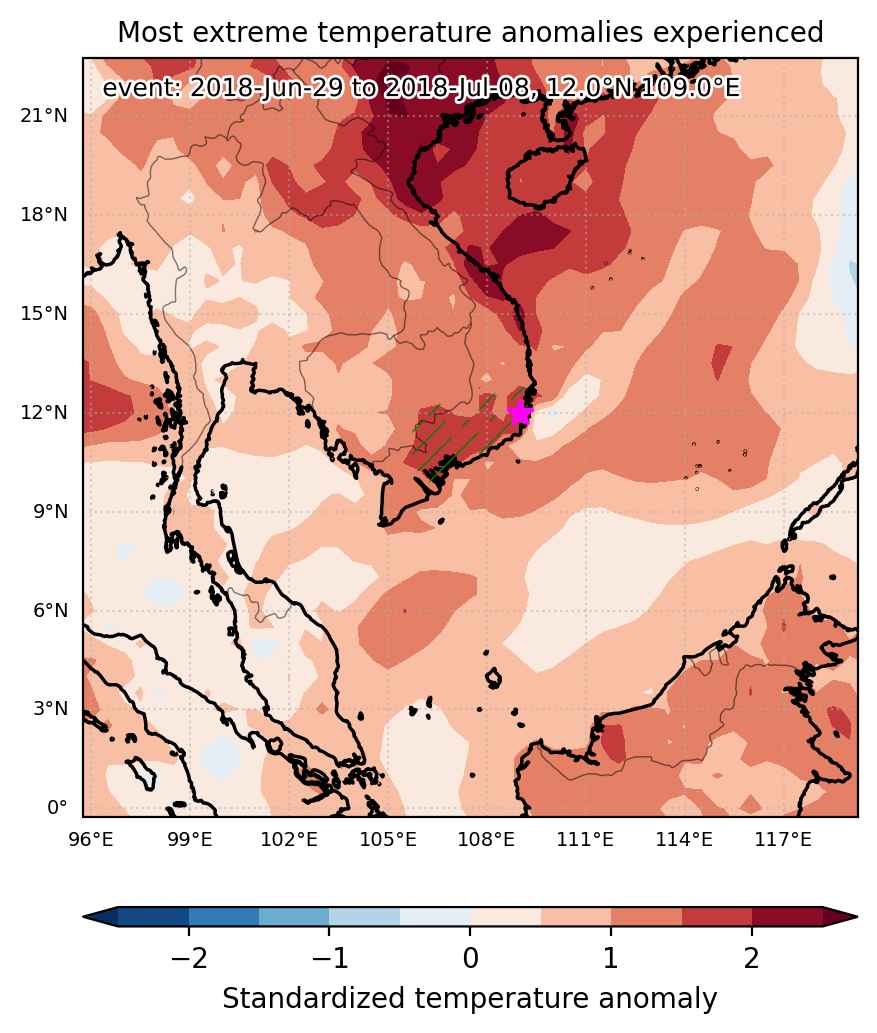
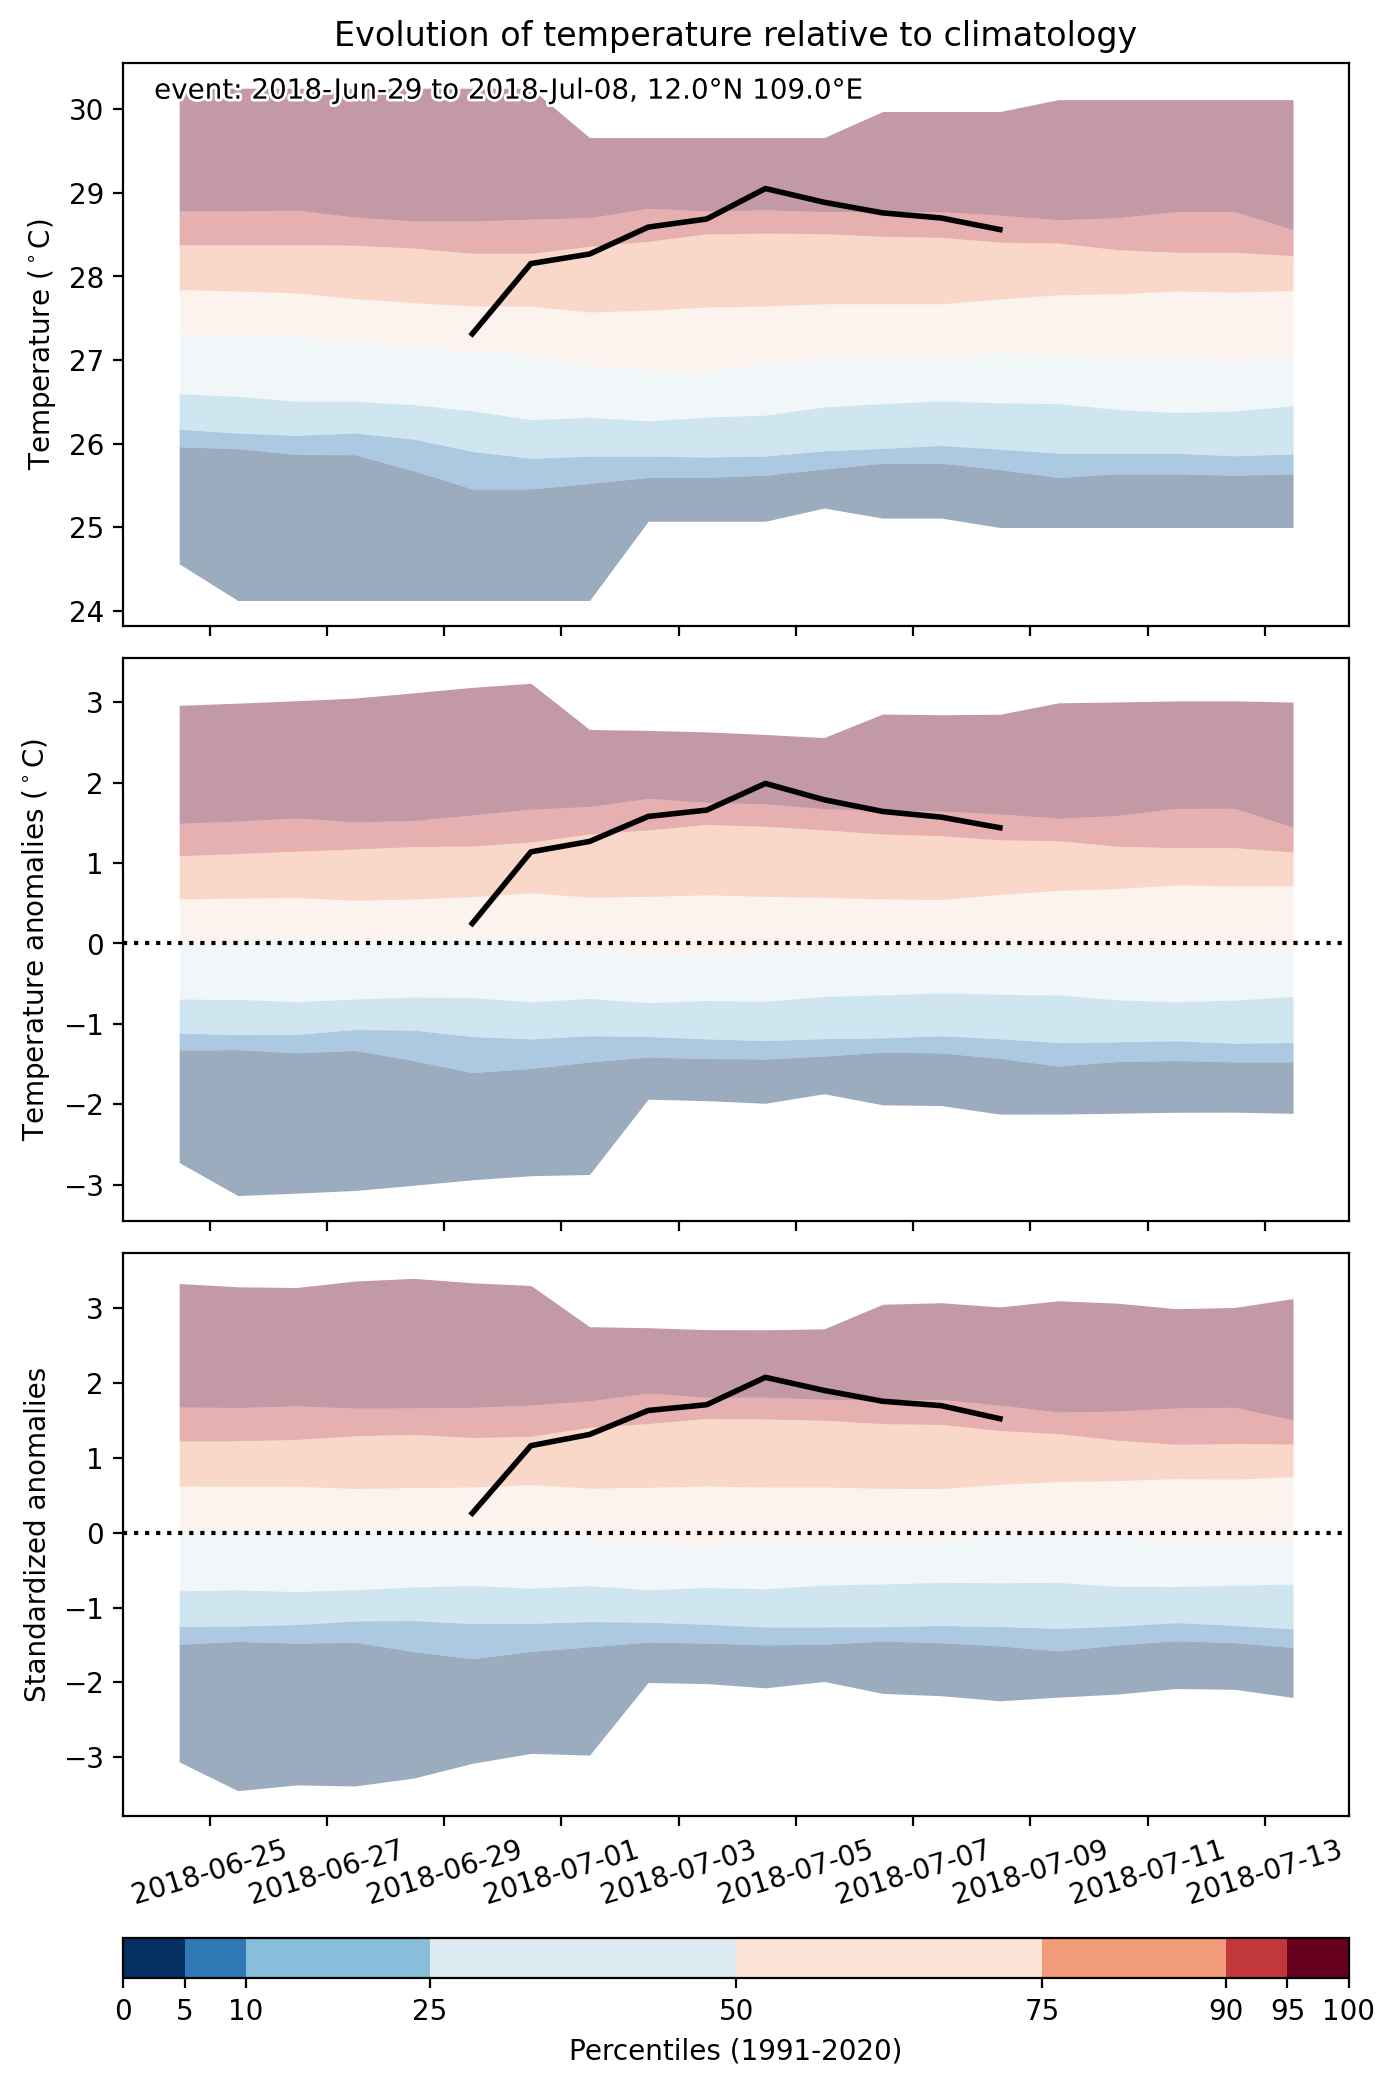
  • Mean temperature anomaly: 1.5 °C
  • Mean temperature: 28.3 °C
  • Maximum temperature anomaly: 2.3 °C
  • Maximum temperature: 29.9 °C

Event center: 12.0°N 109.0°E

Area affected: 54555 km$^2$


Fig. 1: Map of most extreme temperature anomalies (standardized) experienced during the event. The purple star indicates the center of the extreme event. Green hatching illustrates all areas under the effect of extremes at some time during the event.


Fig. 2: Evolution of temperature at the center of the event. The climatological percentile distribution is illustrated with color shadings.


Fig. 3: Maps illustrating the evolution of standardized temperature anomalies during the event.

Event ID: Heat_wave_2018-Jun-29_to_2018-Jul-08_109.0_12.0

Heat wave occuring from June 29 2018 to July 07 2018 at 16.0°N 108.0°E

Download data: JSON

Event type: Heat wave

Countries affected (identified with ArcGIS Online; provided only for geographical reference):

  • China
  • Laos
  • Thailand
  • Vietnam

Duration: 9 days

Time span: June 29 2018 to July 07 2018

Statistics over entire affected area:

  • Mean temperature anomaly: 2.1 °C
  • Mean temperature: 29.8 °C
  • Maximum temperature anomaly: 4.8 °C
  • Maximum temperature: 35.6 °C

Event center: 16.0°N 108.0°E

Area affected: 875951 km$^2$


Fig. 1: Map of most extreme temperature anomalies (standardized) experienced during the event. The purple star indicates the center of the extreme event. Green hatching illustrates all areas under the effect of extremes at some time during the event.


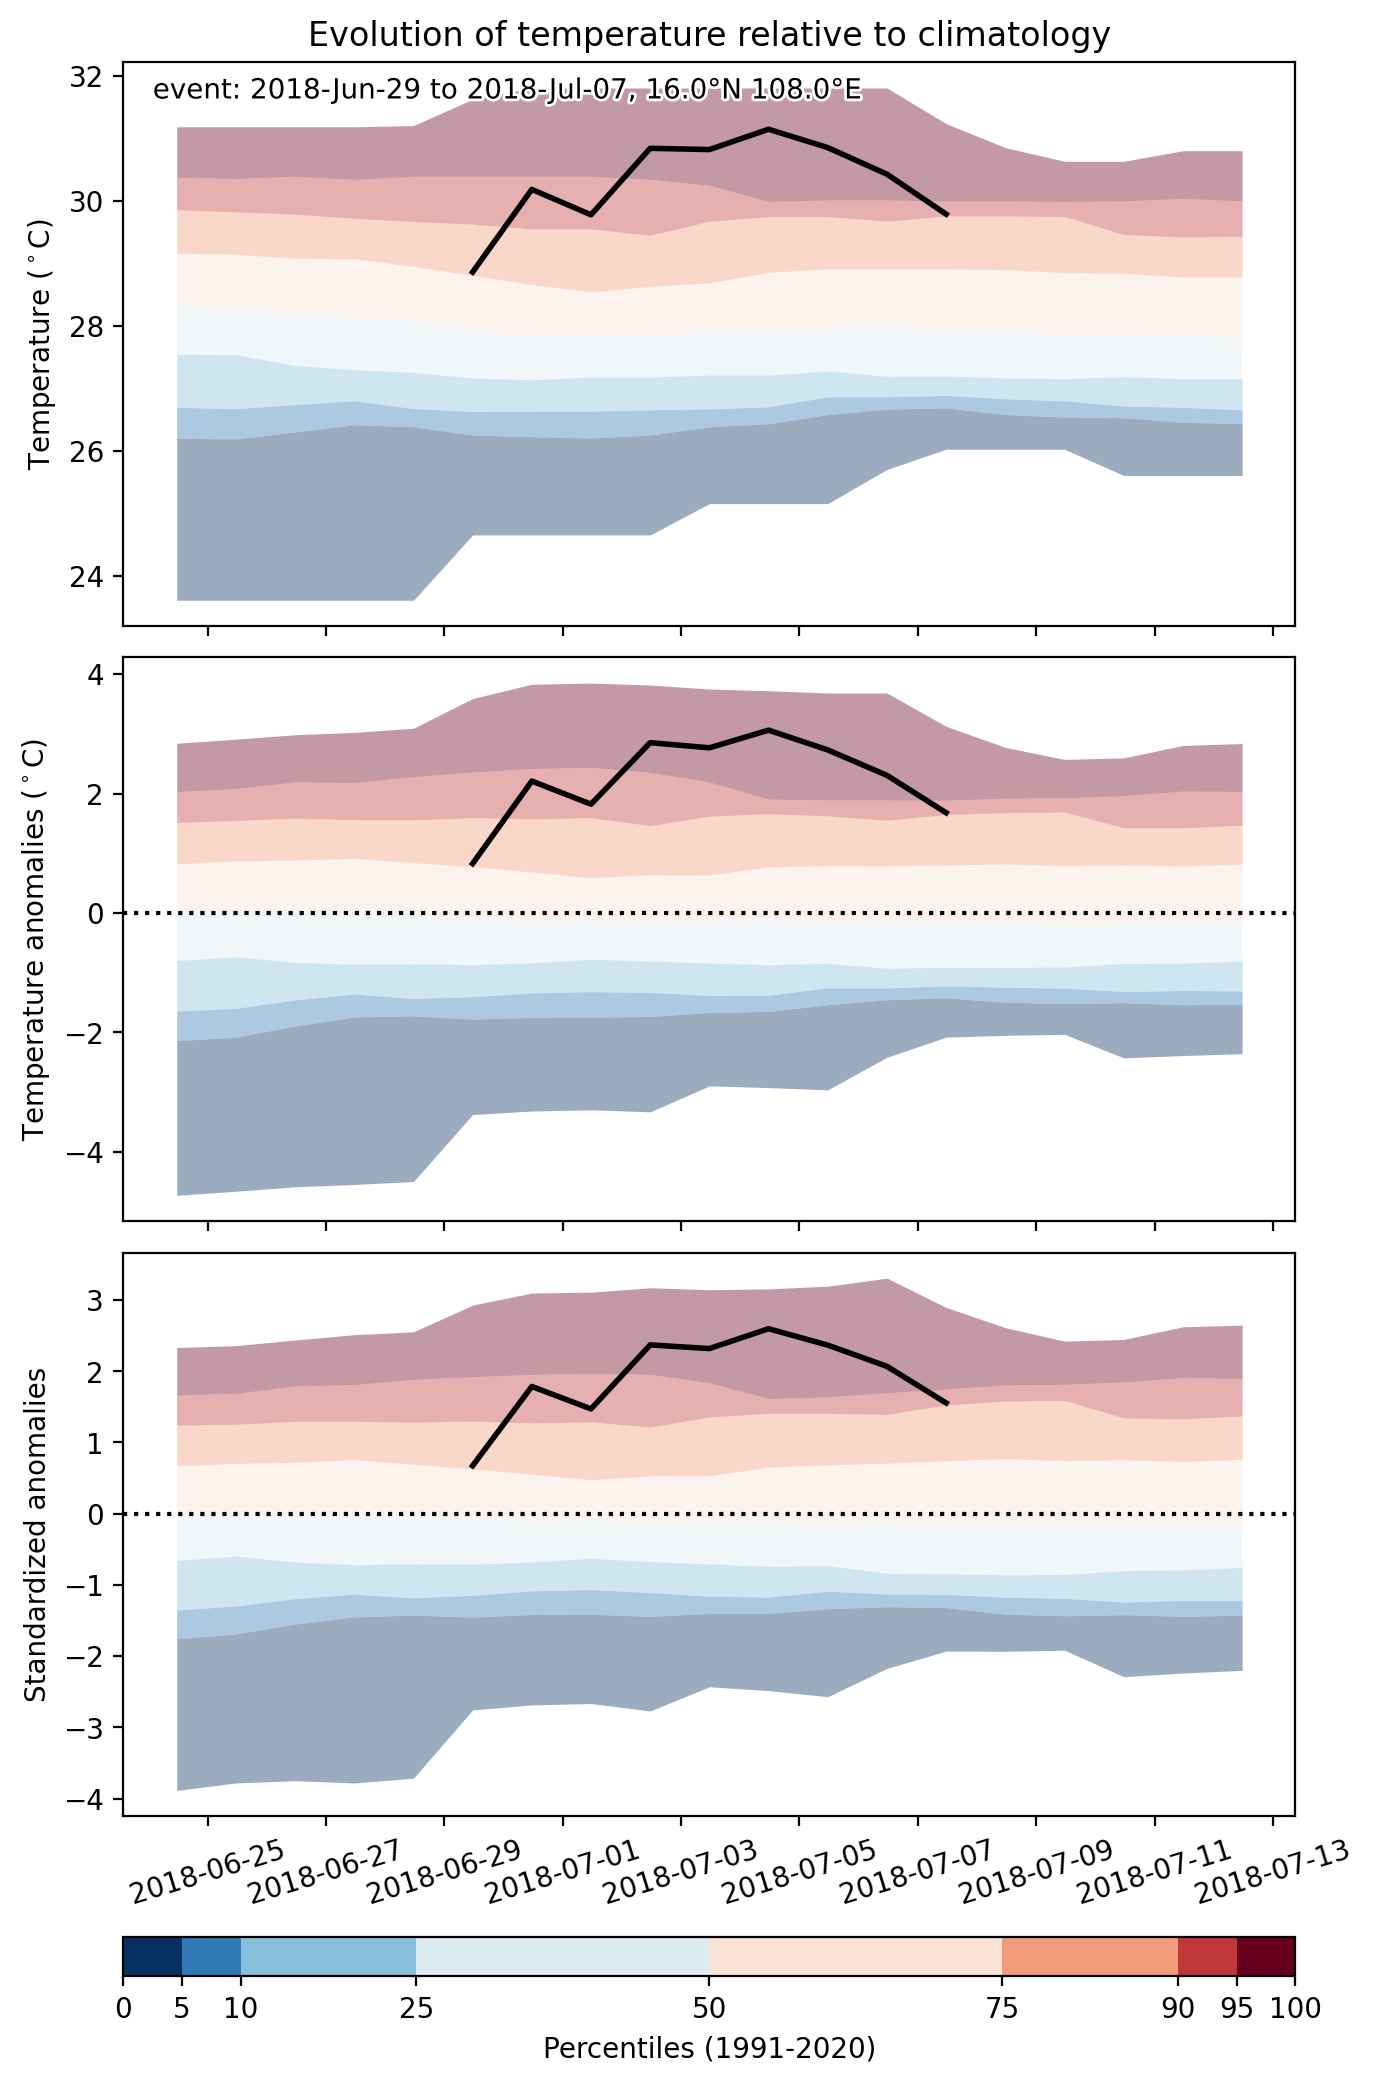
Fig. 2: Evolution of temperature at the center of the event. The climatological percentile distribution is illustrated with color shadings.


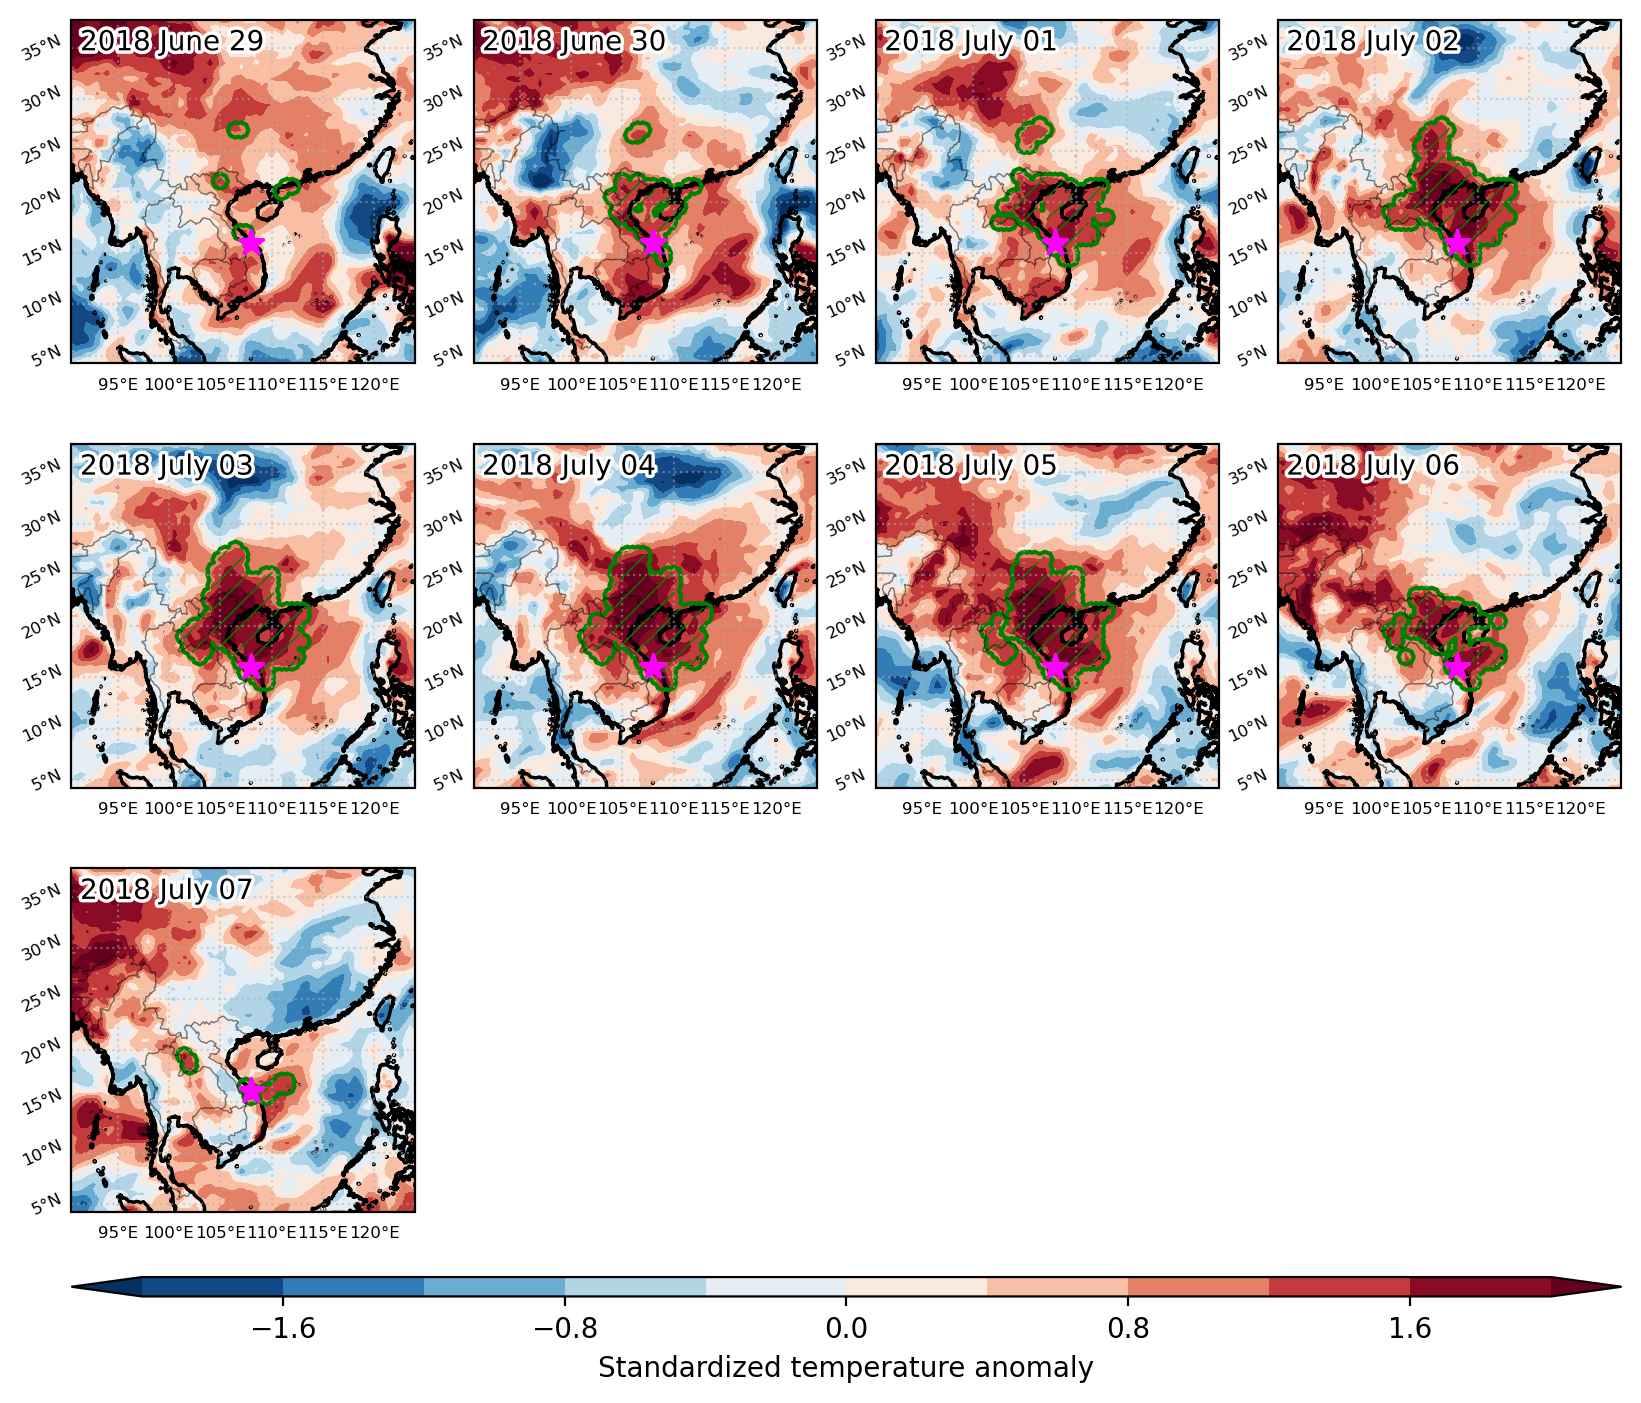
Fig. 3: Maps illustrating the evolution of standardized temperature anomalies during the event.

Event ID: Heat_wave_2018-Jun-29_to_2018-Jul-07_108.0_16.0

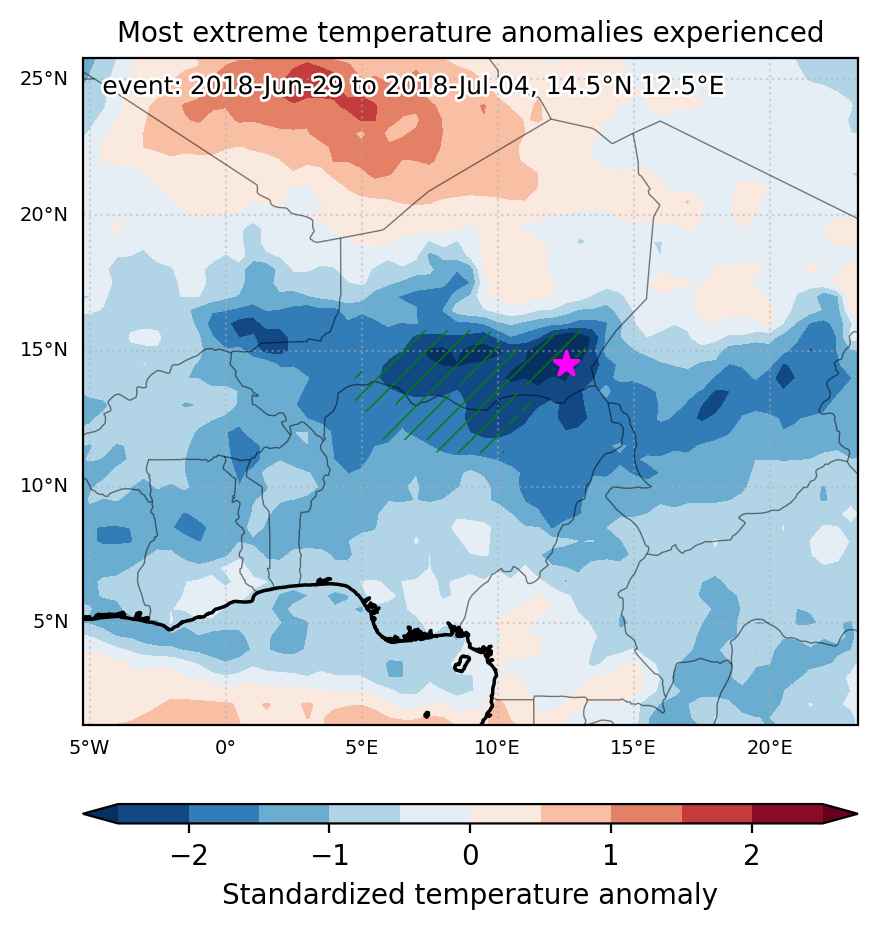
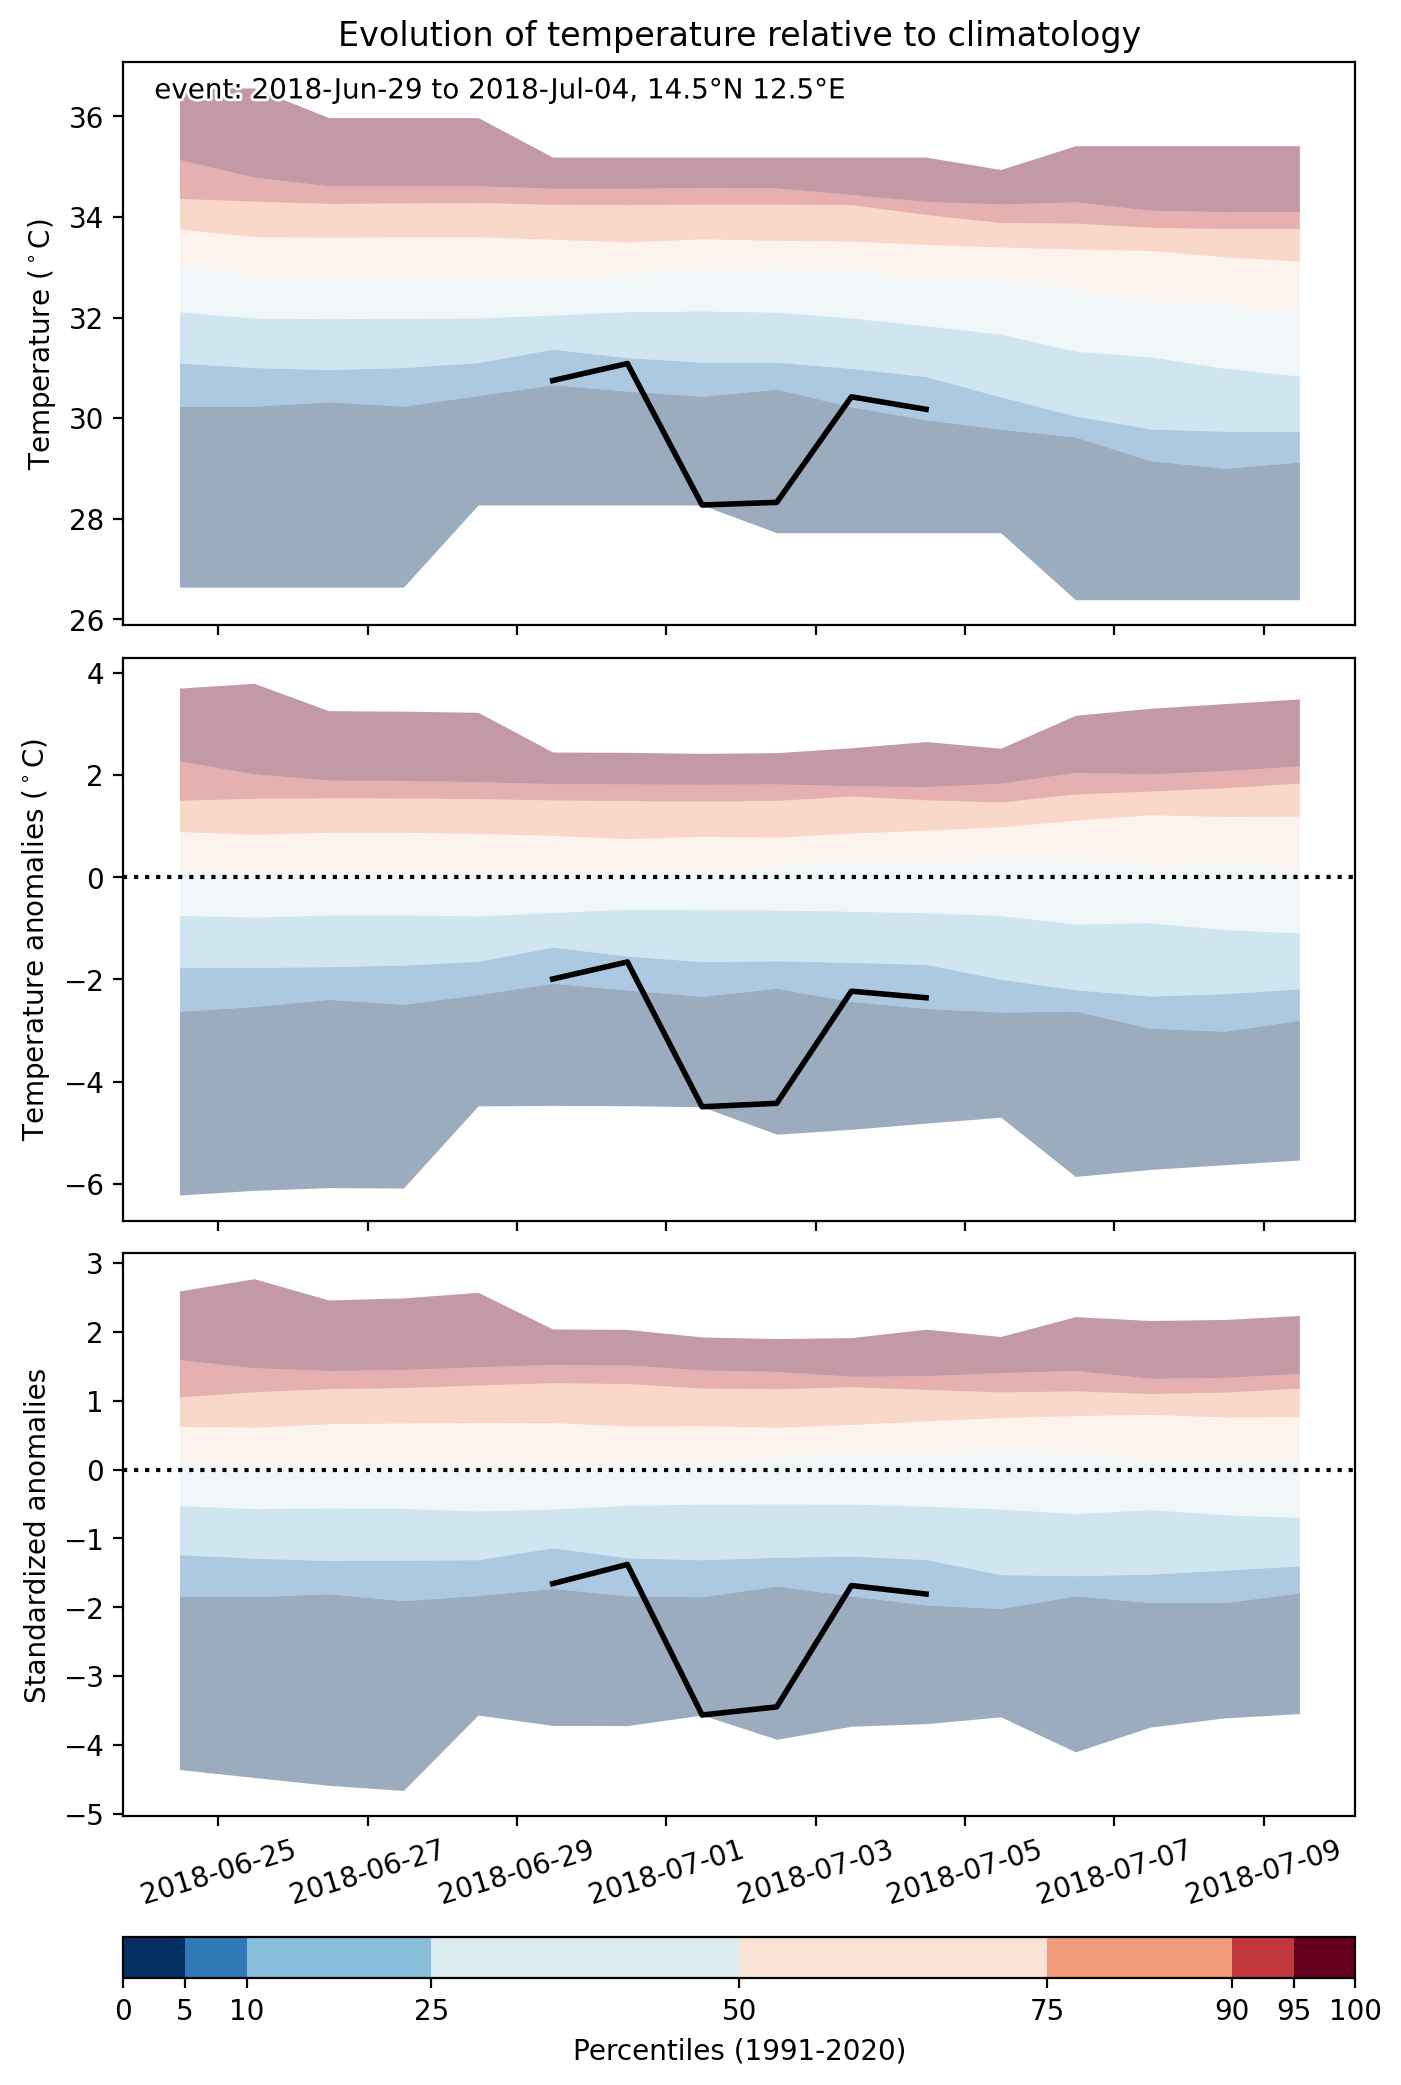
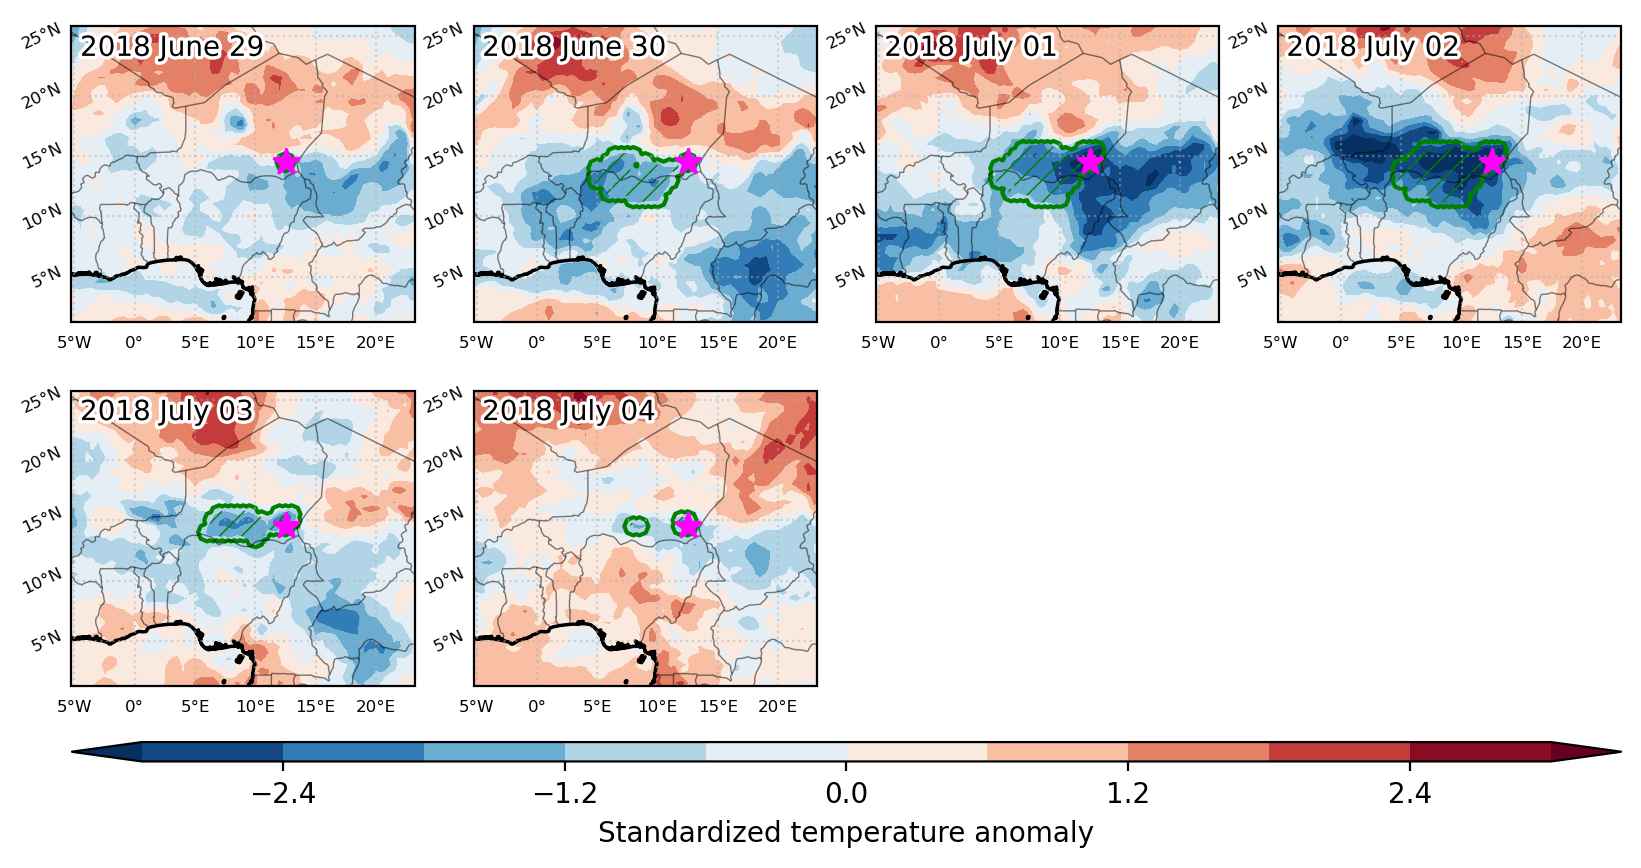
Cold spell occuring from June 29 2018 to July 04 2018 at 14.5°N 12.5°E

Download data: JSON

Event type: Cold spell

Countries affected (identified with ArcGIS Online; provided only for geographical reference):

  • Niger
  • Nigeria

Duration: 6 days

Time span: June 29 2018 to July 04 2018

Statistics over entire affected area:

  • Mean temperature anomaly: -2.9 °C
  • Mean temperature: 27.5 °C
  • Minimum temperature anomaly: -5.3 °C
  • Minimum temperature: 23.7 °C

Event center: 14.5°N 12.5°E

Area affected: 288230 km$^2$


Fig. 1: Map of most extreme temperature anomalies (standardized) experienced during the event. The purple star indicates the center of the extreme event. Green hatching illustrates all areas under the effect of extremes at some time during the event.


Fig. 2: Evolution of temperature at the center of the event. The climatological percentile distribution is illustrated with color shadings.


Fig. 3: Maps illustrating the evolution of standardized temperature anomalies during the event.

Event ID: Cold_spell_2018-Jun-29_to_2018-Jul-04_12.5_14.5

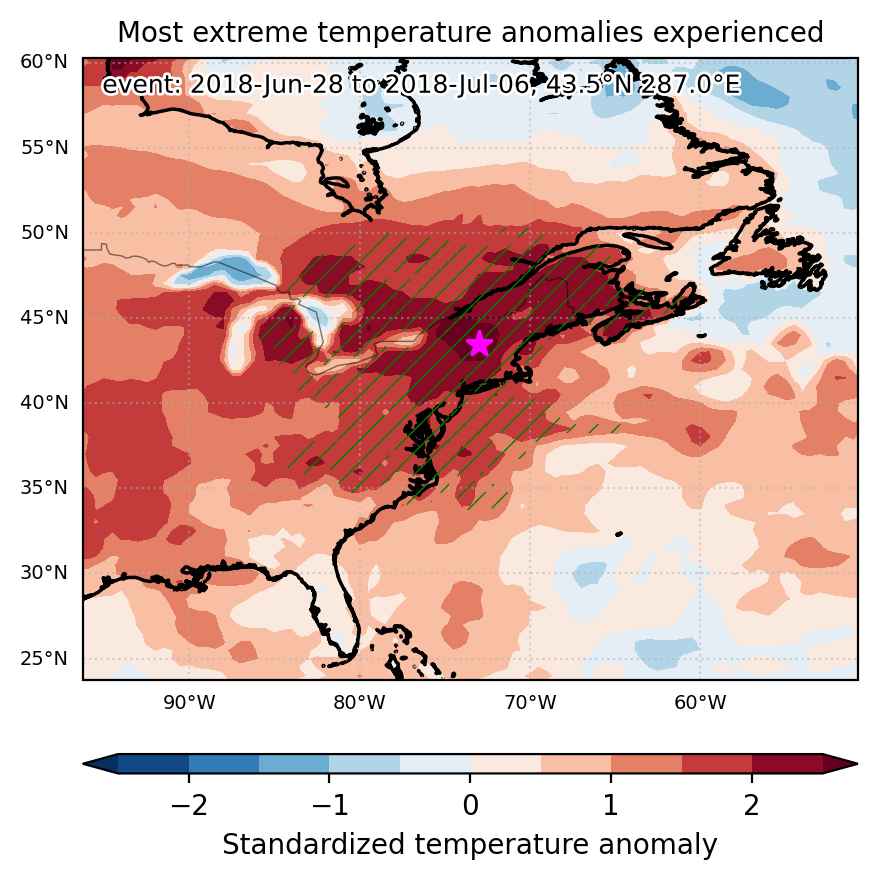
Heat wave occuring from June 28 2018 to July 06 2018 at 43.5°N 287.0°E

Download data: JSON

Event type: Heat wave

Countries affected (identified with ArcGIS Online; provided only for geographical reference):

  • Canada
  • United States

Duration: 9 days

Time span: June 28 2018 to July 06 2018

Statistics over entire affected area:

  • Mean temperature anomaly: 5.0 °C
  • Mean temperature: 25.6 °C
  • Maximum temperature anomaly: 11.9 °C
  • Maximum temperature: 31.5 °C

Event center: 43.5°N 287.0°E

Area affected: 1871502 km$^2$


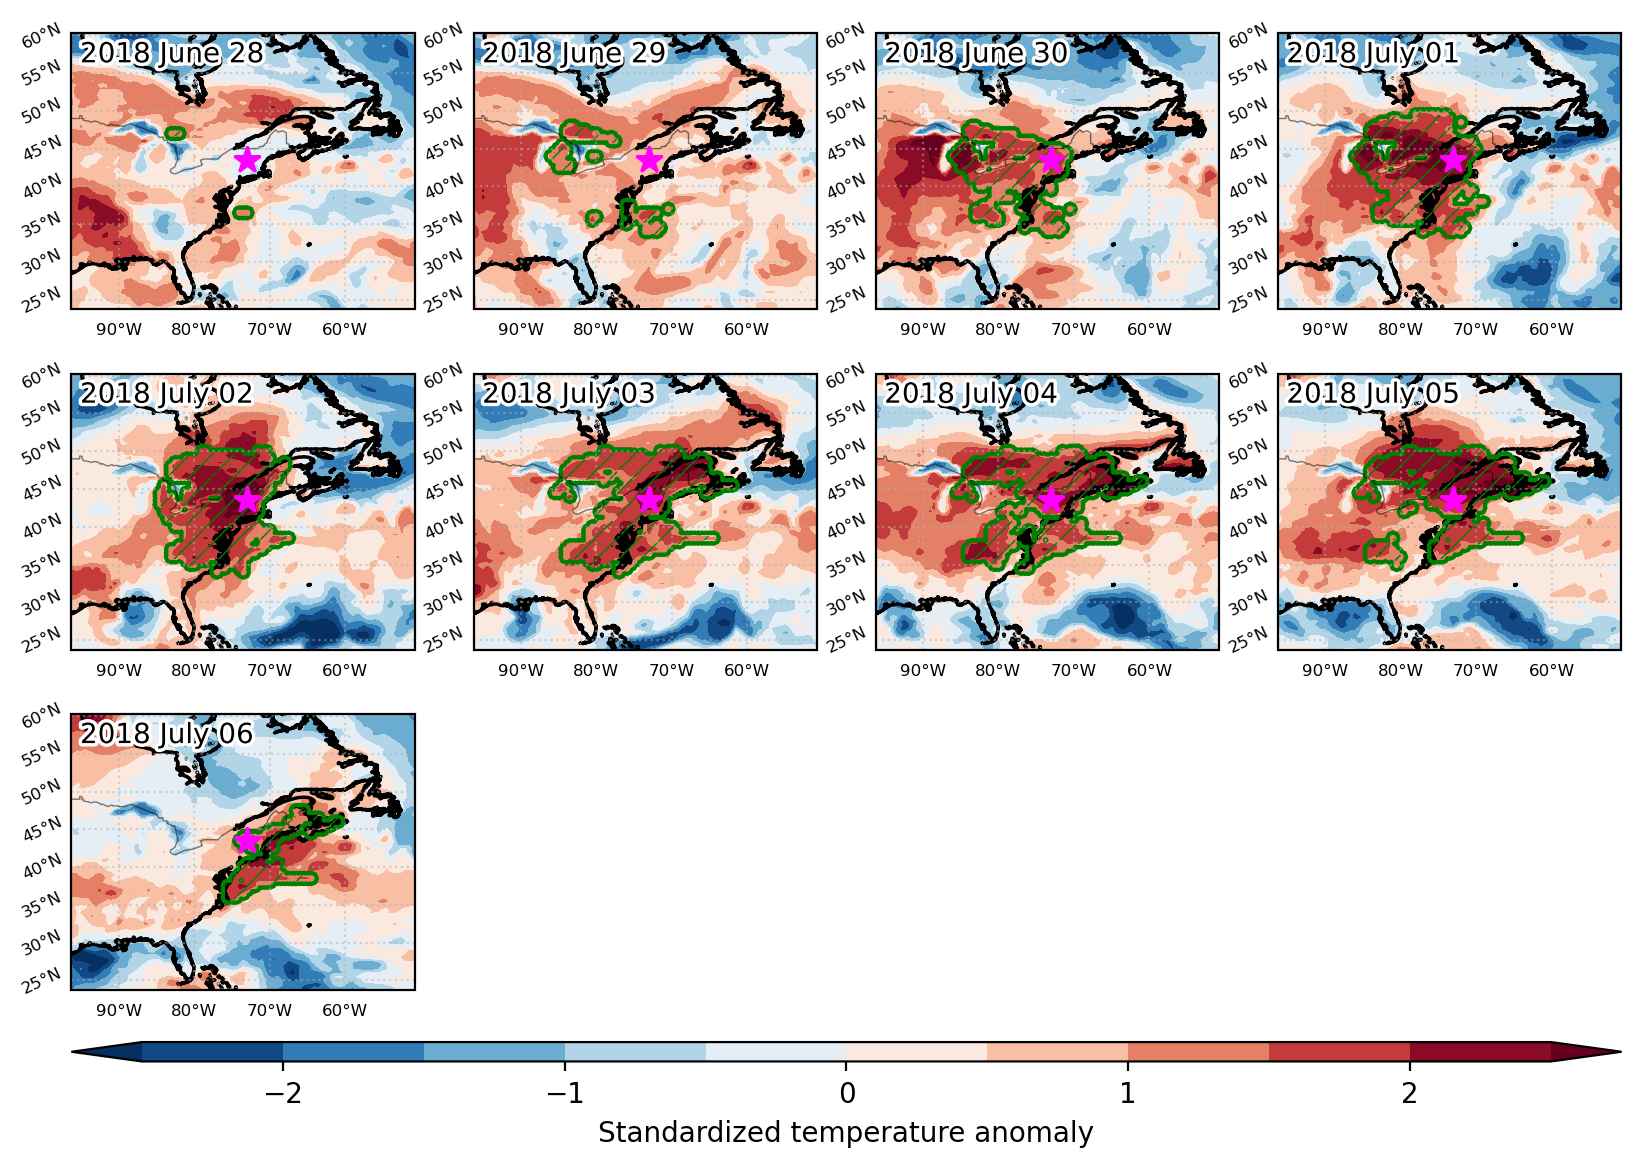
Fig. 1: Map of most extreme temperature anomalies (standardized) experienced during the event. The purple star indicates the center of the extreme event. Green hatching illustrates all areas under the effect of extremes at some time during the event.


Fig. 2: Evolution of temperature at the center of the event. The climatological percentile distribution is illustrated with color shadings.


Fig. 3: Maps illustrating the evolution of standardized temperature anomalies during the event.

Event ID: Heat_wave_2018-Jun-28_to_2018-Jul-06_287.0_43.5

Heat wave occuring from June 28 2018 to July 04 2018 at 15.5°N 122.5°E

Download data: JSON

Event type: Heat wave

Countries affected (identified with ArcGIS Online; provided only for geographical reference):

  • Philippines

Duration: 7 days

Time span: June 28 2018 to July 04 2018

Statistics over entire affected area:

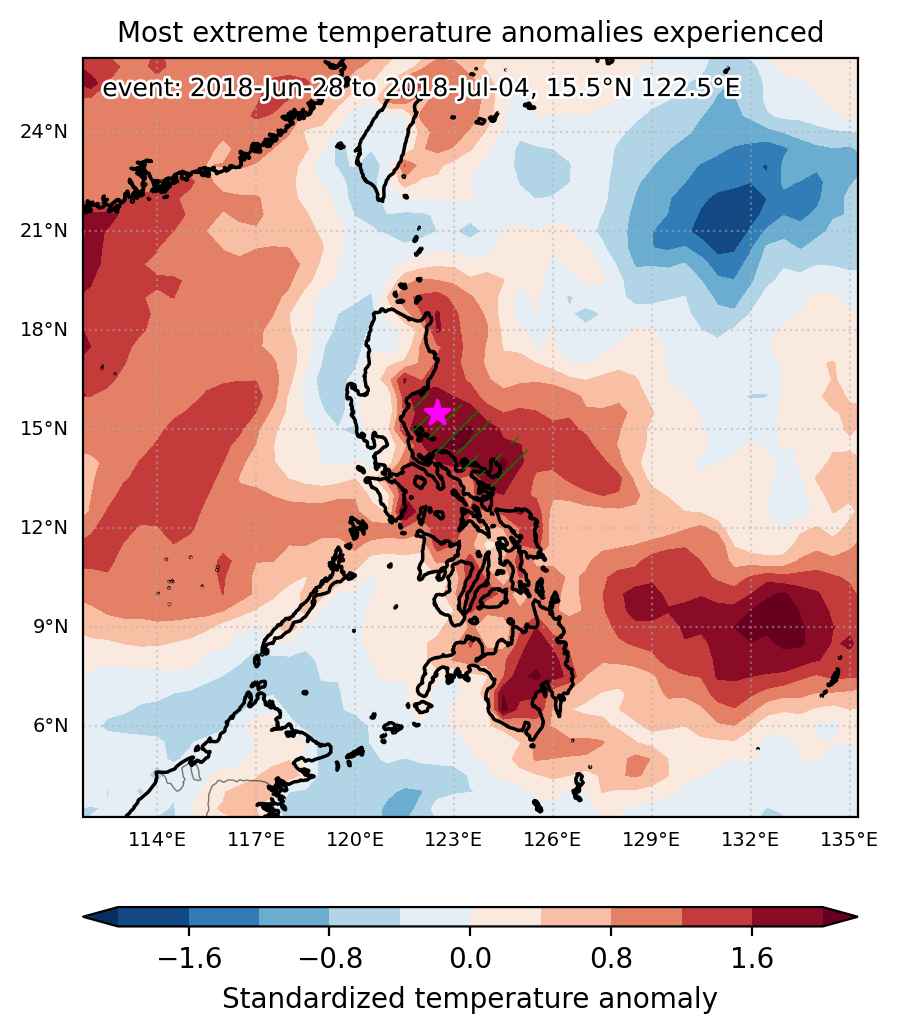
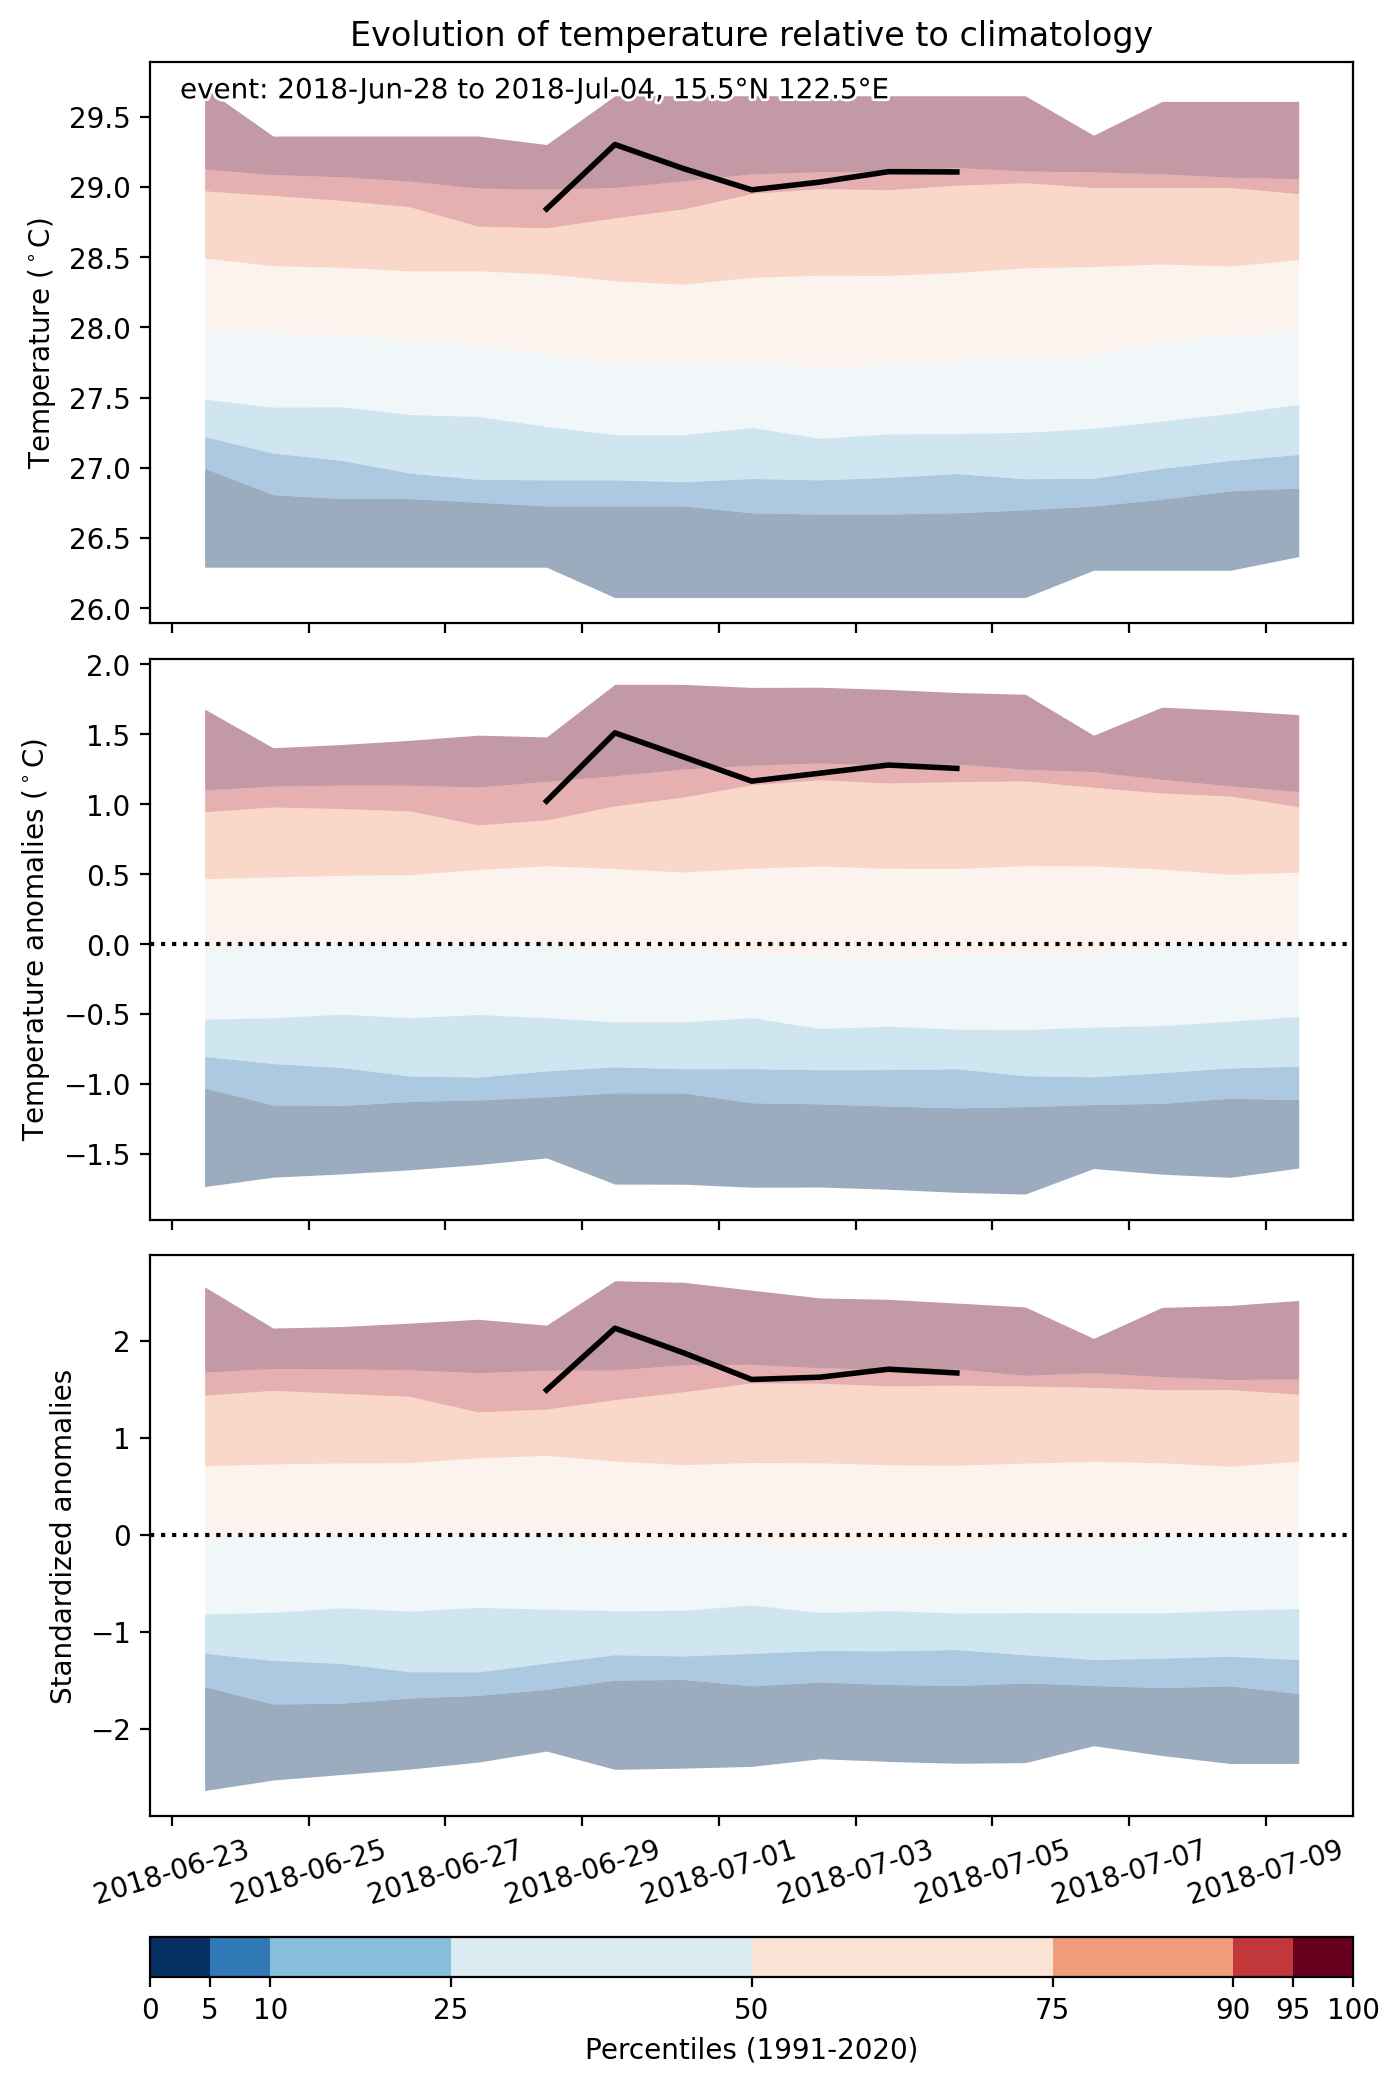
  • Mean temperature anomaly: 1.2 °C
  • Mean temperature: 28.9 °C
  • Maximum temperature anomaly: 1.7 °C
  • Maximum temperature: 29.5 °C

Event center: 15.5°N 122.5°E

Area affected: 56794 km$^2$


Fig. 1: Map of most extreme temperature anomalies (standardized) experienced during the event. The purple star indicates the center of the extreme event. Green hatching illustrates all areas under the effect of extremes at some time during the event.


Fig. 2: Evolution of temperature at the center of the event. The climatological percentile distribution is illustrated with color shadings.


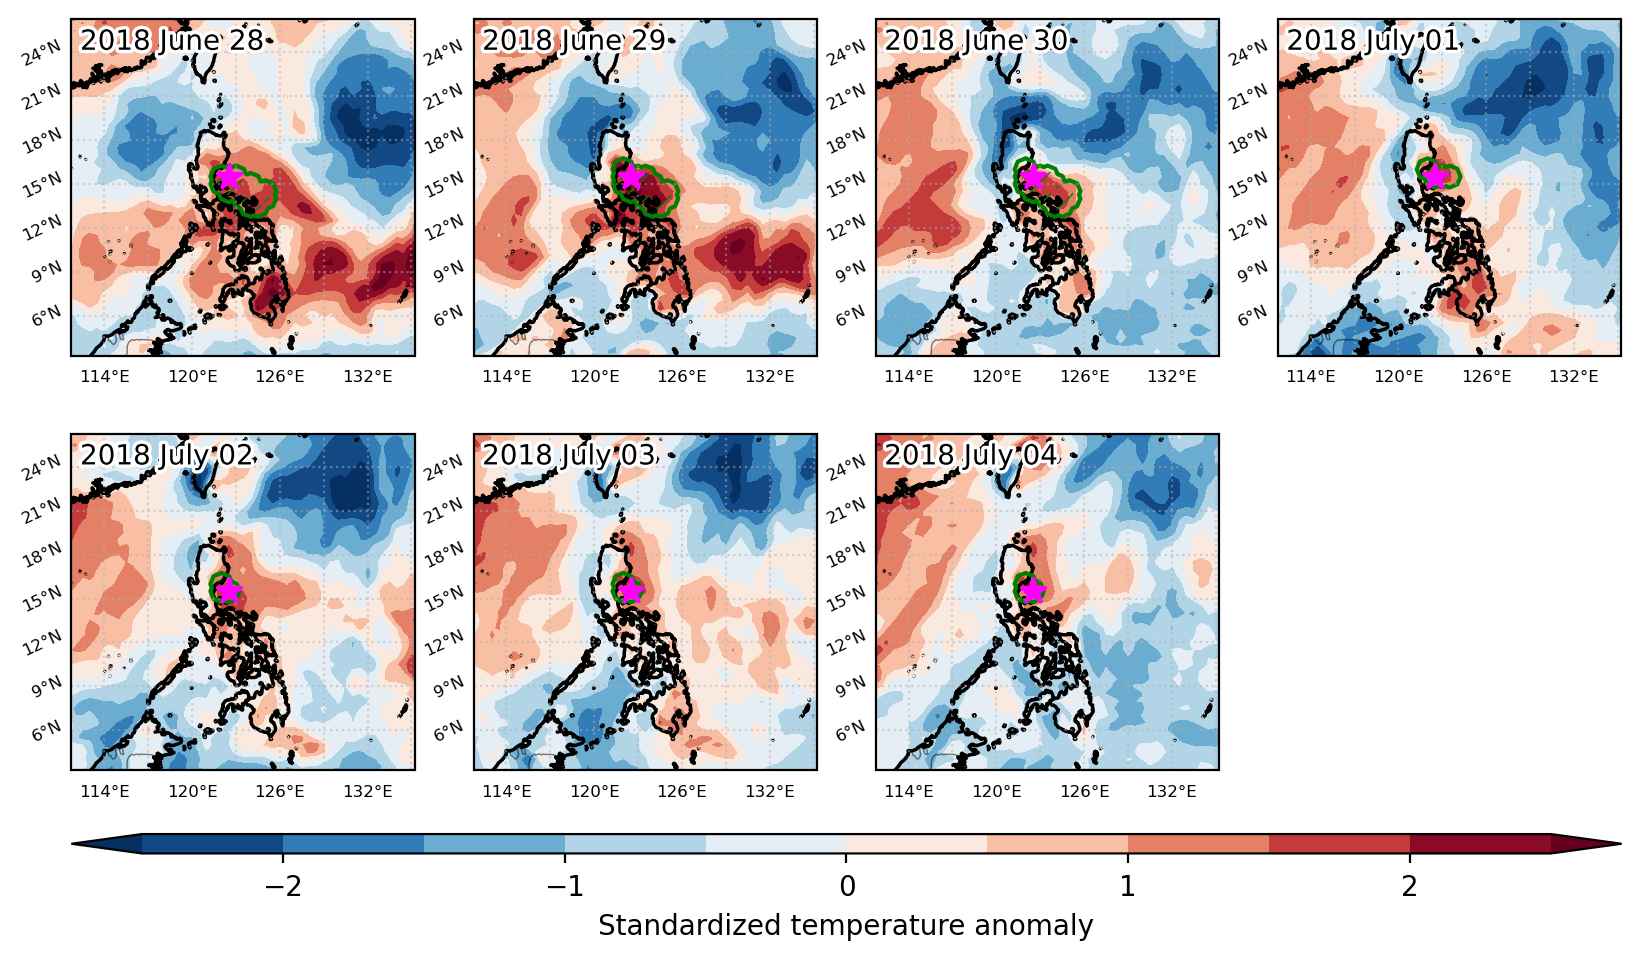
Fig. 3: Maps illustrating the evolution of standardized temperature anomalies during the event.

Event ID: Heat_wave_2018-Jun-28_to_2018-Jul-04_122.5_15.5

Heat wave occuring from June 28 2018 to July 02 2018 at -25.0°S 157.5°E

Download data: JSON

Event type: Heat wave

Countries affected (identified with ArcGIS Online; provided only for geographical reference):

  • Australia

Duration: 5 days

Time span: June 28 2018 to July 02 2018

Statistics over entire affected area:

  • Mean temperature anomaly: 1.6 °C
  • Mean temperature: 21.7 °C
  • Maximum temperature anomaly: 4.2 °C
  • Maximum temperature: 23.5 °C

Event center: -25.0°S 157.5°E

Area affected: 522240 km$^2$


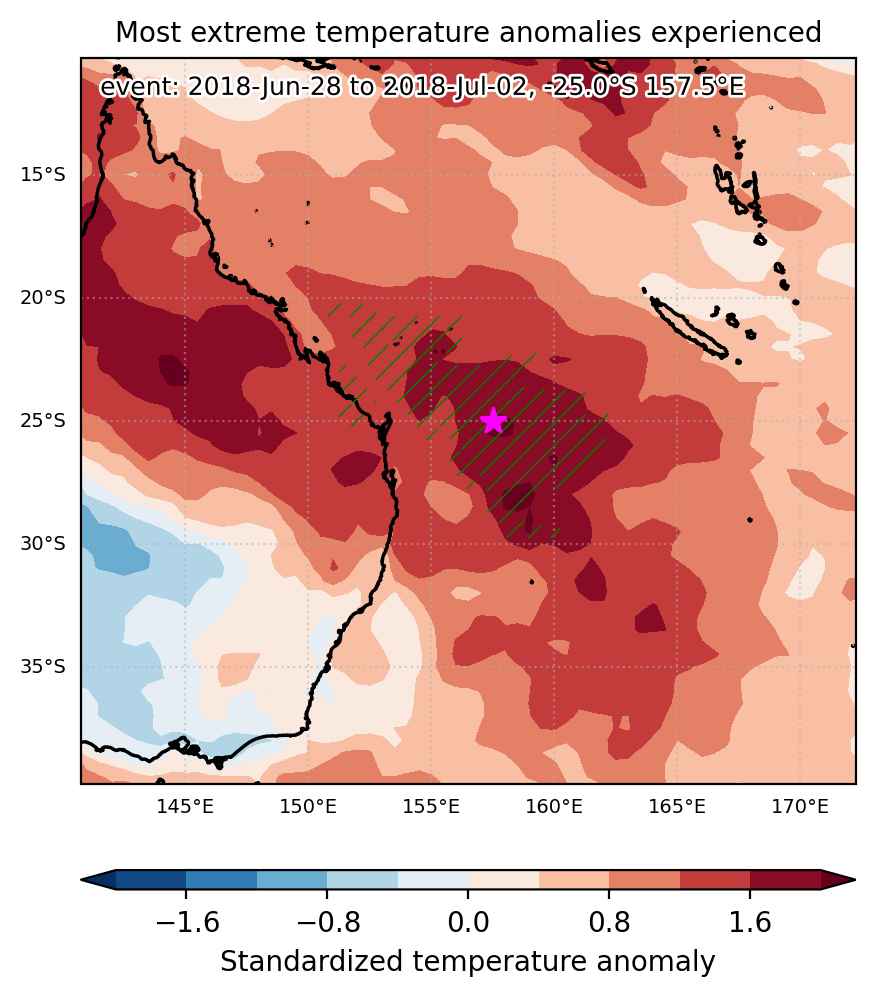
Fig. 1: Map of most extreme temperature anomalies (standardized) experienced during the event. The purple star indicates the center of the extreme event. Green hatching illustrates all areas under the effect of extremes at some time during the event.


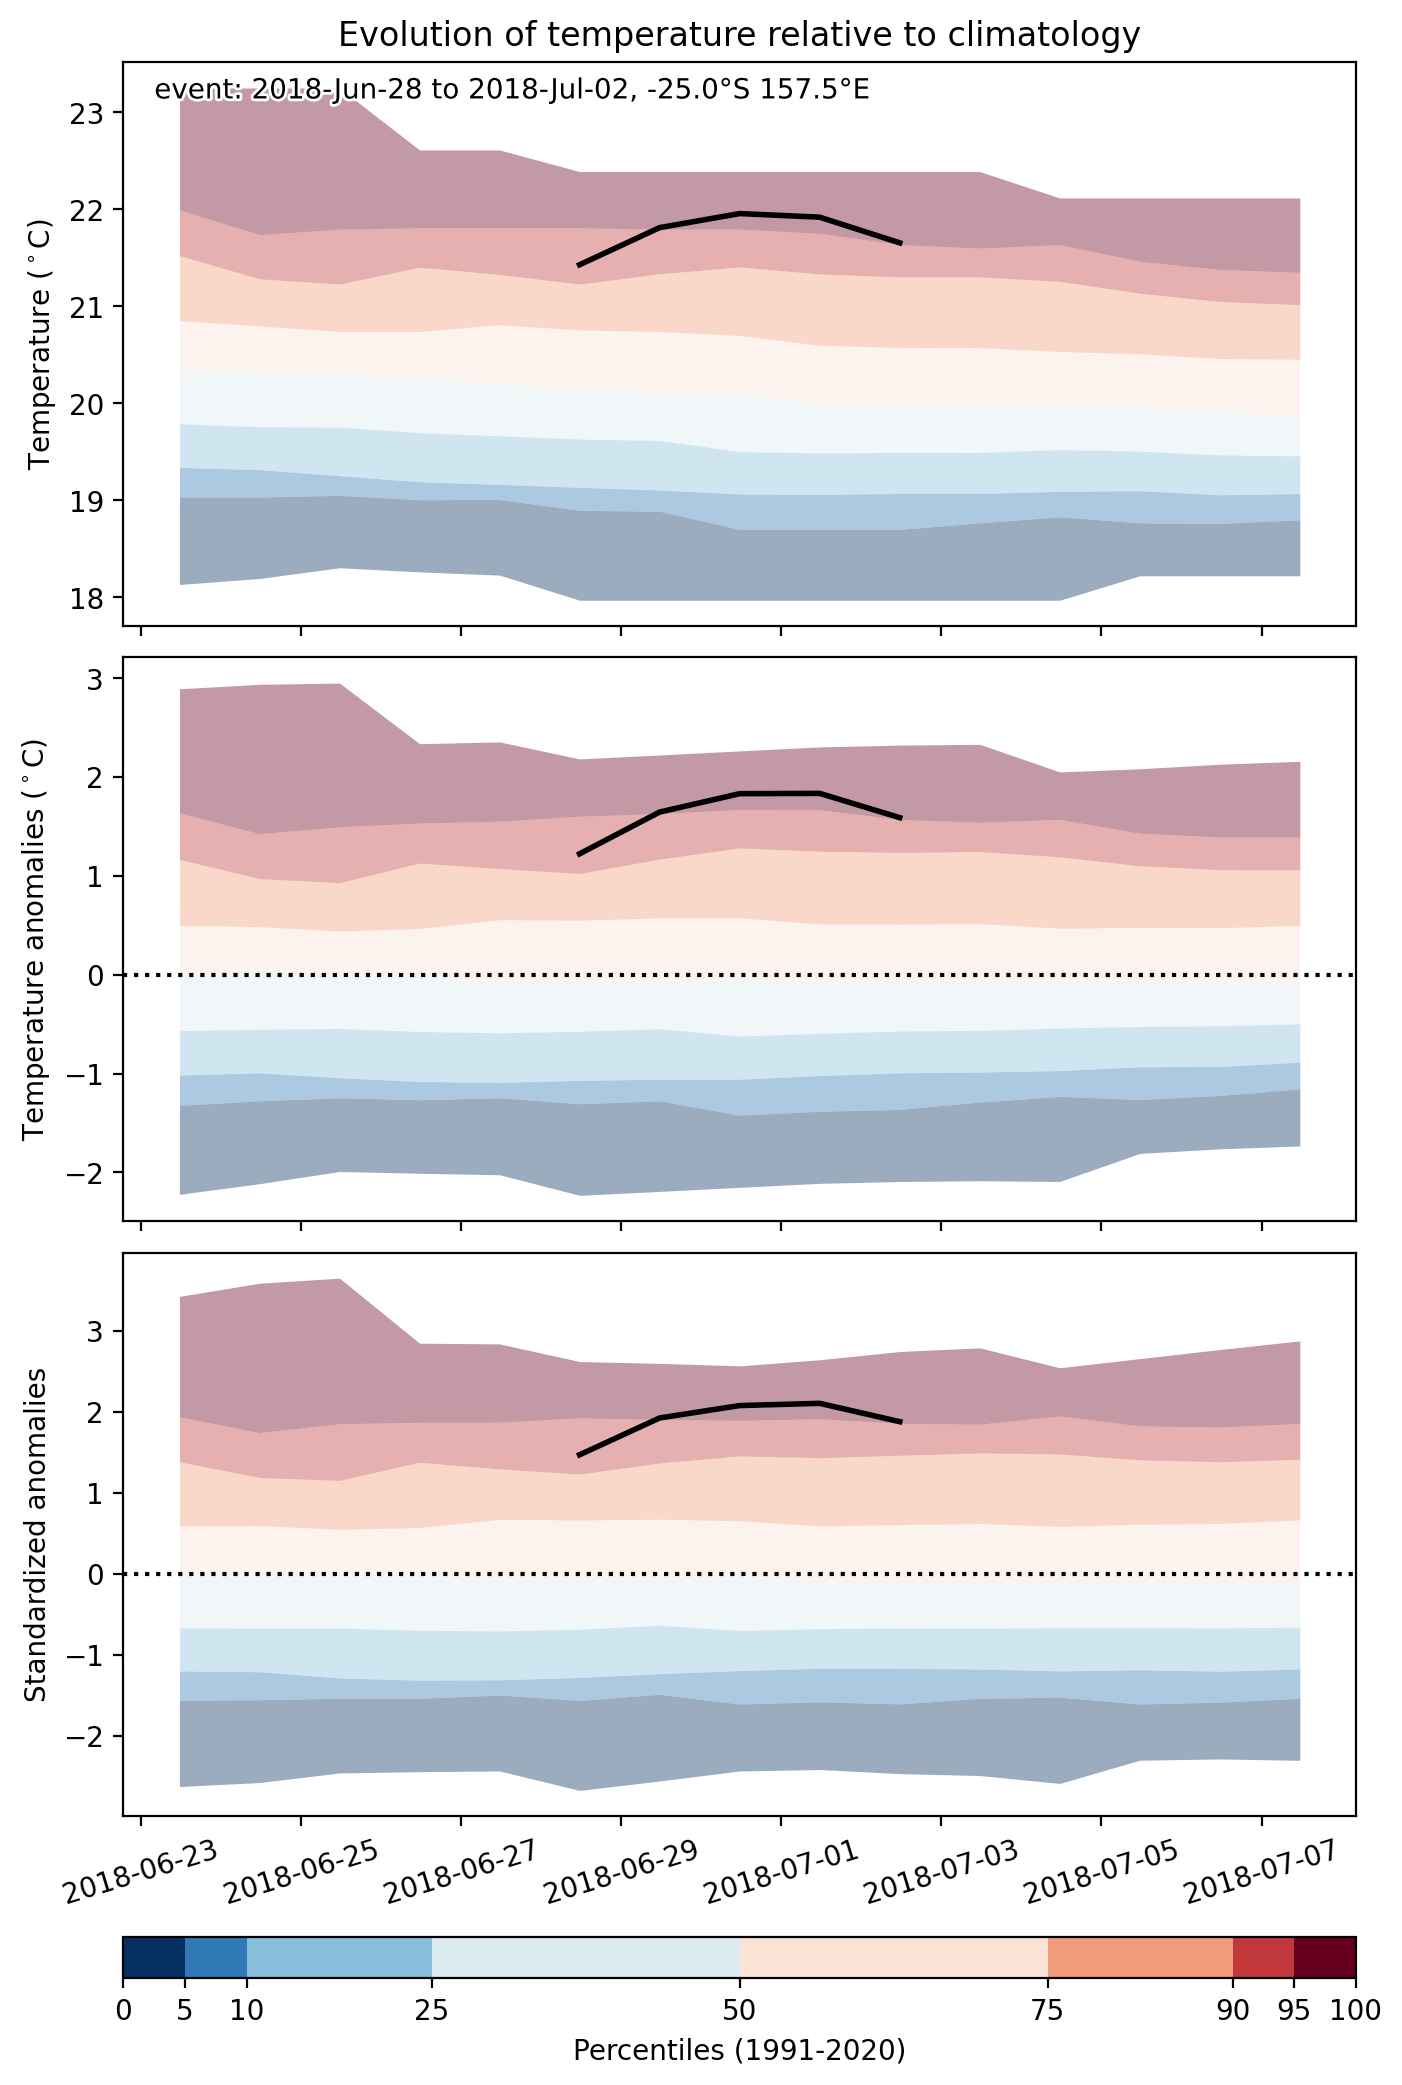
Fig. 2: Evolution of temperature at the center of the event. The climatological percentile distribution is illustrated with color shadings.


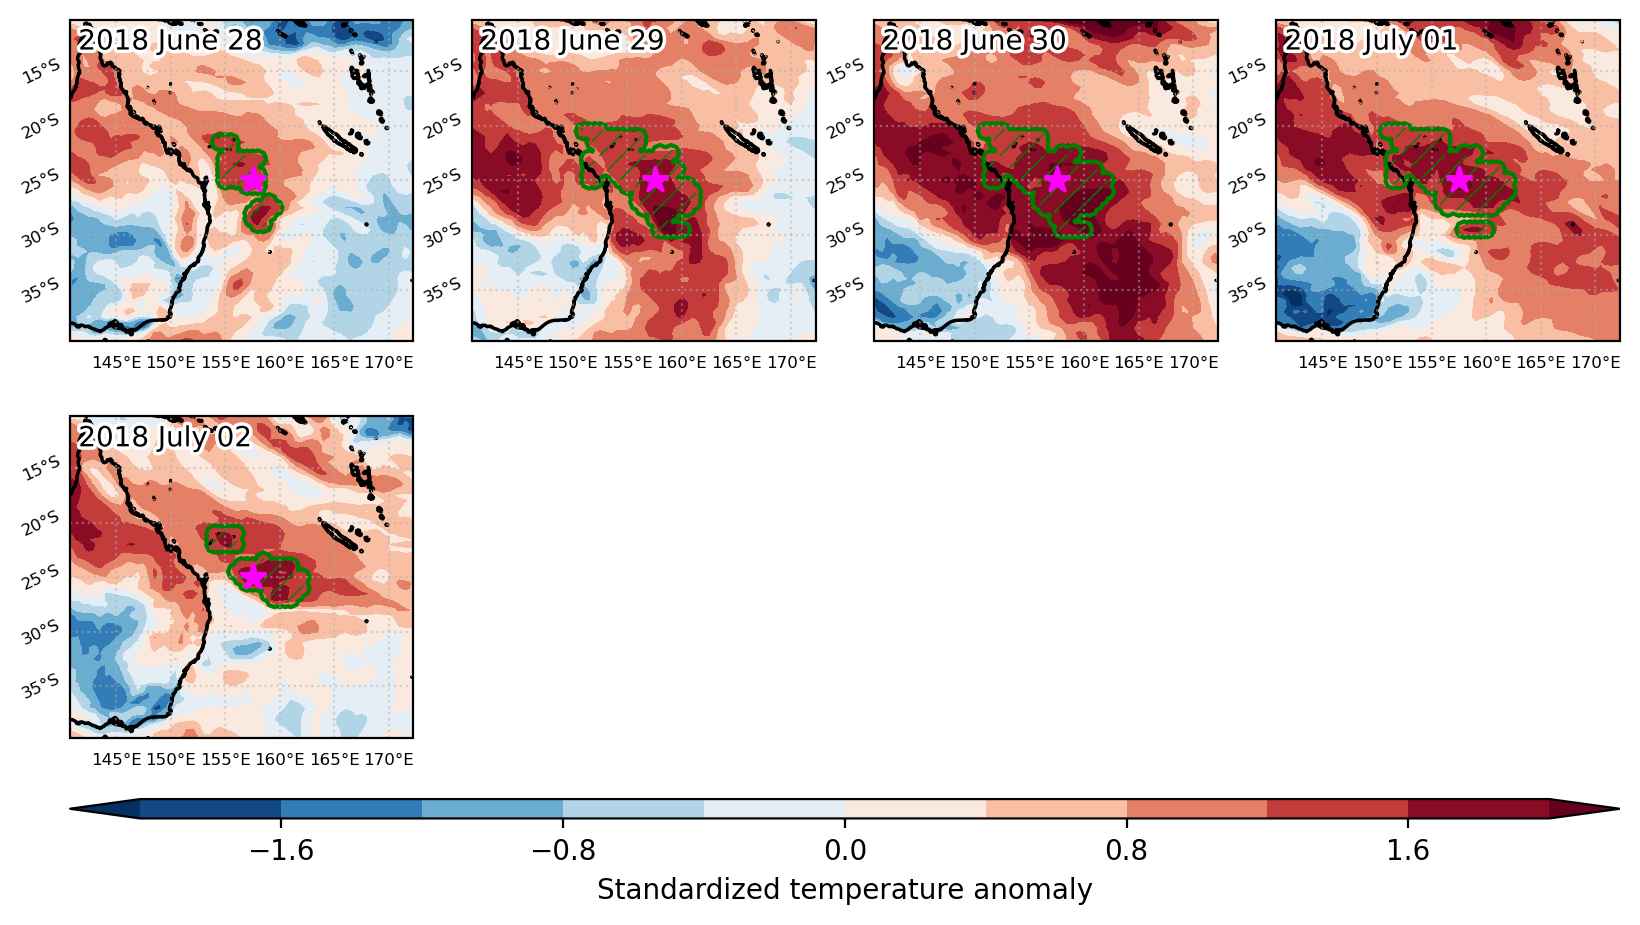
Fig. 3: Maps illustrating the evolution of standardized temperature anomalies during the event.

Event ID: Heat_wave_2018-Jun-28_to_2018-Jul-02_157.5_-25.0

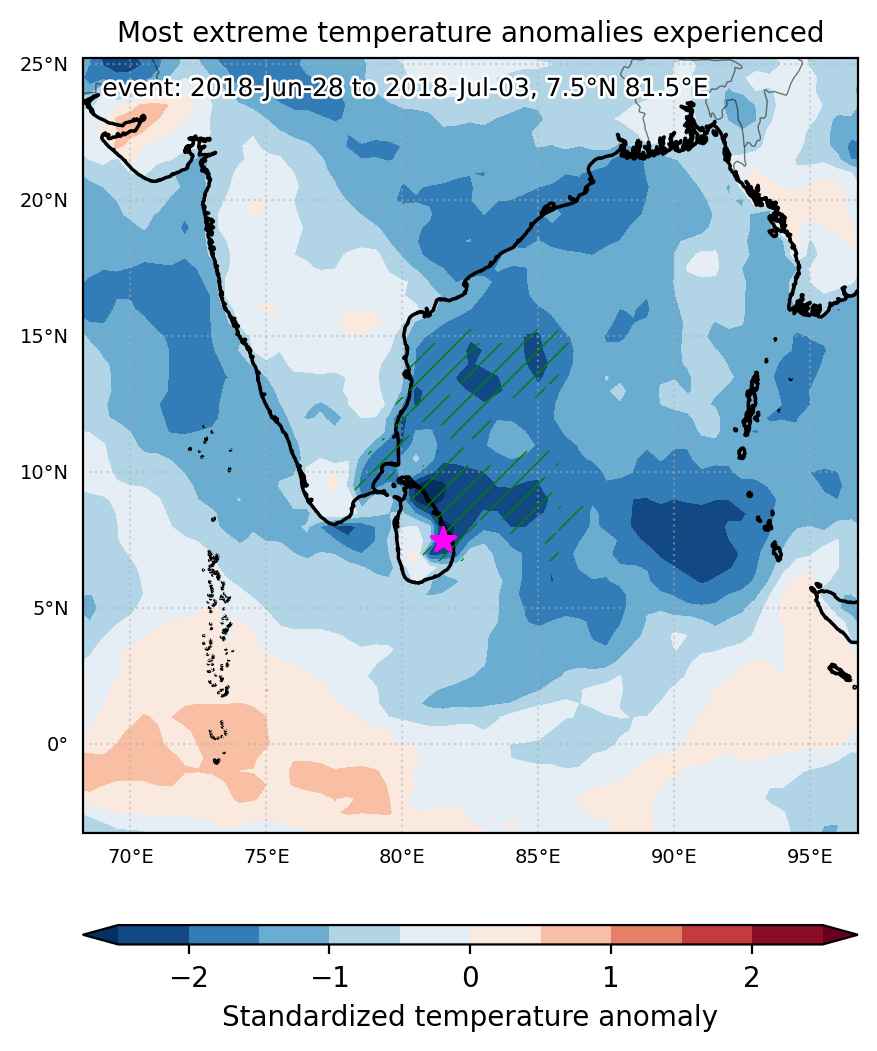
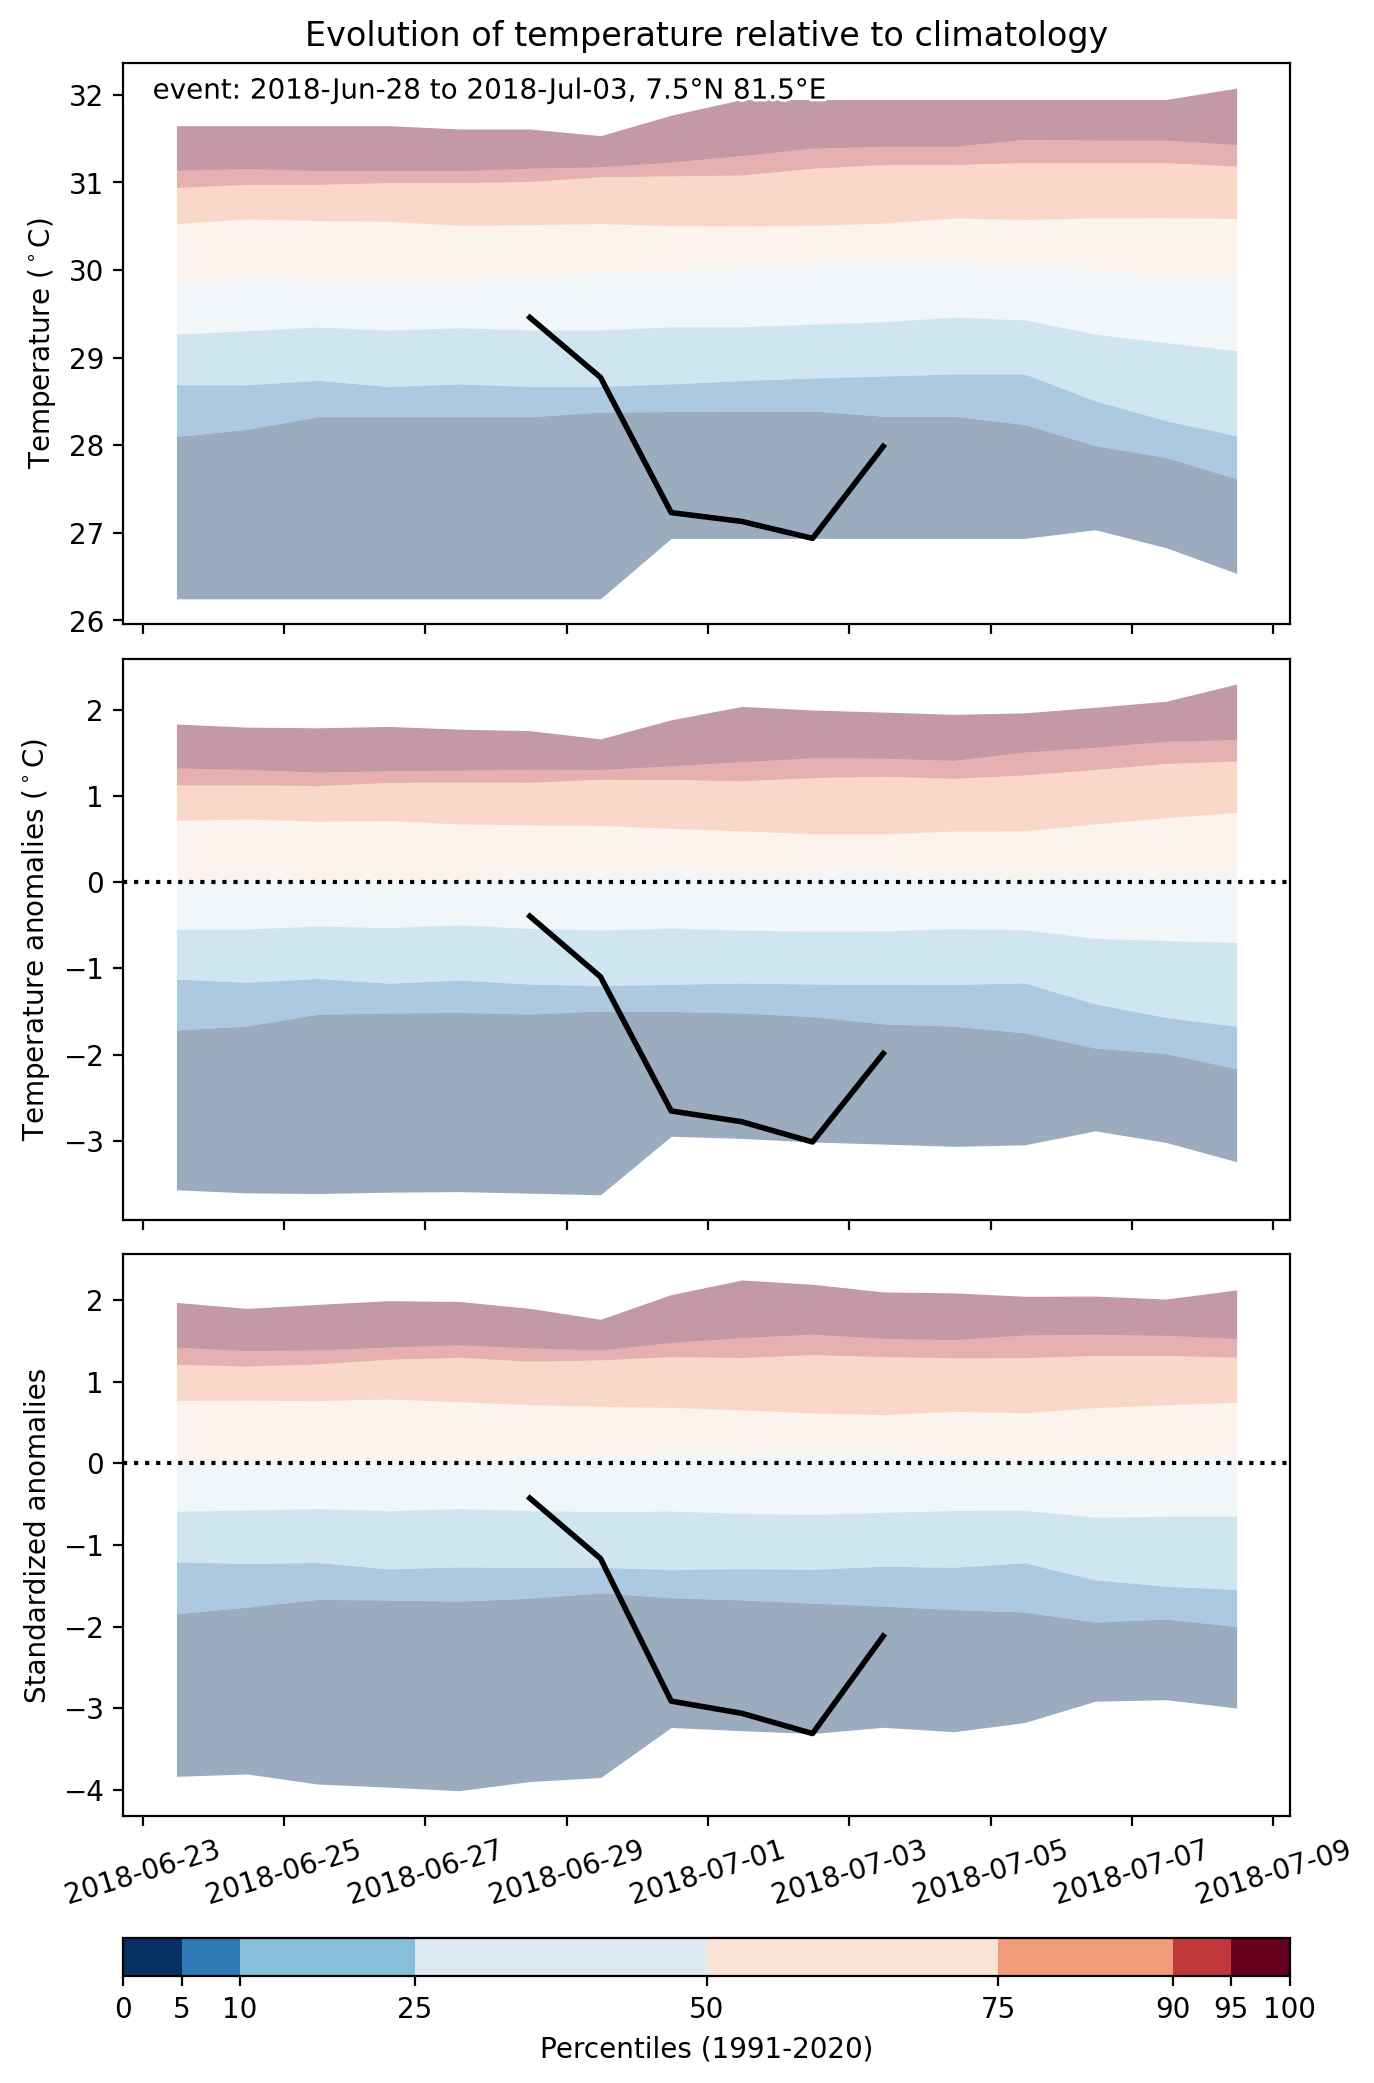
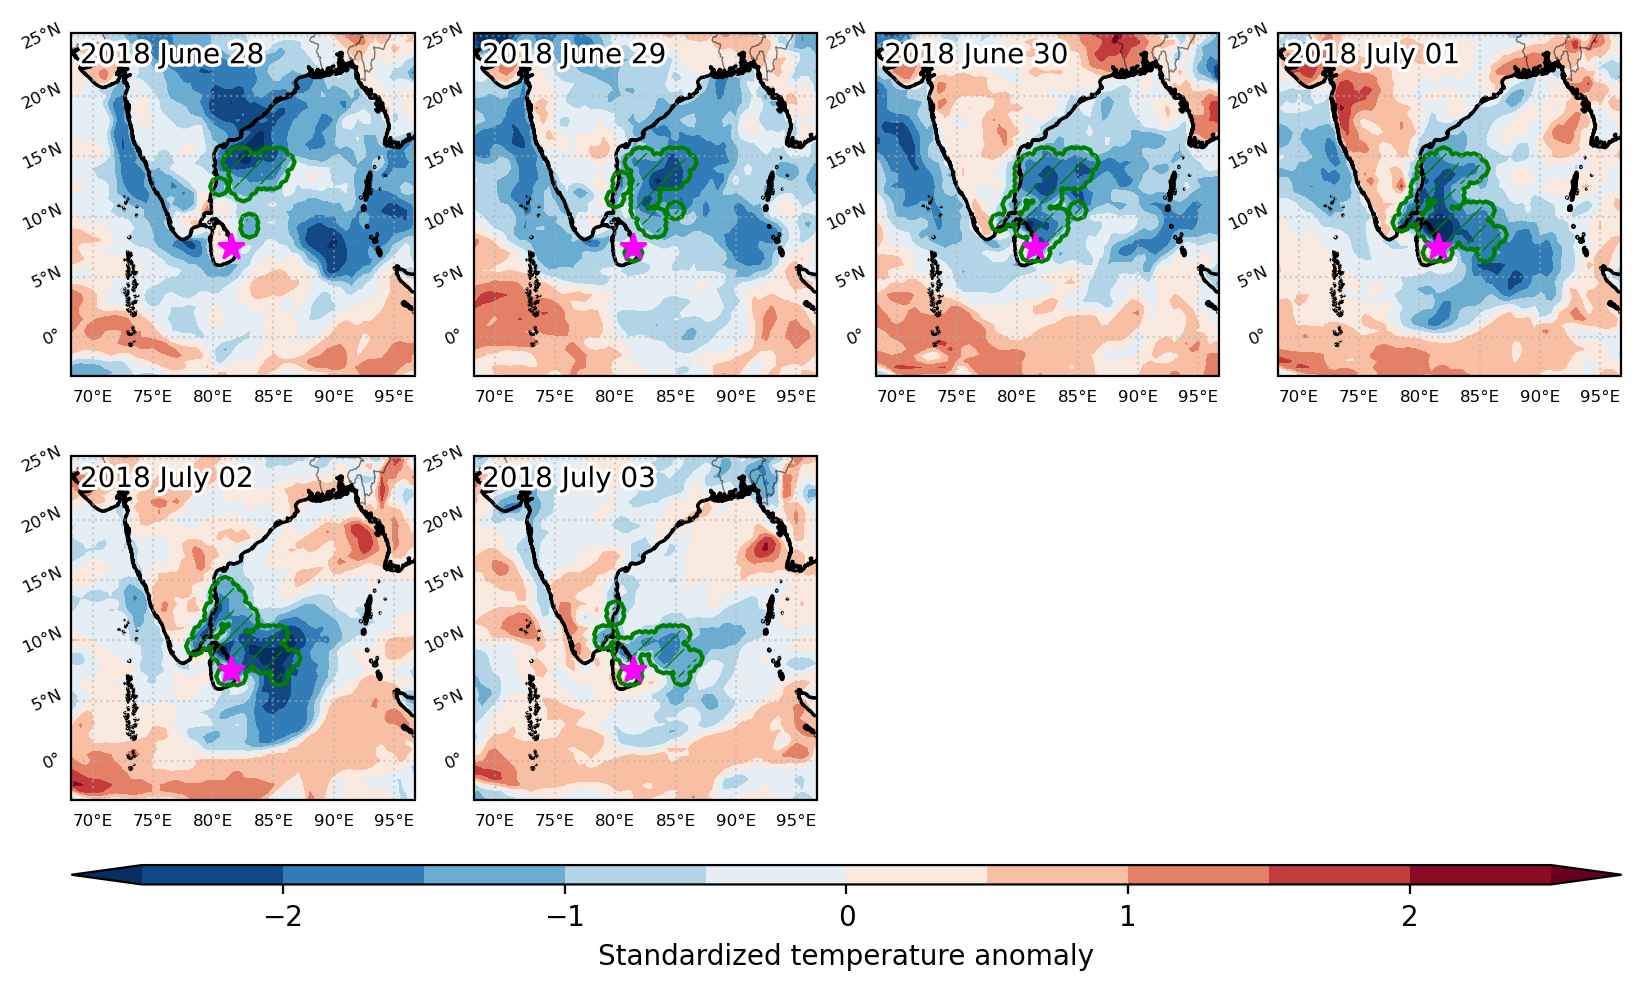
Cold spell occuring from June 28 2018 to July 03 2018 at 7.5°N 81.5°E

Download data: JSON

Event type: Cold spell

Countries affected (identified with ArcGIS Online; provided only for geographical reference):

  • India
  • Sri Lanka

Duration: 6 days

Time span: June 28 2018 to July 03 2018

Statistics over entire affected area:

  • Mean temperature anomaly: -1.0 °C
  • Mean temperature: 28.0 °C
  • Minimum temperature anomaly: -3.0 °C
  • Minimum temperature: 23.3 °C

Event center: 7.5°N 81.5°E

Area affected: 399872 km$^2$


Fig. 1: Map of most extreme temperature anomalies (standardized) experienced during the event. The purple star indicates the center of the extreme event. Green hatching illustrates all areas under the effect of extremes at some time during the event.


Fig. 2: Evolution of temperature at the center of the event. The climatological percentile distribution is illustrated with color shadings.


Fig. 3: Maps illustrating the evolution of standardized temperature anomalies during the event.

Event ID: Cold_spell_2018-Jun-28_to_2018-Jul-03_81.5_7.5

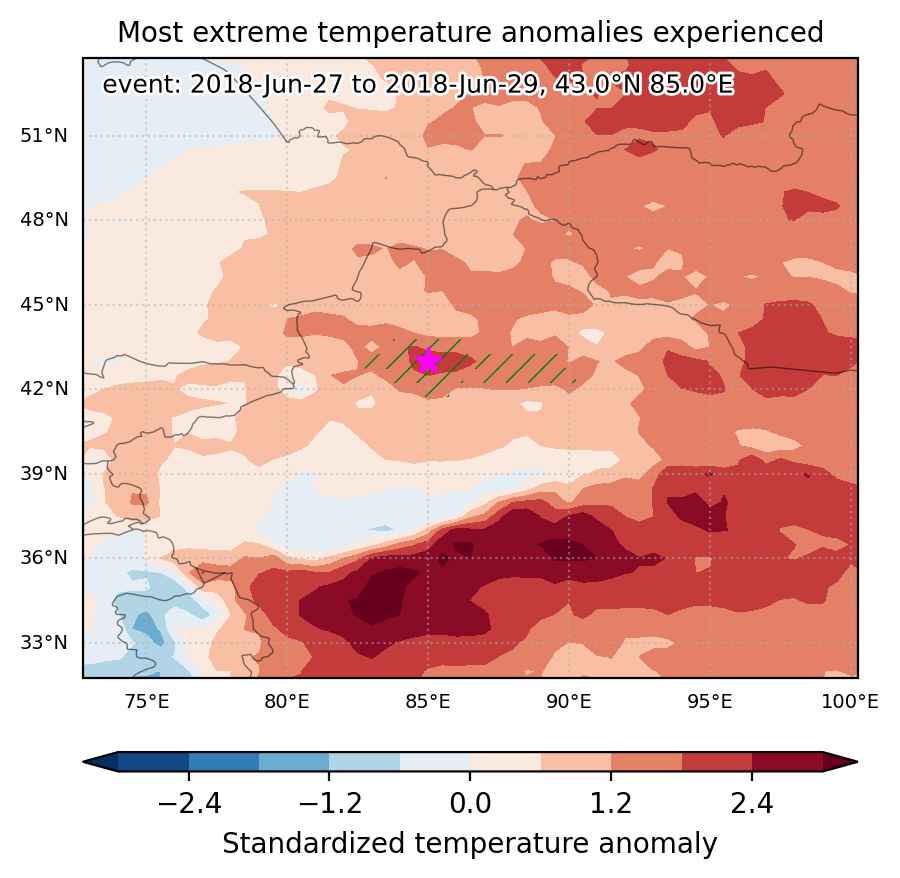
Heat wave occuring from June 27 2018 to June 29 2018 at 43.0°N 85.0°E

Download data: JSON

Event type: Heat wave

Countries affected (identified with ArcGIS Online; provided only for geographical reference):

  • China

Duration: 3 days

Time span: June 27 2018 to June 29 2018

Statistics over entire affected area:

  • Mean temperature anomaly: 3.7 °C
  • Mean temperature: 18.4 °C
  • Maximum temperature anomaly: 4.8 °C
  • Maximum temperature: 35.7 °C

Event center: 43.0°N 85.0°E

Area affected: 74802 km$^2$


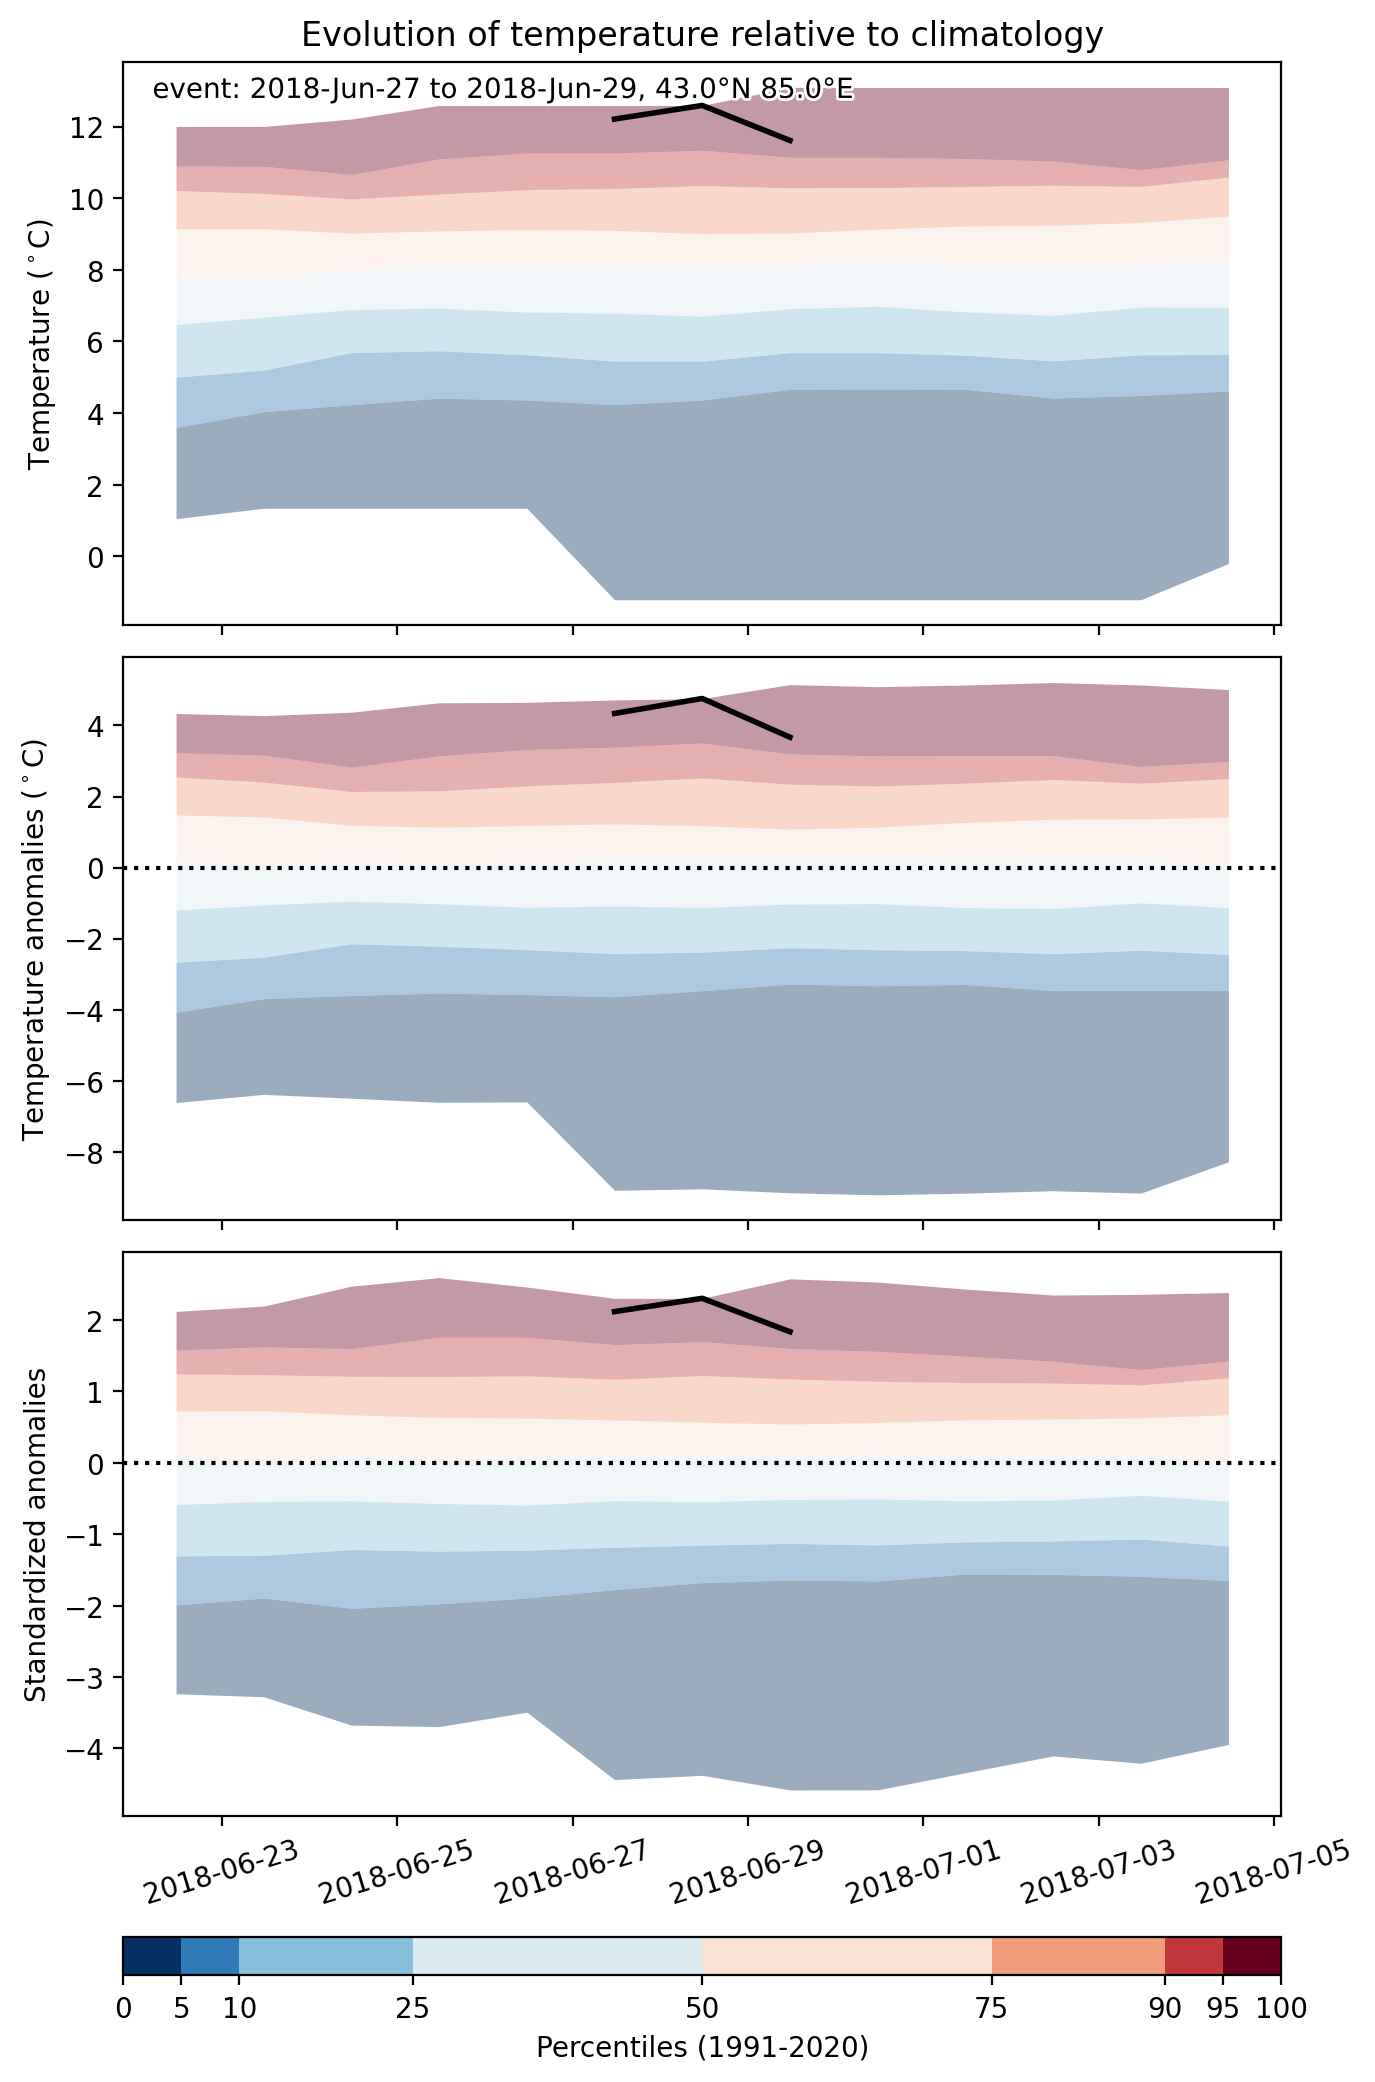
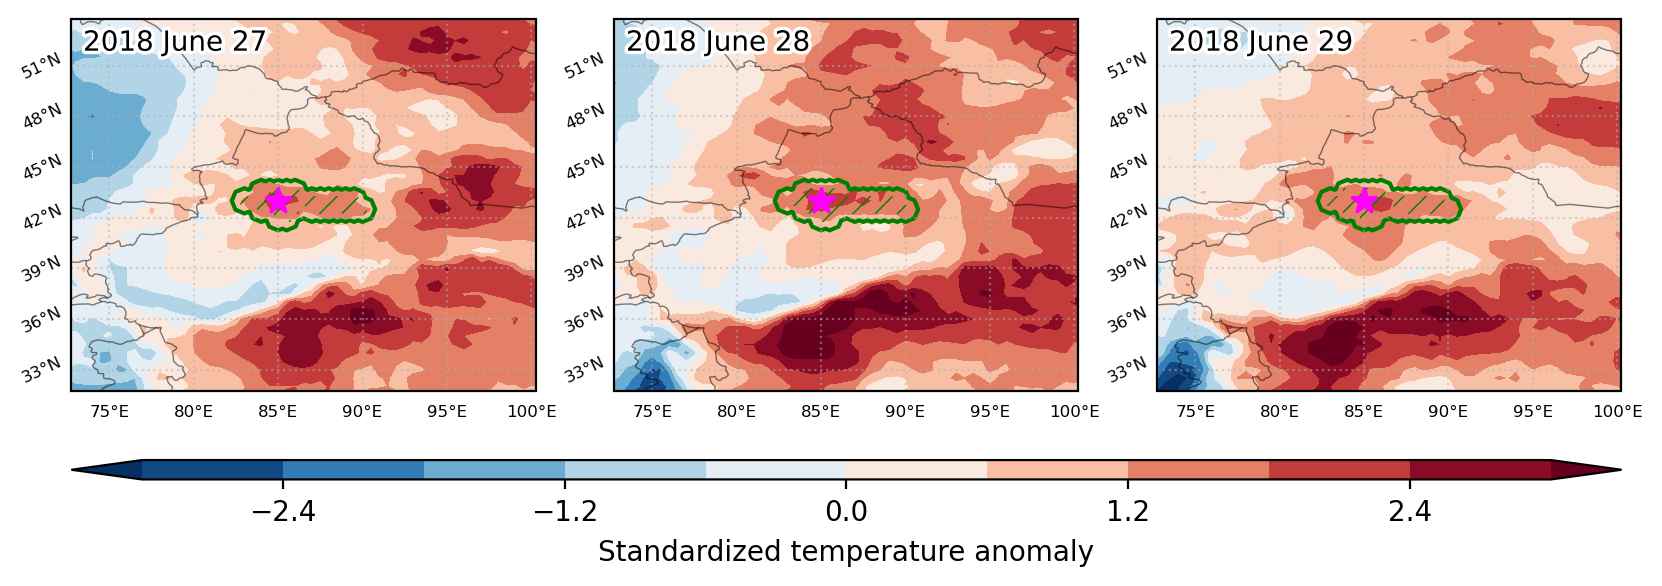
Fig. 1: Map of most extreme temperature anomalies (standardized) experienced during the event. The purple star indicates the center of the extreme event. Green hatching illustrates all areas under the effect of extremes at some time during the event.


Fig. 2: Evolution of temperature at the center of the event. The climatological percentile distribution is illustrated with color shadings.


Fig. 3: Maps illustrating the evolution of standardized temperature anomalies during the event.

Event ID: Heat_wave_2018-Jun-27_to_2018-Jun-29_85.0_43.0