Cold spell occuring from January 20 2018 to March 12 2018 at 8.5°N 345.0°E

Download data: JSON

Event type: Cold spell

Countries affected (identified with ArcGIS Online; provided only for geographical reference):

  • Algeria
  • Andorra
  • Burkina Faso
  • Cabo Verde
  • Canarias
  • Côte d’Ivoire
  • France
  • Gambia
  • Guinea
  • Guinea-Bissau
  • Liberia
  • Libya
  • Mali
  • Mauritania
  • Morocco
  • Portugal
  • Senegal
  • Sierra Leone
  • Spain
  • Tunisia

Duration: 52 days

Time span: January 20 2018 to March 12 2018

Statistics over entire affected area:

  • Mean temperature anomaly: -2.7 °C
  • Mean temperature: 17.7 °C
  • Minimum temperature anomaly: -10.7 °C
  • Minimum temperature: -11.8 °C

Event center: 8.5°N 345.0°E

Area affected: 12994051 km$^2$
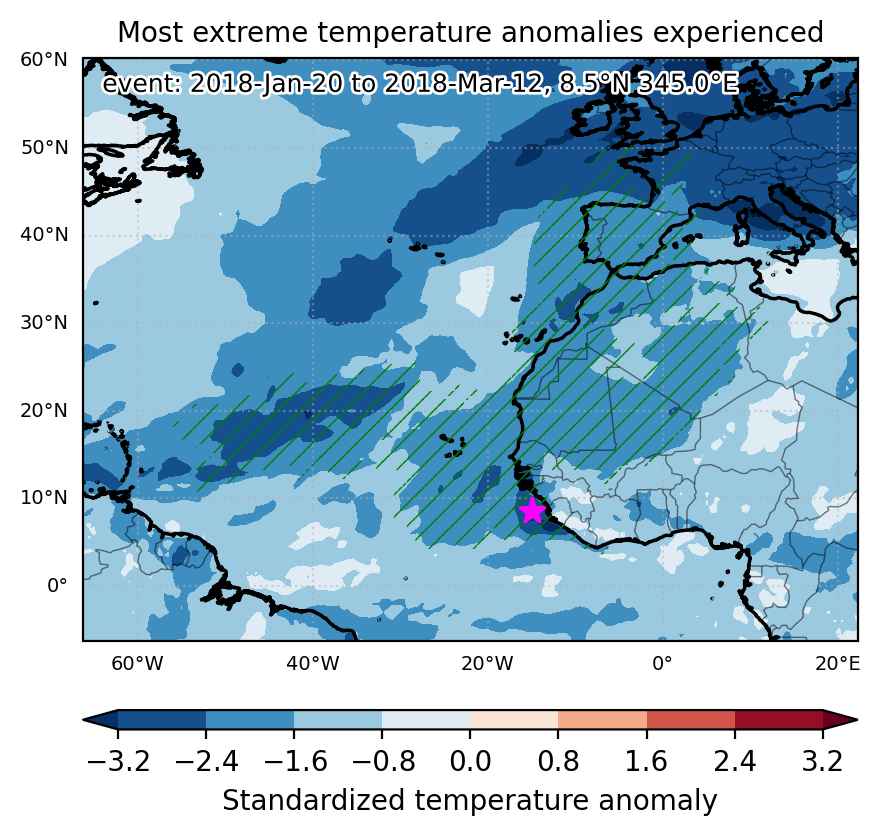

Fig. 1: Map of most extreme temperature anomalies (standardized) experienced during the event. The purple star indicates the center of the extreme event. Green hatching illustrates all areas under the effect of extremes at some time during the event.
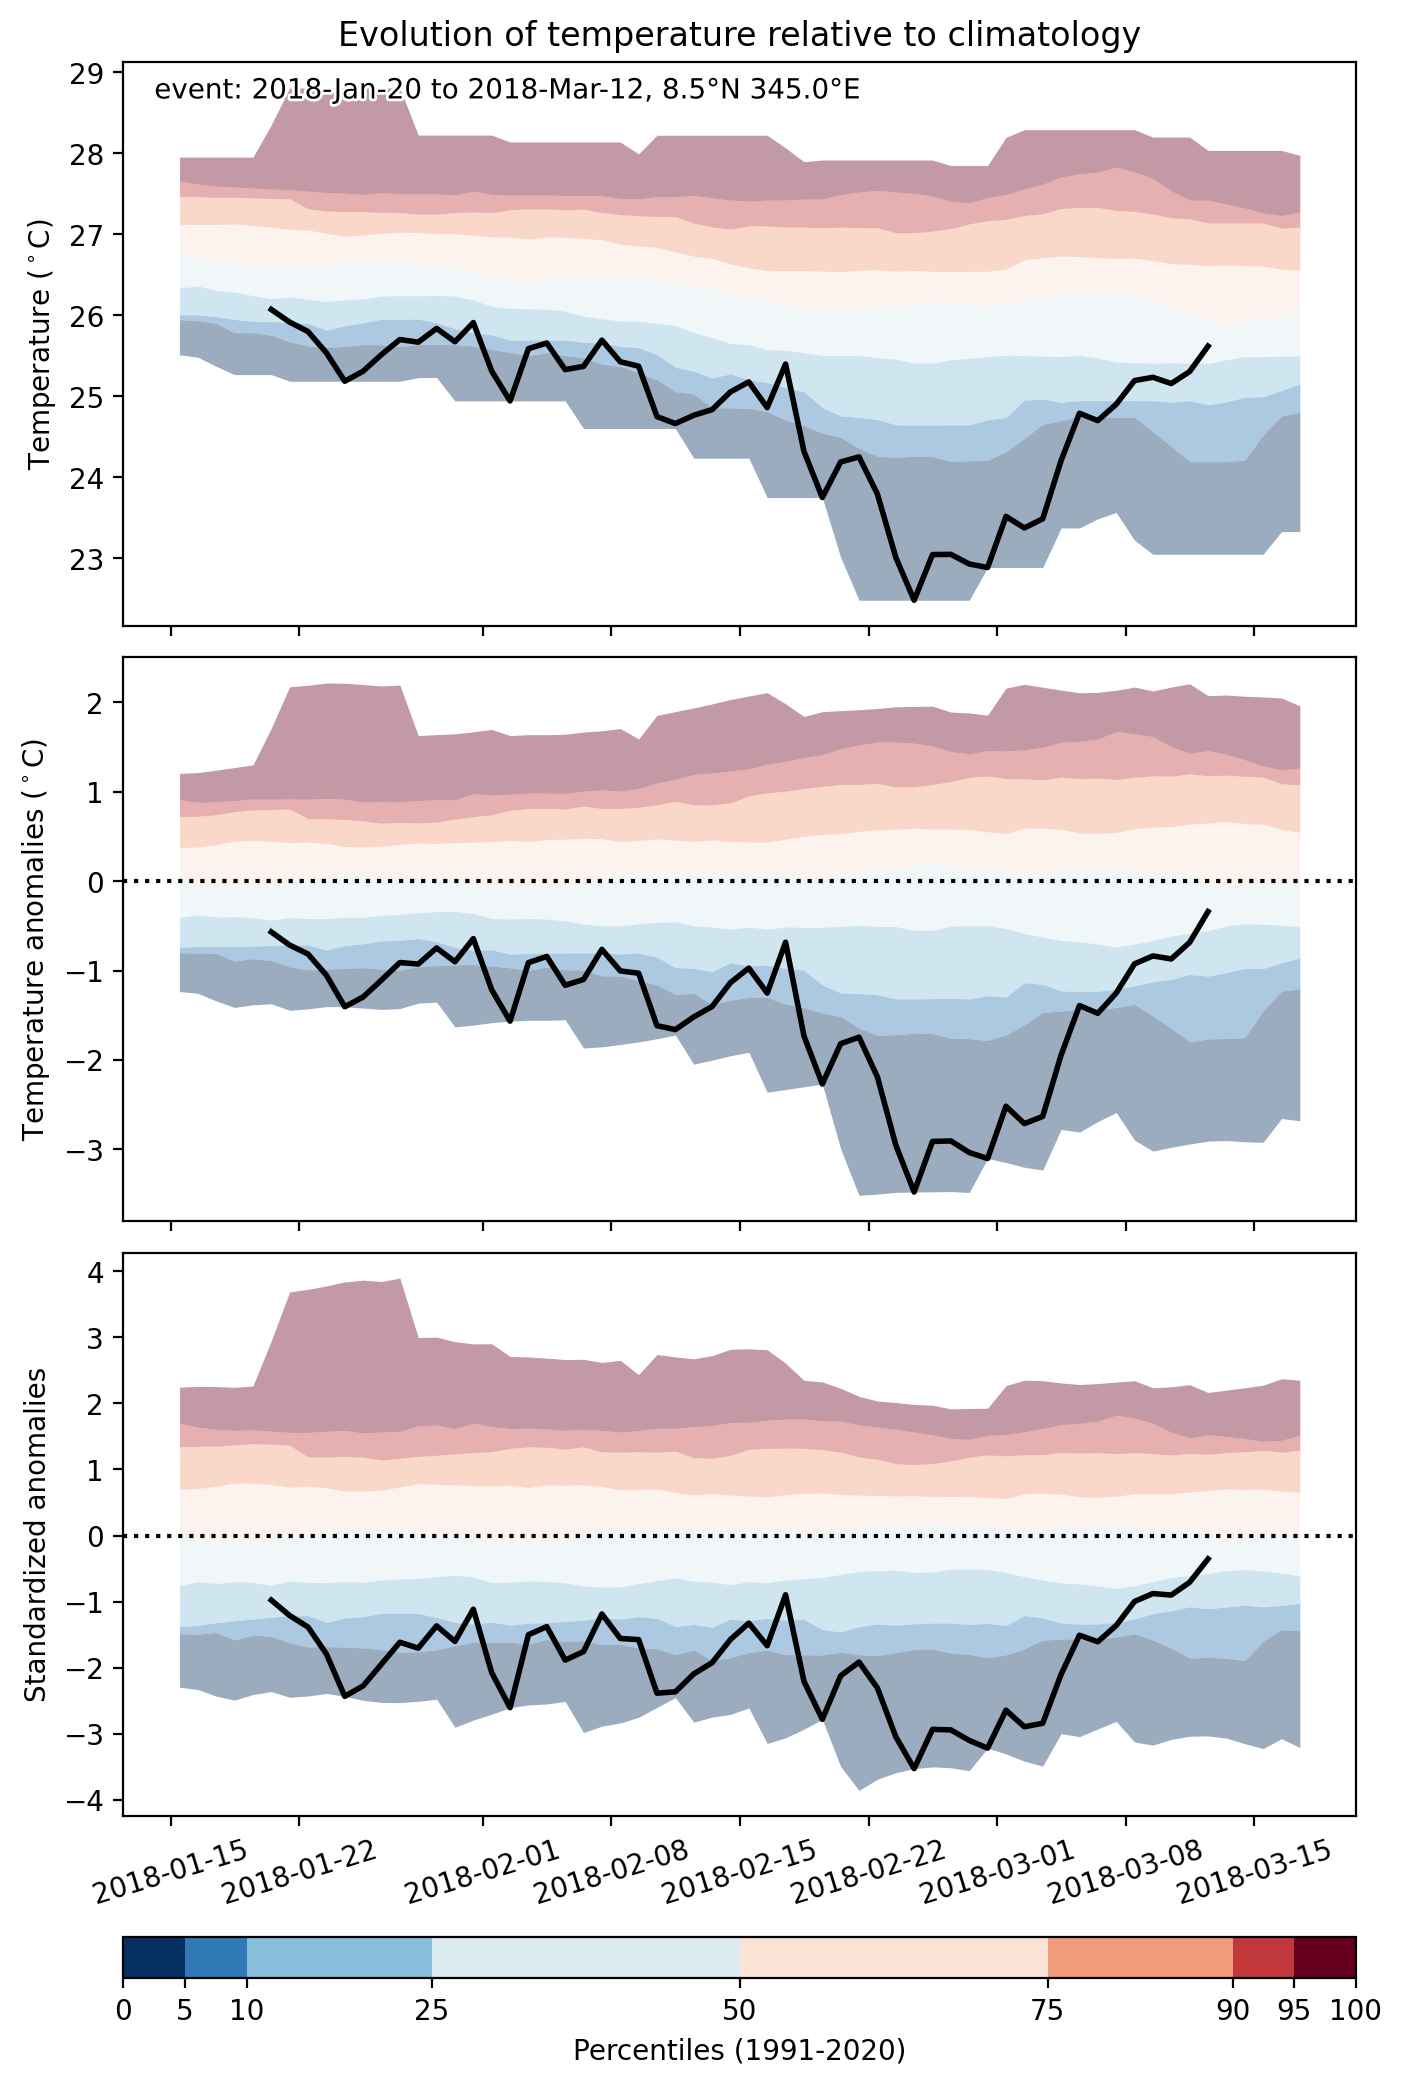


Fig. 2: Evolution of temperature at the center of the event. The climatological percentile distribution is illustrated with color shadings.
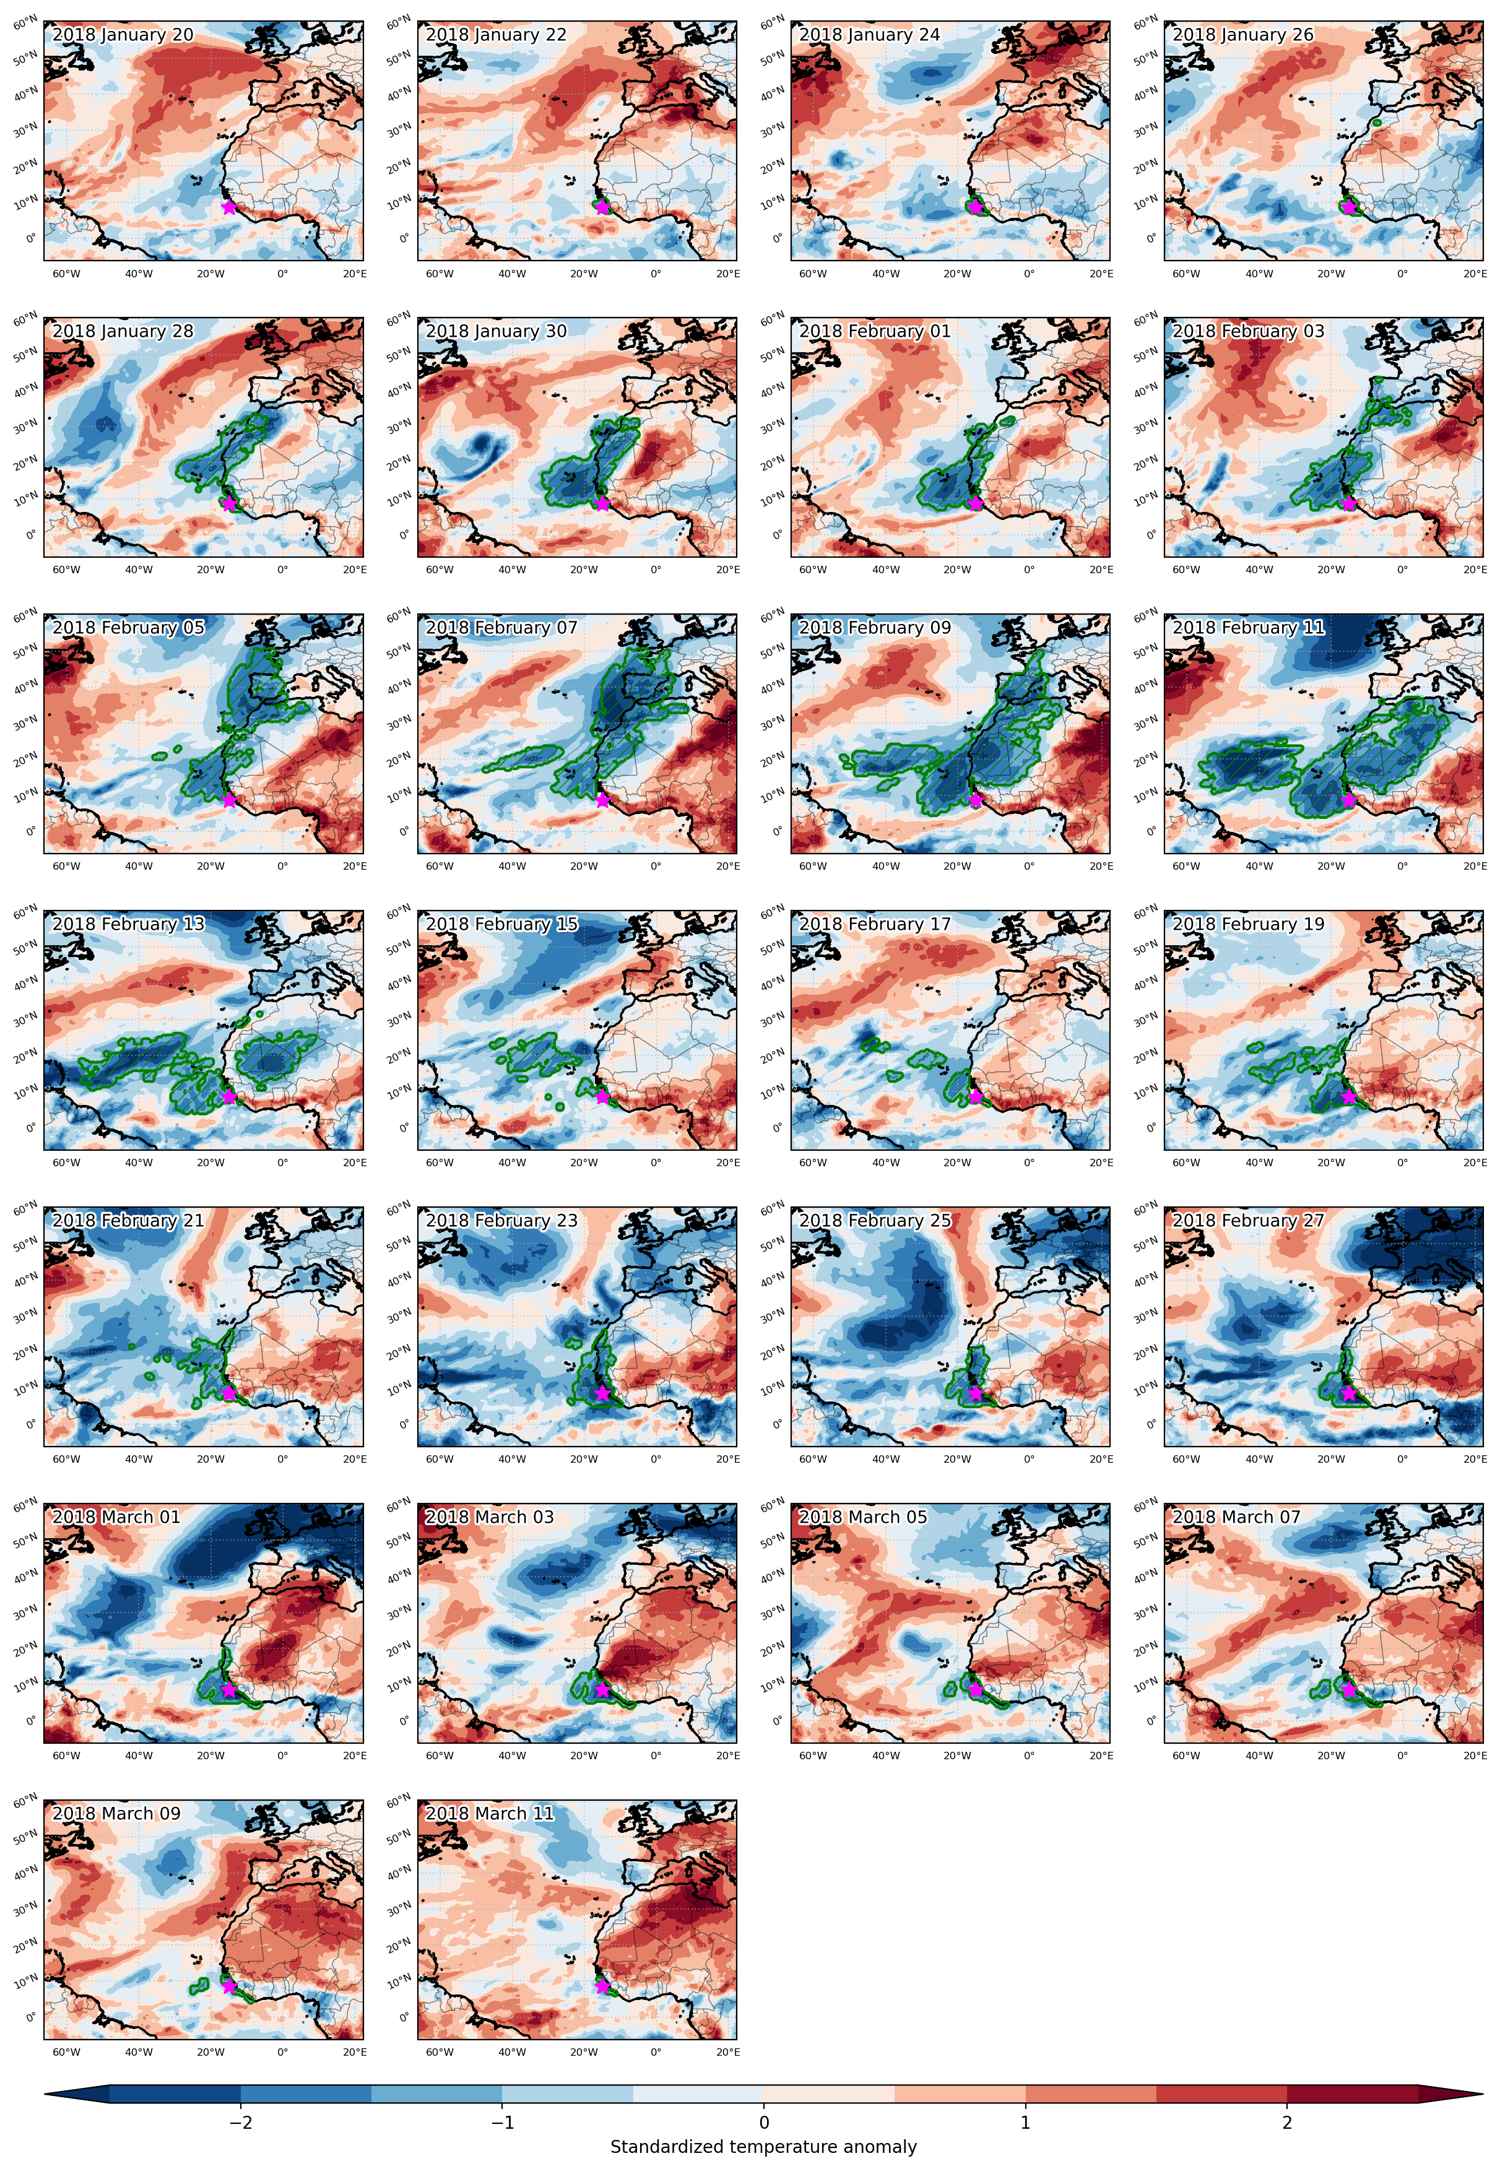


Fig. 3: Maps illustrating the evolution of standardized temperature anomalies during the event.

Event ID: Cold_spell_2018-Jan-20_to_2018-Mar-12_345.0_8.5
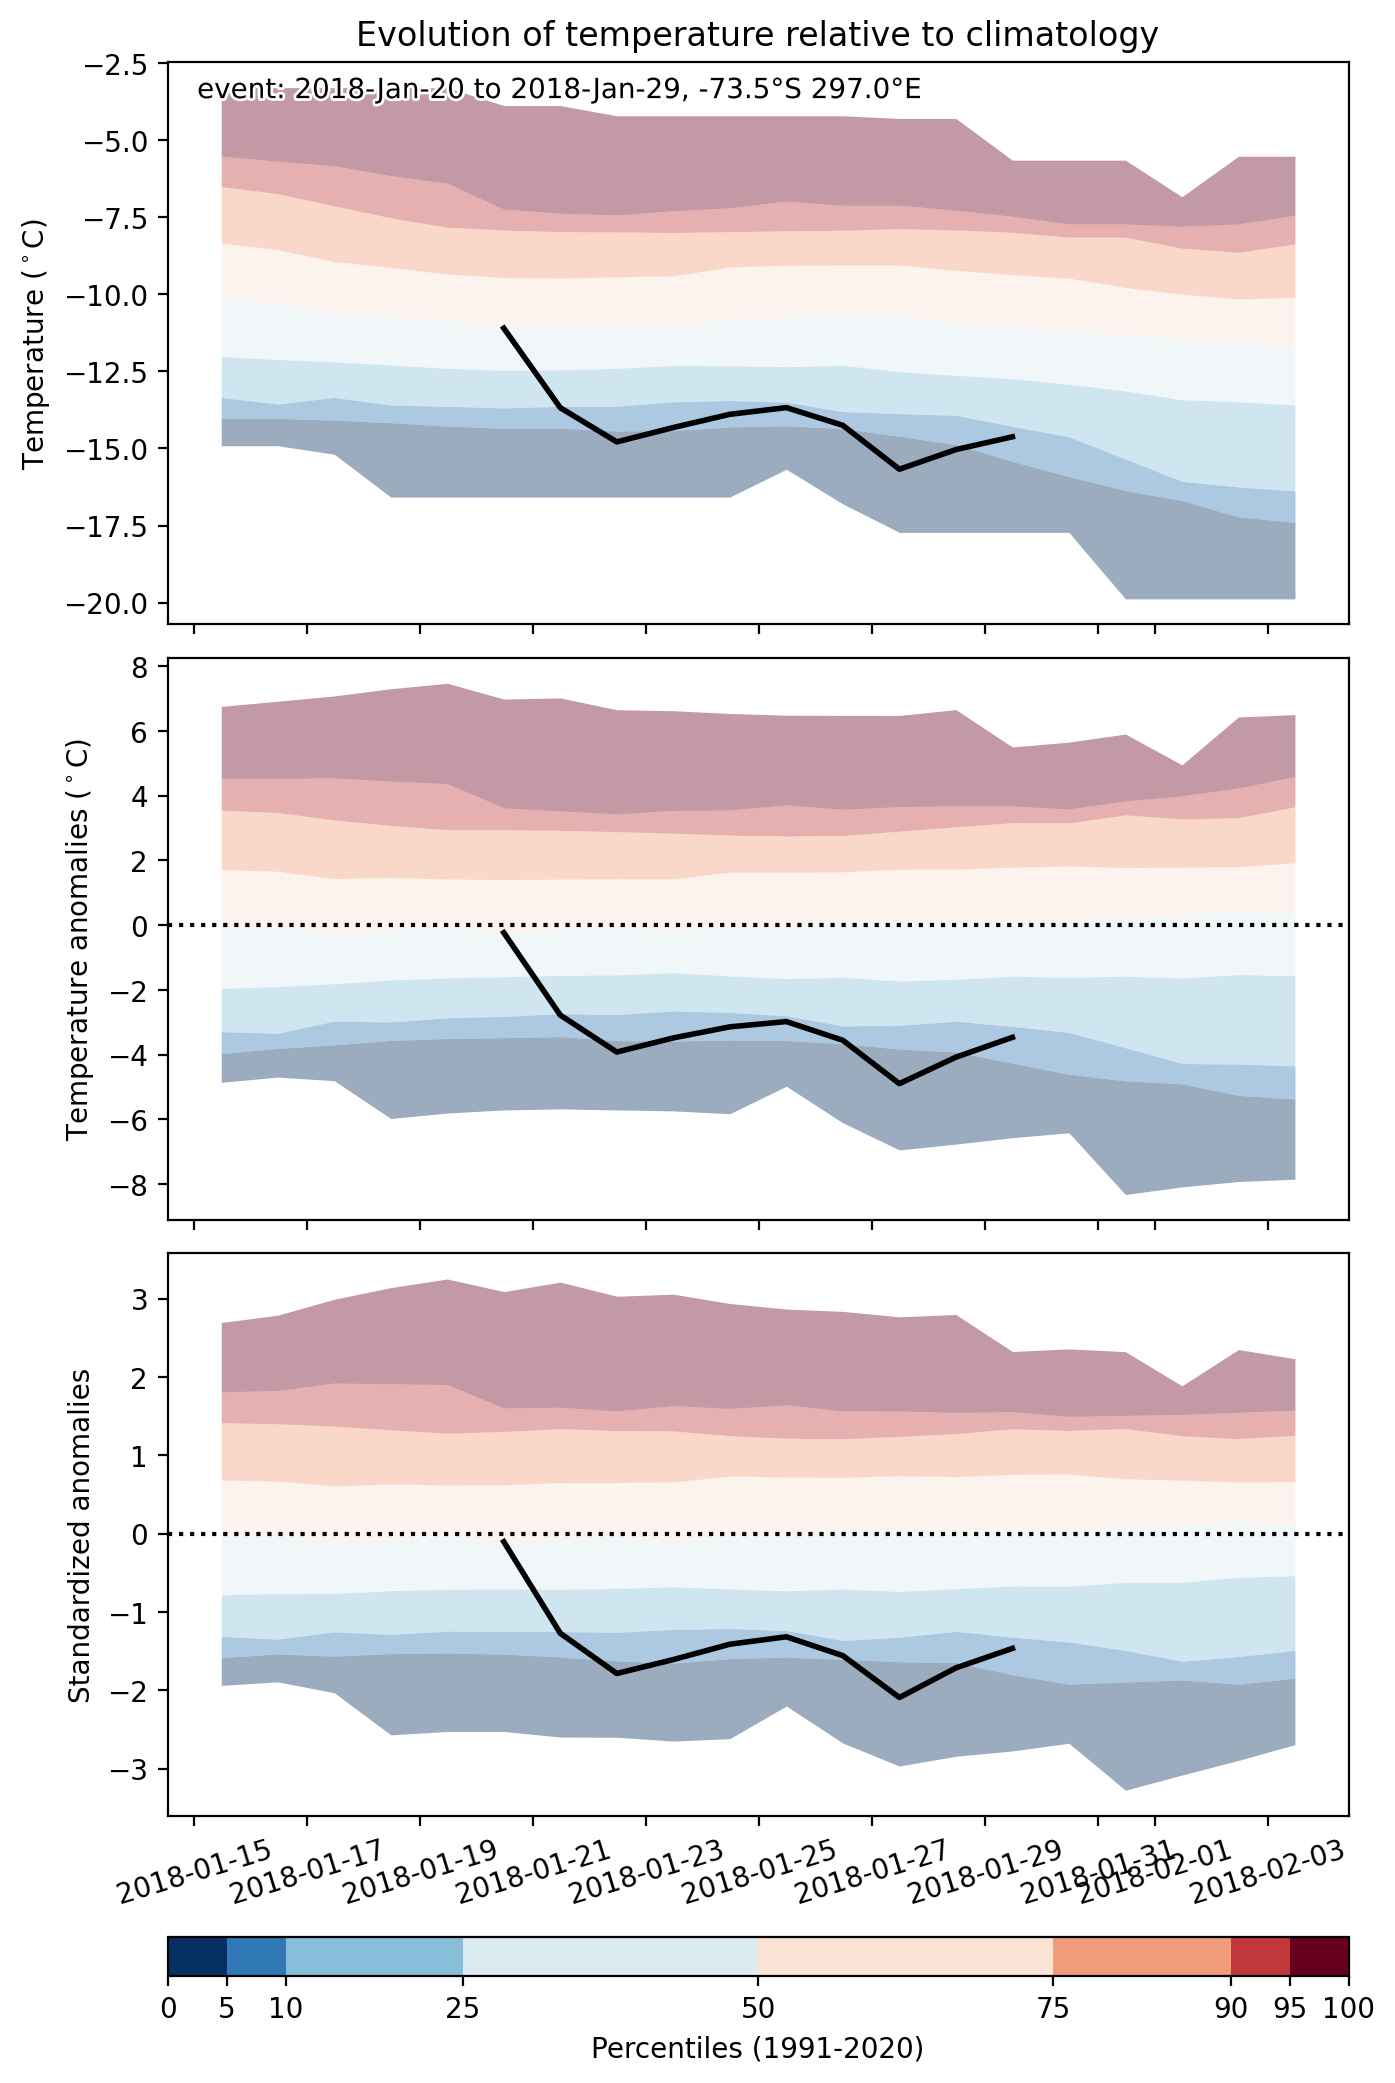
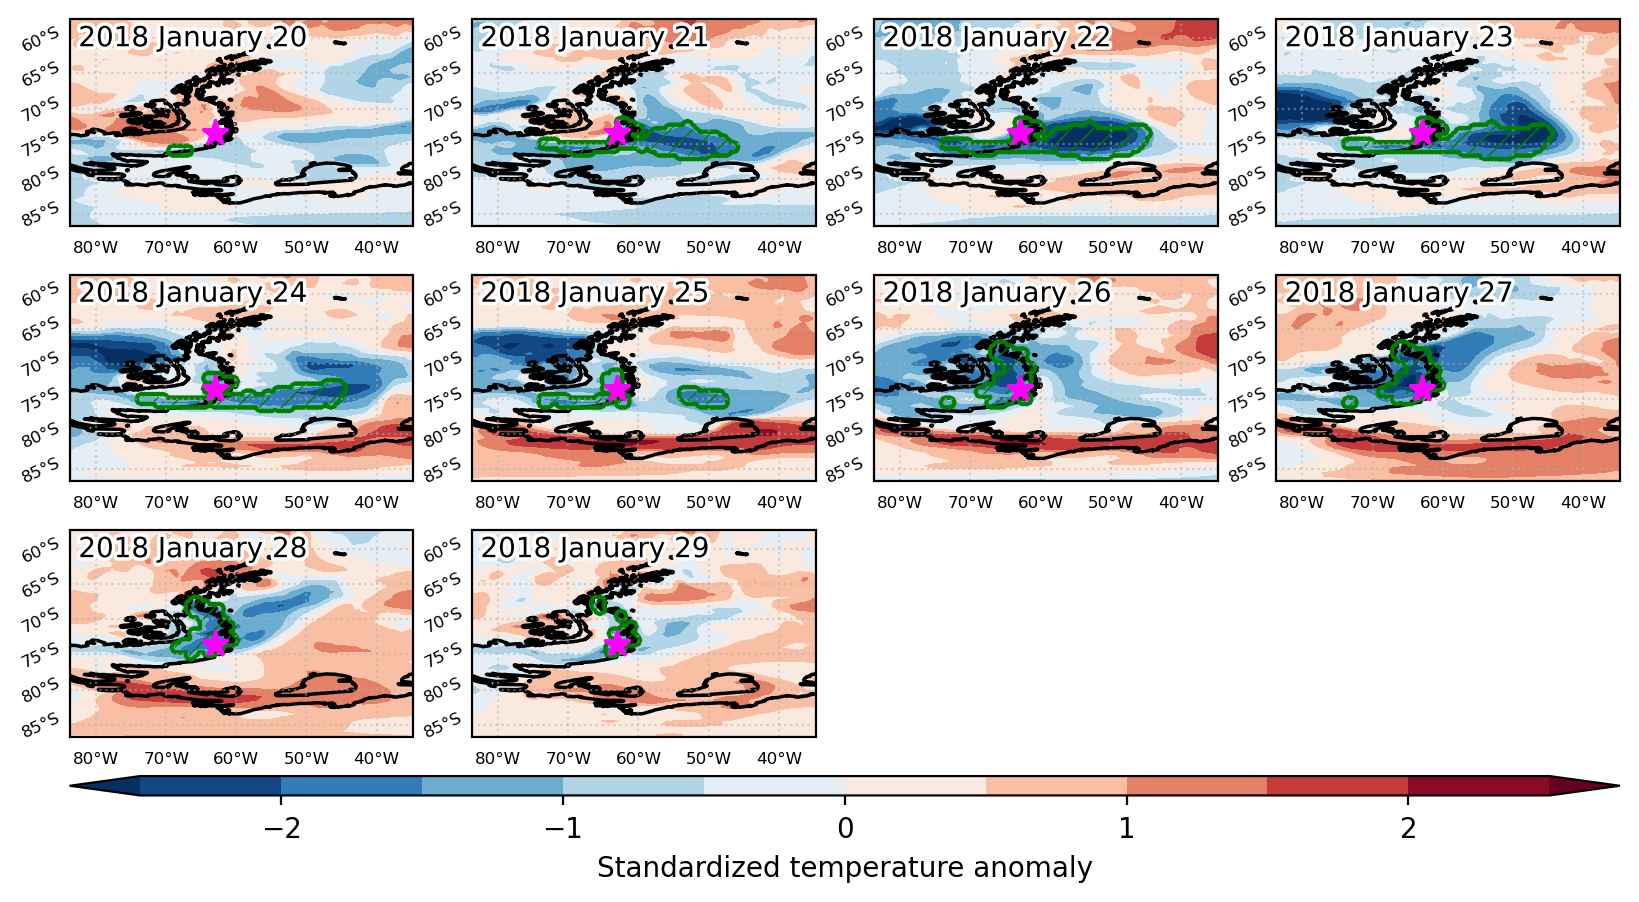
Cold spell occuring from January 20 2018 to January 29 2018 at -73.5°S 297.0°E

Download data: JSON

Event type: Cold spell

Countries affected (identified with ArcGIS Online; provided only for geographical reference):

  • Antarctica

Duration: 10 days

Time span: January 20 2018 to January 29 2018

Statistics over entire affected area:

  • Mean temperature anomaly: -4.1 °C
  • Mean temperature: -10.0 °C
  • Minimum temperature anomaly: -7.0 °C
  • Minimum temperature: -20.4 °C

Event center: -73.5°S 297.0°E

Area affected: 299101 km$^2$


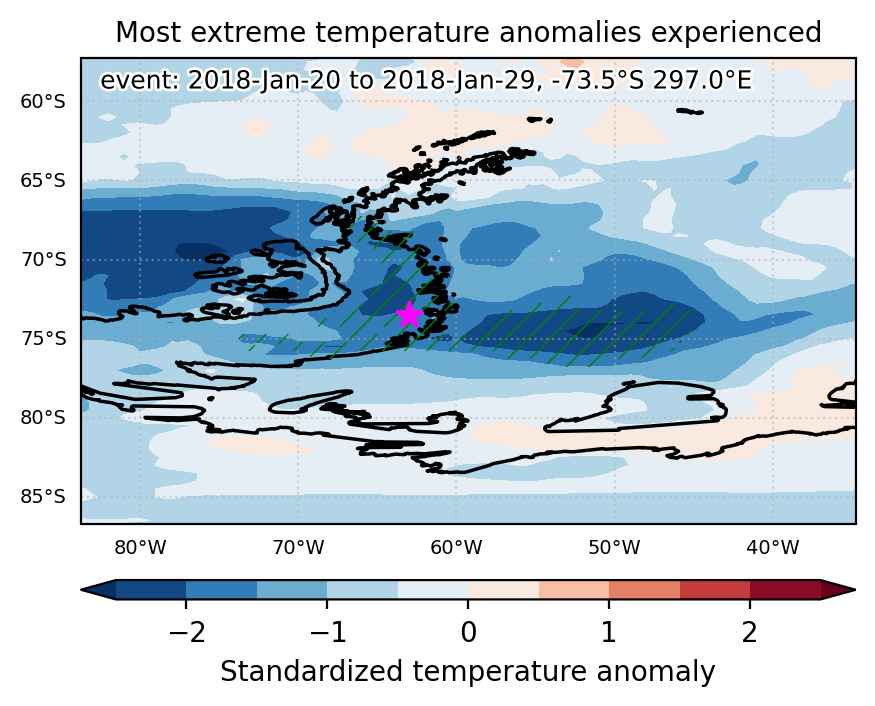
Fig. 1: Map of most extreme temperature anomalies (standardized) experienced during the event. The purple star indicates the center of the extreme event. Green hatching illustrates all areas under the effect of extremes at some time during the event.


Fig. 2: Evolution of temperature at the center of the event. The climatological percentile distribution is illustrated with color shadings.


Fig. 3: Maps illustrating the evolution of standardized temperature anomalies during the event.

Event ID: Cold_spell_2018-Jan-20_to_2018-Jan-29_297.0_-73.5

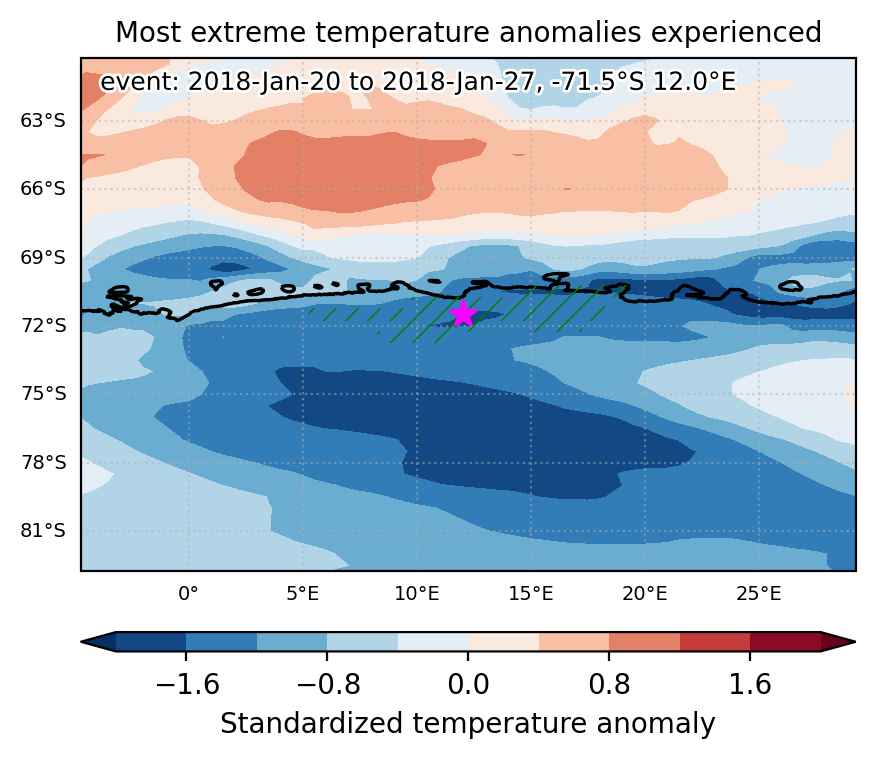
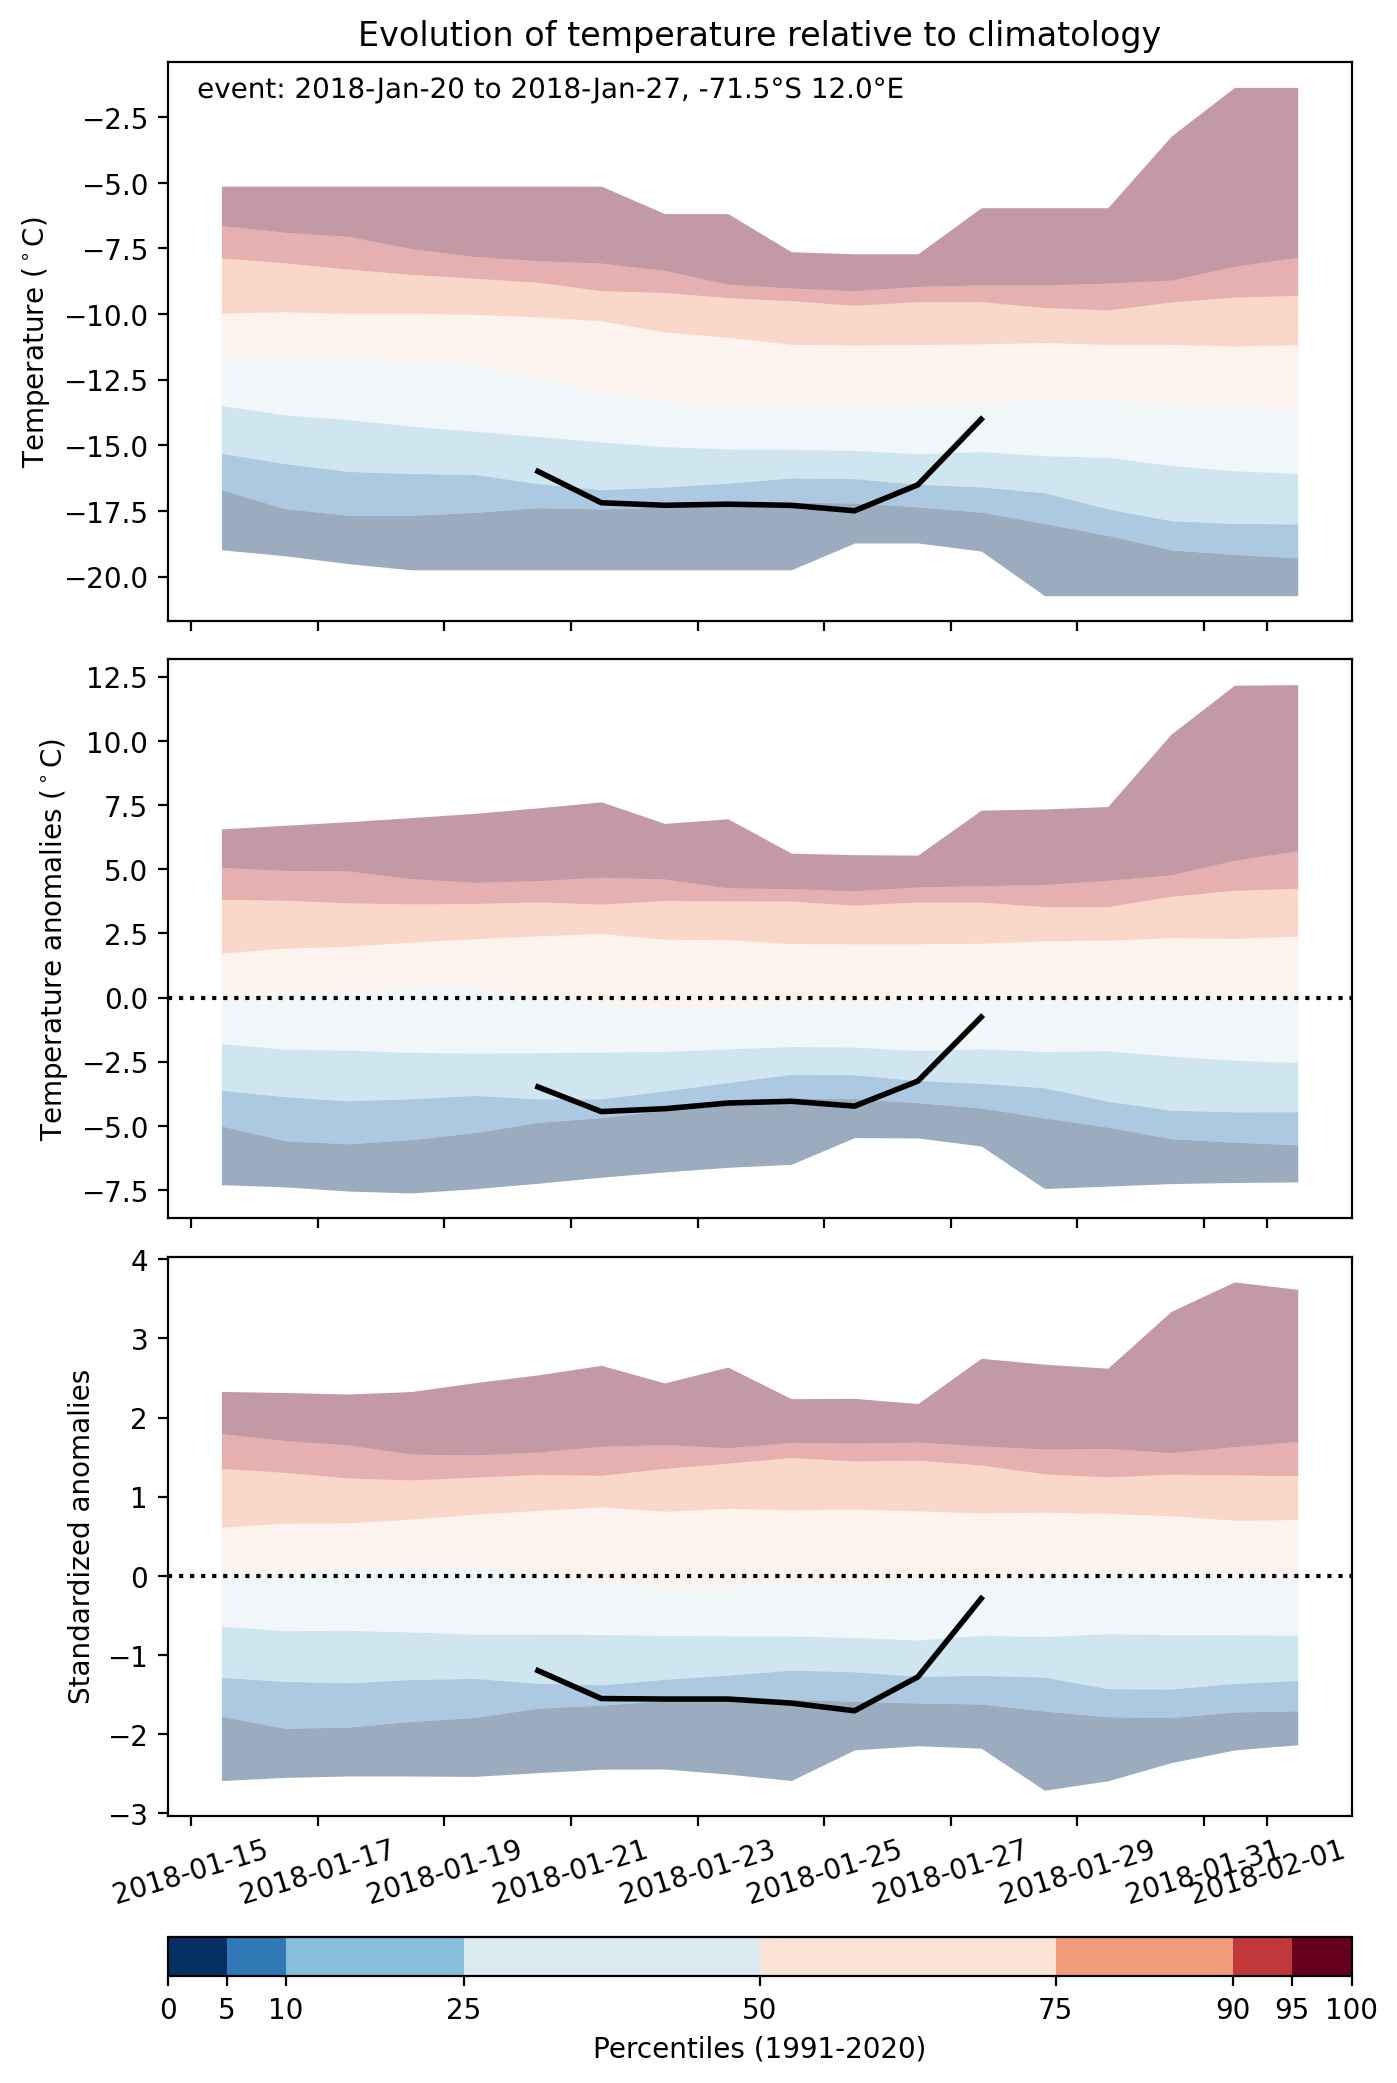
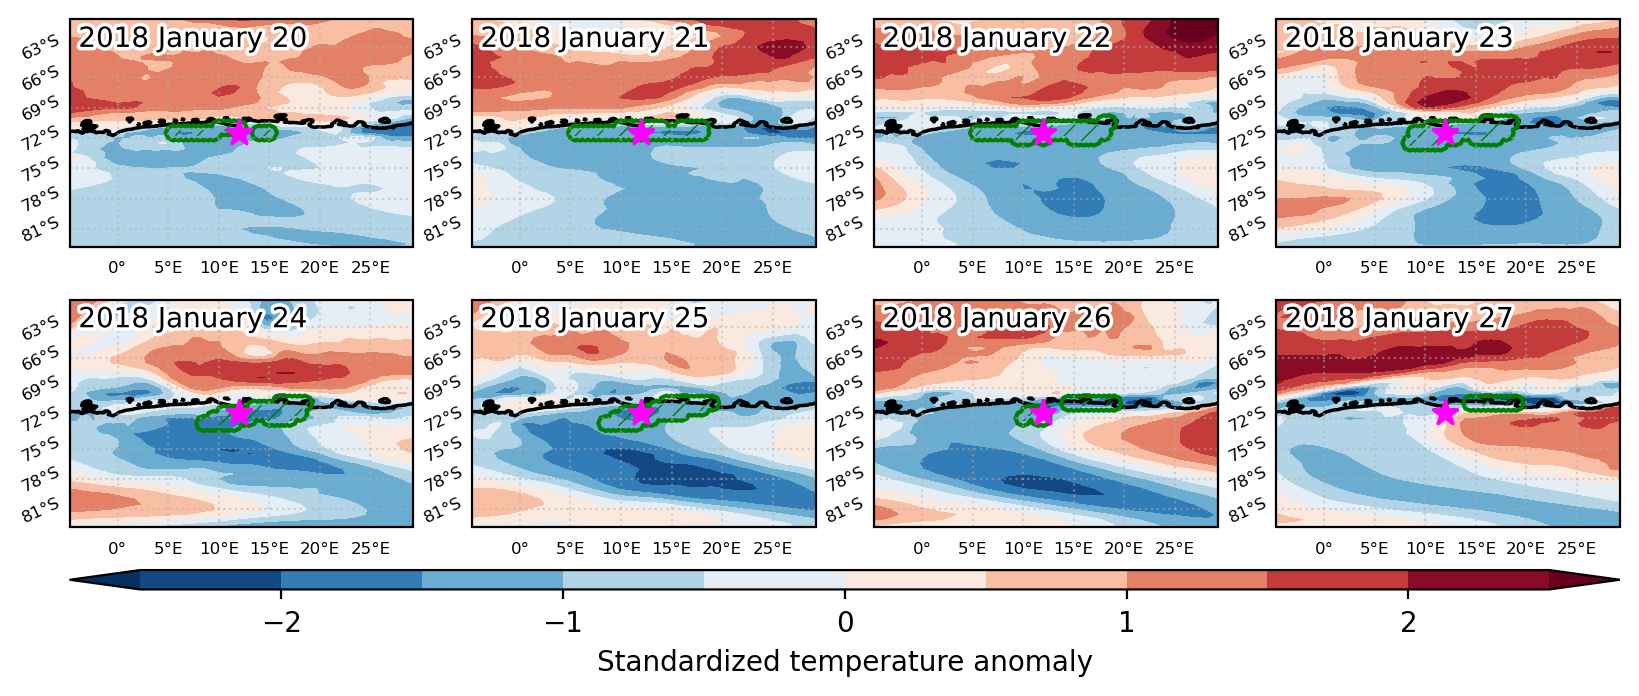
Cold spell occuring from January 20 2018 to January 27 2018 at -71.5°S 12.0°E

Download data: JSON

Event type: Cold spell

Countries affected (identified with ArcGIS Online; provided only for geographical reference):

  • Antarctica

Duration: 8 days

Time span: January 20 2018 to January 27 2018

Statistics over entire affected area:

  • Mean temperature anomaly: -3.6 °C
  • Mean temperature: -15.6 °C
  • Minimum temperature anomaly: -5.3 °C
  • Minimum temperature: -27.4 °C

Event center: -71.5°S 12.0°E

Area affected: 71851 km$^2$


Fig. 1: Map of most extreme temperature anomalies (standardized) experienced during the event. The purple star indicates the center of the extreme event. Green hatching illustrates all areas under the effect of extremes at some time during the event.


Fig. 2: Evolution of temperature at the center of the event. The climatological percentile distribution is illustrated with color shadings.


Fig. 3: Maps illustrating the evolution of standardized temperature anomalies during the event.

Event ID: Cold_spell_2018-Jan-20_to_2018-Jan-27_12.0_-71.5

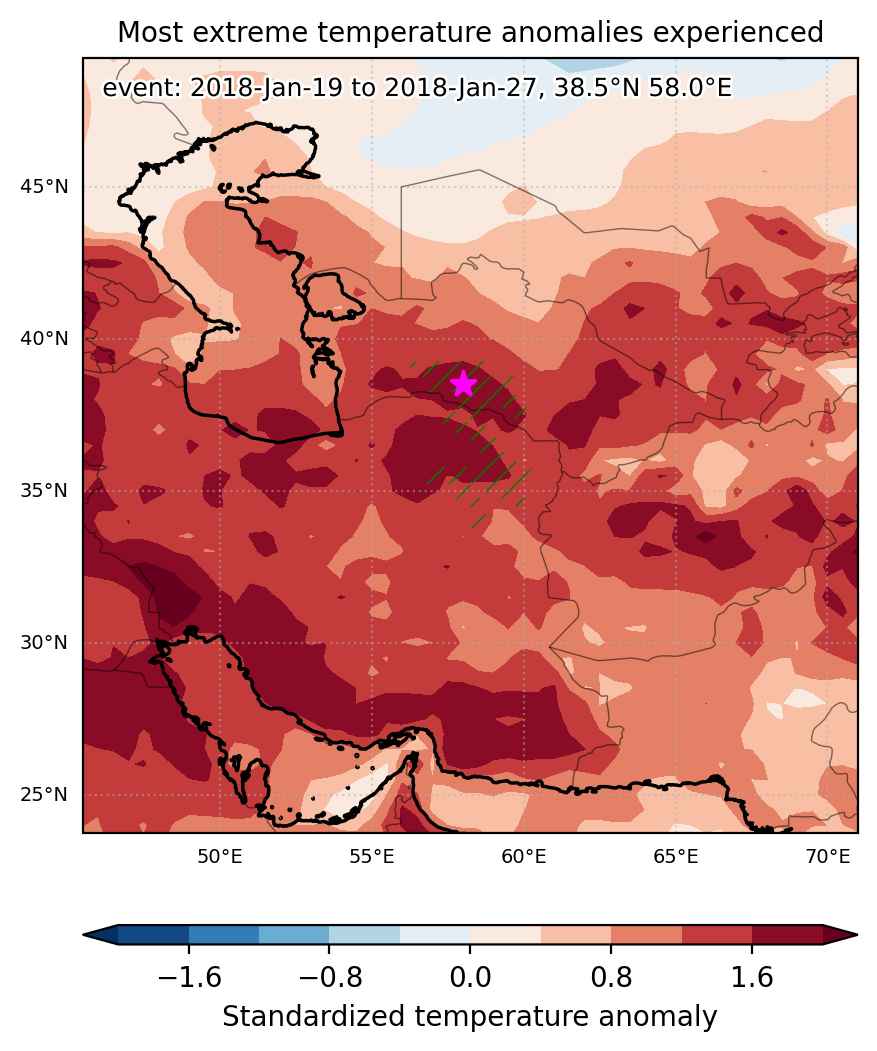
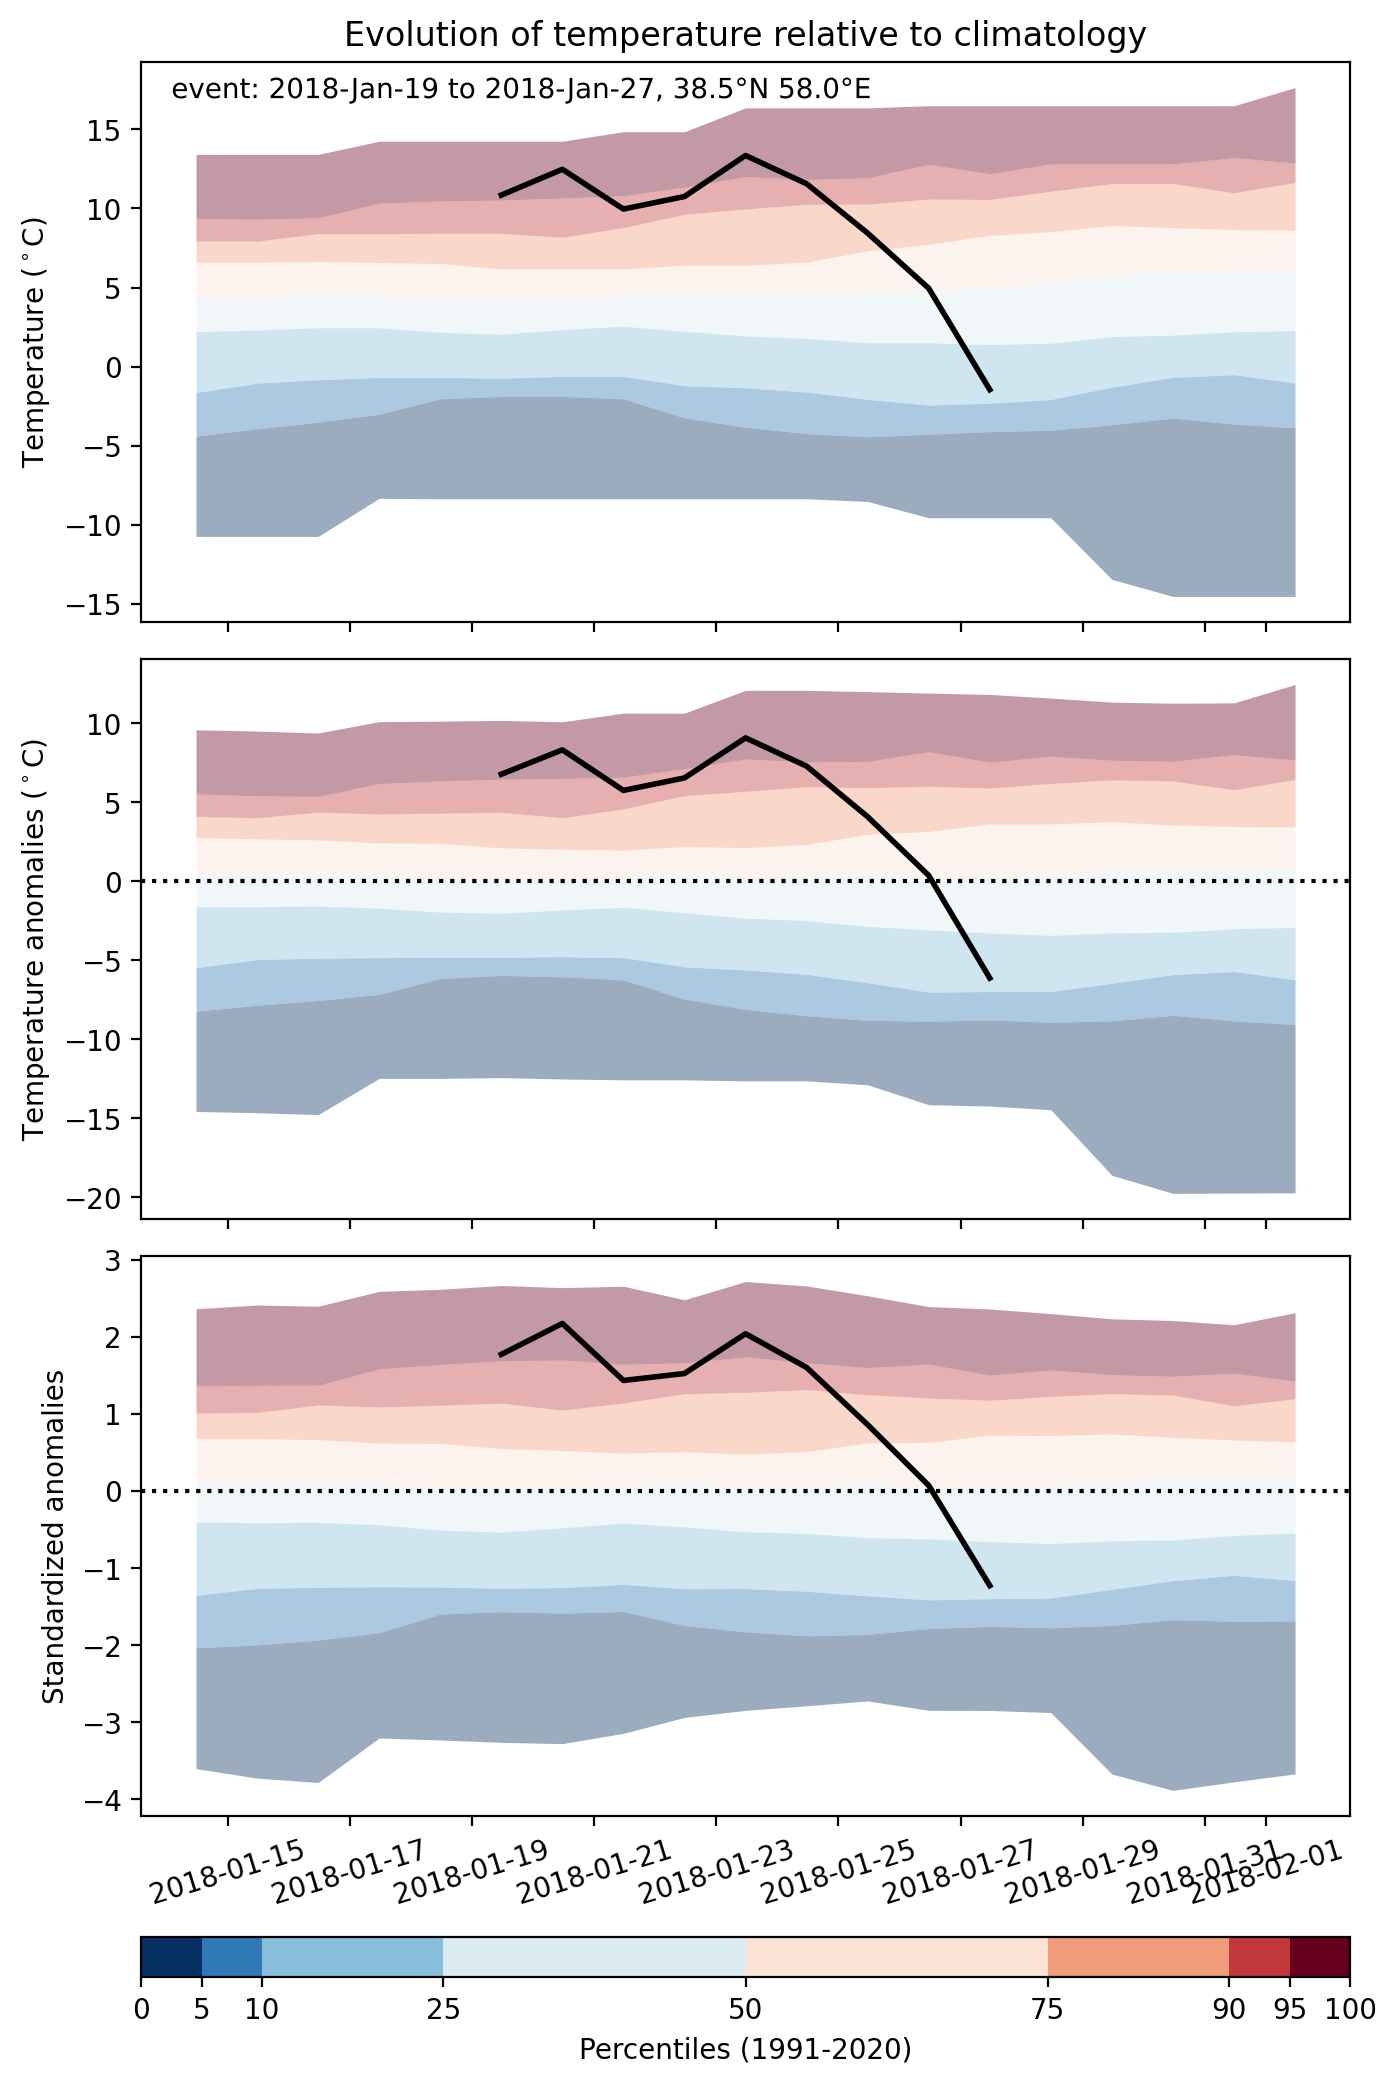
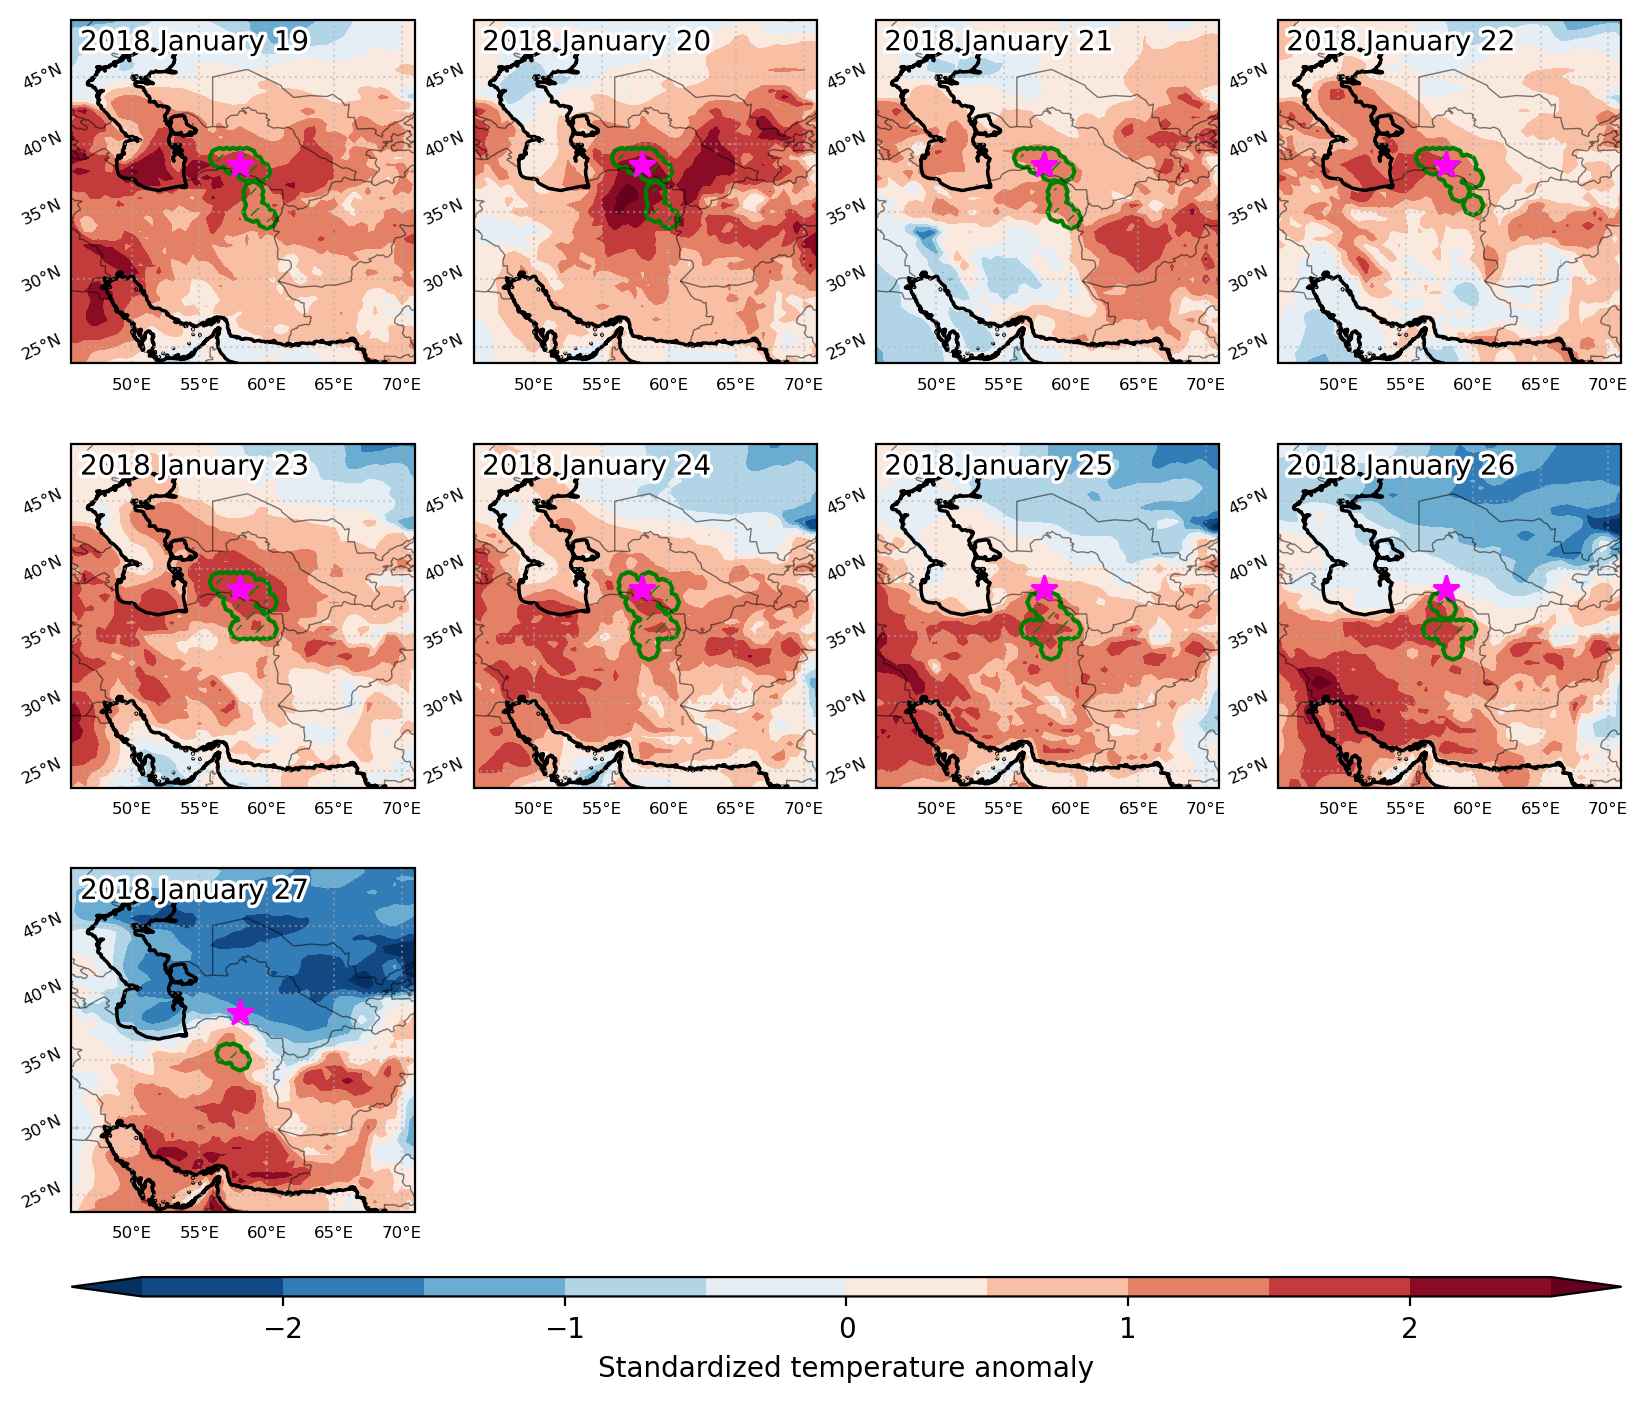
Heat wave occuring from January 19 2018 to January 27 2018 at 38.5°N 58.0°E

Download data: JSON

Event type: Heat wave

Countries affected (identified with ArcGIS Online; provided only for geographical reference):

  • Iran
  • Turkmenistan

Duration: 9 days

Time span: January 19 2018 to January 27 2018

Statistics over entire affected area:

  • Mean temperature anomaly: 6.4 °C
  • Mean temperature: 8.2 °C
  • Maximum temperature anomaly: 9.5 °C
  • Maximum temperature: 13.3 °C

Event center: 38.5°N 58.0°E

Area affected: 91403 km$^2$


Fig. 1: Map of most extreme temperature anomalies (standardized) experienced during the event. The purple star indicates the center of the extreme event. Green hatching illustrates all areas under the effect of extremes at some time during the event.


Fig. 2: Evolution of temperature at the center of the event. The climatological percentile distribution is illustrated with color shadings.


Fig. 3: Maps illustrating the evolution of standardized temperature anomalies during the event.

Event ID: Heat_wave_2018-Jan-19_to_2018-Jan-27_58.0_38.5

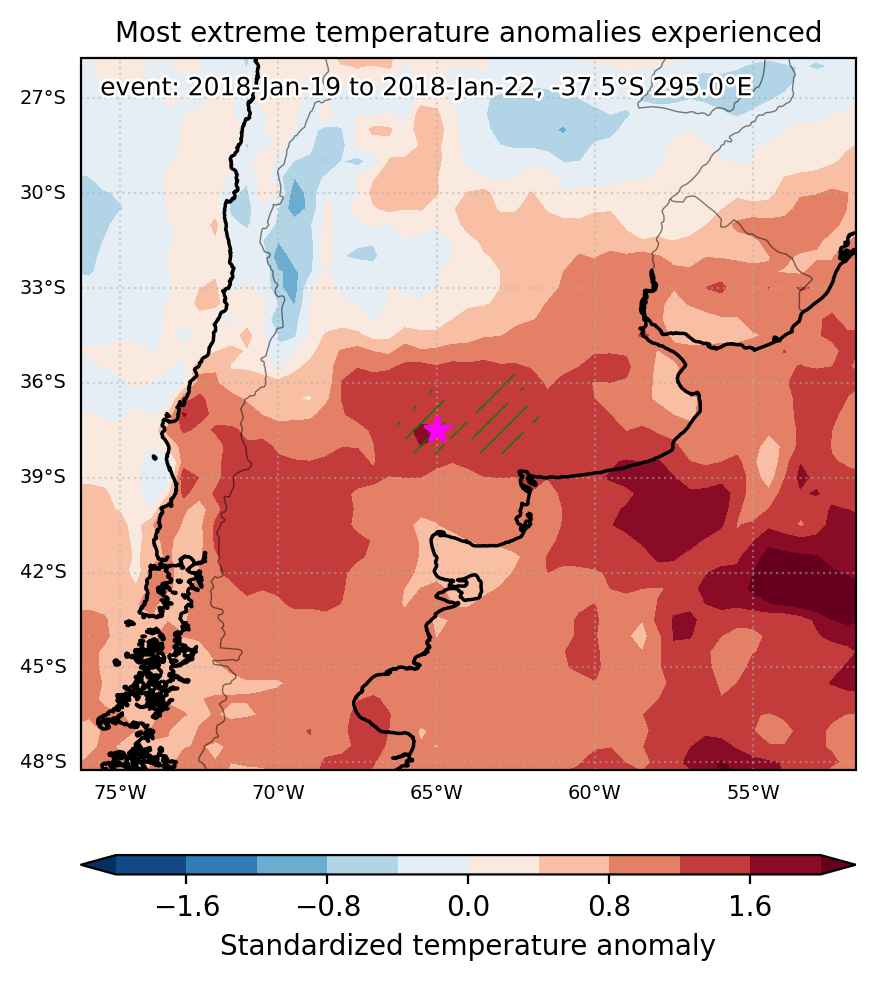
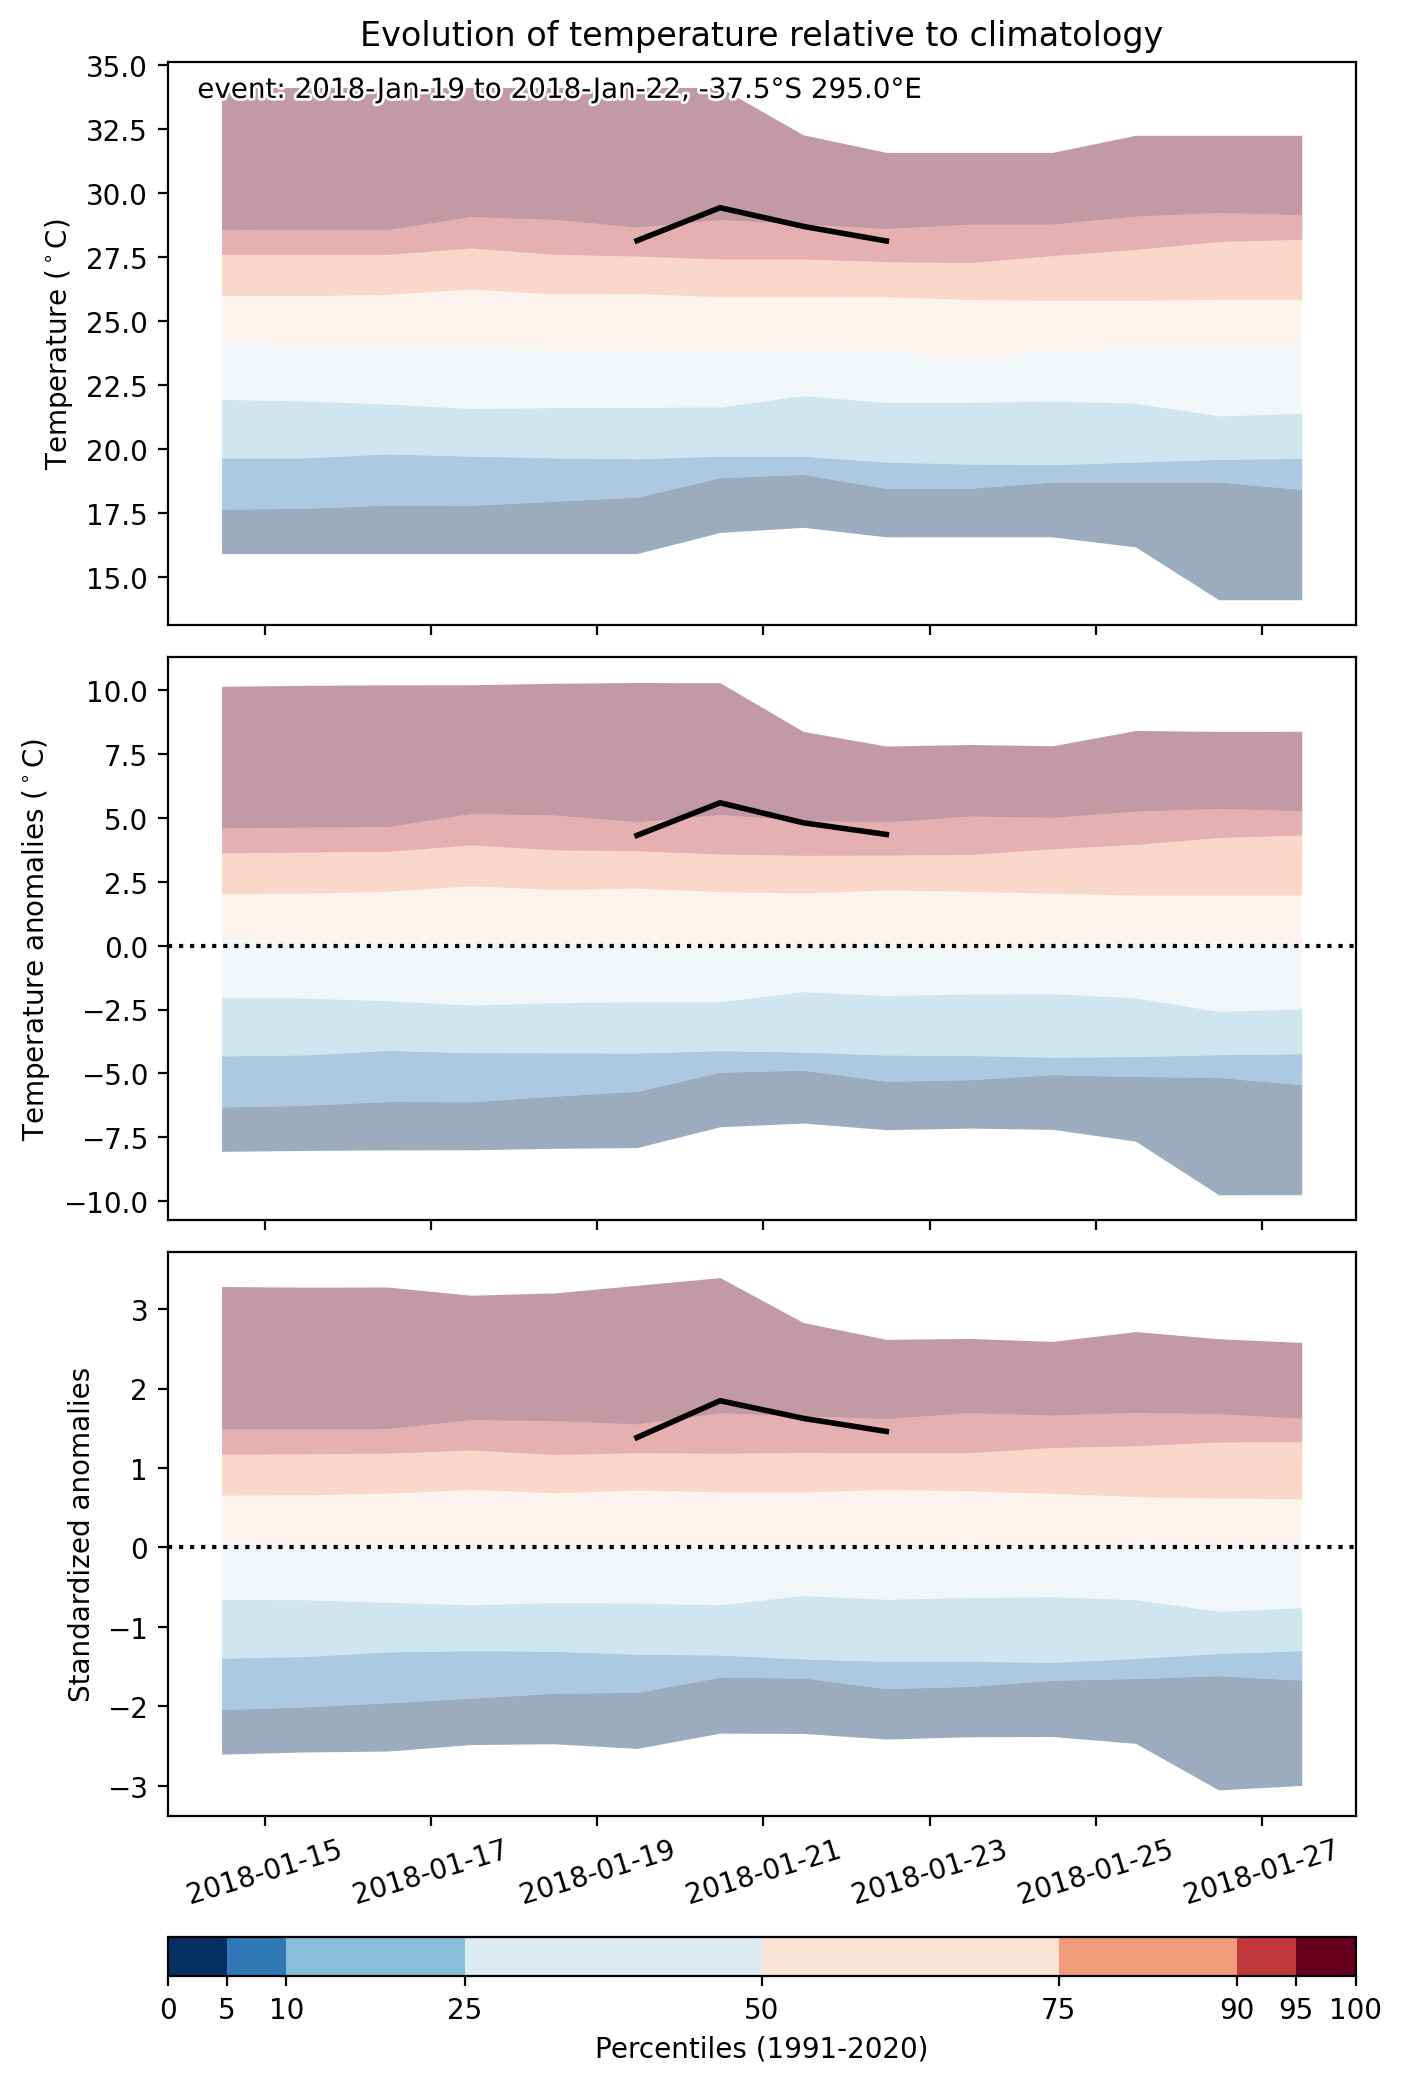
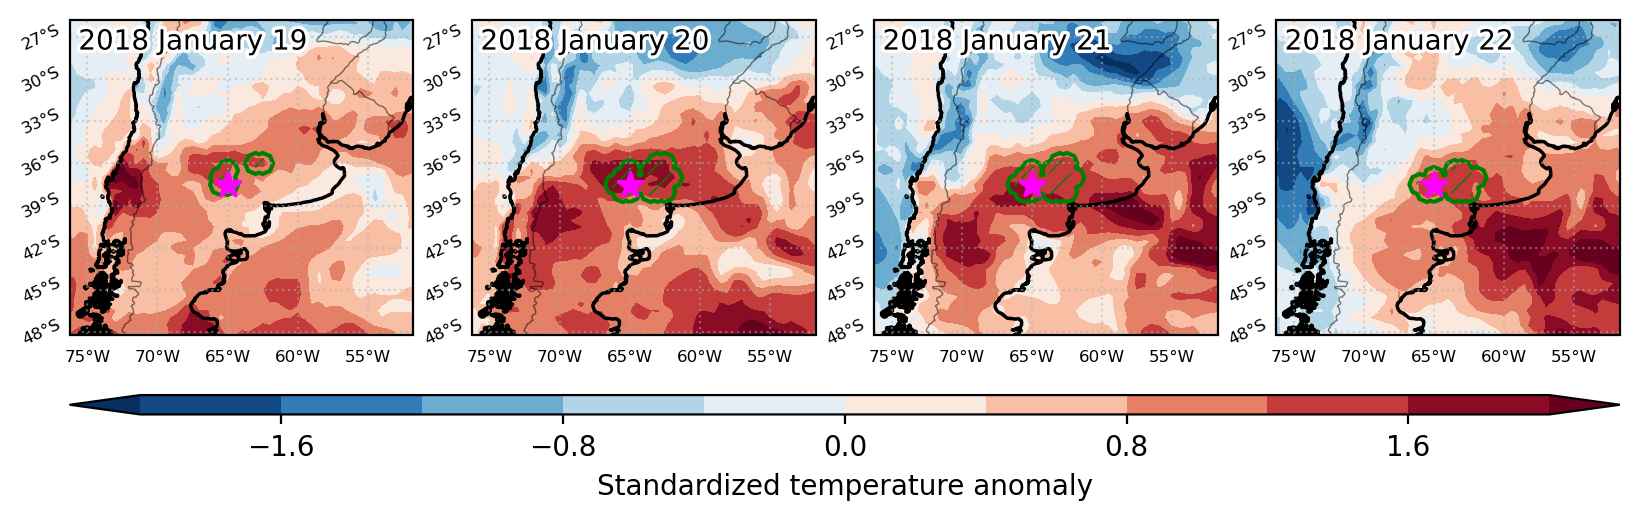
Heat wave occuring from January 19 2018 to January 22 2018 at -37.5°S 295.0°E

Download data: JSON

Event type: Heat wave

Countries affected (identified with ArcGIS Online; provided only for geographical reference):

  • Argentina

Duration: 4 days

Time span: January 19 2018 to January 22 2018

Statistics over entire affected area:

  • Mean temperature anomaly: 4.4 °C
  • Mean temperature: 28.0 °C
  • Maximum temperature anomaly: 5.9 °C
  • Maximum temperature: 31.5 °C

Event center: -37.5°S 295.0°E

Area affected: 59065 km$^2$


Fig. 1: Map of most extreme temperature anomalies (standardized) experienced during the event. The purple star indicates the center of the extreme event. Green hatching illustrates all areas under the effect of extremes at some time during the event.


Fig. 2: Evolution of temperature at the center of the event. The climatological percentile distribution is illustrated with color shadings.


Fig. 3: Maps illustrating the evolution of standardized temperature anomalies during the event.

Event ID: Heat_wave_2018-Jan-19_to_2018-Jan-22_295.0_-37.5

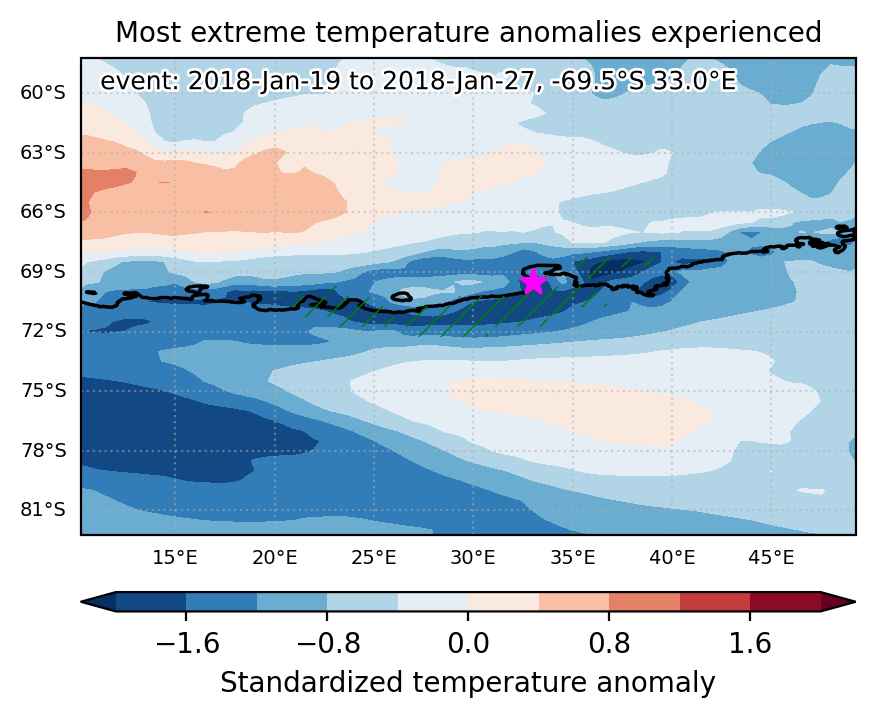
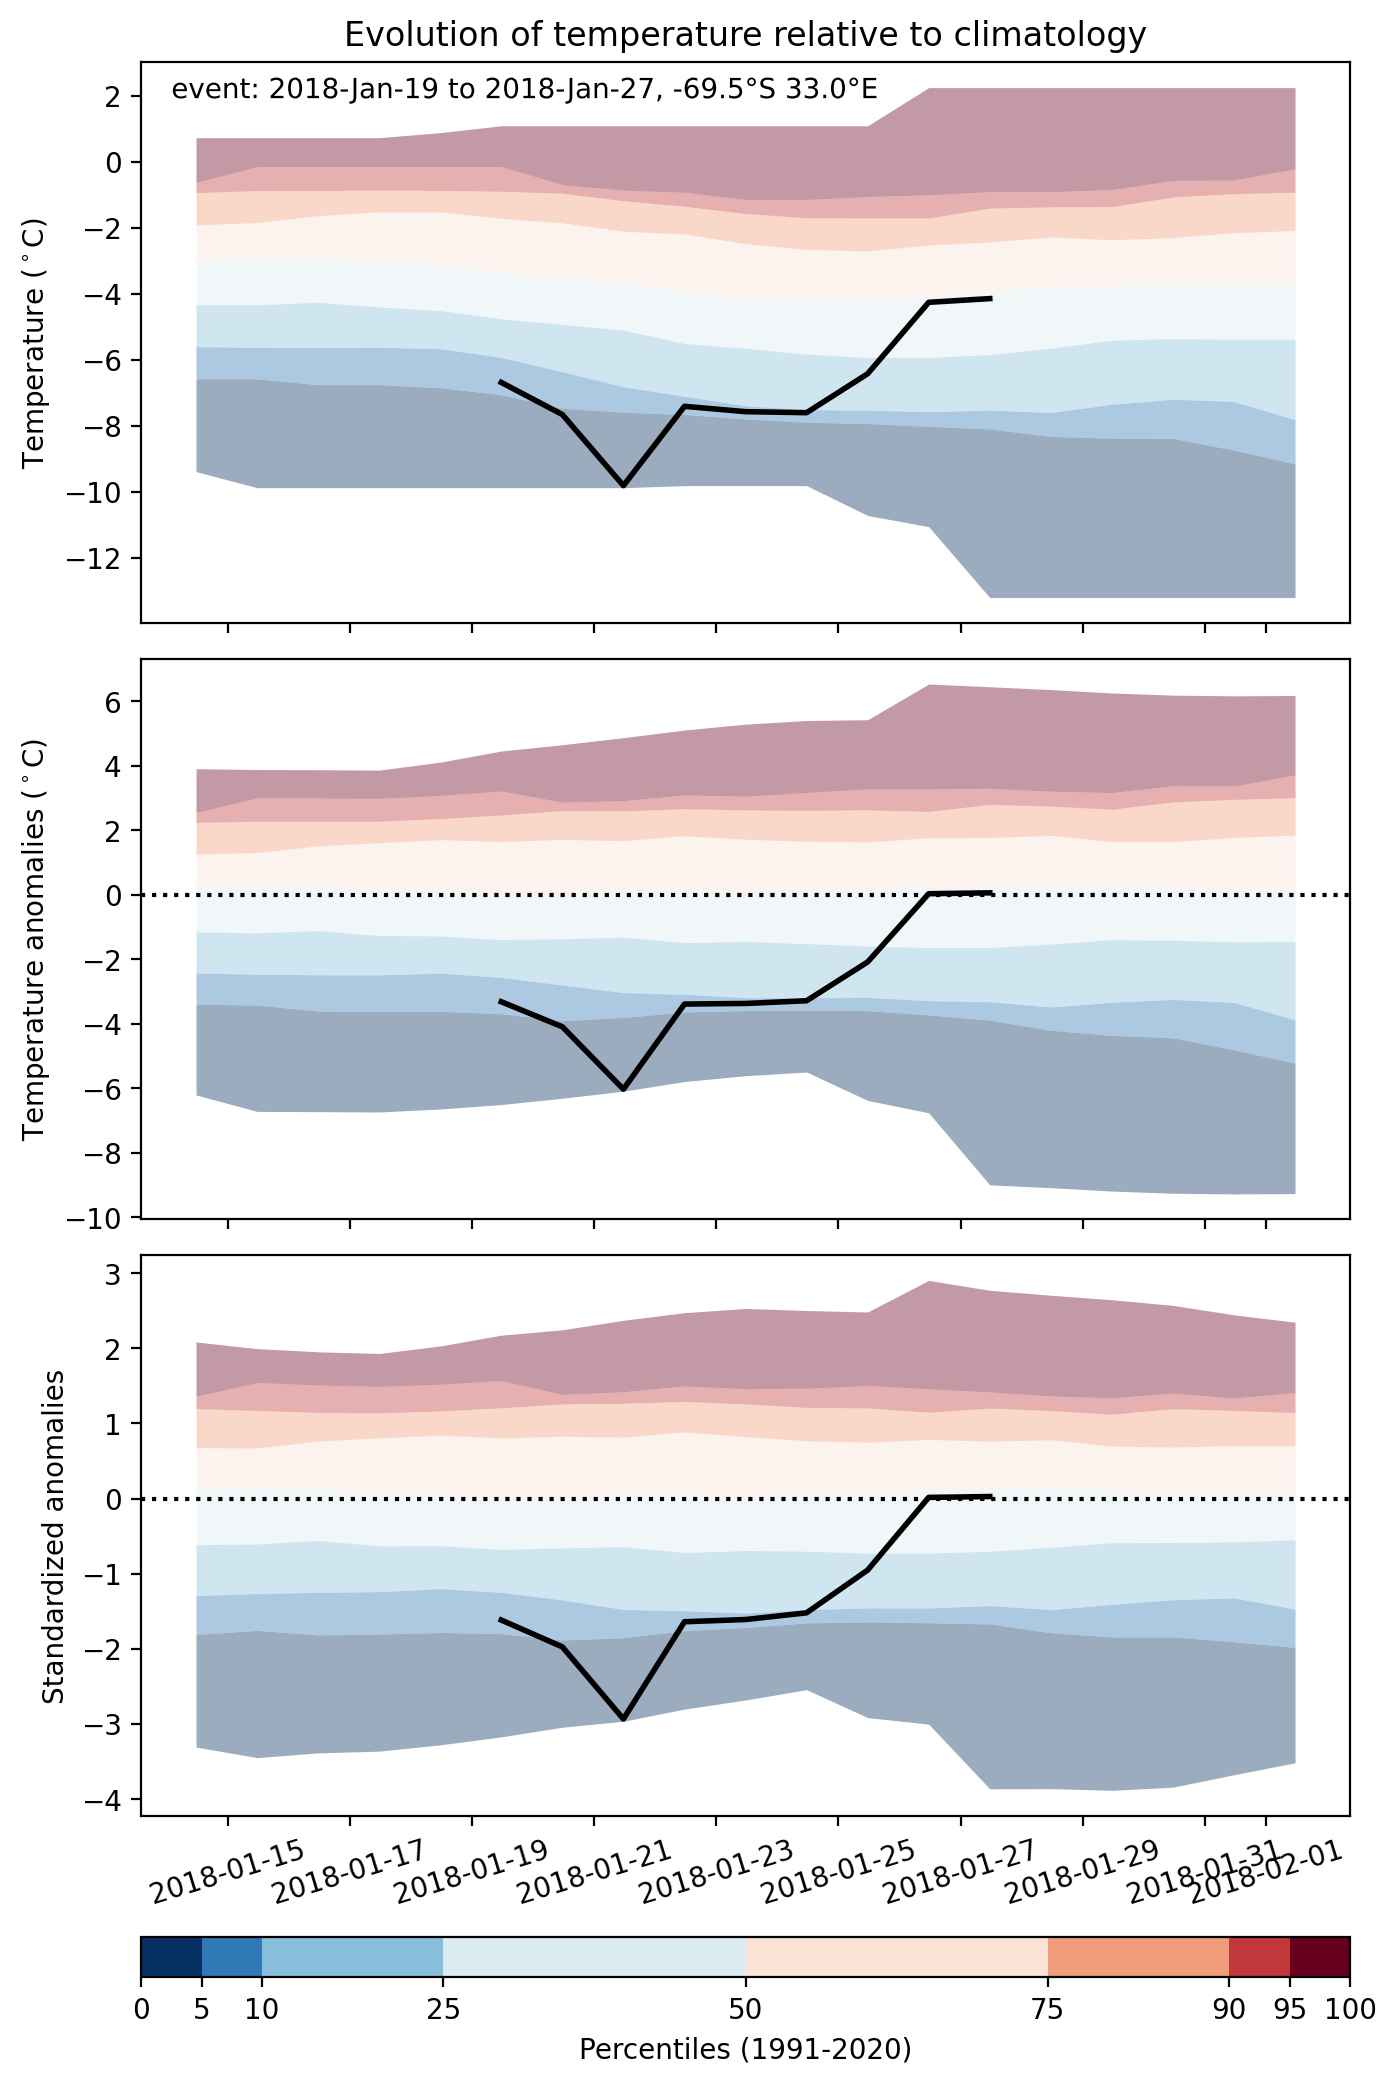
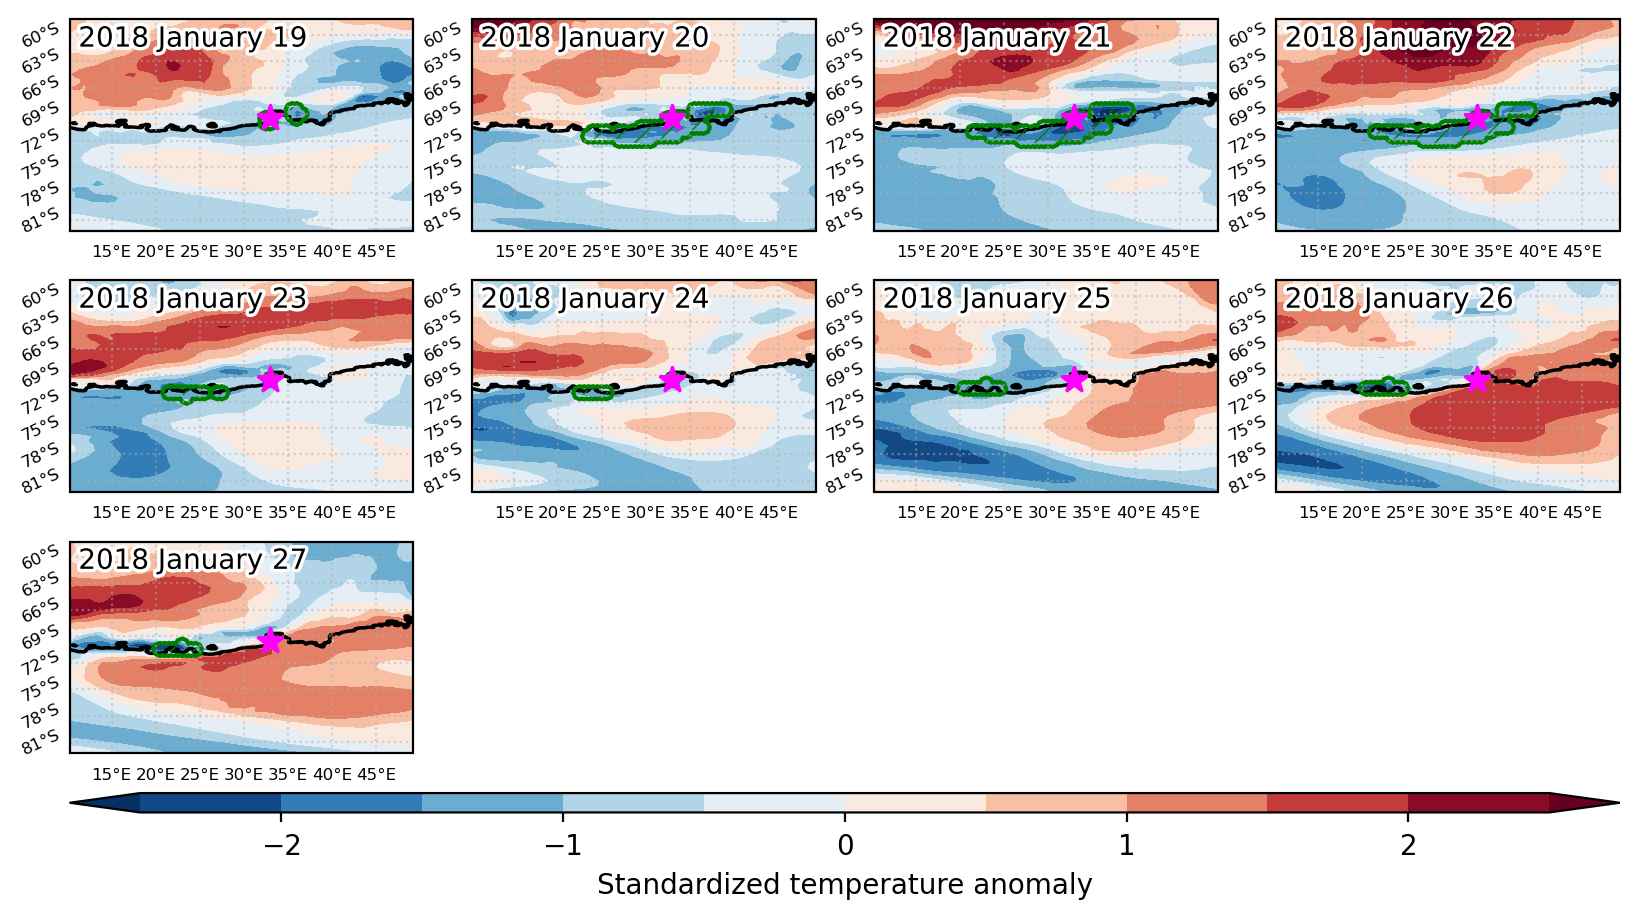
Cold spell occuring from January 19 2018 to January 27 2018 at -69.5°S 33.0°E

Download data: JSON

Event type: Cold spell

Countries affected (identified with ArcGIS Online; provided only for geographical reference):

  • Antarctica

Duration: 9 days

Time span: January 19 2018 to January 27 2018

Statistics over entire affected area:

  • Mean temperature anomaly: -3.7 °C
  • Mean temperature: -12.3 °C
  • Minimum temperature anomaly: -6.0 °C
  • Minimum temperature: -20.5 °C

Event center: -69.5°S 33.0°E

Area affected: 103411 km$^2$


Fig. 1: Map of most extreme temperature anomalies (standardized) experienced during the event. The purple star indicates the center of the extreme event. Green hatching illustrates all areas under the effect of extremes at some time during the event.


Fig. 2: Evolution of temperature at the center of the event. The climatological percentile distribution is illustrated with color shadings.


Fig. 3: Maps illustrating the evolution of standardized temperature anomalies during the event.

Event ID: Cold_spell_2018-Jan-19_to_2018-Jan-27_33.0_-69.5

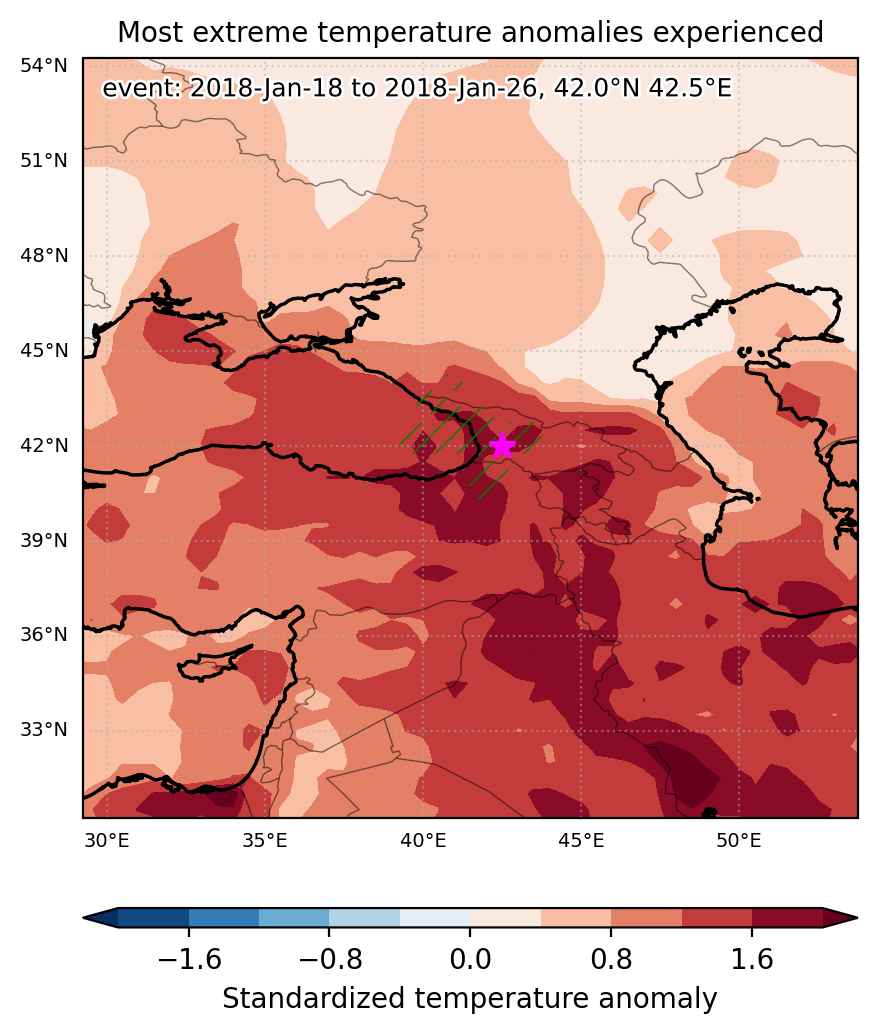
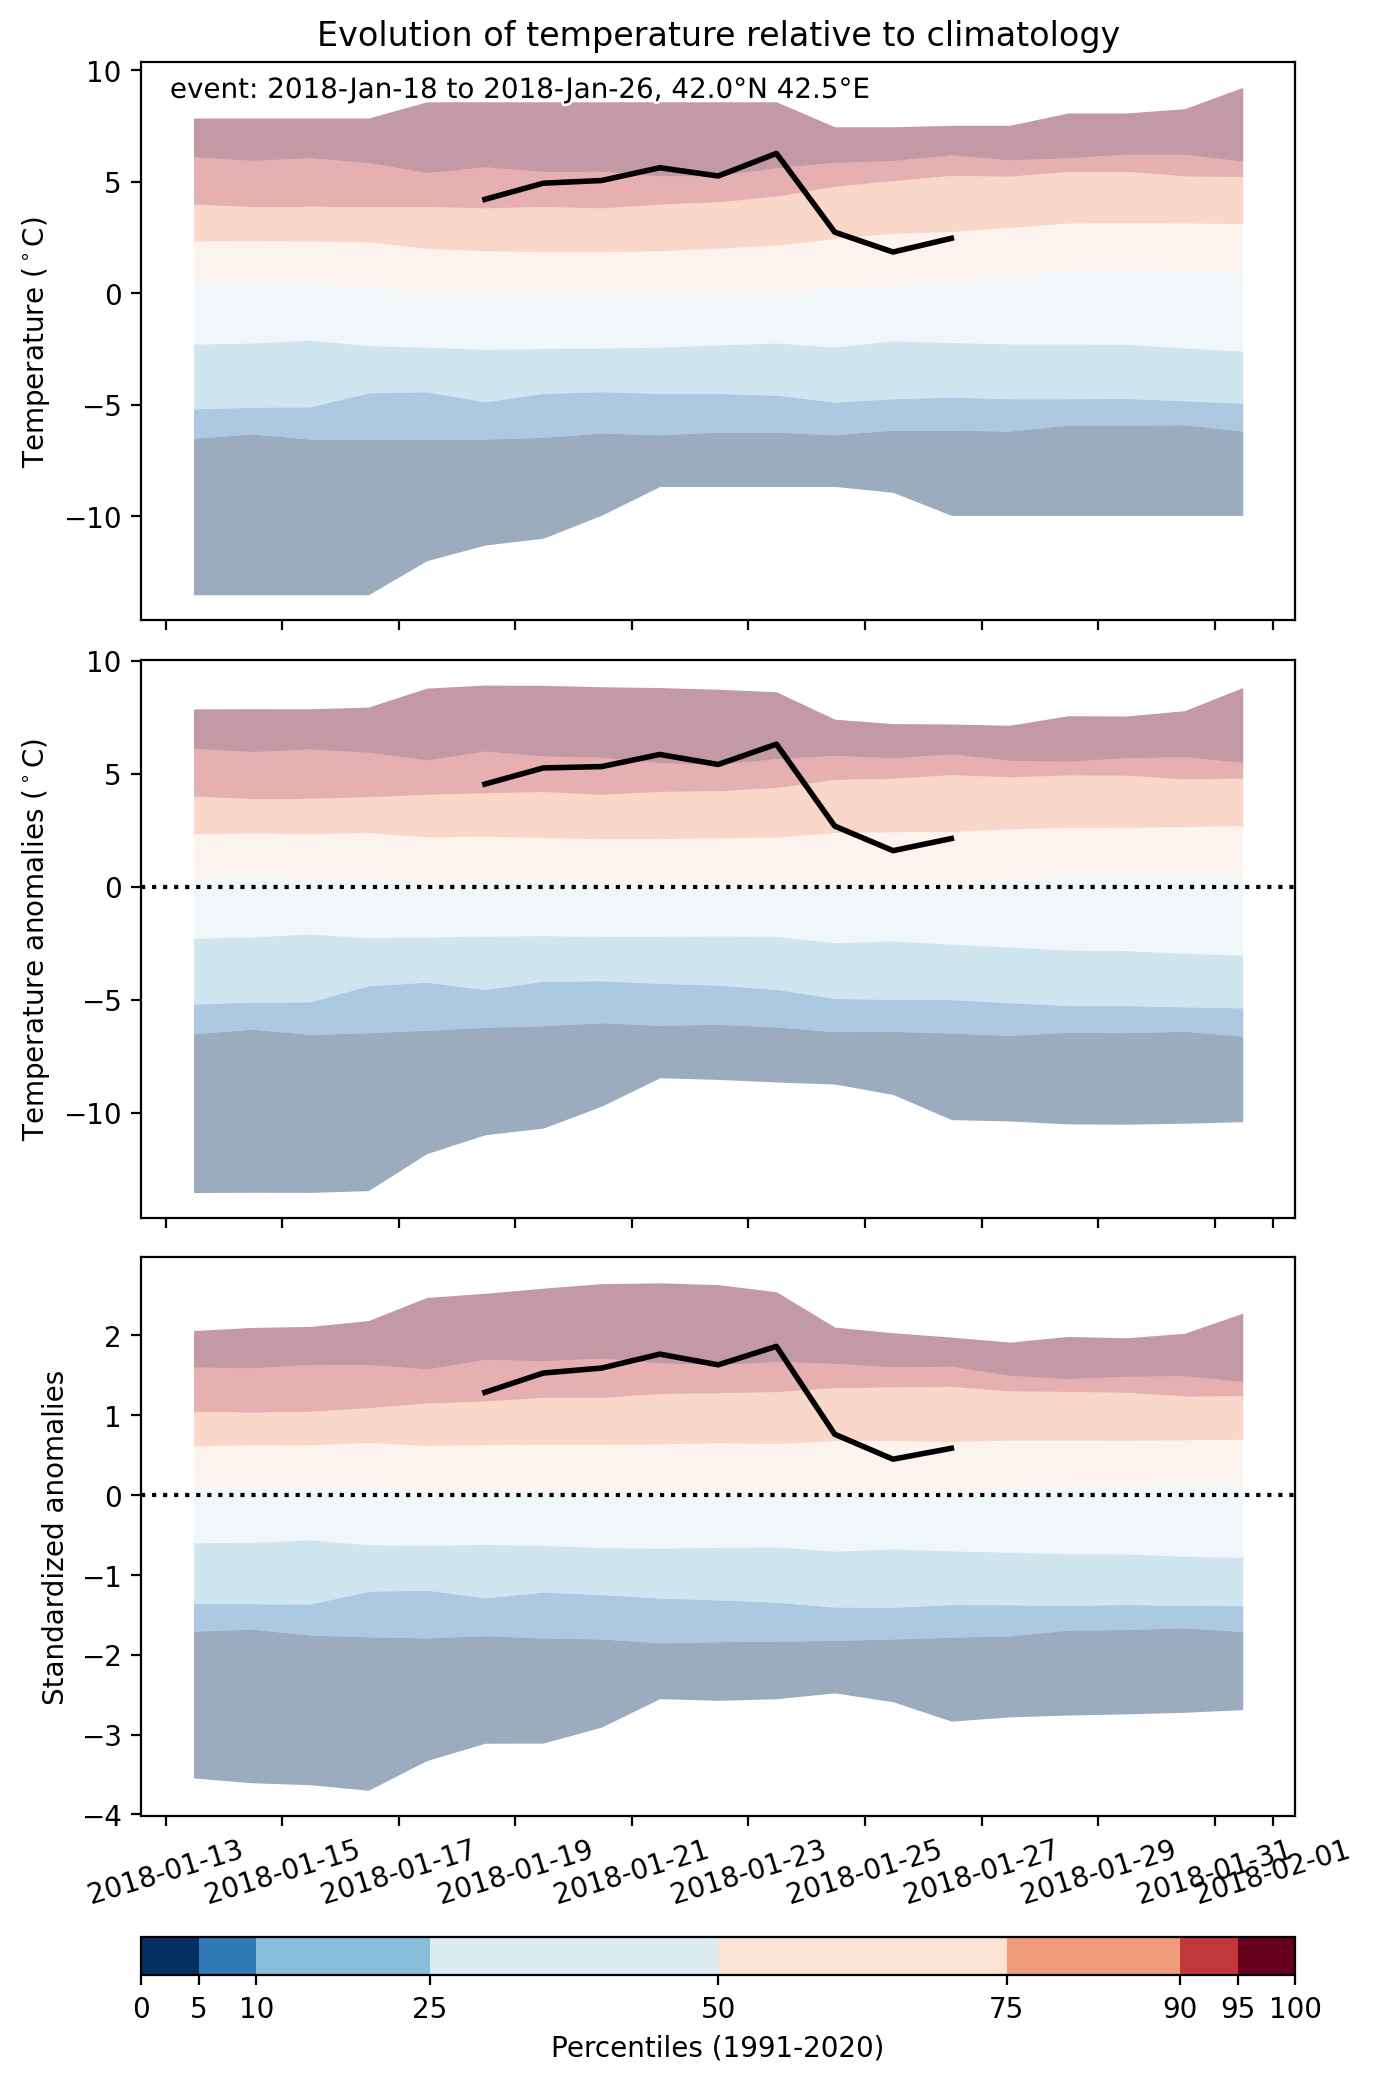
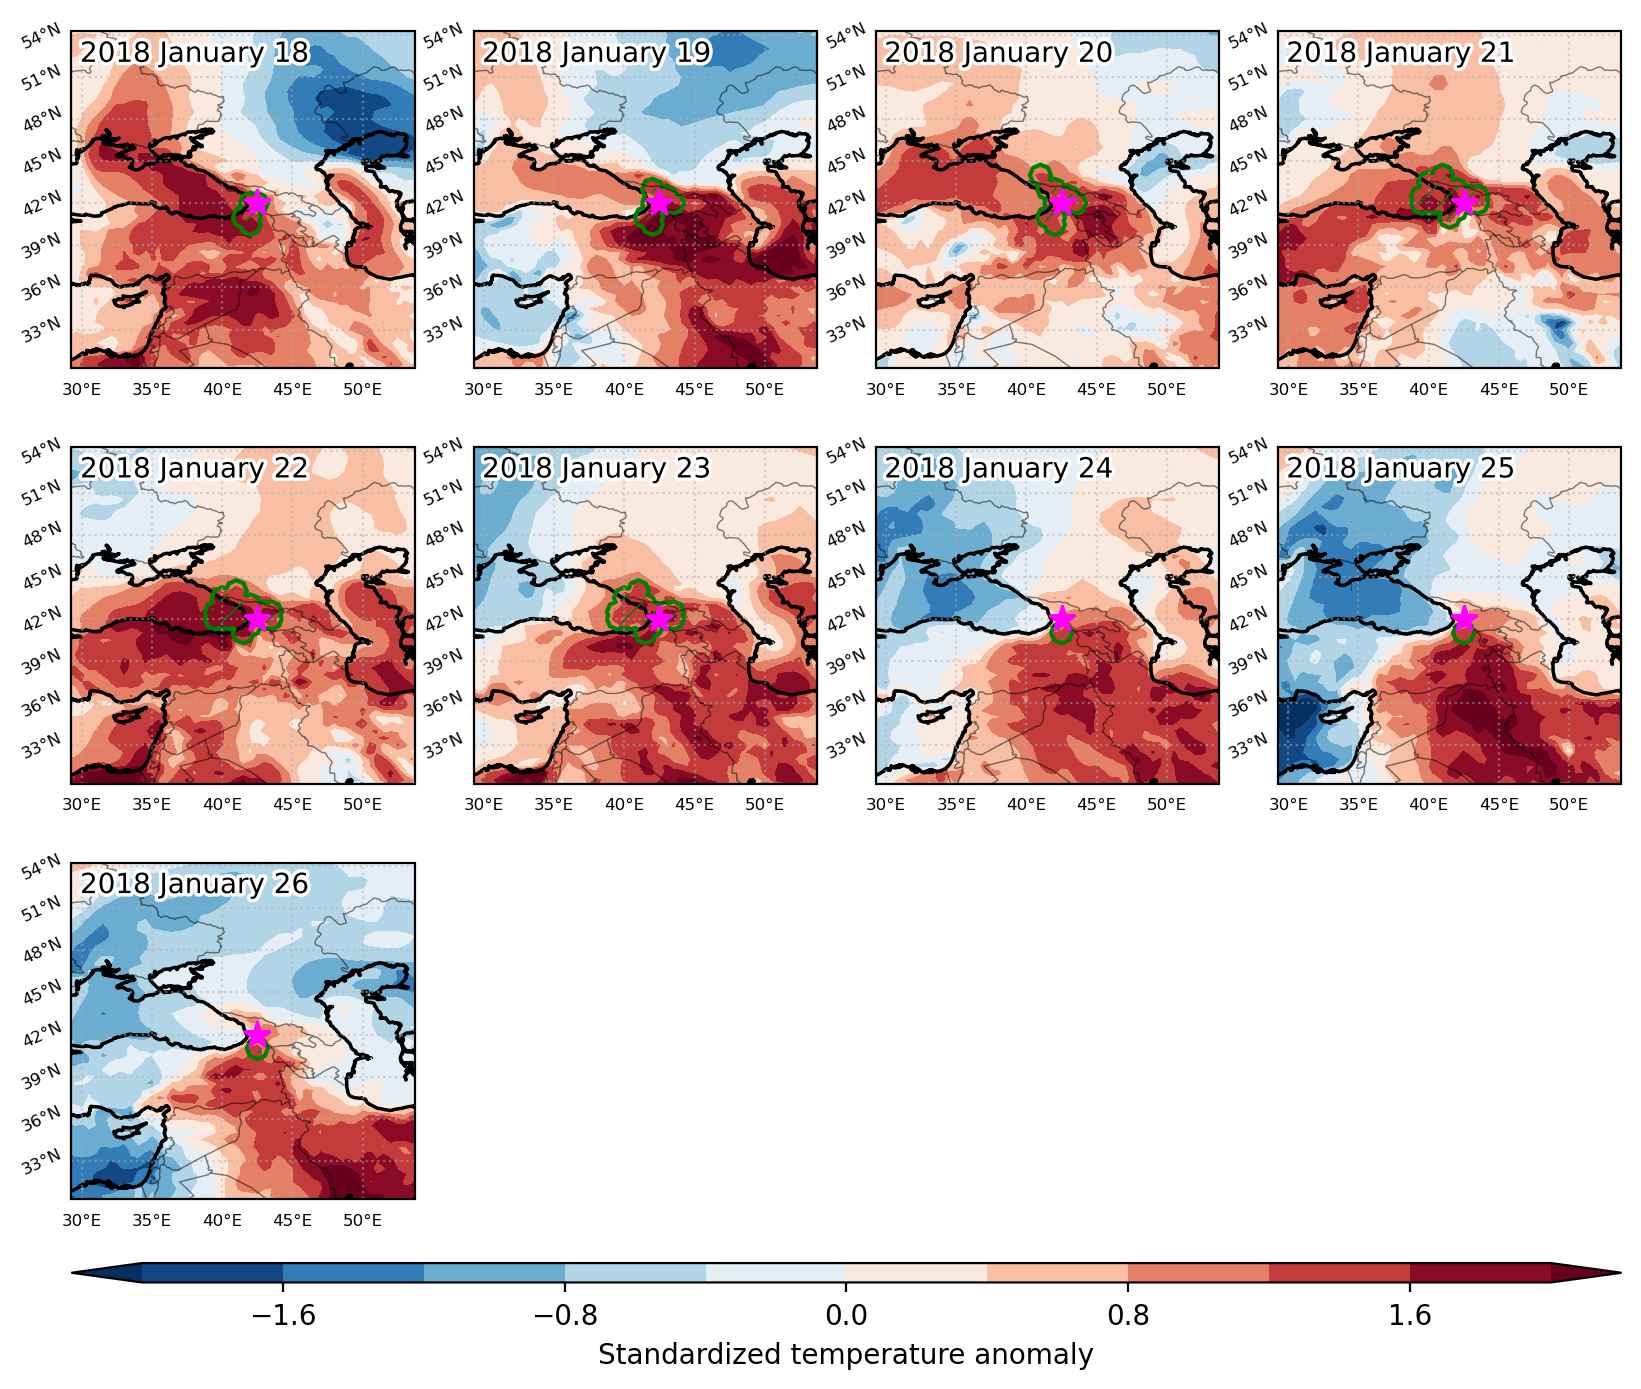
Heat wave occuring from January 18 2018 to January 26 2018 at 42.0°N 42.5°E

Download data: JSON

Event type: Heat wave

Countries affected (identified with ArcGIS Online; provided only for geographical reference):

  • Georgia
  • Russian Federation
  • Turkiye

Duration: 9 days

Time span: January 18 2018 to January 26 2018

Statistics over entire affected area:

  • Mean temperature anomaly: 4.8 °C
  • Mean temperature: 5.1 °C
  • Maximum temperature anomaly: 8.5 °C
  • Maximum temperature: 12.0 °C

Event center: 42.0°N 42.5°E

Area affected: 66320 km$^2$


Fig. 1: Map of most extreme temperature anomalies (standardized) experienced during the event. The purple star indicates the center of the extreme event. Green hatching illustrates all areas under the effect of extremes at some time during the event.


Fig. 2: Evolution of temperature at the center of the event. The climatological percentile distribution is illustrated with color shadings.


Fig. 3: Maps illustrating the evolution of standardized temperature anomalies during the event.

Event ID: Heat_wave_2018-Jan-18_to_2018-Jan-26_42.5_42.0

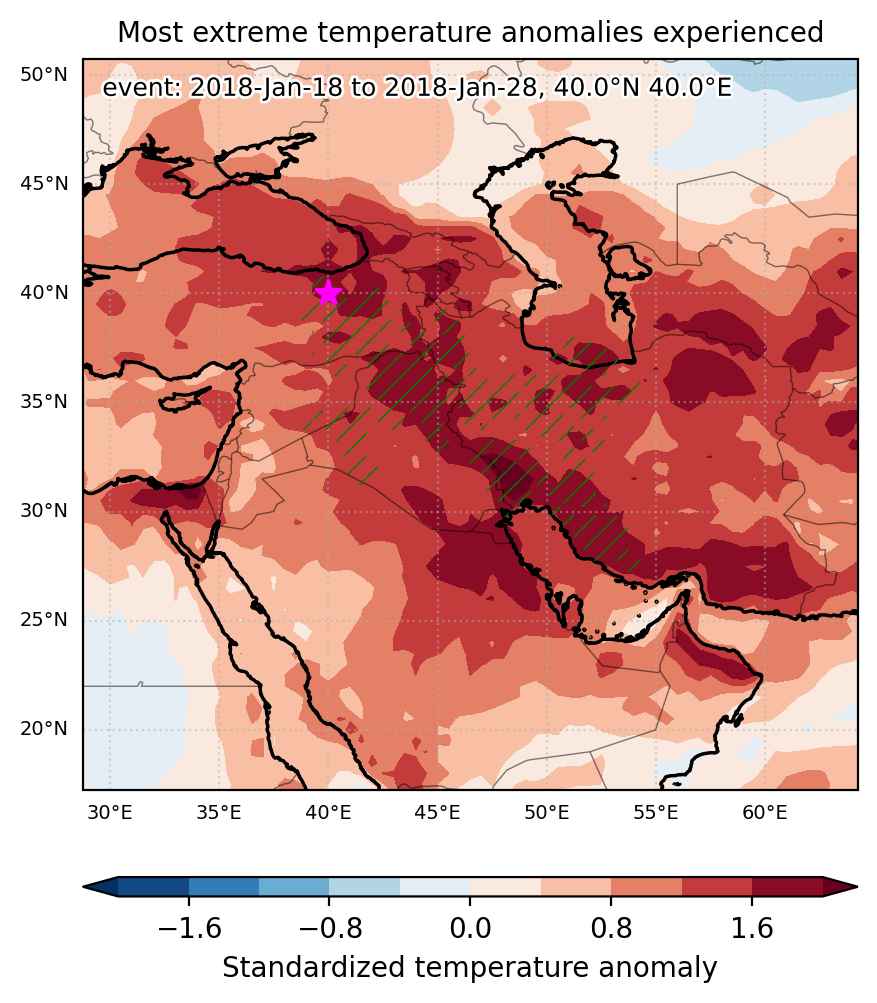
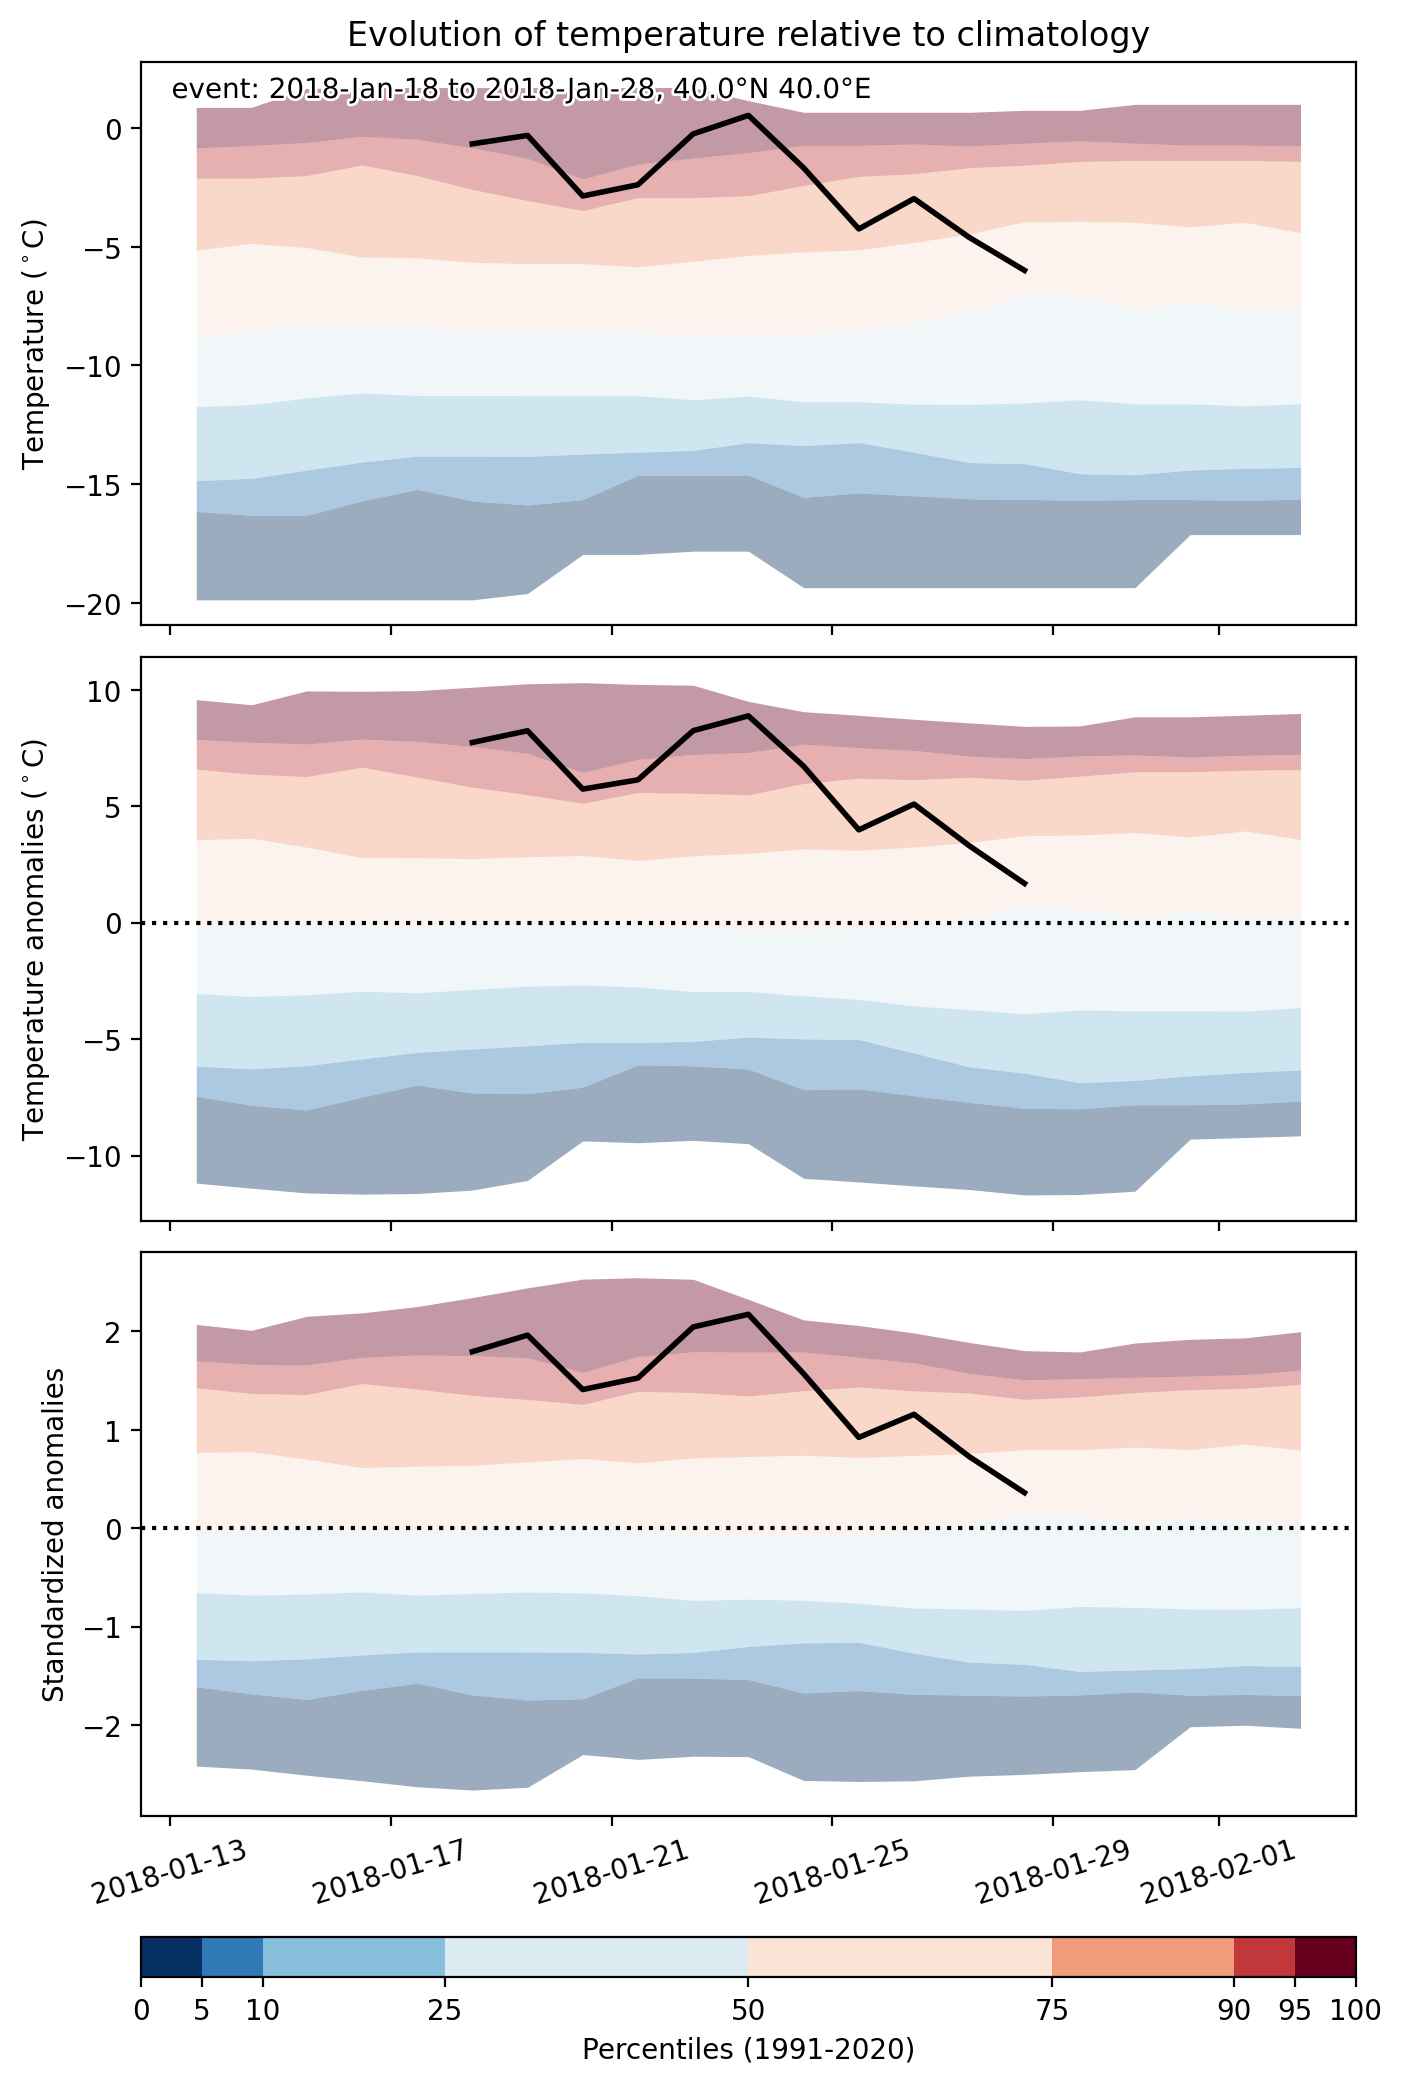
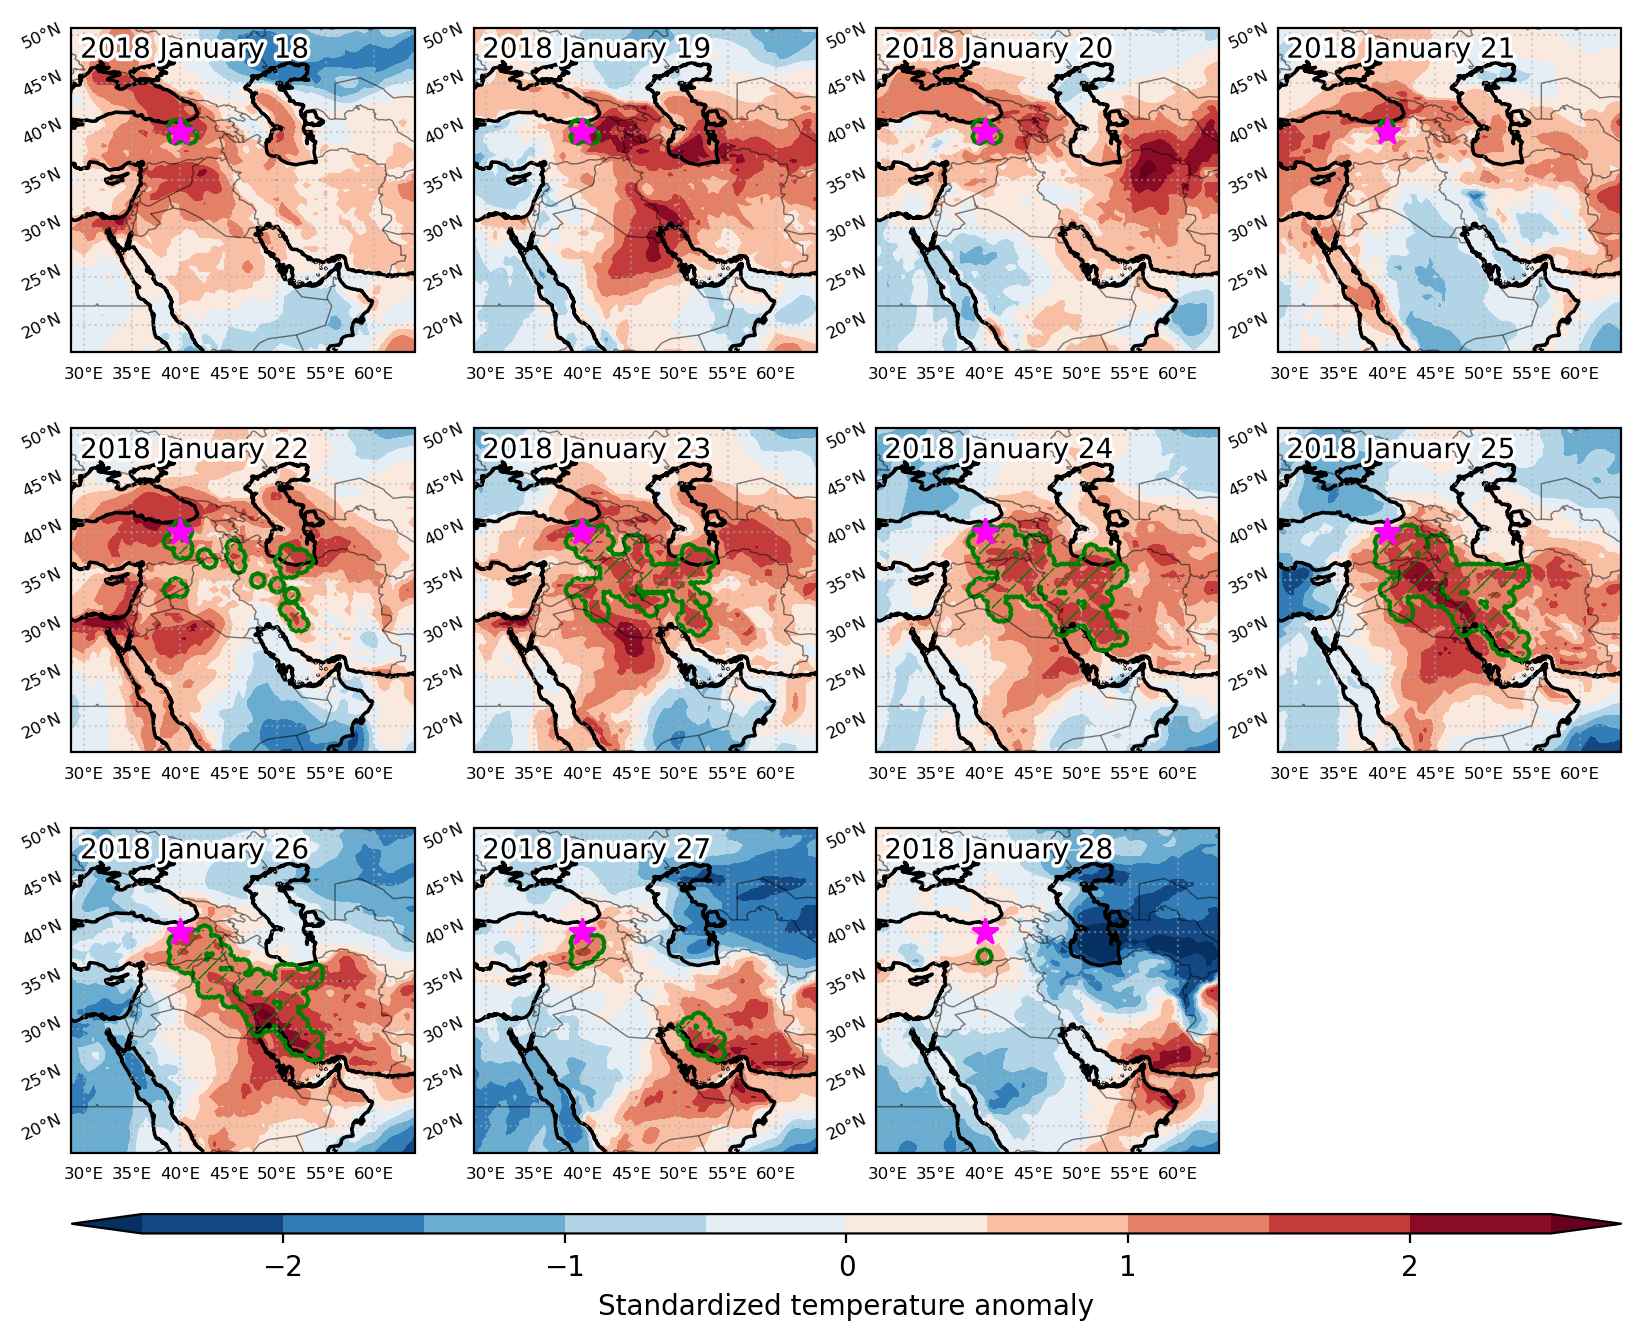
Heat wave occuring from January 18 2018 to January 28 2018 at 40.0°N 40.0°E

Download data: JSON

Event type: Heat wave

Countries affected (identified with ArcGIS Online; provided only for geographical reference):

  • Azerbaijan
  • Iran
  • Iraq
  • Syria
  • Turkiye

Duration: 11 days

Time span: January 18 2018 to January 28 2018

Statistics over entire affected area:

  • Mean temperature anomaly: 5.5 °C
  • Mean temperature: 8.4 °C
  • Maximum temperature anomaly: 9.7 °C
  • Maximum temperature: 20.6 °C

Event center: 40.0°N 40.0°E

Area affected: 736090 km$^2$


Fig. 1: Map of most extreme temperature anomalies (standardized) experienced during the event. The purple star indicates the center of the extreme event. Green hatching illustrates all areas under the effect of extremes at some time during the event.


Fig. 2: Evolution of temperature at the center of the event. The climatological percentile distribution is illustrated with color shadings.


Fig. 3: Maps illustrating the evolution of standardized temperature anomalies during the event.

Event ID: Heat_wave_2018-Jan-18_to_2018-Jan-28_40.0_40.0

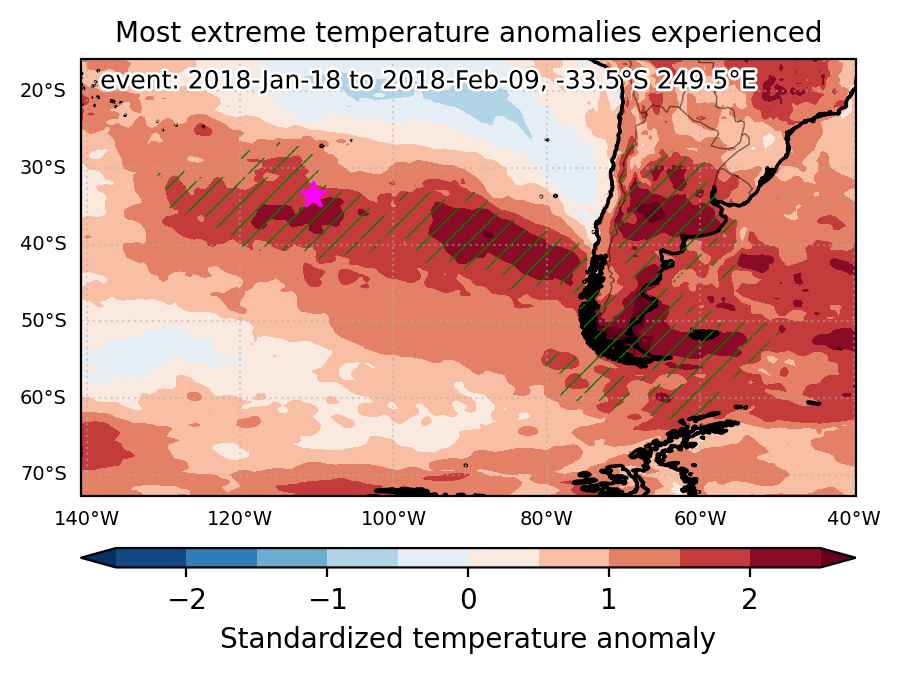
Heat wave occuring from January 18 2018 to February 09 2018 at -33.5°S 249.5°E

Download data: JSON

Event type: Heat wave

Countries affected (identified with ArcGIS Online; provided only for geographical reference):

  • Antarctica
  • Argentina
  • Chile
  • Falkland Islands
  • Uruguay

Duration: 23 days

Time span: January 18 2018 to February 09 2018

Statistics over entire affected area:

  • Mean temperature anomaly: 3.3 °C
  • Mean temperature: 20.4 °C
  • Maximum temperature anomaly: 12.8 °C
  • Maximum temperature: 35.4 °C

Event center: -33.5°S 249.5°E

Area affected: 8289334 km$^2$


Fig. 1: Map of most extreme temperature anomalies (standardized) experienced during the event. The purple star indicates the center of the extreme event. Green hatching illustrates all areas under the effect of extremes at some time during the event.


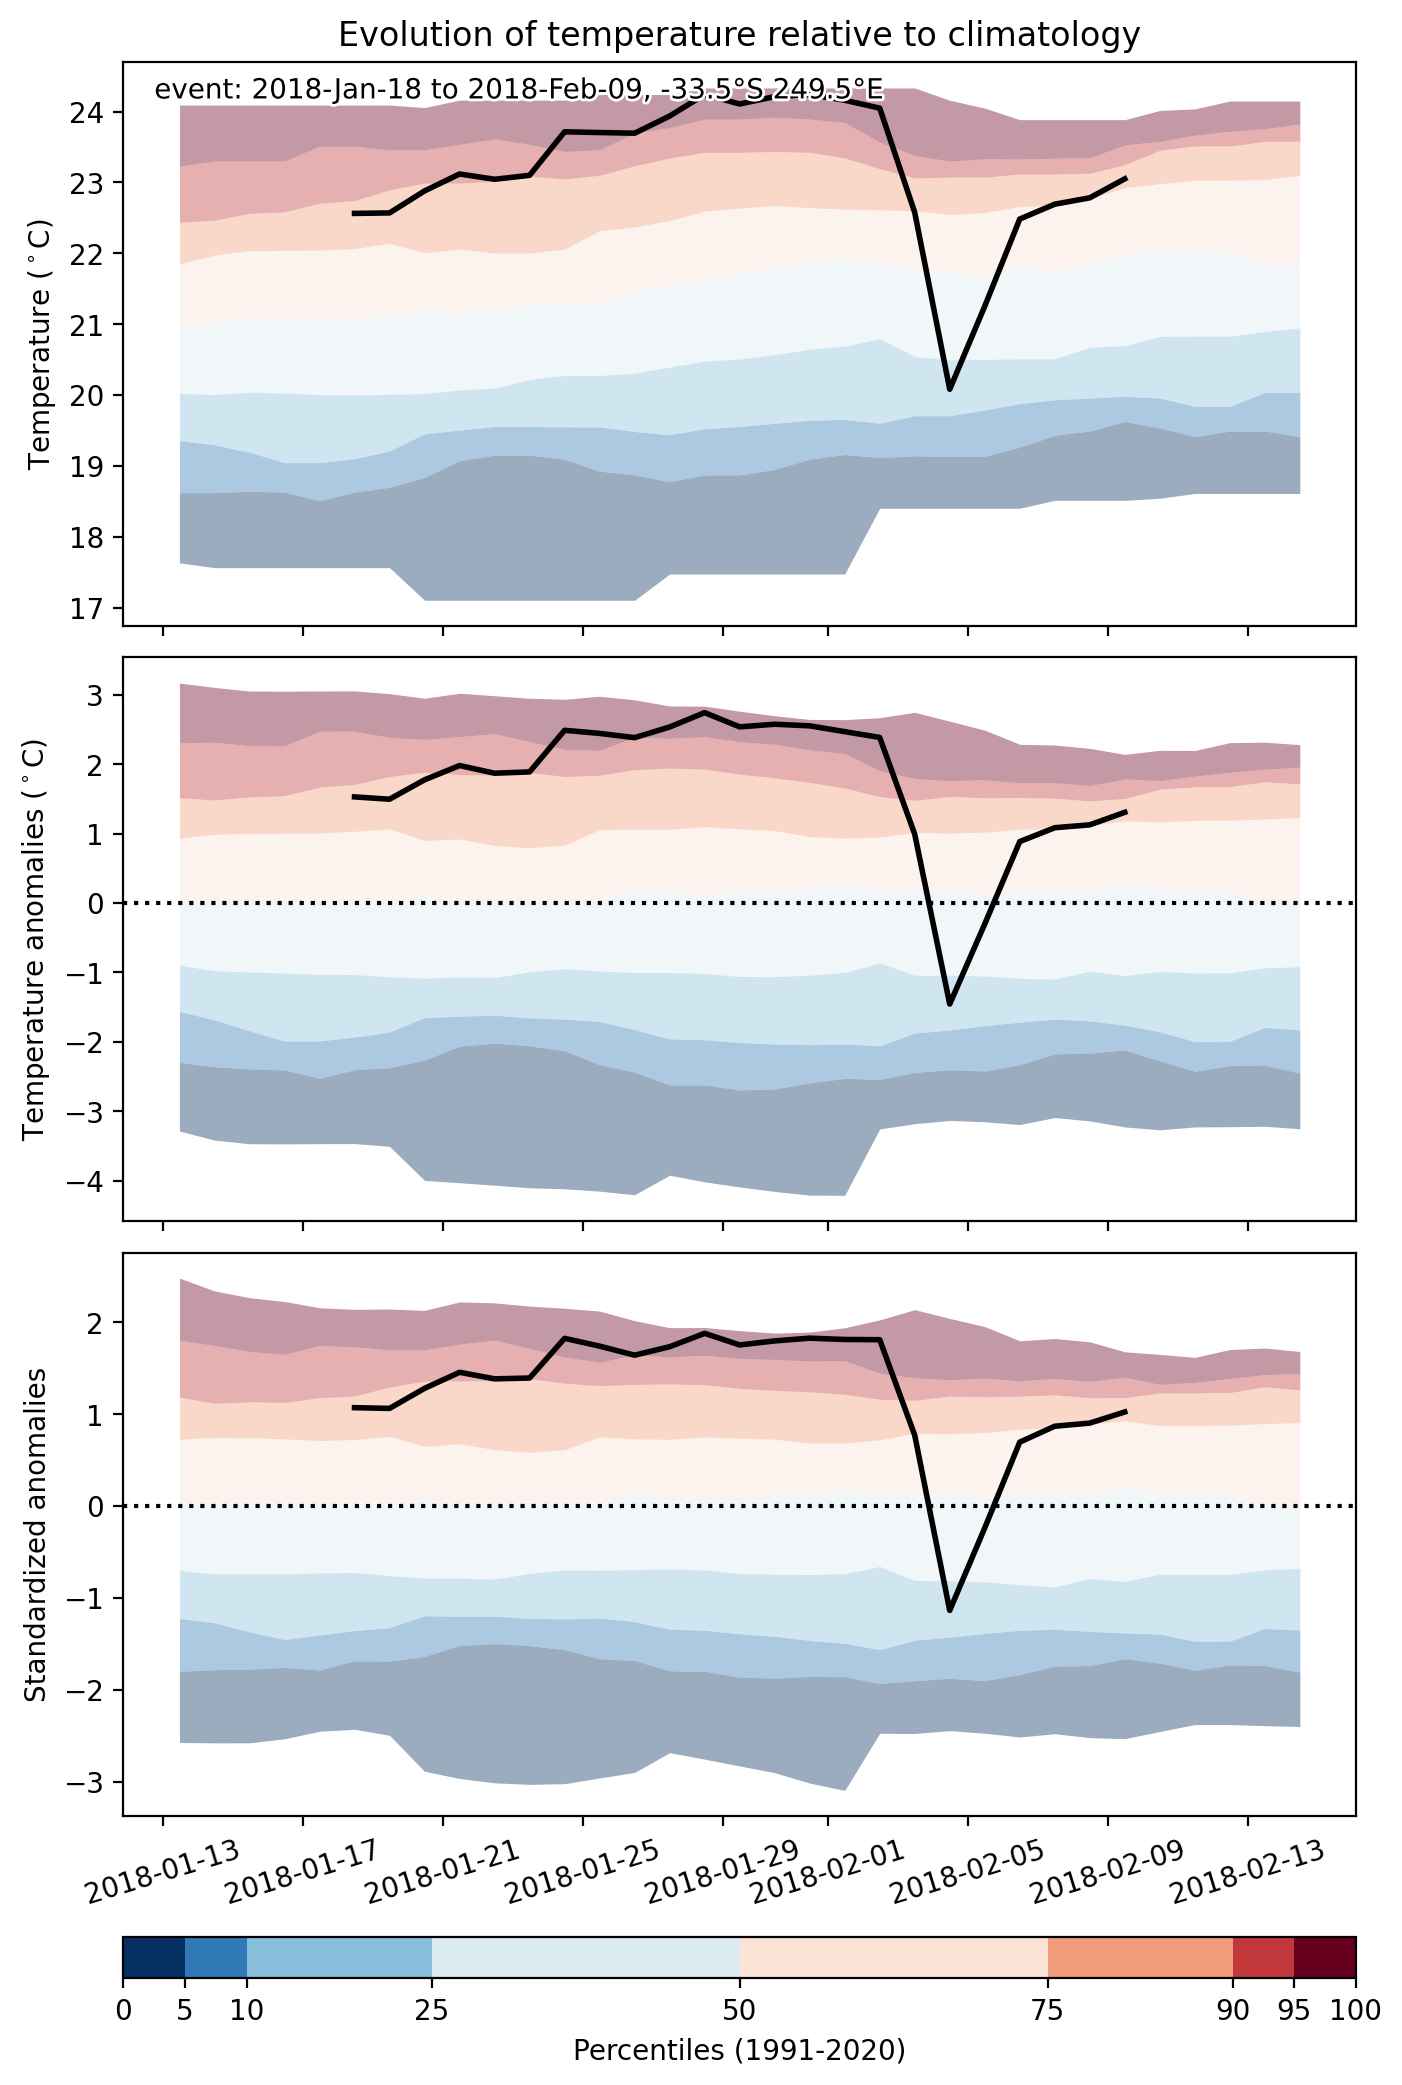
Fig. 2: Evolution of temperature at the center of the event. The climatological percentile distribution is illustrated with color shadings.


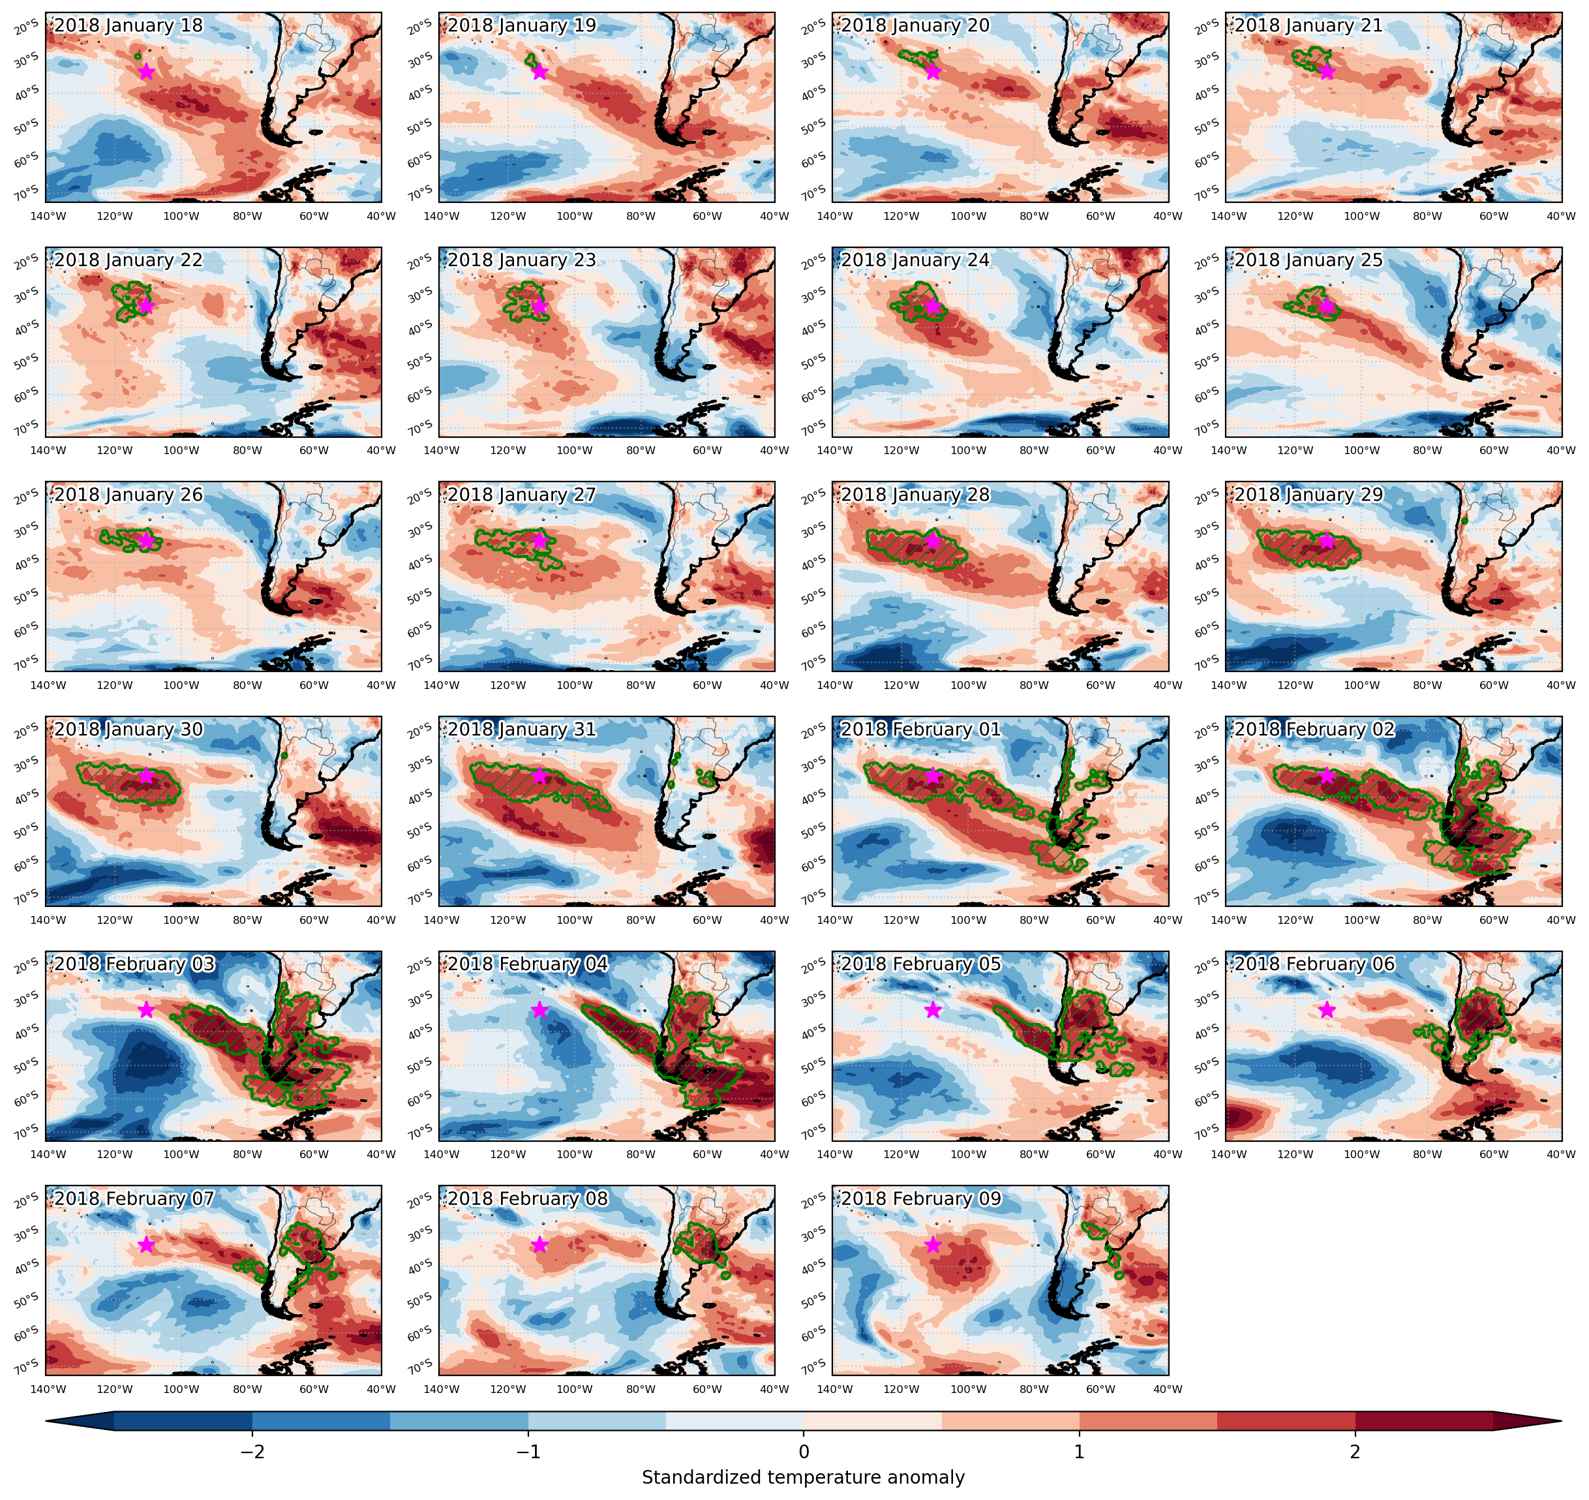
Fig. 3: Maps illustrating the evolution of standardized temperature anomalies during the event.

Event ID: Heat_wave_2018-Jan-18_to_2018-Feb-09_249.5_-33.5

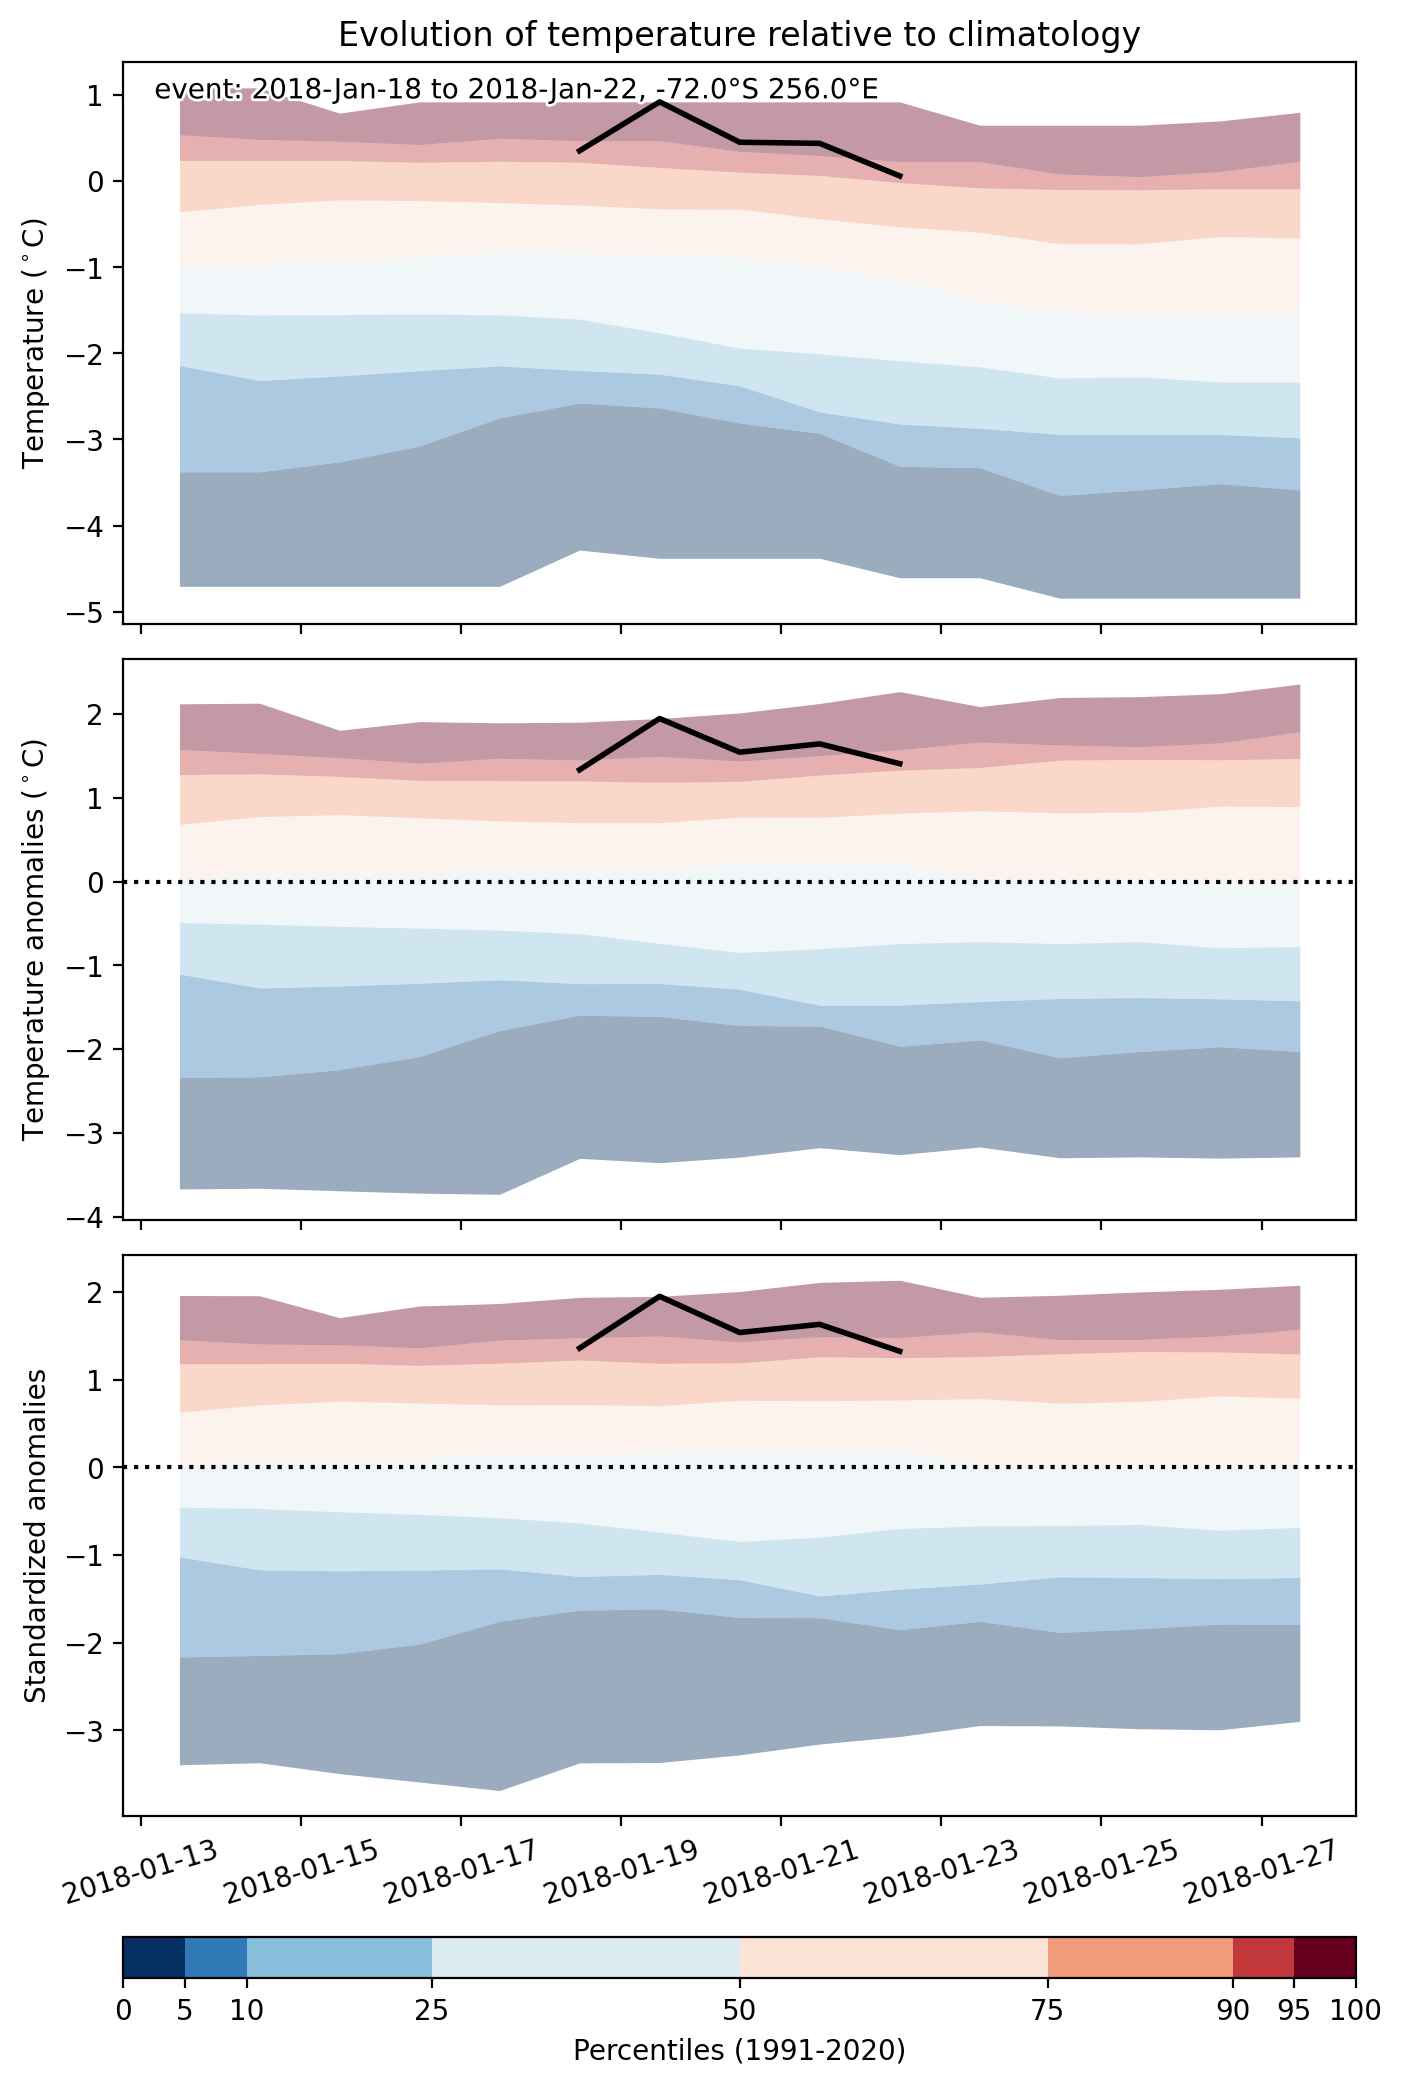
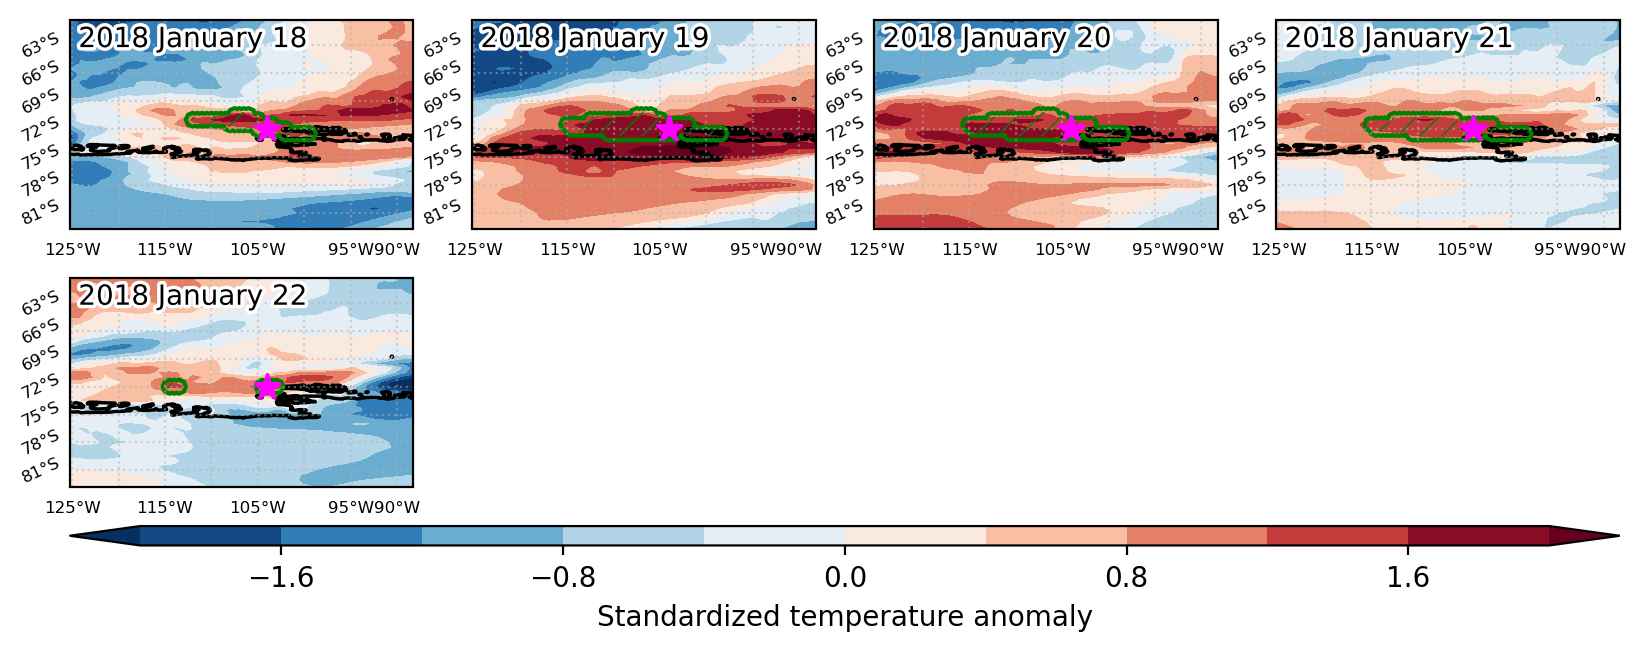
Heat wave occuring from January 18 2018 to January 22 2018 at -72.0°S 256.0°E

Download data: JSON

Event type: Heat wave

Countries affected (identified with ArcGIS Online; provided only for geographical reference):

  • Antarctica

Duration: 5 days

Time span: January 18 2018 to January 22 2018

Statistics over entire affected area:

  • Mean temperature anomaly: 1.6 °C
  • Mean temperature: 0.3 °C
  • Maximum temperature anomaly: 4.8 °C
  • Maximum temperature: 1.2 °C

Event center: -72.0°S 256.0°E

Area affected: 91943 km$^2$


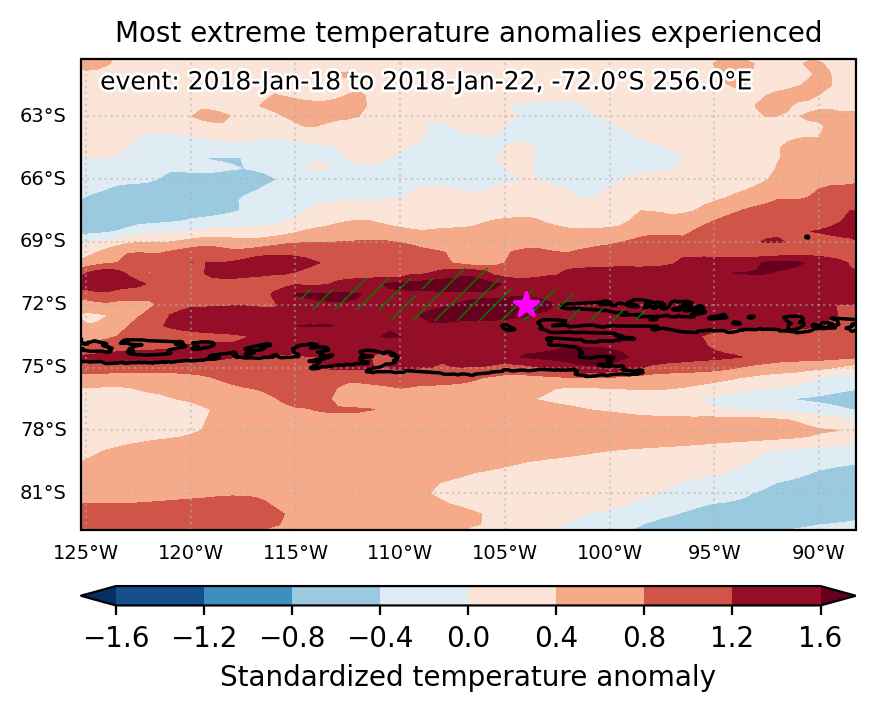
Fig. 1: Map of most extreme temperature anomalies (standardized) experienced during the event. The purple star indicates the center of the extreme event. Green hatching illustrates all areas under the effect of extremes at some time during the event.


Fig. 2: Evolution of temperature at the center of the event. The climatological percentile distribution is illustrated with color shadings.


Fig. 3: Maps illustrating the evolution of standardized temperature anomalies during the event.

Event ID: Heat_wave_2018-Jan-18_to_2018-Jan-22_256.0_-72.0