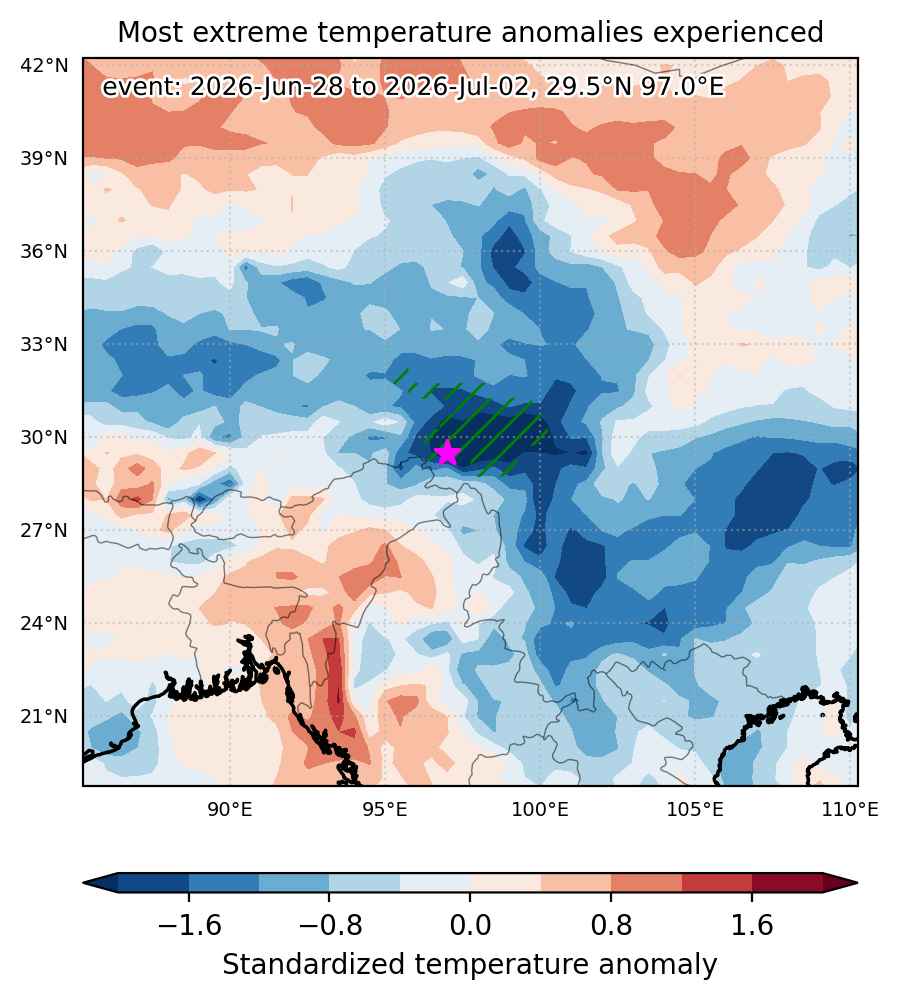
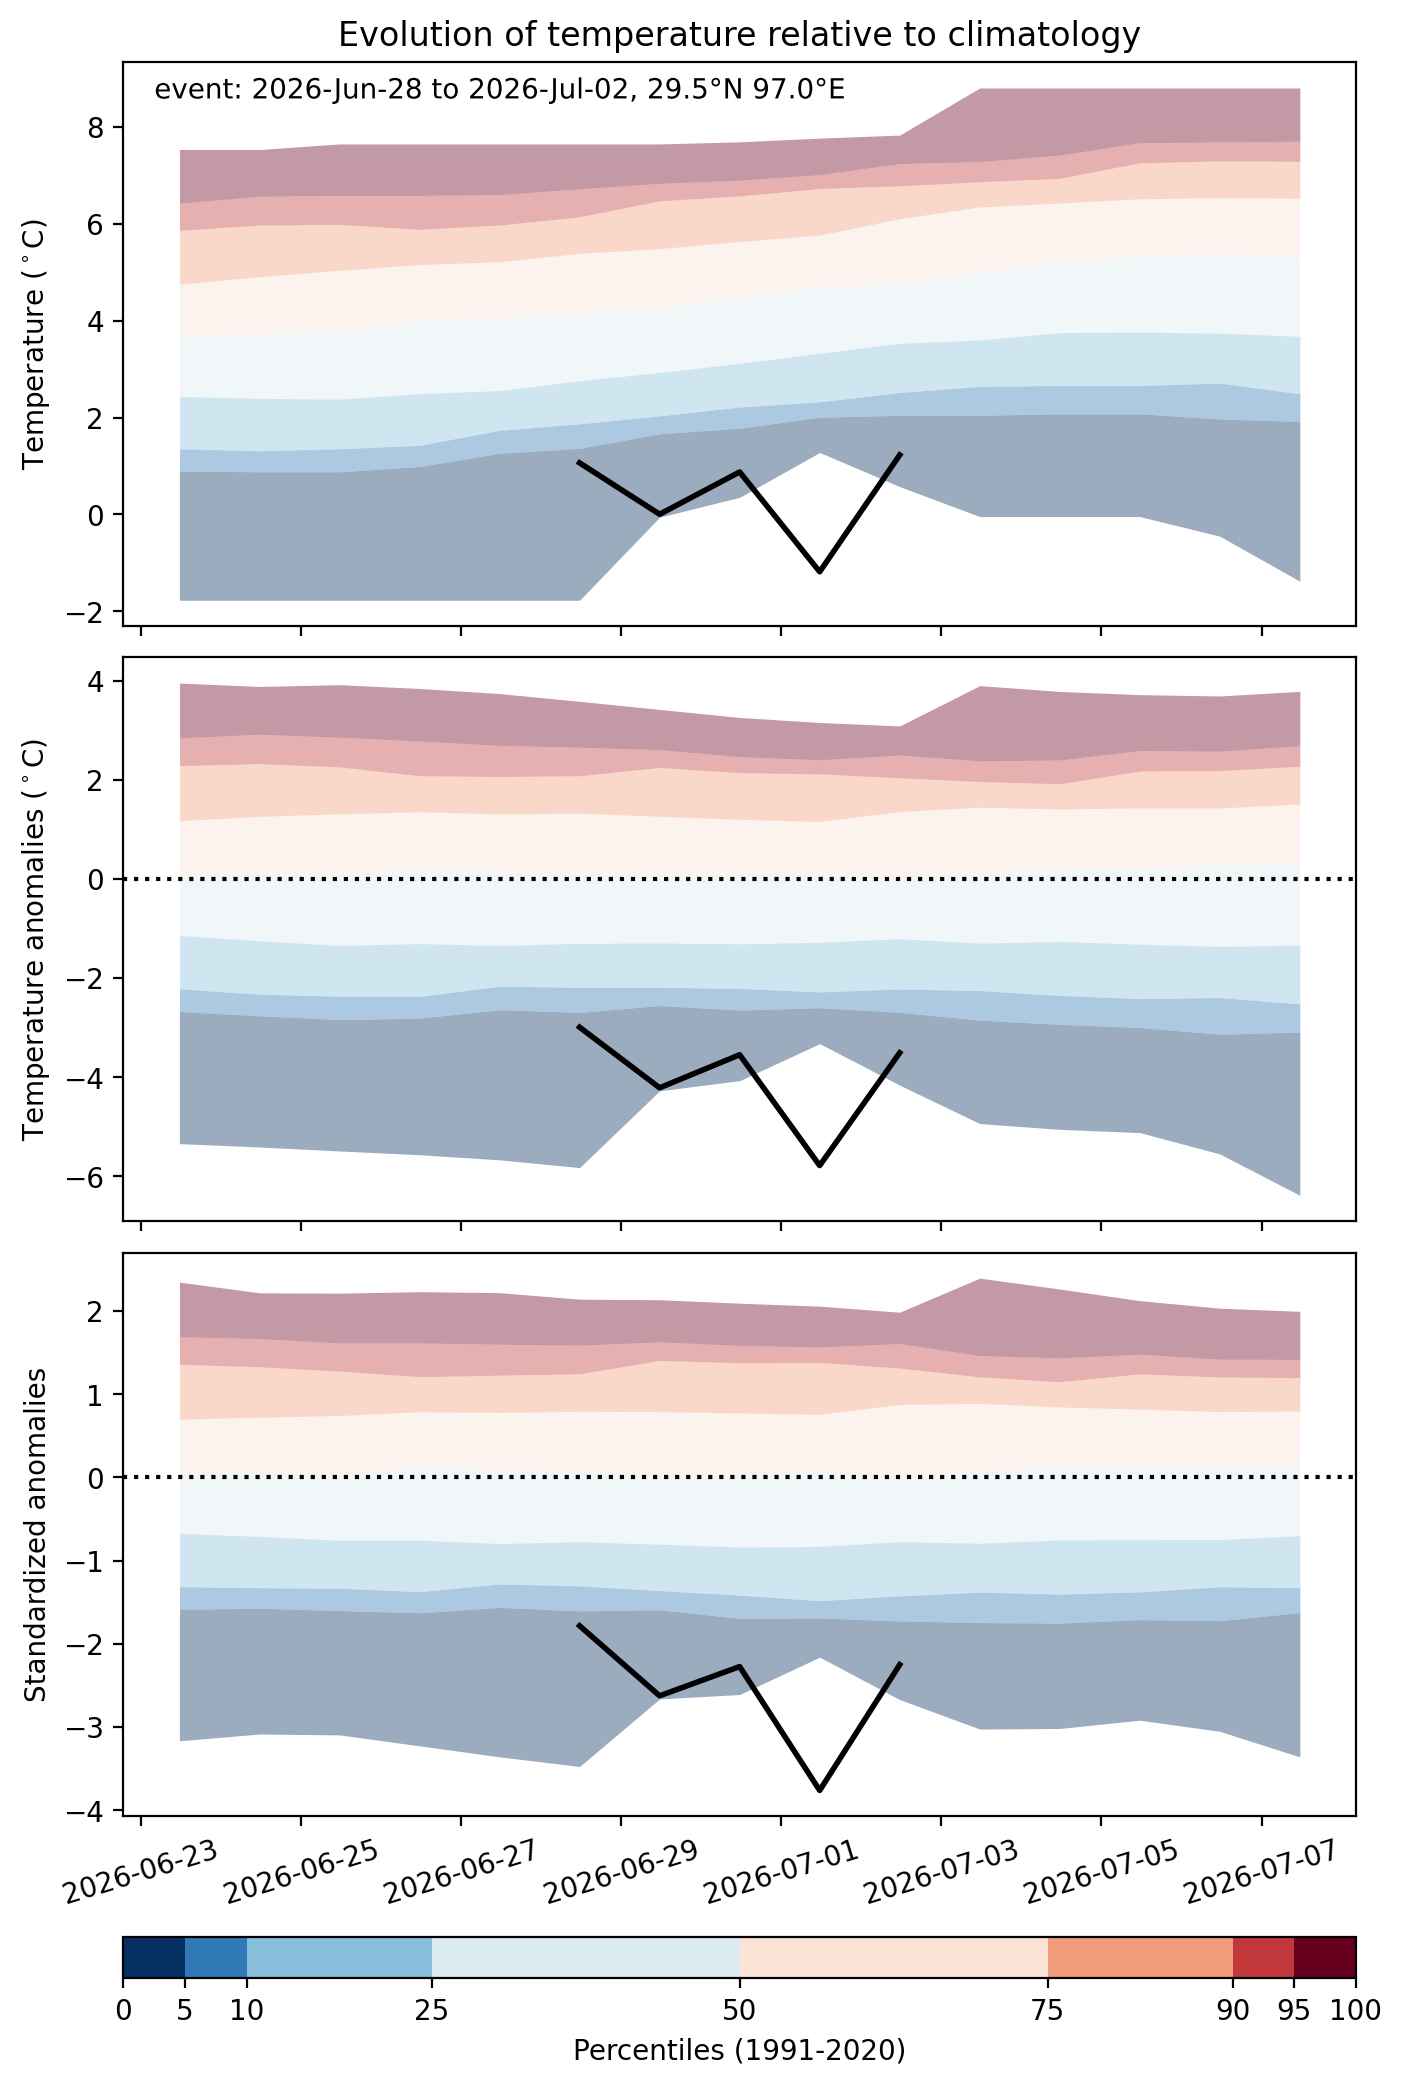
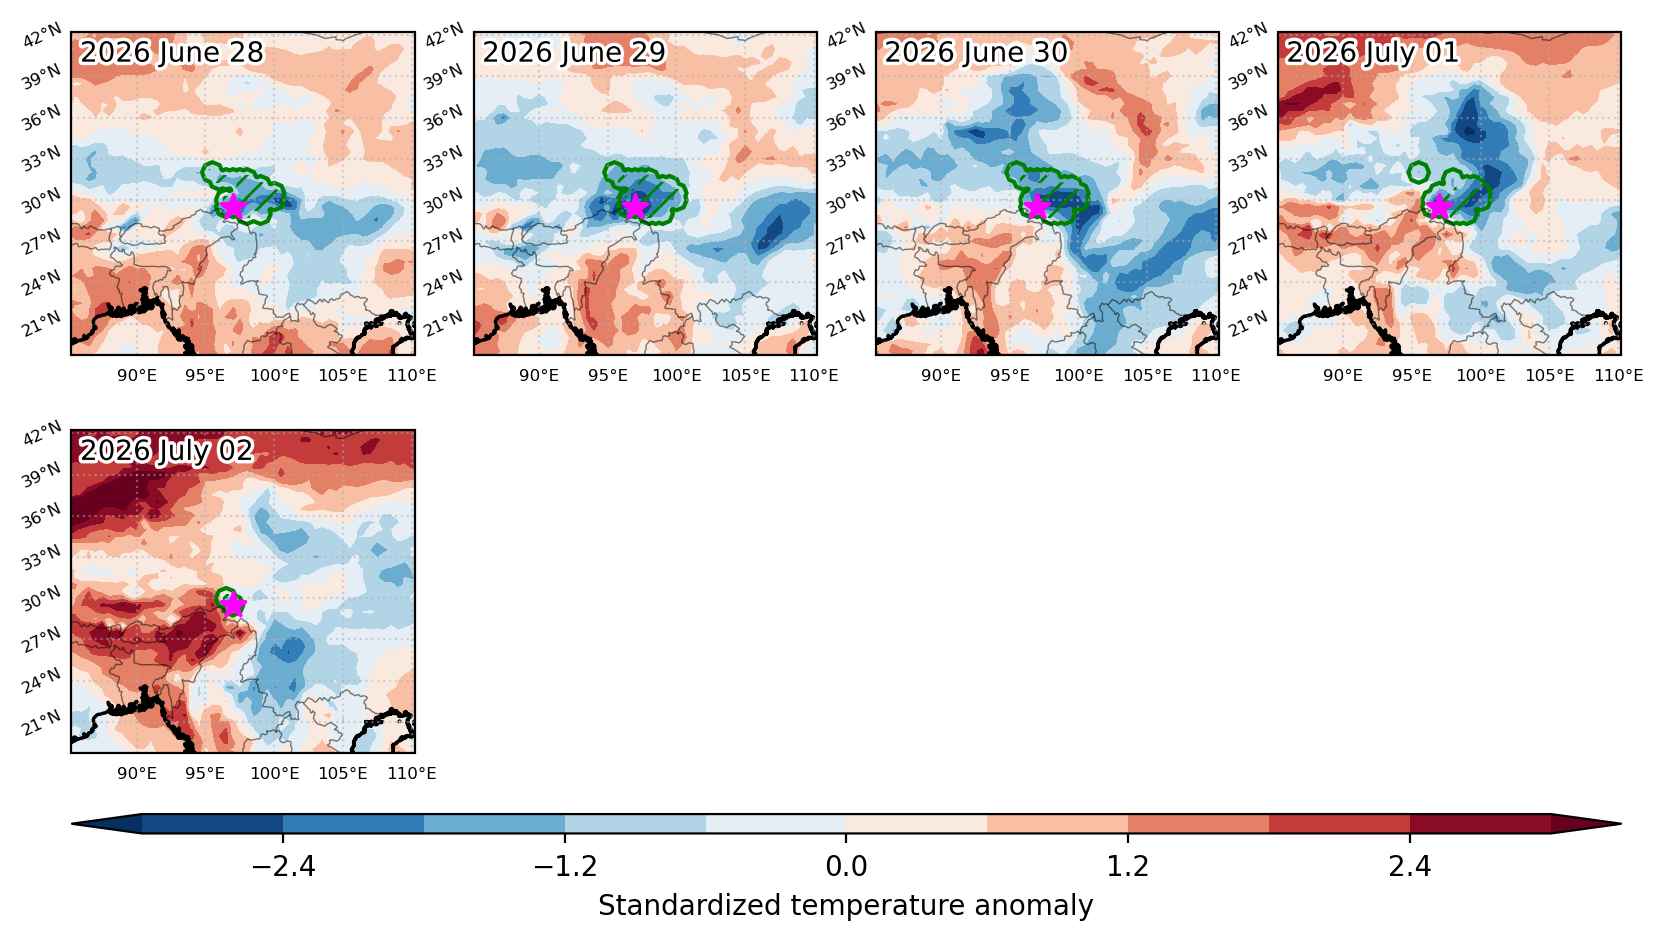
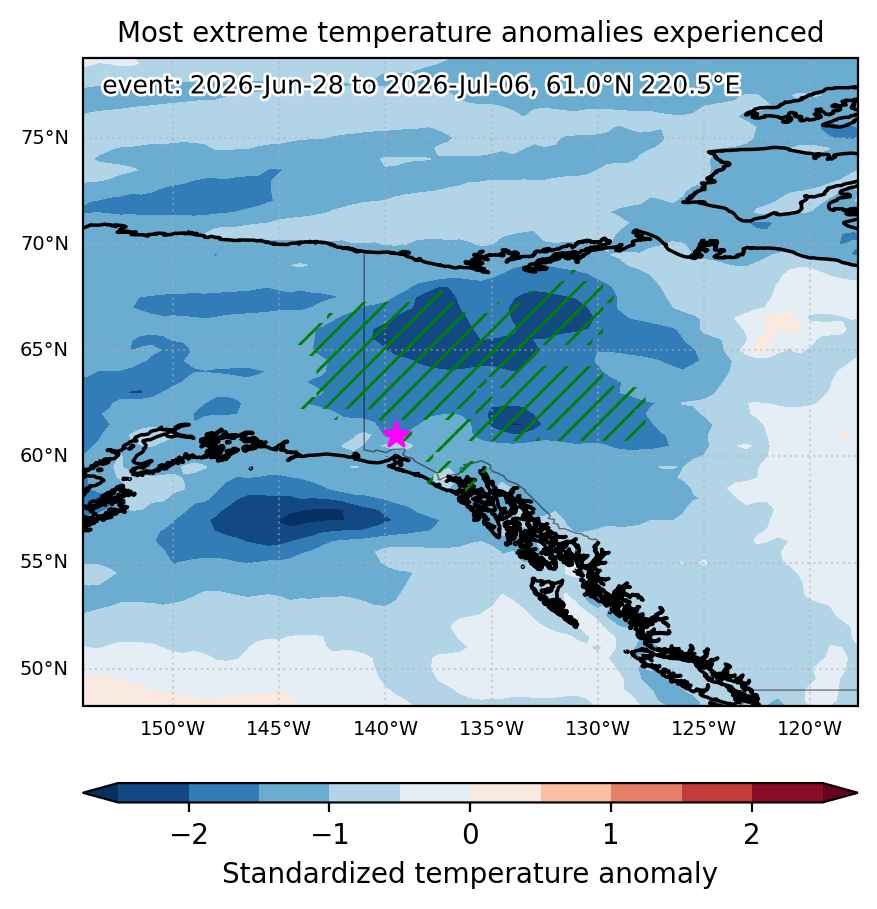
Cold spell occuring from March 18 2026 to March 21 2026 at 31.0°N 74.5°E

Download data: JSON

Event type: Cold spell

Countries affected (identified with ArcGIS Online; provided only for geographical reference):

  • India
  • Pakistan

Duration: 4 days

Time span: March 18 2026 to March 21 2026

Statistics over entire affected area:

  • Mean temperature anomaly: -4.0 °C
  • Mean temperature: 18.4 °C
  • Minimum temperature anomaly: -6.7 °C
  • Minimum temperature: 16.3 °C

Event center: 31.0°N 74.5°E

Area affected: 63954 km$^2$


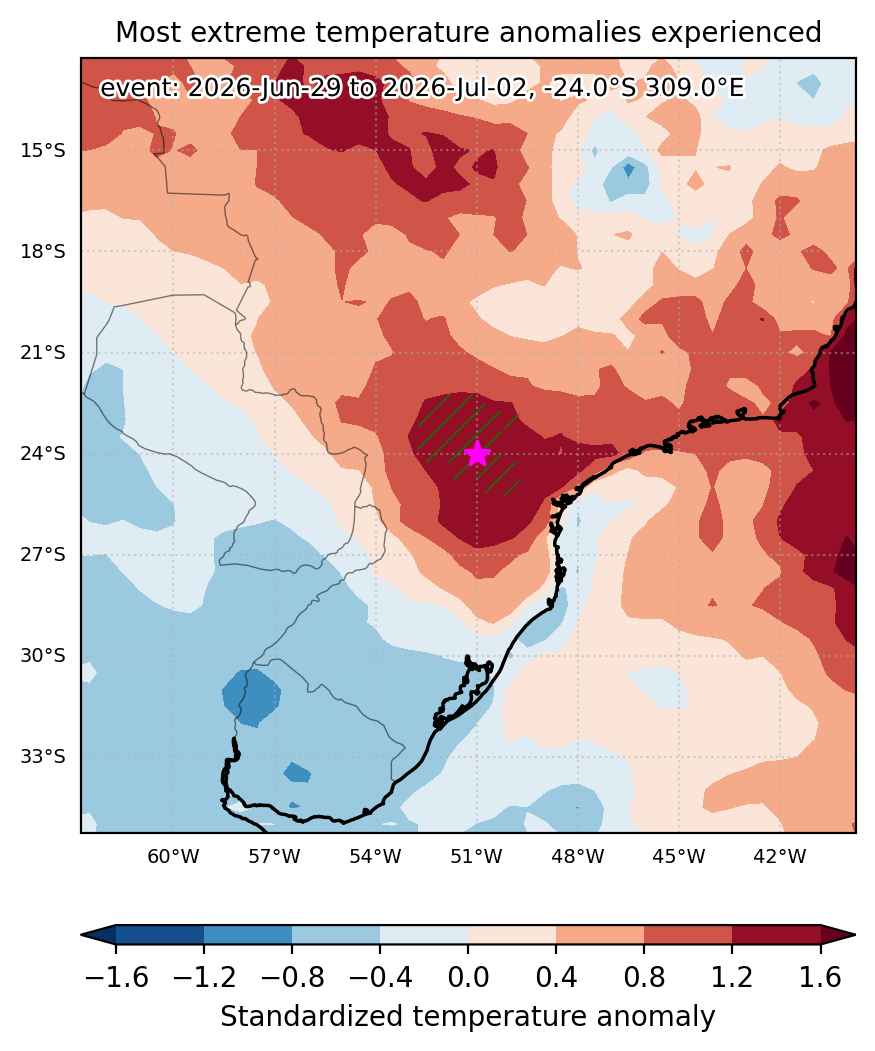
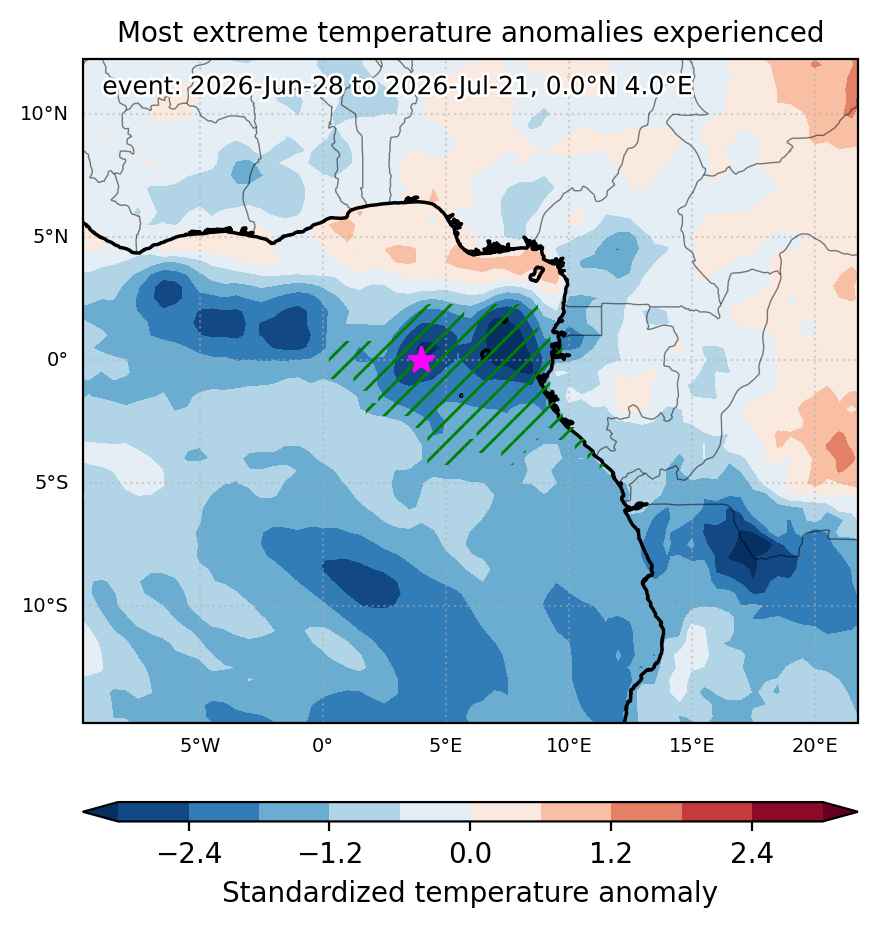
Fig. 1: Map of most extreme temperature anomalies (standardized) experienced during the event. The purple star indicates the center of the extreme event. Green hatching illustrates all areas under the effect of extremes at some time during the event.


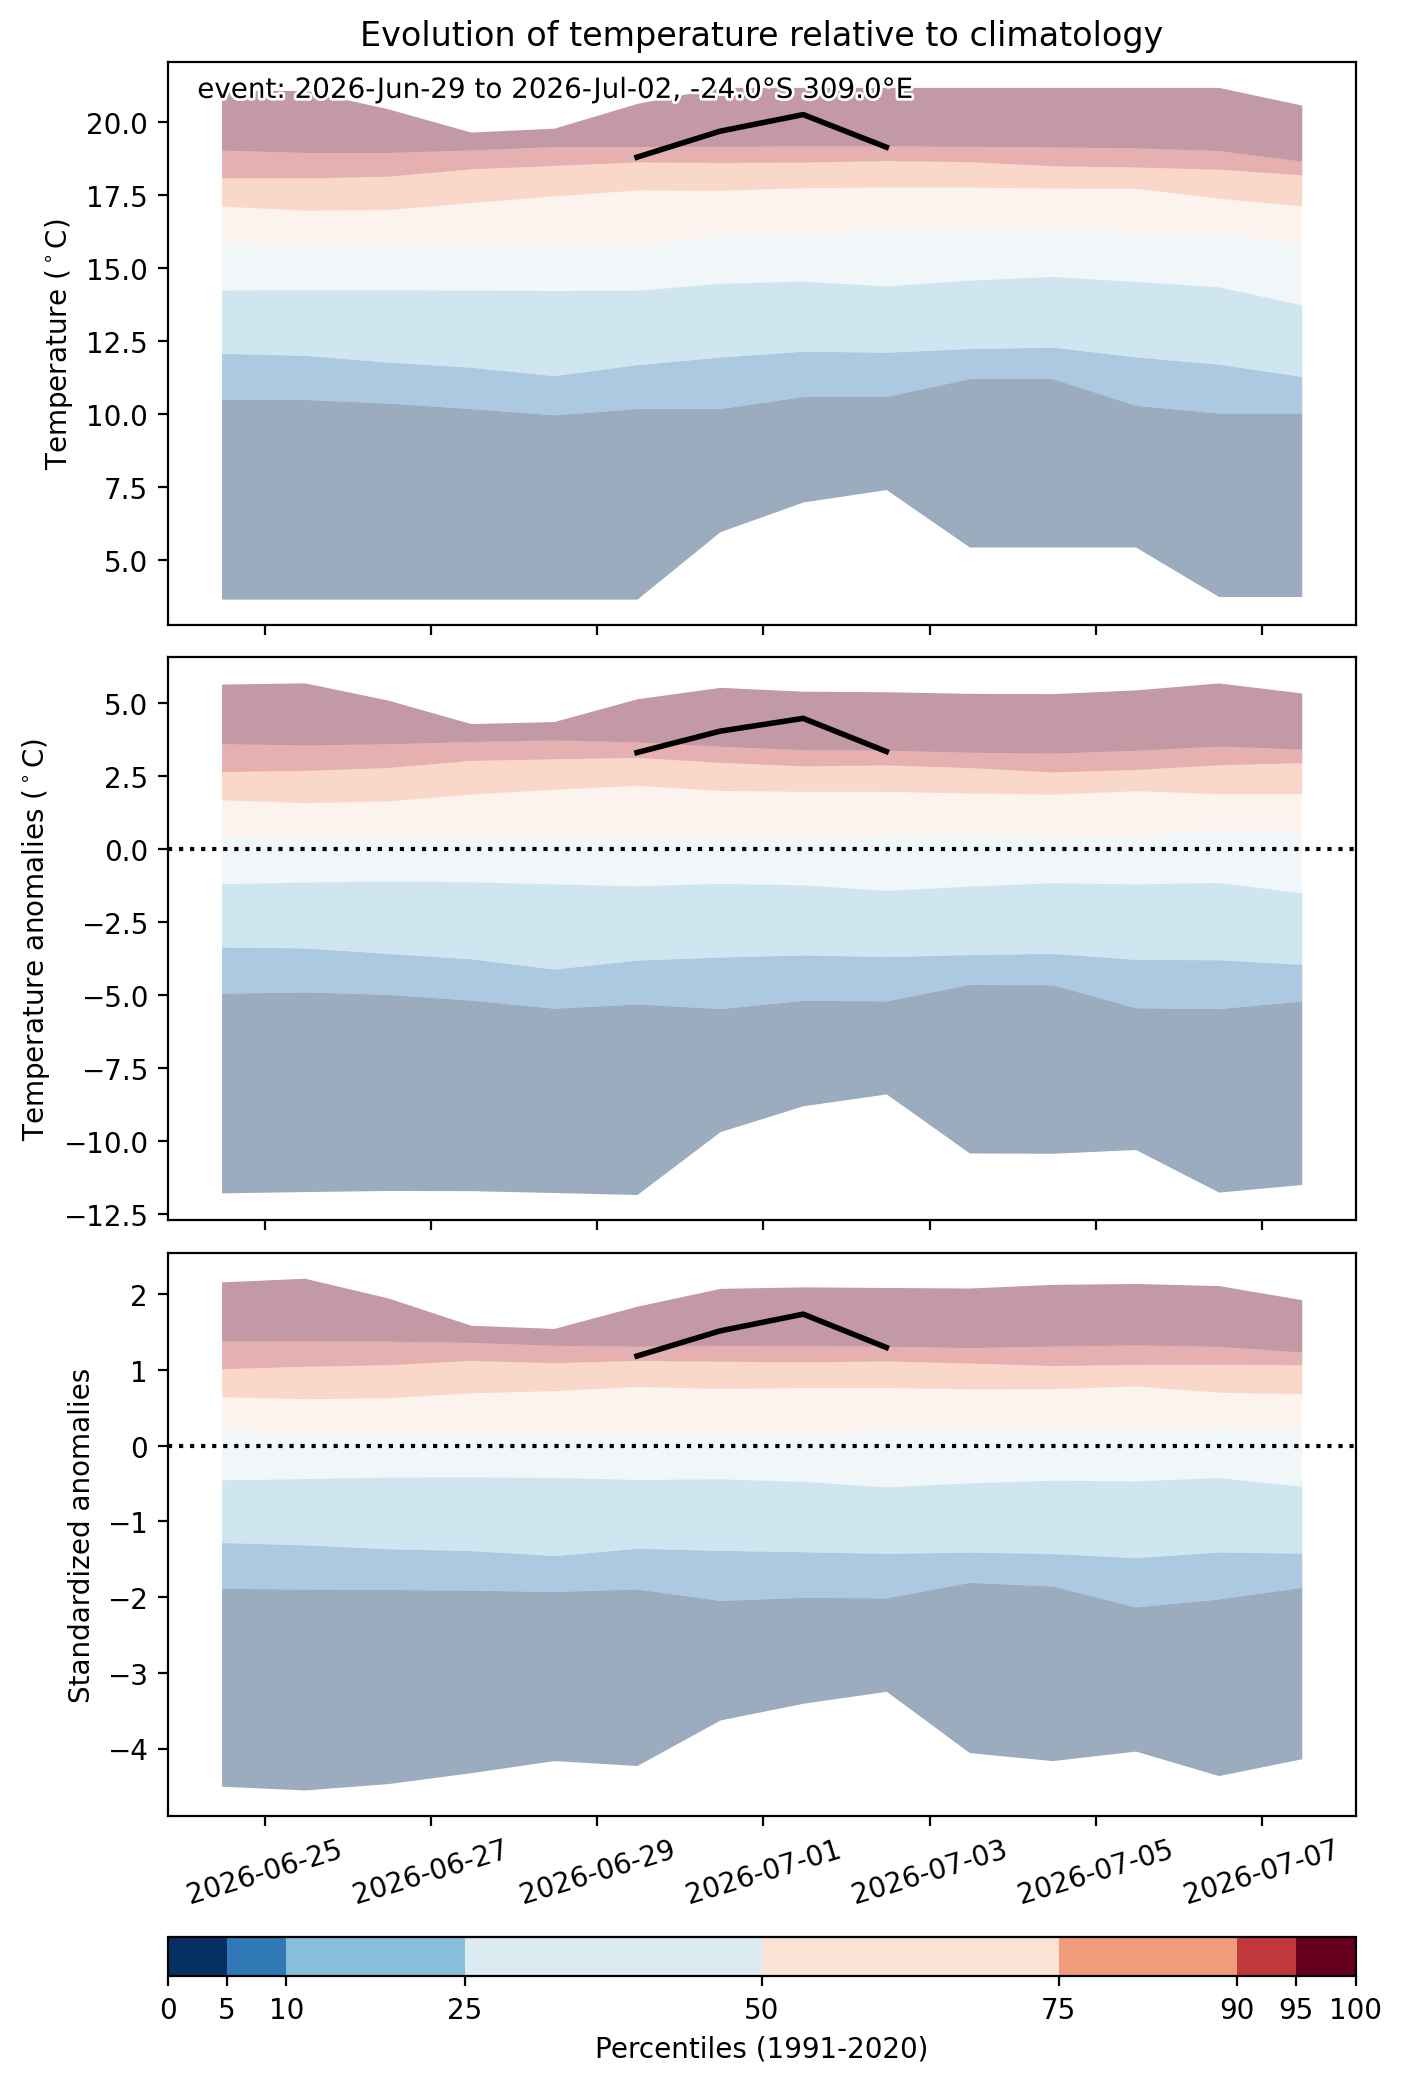
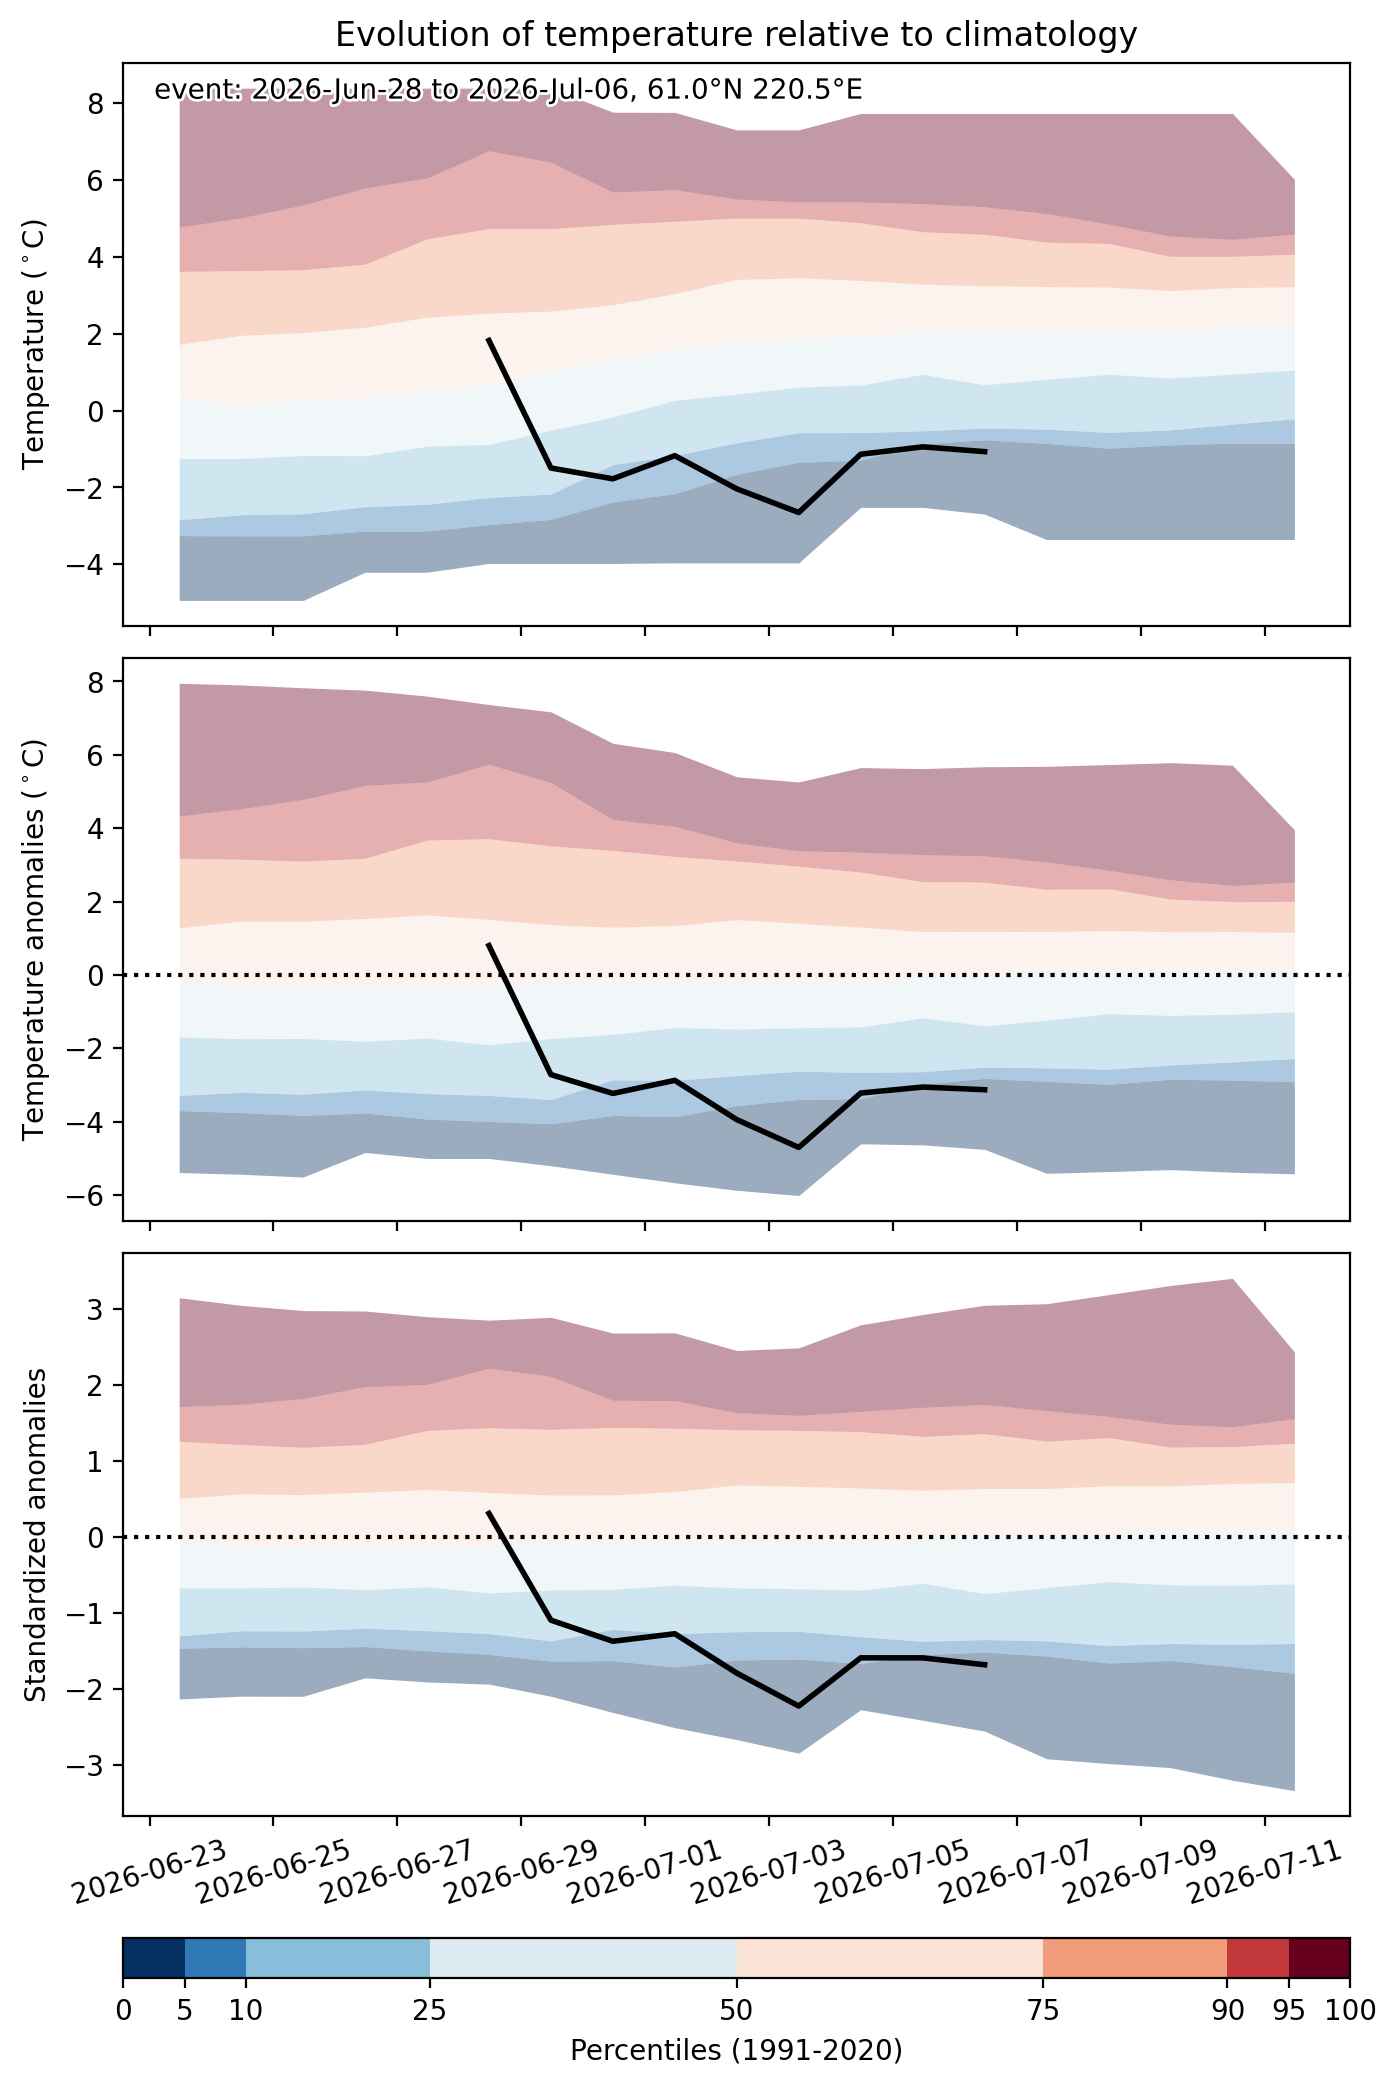
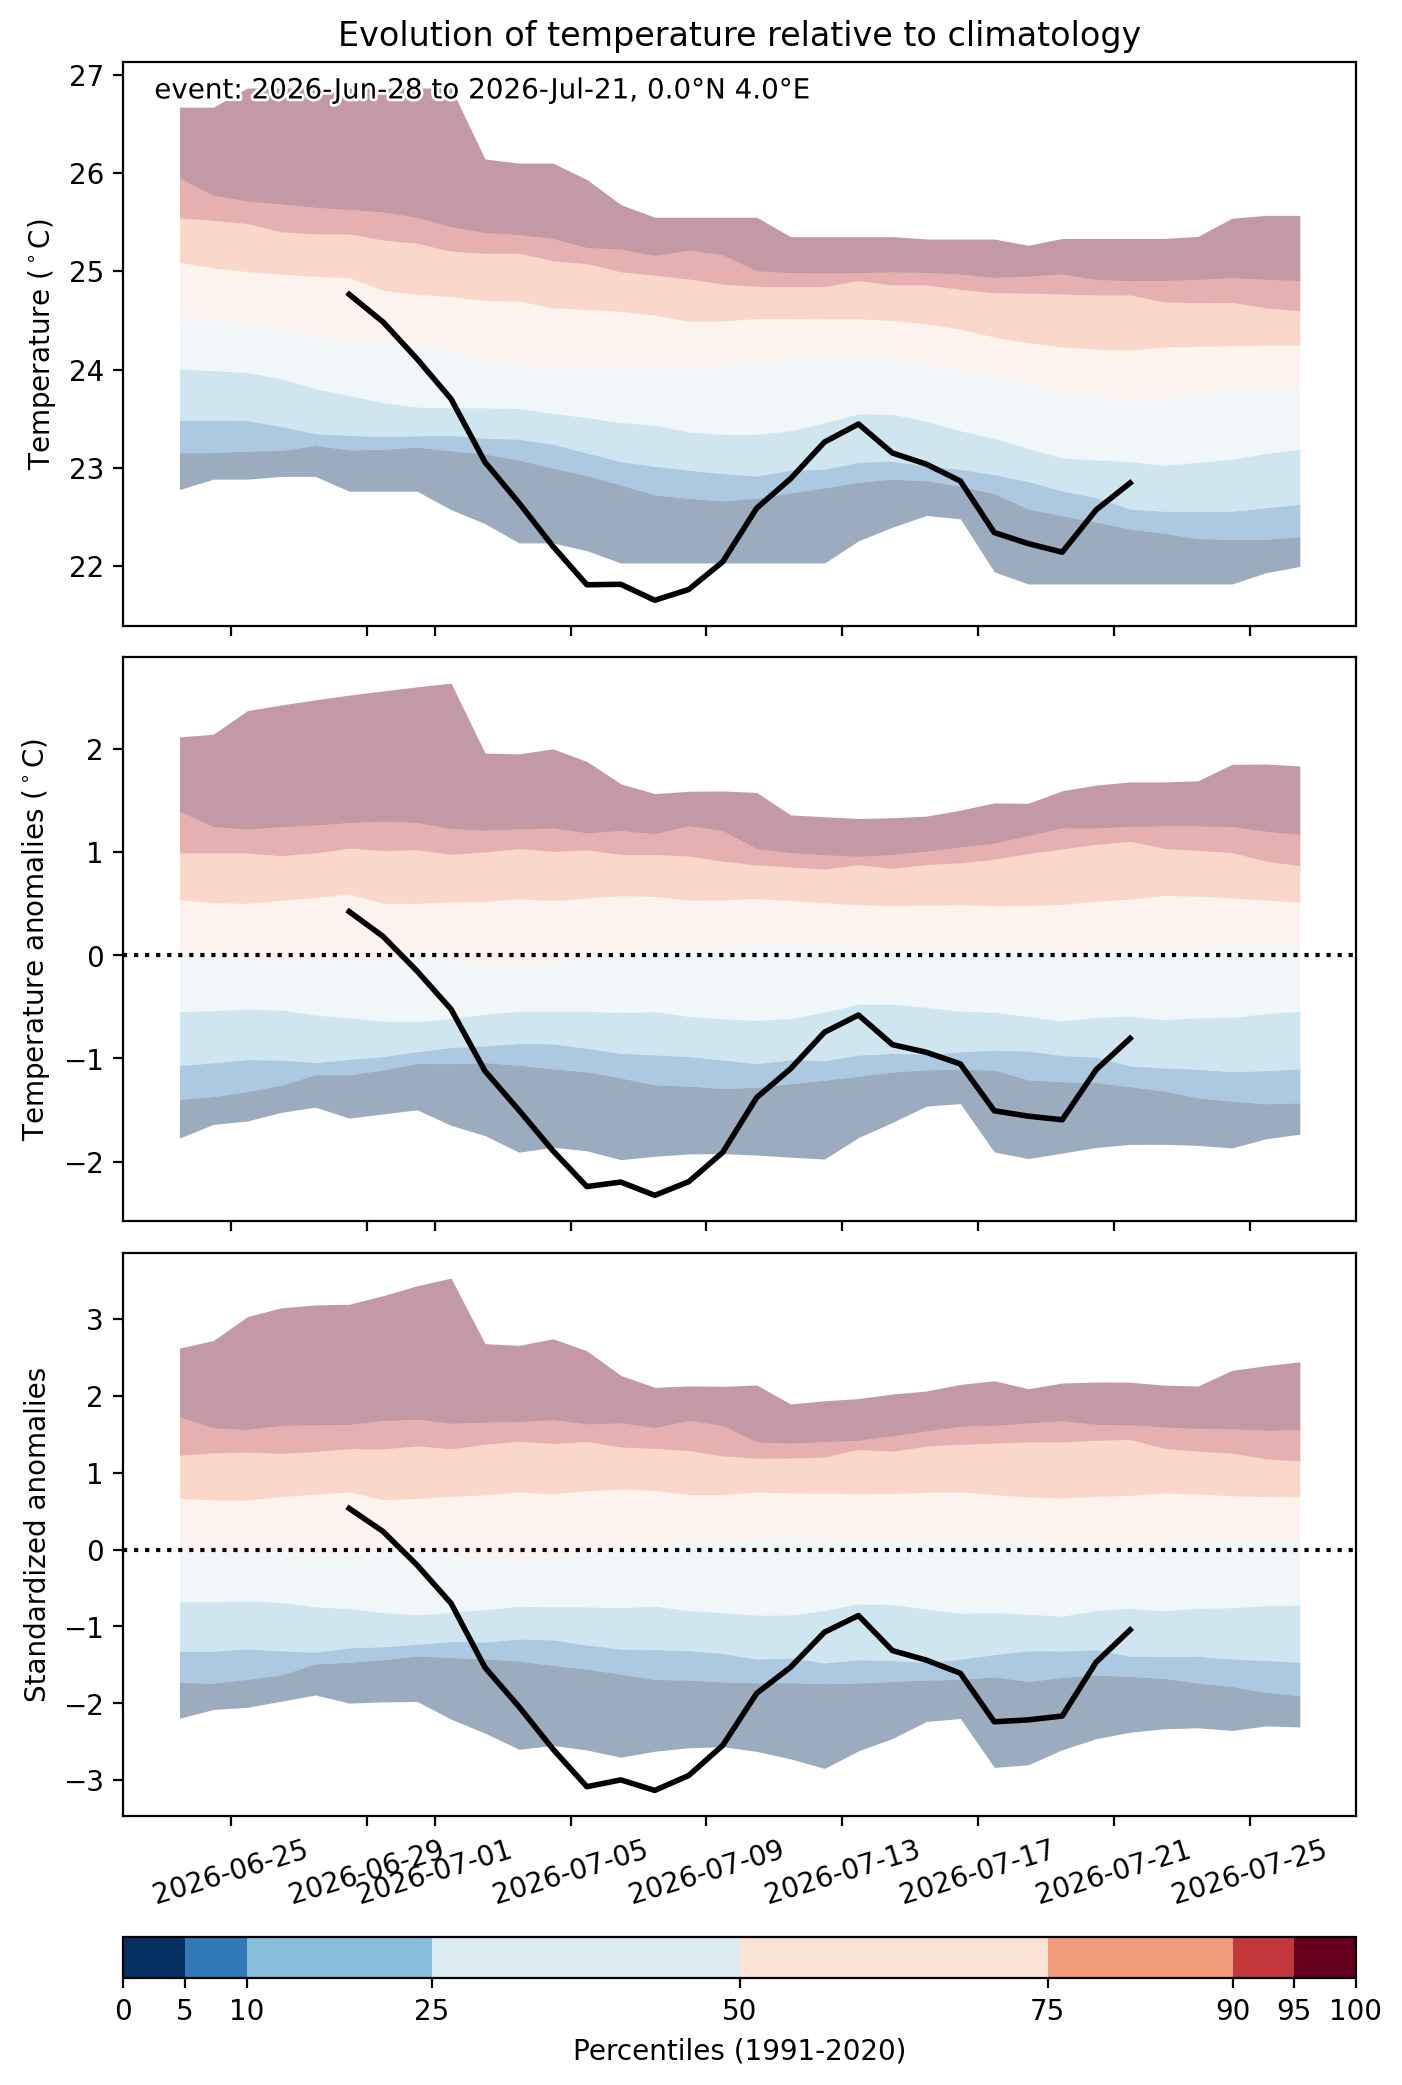
Fig. 2: Evolution of temperature at the center of the event. The climatological percentile distribution is illustrated with color shadings.


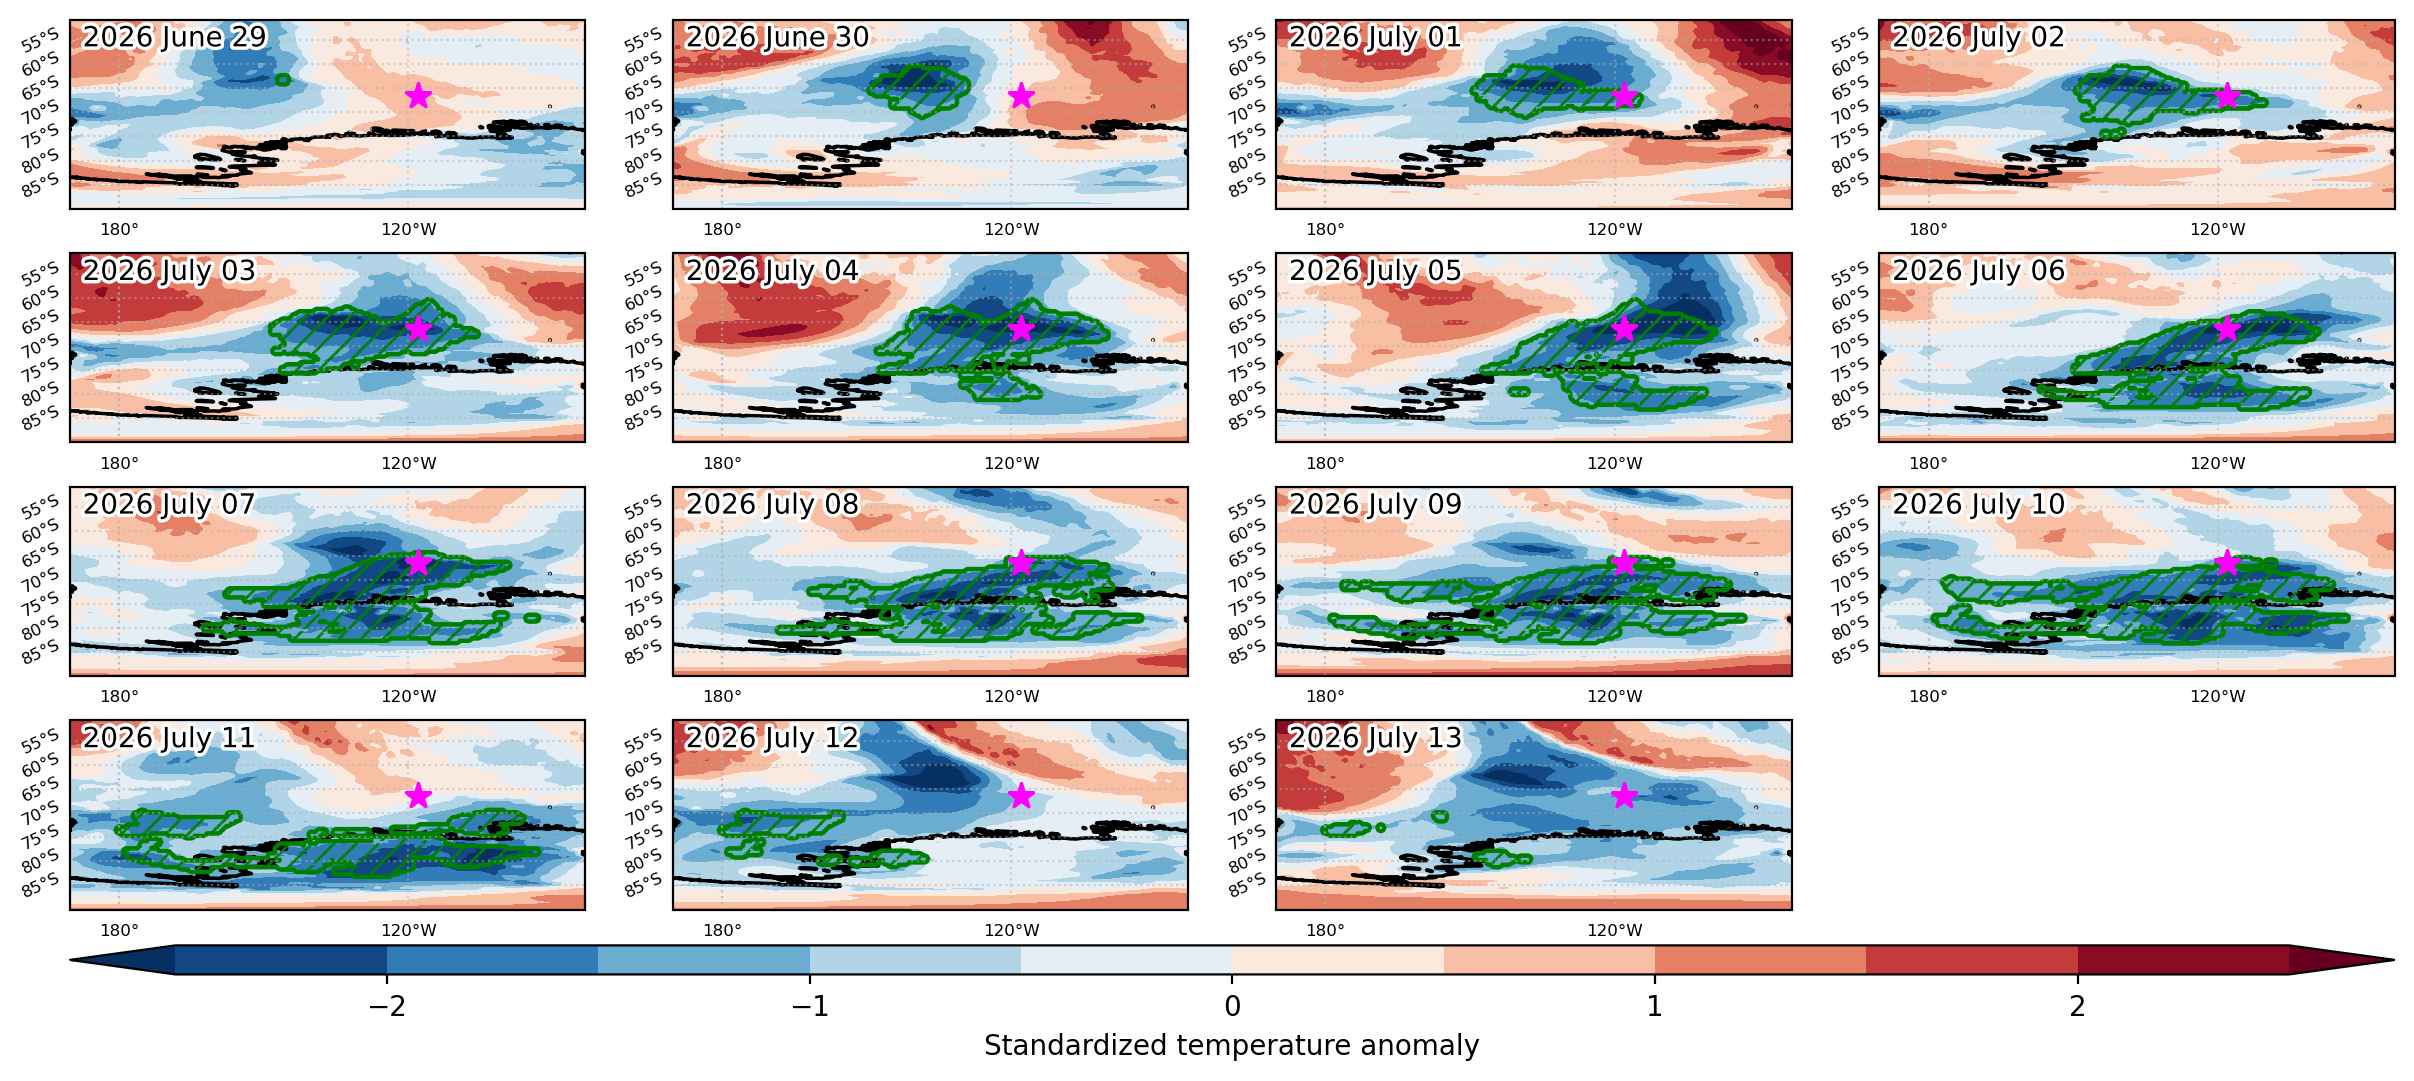
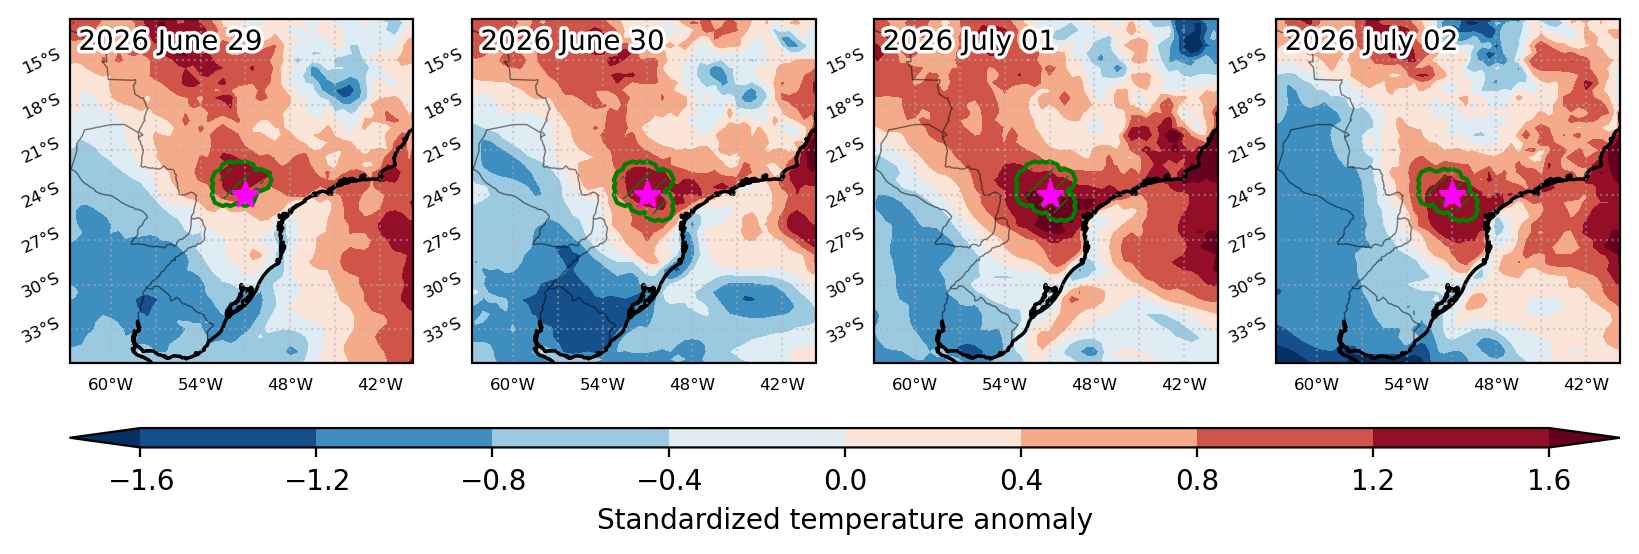
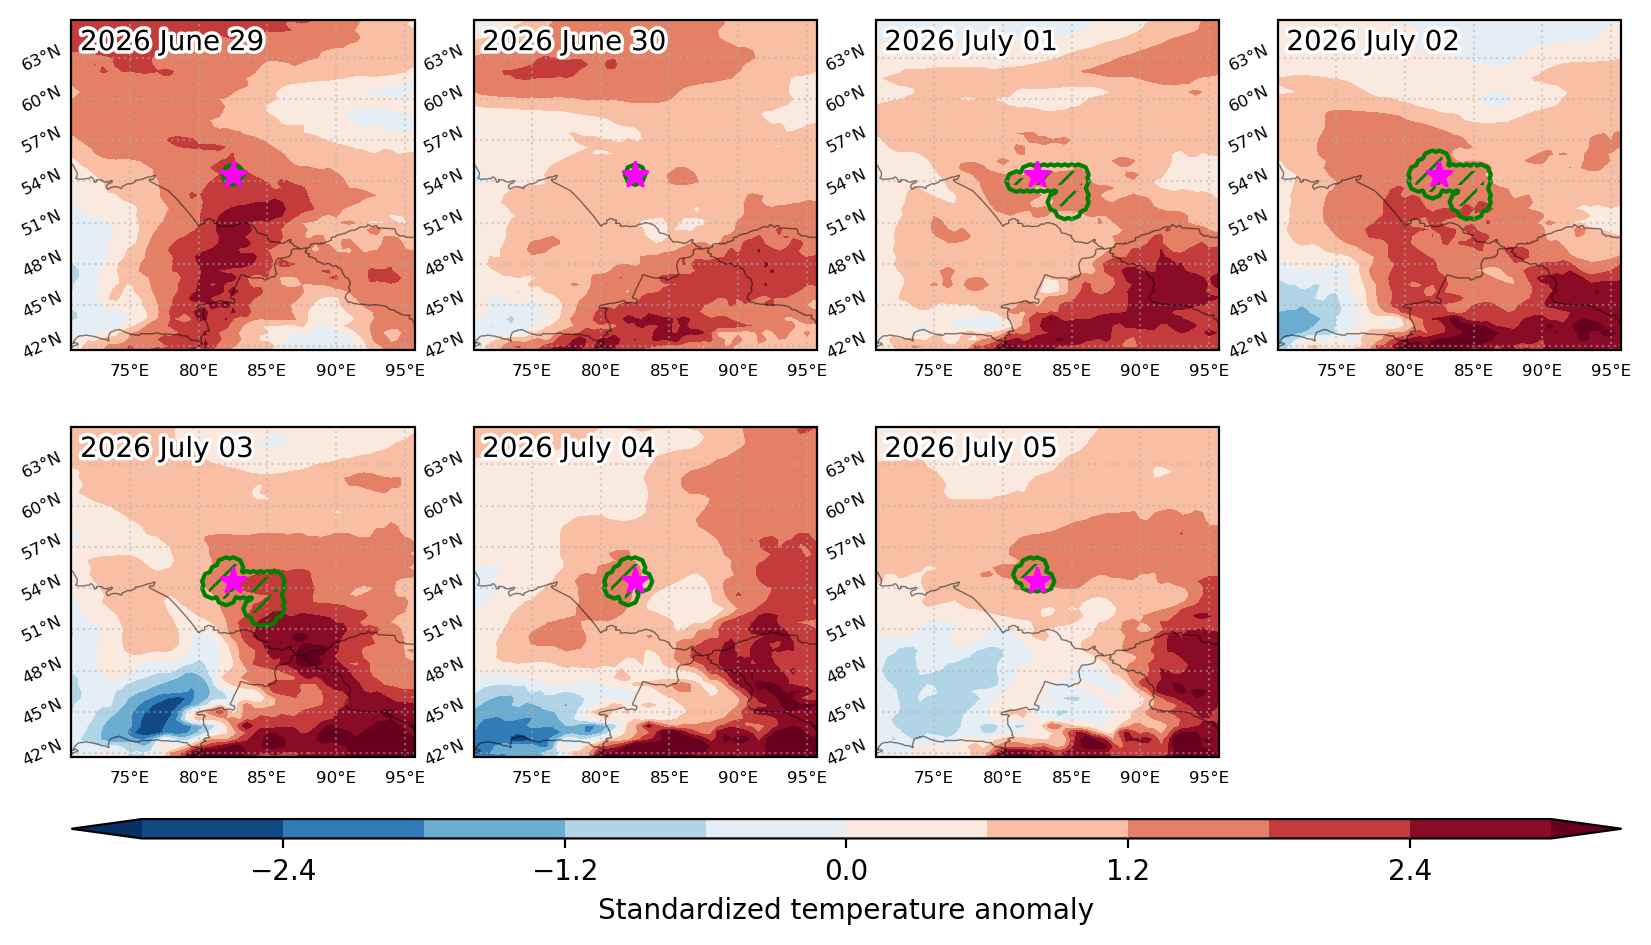
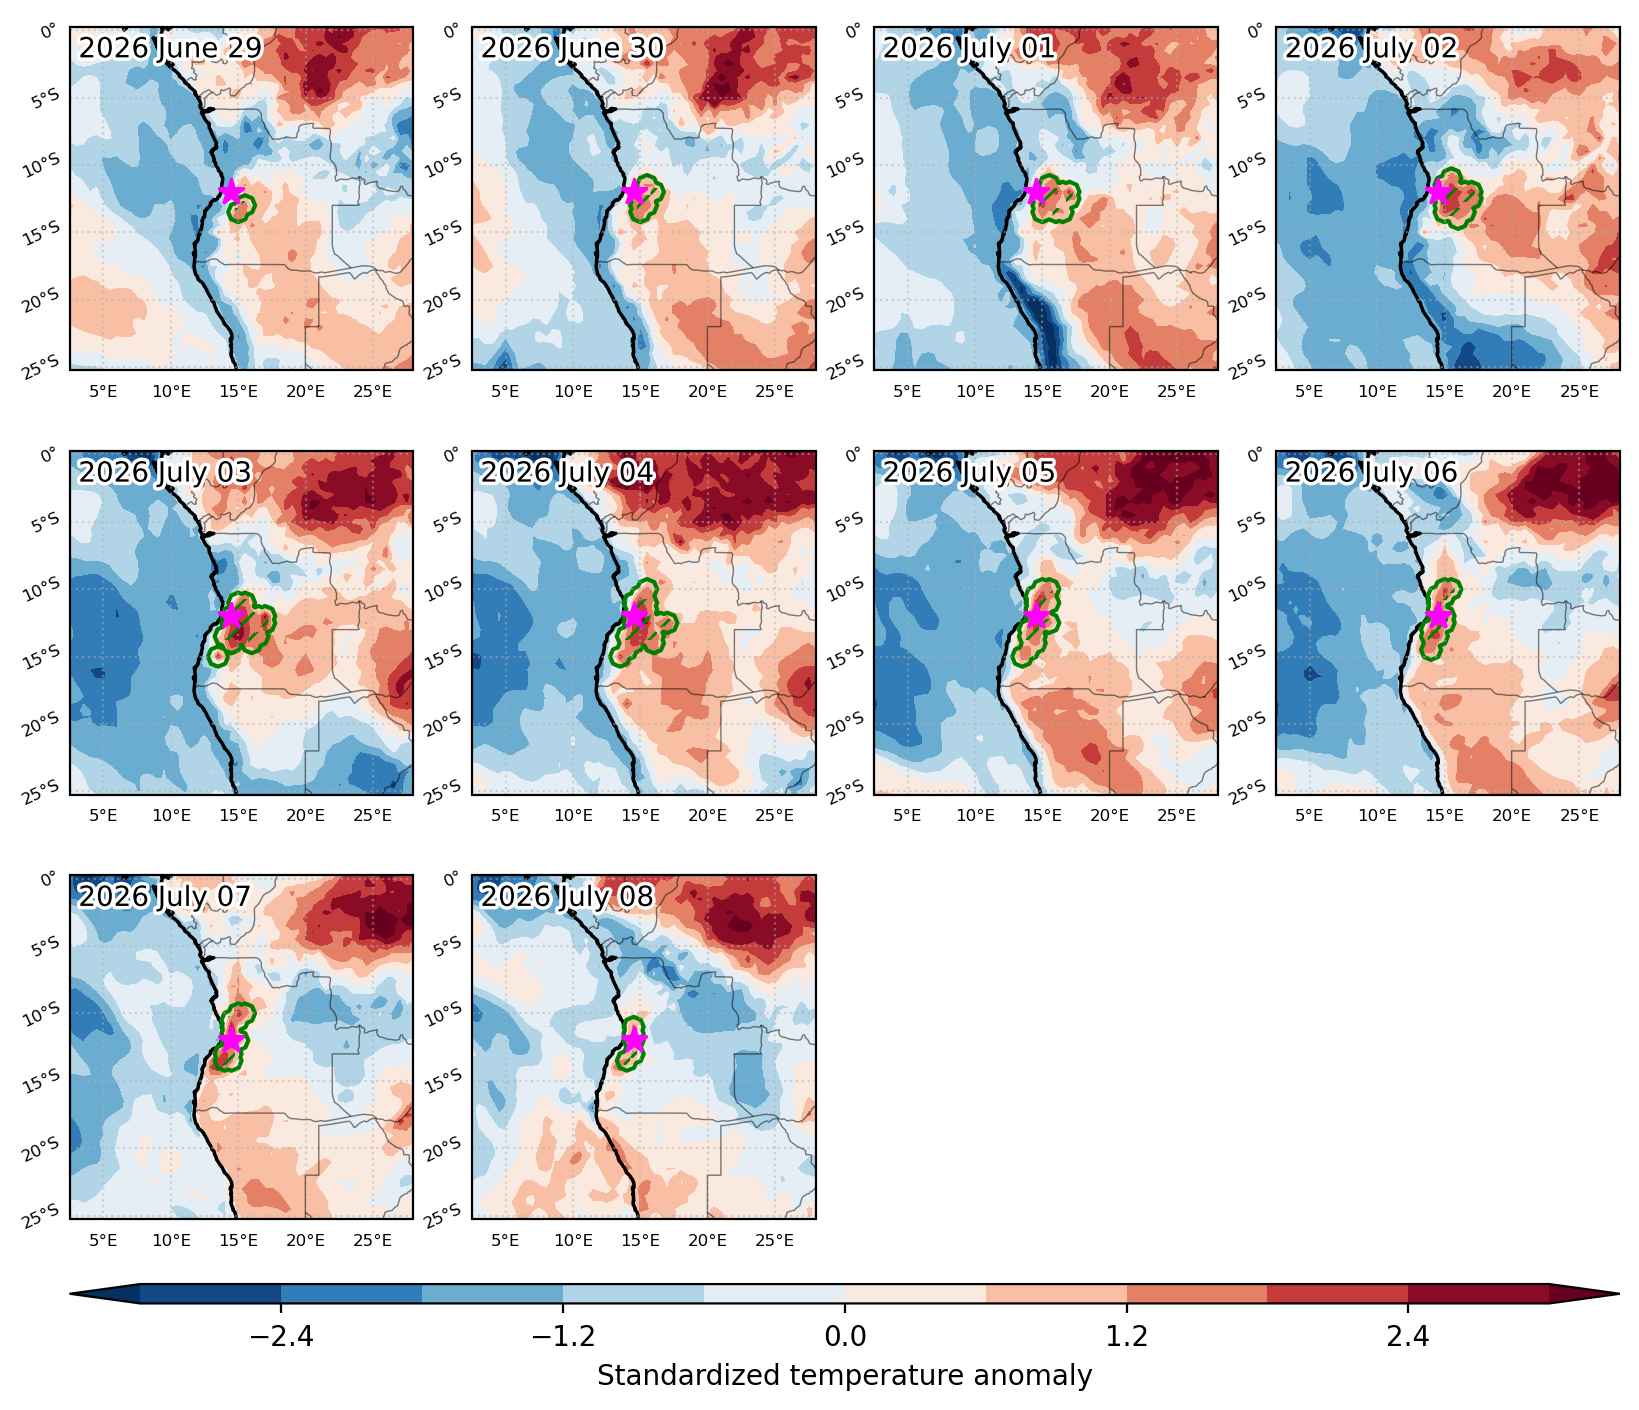
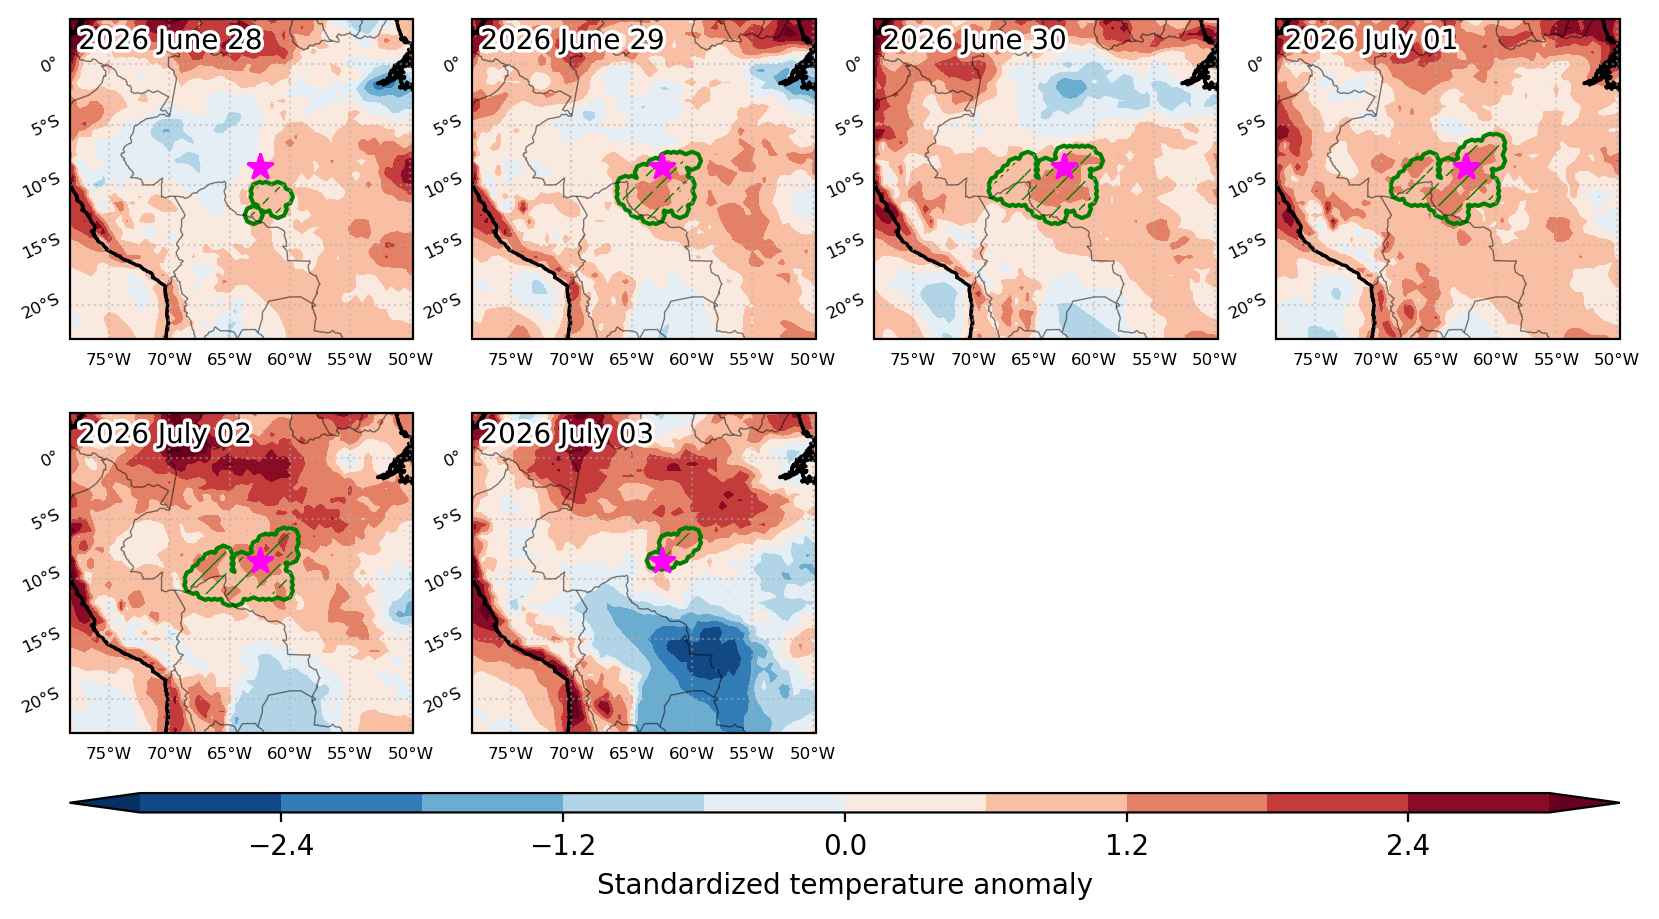
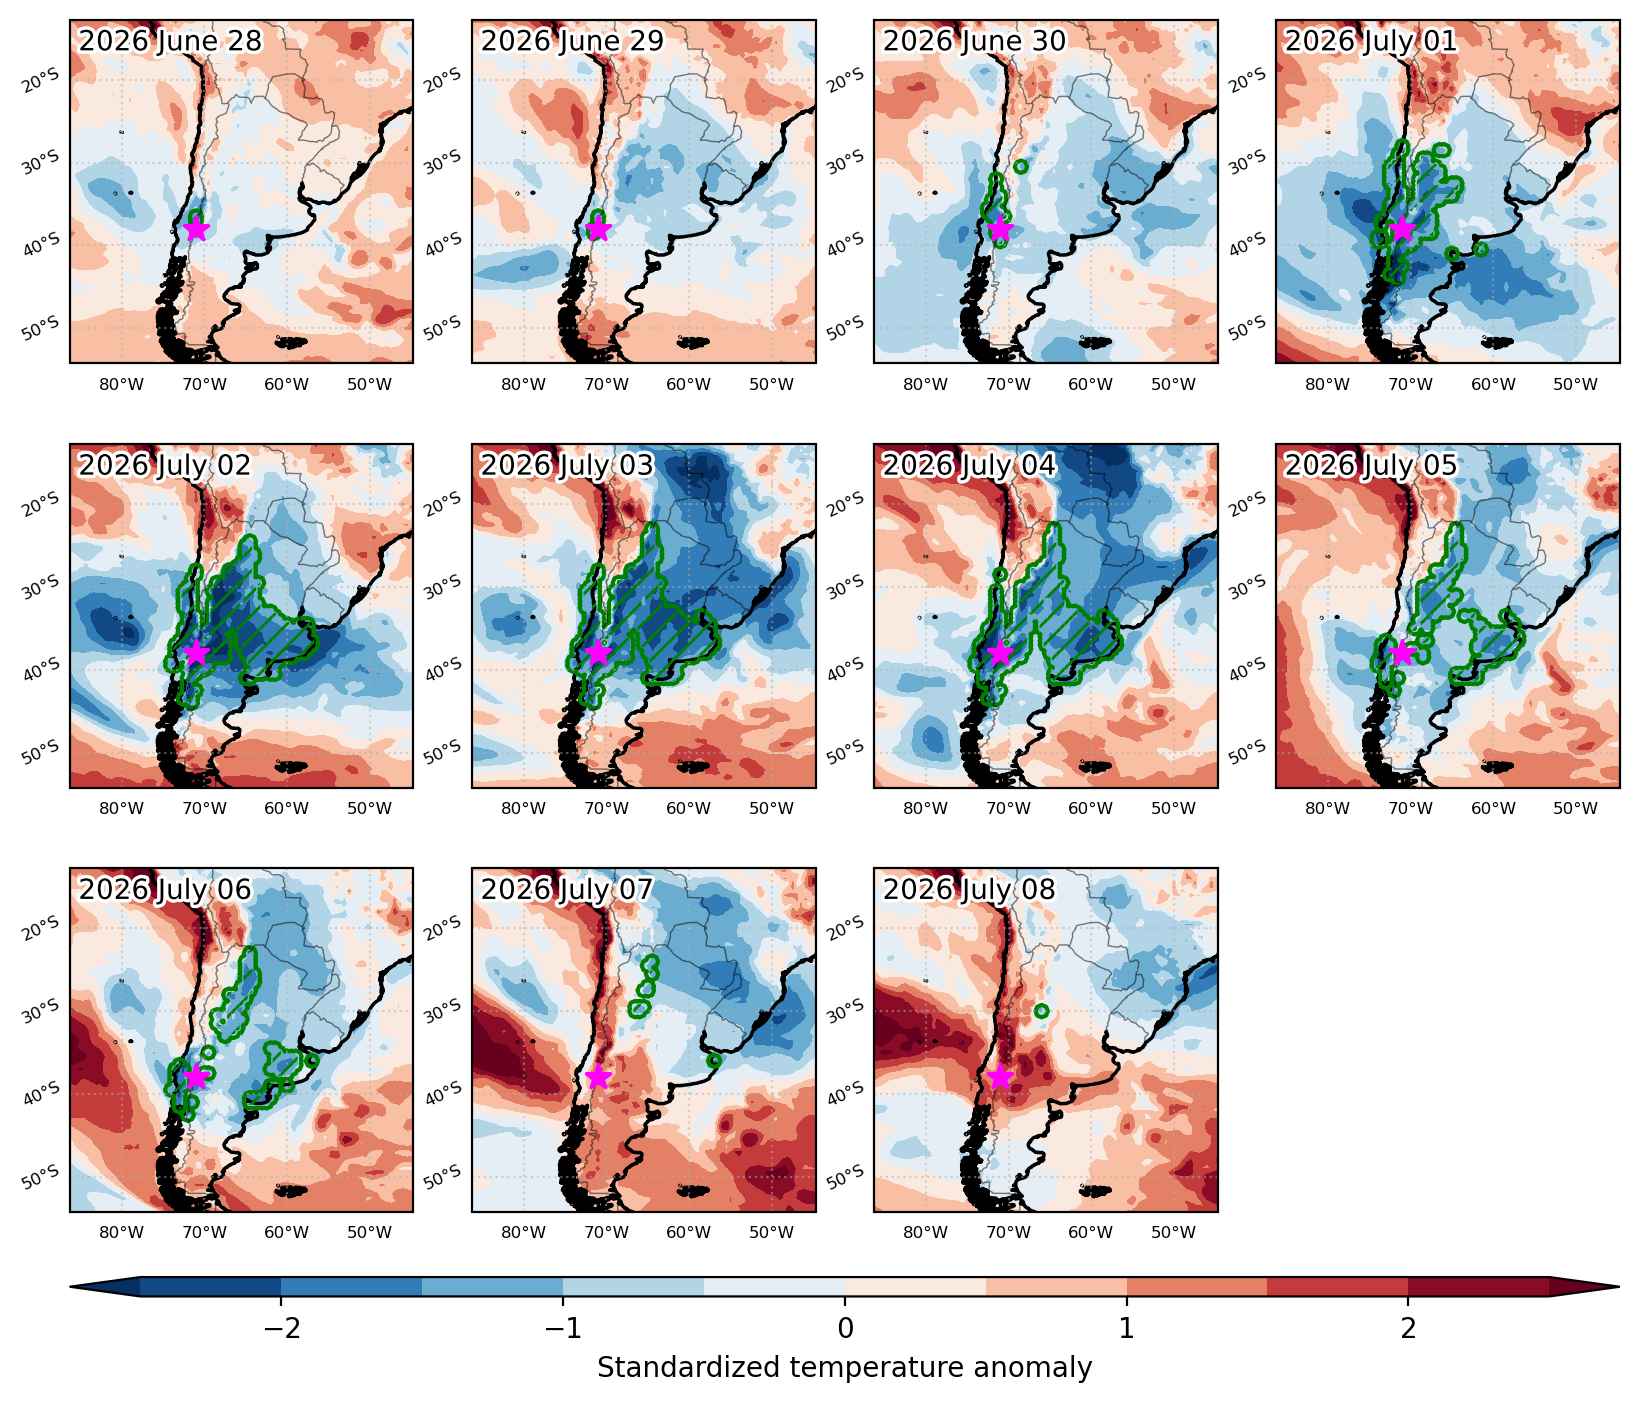
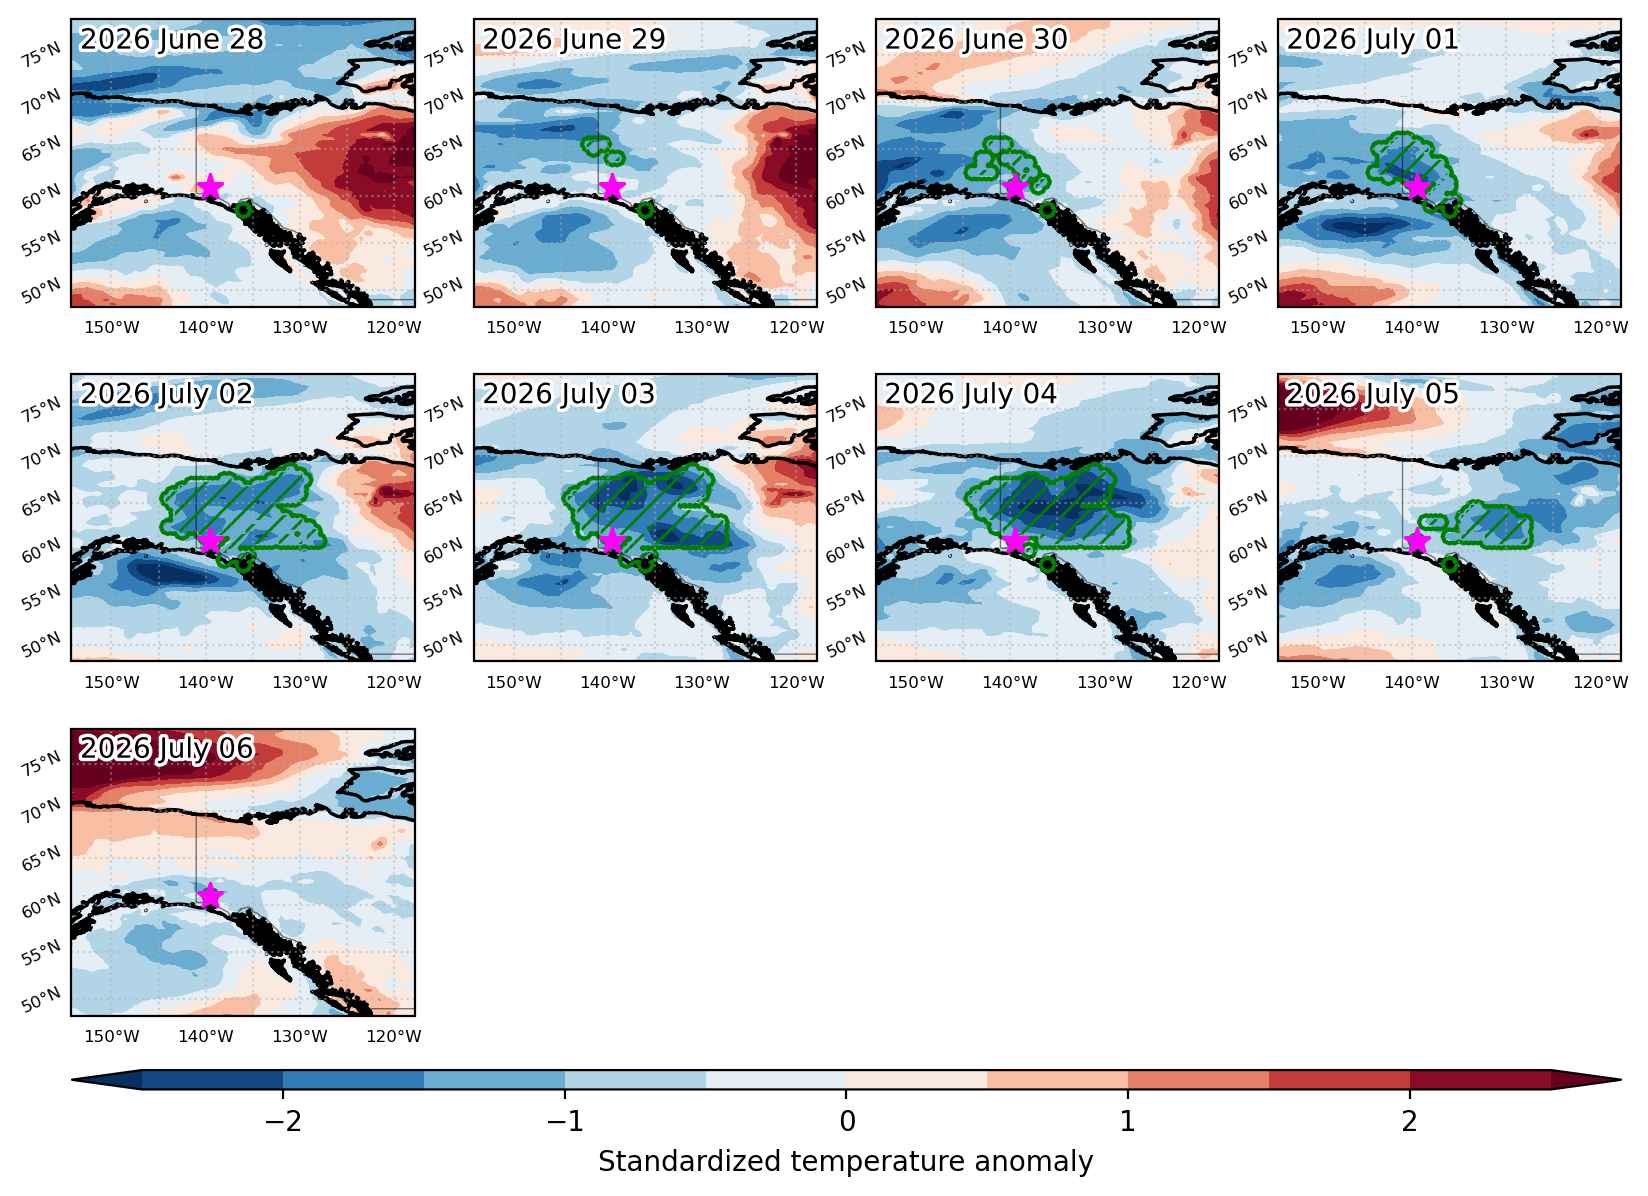
Fig. 3: Maps illustrating the evolution of standardized temperature anomalies during the event.

Event ID: Cold_spell_2026-Mar-18_to_2026-Mar-21_74.5_31.0

Cold spell occuring from March 18 2026 to March 23 2026 at 68.5°N 88.0°E

Download data: JSON

Event type: Cold spell

Countries affected (identified with ArcGIS Online; provided only for geographical reference):

  • Russian Federation

Duration: 6 days

Time span: March 18 2026 to March 23 2026

Statistics over entire affected area:

  • Mean temperature anomaly: -12.8 °C
  • Mean temperature: -29.9 °C
  • Minimum temperature anomaly: -17.1 °C
  • Minimum temperature: -35.5 °C

Event center: 68.5°N 88.0°E

Area affected: 320487 km$^2$


Fig. 1: Map of most extreme temperature anomalies (standardized) experienced during the event. The purple star indicates the center of the extreme event. Green hatching illustrates all areas under the effect of extremes at some time during the event.


Fig. 2: Evolution of temperature at the center of the event. The climatological percentile distribution is illustrated with color shadings.


Fig. 3: Maps illustrating the evolution of standardized temperature anomalies during the event.

Event ID: Cold_spell_2026-Mar-18_to_2026-Mar-23_88.0_68.5

Cold spell occuring from March 18 2026 to March 22 2026 at 26.5°N 69.5°E

Download data: JSON

Event type: Cold spell

Countries affected (identified with ArcGIS Online; provided only for geographical reference):

  • India
  • Pakistan

Duration: 5 days

Time span: March 18 2026 to March 22 2026

Statistics over entire affected area:

  • Mean temperature anomaly: -4.7 °C
  • Mean temperature: 21.8 °C
  • Minimum temperature anomaly: -8.3 °C
  • Minimum temperature: 15.9 °C

Event center: 26.5°N 69.5°E

Area affected: 83095 km$^2$


Fig. 1: Map of most extreme temperature anomalies (standardized) experienced during the event. The purple star indicates the center of the extreme event. Green hatching illustrates all areas under the effect of extremes at some time during the event.


Fig. 2: Evolution of temperature at the center of the event. The climatological percentile distribution is illustrated with color shadings.


Fig. 3: Maps illustrating the evolution of standardized temperature anomalies during the event.

Event ID: Cold_spell_2026-Mar-18_to_2026-Mar-22_69.5_26.5

Cold spell occuring from March 18 2026 to March 25 2026 at -7.5°S 126.0°E

Download data: JSON

Event type: Cold spell

Countries affected (identified with ArcGIS Online; provided only for geographical reference):

  • Indonesia
  • Timor-Leste

Duration: 8 days

Time span: March 18 2026 to March 25 2026

Statistics over entire affected area:

  • Mean temperature anomaly: -0.9 °C
  • Mean temperature: 26.3 °C
  • Minimum temperature anomaly: -1.3 °C
  • Minimum temperature: 24.9 °C

Event center: -7.5°S 126.0°E

Area affected: 174930 km$^2$


Fig. 1: Map of most extreme temperature anomalies (standardized) experienced during the event. The purple star indicates the center of the extreme event. Green hatching illustrates all areas under the effect of extremes at some time during the event.


Fig. 2: Evolution of temperature at the center of the event. The climatological percentile distribution is illustrated with color shadings.


Fig. 3: Maps illustrating the evolution of standardized temperature anomalies during the event.

Event ID: Cold_spell_2026-Mar-18_to_2026-Mar-25_126.0_-7.5

Cold spell occuring from March 17 2026 to March 21 2026 at -7.0°S 139.0°E

Download data: JSON

Event type: Cold spell

Countries affected (identified with ArcGIS Online; provided only for geographical reference):

  • Indonesia
  • Papua New Guinea

Duration: 5 days

Time span: March 17 2026 to March 21 2026

Statistics over entire affected area:

  • Mean temperature anomaly: -1.4 °C
  • Mean temperature: 25.4 °C
  • Minimum temperature anomaly: -2.0 °C
  • Minimum temperature: 24.5 °C

Event center: -7.0°S 139.0°E

Area affected: 110321 km$^2$


Fig. 1: Map of most extreme temperature anomalies (standardized) experienced during the event. The purple star indicates the center of the extreme event. Green hatching illustrates all areas under the effect of extremes at some time during the event.


Fig. 2: Evolution of temperature at the center of the event. The climatological percentile distribution is illustrated with color shadings.


Fig. 3: Maps illustrating the evolution of standardized temperature anomalies during the event.

Event ID: Cold_spell_2026-Mar-17_to_2026-Mar-21_139.0_-7.0

Cold spell occuring from March 17 2026 to March 19 2026 at 30.5°N 274.5°E

Download data: JSON

Event type: Cold spell

Countries affected (identified with ArcGIS Online; provided only for geographical reference):

  • United States

Duration: 3 days

Time span: March 17 2026 to March 19 2026

Statistics over entire affected area:

  • Mean temperature anomaly: -7.7 °C
  • Mean temperature: 9.5 °C
  • Minimum temperature anomaly: -10.5 °C
  • Minimum temperature: 5.4 °C

Event center: 30.5°N 274.5°E

Area affected: 125252 km$^2$


Fig. 1: Map of most extreme temperature anomalies (standardized) experienced during the event. The purple star indicates the center of the extreme event. Green hatching illustrates all areas under the effect of extremes at some time during the event.


Fig. 2: Evolution of temperature at the center of the event. The climatological percentile distribution is illustrated with color shadings.


Fig. 3: Maps illustrating the evolution of standardized temperature anomalies during the event.

Event ID: Cold_spell_2026-Mar-17_to_2026-Mar-19_274.5_30.5

Cold spell occuring from March 17 2026 to March 23 2026 at 18.5°N 271.5°E

Download data: JSON

Event type: Cold spell

Countries affected (identified with ArcGIS Online; provided only for geographical reference):

  • Belize
  • Guatemala
  • Mexico

Duration: 7 days

Time span: March 17 2026 to March 23 2026

Statistics over entire affected area:

  • Mean temperature anomaly: -3.1 °C
  • Mean temperature: 22.6 °C
  • Minimum temperature anomaly: -5.8 °C
  • Minimum temperature: 14.9 °C

Event center: 18.5°N 271.5°E

Area affected: 328303 km$^2$


Fig. 1: Map of most extreme temperature anomalies (standardized) experienced during the event. The purple star indicates the center of the extreme event. Green hatching illustrates all areas under the effect of extremes at some time during the event.


Fig. 2: Evolution of temperature at the center of the event. The climatological percentile distribution is illustrated with color shadings.


Fig. 3: Maps illustrating the evolution of standardized temperature anomalies during the event.

Event ID: Cold_spell_2026-Mar-17_to_2026-Mar-23_271.5_18.5

Cold spell occuring from March 17 2026 to March 19 2026 at 27.0°N 272.5°E

Download data: JSON

Event type: Cold spell

Countries affected (identified with ArcGIS Online; provided only for geographical reference):

  • Mexico

Duration: 3 days

Time span: March 17 2026 to March 19 2026

Statistics over entire affected area:

  • Mean temperature anomaly: -4.4 °C
  • Mean temperature: 17.8 °C
  • Minimum temperature anomaly: -7.0 °C
  • Minimum temperature: 13.5 °C

Event center: 27.0°N 272.5°E

Area affected: 169134 km$^2$


Fig. 1: Map of most extreme temperature anomalies (standardized) experienced during the event. The purple star indicates the center of the extreme event. Green hatching illustrates all areas under the effect of extremes at some time during the event.


Fig. 2: Evolution of temperature at the center of the event. The climatological percentile distribution is illustrated with color shadings.


Fig. 3: Maps illustrating the evolution of standardized temperature anomalies during the event.

Event ID: Cold_spell_2026-Mar-17_to_2026-Mar-19_272.5_27.0

Cold spell occuring from March 16 2026 to March 18 2026 at 41.5°N 269.0°E

Download data: JSON

Event type: Cold spell

Countries affected (identified with ArcGIS Online; provided only for geographical reference):

  • United States

Duration: 3 days

Time span: March 16 2026 to March 18 2026

Statistics over entire affected area:

  • Mean temperature anomaly: -9.6 °C
  • Mean temperature: -6.3 °C
  • Minimum temperature anomaly: -15.8 °C
  • Minimum temperature: -11.5 °C

Event center: 41.5°N 269.0°E

Area affected: 72885 km$^2$


Fig. 1: Map of most extreme temperature anomalies (standardized) experienced during the event. The purple star indicates the center of the extreme event. Green hatching illustrates all areas under the effect of extremes at some time during the event.


Fig. 2: Evolution of temperature at the center of the event. The climatological percentile distribution is illustrated with color shadings.


Fig. 3: Maps illustrating the evolution of standardized temperature anomalies during the event.

Event ID: Cold_spell_2026-Mar-16_to_2026-Mar-18_269.0_41.5

Cold spell occuring from March 16 2026 to March 24 2026 at 5.0°N 114.0°E

Download data: JSON

Event type: Cold spell

Countries affected (identified with ArcGIS Online; provided only for geographical reference):

  • Malaysia

Duration: 9 days

Time span: March 16 2026 to March 24 2026

Statistics over entire affected area:

  • Mean temperature anomaly: -0.7 °C
  • Mean temperature: 26.1 °C
  • Minimum temperature anomaly: -1.0 °C
  • Minimum temperature: 25.8 °C

Event center: 5.0°N 114.0°E

Area affected: 55405 km$^2$


Fig. 1: Map of most extreme temperature anomalies (standardized) experienced during the event. The purple star indicates the center of the extreme event. Green hatching illustrates all areas under the effect of extremes at some time during the event.


Fig. 2: Evolution of temperature at the center of the event. The climatological percentile distribution is illustrated with color shadings.


Fig. 3: Maps illustrating the evolution of standardized temperature anomalies during the event.

Event ID: Cold_spell_2026-Mar-16_to_2026-Mar-24_114.0_5.0