(ongoing) Heat wave occuring from April 24 2026 to May 03 2026 at 9.0°N 264.5°E

Download data: JSON

Event type: Heat wave

Countries affected (identified with ArcGIS Online; provided only for geographical reference):

    Duration: 10 days

    Time span: April 24 2026 to May 03 2026

    Statistics over entire affected area:

    • Mean temperature anomaly: 1.1 °C
    • Mean temperature: 28.8 °C
    • Maximum temperature anomaly: 1.9 °C
    • Maximum temperature: 29.8 °C

    Event center: 9.0°N 264.5°E

    Area affected: 484590 km$^2$


    Fig. 1: unavailable since event is ongoing.


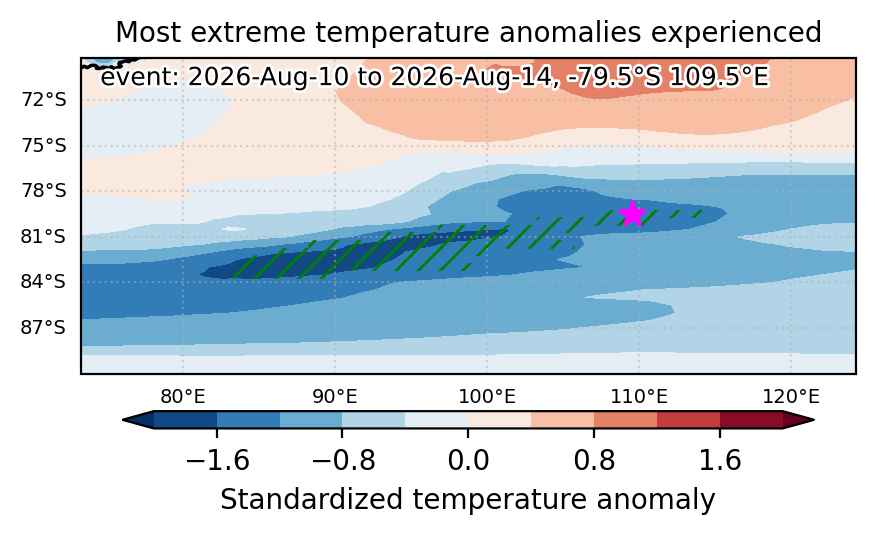
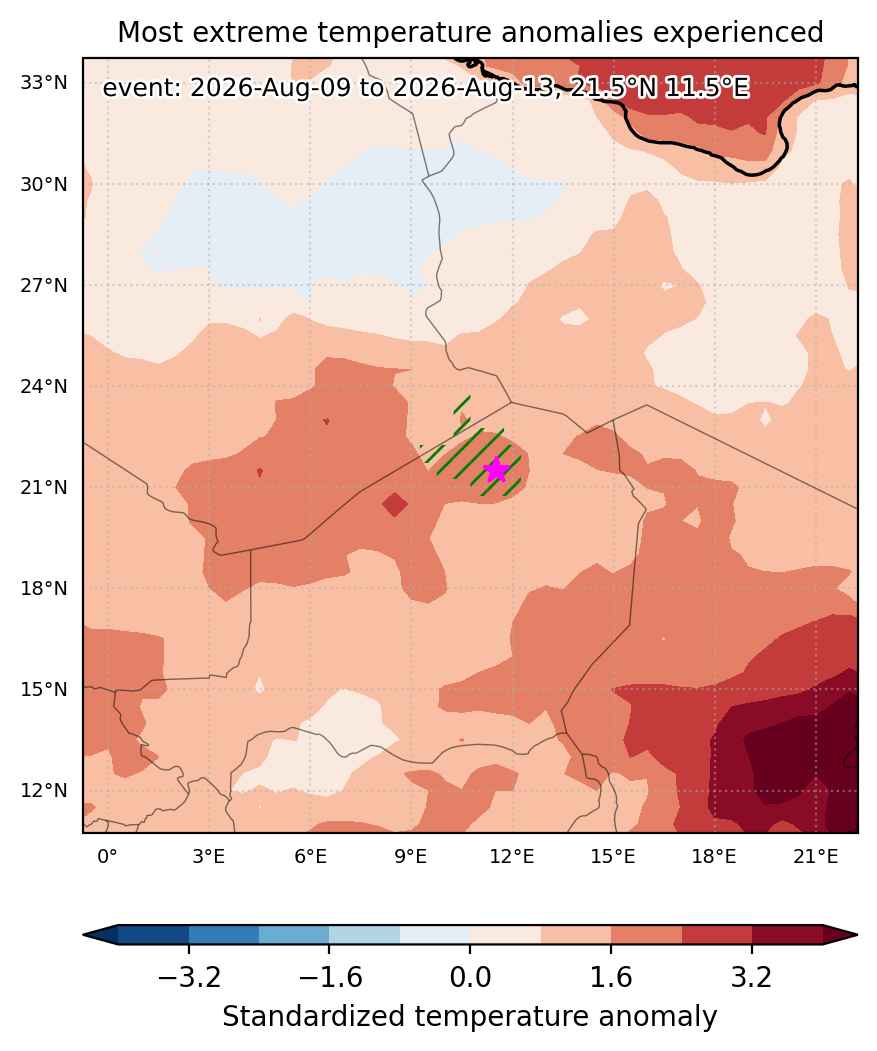
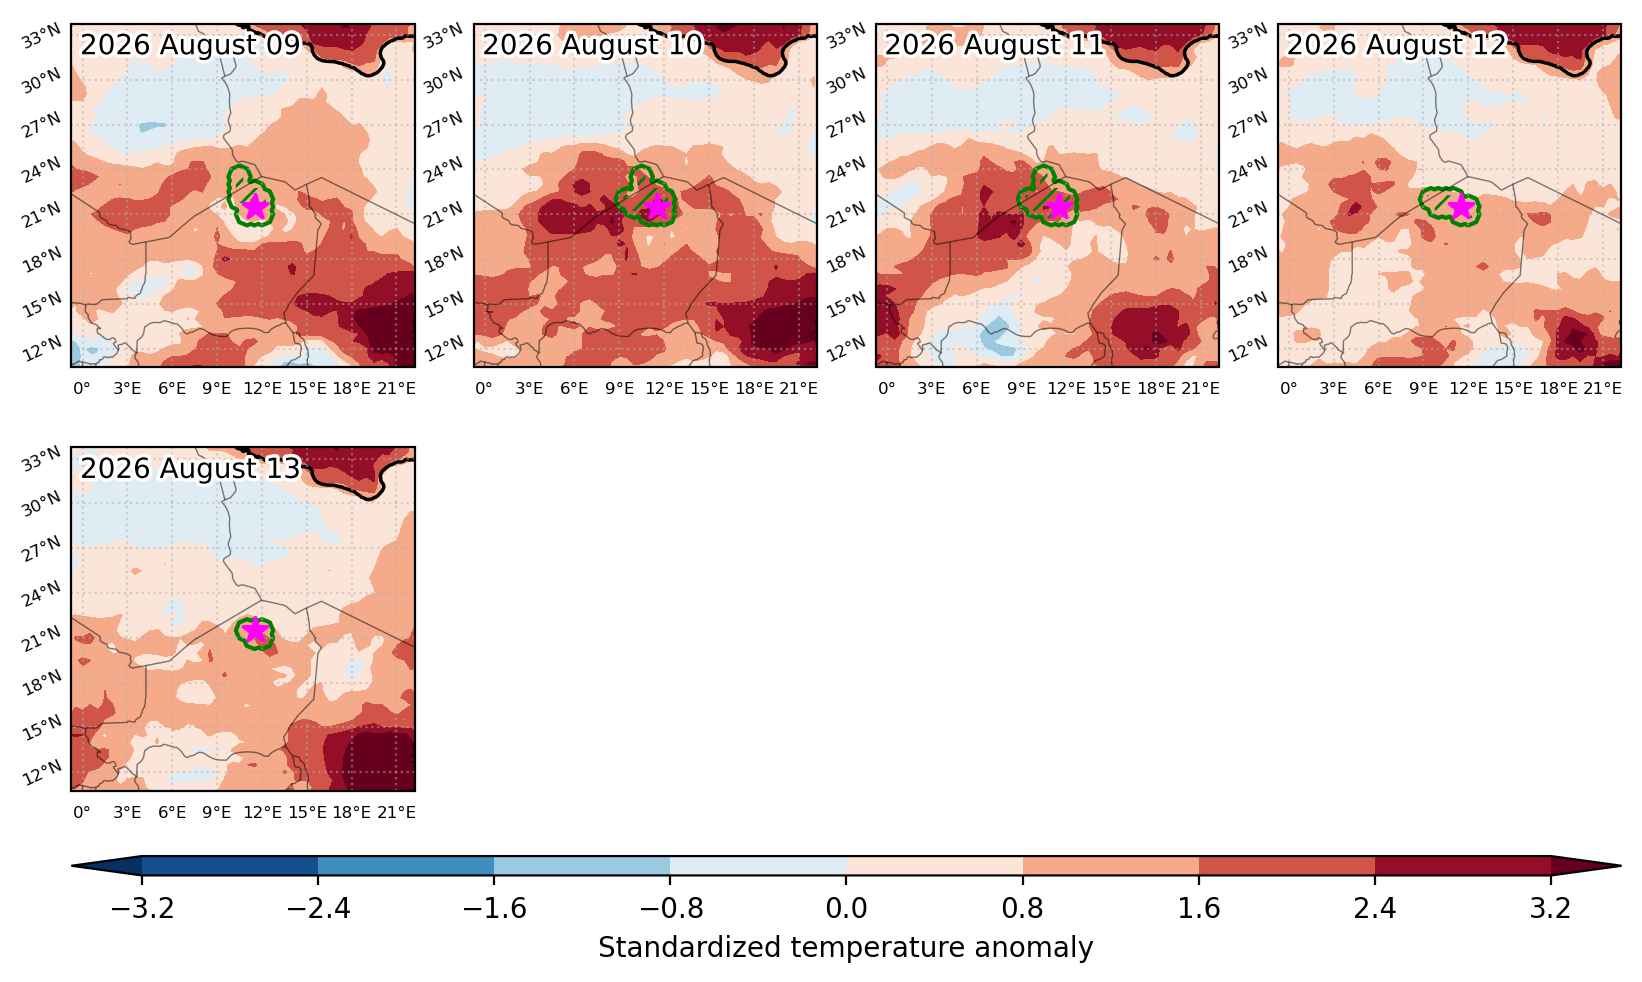
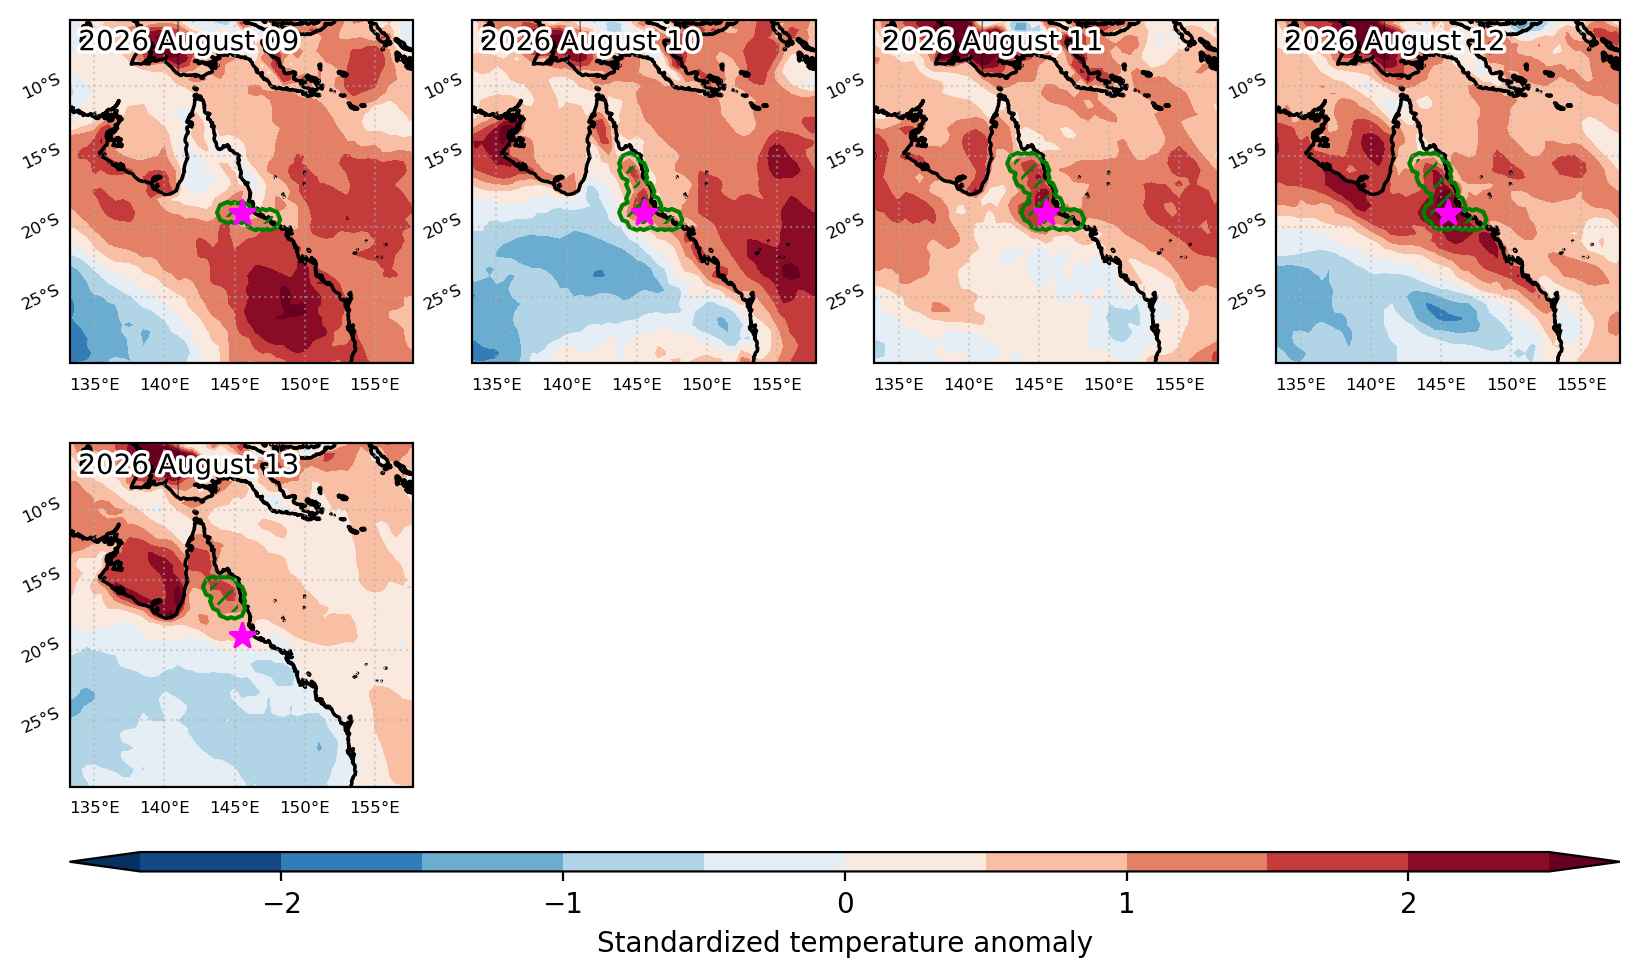
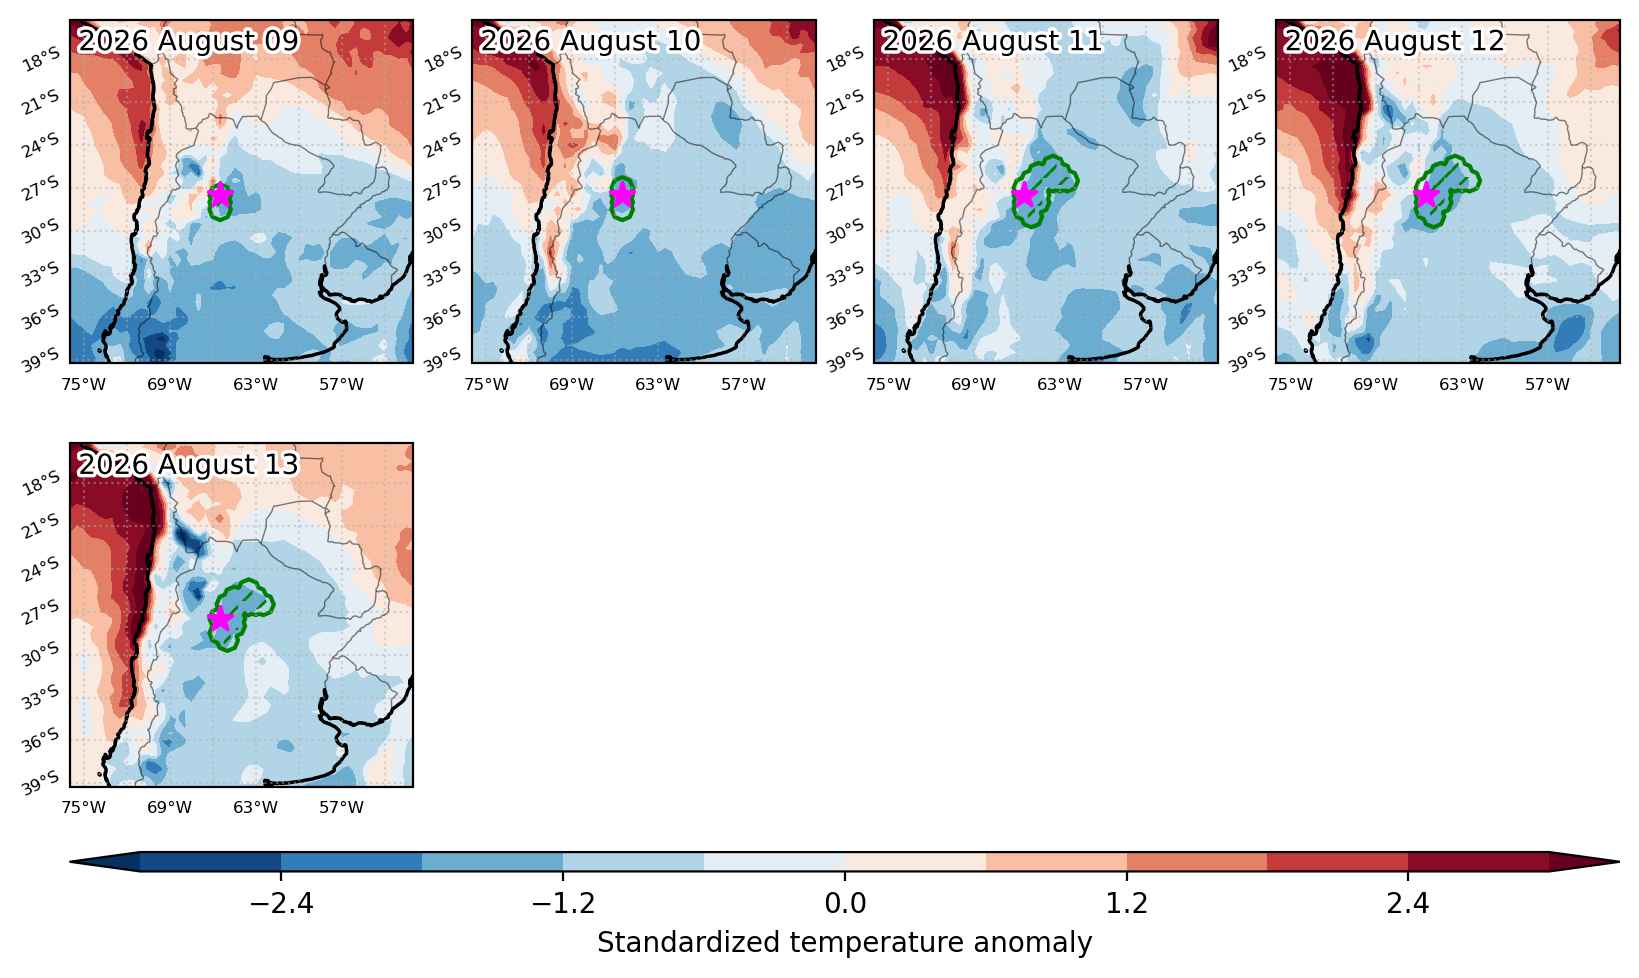
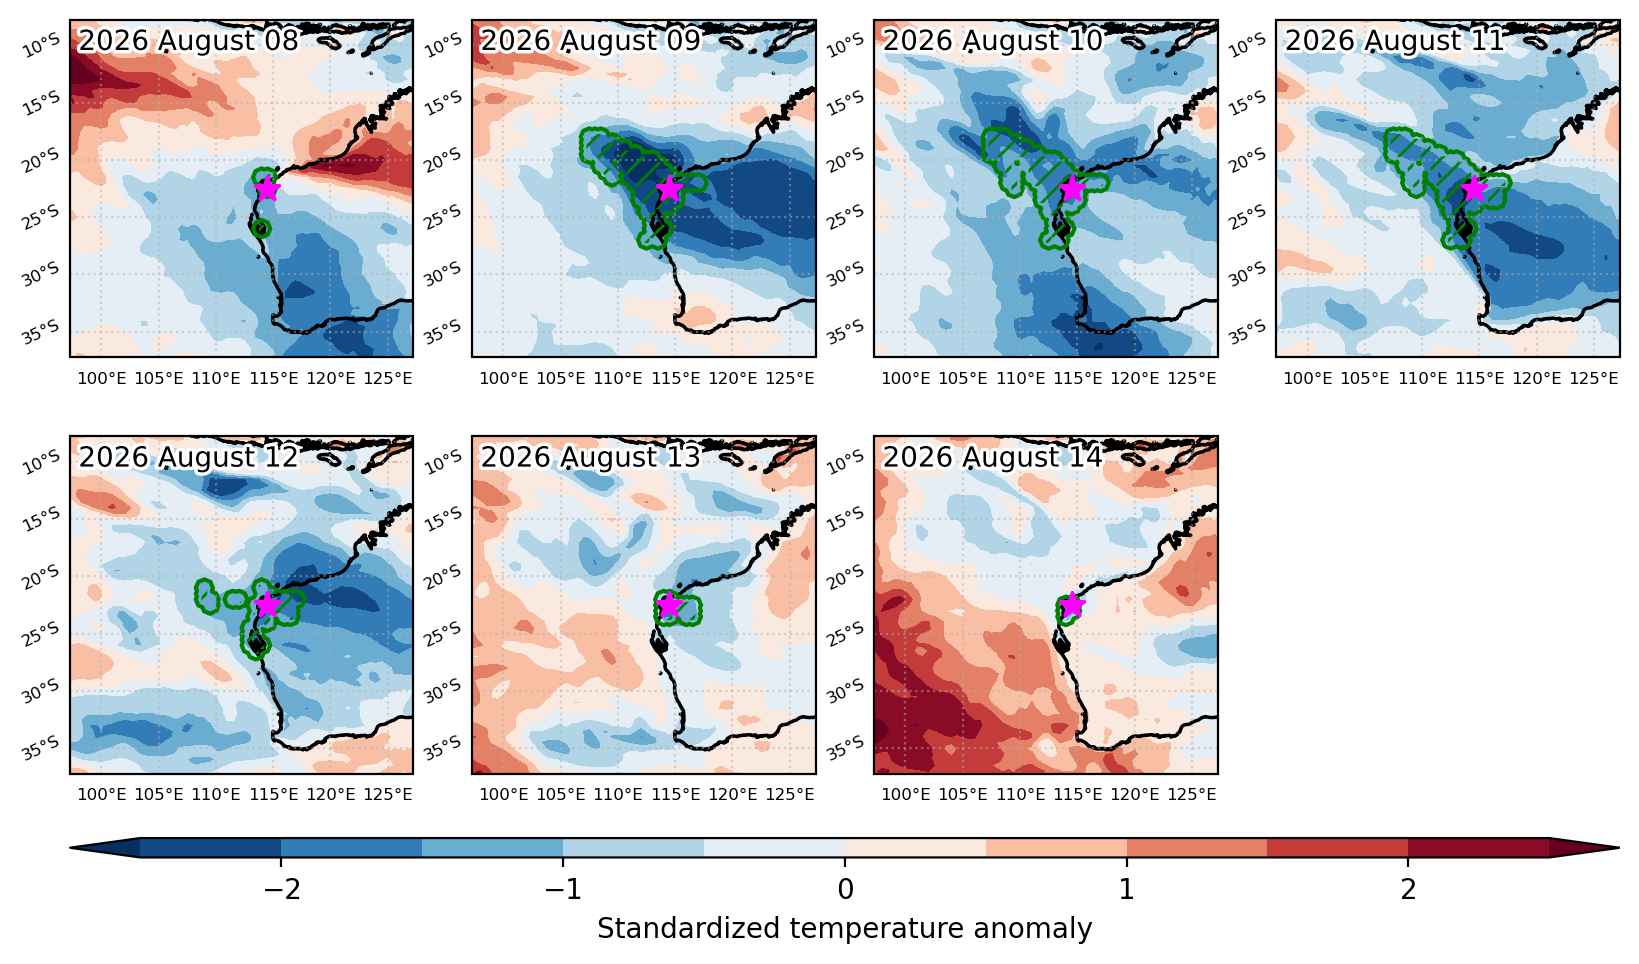
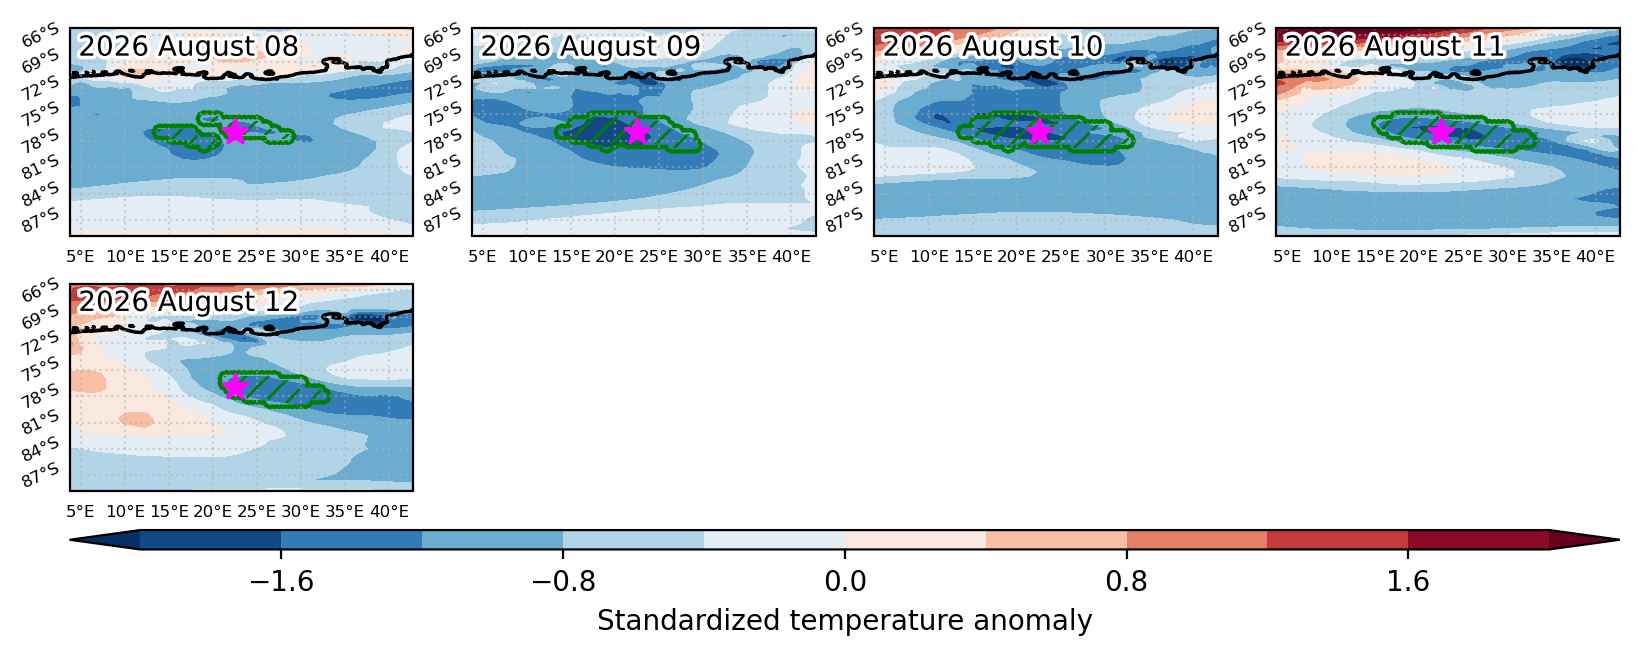
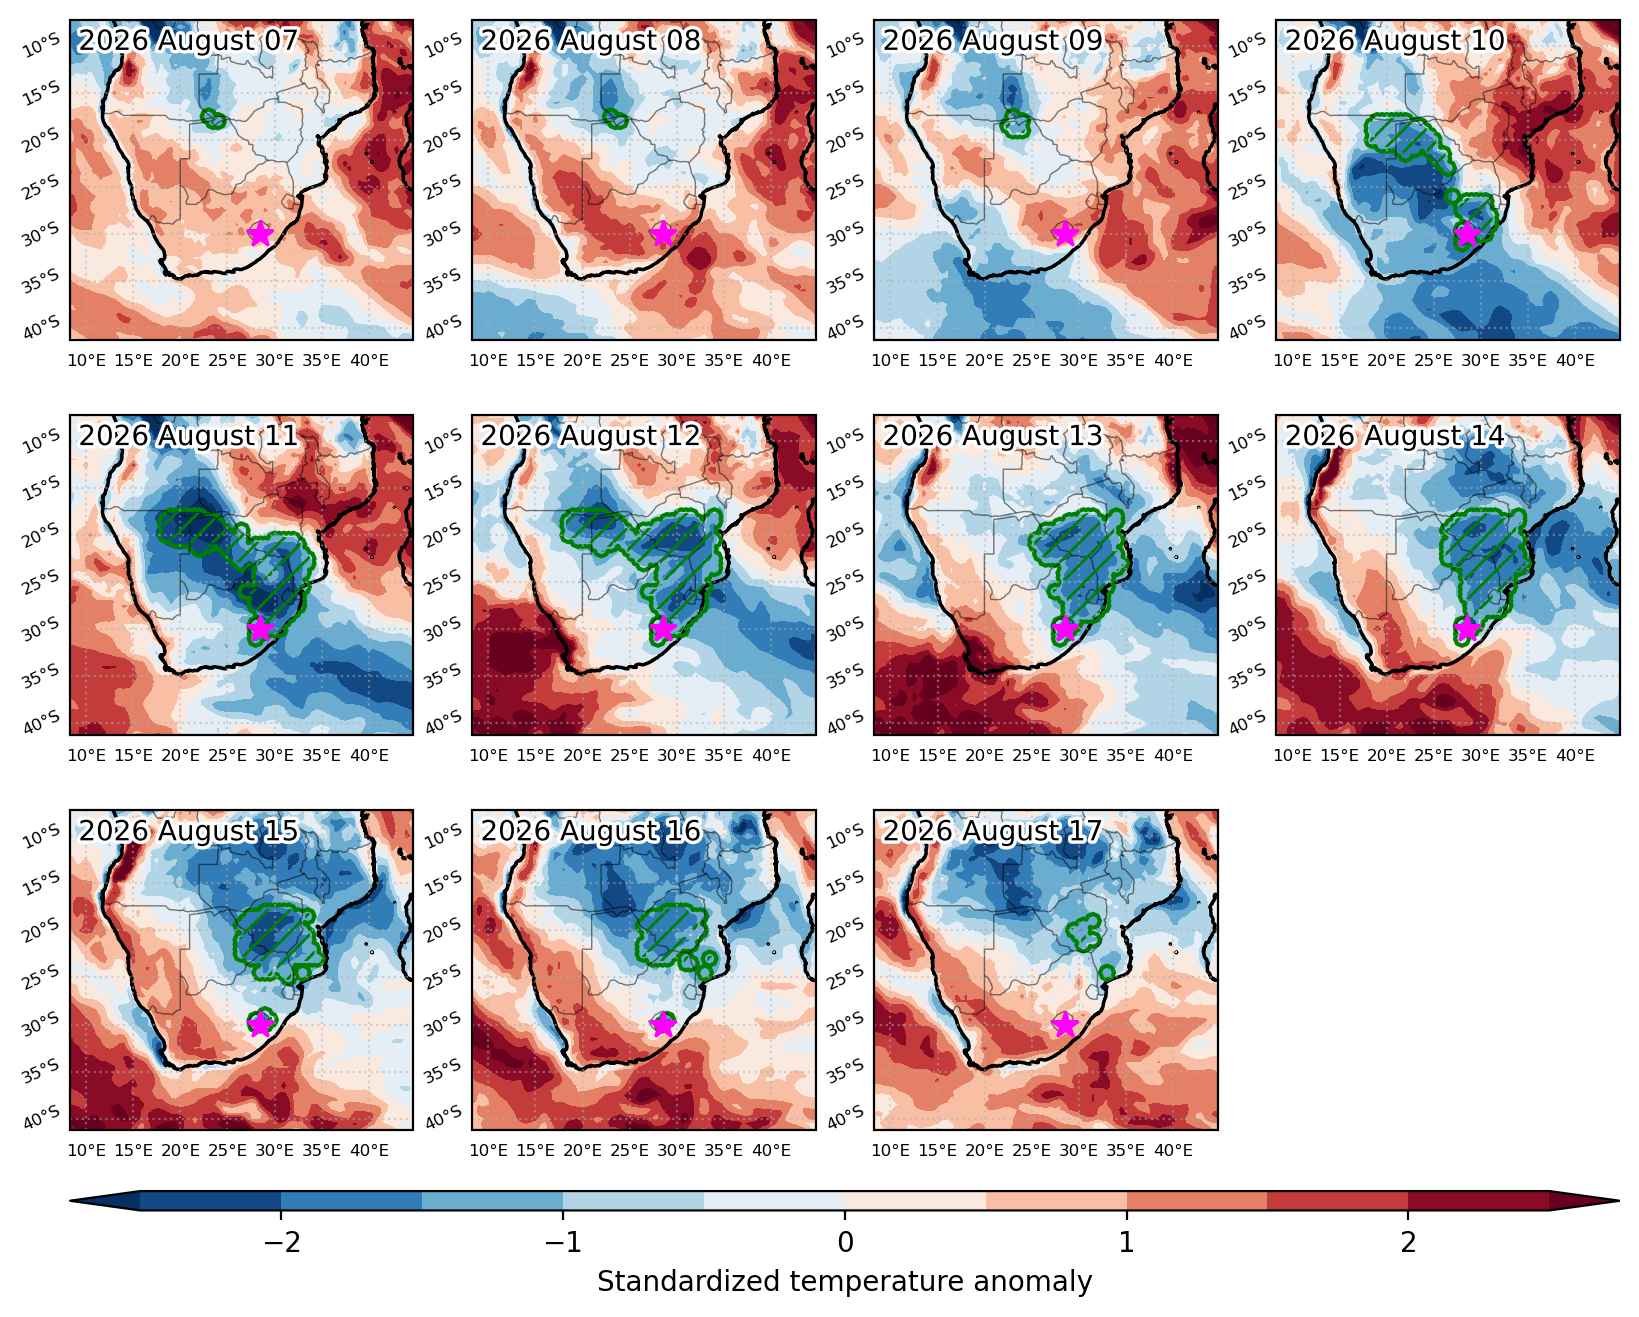
    Fig. 3: Maps illustrating the evolution of standardized temperature anomalies during the event.

    Event ID: Heat_wave_2026-Apr-24_to_2026-May-03_264.5_9.0

    (ongoing) Heat wave occuring from April 23 2026 to May 03 2026 at 27.5°N 147.0°E

    Download data: JSON

    Event type: Heat wave

    Countries affected (identified with ArcGIS Online; provided only for geographical reference):

      Duration: 11 days

      Time span: April 23 2026 to May 03 2026

      Statistics over entire affected area:

      • Mean temperature anomaly: 2.1 °C
      • Mean temperature: 24.4 °C
      • Maximum temperature anomaly: 3.6 °C
      • Maximum temperature: 25.7 °C

      Event center: 27.5°N 147.0°E

      Area affected: 176859 km$^2$


      Fig. 1: unavailable since event is ongoing.


      Fig. 3: Maps illustrating the evolution of standardized temperature anomalies during the event.

      Event ID: Heat_wave_2026-Apr-23_to_2026-May-03_147.0_27.5

      (ongoing) Heat wave occuring from April 23 2026 to May 03 2026 at -13.5°S 289.0°E

      Download data: JSON

      Event type: Heat wave

      Countries affected (identified with ArcGIS Online; provided only for geographical reference):

      • Peru

      Duration: 11 days

      Time span: April 23 2026 to May 03 2026

      Statistics over entire affected area:

      • Mean temperature anomaly: 1.7 °C
      • Mean temperature: 21.2 °C
      • Maximum temperature anomaly: 3.2 °C
      • Maximum temperature: 28.0 °C

      Event center: -13.5°S 289.0°E

      Area affected: 160195 km$^2$


      Fig. 1: unavailable since event is ongoing.


      Fig. 3: Maps illustrating the evolution of standardized temperature anomalies during the event.

      Event ID: Heat_wave_2026-Apr-23_to_2026-May-03_289.0_-13.5

      (ongoing) Heat wave occuring from April 21 2026 to May 03 2026 at 4.0°N 317.5°E

      Download data: JSON

      Event type: Heat wave

      Countries affected (identified with ArcGIS Online; provided only for geographical reference):

      • Brazil
      • French Guiana

      Duration: 13 days

      Time span: April 21 2026 to May 03 2026

      Statistics over entire affected area:

      • Mean temperature anomaly: 0.8 °C
      • Mean temperature: 27.1 °C
      • Maximum temperature anomaly: 1.7 °C
      • Maximum temperature: 27.8 °C

      Event center: 4.0°N 317.5°E

      Area affected: 434440 km$^2$


      Fig. 1: unavailable since event is ongoing.


      Fig. 3: Maps illustrating the evolution of standardized temperature anomalies during the event.

      Event ID: Heat_wave_2026-Apr-21_to_2026-May-03_317.5_4.0

      (ongoing) Cold spell occuring from April 20 2026 to May 03 2026 at -31.0°S 288.0°E

      Download data: JSON

      Event type: Cold spell

      Countries affected (identified with ArcGIS Online; provided only for geographical reference):

      • Chile

      Duration: 14 days

      Time span: April 20 2026 to May 03 2026

      Statistics over entire affected area:

      • Mean temperature anomaly: -1.5 °C
      • Mean temperature: 14.0 °C
      • Minimum temperature anomaly: -3.0 °C
      • Minimum temperature: 11.2 °C

      Event center: -31.0°S 288.0°E

      Area affected: 102435 km$^2$


      Fig. 1: unavailable since event is ongoing.


      Fig. 3: Maps illustrating the evolution of standardized temperature anomalies during the event.

      Event ID: Cold_spell_2026-Apr-20_to_2026-May-03_288.0_-31.0

      (ongoing) Heat wave occuring from April 20 2026 to May 03 2026 at -45.5°S 147.5°E

      Download data: JSON

      Event type: Heat wave

      Countries affected (identified with ArcGIS Online; provided only for geographical reference):

      • Australia

      Duration: 14 days

      Time span: April 20 2026 to May 03 2026

      Statistics over entire affected area:

      • Mean temperature anomaly: 3.4 °C
      • Mean temperature: 16.1 °C
      • Maximum temperature anomaly: 10.9 °C
      • Maximum temperature: 25.9 °C

      Event center: -45.5°S 147.5°E

      Area affected: 3800949 km$^2$


      Fig. 1: unavailable since event is ongoing.


      Fig. 3: Maps illustrating the evolution of standardized temperature anomalies during the event.

      Event ID: Heat_wave_2026-Apr-20_to_2026-May-03_147.5_-45.5

      (ongoing) Heat wave occuring from April 19 2026 to May 03 2026 at 49.5°N 234.0°E

      Download data: JSON

      Event type: Heat wave

      Countries affected (identified with ArcGIS Online; provided only for geographical reference):

      • Canada
      • United States

      Duration: 15 days

      Time span: April 19 2026 to May 03 2026

      Statistics over entire affected area:

      • Mean temperature anomaly: 7.1 °C
      • Mean temperature: 14.4 °C
      • Maximum temperature anomaly: 14.6 °C
      • Maximum temperature: 24.5 °C

      Event center: 49.5°N 234.0°E

      Area affected: 1910635 km$^2$


      Fig. 1: unavailable since event is ongoing.


      Fig. 3: Maps illustrating the evolution of standardized temperature anomalies during the event.

      Event ID: Heat_wave_2026-Apr-19_to_2026-May-03_234.0_49.5

      (ongoing) Cold spell occuring from April 18 2026 to May 03 2026 at 9.0°N 345.0°E

      Download data: JSON

      Event type: Cold spell

      Countries affected (identified with ArcGIS Online; provided only for geographical reference):

      • Guinea
      • Sierra Leone

      Duration: 16 days

      Time span: April 18 2026 to May 03 2026

      Statistics over entire affected area:

      • Mean temperature anomaly: -1.8 °C
      • Mean temperature: 23.0 °C
      • Minimum temperature anomaly: -3.5 °C
      • Minimum temperature: 19.2 °C

      Event center: 9.0°N 345.0°E

      Area affected: 258491 km$^2$


      Fig. 1: unavailable since event is ongoing.


      Fig. 3: Maps illustrating the evolution of standardized temperature anomalies during the event.

      Event ID: Cold_spell_2026-Apr-18_to_2026-May-03_345.0_9.0

      (ongoing) Heat wave occuring from April 17 2026 to May 03 2026 at -17.5°S 185.5°E

      Download data: JSON

      Event type: Heat wave

      Countries affected (identified with ArcGIS Online; provided only for geographical reference):

      • Fiji
      • Samoa
      • Vanuatu

      Duration: 17 days

      Time span: April 17 2026 to May 03 2026

      Statistics over entire affected area:

      • Mean temperature anomaly: 1.3 °C
      • Mean temperature: 27.7 °C
      • Maximum temperature anomaly: 3.0 °C
      • Maximum temperature: 29.3 °C

      Event center: -17.5°S 185.5°E

      Area affected: 4267263 km$^2$


      Fig. 1: unavailable since event is ongoing.


      Fig. 3: Maps illustrating the evolution of standardized temperature anomalies during the event.

      Event ID: Heat_wave_2026-Apr-17_to_2026-May-03_185.5_-17.5

      (ongoing) Heat wave occuring from April 17 2026 to May 03 2026 at 10.0°N 92.5°E

      Download data: JSON

      Event type: Heat wave

      Countries affected (identified with ArcGIS Online; provided only for geographical reference):

      • India
      • Malaysia
      • Myanmar
      • Thailand

      Duration: 17 days

      Time span: April 17 2026 to May 03 2026

      Statistics over entire affected area:

      • Mean temperature anomaly: 1.4 °C
      • Mean temperature: 29.6 °C
      • Maximum temperature anomaly: 3.6 °C
      • Maximum temperature: 31.9 °C

      Event center: 10.0°N 92.5°E

      Area affected: 746470 km$^2$


      Fig. 1: unavailable since event is ongoing.


      Fig. 3: Maps illustrating the evolution of standardized temperature anomalies during the event.

      Event ID: Heat_wave_2026-Apr-17_to_2026-May-03_92.5_10.0