Cold spell occuring from May 12 2019 to May 25 2019 at 45.0°N 13.0°E

Download data: JSON

Event type: Cold spell

Countries affected (identified with ArcGIS Online; provided only for geographical reference):

  • Albania
  • Austria
  • Bosnia and Herzegovina
  • Bulgaria
  • Croatia
  • Czech Republic
  • France
  • Germany
  • Greece
  • Hungary
  • Italy
  • Montenegro
  • Poland
  • Romania
  • Serbia
  • Slovakia
  • Slovenia
  • Spain
  • Switzerland
  • Tunisia

Duration: 14 days

Time span: May 12 2019 to May 25 2019

Statistics over entire affected area:

  • Mean temperature anomaly: -3.7 °C
  • Mean temperature: 13.1 °C
  • Minimum temperature anomaly: -9.7 °C
  • Minimum temperature: -4.7 °C

Event center: 45.0°N 13.0°E

Area affected: 2251981 km$^2$
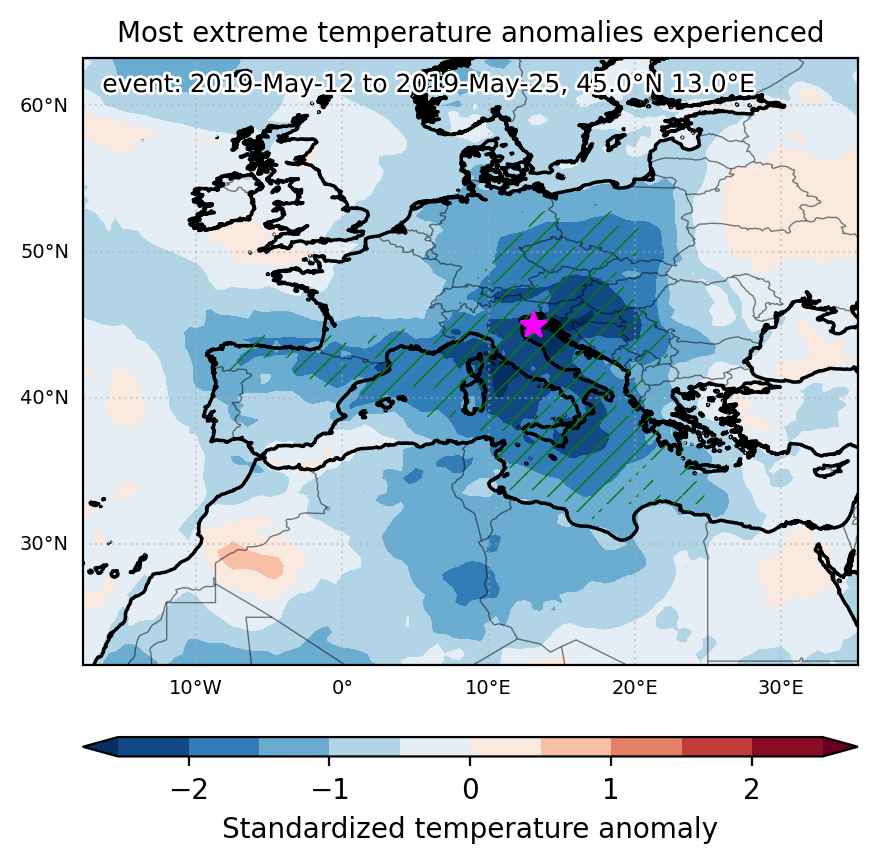

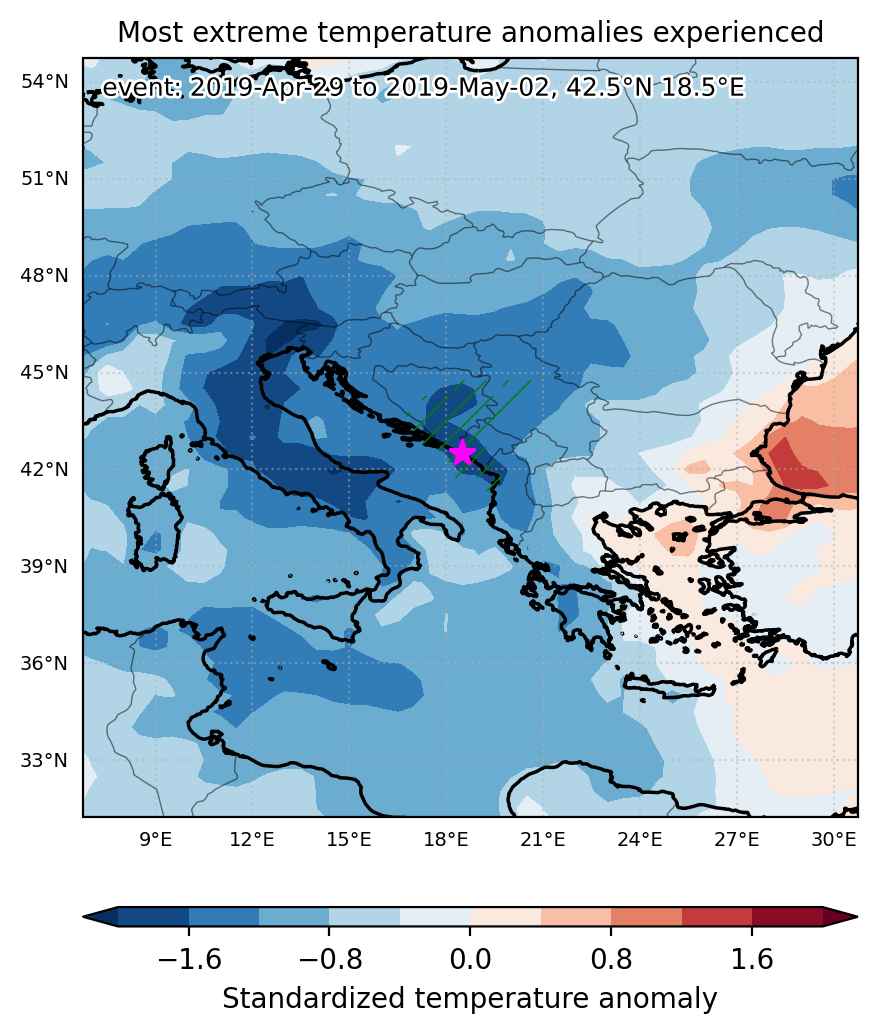
Fig. 1: Map of most extreme temperature anomalies (standardized) experienced during the event. The purple star indicates the center of the extreme event. Green hatching illustrates all areas under the effect of extremes at some time during the event.
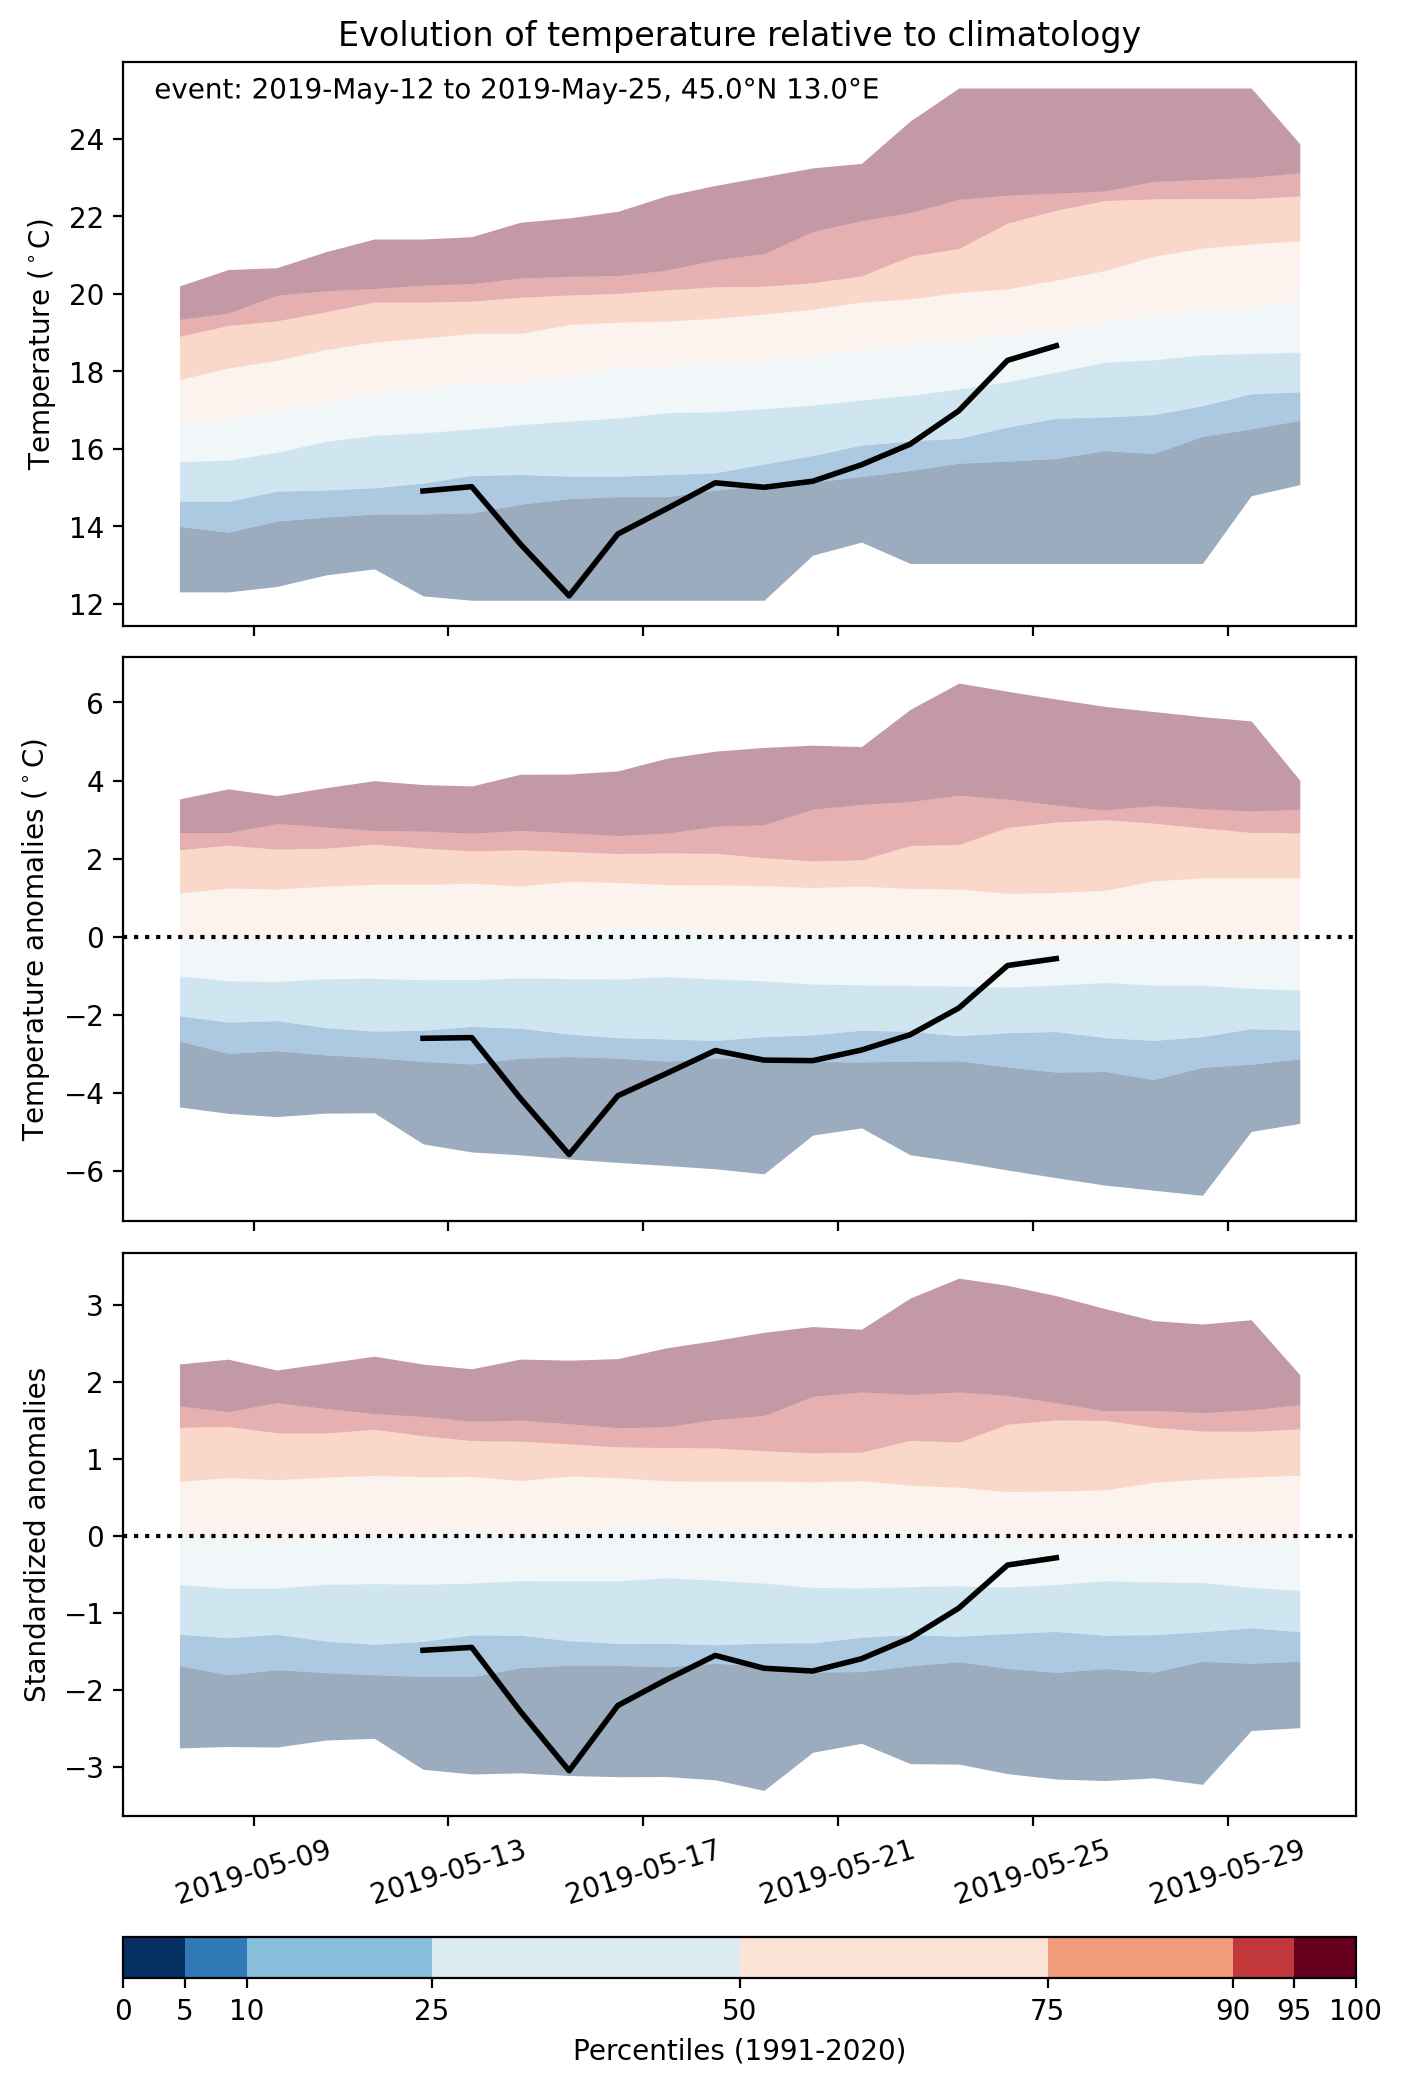


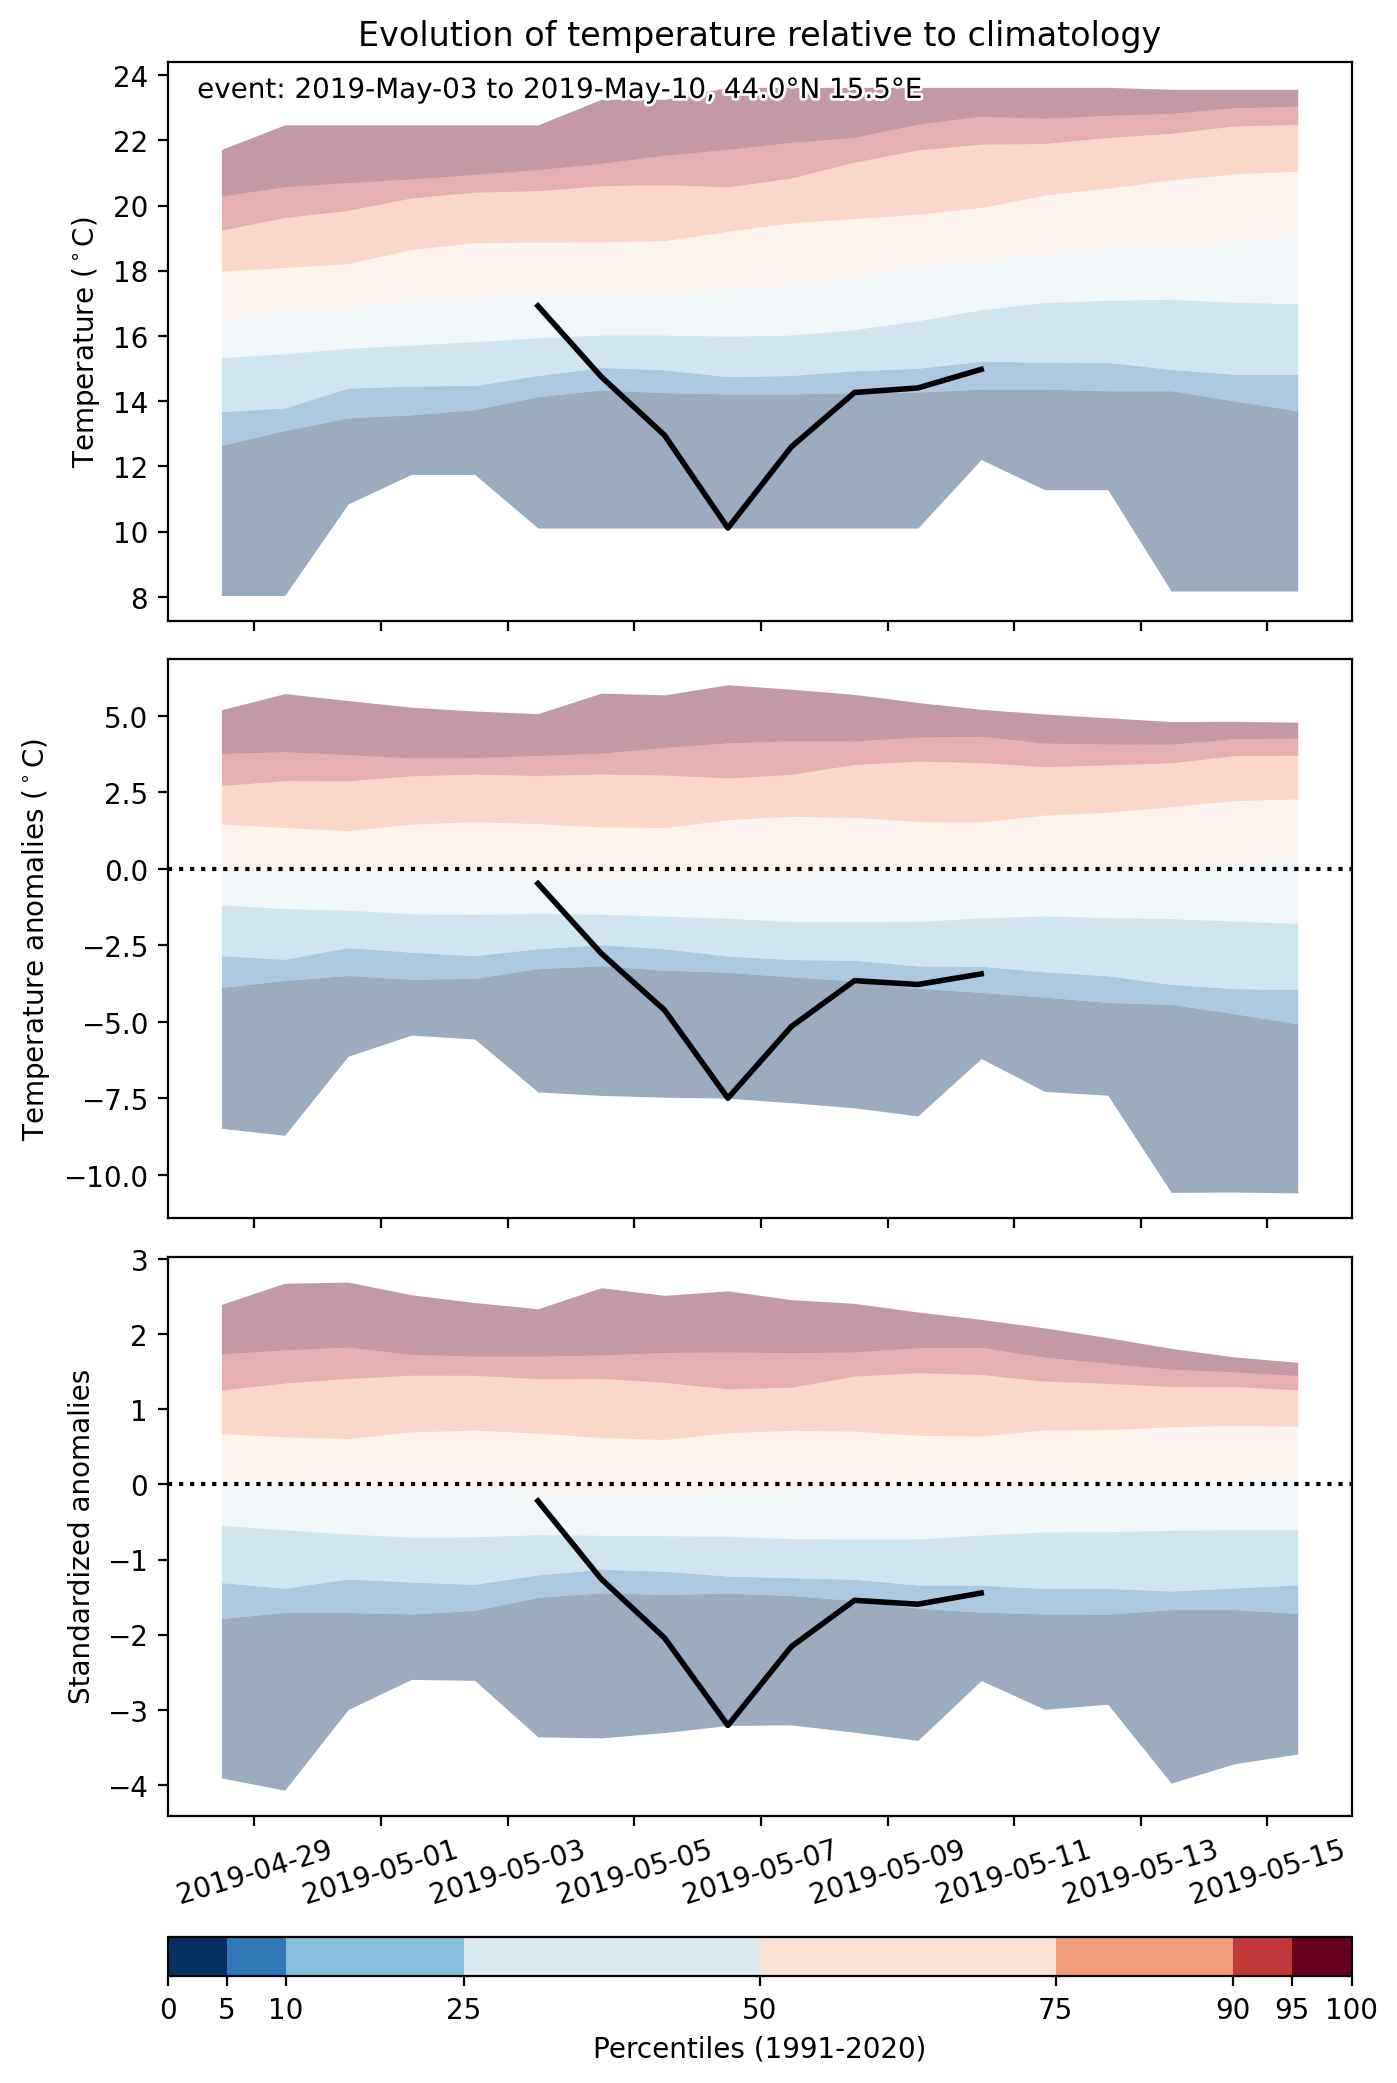
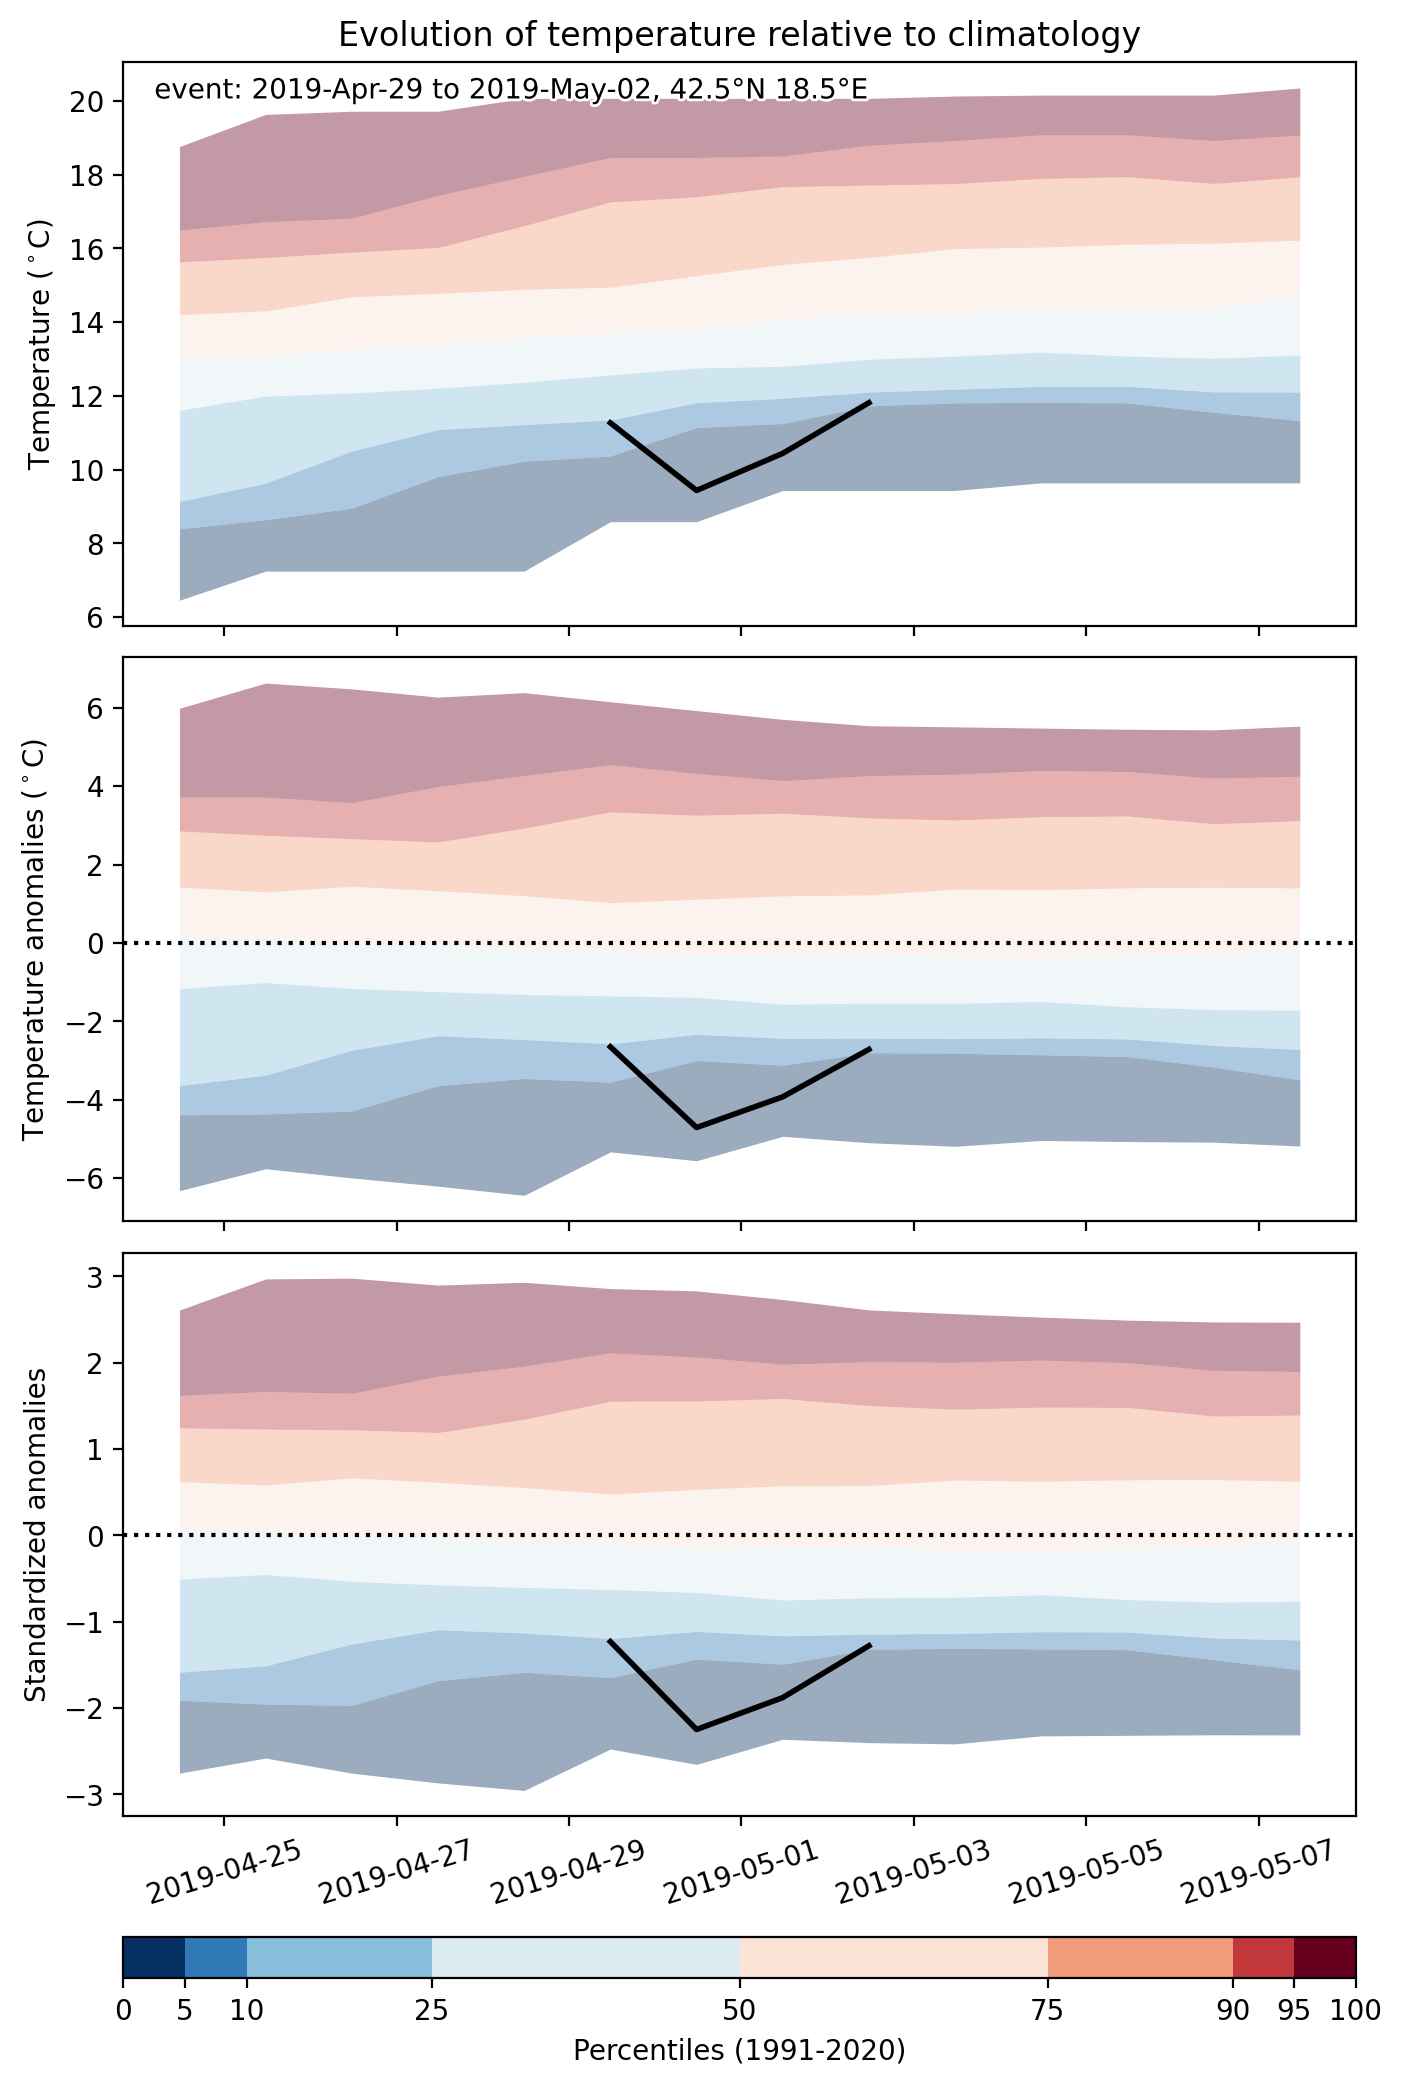
Fig. 2: Evolution of temperature at the center of the event. The climatological percentile distribution is illustrated with color shadings.
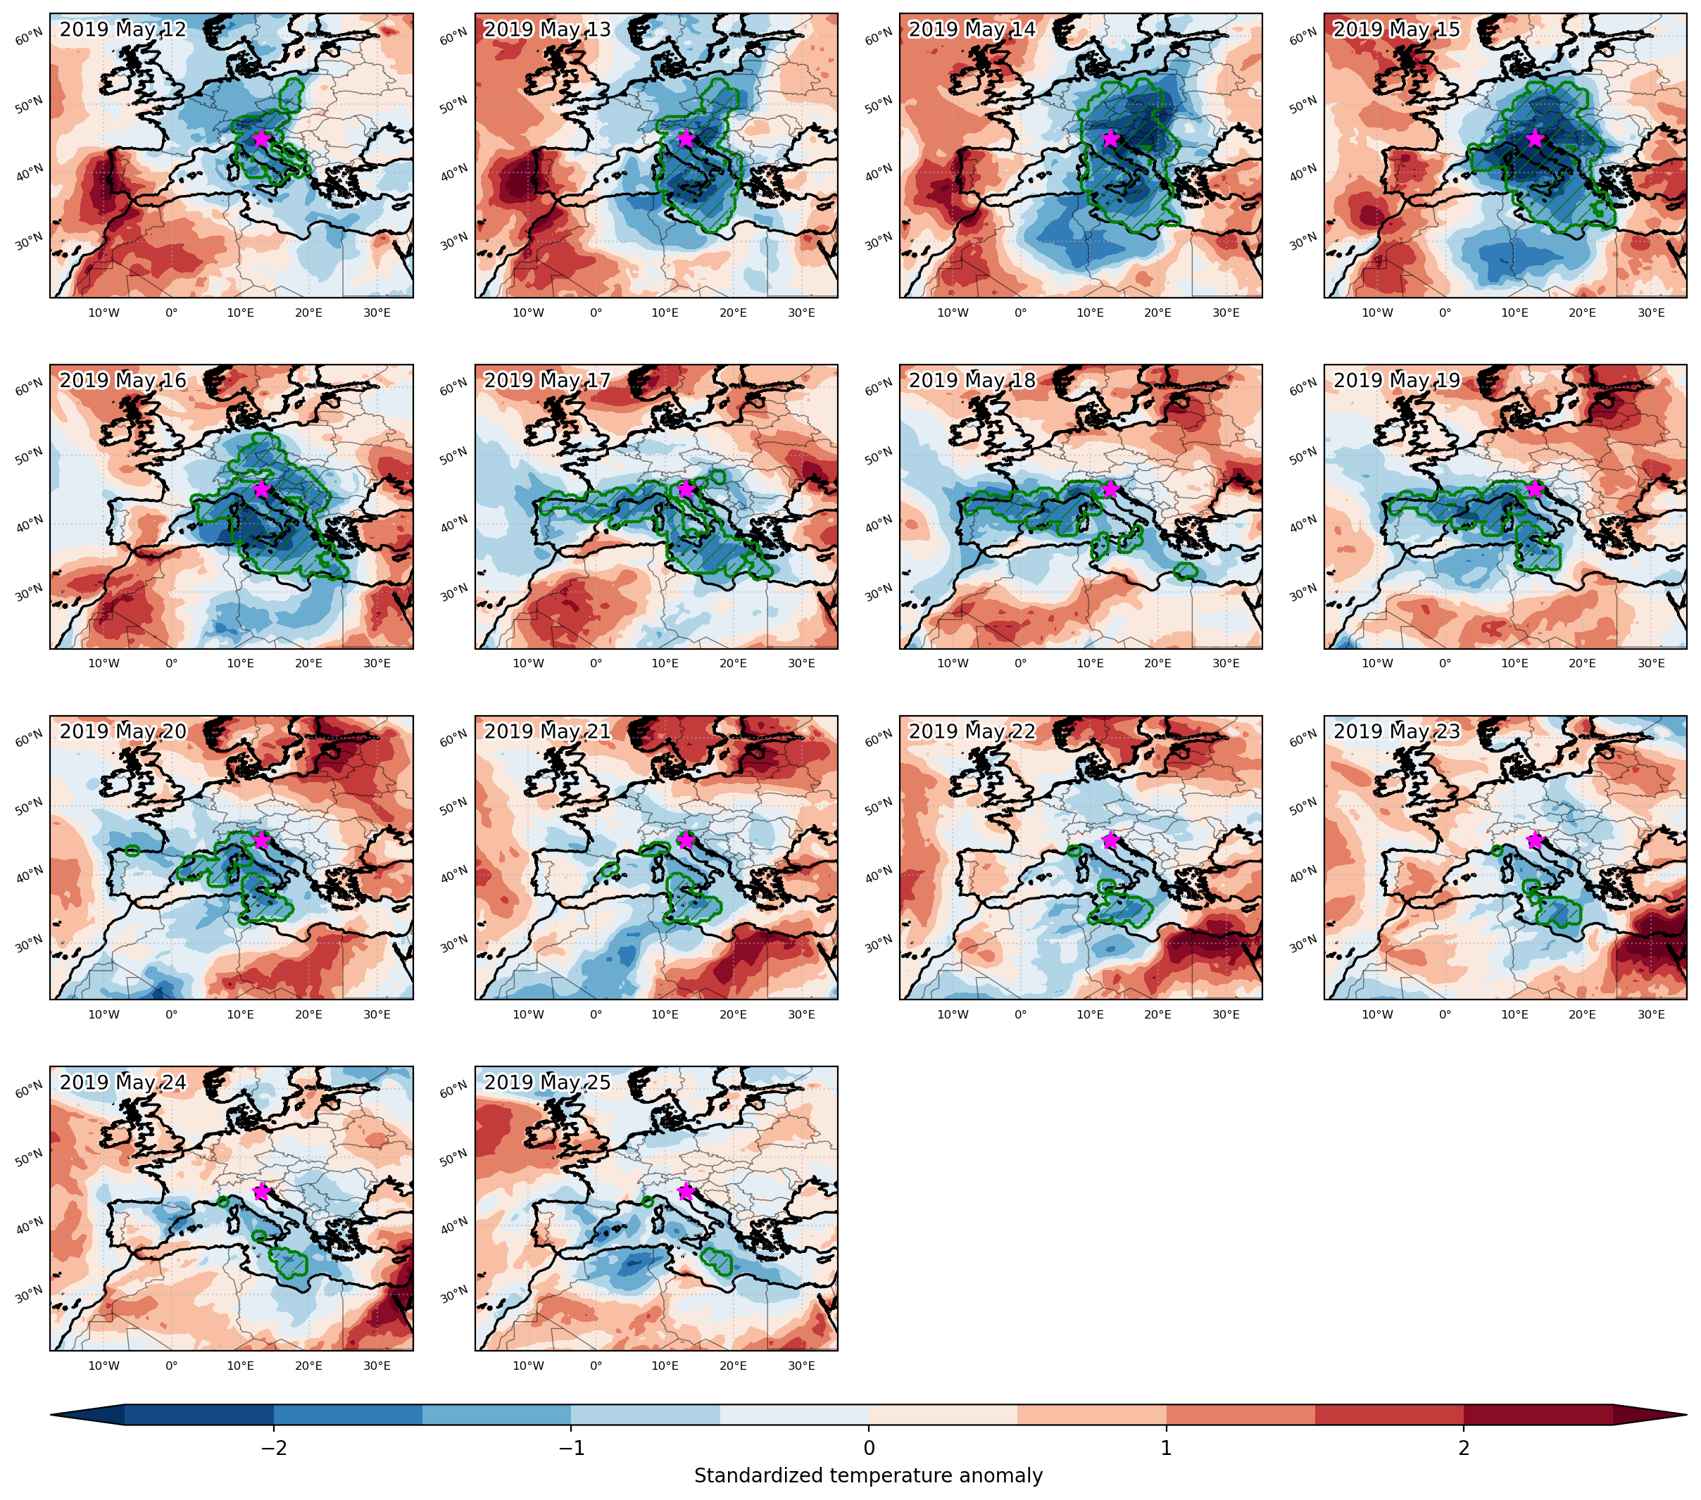


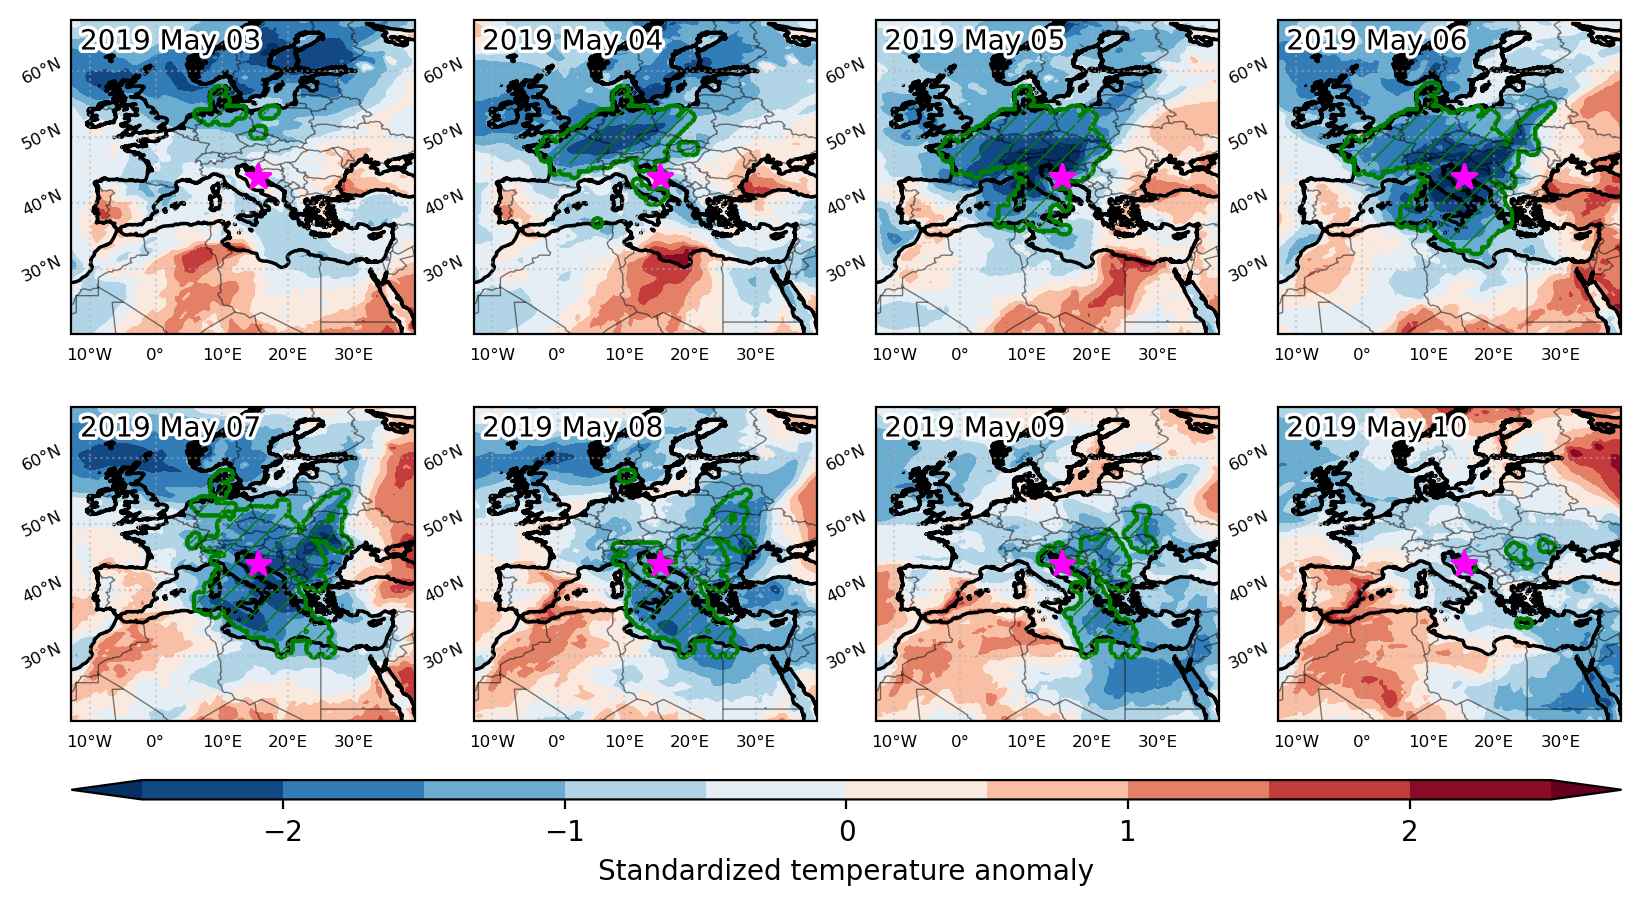
Fig. 3: Maps illustrating the evolution of standardized temperature anomalies during the event.

Event ID: Cold_spell_2019-May-12_to_2019-May-25_13.0_45.0
Cold spell occuring from May 03 2019 to May 10 2019 at 44.0°N 15.5°E

Download data: JSON

Event type: Cold spell

Countries affected (identified with ArcGIS Online; provided only for geographical reference):

  • Albania
  • Algeria
  • Austria
  • Belarus
  • Belgium
  • Bosnia and Herzegovina
  • Bulgaria
  • Croatia
  • Czech Republic
  • Denmark
  • Egypt
  • France
  • Germany
  • Greece
  • Hungary
  • Italy
  • Libya
  • Luxembourg
  • Moldova
  • Montenegro
  • Netherlands
  • North Macedonia
  • Poland
  • Romania
  • Serbia
  • Slovakia
  • Slovenia
  • Switzerland
  • Tunisia
  • Ukraine

Duration: 8 days

Time span: May 03 2019 to May 10 2019

Statistics over entire affected area:

  • Mean temperature anomaly: -4.7 °C
  • Mean temperature: 9.6 °C
  • Minimum temperature anomaly: -10.3 °C
  • Minimum temperature: -8.7 °C

Event center: 44.0°N 15.5°E

Area affected: 3192553 km$^2$


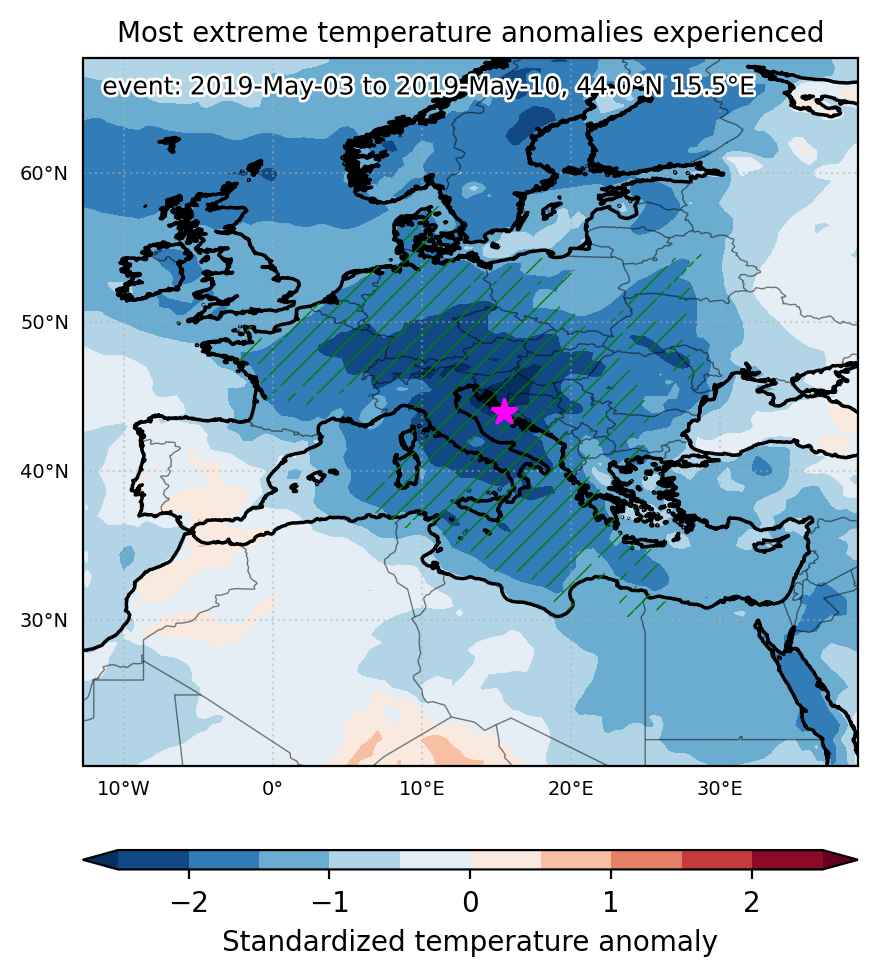
Fig. 1: Map of most extreme temperature anomalies (standardized) experienced during the event. The purple star indicates the center of the extreme event. Green hatching illustrates all areas under the effect of extremes at some time during the event.


Fig. 2: Evolution of temperature at the center of the event. The climatological percentile distribution is illustrated with color shadings.


Fig. 3: Maps illustrating the evolution of standardized temperature anomalies during the event.

Event ID: Cold_spell_2019-May-03_to_2019-May-10_15.5_44.0

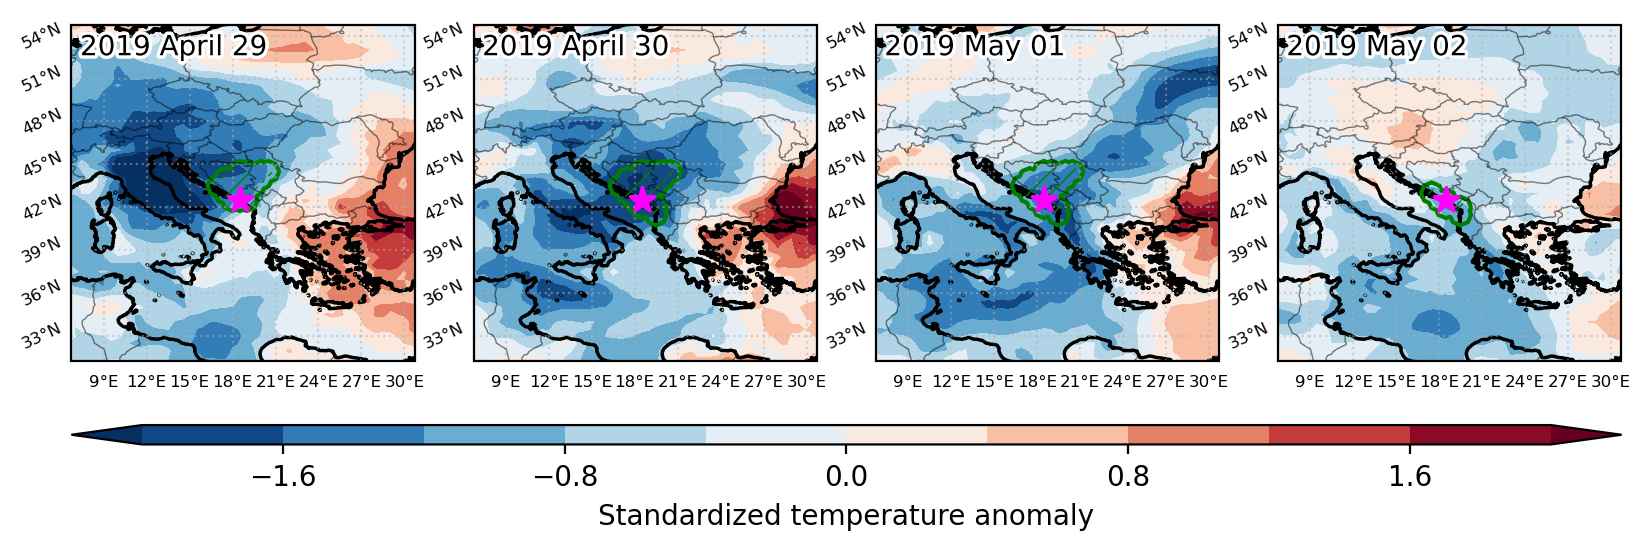
Cold spell occuring from April 29 2019 to May 02 2019 at 42.5°N 18.5°E

Download data: JSON

Event type: Cold spell

Countries affected (identified with ArcGIS Online; provided only for geographical reference):

  • Albania
  • Bosnia and Herzegovina
  • Croatia
  • Montenegro
  • Serbia

Duration: 4 days

Time span: April 29 2019 to May 02 2019

Statistics over entire affected area:

  • Mean temperature anomaly: -4.2 °C
  • Mean temperature: 9.7 °C
  • Minimum temperature anomaly: -6.6 °C
  • Minimum temperature: 3.5 °C

Event center: 42.5°N 18.5°E

Area affected: 60699 km$^2$


Fig. 1: Map of most extreme temperature anomalies (standardized) experienced during the event. The purple star indicates the center of the extreme event. Green hatching illustrates all areas under the effect of extremes at some time during the event.


Fig. 2: Evolution of temperature at the center of the event. The climatological percentile distribution is illustrated with color shadings.


Fig. 3: Maps illustrating the evolution of standardized temperature anomalies during the event.

Event ID: Cold_spell_2019-Apr-29_to_2019-May-02_18.5_42.5

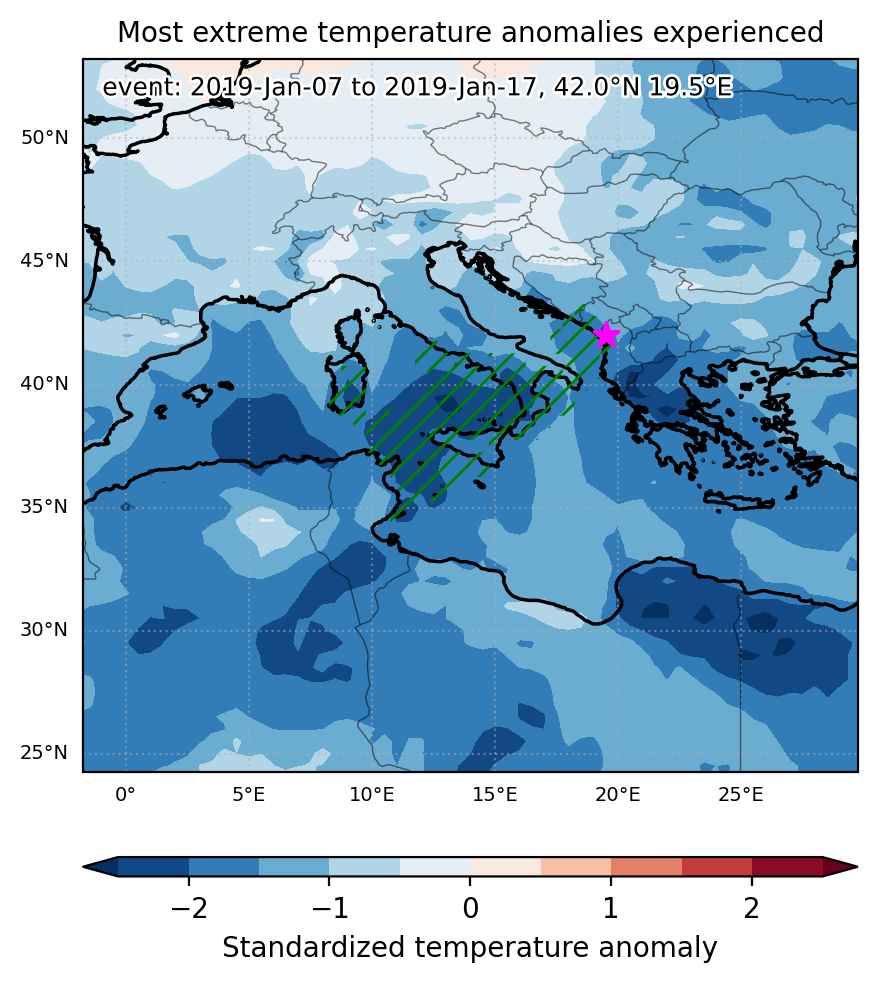
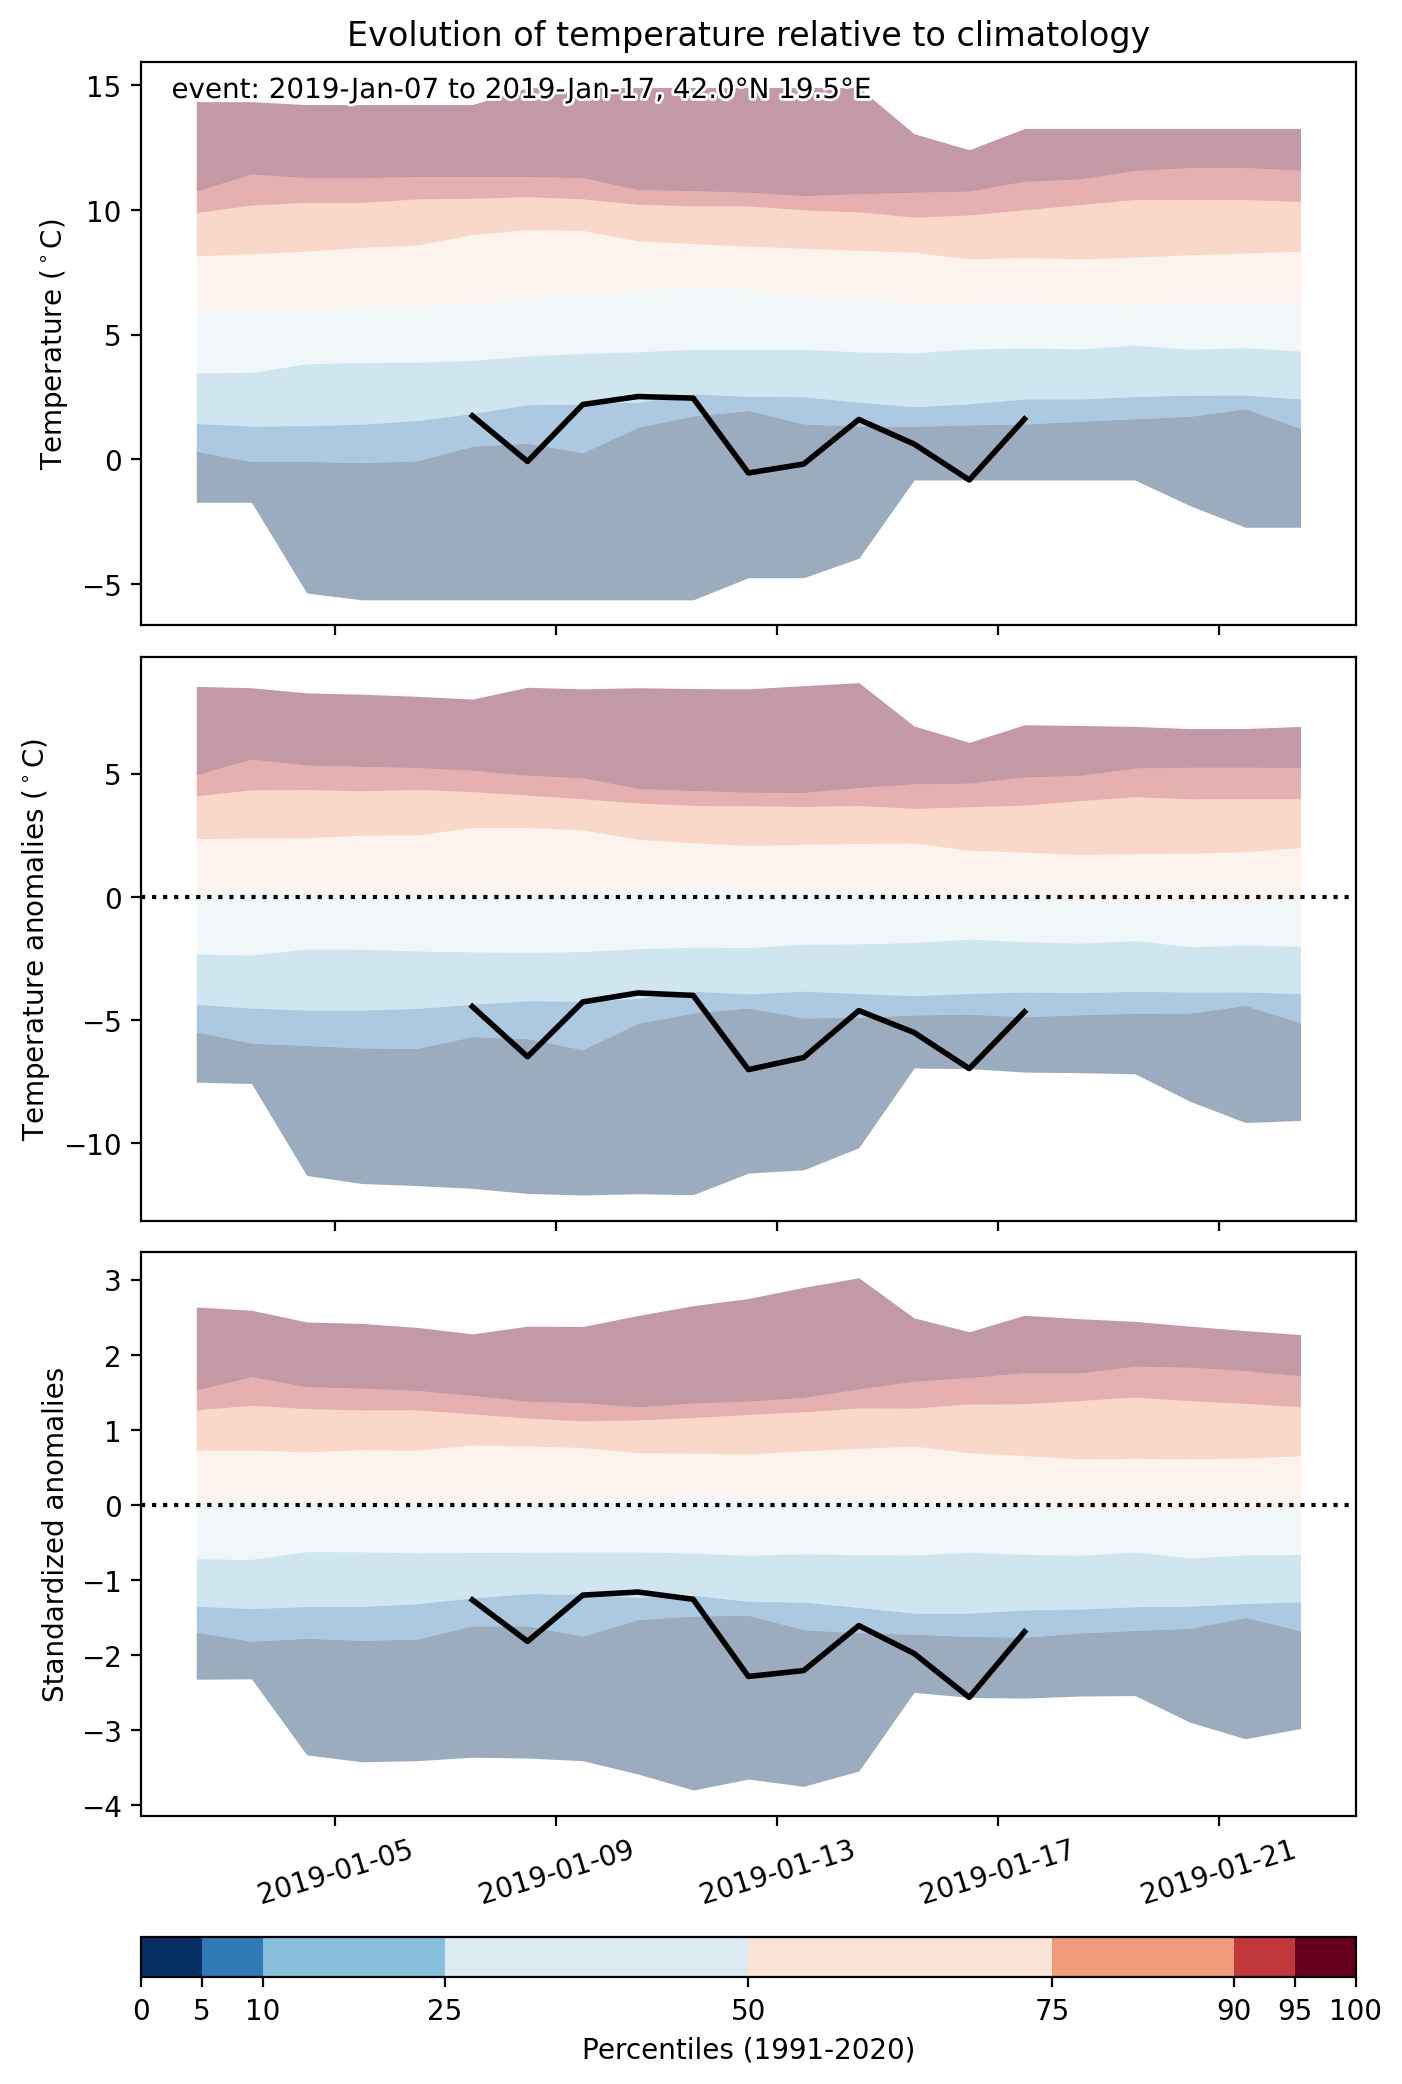
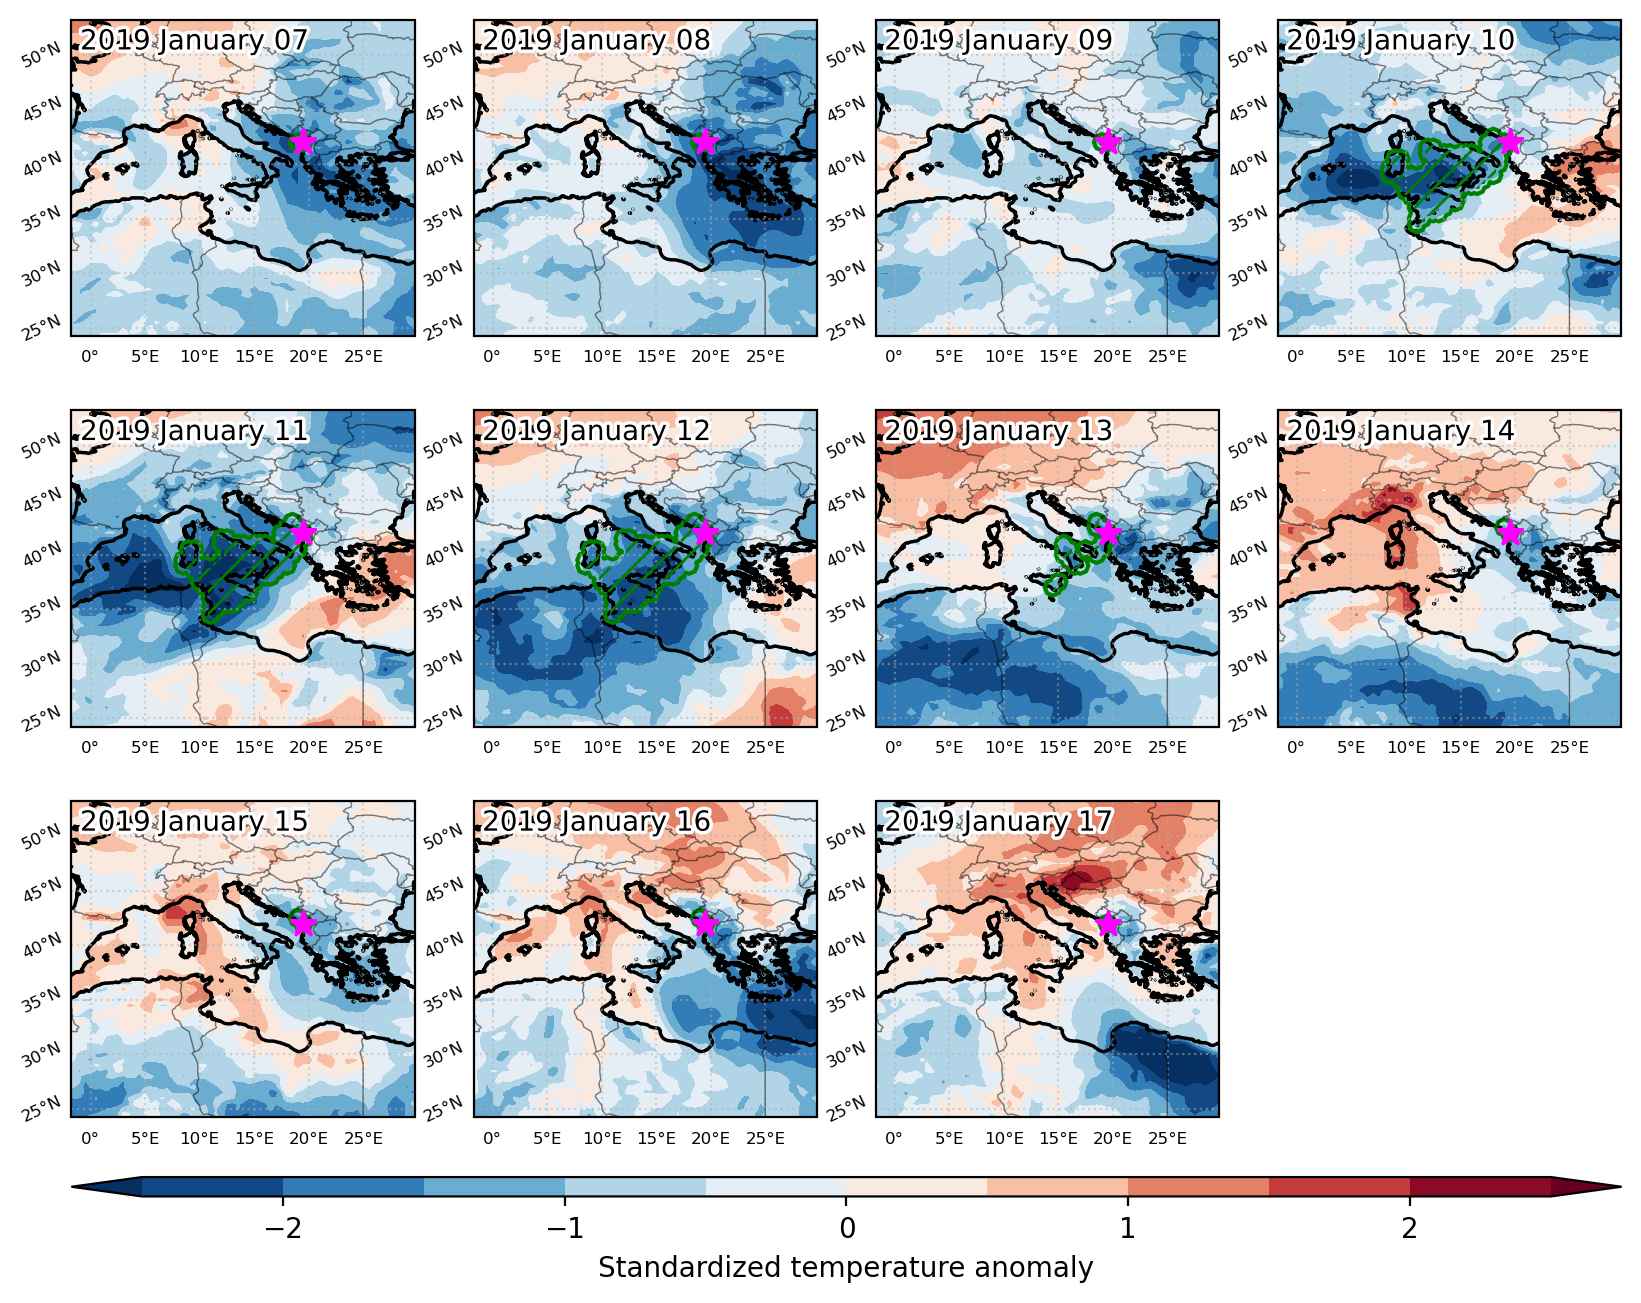
Cold spell occuring from January 07 2019 to January 17 2019 at 42.0°N 19.5°E

Download data: JSON

Event type: Cold spell

Countries affected (identified with ArcGIS Online; provided only for geographical reference):

  • Albania
  • Bosnia and Herzegovina
  • Italy
  • Montenegro
  • Tunisia

Duration: 11 days

Time span: January 07 2019 to January 17 2019

Statistics over entire affected area:

  • Mean temperature anomaly: -3.5 °C
  • Mean temperature: 8.1 °C
  • Minimum temperature anomaly: -7.7 °C
  • Minimum temperature: -6.8 °C

Event center: 42.0°N 19.5°E

Area affected: 381831 km$^2$


Fig. 1: Map of most extreme temperature anomalies (standardized) experienced during the event. The purple star indicates the center of the extreme event. Green hatching illustrates all areas under the effect of extremes at some time during the event.


Fig. 2: Evolution of temperature at the center of the event. The climatological percentile distribution is illustrated with color shadings.


Fig. 3: Maps illustrating the evolution of standardized temperature anomalies during the event.

Event ID: Cold_spell_2019-Jan-07_to_2019-Jan-17_19.5_42.0

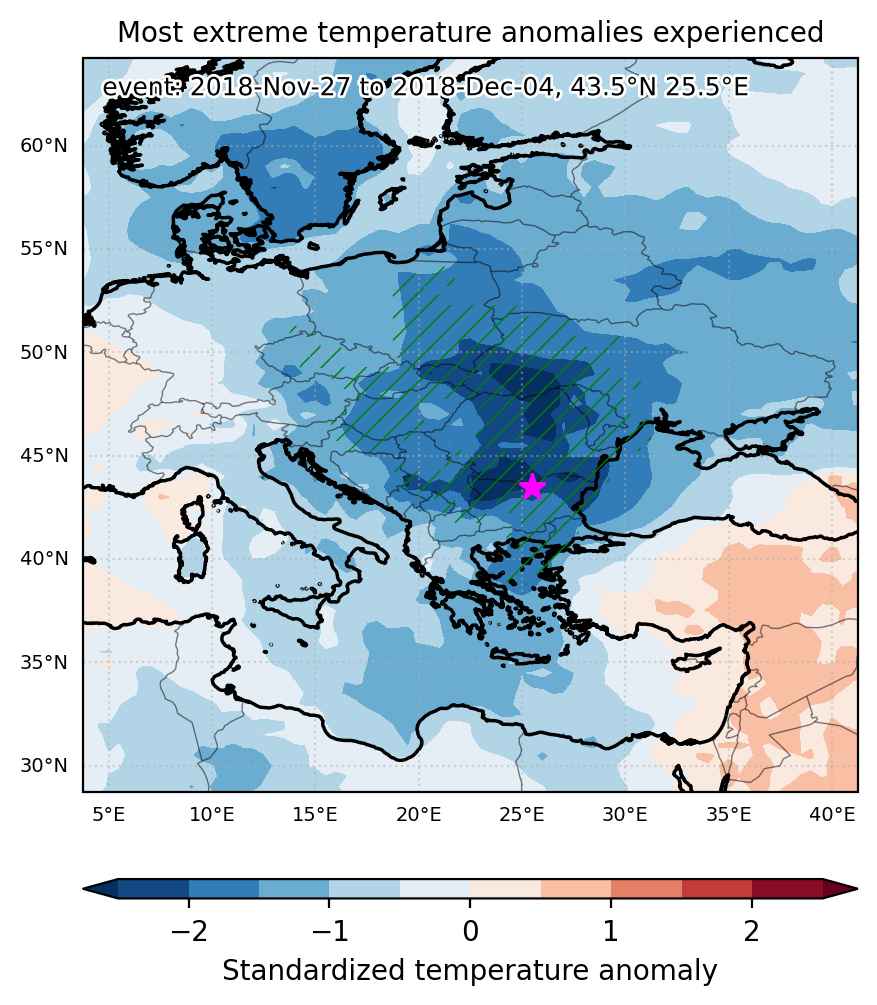
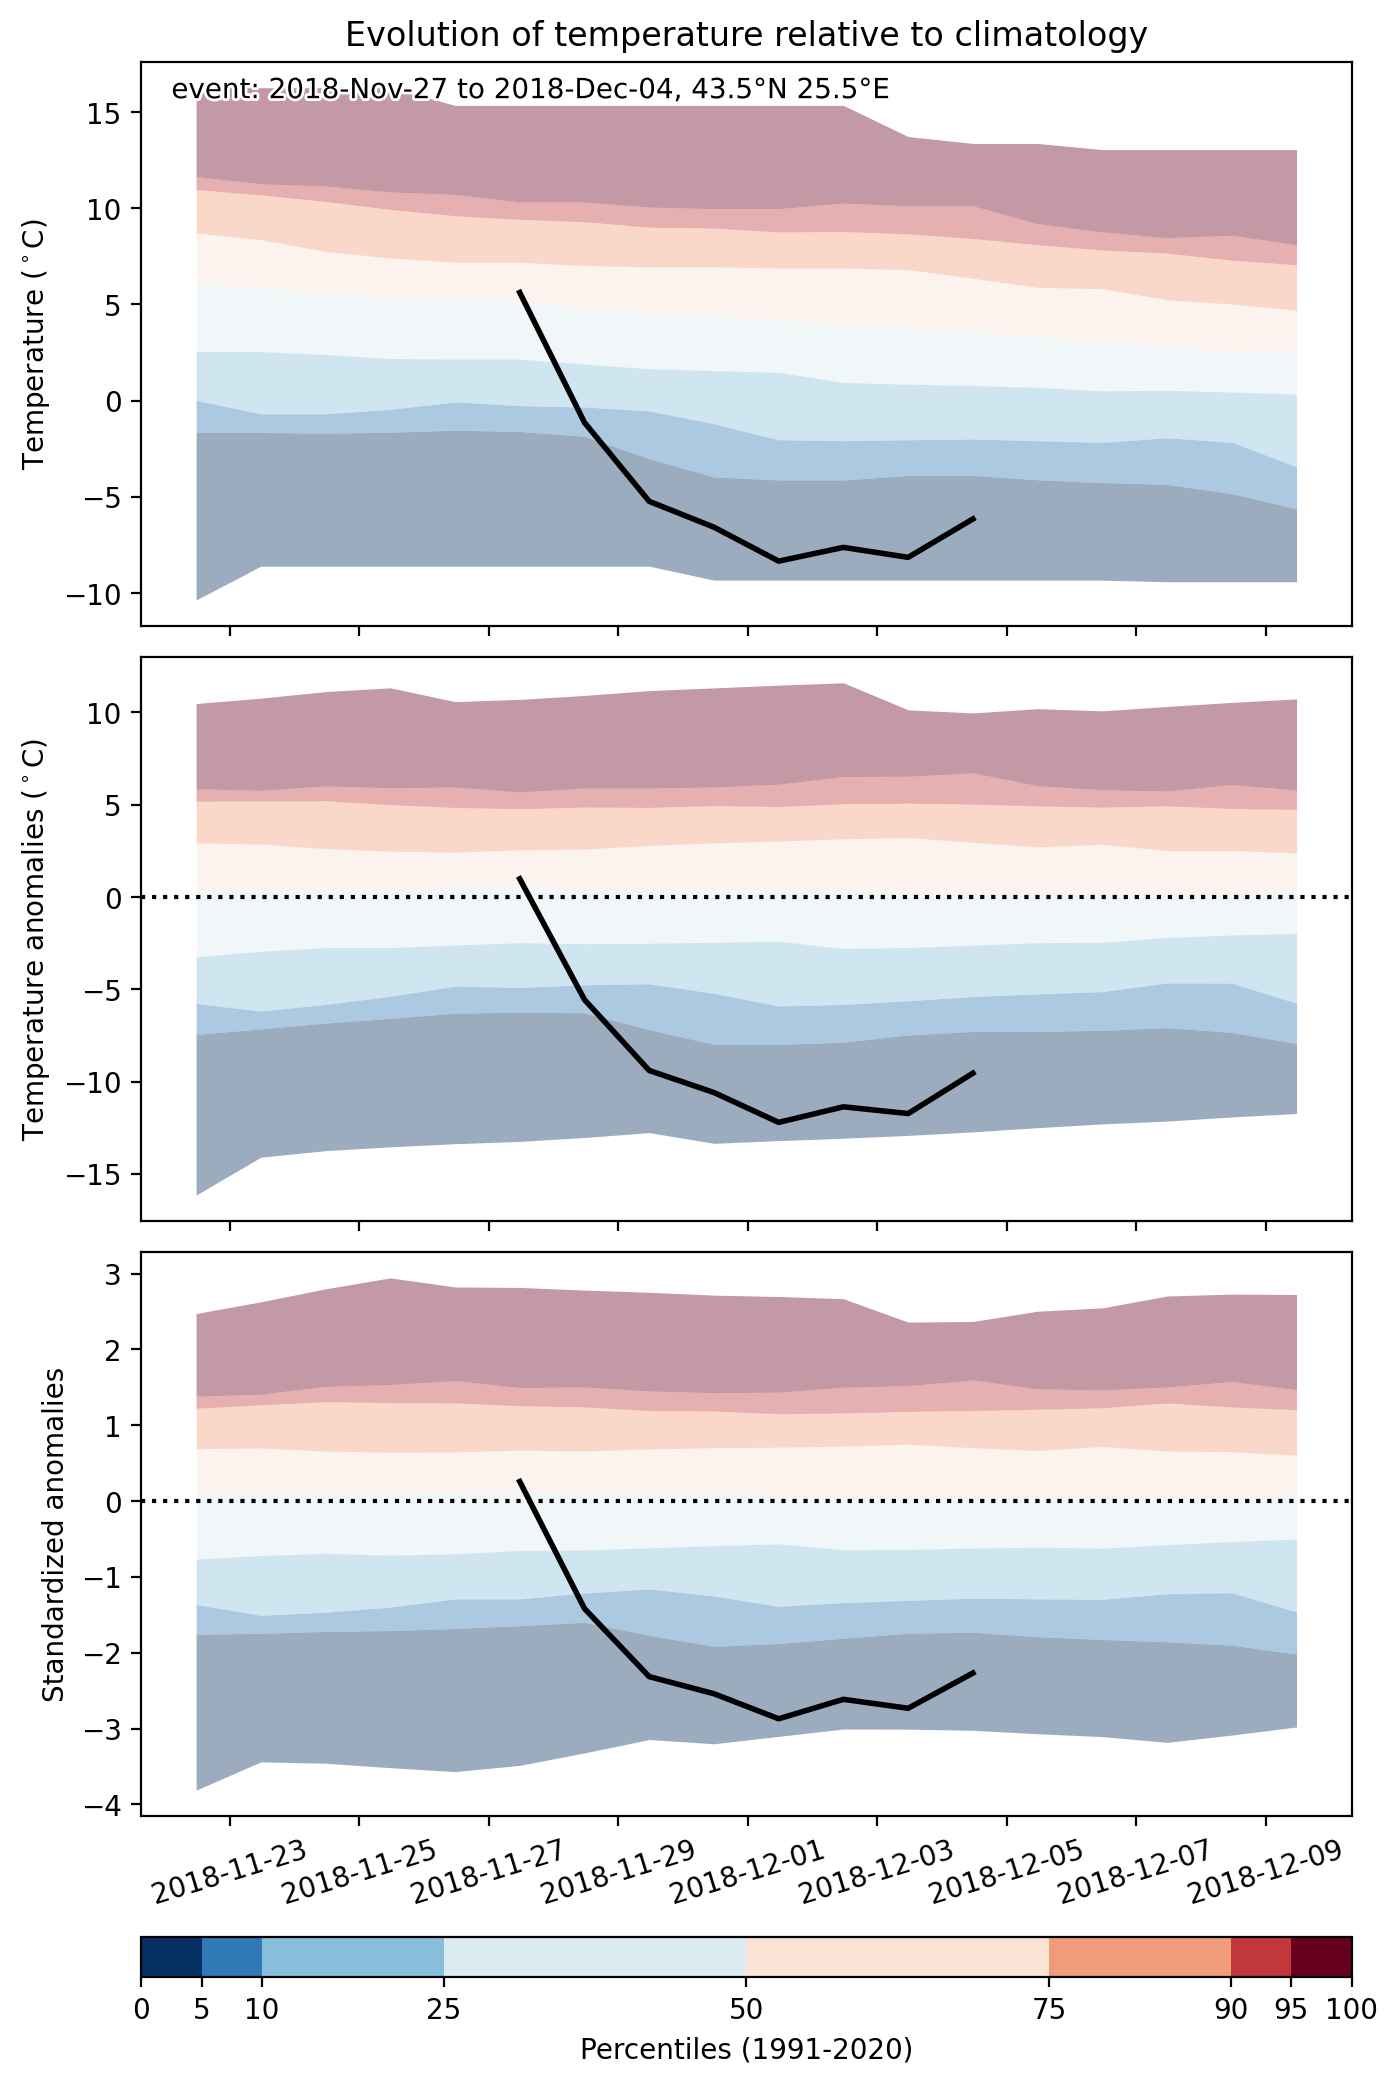
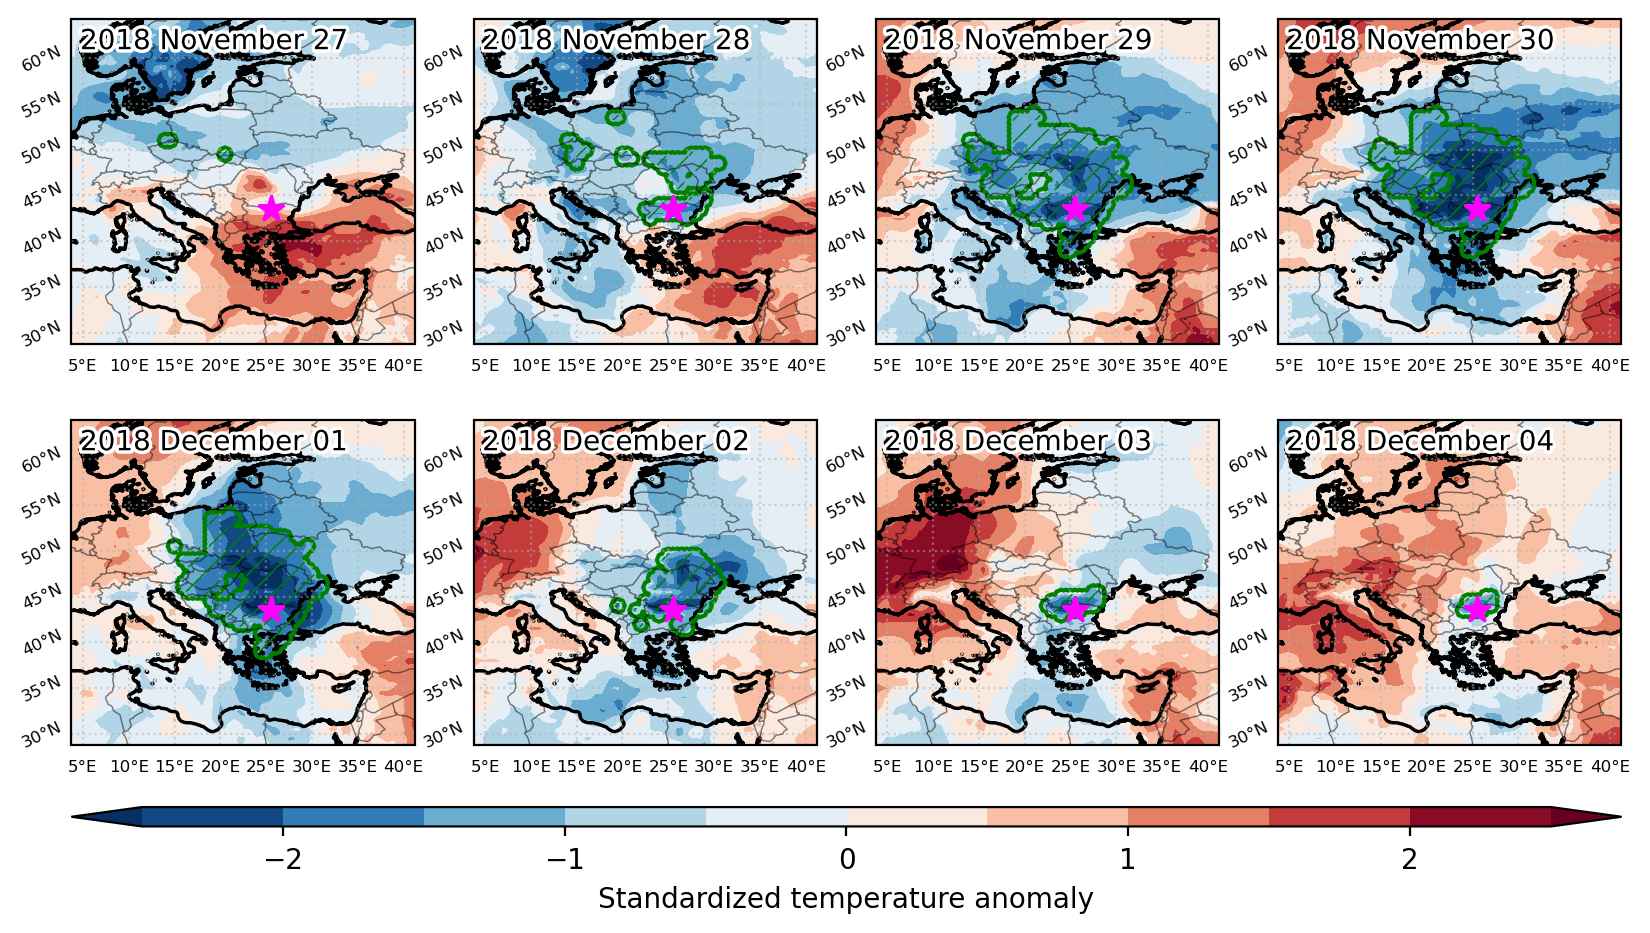
Cold spell occuring from November 27 2018 to December 04 2018 at 43.5°N 25.5°E

Download data: JSON

Event type: Cold spell

Countries affected (identified with ArcGIS Online; provided only for geographical reference):

  • Austria
  • Belarus
  • Bosnia and Herzegovina
  • Bulgaria
  • Croatia
  • Czech Republic
  • Germany
  • Greece
  • Hungary
  • Moldova
  • North Macedonia
  • Poland
  • Romania
  • Serbia
  • Slovakia
  • Slovenia
  • Turkiye
  • Ukraine

Duration: 8 days

Time span: November 27 2018 to December 04 2018

Statistics over entire affected area:

  • Mean temperature anomaly: -7.5 °C
  • Mean temperature: -5.3 °C
  • Minimum temperature anomaly: -15.6 °C
  • Minimum temperature: -17.3 °C

Event center: 43.5°N 25.5°E

Area affected: 961978 km$^2$


Fig. 1: Map of most extreme temperature anomalies (standardized) experienced during the event. The purple star indicates the center of the extreme event. Green hatching illustrates all areas under the effect of extremes at some time during the event.


Fig. 2: Evolution of temperature at the center of the event. The climatological percentile distribution is illustrated with color shadings.


Fig. 3: Maps illustrating the evolution of standardized temperature anomalies during the event.

Event ID: Cold_spell_2018-Nov-27_to_2018-Dec-04_25.5_43.5

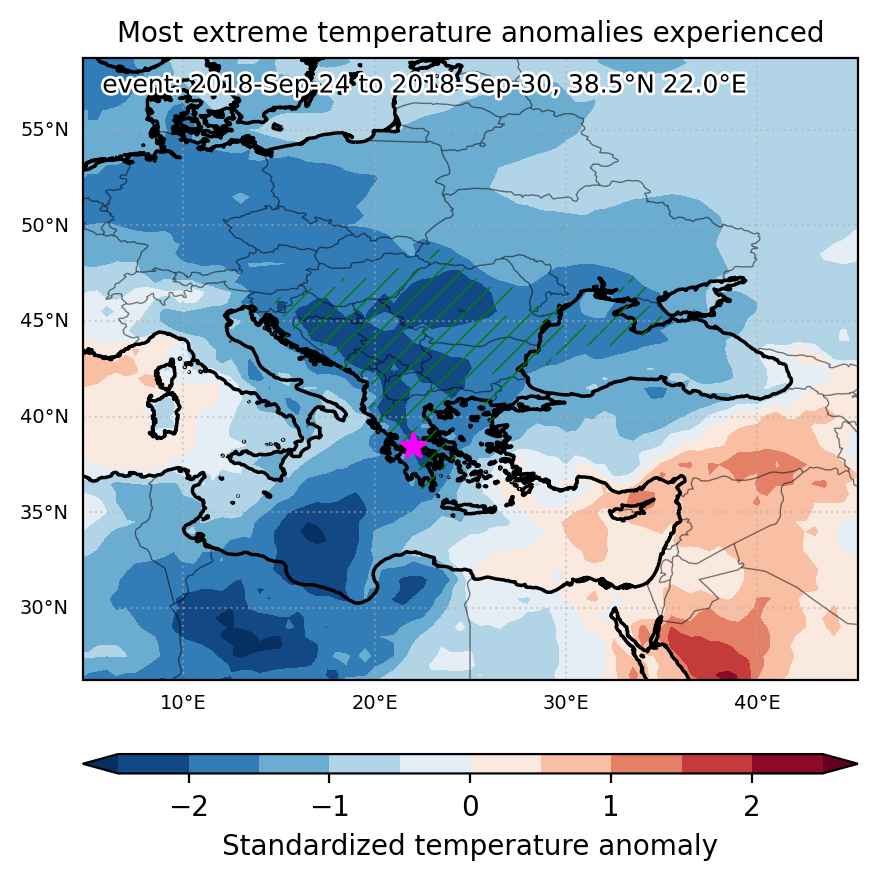
Cold spell occuring from September 24 2018 to September 30 2018 at 38.5°N 22.0°E

Download data: JSON

Event type: Cold spell

Countries affected (identified with ArcGIS Online; provided only for geographical reference):

  • Albania
  • Bosnia and Herzegovina
  • Bulgaria
  • Croatia
  • Greece
  • Hungary
  • Moldova
  • Montenegro
  • North Macedonia
  • Romania
  • Serbia
  • Slovenia
  • Turkiye
  • Ukraine

Duration: 7 days

Time span: September 24 2018 to September 30 2018

Statistics over entire affected area:

  • Mean temperature anomaly: -5.5 °C
  • Mean temperature: 10.2 °C
  • Minimum temperature anomaly: -8.9 °C
  • Minimum temperature: 1.2 °C

Event center: 38.5°N 22.0°E

Area affected: 794695 km$^2$


Fig. 1: Map of most extreme temperature anomalies (standardized) experienced during the event. The purple star indicates the center of the extreme event. Green hatching illustrates all areas under the effect of extremes at some time during the event.


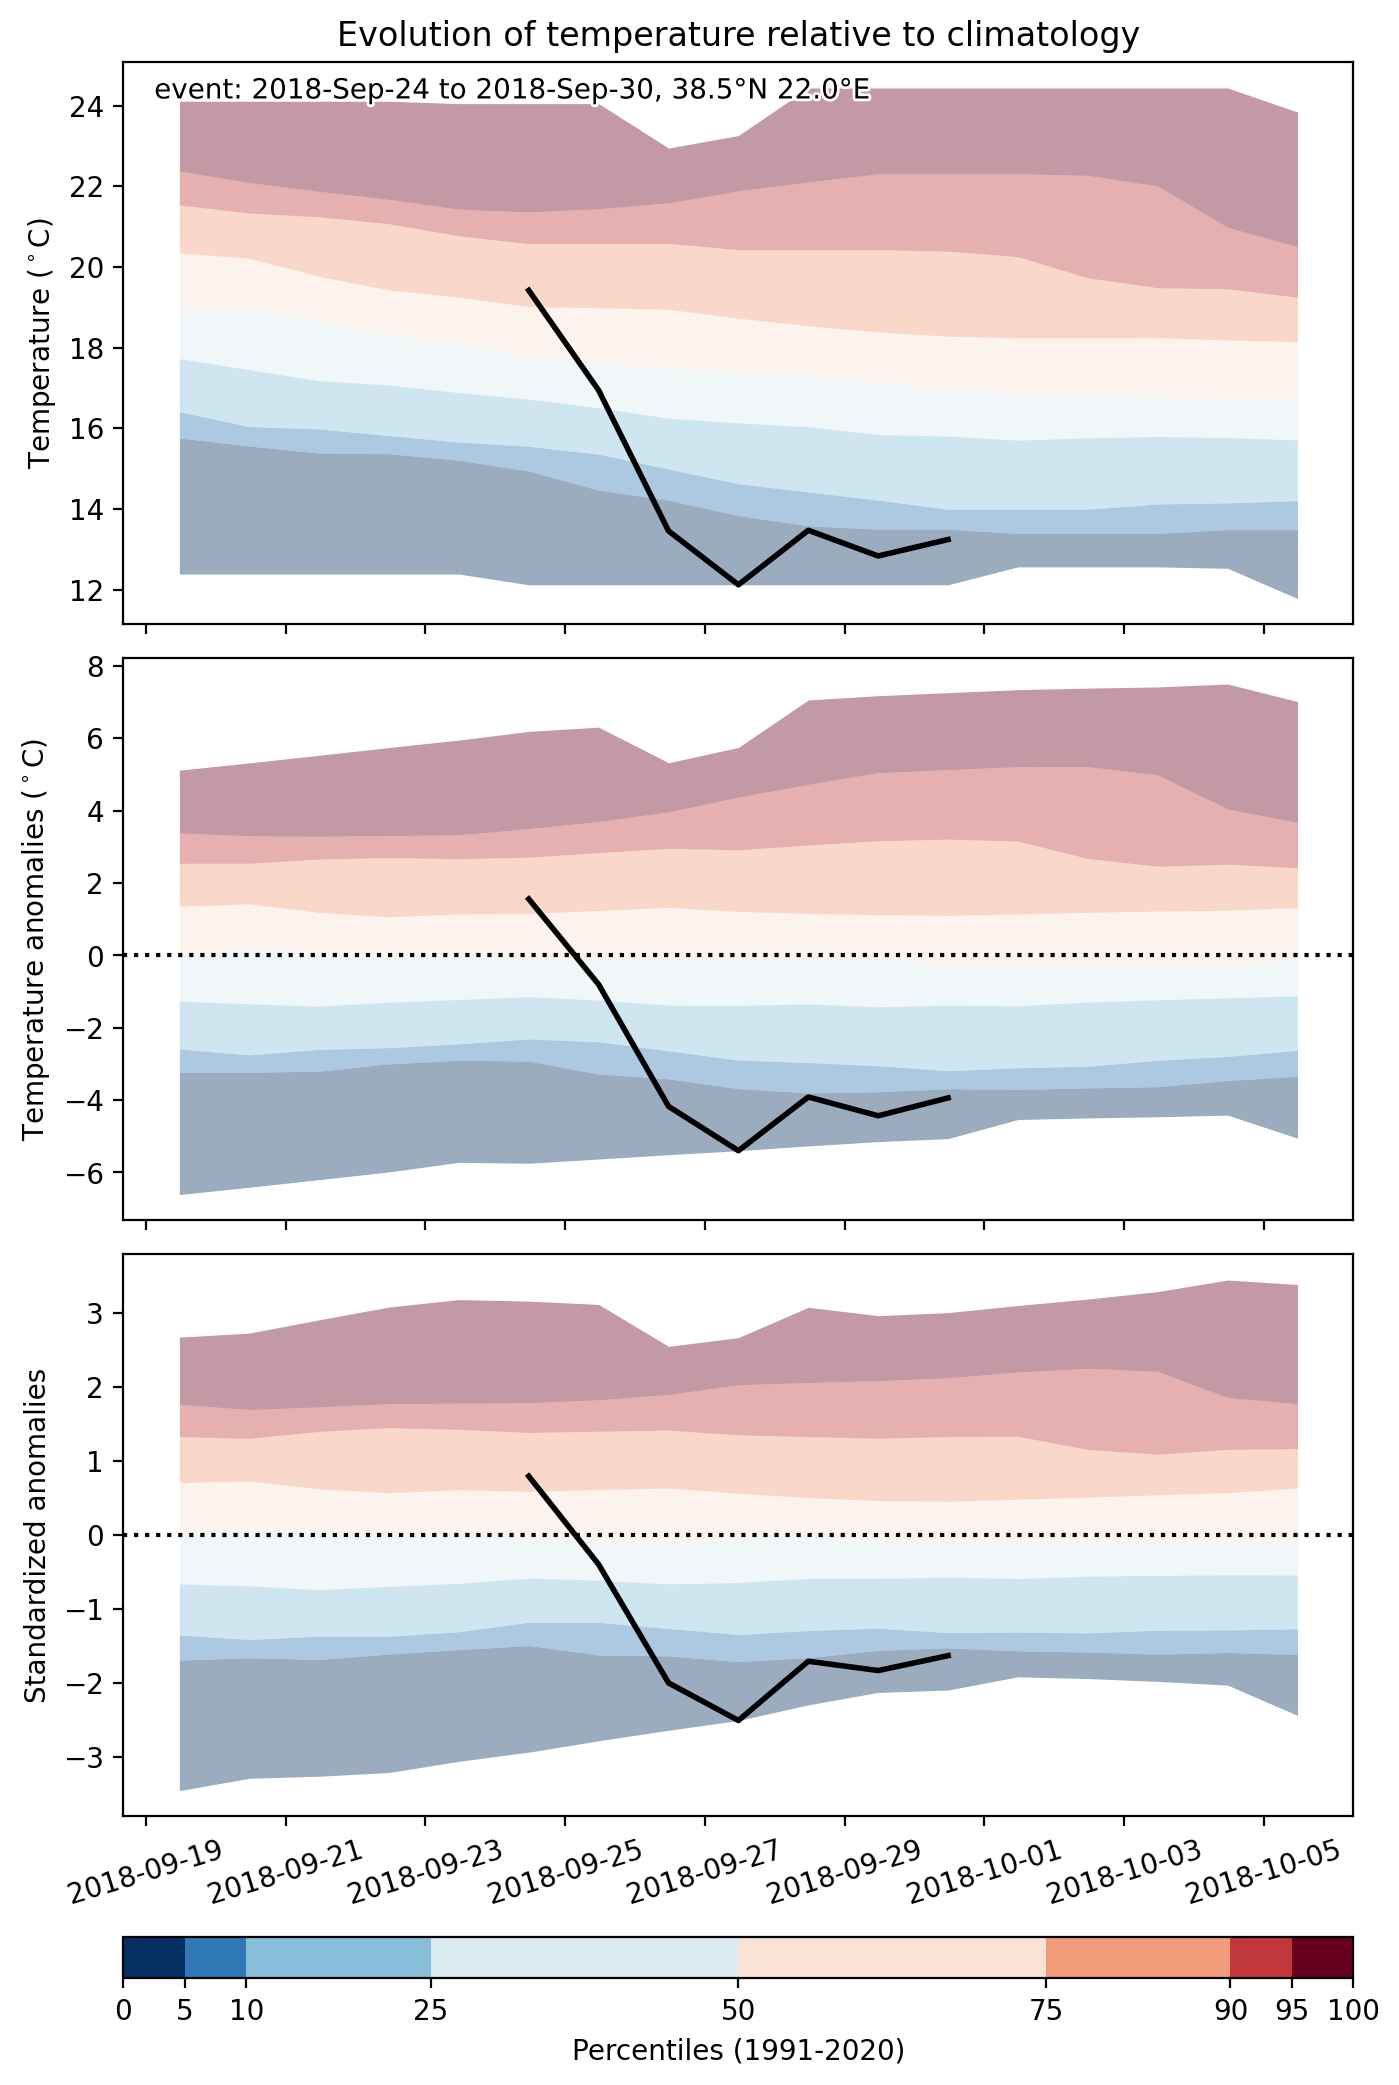
Fig. 2: Evolution of temperature at the center of the event. The climatological percentile distribution is illustrated with color shadings.


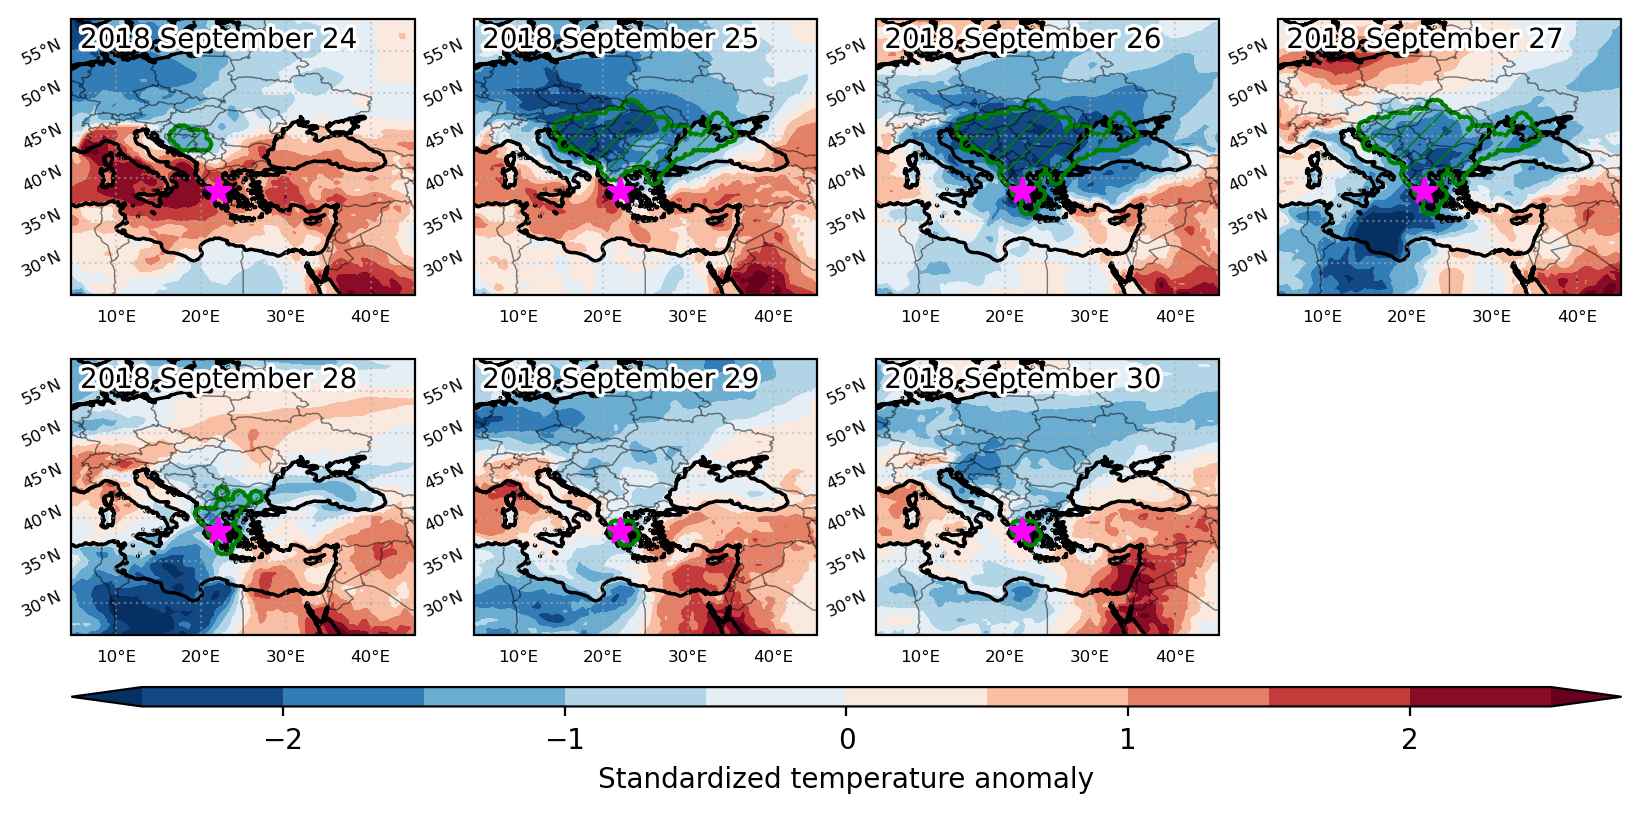
Fig. 3: Maps illustrating the evolution of standardized temperature anomalies during the event.

Event ID: Cold_spell_2018-Sep-24_to_2018-Sep-30_22.0_38.5

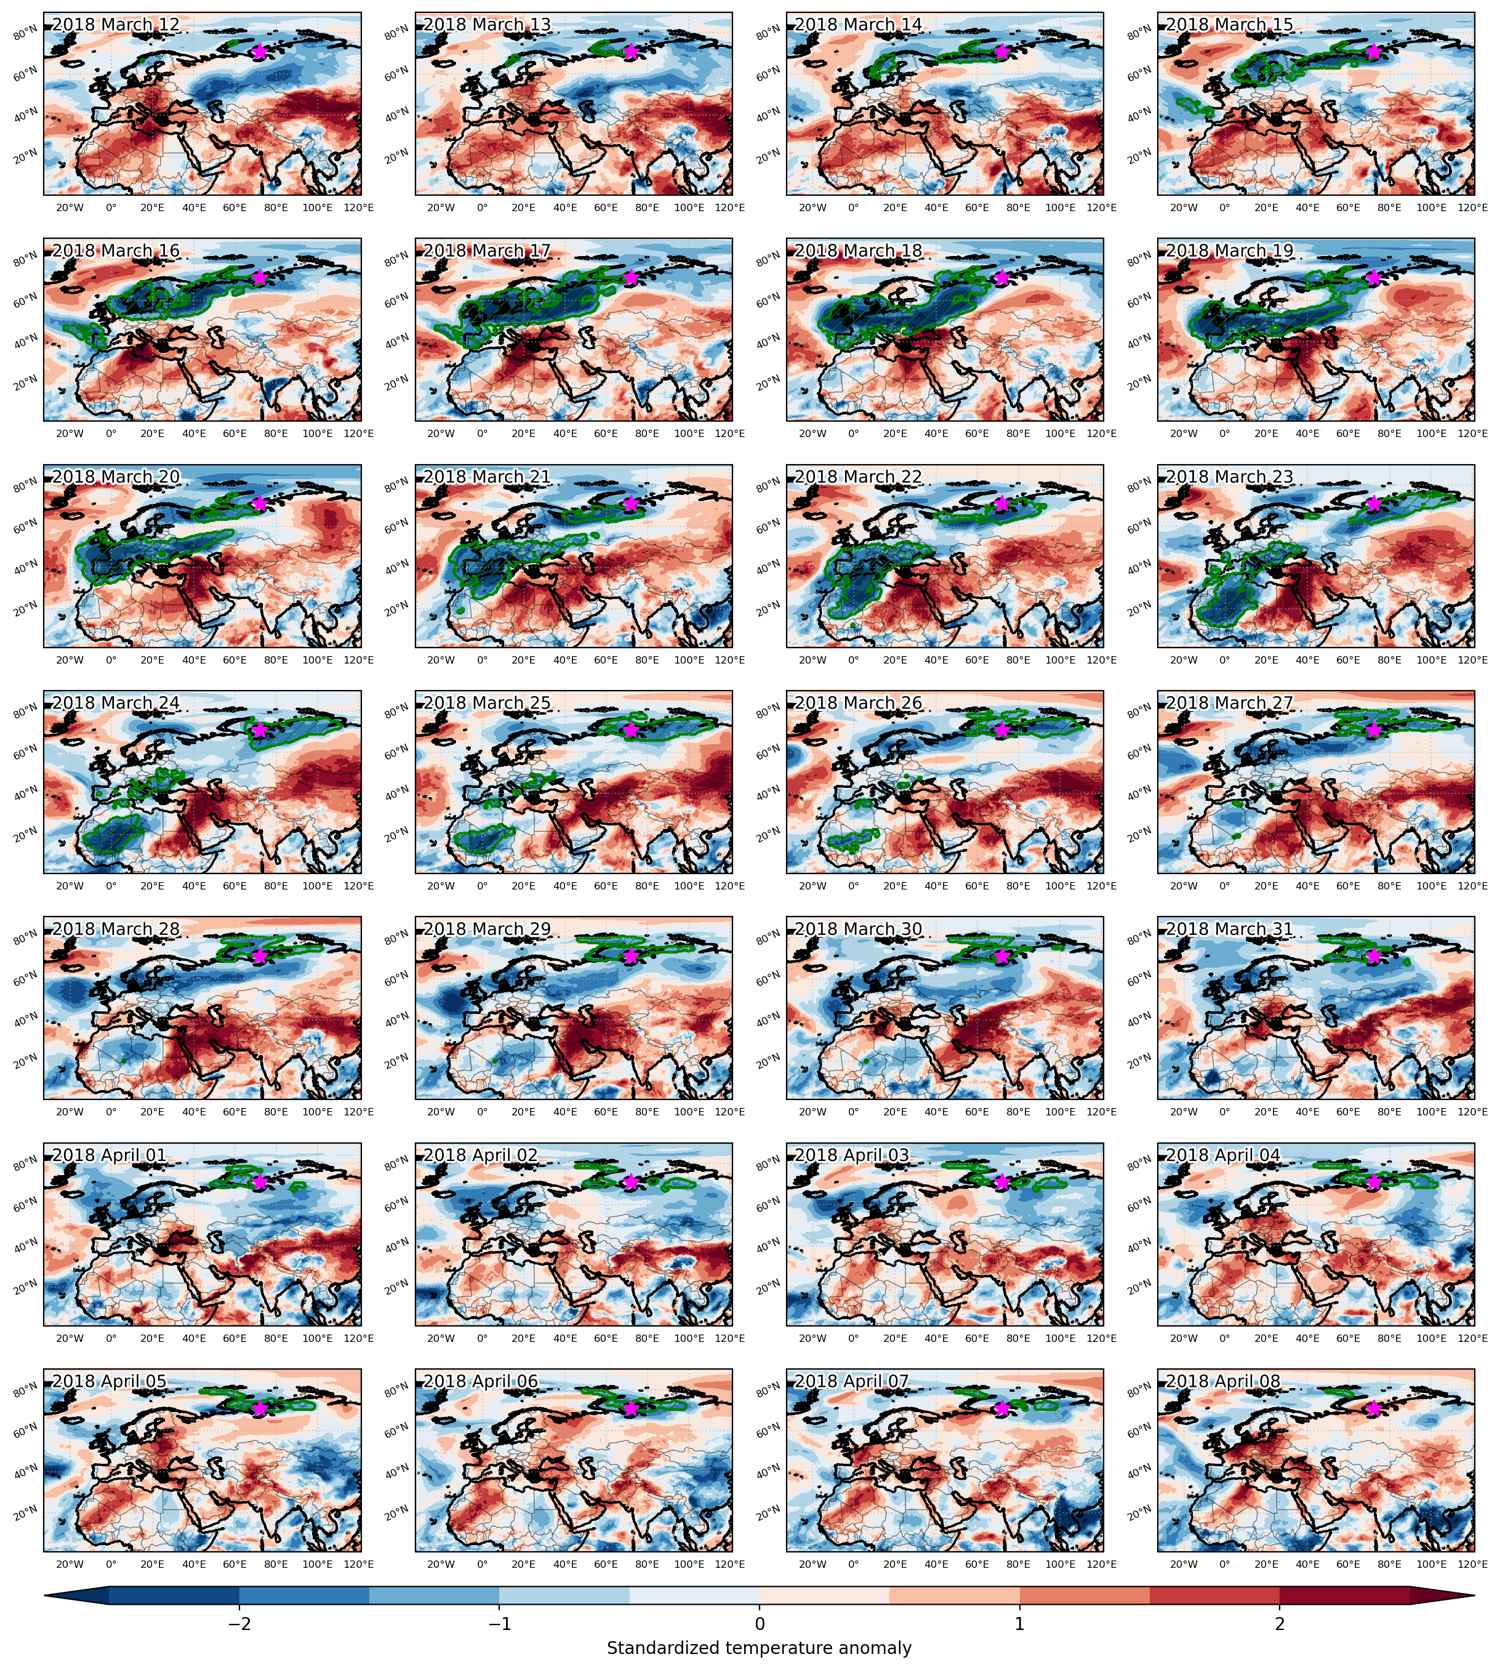
Cold spell occuring from March 12 2018 to April 08 2018 at 71.0°N 72.0°E

Download data: JSON

Event type: Cold spell

Countries affected (identified with ArcGIS Online; provided only for geographical reference):

  • Albania
  • Algeria
  • Andorra
  • Austria
  • Belarus
  • Belgium
  • Bosnia and Herzegovina
  • Bulgaria
  • Burkina Faso
  • Croatia
  • Czech Republic
  • Denmark
  • Estonia
  • Finland
  • France
  • Germany
  • Hungary
  • Ireland
  • Italy
  • Latvia
  • Libya
  • Lithuania
  • Luxembourg
  • Mali
  • Mauritania
  • Moldova
  • Montenegro
  • Morocco
  • Netherlands
  • Niger
  • Nigeria
  • North Macedonia
  • Norway
  • Poland
  • Portugal
  • Romania
  • Russian Federation
  • Serbia
  • Slovakia
  • Slovenia
  • Spain
  • Sweden
  • Switzerland
  • Tunisia
  • Ukraine
  • United Kingdom

Duration: 28 days

Time span: March 12 2018 to April 08 2018

Statistics over entire affected area:

  • Mean temperature anomaly: -8.7 °C
  • Mean temperature: -9.4 °C
  • Minimum temperature anomaly: -23.0 °C
  • Minimum temperature: -41.9 °C

Event center: 71.0°N 72.0°E

Area affected: 17288191 km$^2$


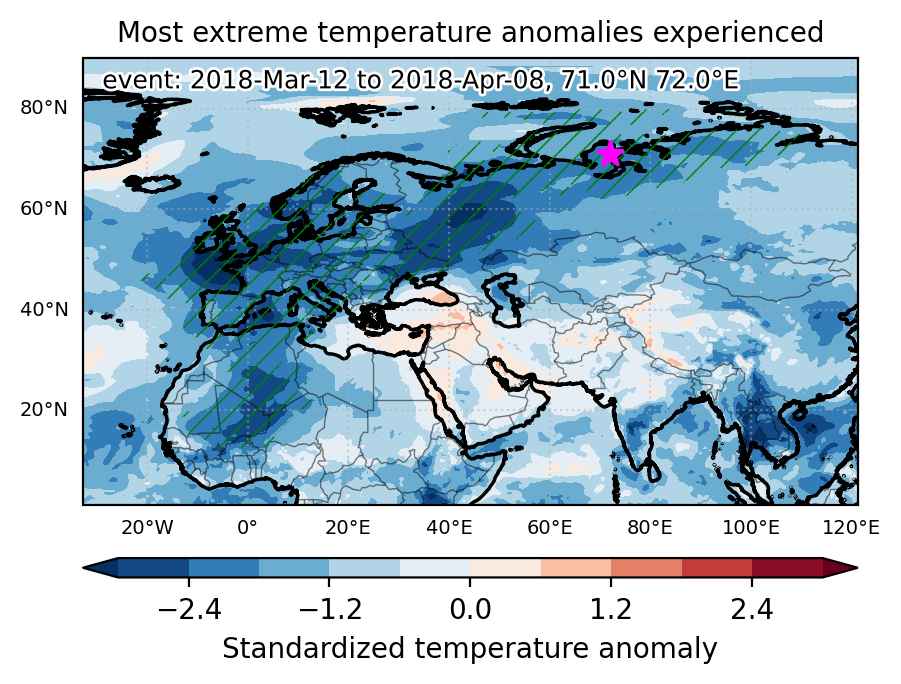
Fig. 1: Map of most extreme temperature anomalies (standardized) experienced during the event. The purple star indicates the center of the extreme event. Green hatching illustrates all areas under the effect of extremes at some time during the event.


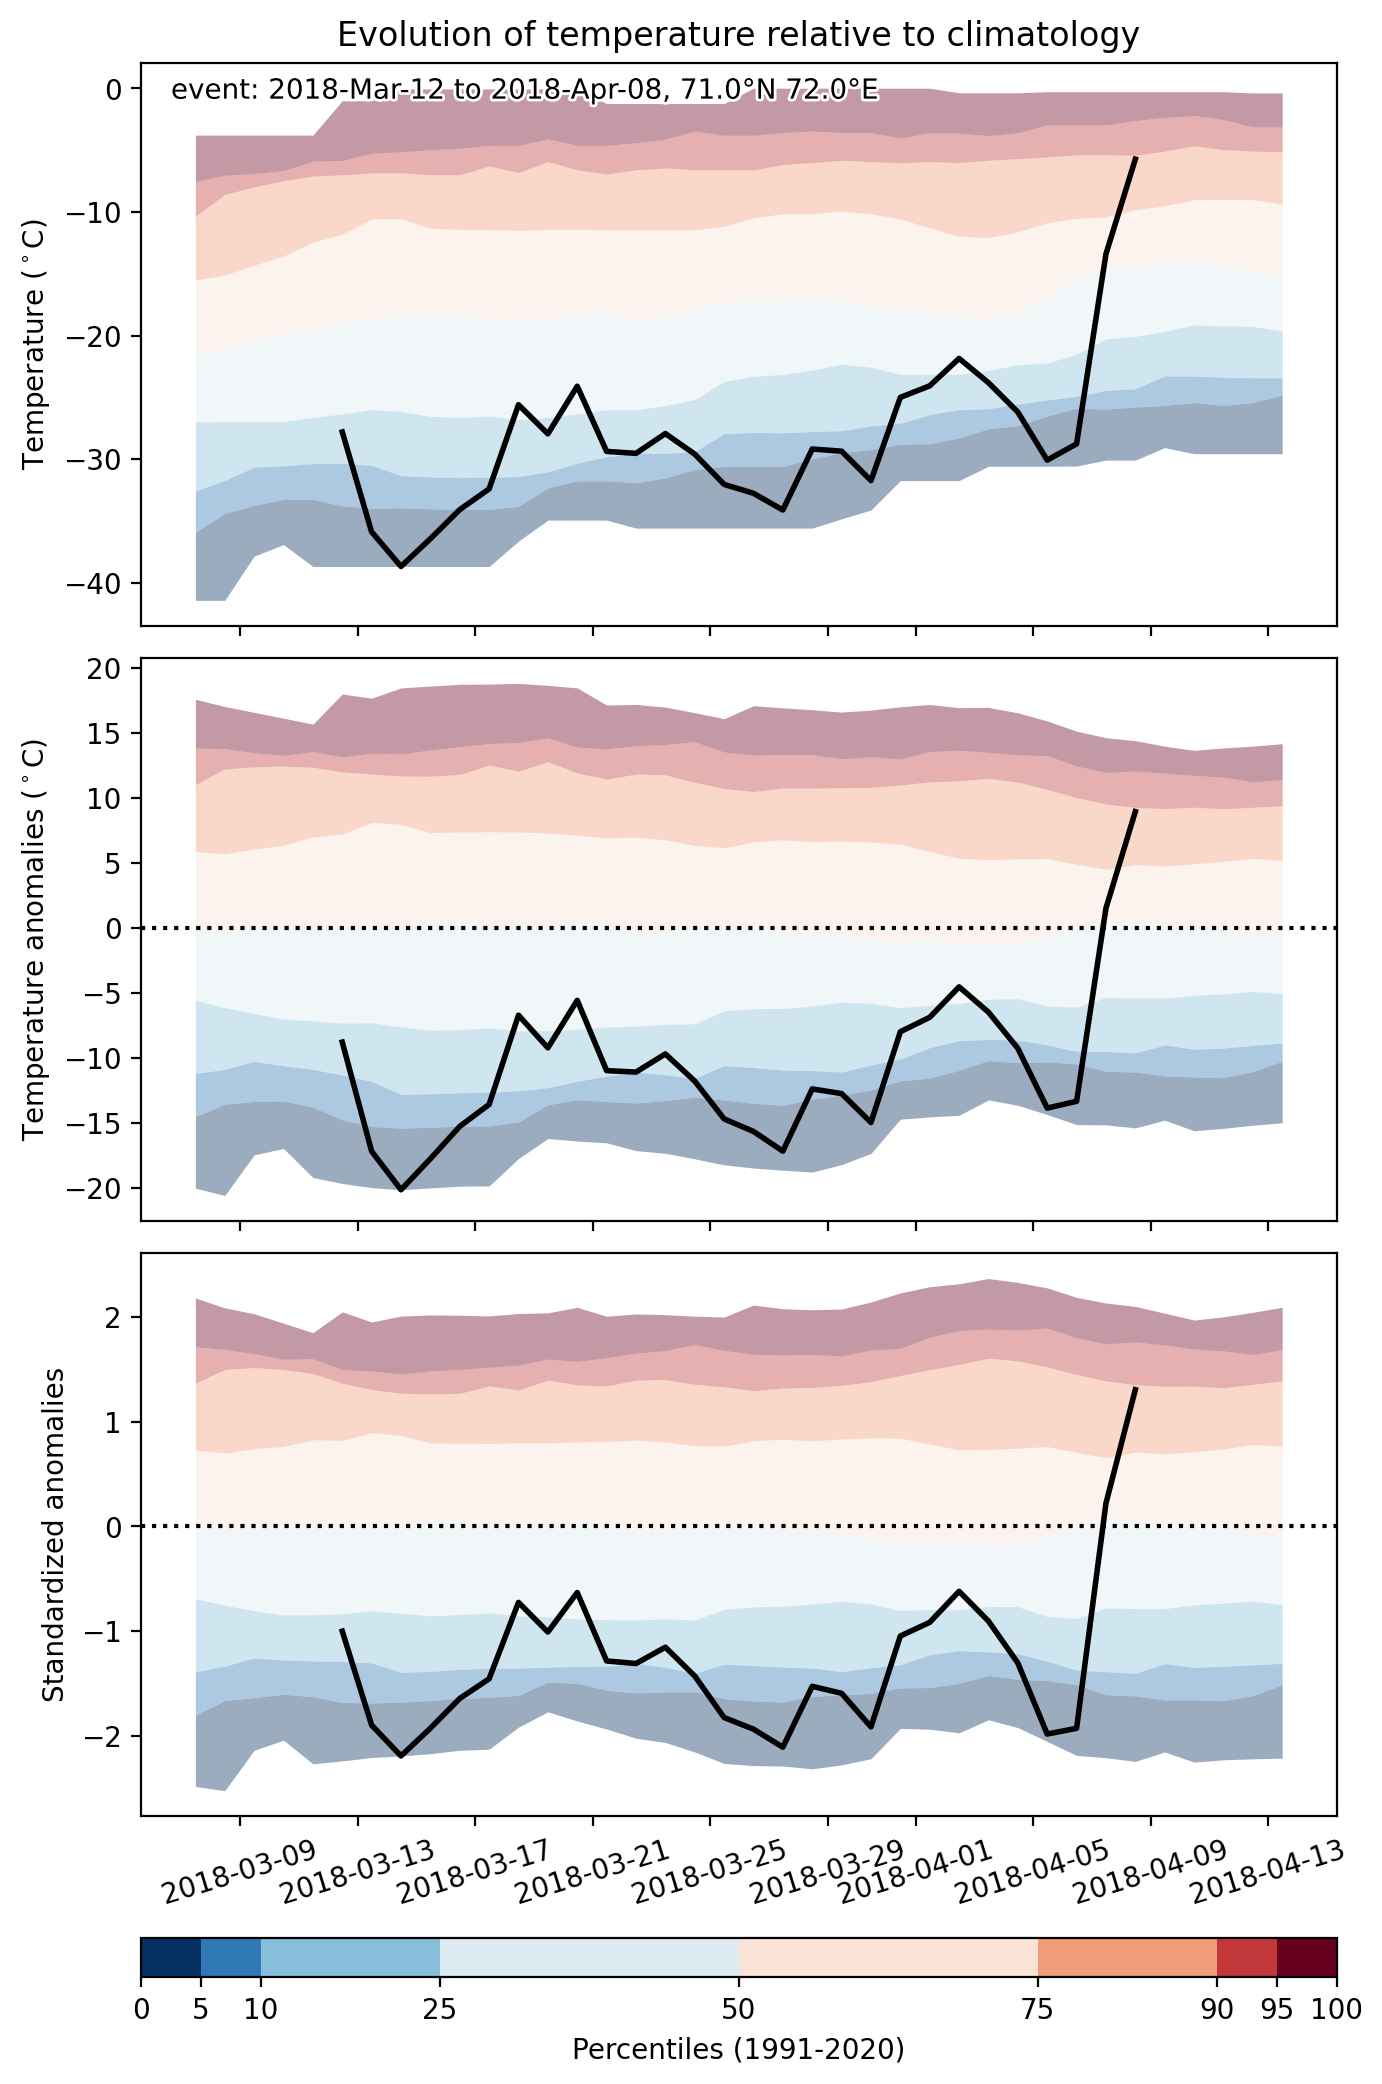
Fig. 2: Evolution of temperature at the center of the event. The climatological percentile distribution is illustrated with color shadings.


Fig. 3: Maps illustrating the evolution of standardized temperature anomalies during the event.

Event ID: Cold_spell_2018-Mar-12_to_2018-Apr-08_72.0_71.0

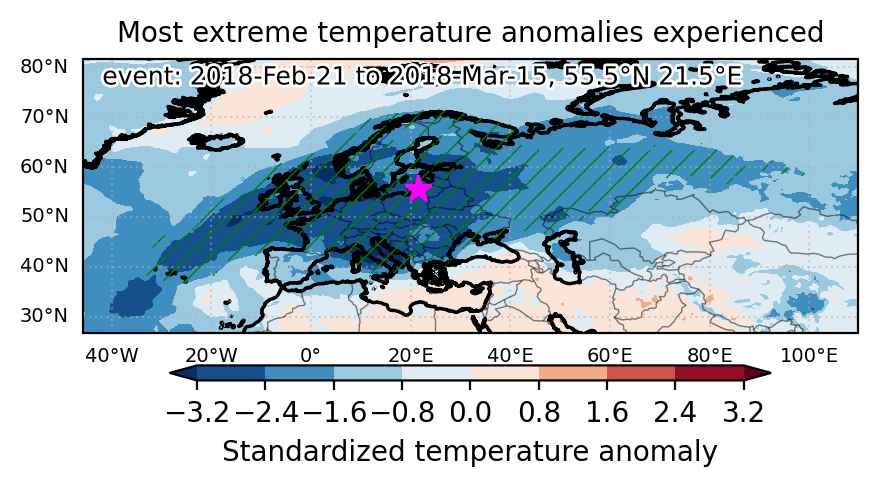
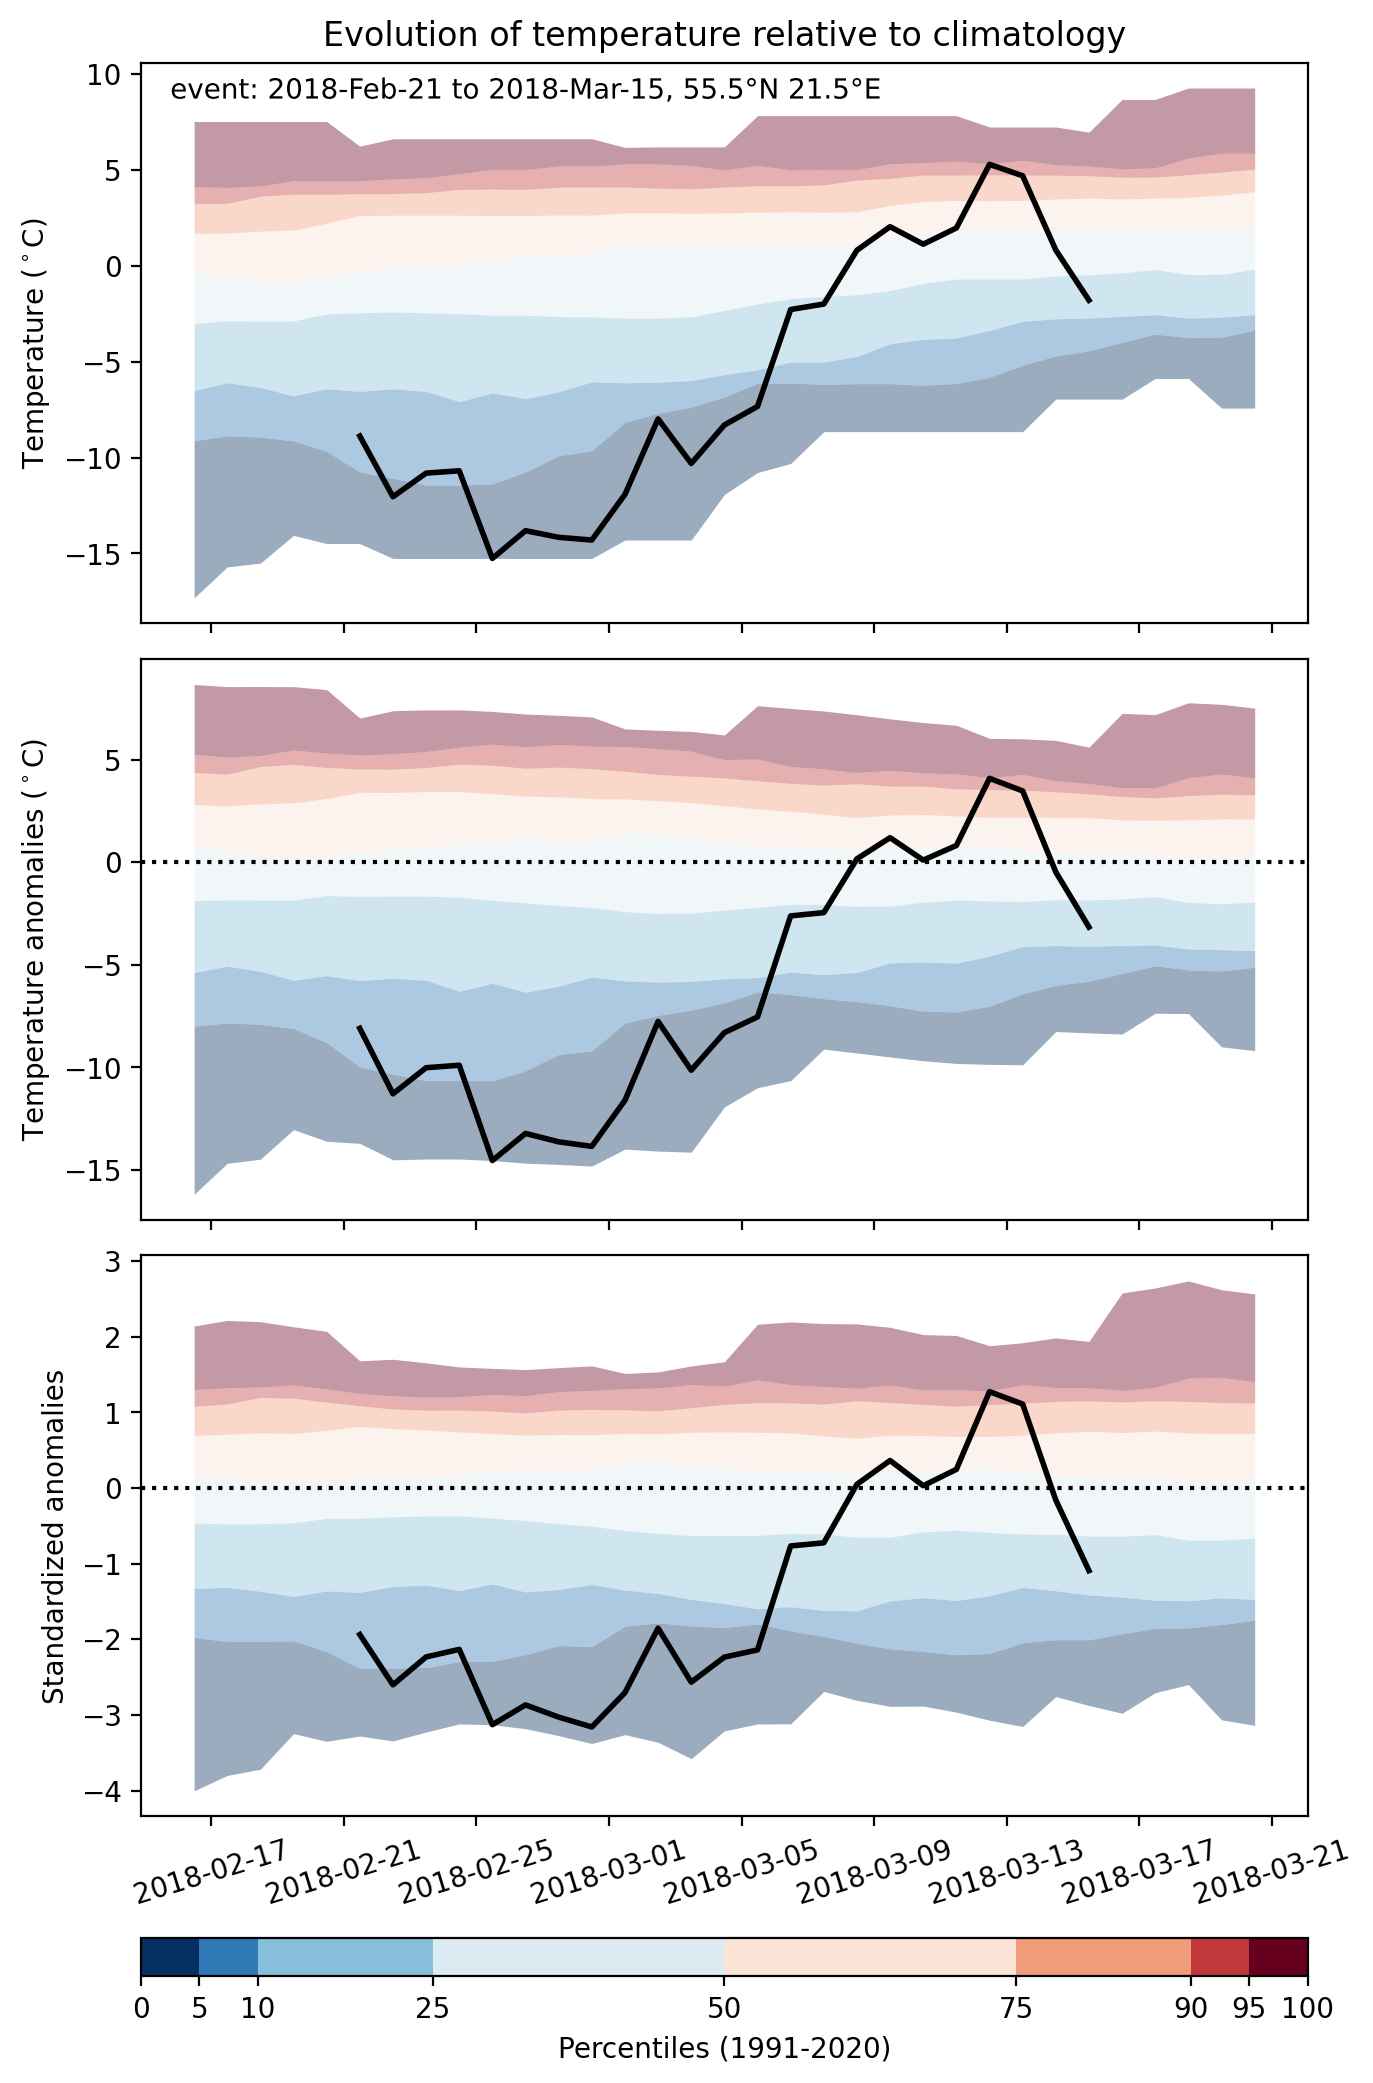
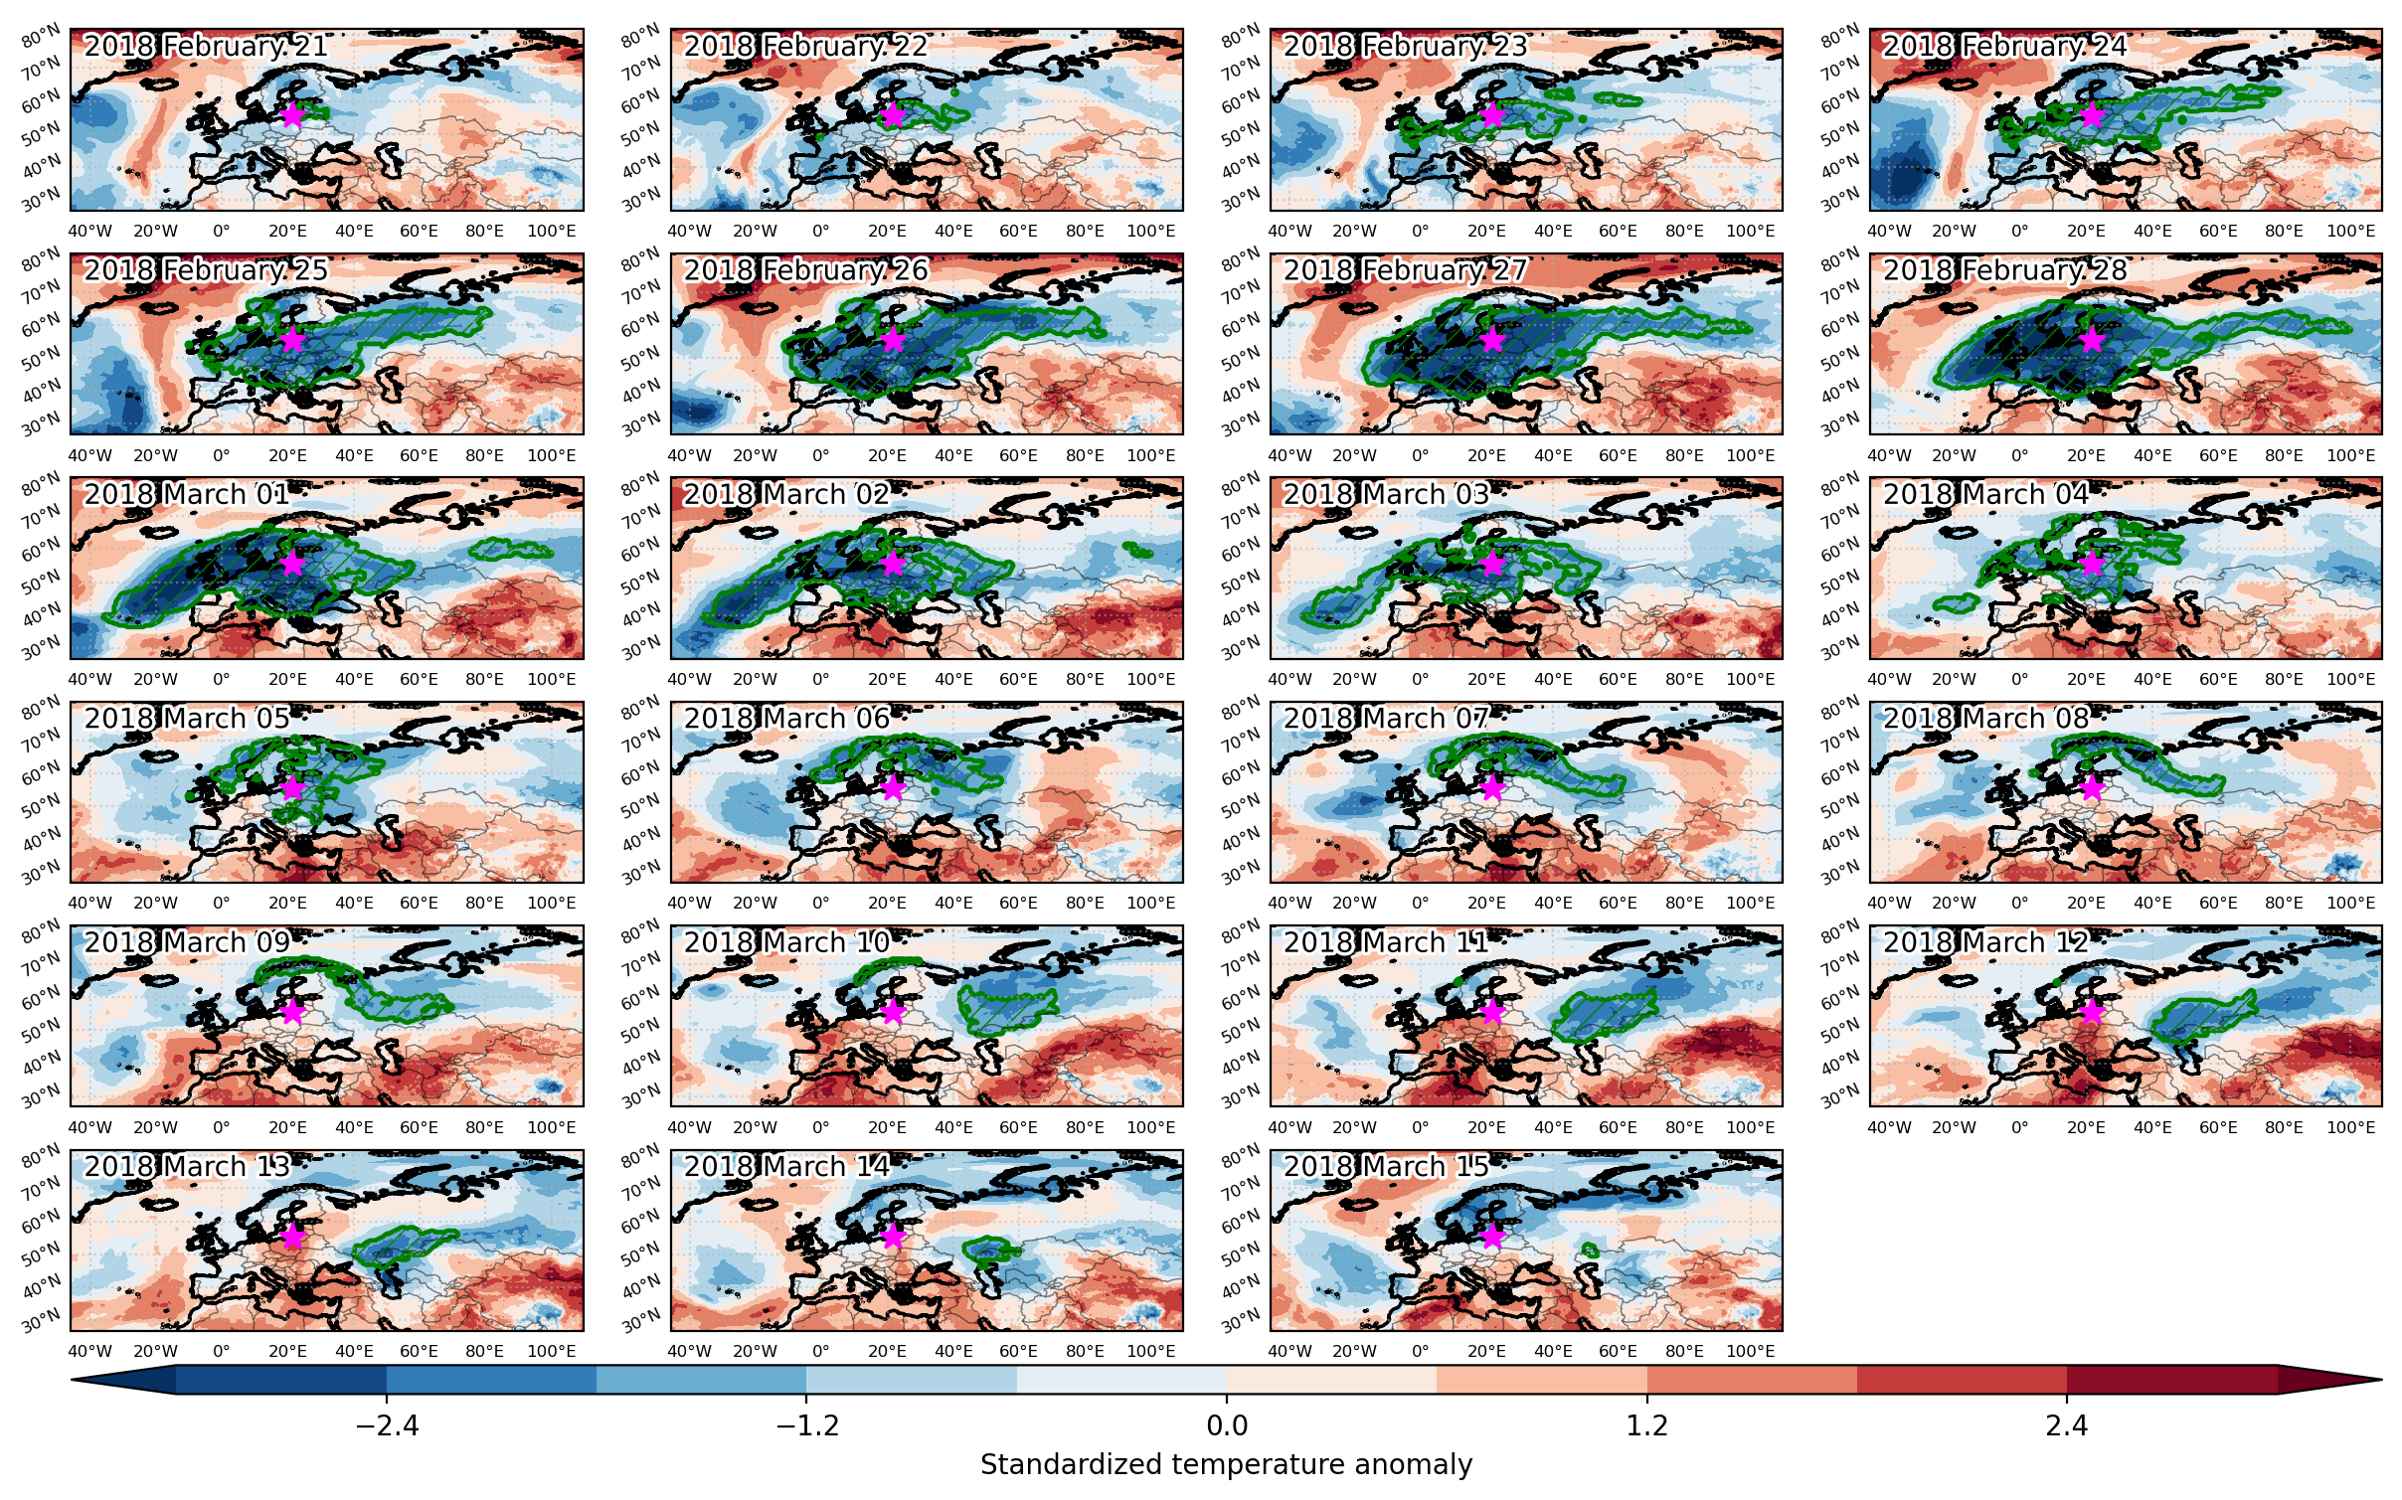
Cold spell occuring from February 21 2018 to March 15 2018 at 55.5°N 21.5°E

Download data: JSON

Event type: Cold spell

Countries affected (identified with ArcGIS Online; provided only for geographical reference):

  • Albania
  • Austria
  • Azores
  • Belarus
  • Belgium
  • Bosnia and Herzegovina
  • Bulgaria
  • Croatia
  • Czech Republic
  • Denmark
  • Estonia
  • Finland
  • France
  • Germany
  • Greece
  • Hungary
  • Ireland
  • Italy
  • Kazakhstan
  • Latvia
  • Lithuania
  • Luxembourg
  • Moldova
  • Montenegro
  • Netherlands
  • North Macedonia
  • Norway
  • Poland
  • Romania
  • Russian Federation
  • Serbia
  • Slovakia
  • Slovenia
  • Sweden
  • Switzerland
  • Turkiye
  • Ukraine
  • United Kingdom

Duration: 23 days

Time span: February 21 2018 to March 15 2018

Statistics over entire affected area:

  • Mean temperature anomaly: -9.0 °C
  • Mean temperature: -9.7 °C
  • Minimum temperature anomaly: -20.9 °C
  • Minimum temperature: -33.6 °C

Event center: 55.5°N 21.5°E

Area affected: 14330444 km$^2$


Fig. 1: Map of most extreme temperature anomalies (standardized) experienced during the event. The purple star indicates the center of the extreme event. Green hatching illustrates all areas under the effect of extremes at some time during the event.


Fig. 2: Evolution of temperature at the center of the event. The climatological percentile distribution is illustrated with color shadings.


Fig. 3: Maps illustrating the evolution of standardized temperature anomalies during the event.

Event ID: Cold_spell_2018-Feb-21_to_2018-Mar-15_21.5_55.5

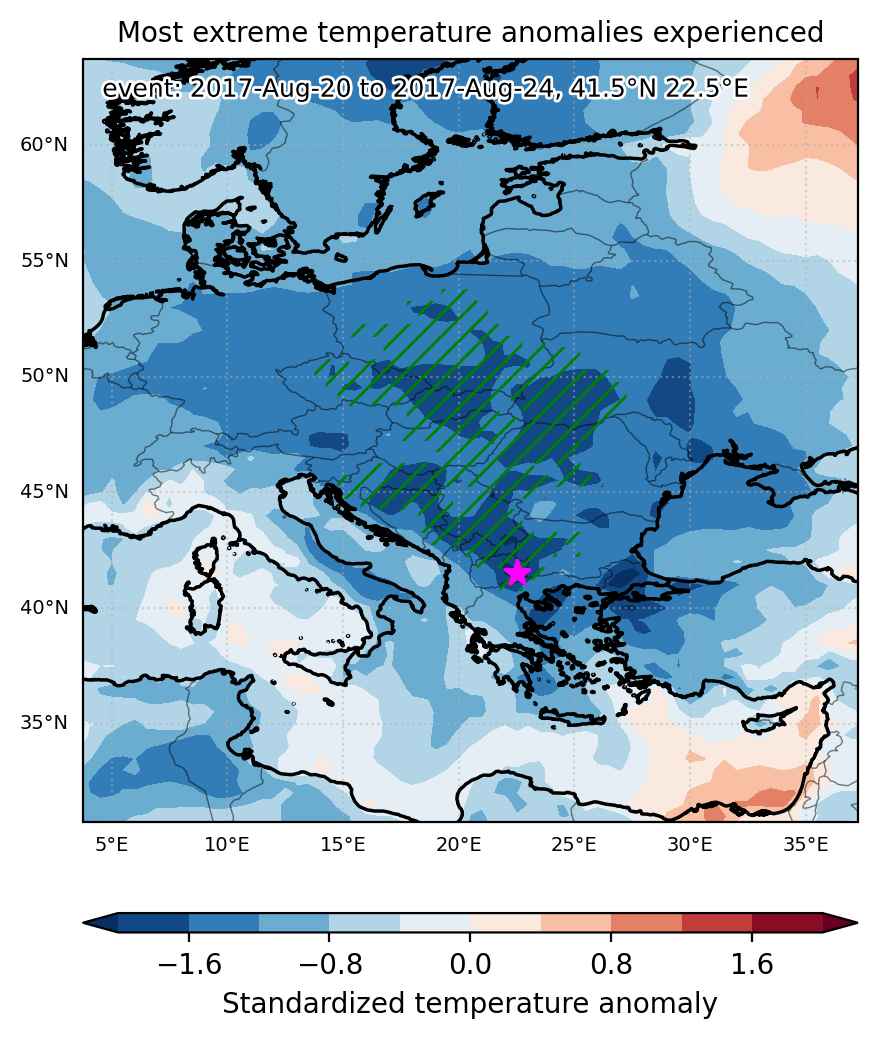
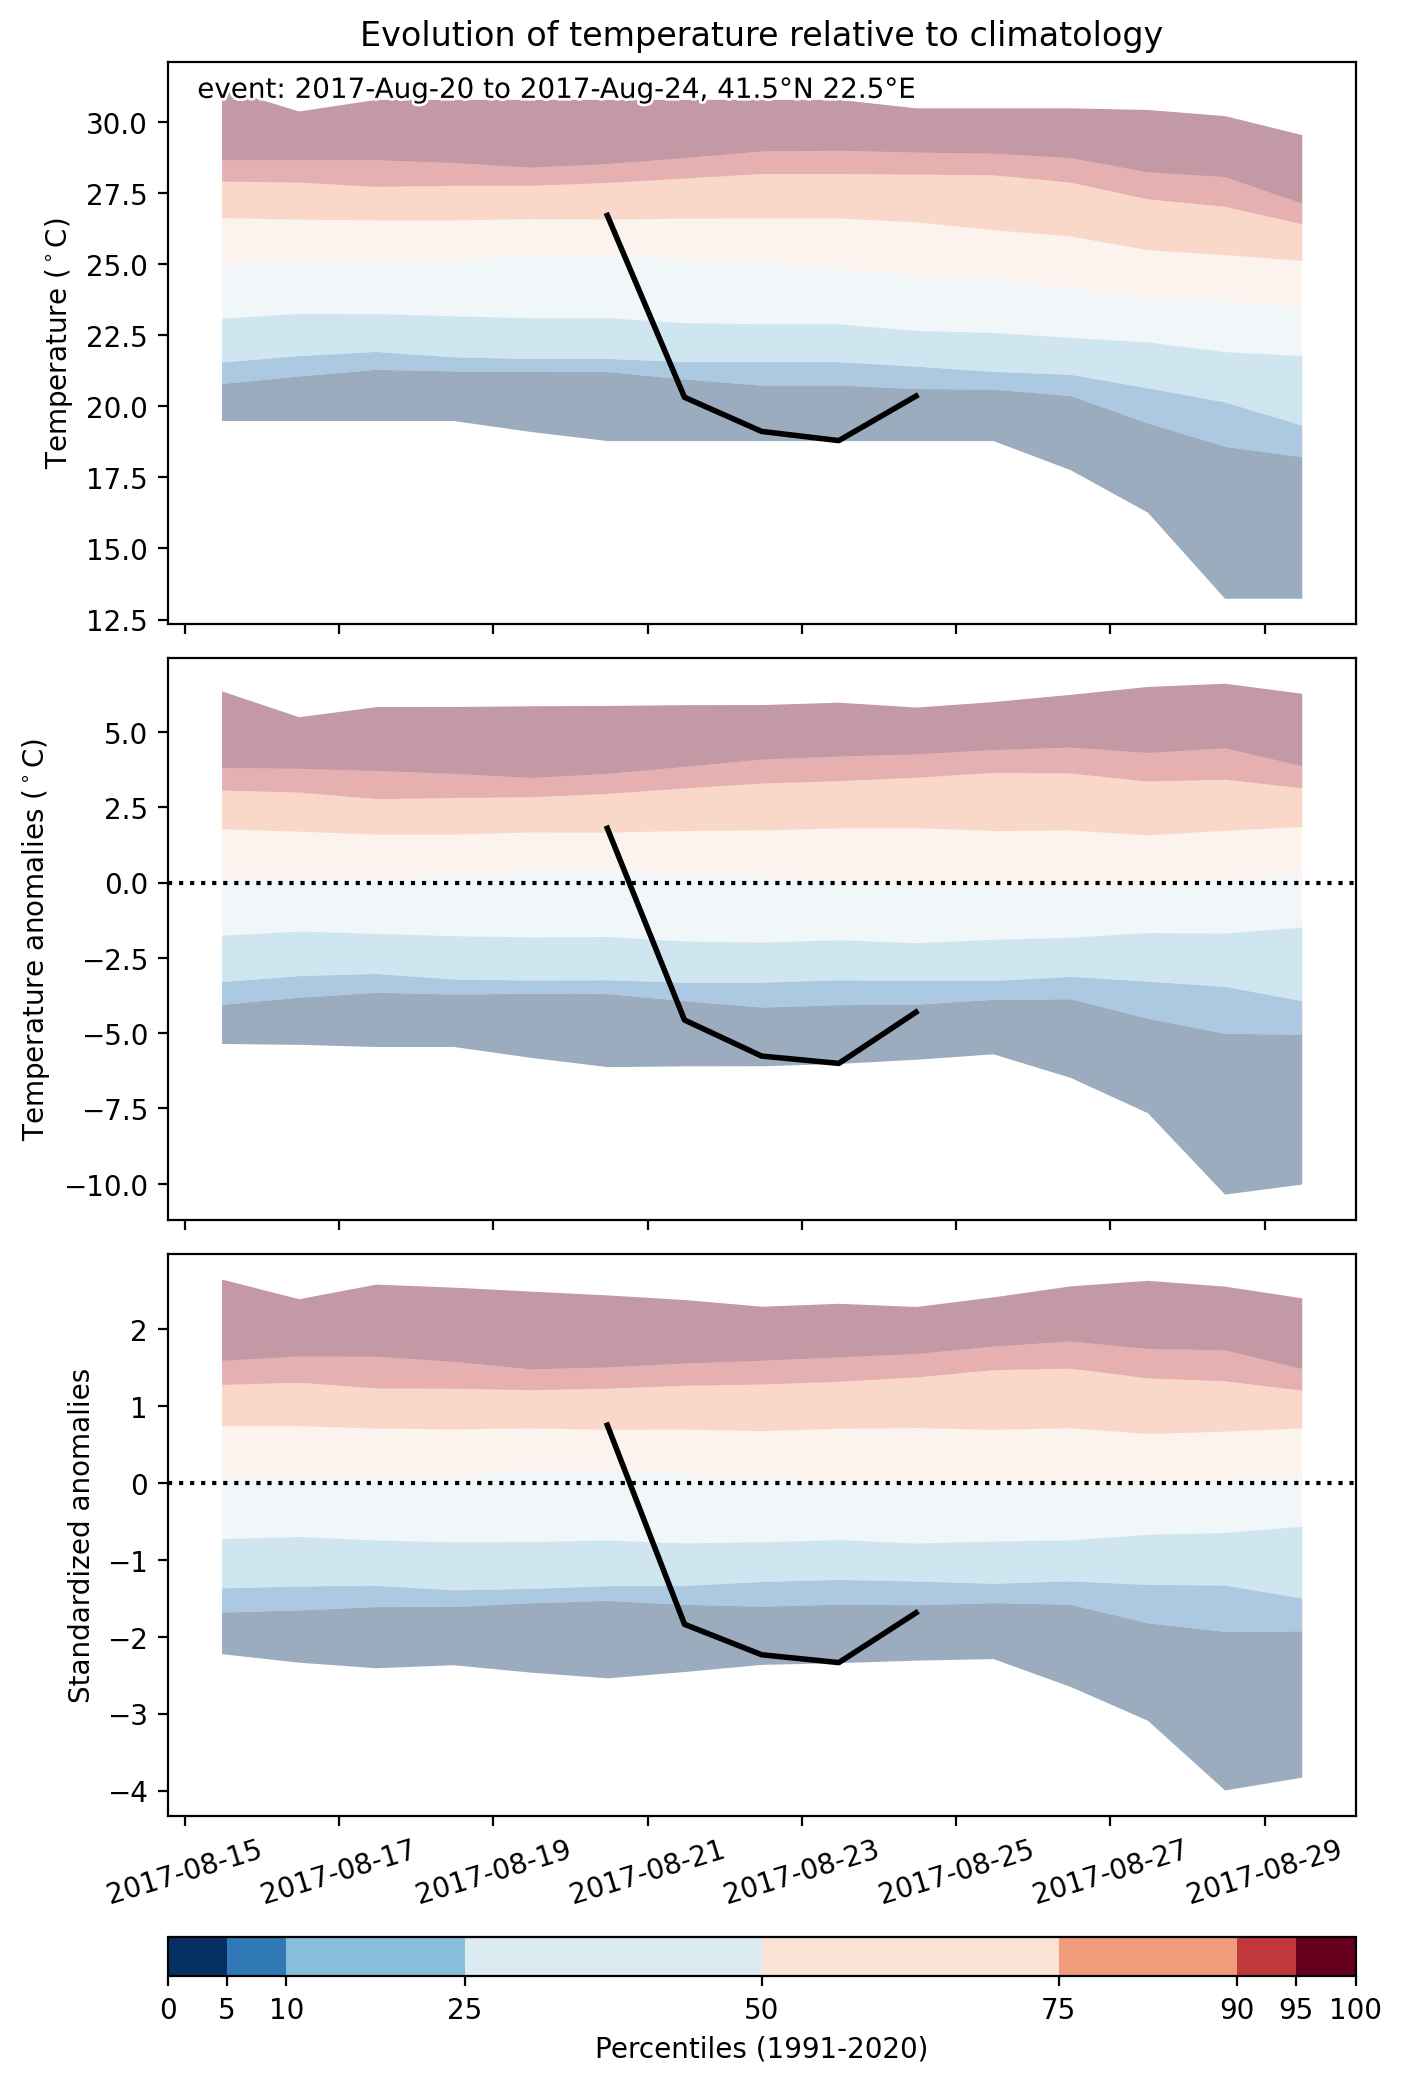
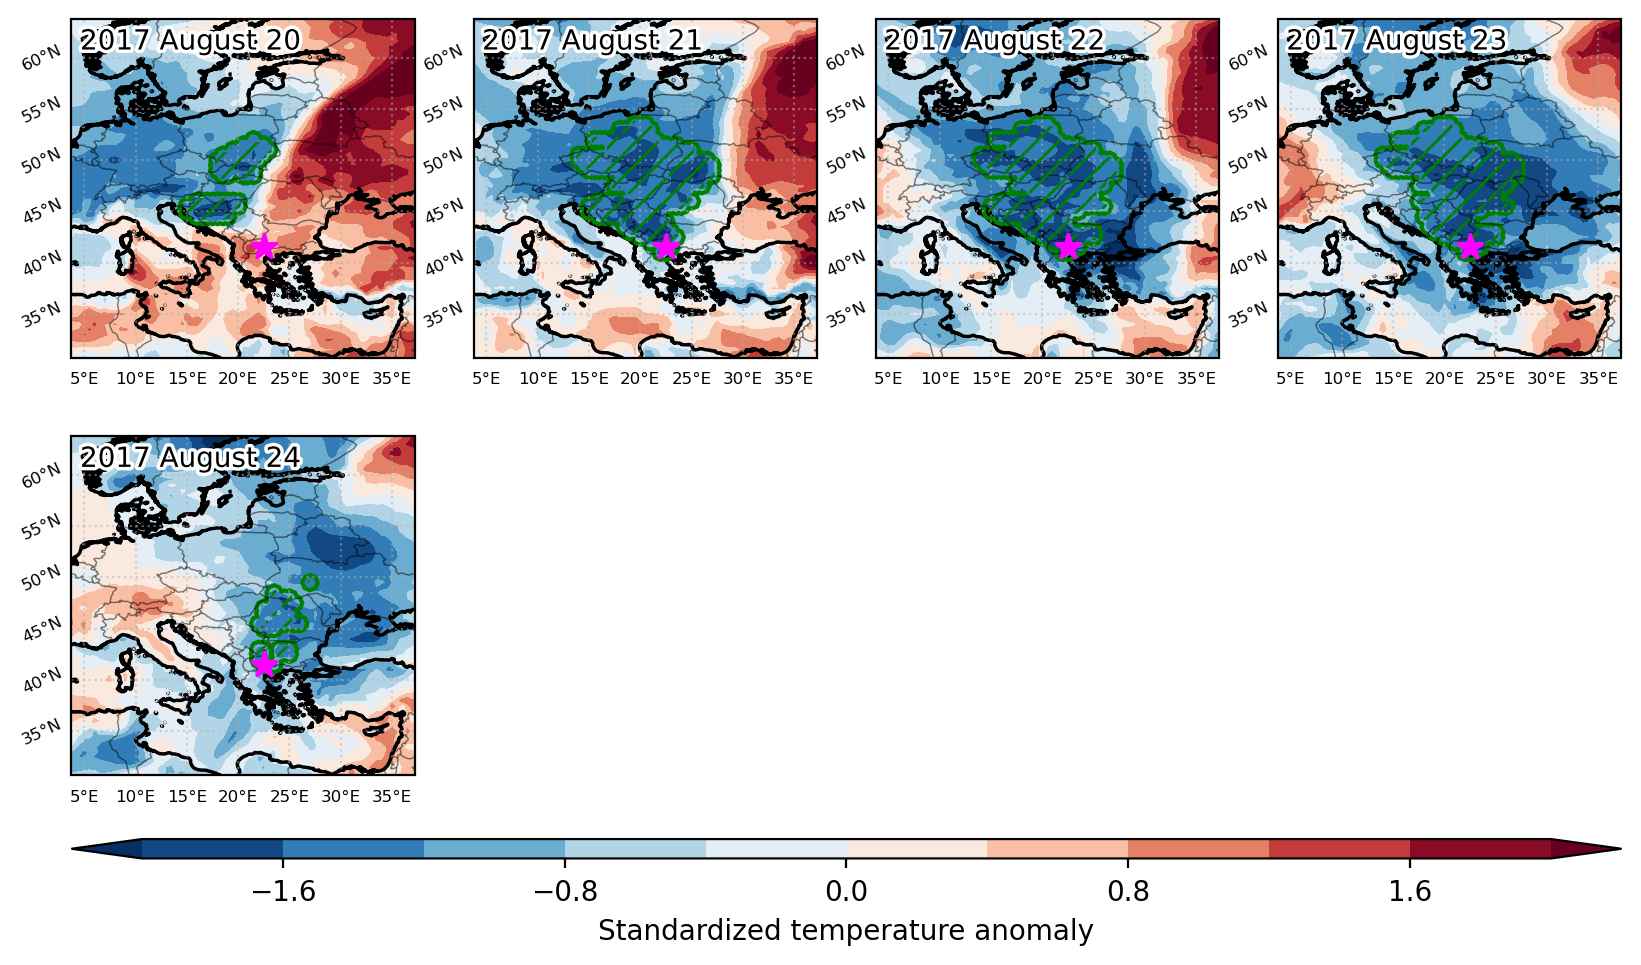
Cold spell occuring from August 20 2017 to August 24 2017 at 41.5°N 22.5°E

Download data: JSON

Event type: Cold spell

Countries affected (identified with ArcGIS Online; provided only for geographical reference):

  • Albania
  • Austria
  • Bosnia and Herzegovina
  • Bulgaria
  • Croatia
  • Czech Republic
  • Greece
  • Hungary
  • Montenegro
  • North Macedonia
  • Poland
  • Romania
  • Serbia
  • Slovakia
  • Slovenia
  • Ukraine

Duration: 5 days

Time span: August 20 2017 to August 24 2017

Statistics over entire affected area:

  • Mean temperature anomaly: -4.6 °C
  • Mean temperature: 14.9 °C
  • Minimum temperature anomaly: -6.1 °C
  • Minimum temperature: 8.2 °C

Event center: 41.5°N 22.5°E

Area affected: 730039 km$^2$


Fig. 1: Map of most extreme temperature anomalies (standardized) experienced during the event. The purple star indicates the center of the extreme event. Green hatching illustrates all areas under the effect of extremes at some time during the event.


Fig. 2: Evolution of temperature at the center of the event. The climatological percentile distribution is illustrated with color shadings.


Fig. 3: Maps illustrating the evolution of standardized temperature anomalies during the event.

Event ID: Cold_spell_2017-Aug-20_to_2017-Aug-24_22.5_41.5

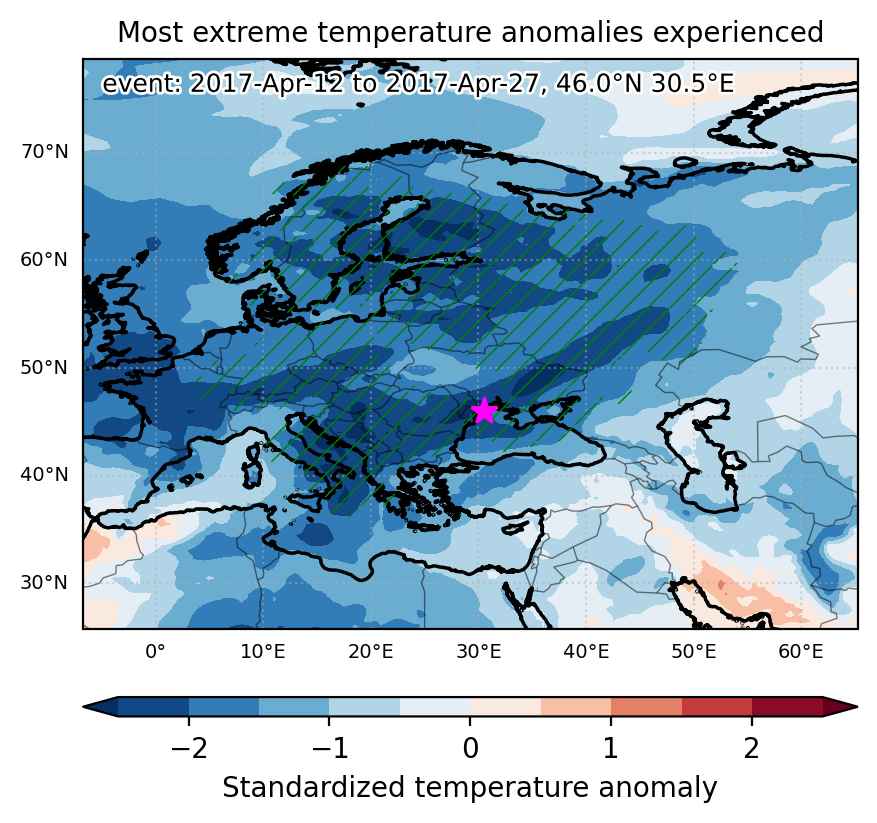
Cold spell occuring from April 12 2017 to April 27 2017 at 46.0°N 30.5°E

Download data: JSON

Event type: Cold spell

Countries affected (identified with ArcGIS Online; provided only for geographical reference):

  • Albania
  • Austria
  • Belarus
  • Belgium
  • Bosnia and Herzegovina
  • Bulgaria
  • Croatia
  • Czech Republic
  • Denmark
  • Estonia
  • Finland
  • France
  • Germany
  • Greece
  • Hungary
  • Italy
  • Kazakhstan
  • Latvia
  • Lithuania
  • Luxembourg
  • Moldova
  • Montenegro
  • North Macedonia
  • Norway
  • Poland
  • Romania
  • Russian Federation
  • Serbia
  • Slovakia
  • Slovenia
  • Sweden
  • Switzerland
  • Turkiye
  • Ukraine

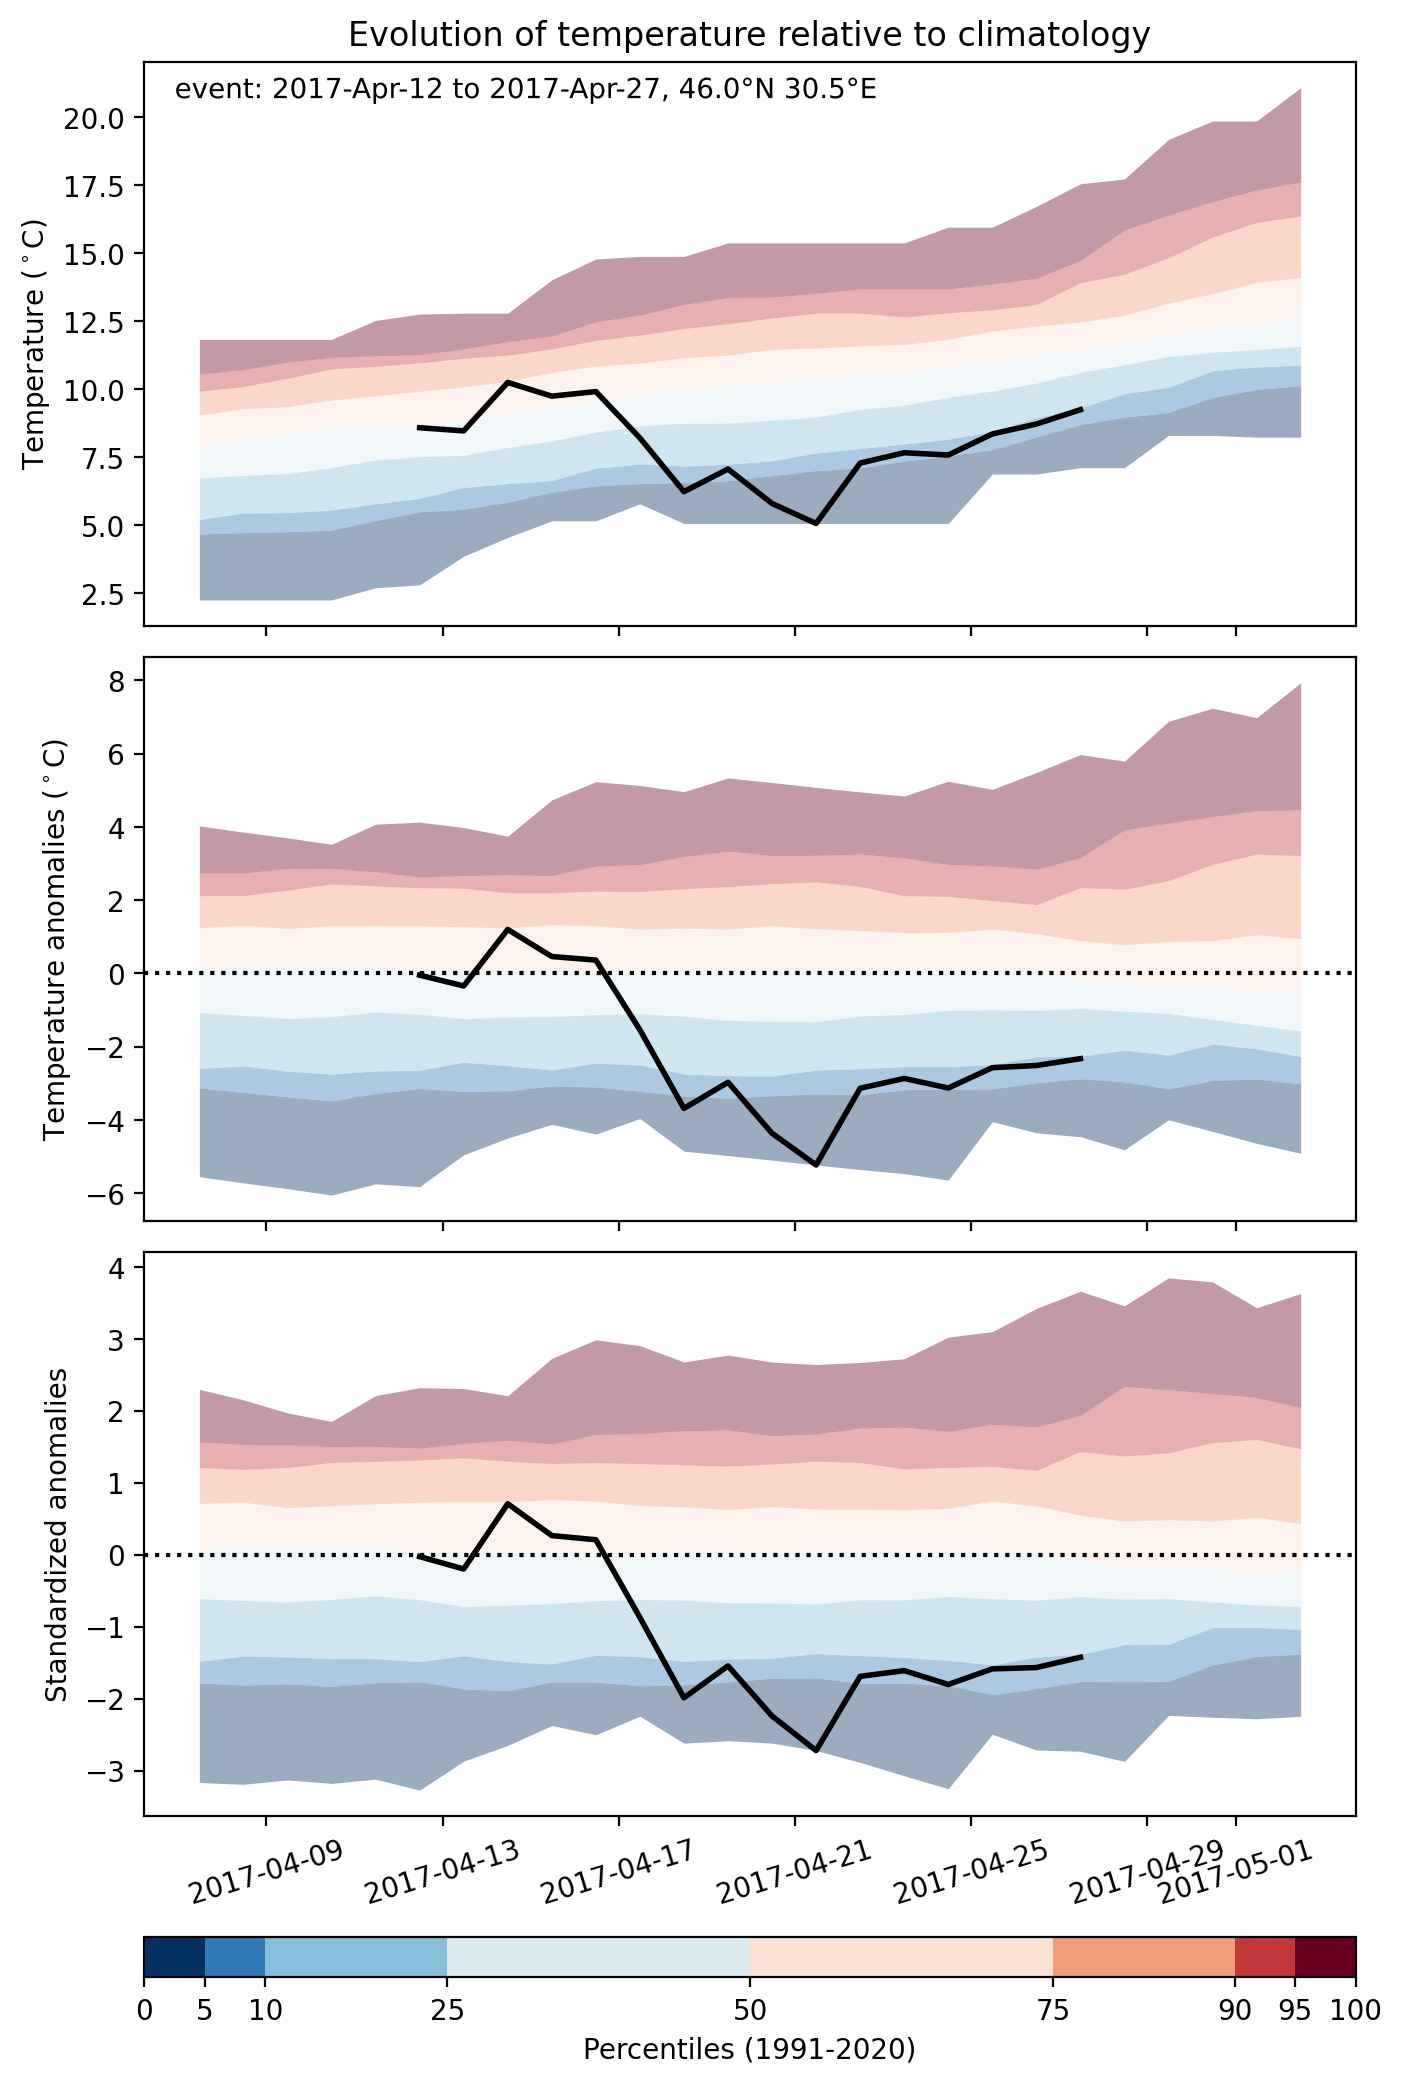
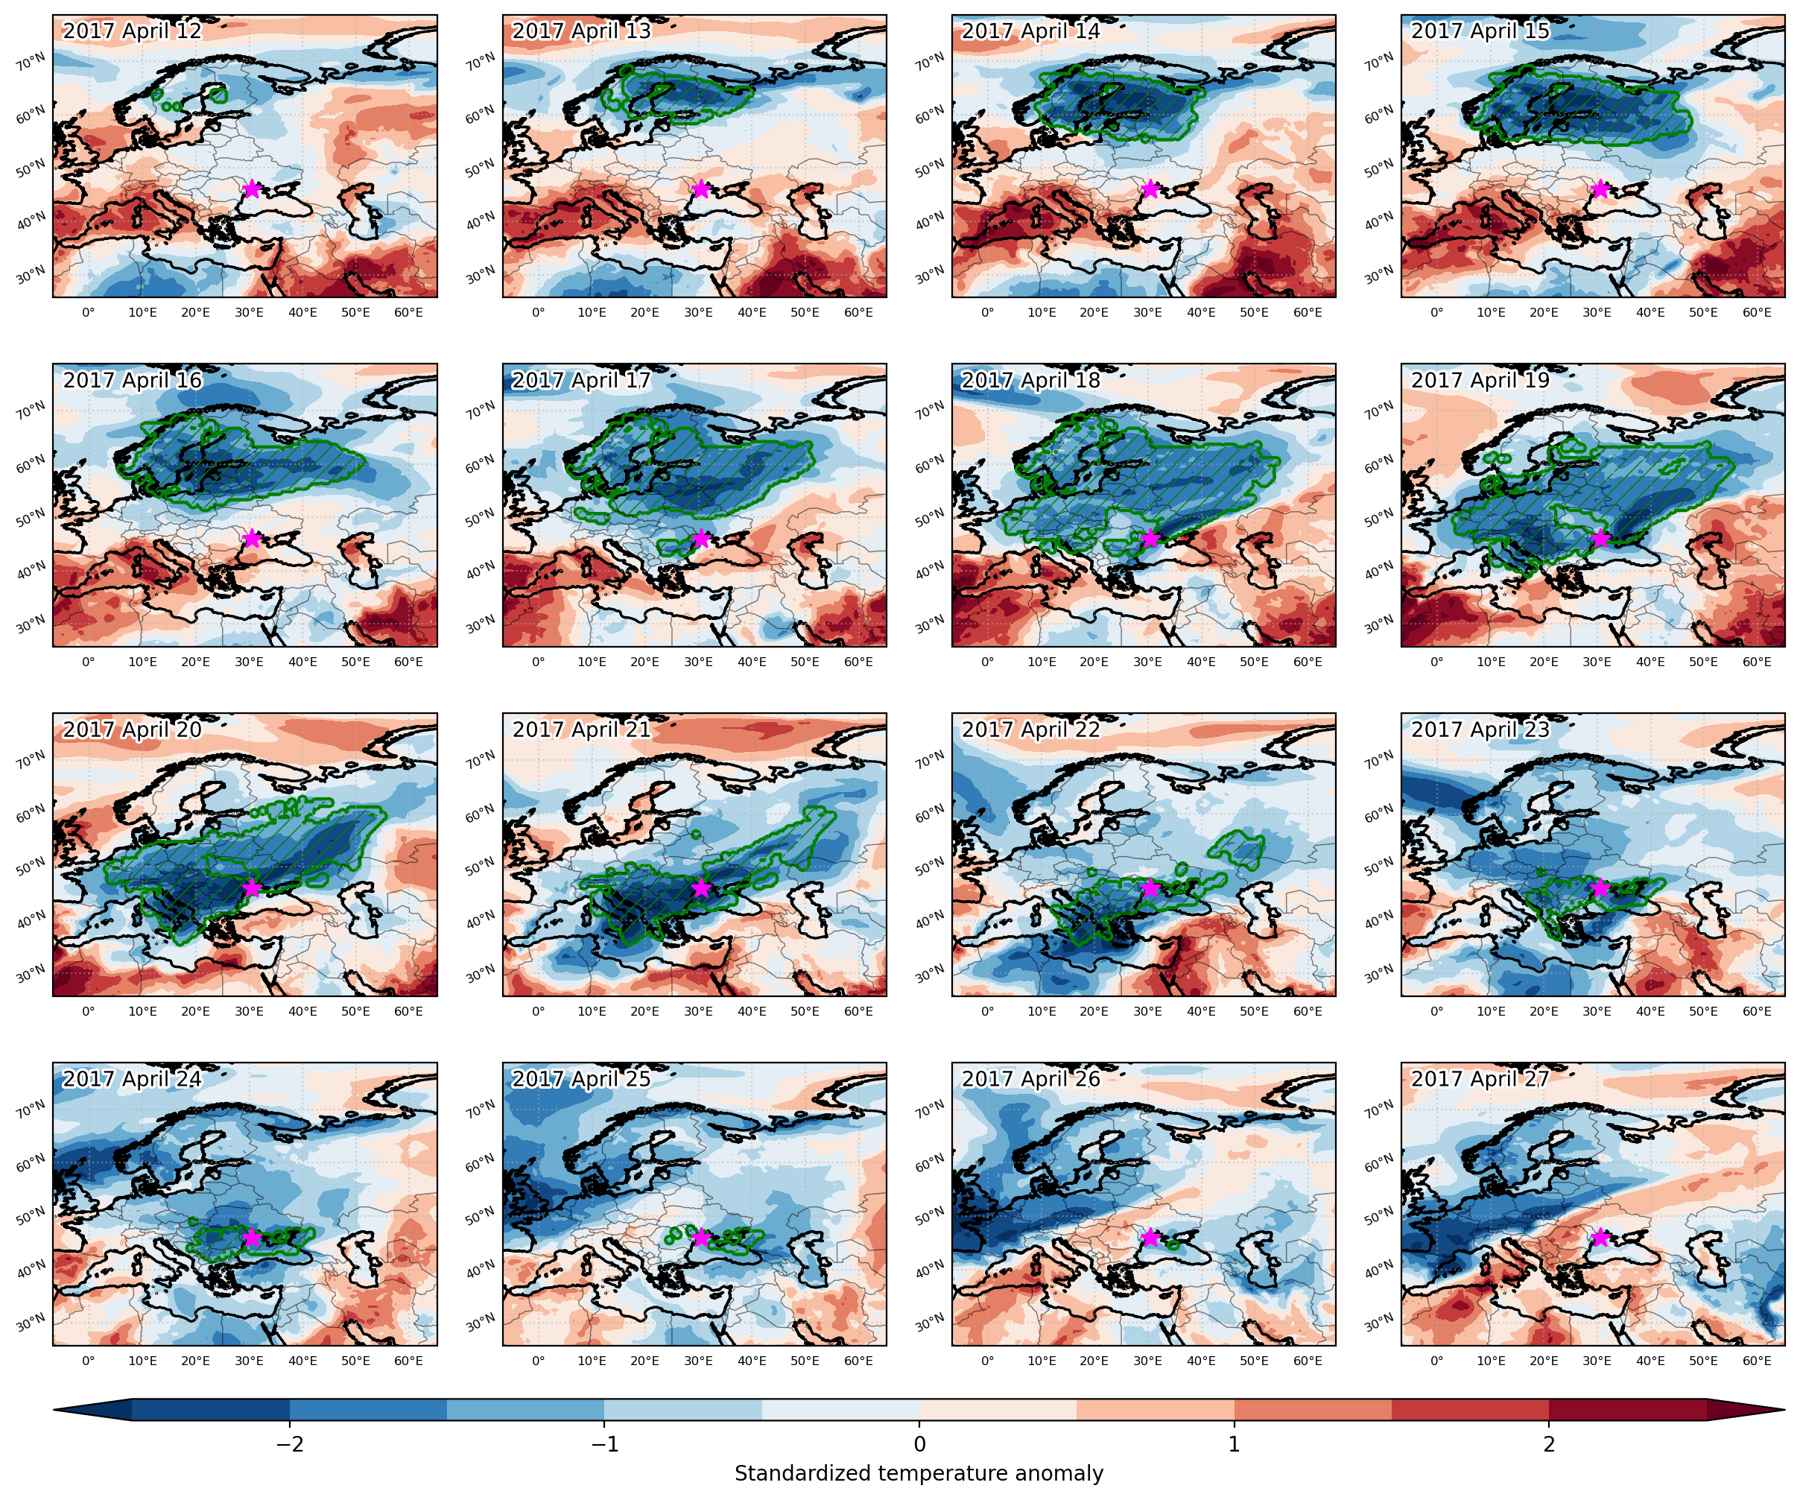
Duration: 16 days

Time span: April 12 2017 to April 27 2017

Statistics over entire affected area:

  • Mean temperature anomaly: -6.1 °C
  • Mean temperature: 0.4 °C
  • Minimum temperature anomaly: -11.3 °C
  • Minimum temperature: -11.4 °C

Event center: 46.0°N 30.5°E

Area affected: 6034590 km$^2$


Fig. 1: Map of most extreme temperature anomalies (standardized) experienced during the event. The purple star indicates the center of the extreme event. Green hatching illustrates all areas under the effect of extremes at some time during the event.


Fig. 2: Evolution of temperature at the center of the event. The climatological percentile distribution is illustrated with color shadings.


Fig. 3: Maps illustrating the evolution of standardized temperature anomalies during the event.

Event ID: Cold_spell_2017-Apr-12_to_2017-Apr-27_30.5_46.0