Cold spell occuring from October 07 2025 to October 16 2025 at 35.0°N 33.5°E

Download data: JSON

Event type: Cold spell

Countries affected (identified with ArcGIS Online; provided only for geographical reference):

  • Cyprus
  • Greece
  • Lebanon
  • Syrian Arab Republic
  • Türkiye

Duration: 10 days

Time span: October 07 2025 to October 16 2025

Statistics over entire affected area:

  • Mean temperature anomaly: -4.3 °C
  • Mean temperature: 13.2 °C
  • Minimum temperature anomaly: -9.5 °C
  • Minimum temperature: 2.3 °C

Event center: 35.0°N 33.5°E

Area affected: 599231 km$^2$
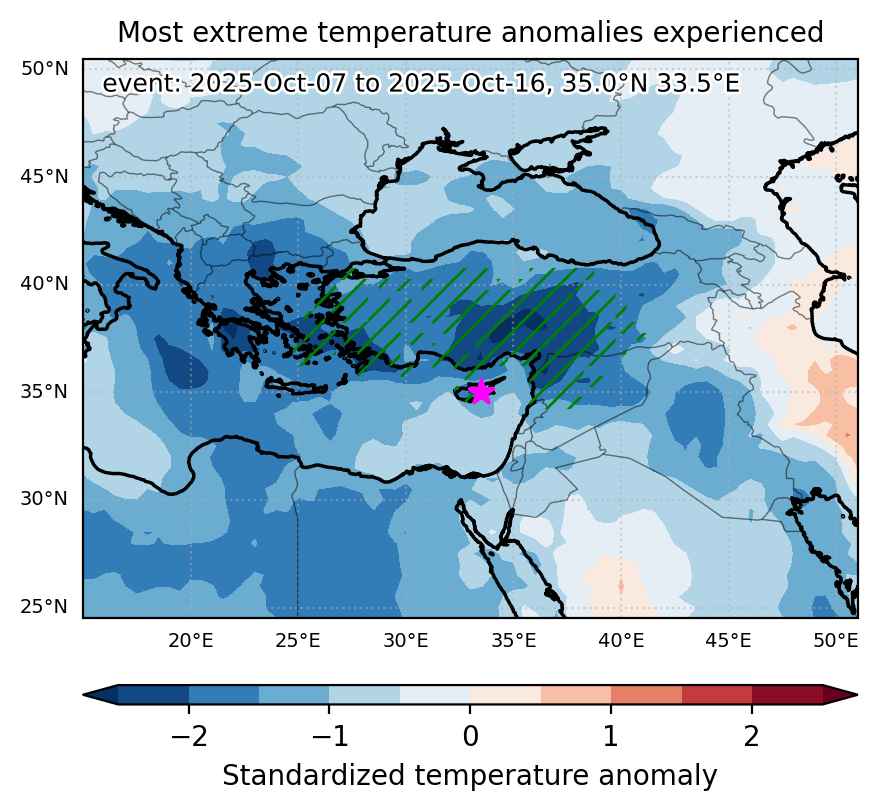

Fig. 1: Map of most extreme temperature anomalies (standardized) experienced during the event. The purple star indicates the center of the extreme event. Green hatching illustrates all areas under the effect of extremes at some time during the event.
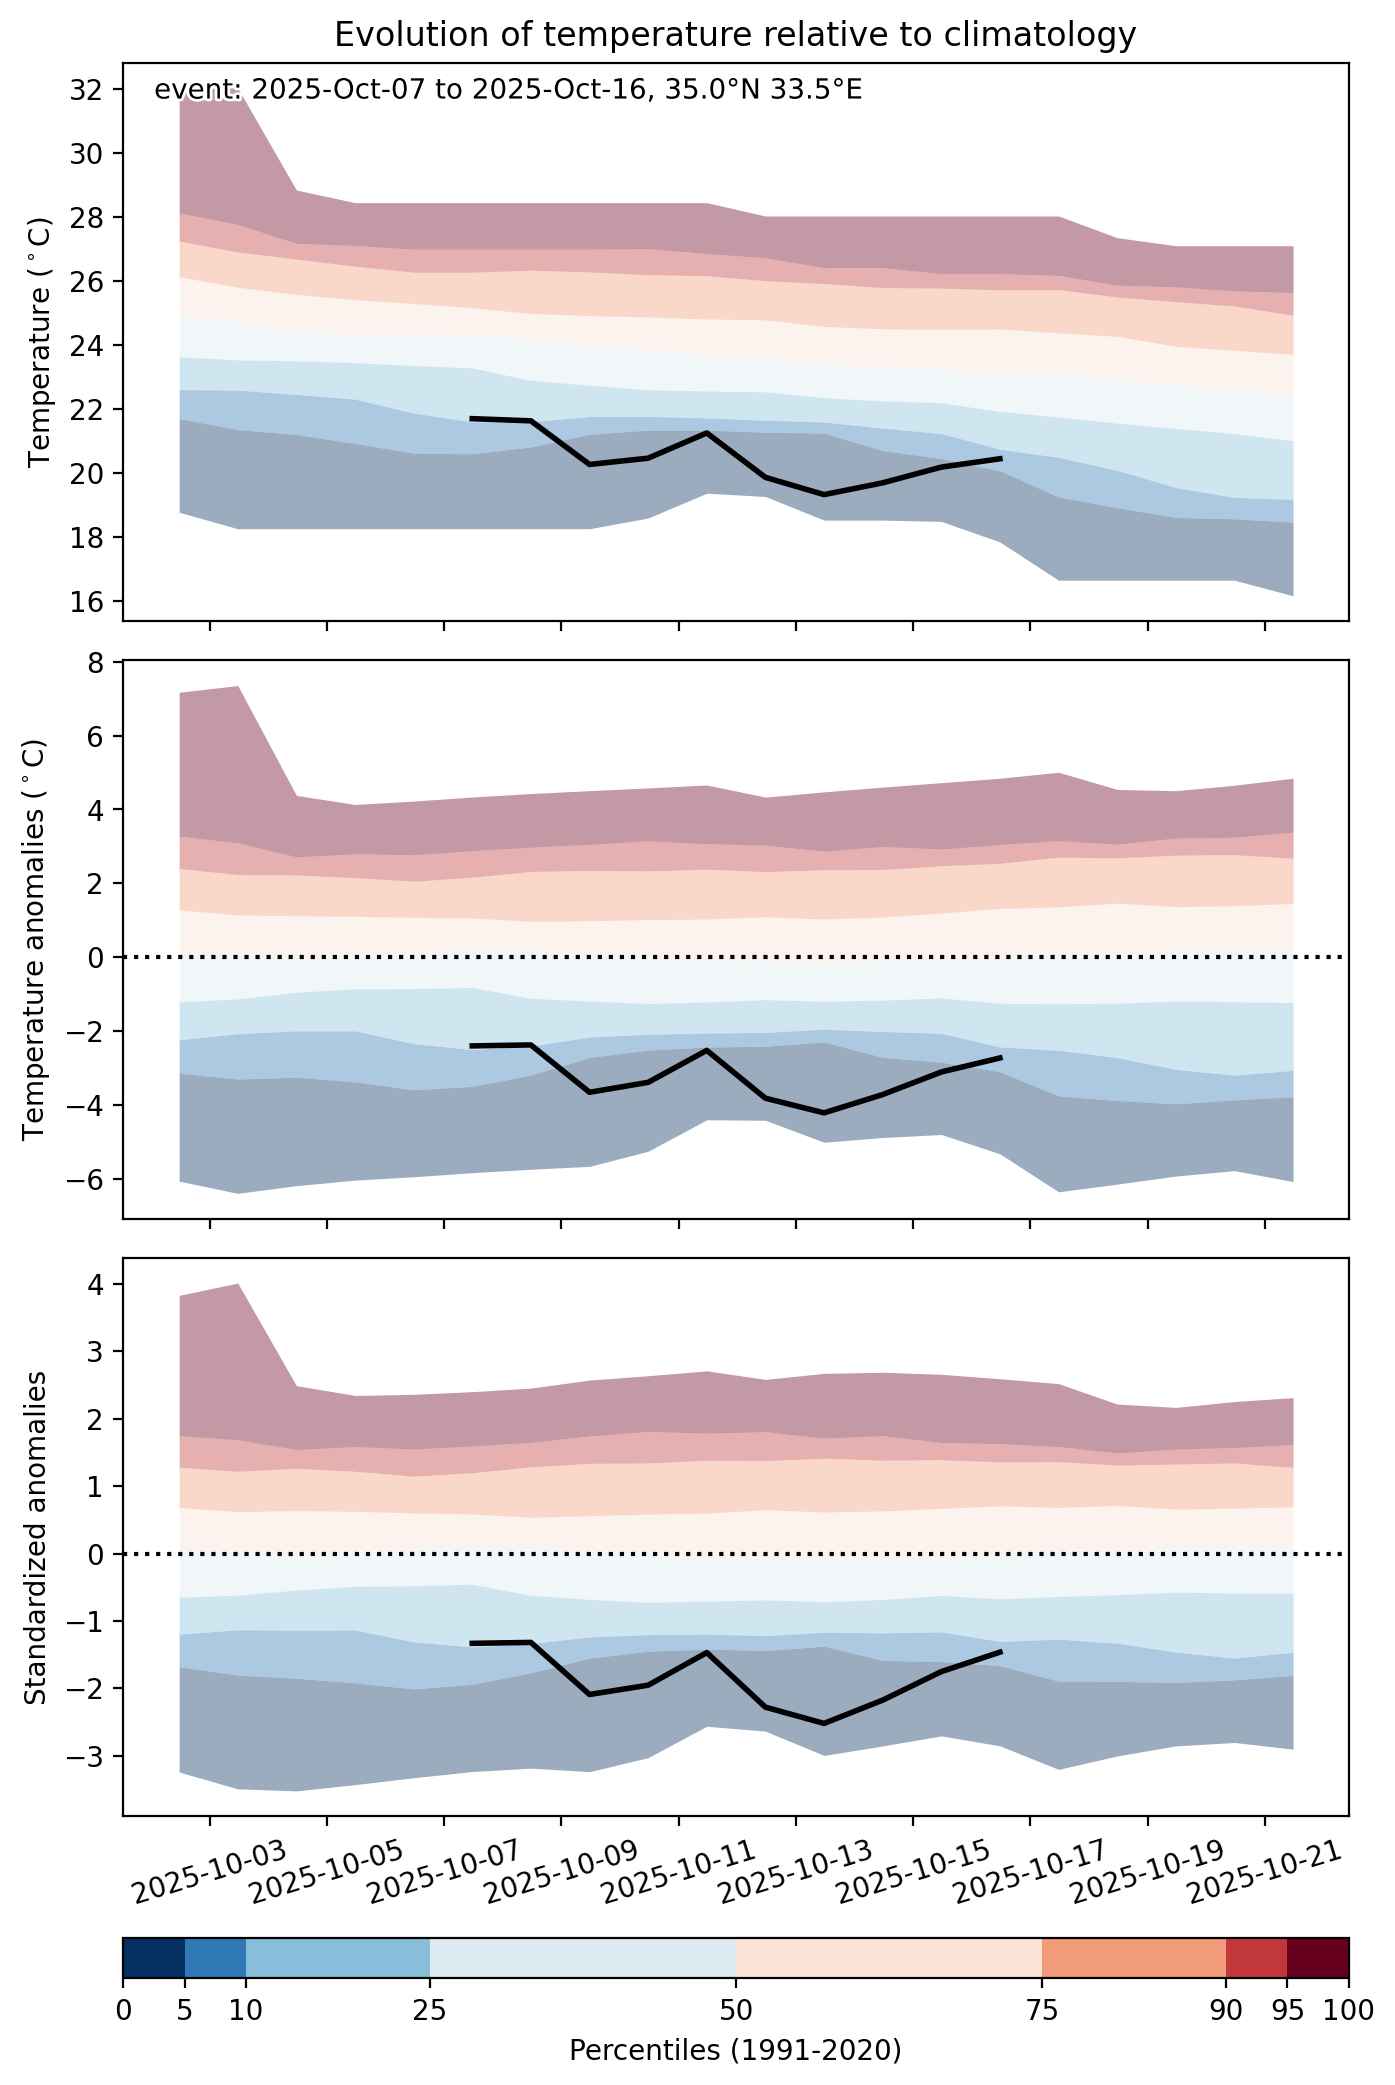


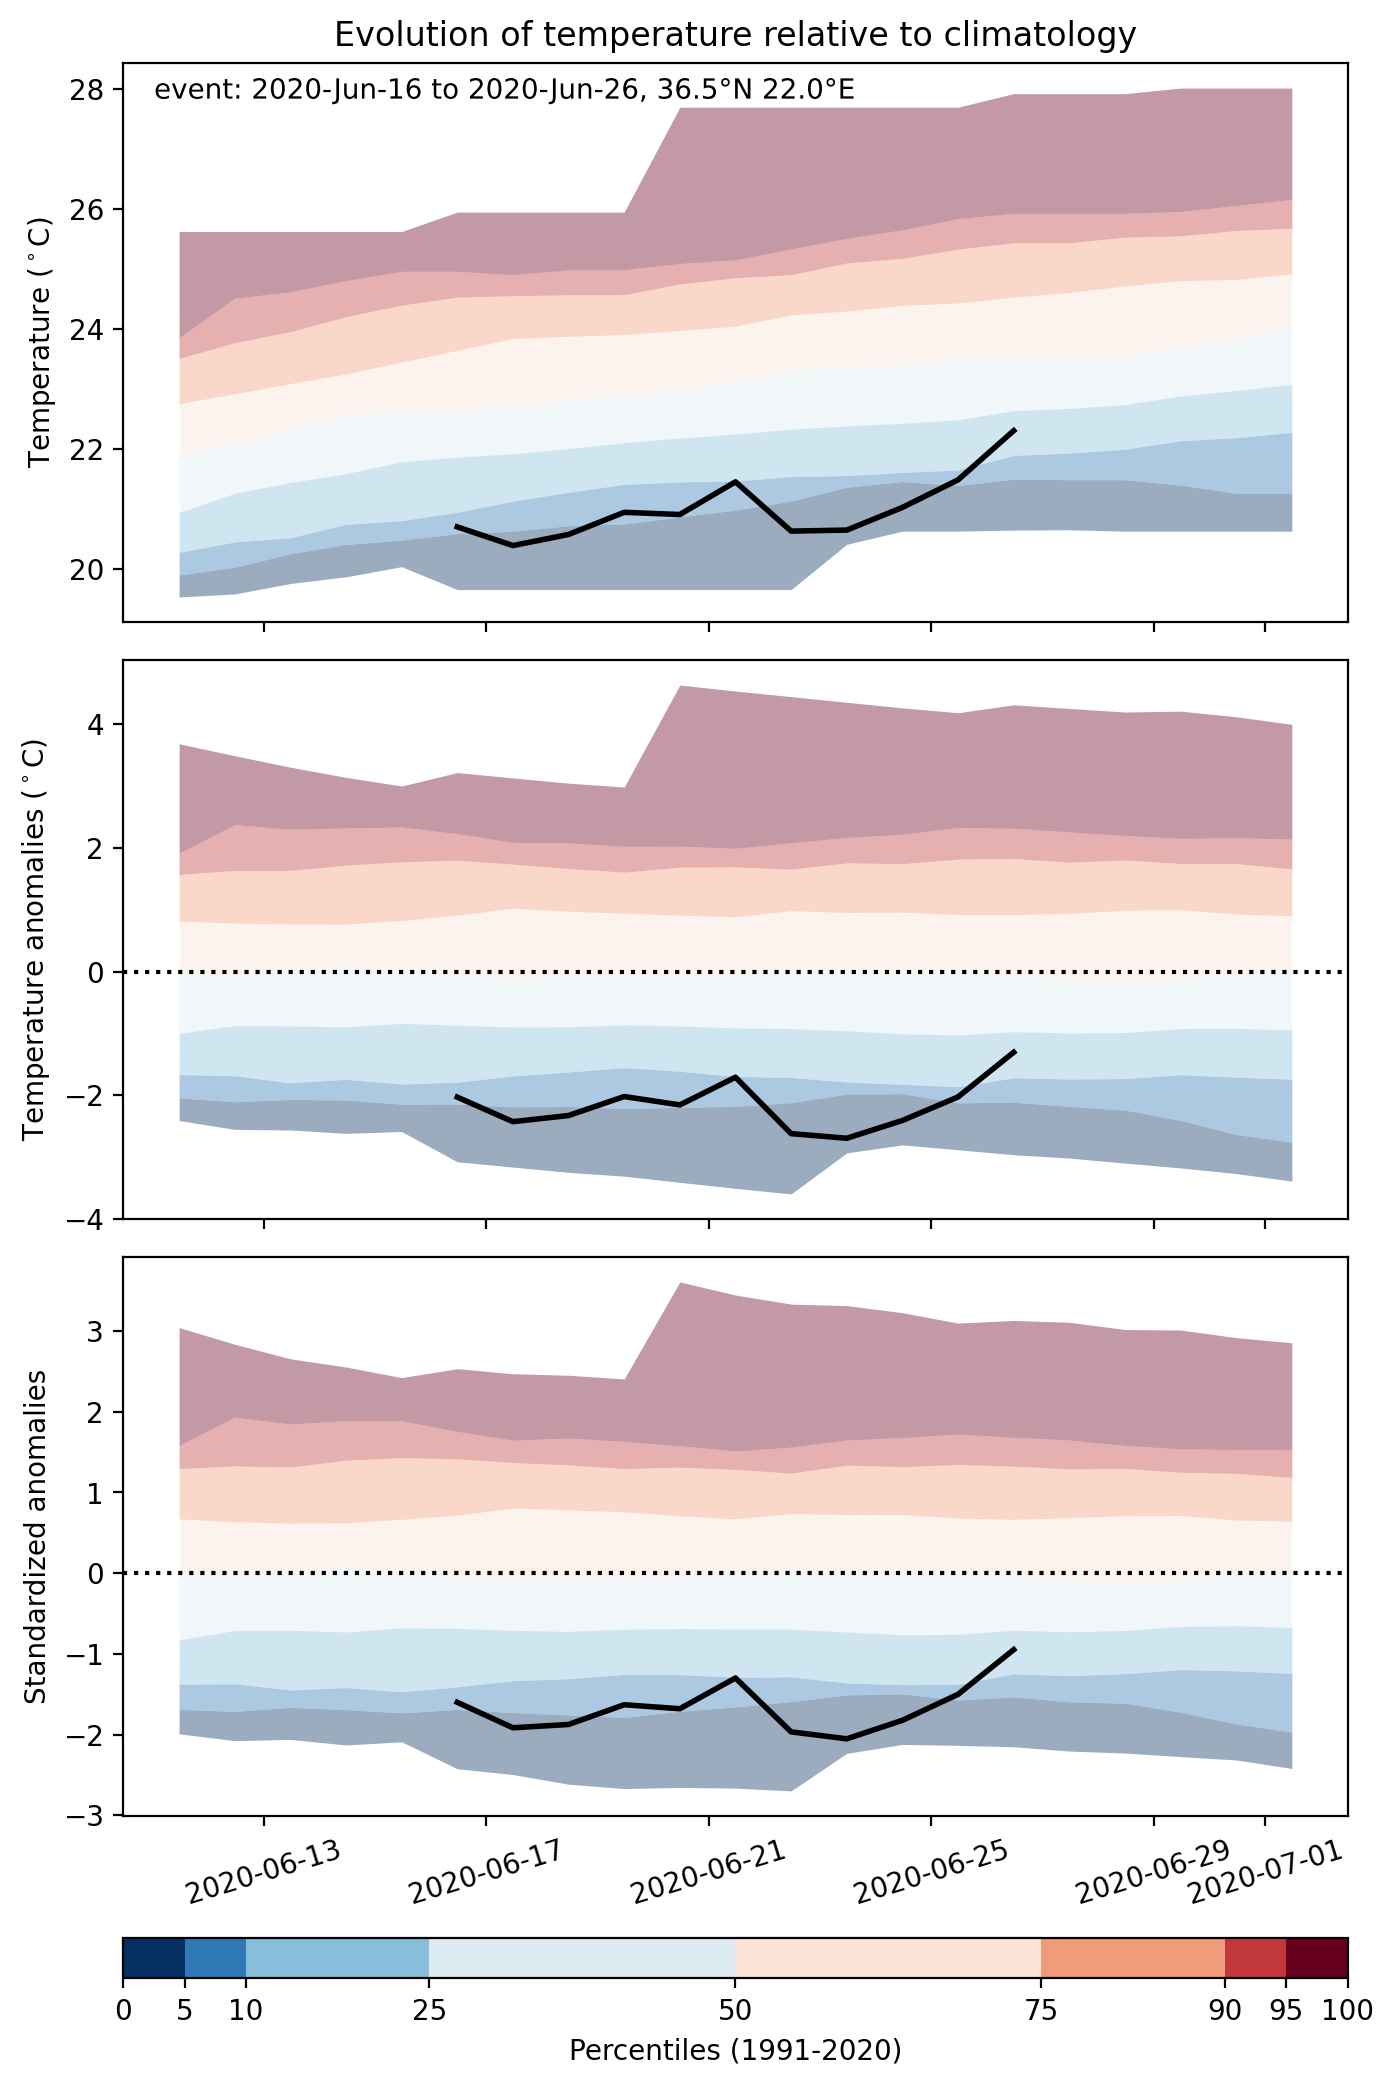
Fig. 2: Evolution of temperature at the center of the event. The climatological percentile distribution is illustrated with color shadings.
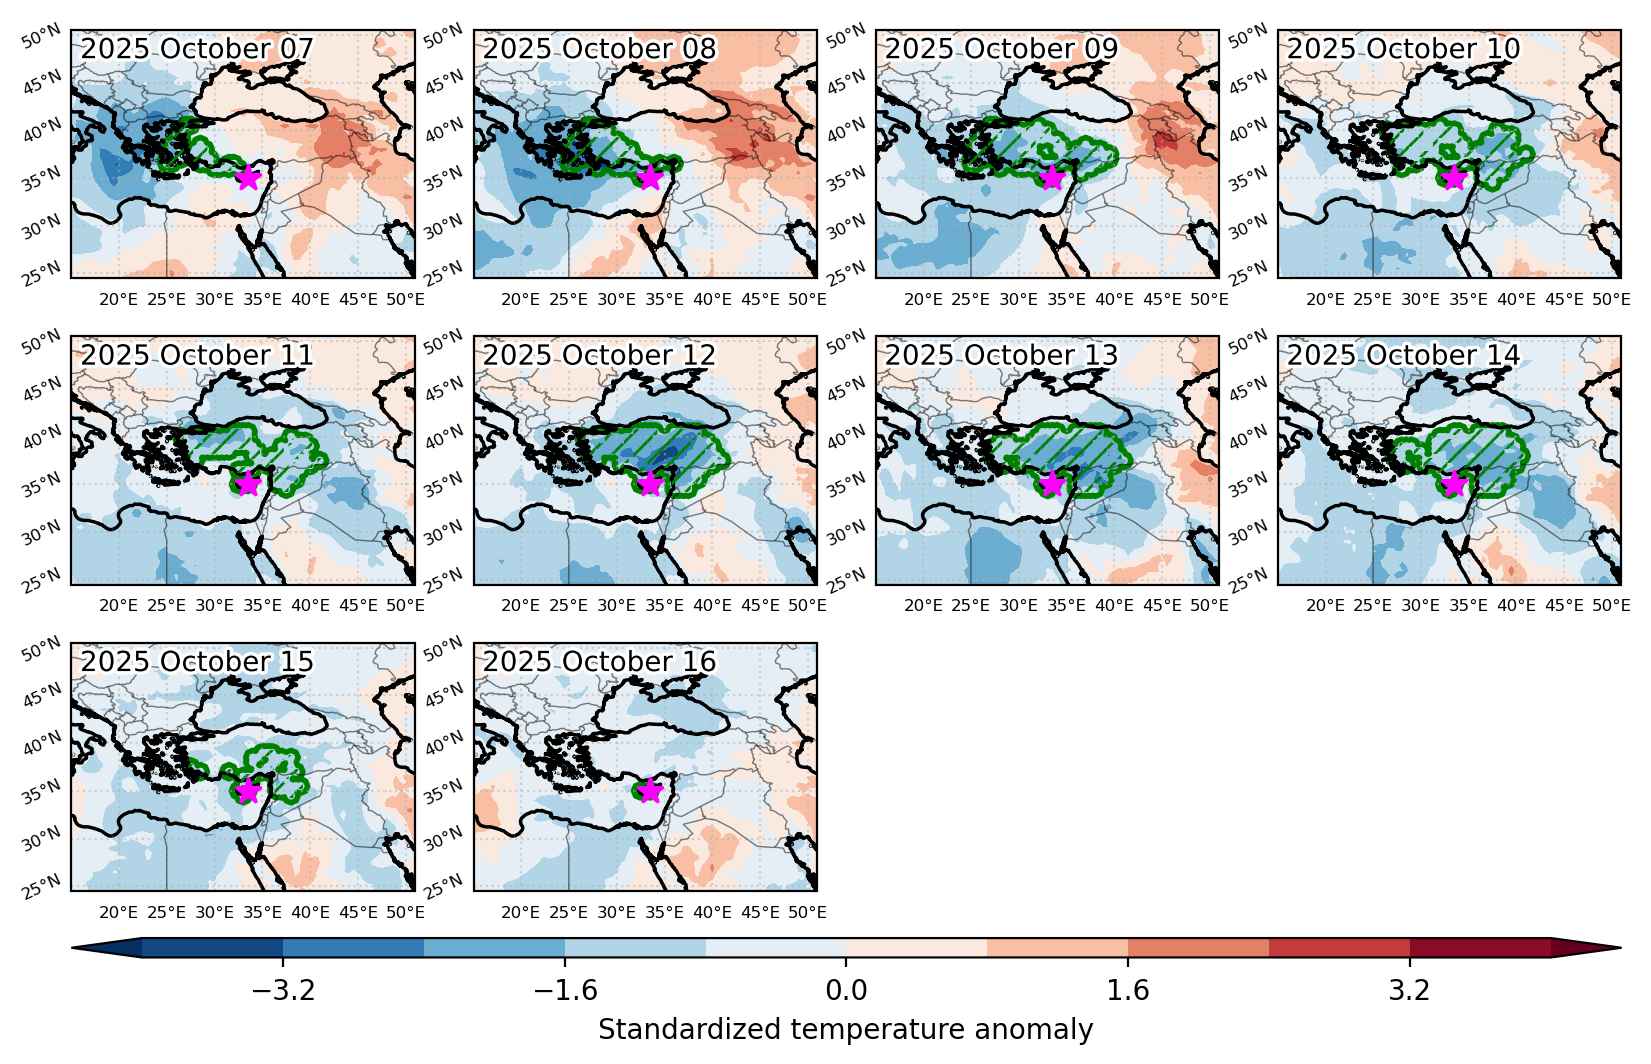


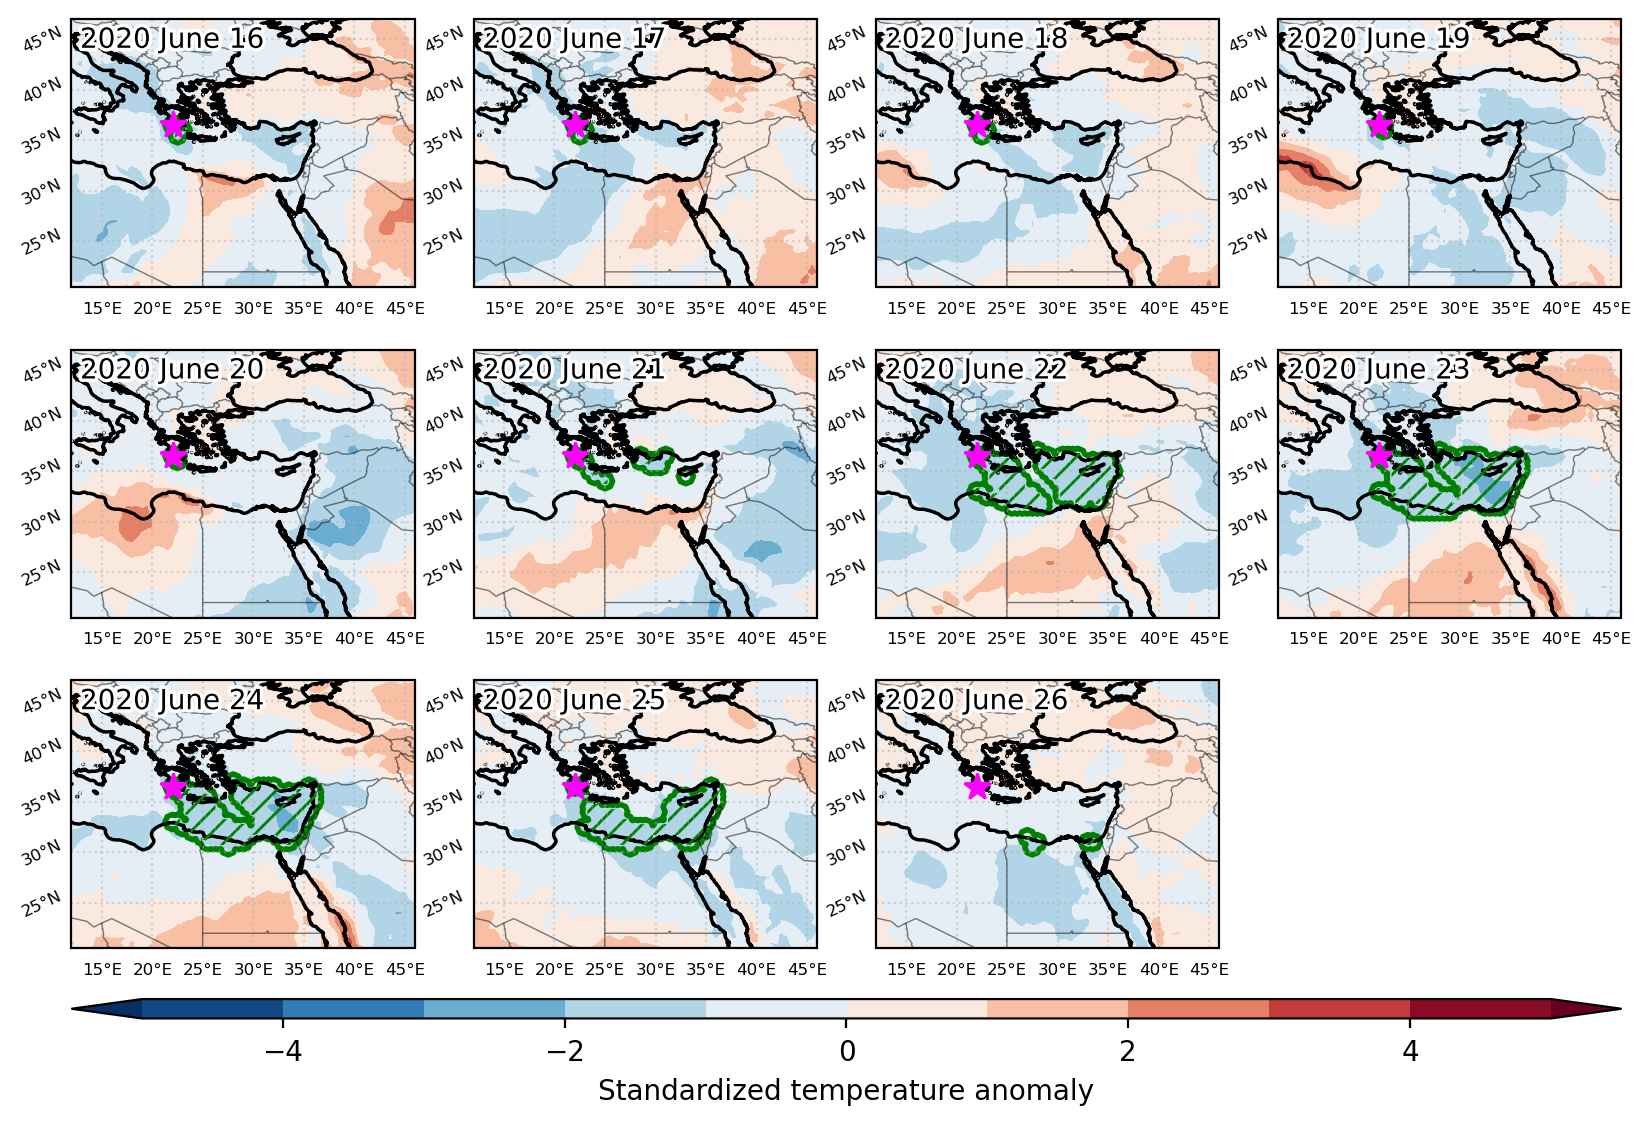
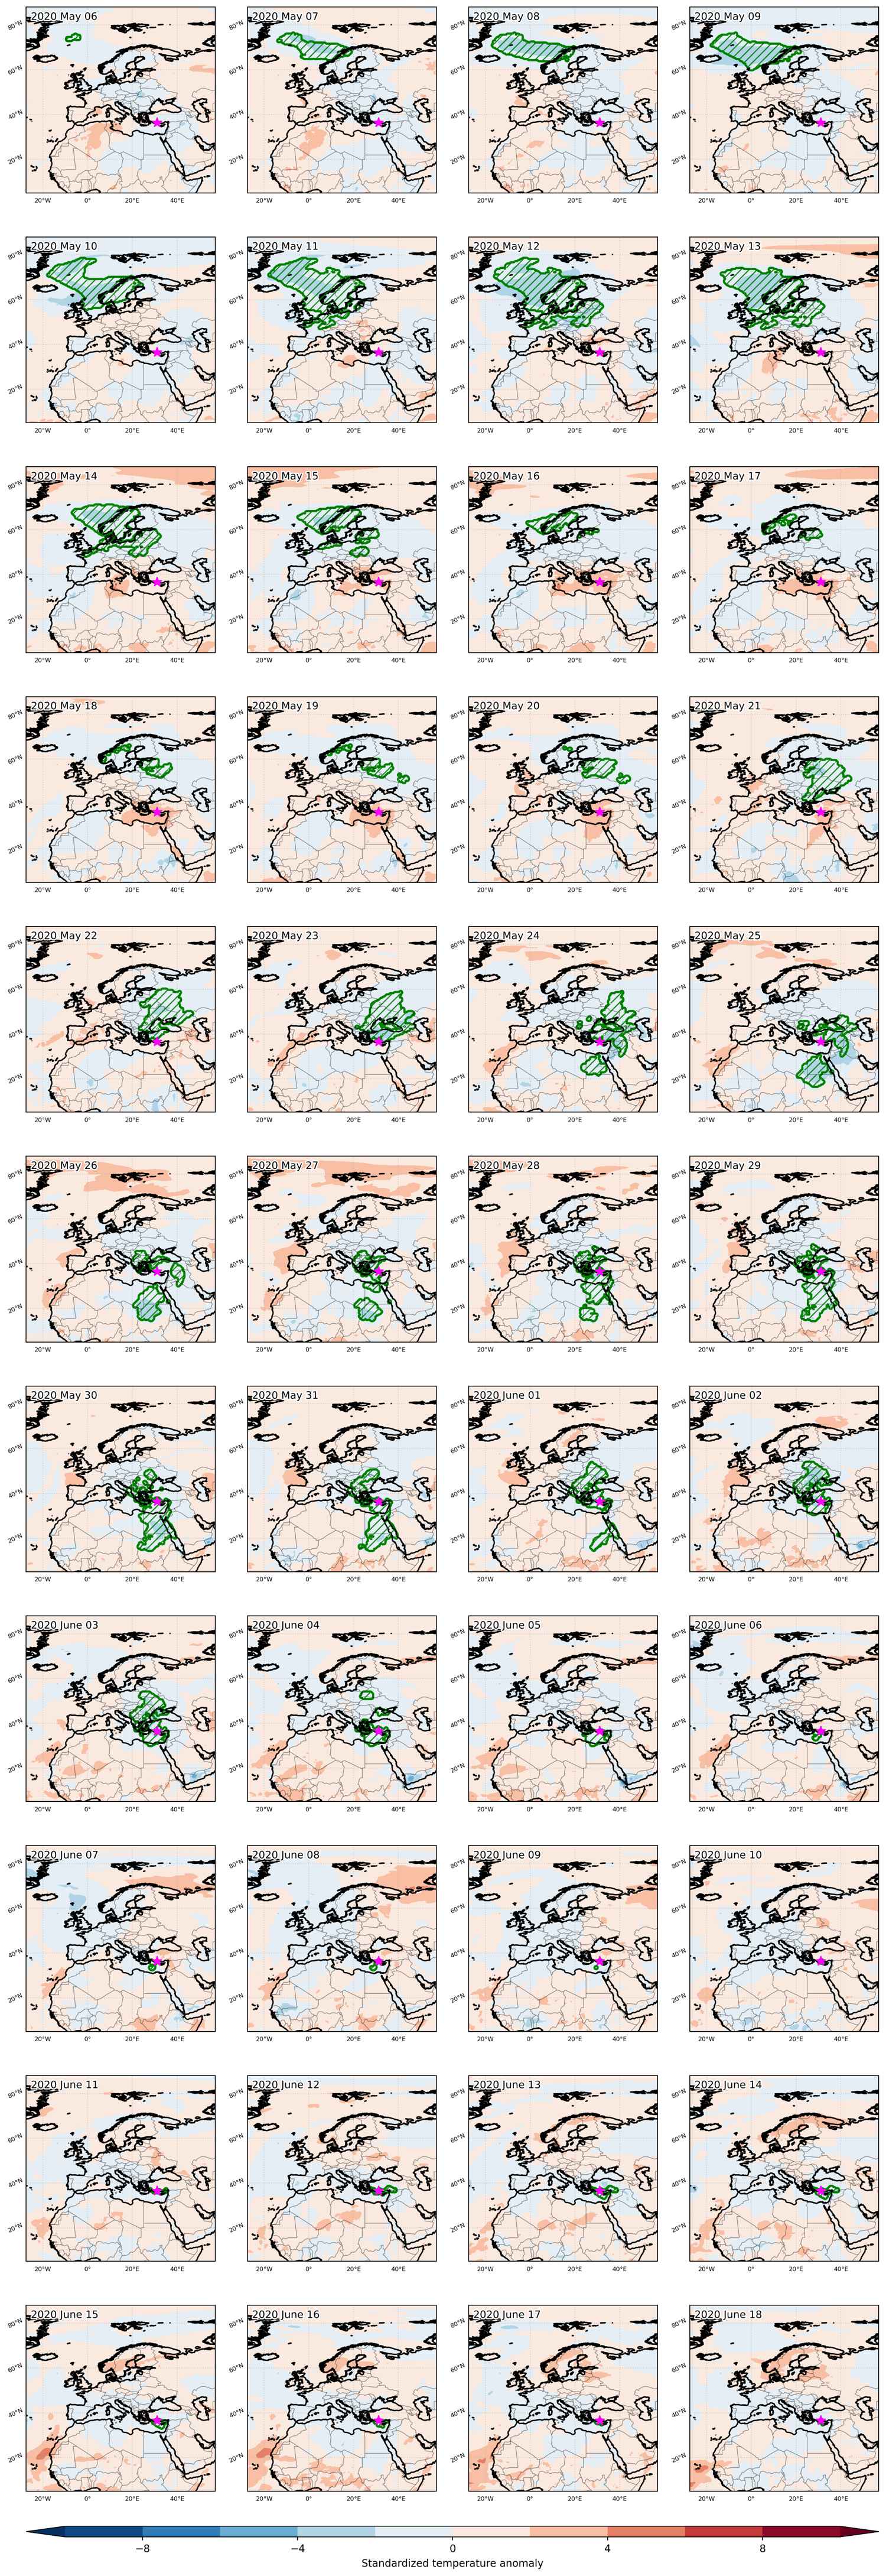
Fig. 3: Maps illustrating the evolution of standardized temperature anomalies during the event.

Event ID: Cold_spell_2025-Oct-07_to_2025-Oct-16_33.5_35.0
Cold spell occuring from February 16 2025 to March 04 2025 at 43.0°N 48.0°E

Download data: JSON

Event type: Cold spell

Countries affected (identified with ArcGIS Online; provided only for geographical reference):

  • Albania
  • Armenia
  • Azerbaijan
  • Bahrain
  • Bulgaria
  • Cyprus
  • Egypt
  • Georgia
  • Greece
  • Hungary
  • Iran, Islamic Republic of
  • Iraq
  • Israel
  • Jordan
  • Kazakhstan
  • Kuwait
  • Lebanon
  • Libya
  • Moldova, Republic of
  • Montenegro
  • North Macedonia
  • Qatar
  • Romania
  • Russian Federation
  • Saudi Arabia
  • Serbia
  • Slovakia
  • Syrian Arab Republic
  • Turkmenistan
  • Türkiye
  • Ukraine
  • United Arab Emirates
  • Uzbekistan

Duration: 17 days

Time span: February 16 2025 to March 04 2025

Statistics over entire affected area:

  • Mean temperature anomaly: -6.8 °C
  • Mean temperature: 0.8 °C
  • Minimum temperature anomaly: -19.9 °C
  • Minimum temperature: -21.0 °C

Event center: 43.0°N 48.0°E

Area affected: 7275702 km$^2$


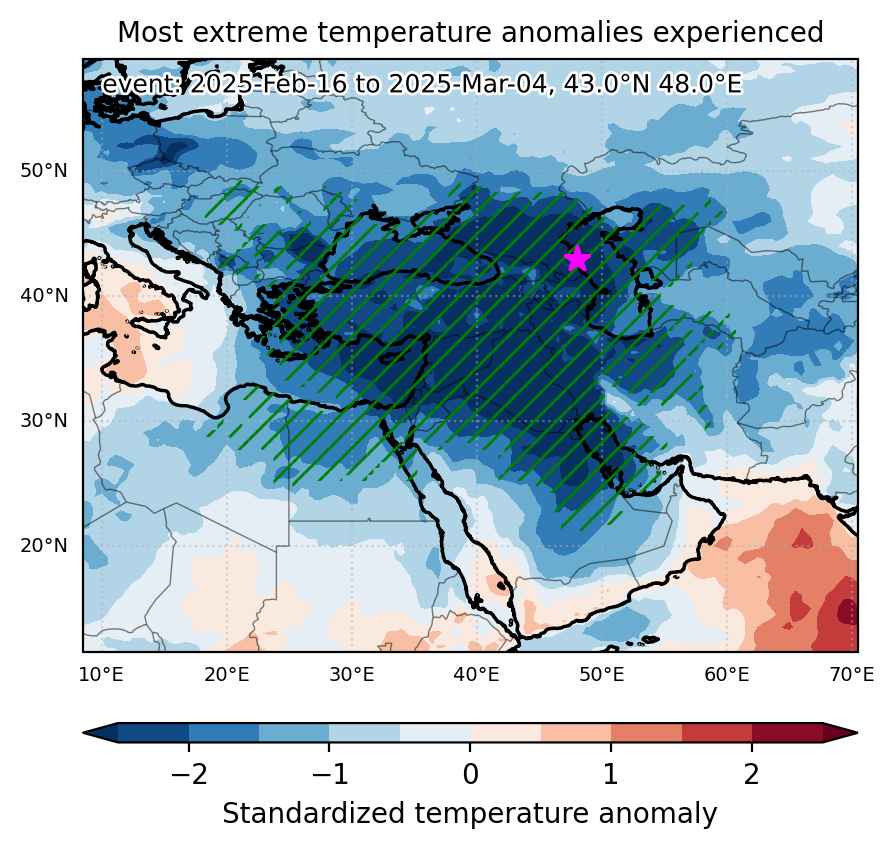
Fig. 1: Map of most extreme temperature anomalies (standardized) experienced during the event. The purple star indicates the center of the extreme event. Green hatching illustrates all areas under the effect of extremes at some time during the event.


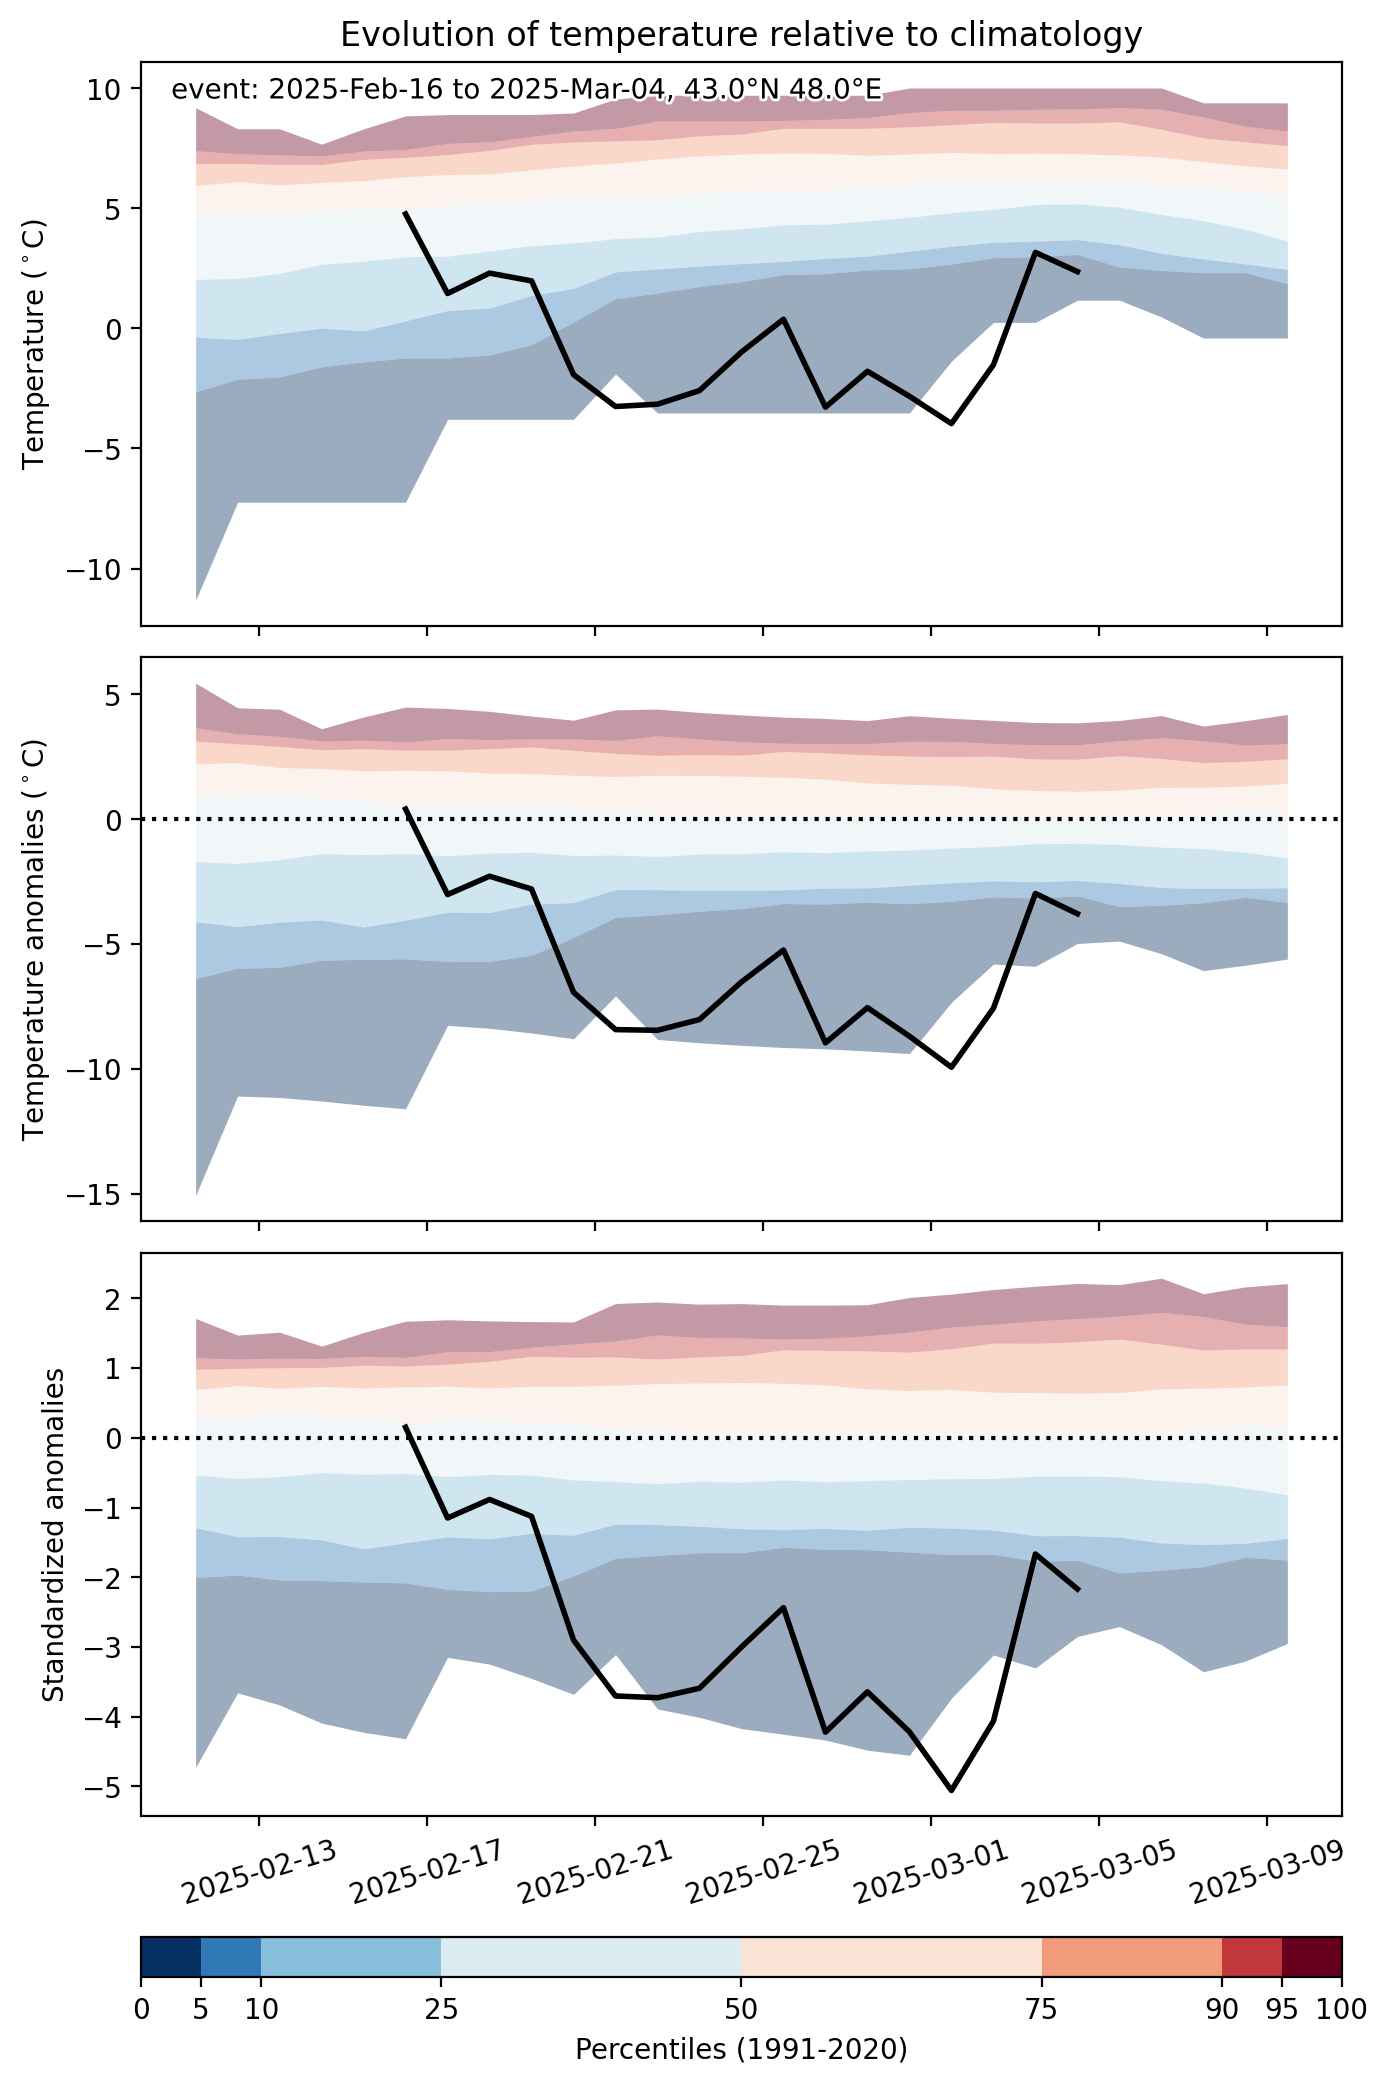
Fig. 2: Evolution of temperature at the center of the event. The climatological percentile distribution is illustrated with color shadings.


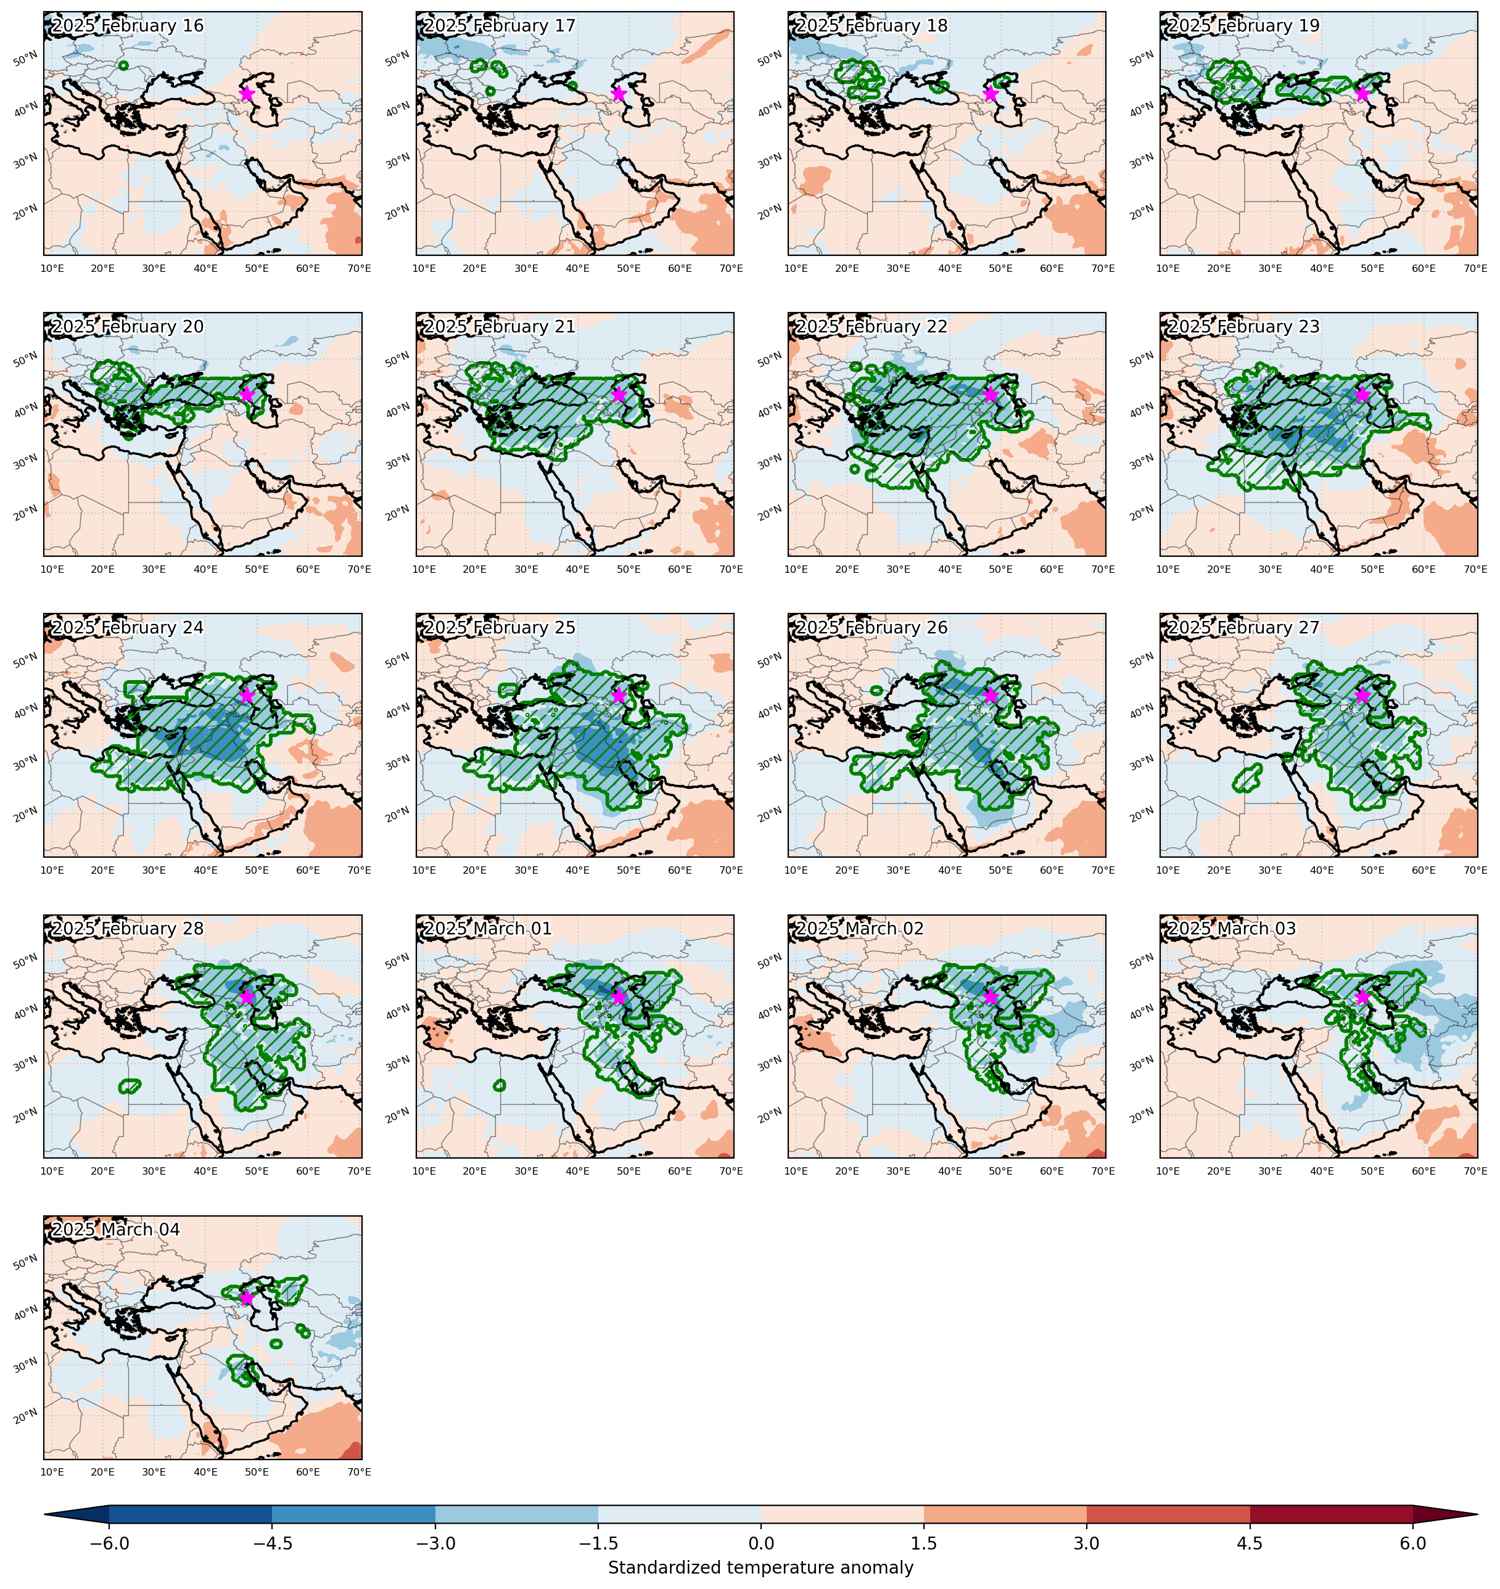
Fig. 3: Maps illustrating the evolution of standardized temperature anomalies during the event.

Event ID: Cold_spell_2025-Feb-16_to_2025-Mar-04_48.0_43.0

Cold spell occuring from February 05 2023 to February 18 2023 at 38.5°N 32.5°E

Download data: JSON

Event type: Cold spell

Countries affected (identified with ArcGIS Online; provided only for geographical reference):

  • Albania
  • Armenia
  • Azerbaijan
  • Bosnia and Herzegovina
  • Bulgaria
  • Croatia
  • Cyprus
  • Egypt
  • France
  • Georgia
  • Greece
  • Iran, Islamic Republic of
  • Iraq
  • Italy
  • Libya
  • Montenegro
  • North Macedonia
  • Serbia
  • Türkiye

Duration: 14 days

Time span: February 05 2023 to February 18 2023

Statistics over entire affected area:

  • Mean temperature anomaly: -5.4 °C
  • Mean temperature: 1.9 °C
  • Minimum temperature anomaly: -15.0 °C
  • Minimum temperature: -18.4 °C

Event center: 38.5°N 32.5°E

Area affected: 2013791 km$^2$


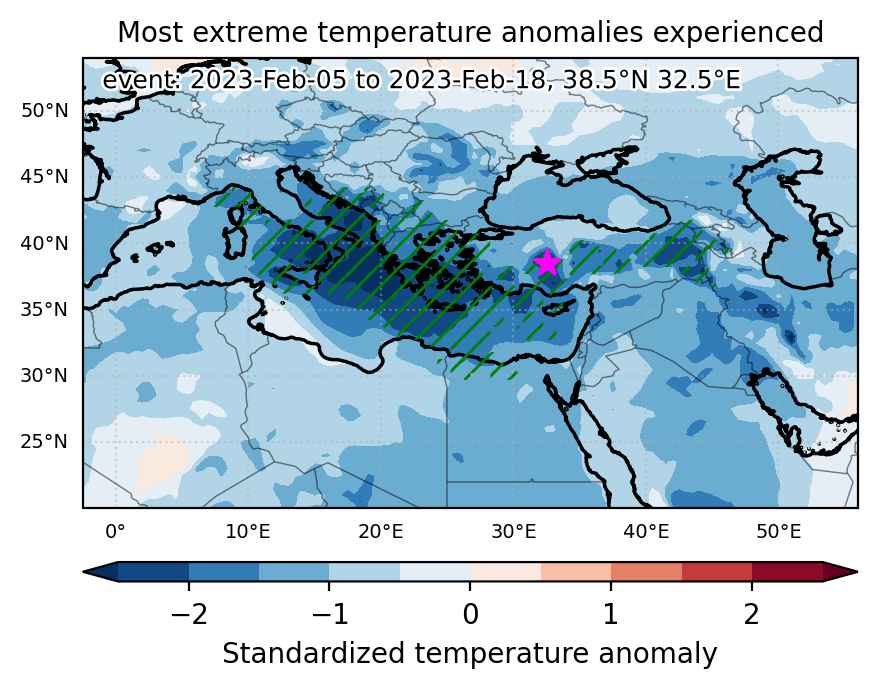
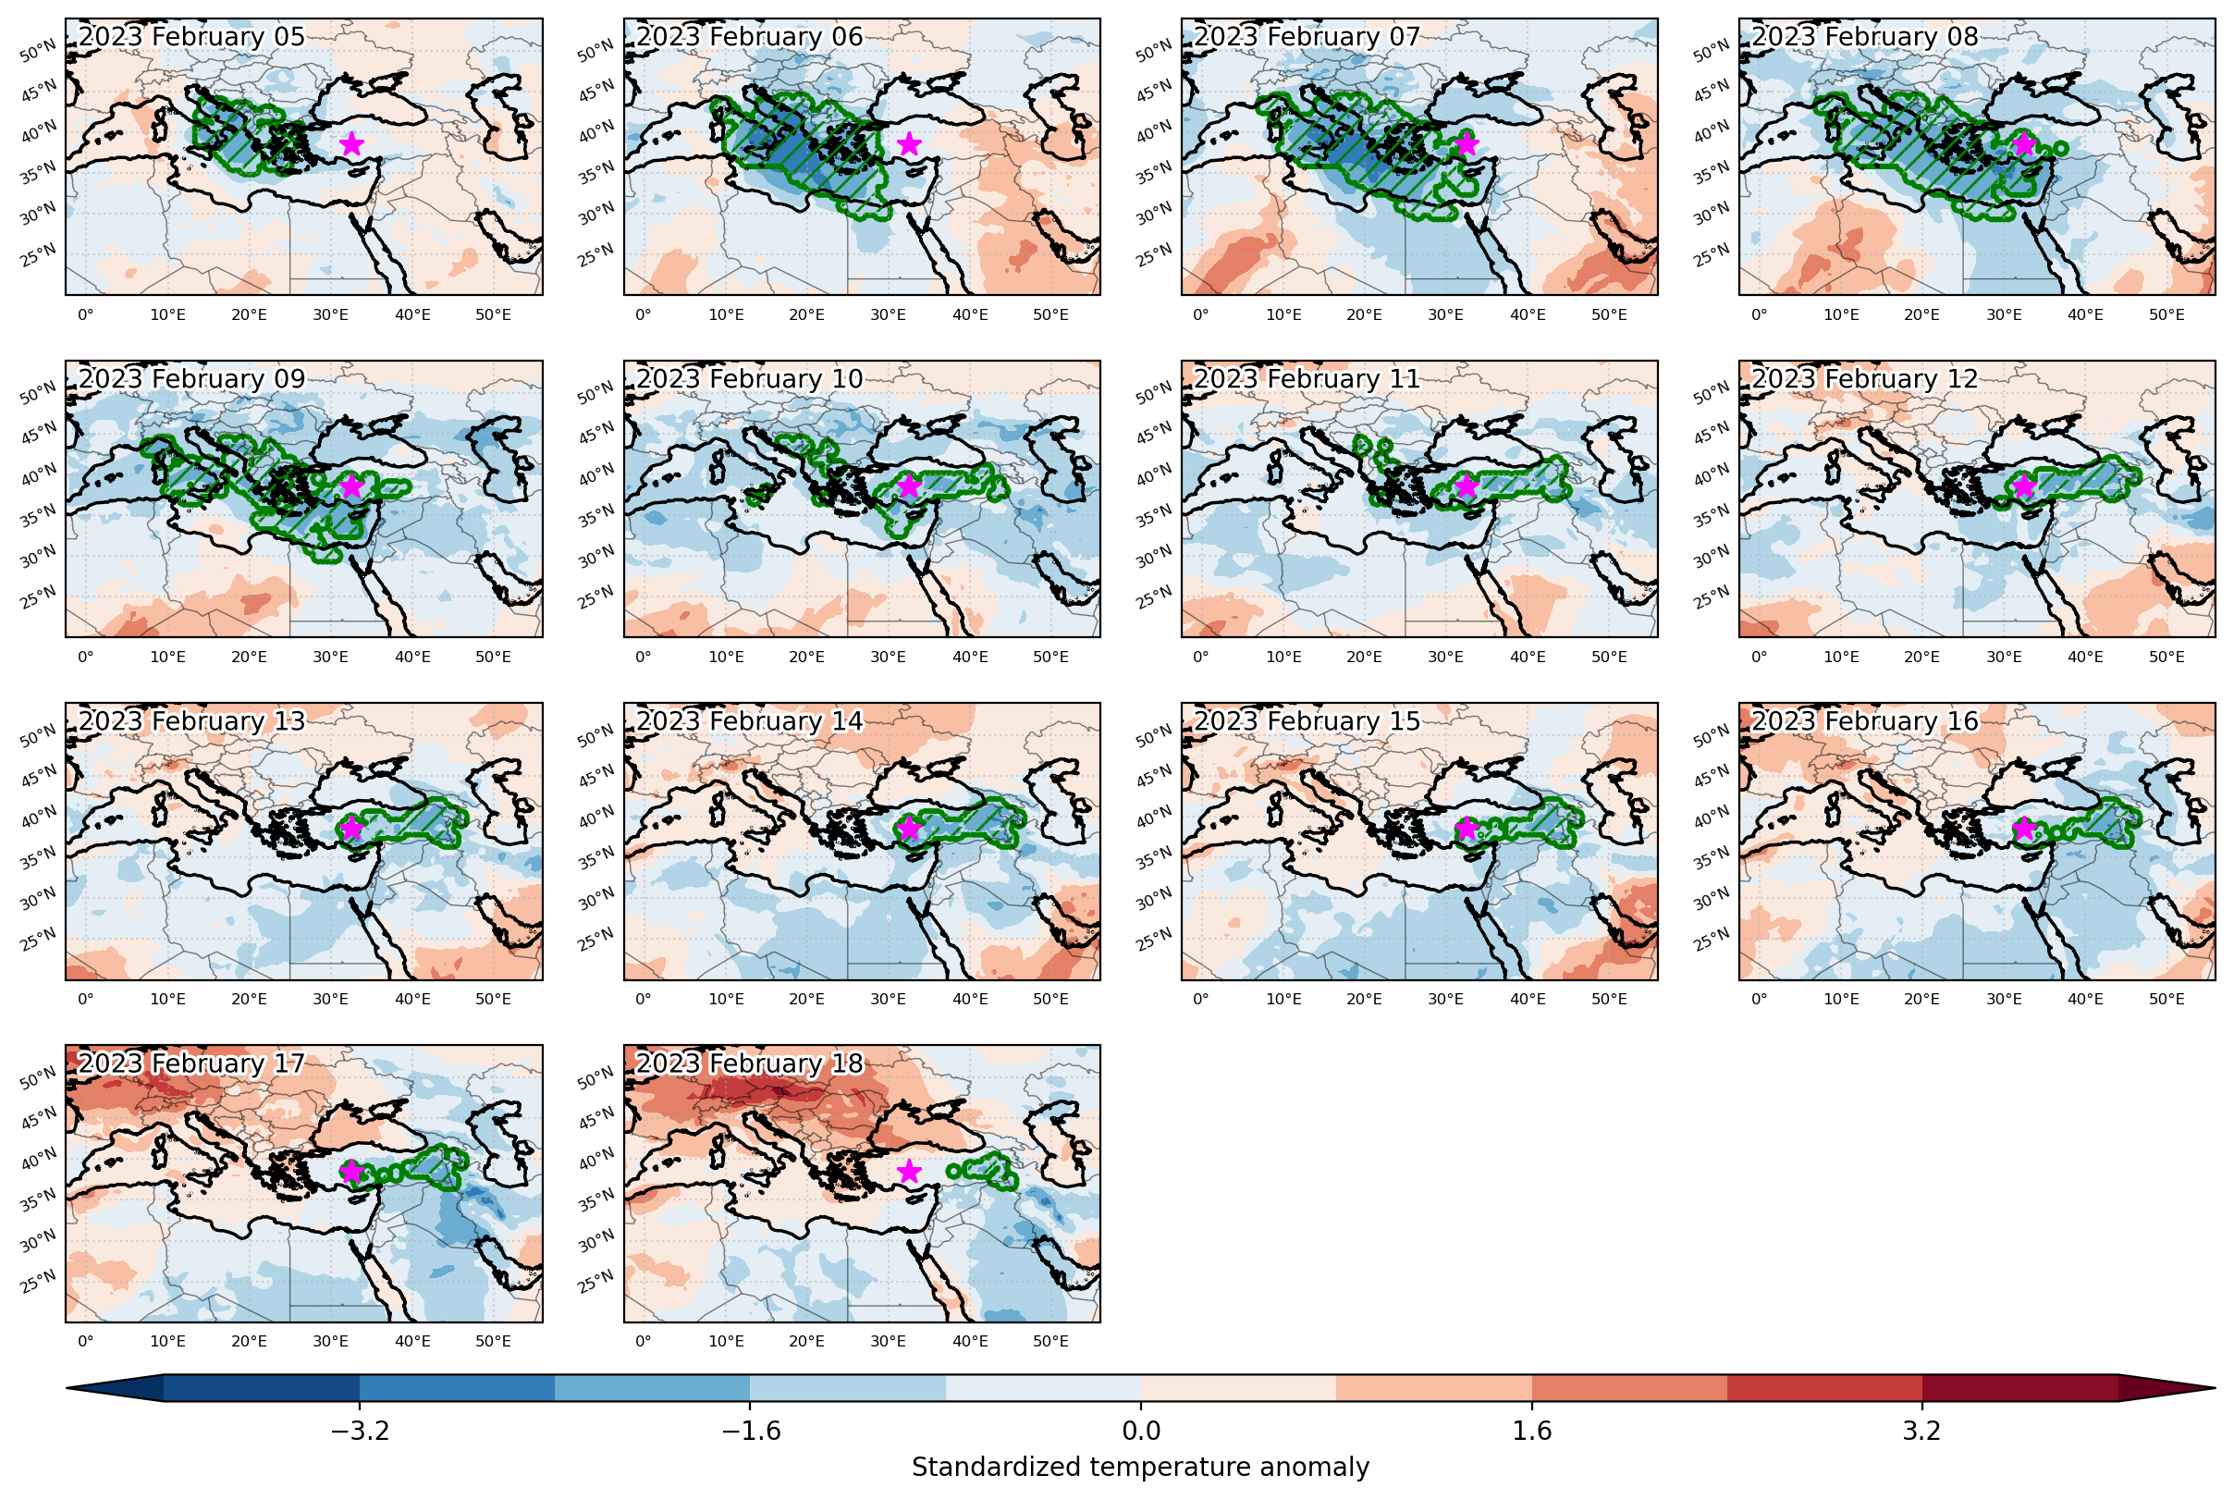
Fig. 1: Map of most extreme temperature anomalies (standardized) experienced during the event. The purple star indicates the center of the extreme event. Green hatching illustrates all areas under the effect of extremes at some time during the event.


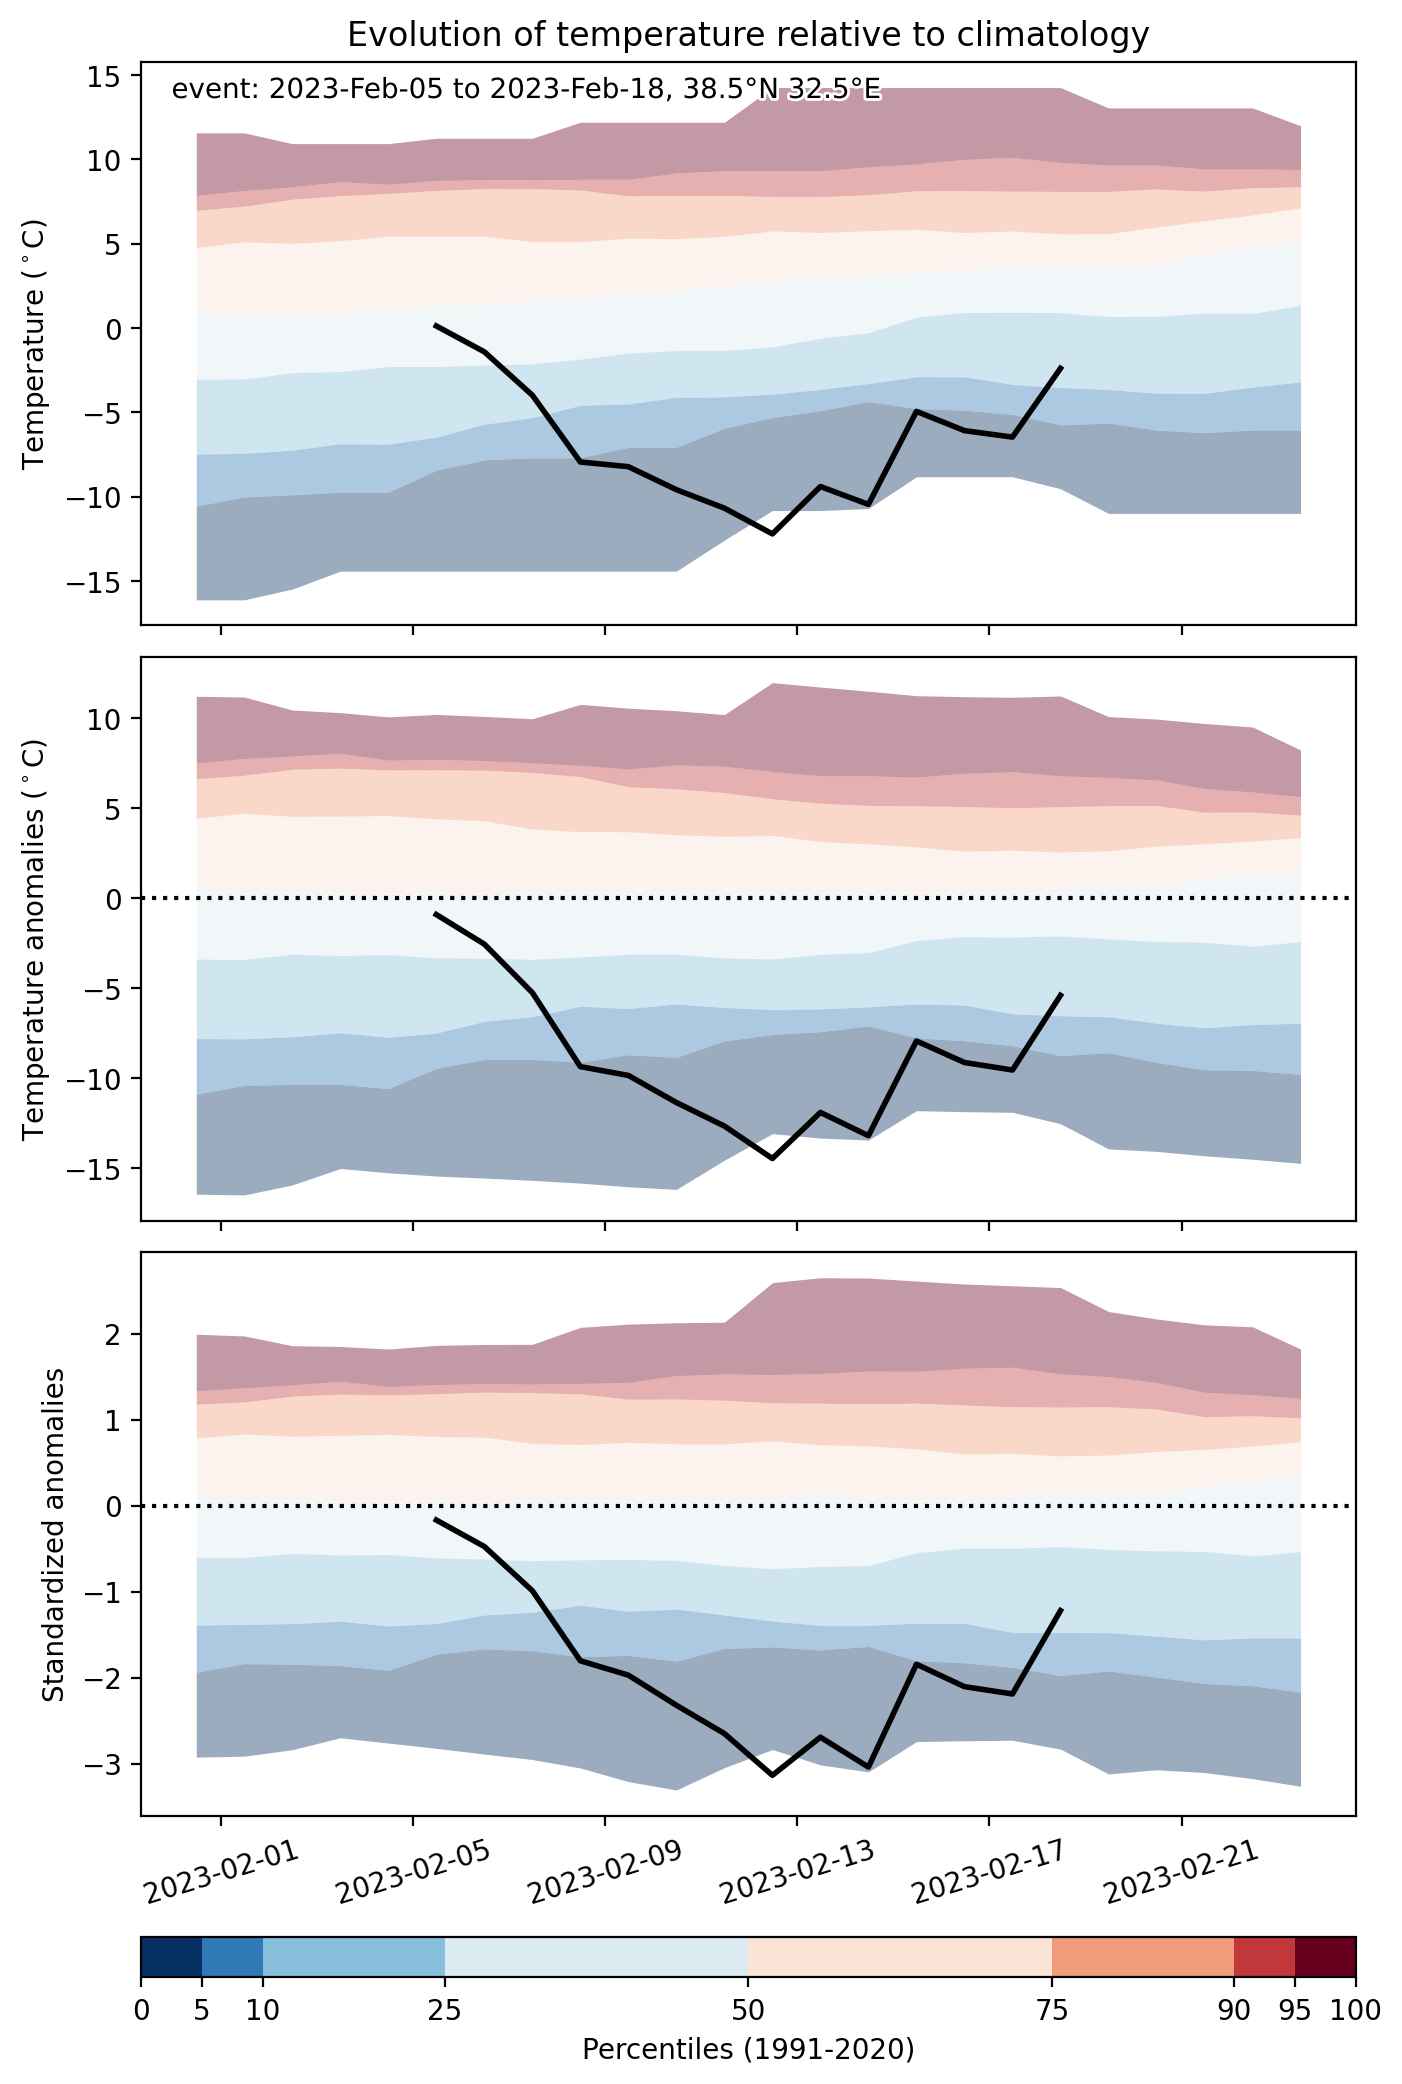
Fig. 2: Evolution of temperature at the center of the event. The climatological percentile distribution is illustrated with color shadings.


Fig. 3: Maps illustrating the evolution of standardized temperature anomalies during the event.

Event ID: Cold_spell_2023-Feb-05_to_2023-Feb-18_32.5_38.5

Cold spell occuring from March 04 2022 to April 01 2022 at 38.5°N 34.5°E

Download data: JSON

Event type: Cold spell

Countries affected (identified with ArcGIS Online; provided only for geographical reference):

  • Albania
  • Algeria
  • Armenia
  • Azerbaijan
  • Bosnia and Herzegovina
  • Bulgaria
  • Cameroon
  • Central African Republic
  • Chad
  • Croatia
  • Cyprus
  • Egypt
  • Eritrea
  • Georgia
  • Greece
  • Iran, Islamic Republic of
  • Iraq
  • Israel
  • Italy
  • Jordan
  • Kazakhstan
  • Kuwait
  • Lebanon
  • Libya
  • Moldova, Republic of
  • Montenegro
  • Niger
  • Nigeria
  • North Macedonia
  • Romania
  • Russian Federation
  • Saudi Arabia
  • Serbia
  • South Sudan
  • Sudan
  • Syrian Arab Republic
  • Tunisia
  • Turkmenistan
  • Türkiye
  • Ukraine
  • Uzbekistan

Duration: 29 days

Time span: March 04 2022 to April 01 2022

Statistics over entire affected area:

  • Mean temperature anomaly: -7.6 °C
  • Mean temperature: -1.0 °C
  • Minimum temperature anomaly: -19.0 °C
  • Minimum temperature: -39.0 °C

Event center: 38.5°N 34.5°E

Area affected: 20134870 km$^2$


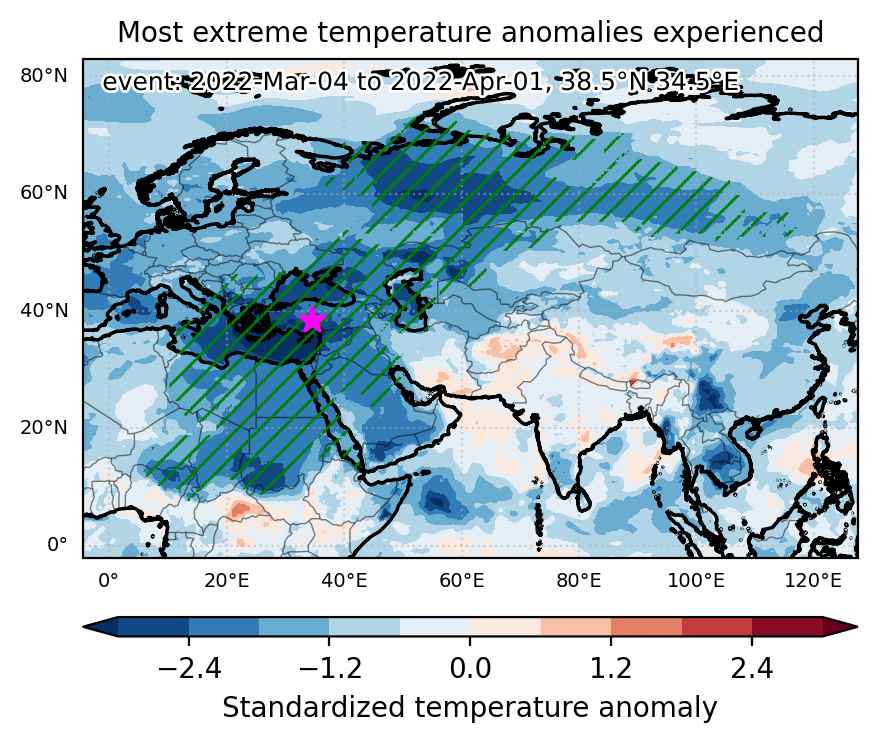
Fig. 1: Map of most extreme temperature anomalies (standardized) experienced during the event. The purple star indicates the center of the extreme event. Green hatching illustrates all areas under the effect of extremes at some time during the event.


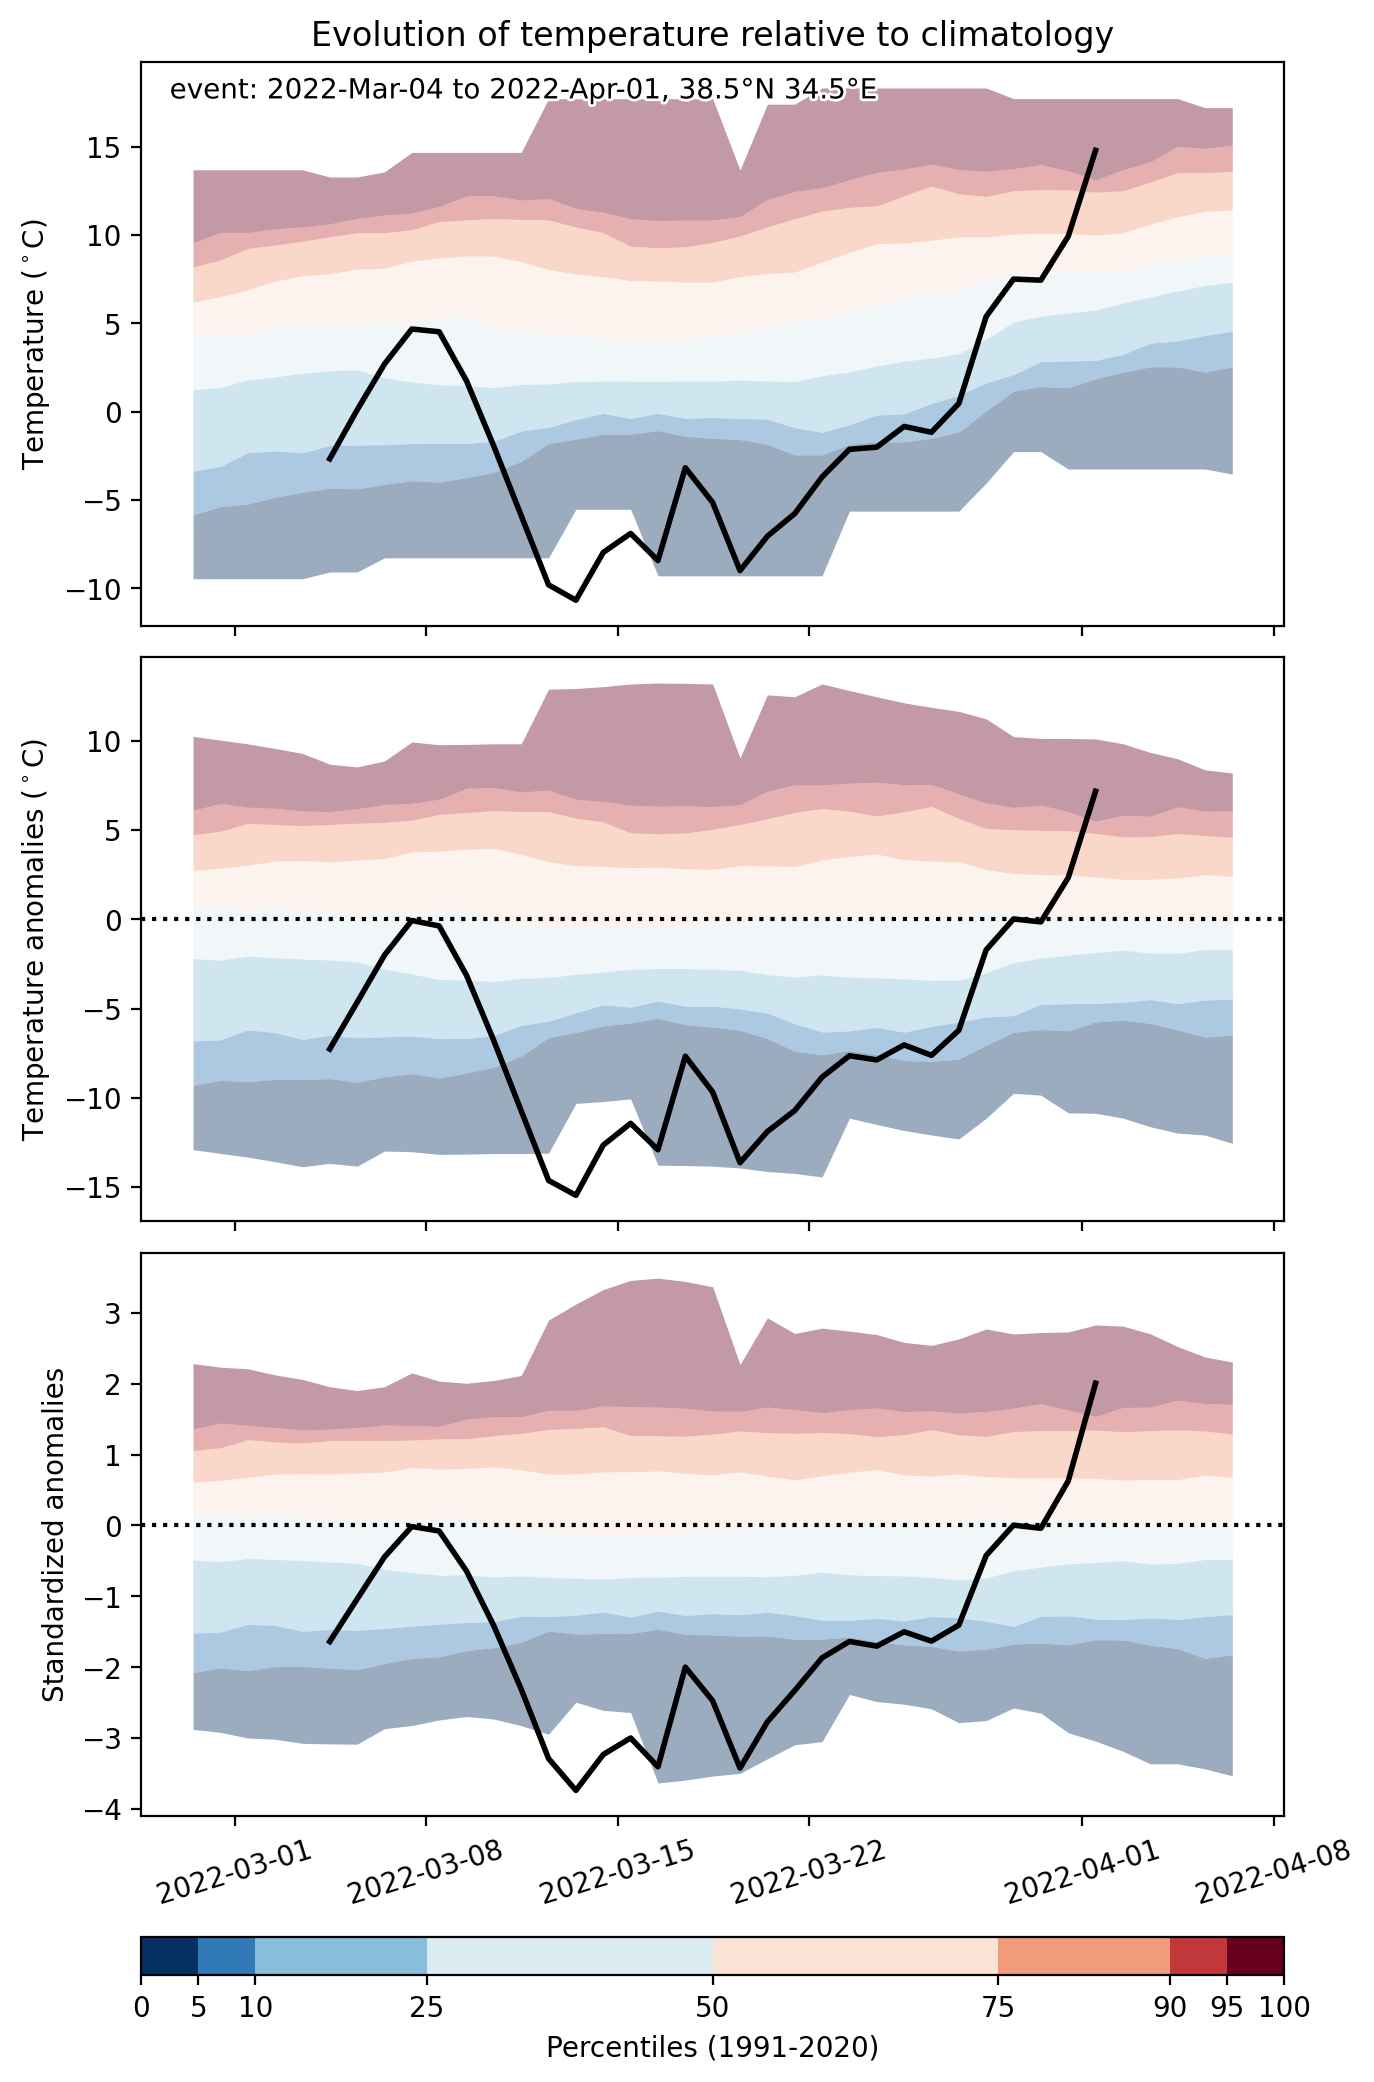
Fig. 2: Evolution of temperature at the center of the event. The climatological percentile distribution is illustrated with color shadings.


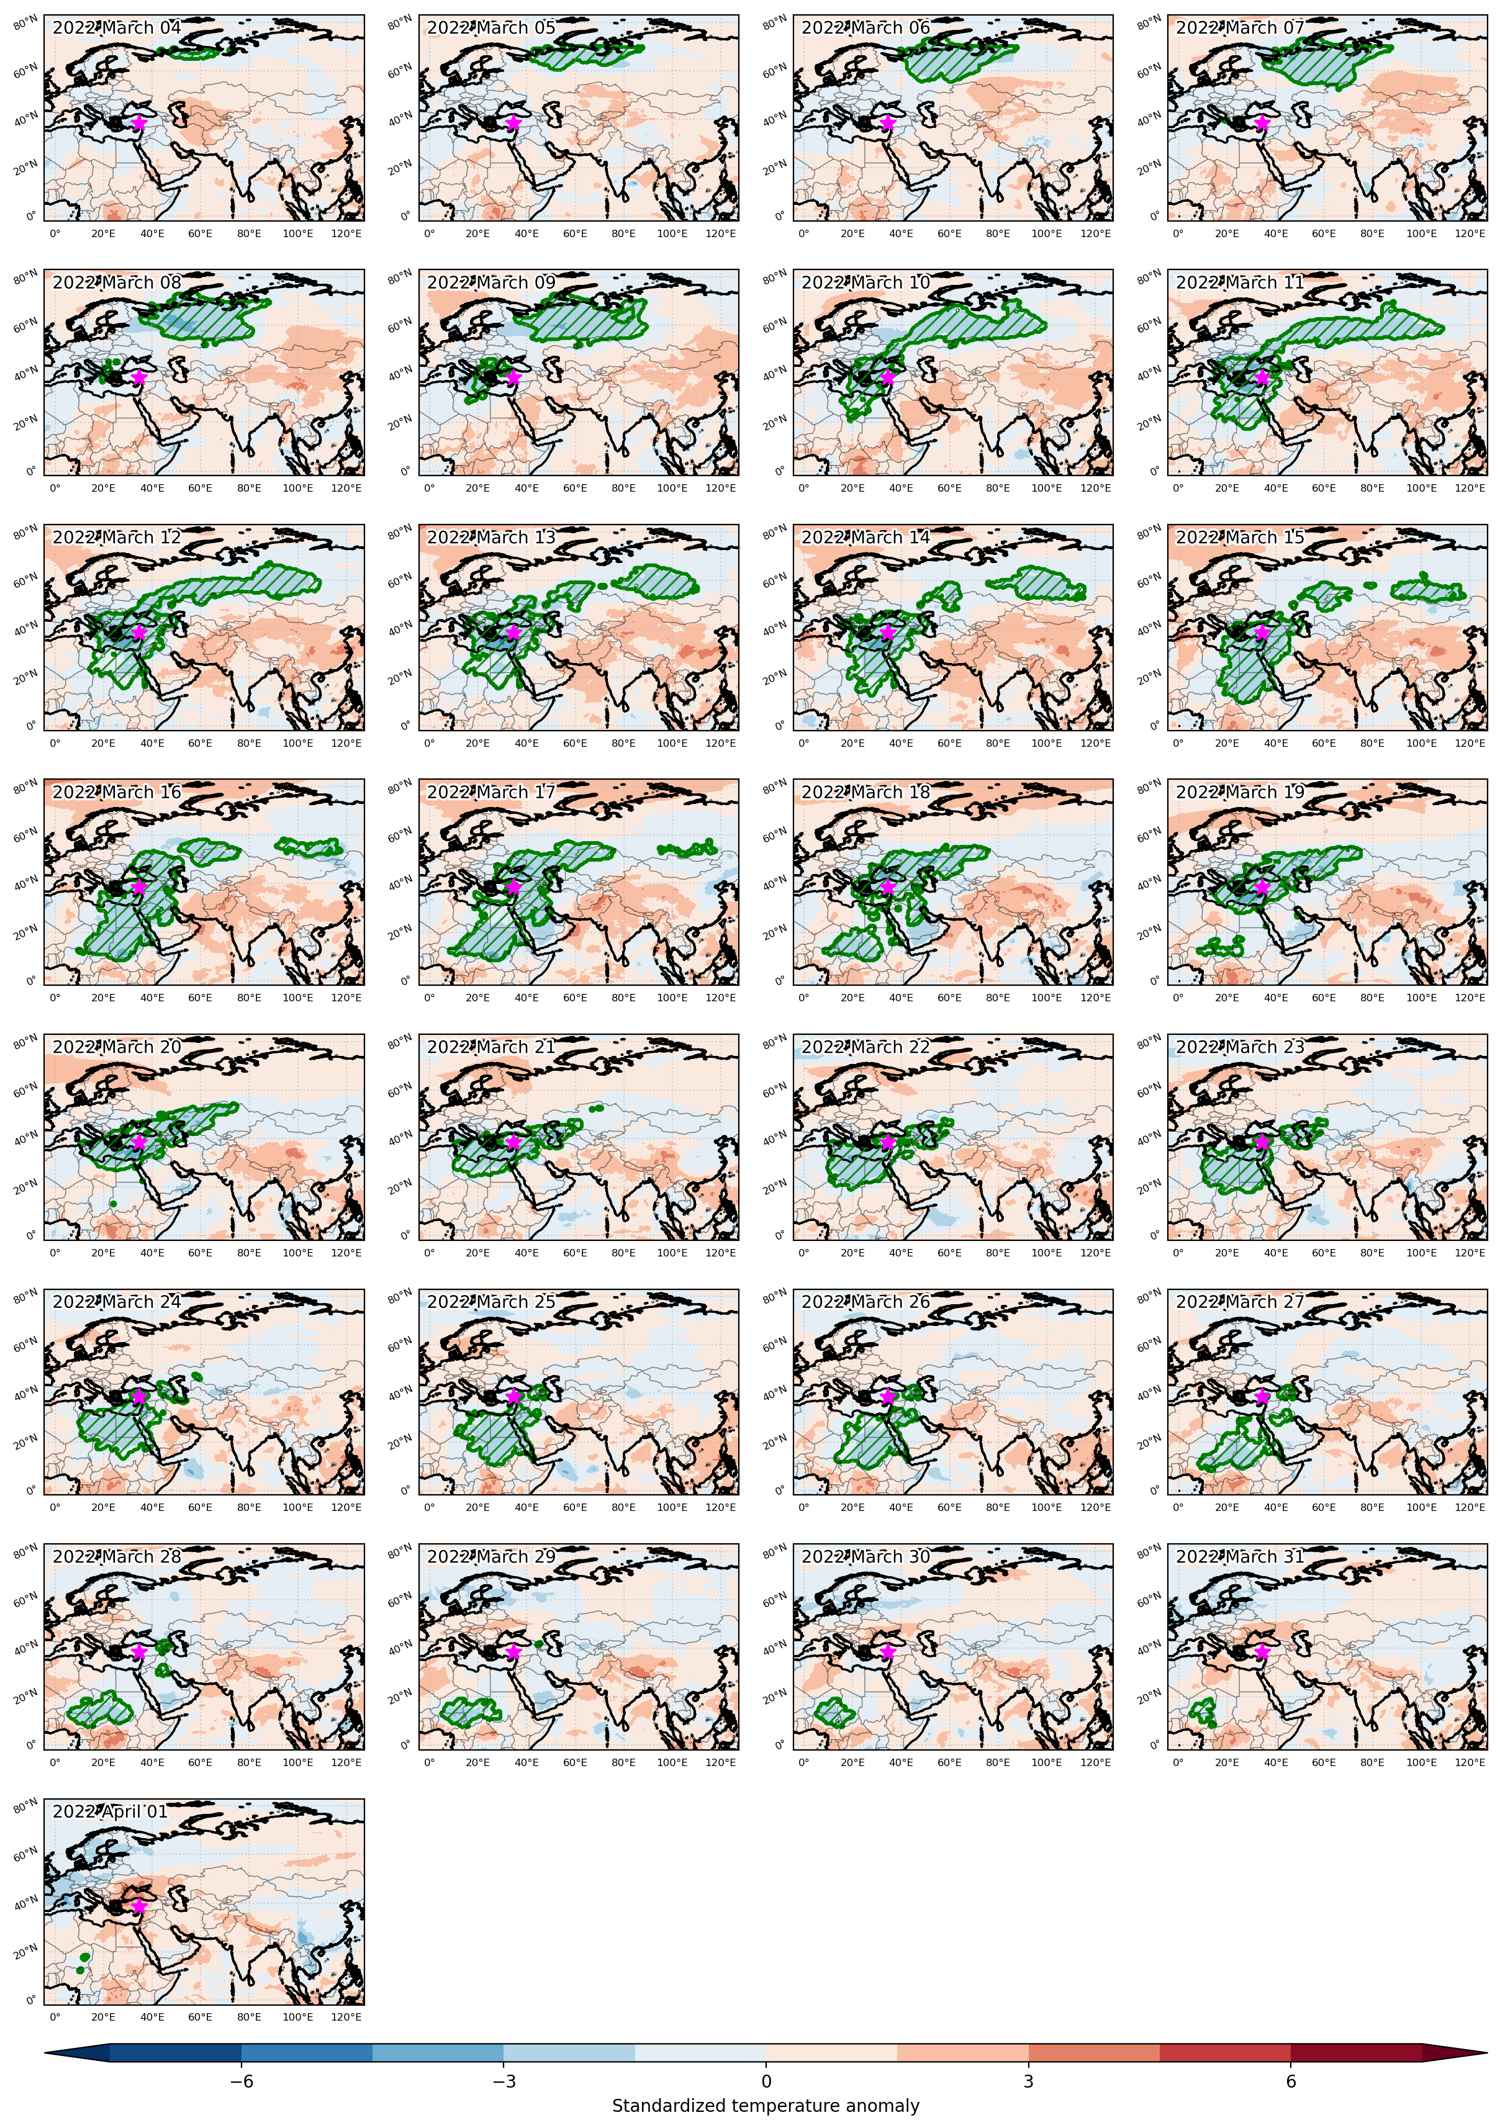
Fig. 3: Maps illustrating the evolution of standardized temperature anomalies during the event.

Event ID: Cold_spell_2022-Mar-04_to_2022-Apr-01_34.5_38.5

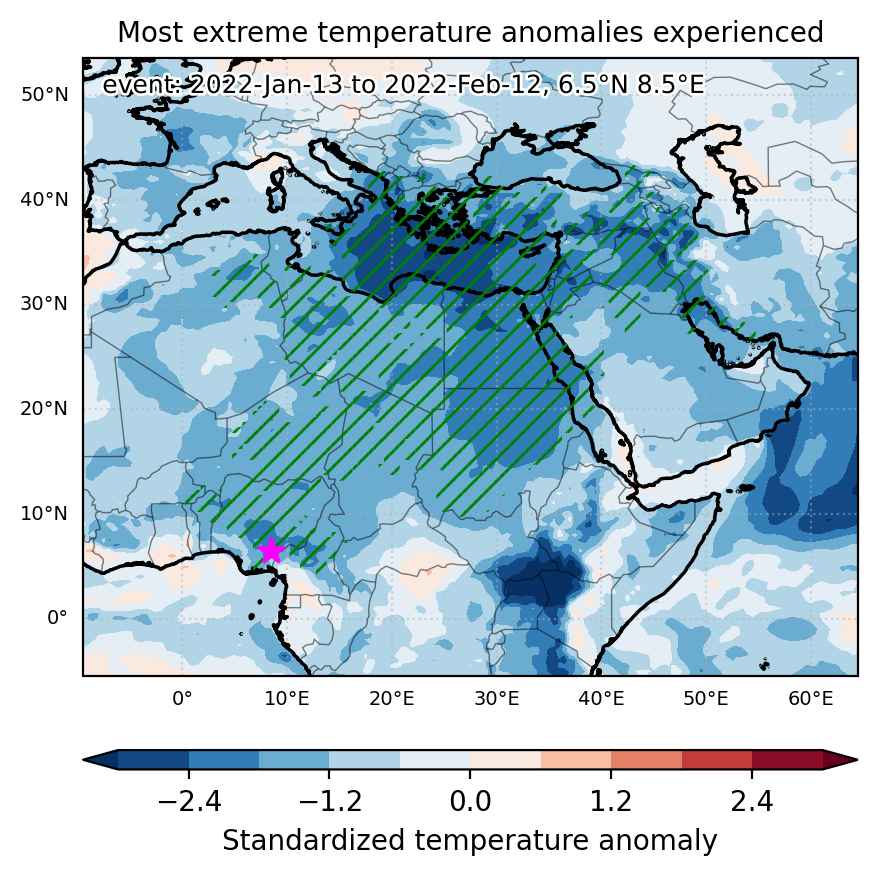
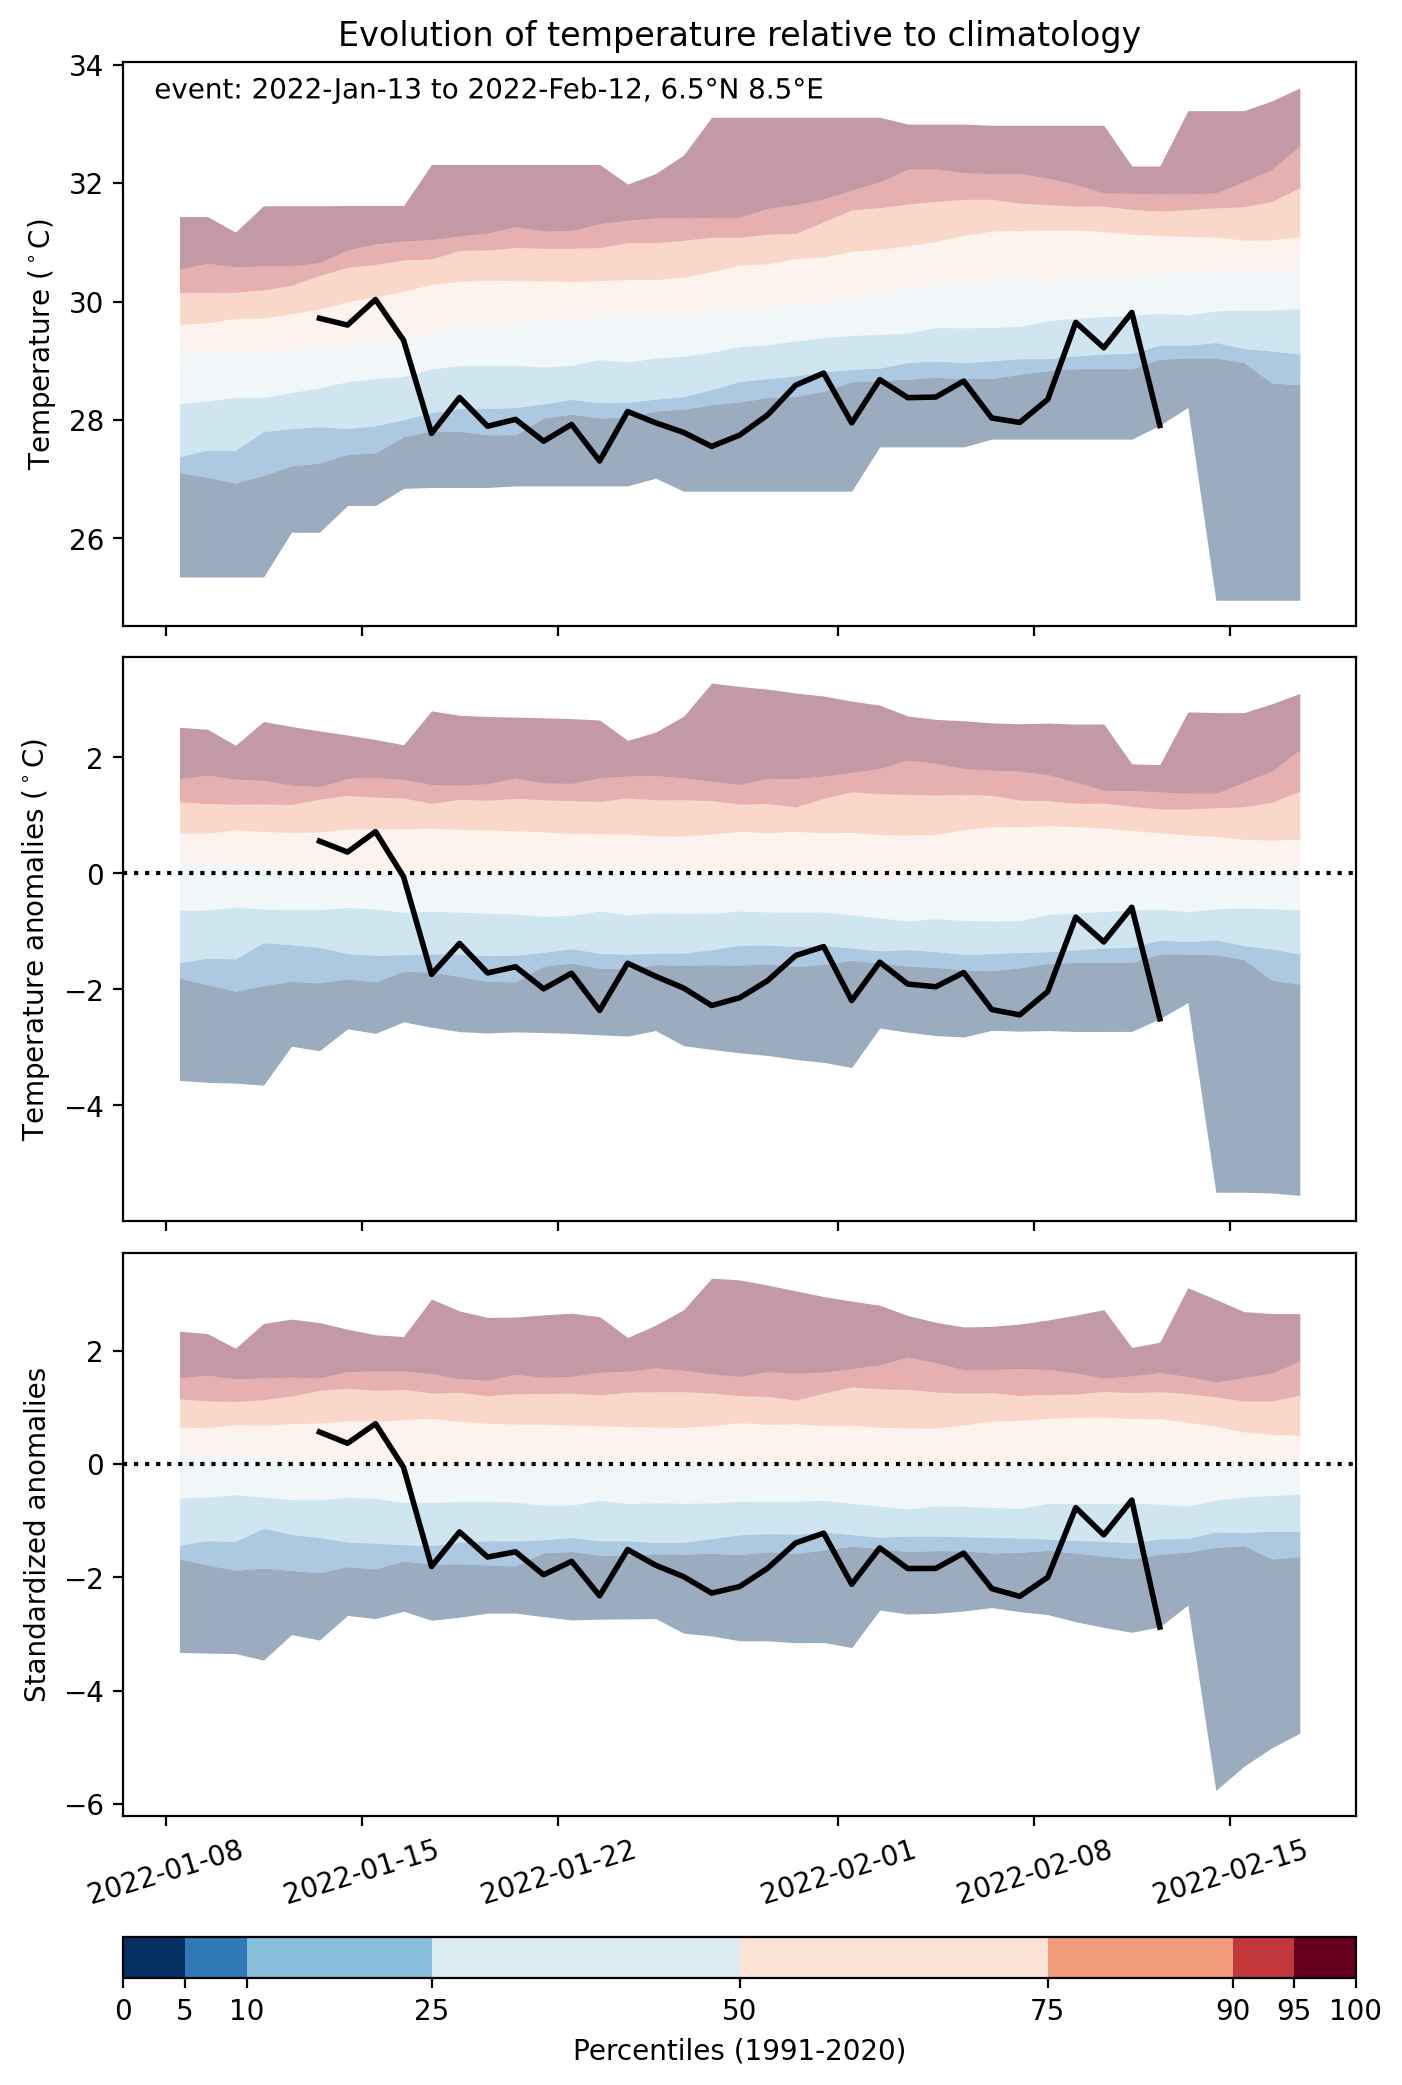
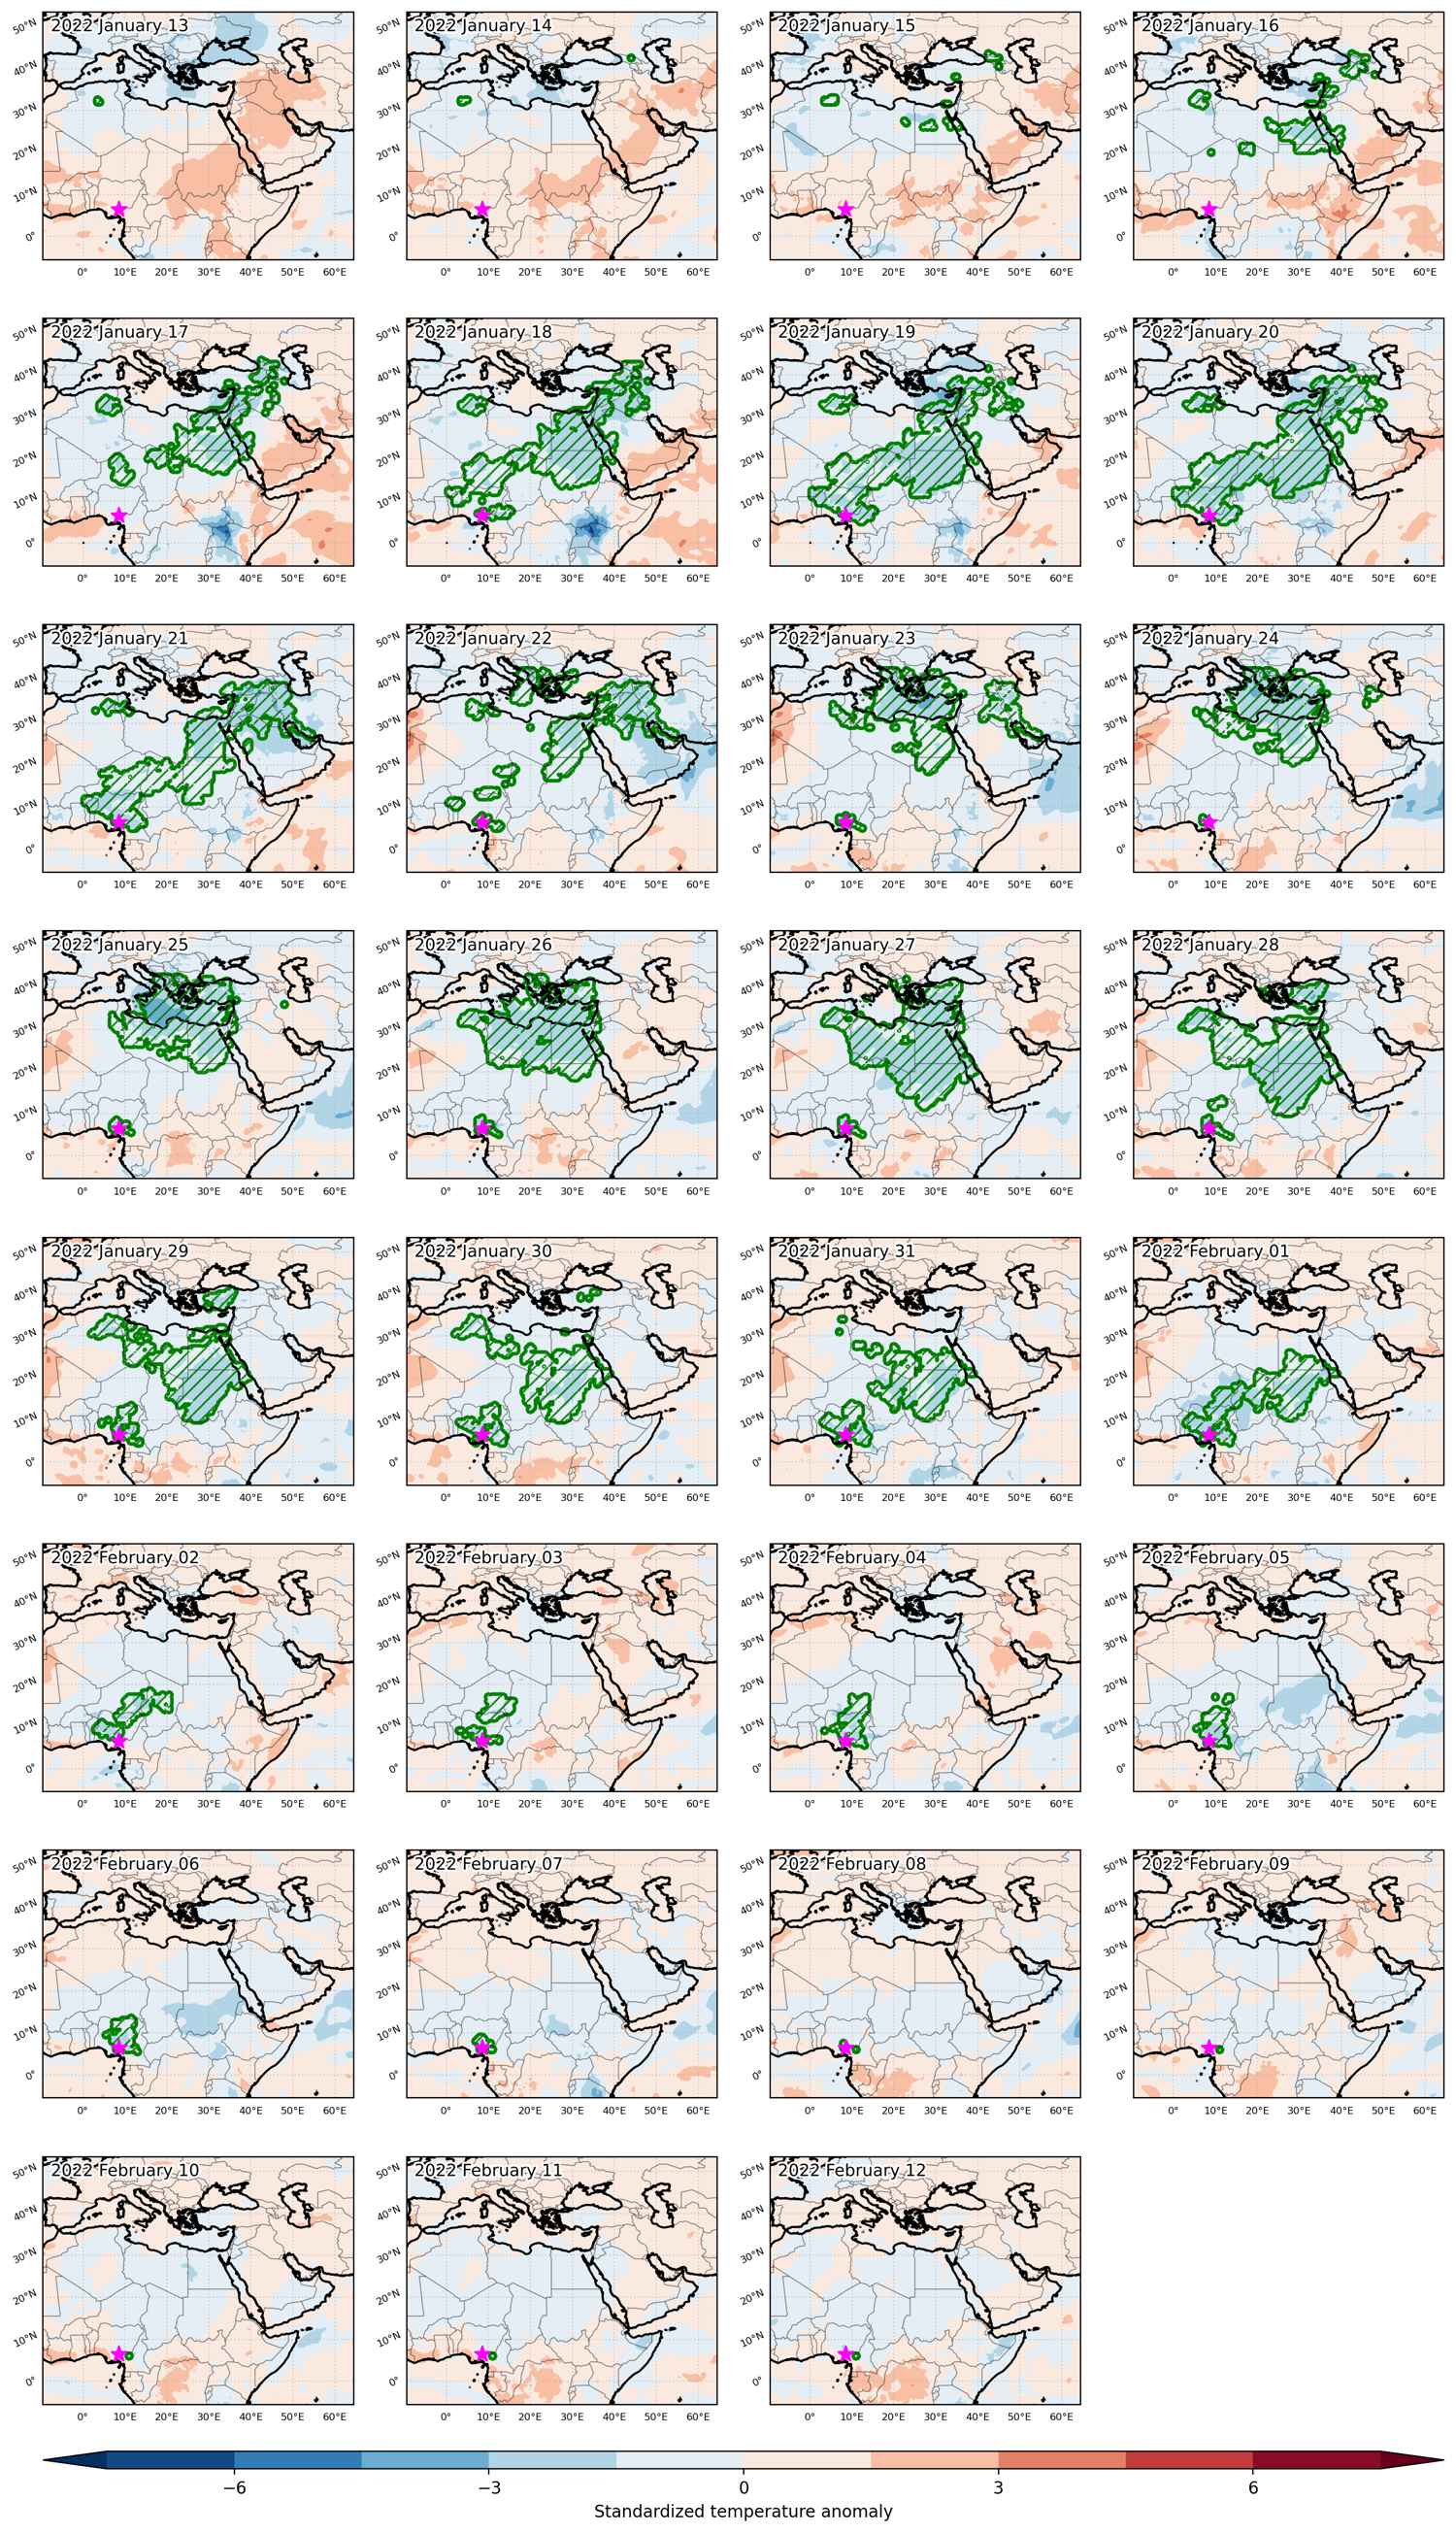
Cold spell occuring from January 13 2022 to February 12 2022 at 6.5°N 8.5°E

Download data: JSON

Event type: Cold spell

Countries affected (identified with ArcGIS Online; provided only for geographical reference):

  • Albania
  • Algeria
  • Armenia
  • Azerbaijan
  • Benin
  • Bulgaria
  • Burkina Faso
  • Cameroon
  • Central African Republic
  • Chad
  • Cyprus
  • Egypt
  • Georgia
  • Greece
  • Iran, Islamic Republic of
  • Iraq
  • Israel
  • Italy
  • Jordan
  • Kuwait
  • Lebanon
  • Libya
  • Montenegro
  • Niger
  • Nigeria
  • North Macedonia
  • Russian Federation
  • Saudi Arabia
  • Serbia
  • Sudan
  • Syrian Arab Republic
  • Togo
  • Tunisia
  • Türkiye

Duration: 31 days

Time span: January 13 2022 to February 12 2022

Statistics over entire affected area:

  • Mean temperature anomaly: -4.4 °C
  • Mean temperature: 10.5 °C
  • Minimum temperature anomaly: -18.5 °C
  • Minimum temperature: -21.2 °C

Event center: 6.5°N 8.5°E

Area affected: 9970939 km$^2$


Fig. 1: Map of most extreme temperature anomalies (standardized) experienced during the event. The purple star indicates the center of the extreme event. Green hatching illustrates all areas under the effect of extremes at some time during the event.


Fig. 2: Evolution of temperature at the center of the event. The climatological percentile distribution is illustrated with color shadings.


Fig. 3: Maps illustrating the evolution of standardized temperature anomalies during the event.

Event ID: Cold_spell_2022-Jan-13_to_2022-Feb-12_8.5_6.5

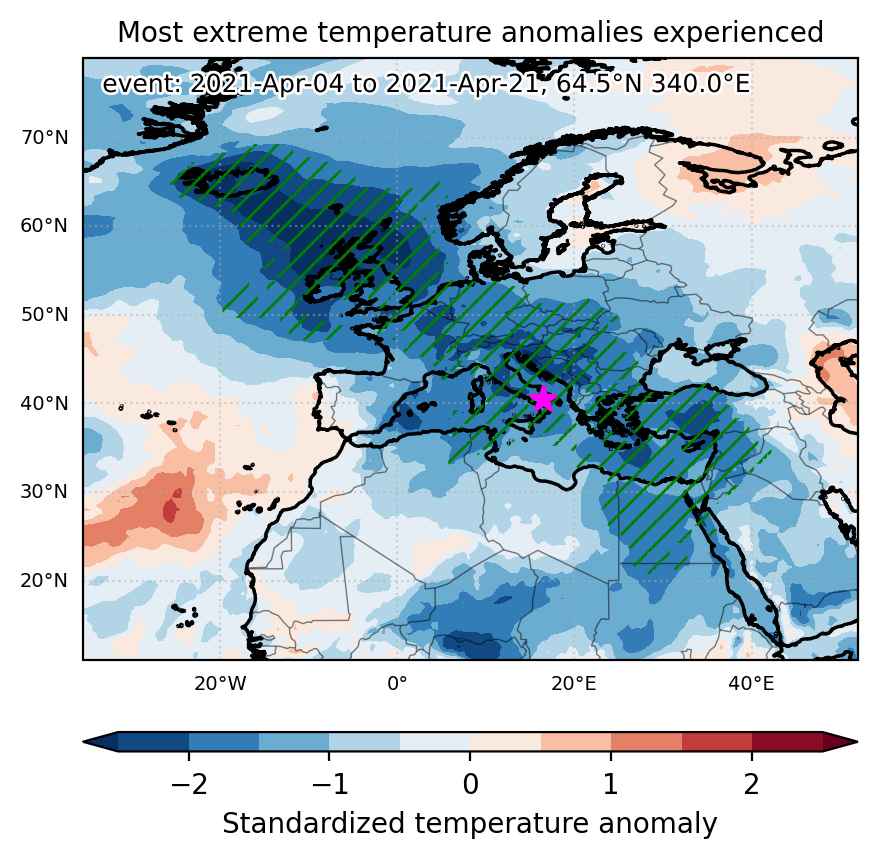
Cold spell occuring from April 04 2021 to April 21 2021 at 64.5°N 340.0°E

Download data: JSON

Event type: Cold spell

Countries affected (identified with ArcGIS Online; provided only for geographical reference):

  • Albania
  • Algeria
  • Austria
  • Belgium
  • Bosnia and Herzegovina
  • Bulgaria
  • Croatia
  • Cyprus
  • Czechia
  • Egypt
  • France
  • Germany
  • Greece
  • Hungary
  • Iceland
  • Iraq
  • Ireland
  • Israel
  • Italy
  • Jordan
  • Lebanon
  • Libya
  • Luxembourg
  • Montenegro
  • Netherlands
  • North Macedonia
  • Poland
  • Romania
  • Saudi Arabia
  • Serbia
  • Slovakia
  • Slovenia
  • Sudan
  • Switzerland
  • Syrian Arab Republic
  • Tunisia
  • Türkiye
  • Ukraine
  • United Kingdom

Duration: 18 days

Time span: April 04 2021 to April 21 2021

Statistics over entire affected area:

  • Mean temperature anomaly: -4.9 °C
  • Mean temperature: 6.6 °C
  • Minimum temperature anomaly: -11.6 °C
  • Minimum temperature: -14.4 °C

Event center: 40.5°N 16.5°E

Area affected: 7702208 km$^2$


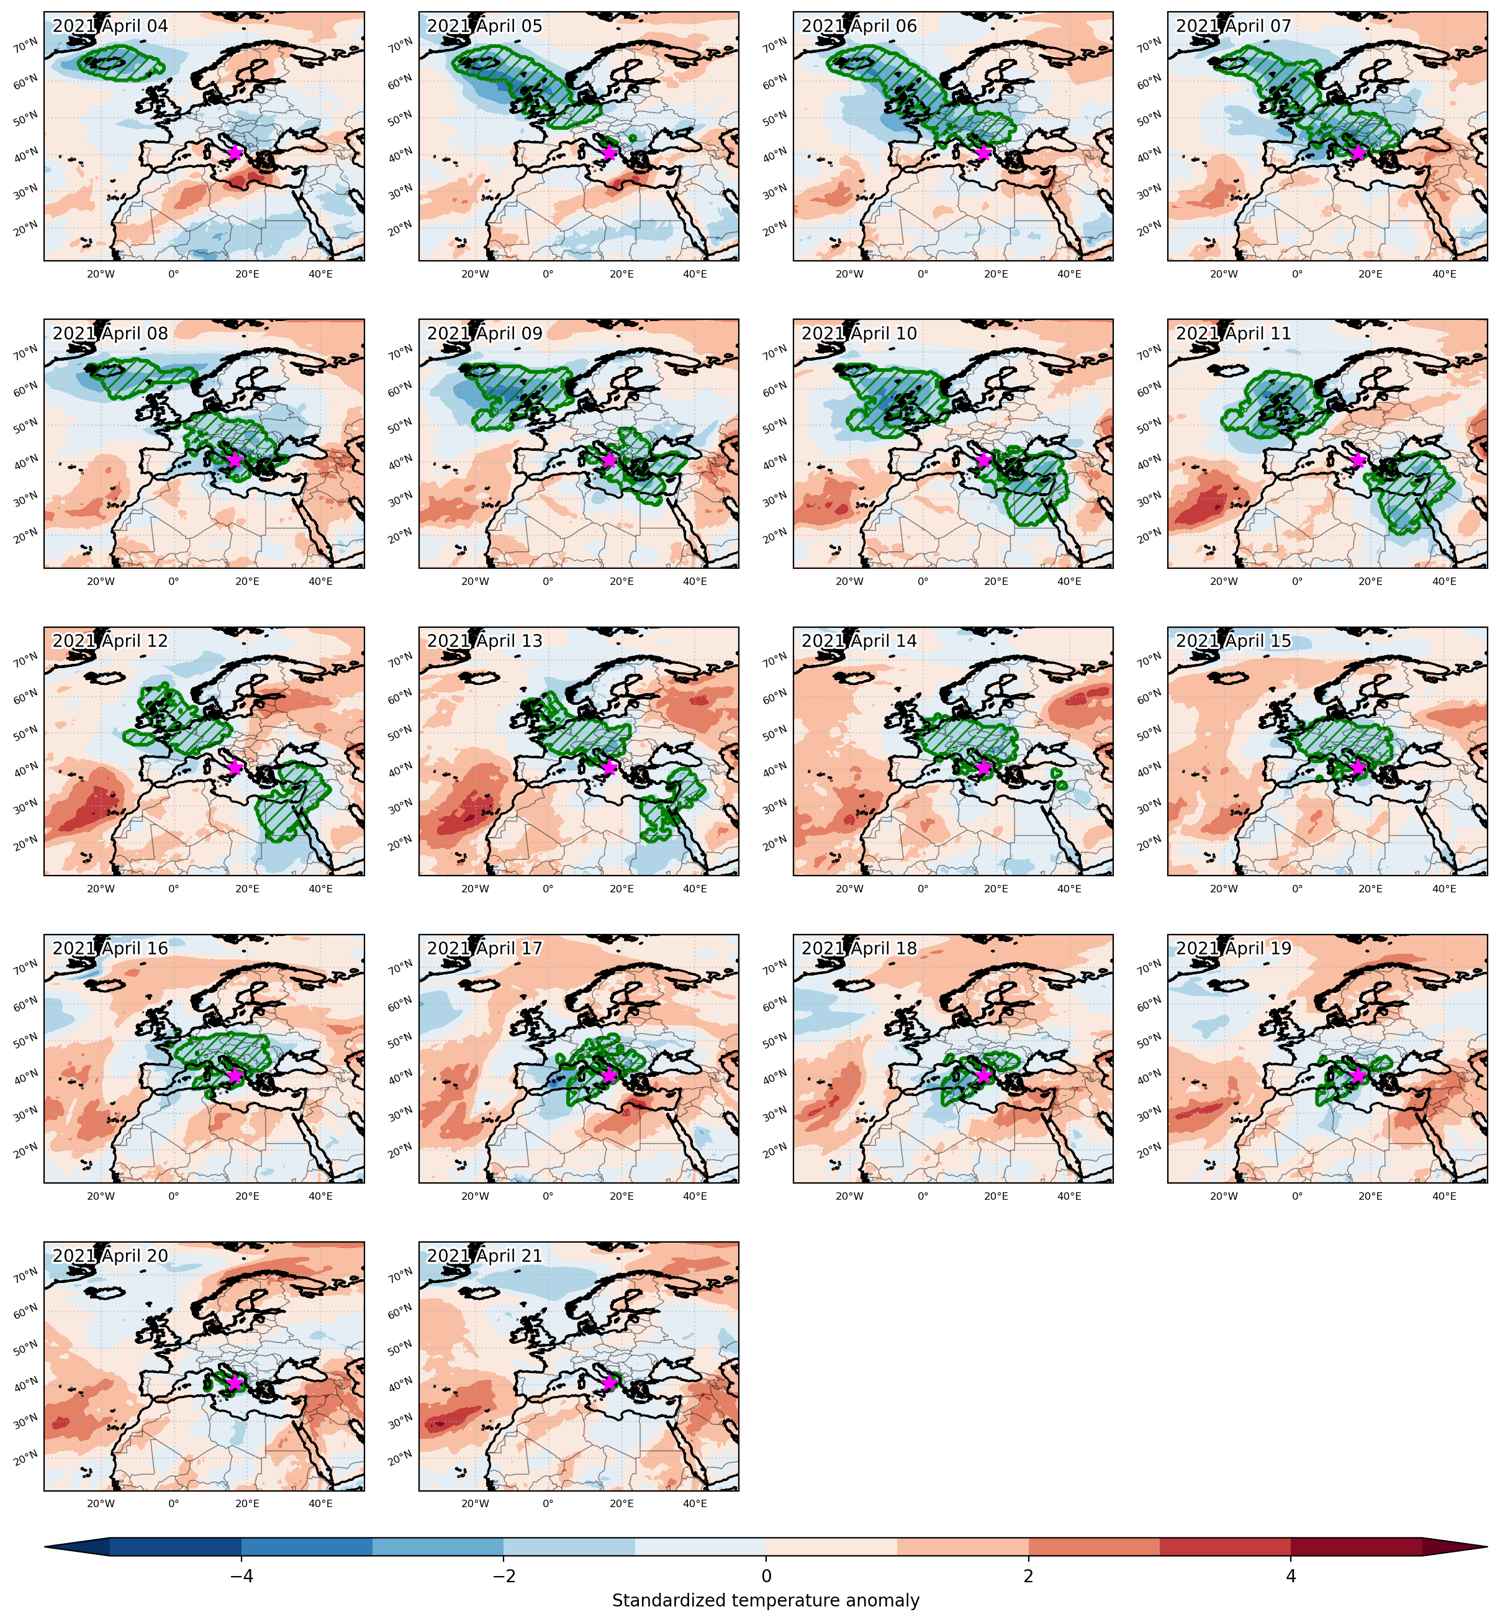
Fig. 1: Map of most extreme temperature anomalies (standardized) experienced during the event. The purple star indicates the center of the extreme event. Green hatching illustrates all areas under the effect of extremes at some time during the event.


Fig. 2: Evolution of temperature at the center of the event. The climatological percentile distribution is illustrated with color shadings.


Fig. 3: Maps illustrating the evolution of standardized temperature anomalies during the event.

Event ID: Cold_spell_2021-Apr-04_to_2021-Apr-21_340.0_64.5

Cold spell occuring from March 15 2021 to April 06 2021 at 11.5°N 11.0°E

Download data: JSON

Event type: Cold spell

Countries affected (identified with ArcGIS Online; provided only for geographical reference):

  • Albania
  • Algeria
  • Andorra
  • Austria
  • Benin
  • Bosnia and Herzegovina
  • Burkina Faso
  • Cameroon
  • Central African Republic
  • Chad
  • Croatia
  • Cyprus
  • Czechia
  • Egypt
  • France
  • Germany
  • Greece
  • Hungary
  • Italy
  • Libya
  • Mali
  • Mauritania
  • Morocco
  • Niger
  • Nigeria
  • North Macedonia
  • Poland
  • Serbia
  • Slovakia
  • Slovenia
  • South Sudan
  • Spain
  • Sudan
  • Switzerland
  • Tunisia
  • Türkiye

Duration: 23 days

Time span: March 15 2021 to April 06 2021

Statistics over entire affected area:

  • Mean temperature anomaly: -4.9 °C
  • Mean temperature: 17.3 °C
  • Minimum temperature anomaly: -11.8 °C
  • Minimum temperature: -15.2 °C

Event center: 11.5°N 11.0°E

Area affected: 11794082 km$^2$


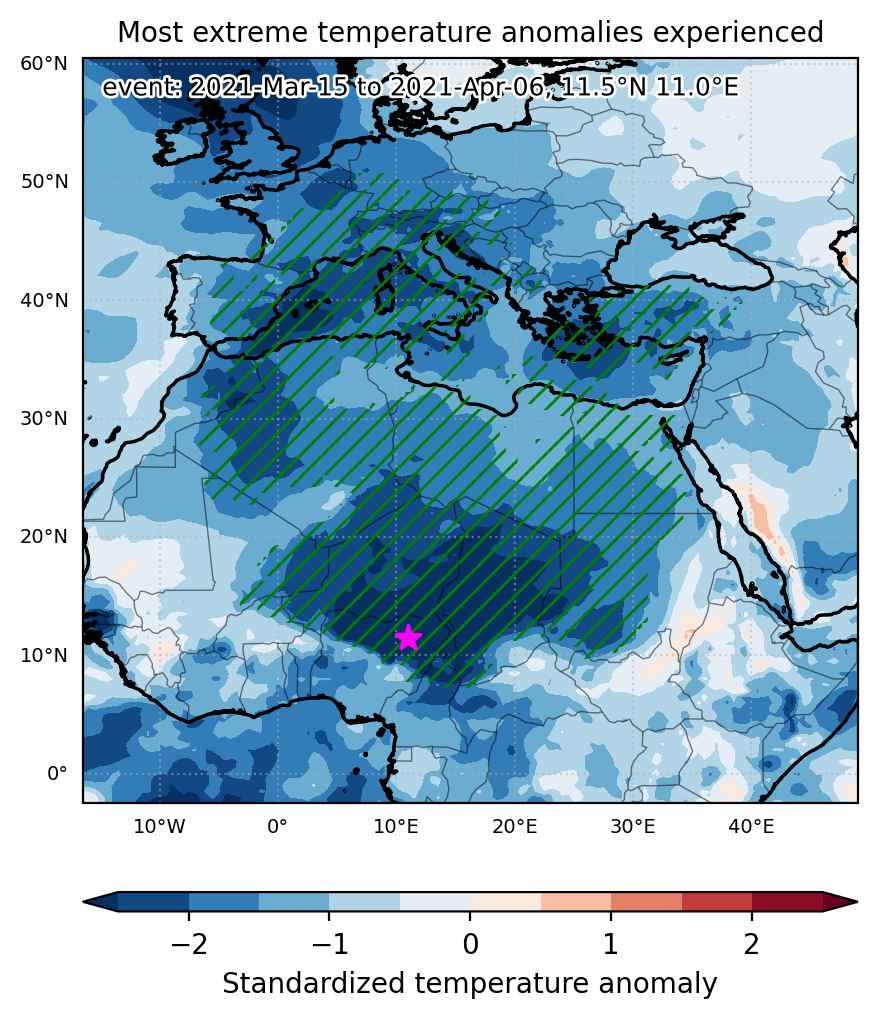
Fig. 1: Map of most extreme temperature anomalies (standardized) experienced during the event. The purple star indicates the center of the extreme event. Green hatching illustrates all areas under the effect of extremes at some time during the event.


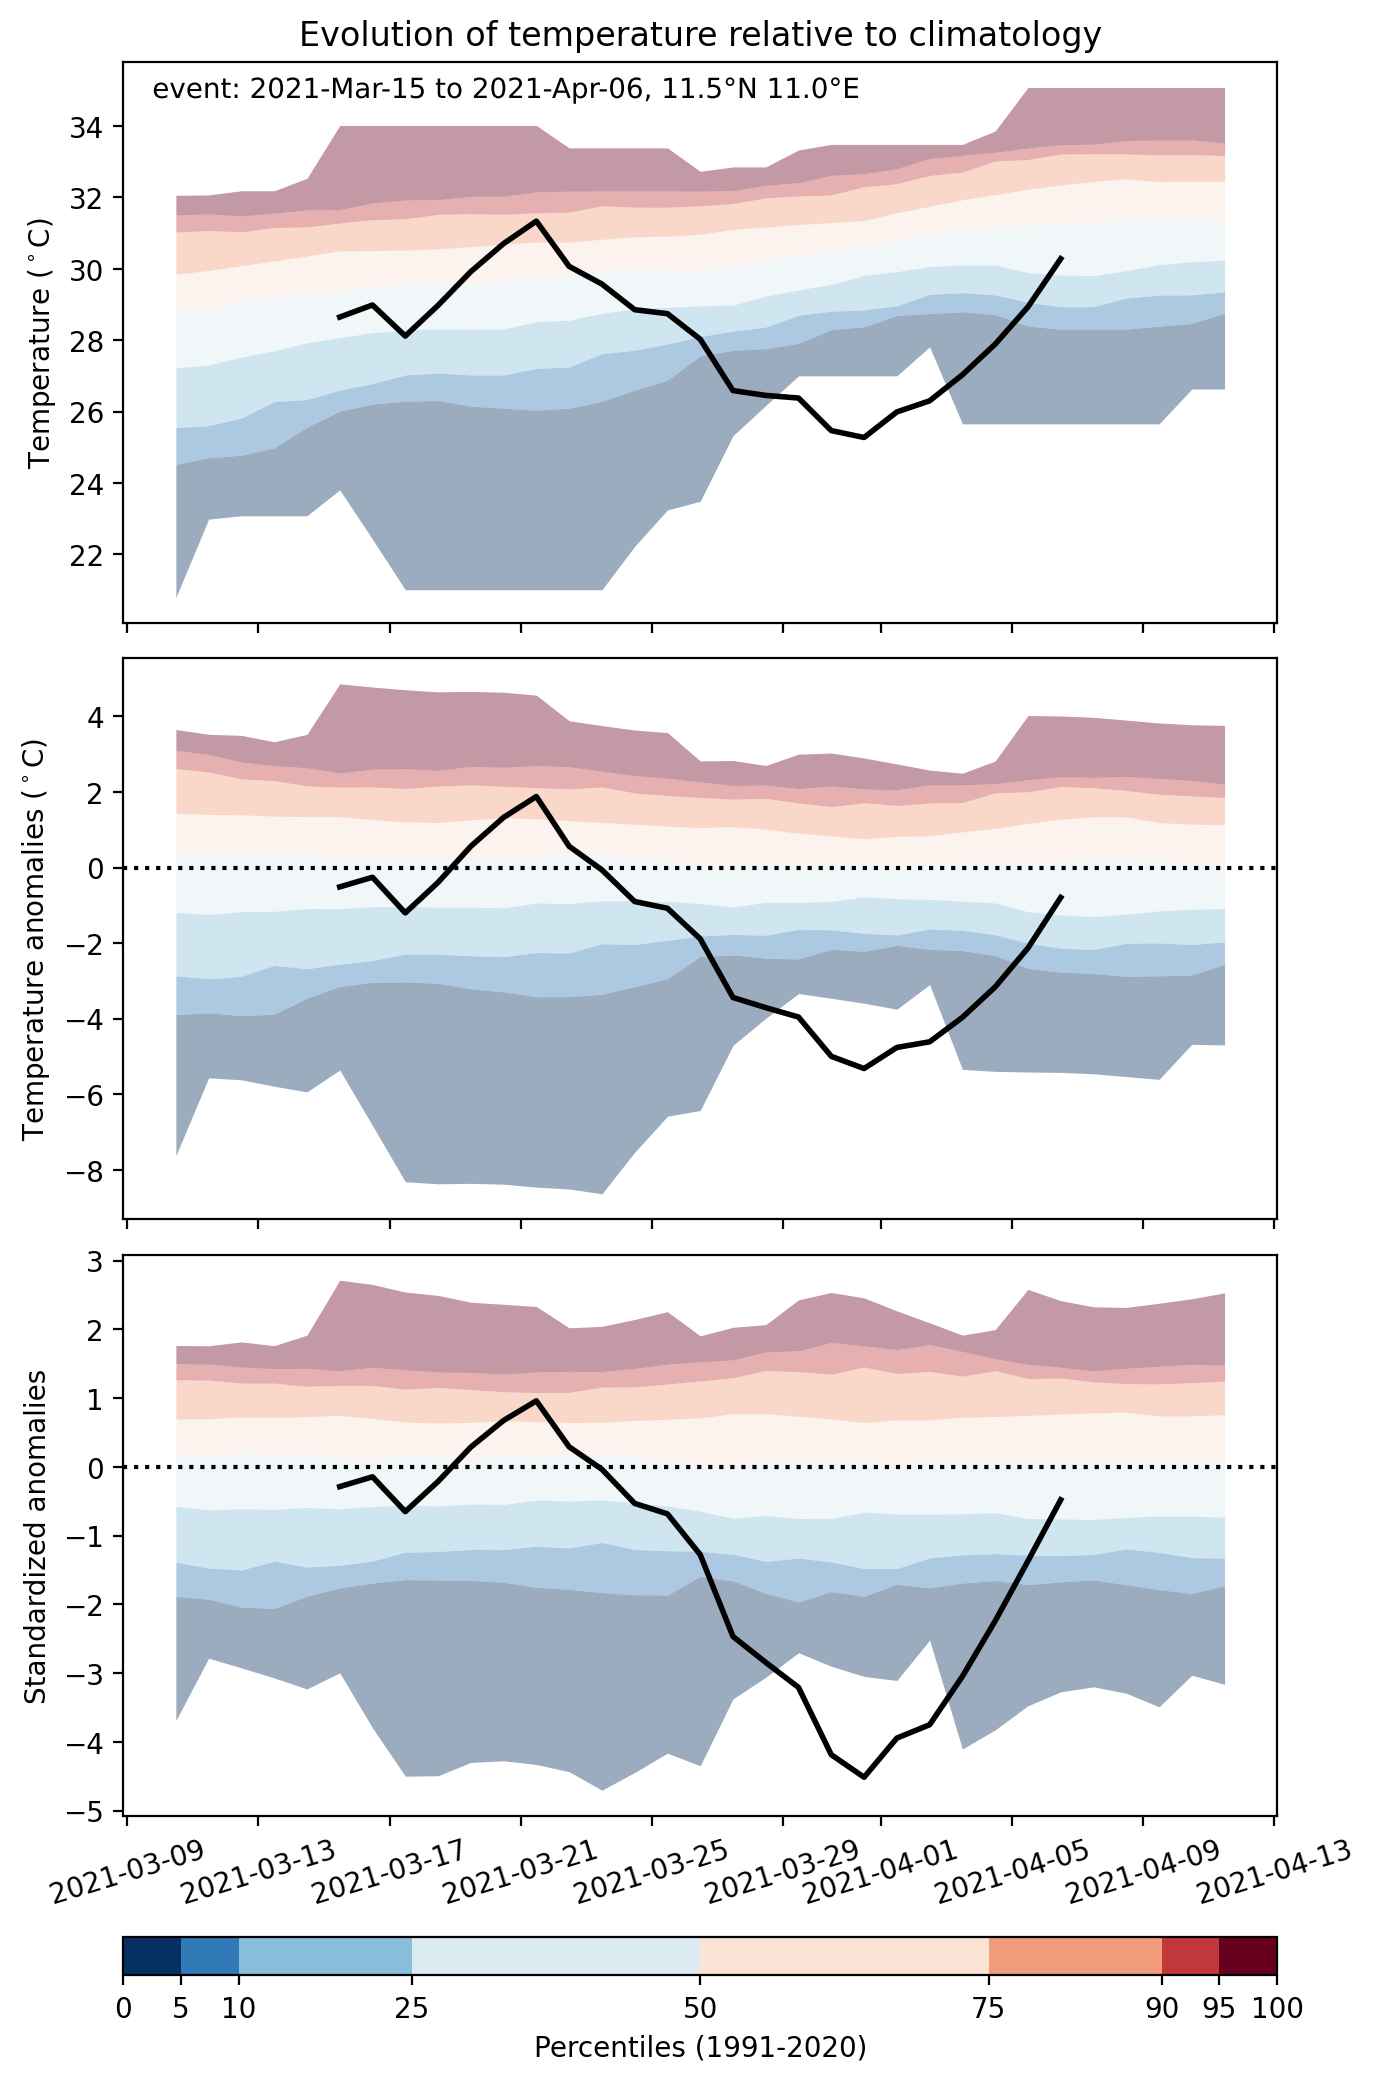
Fig. 2: Evolution of temperature at the center of the event. The climatological percentile distribution is illustrated with color shadings.


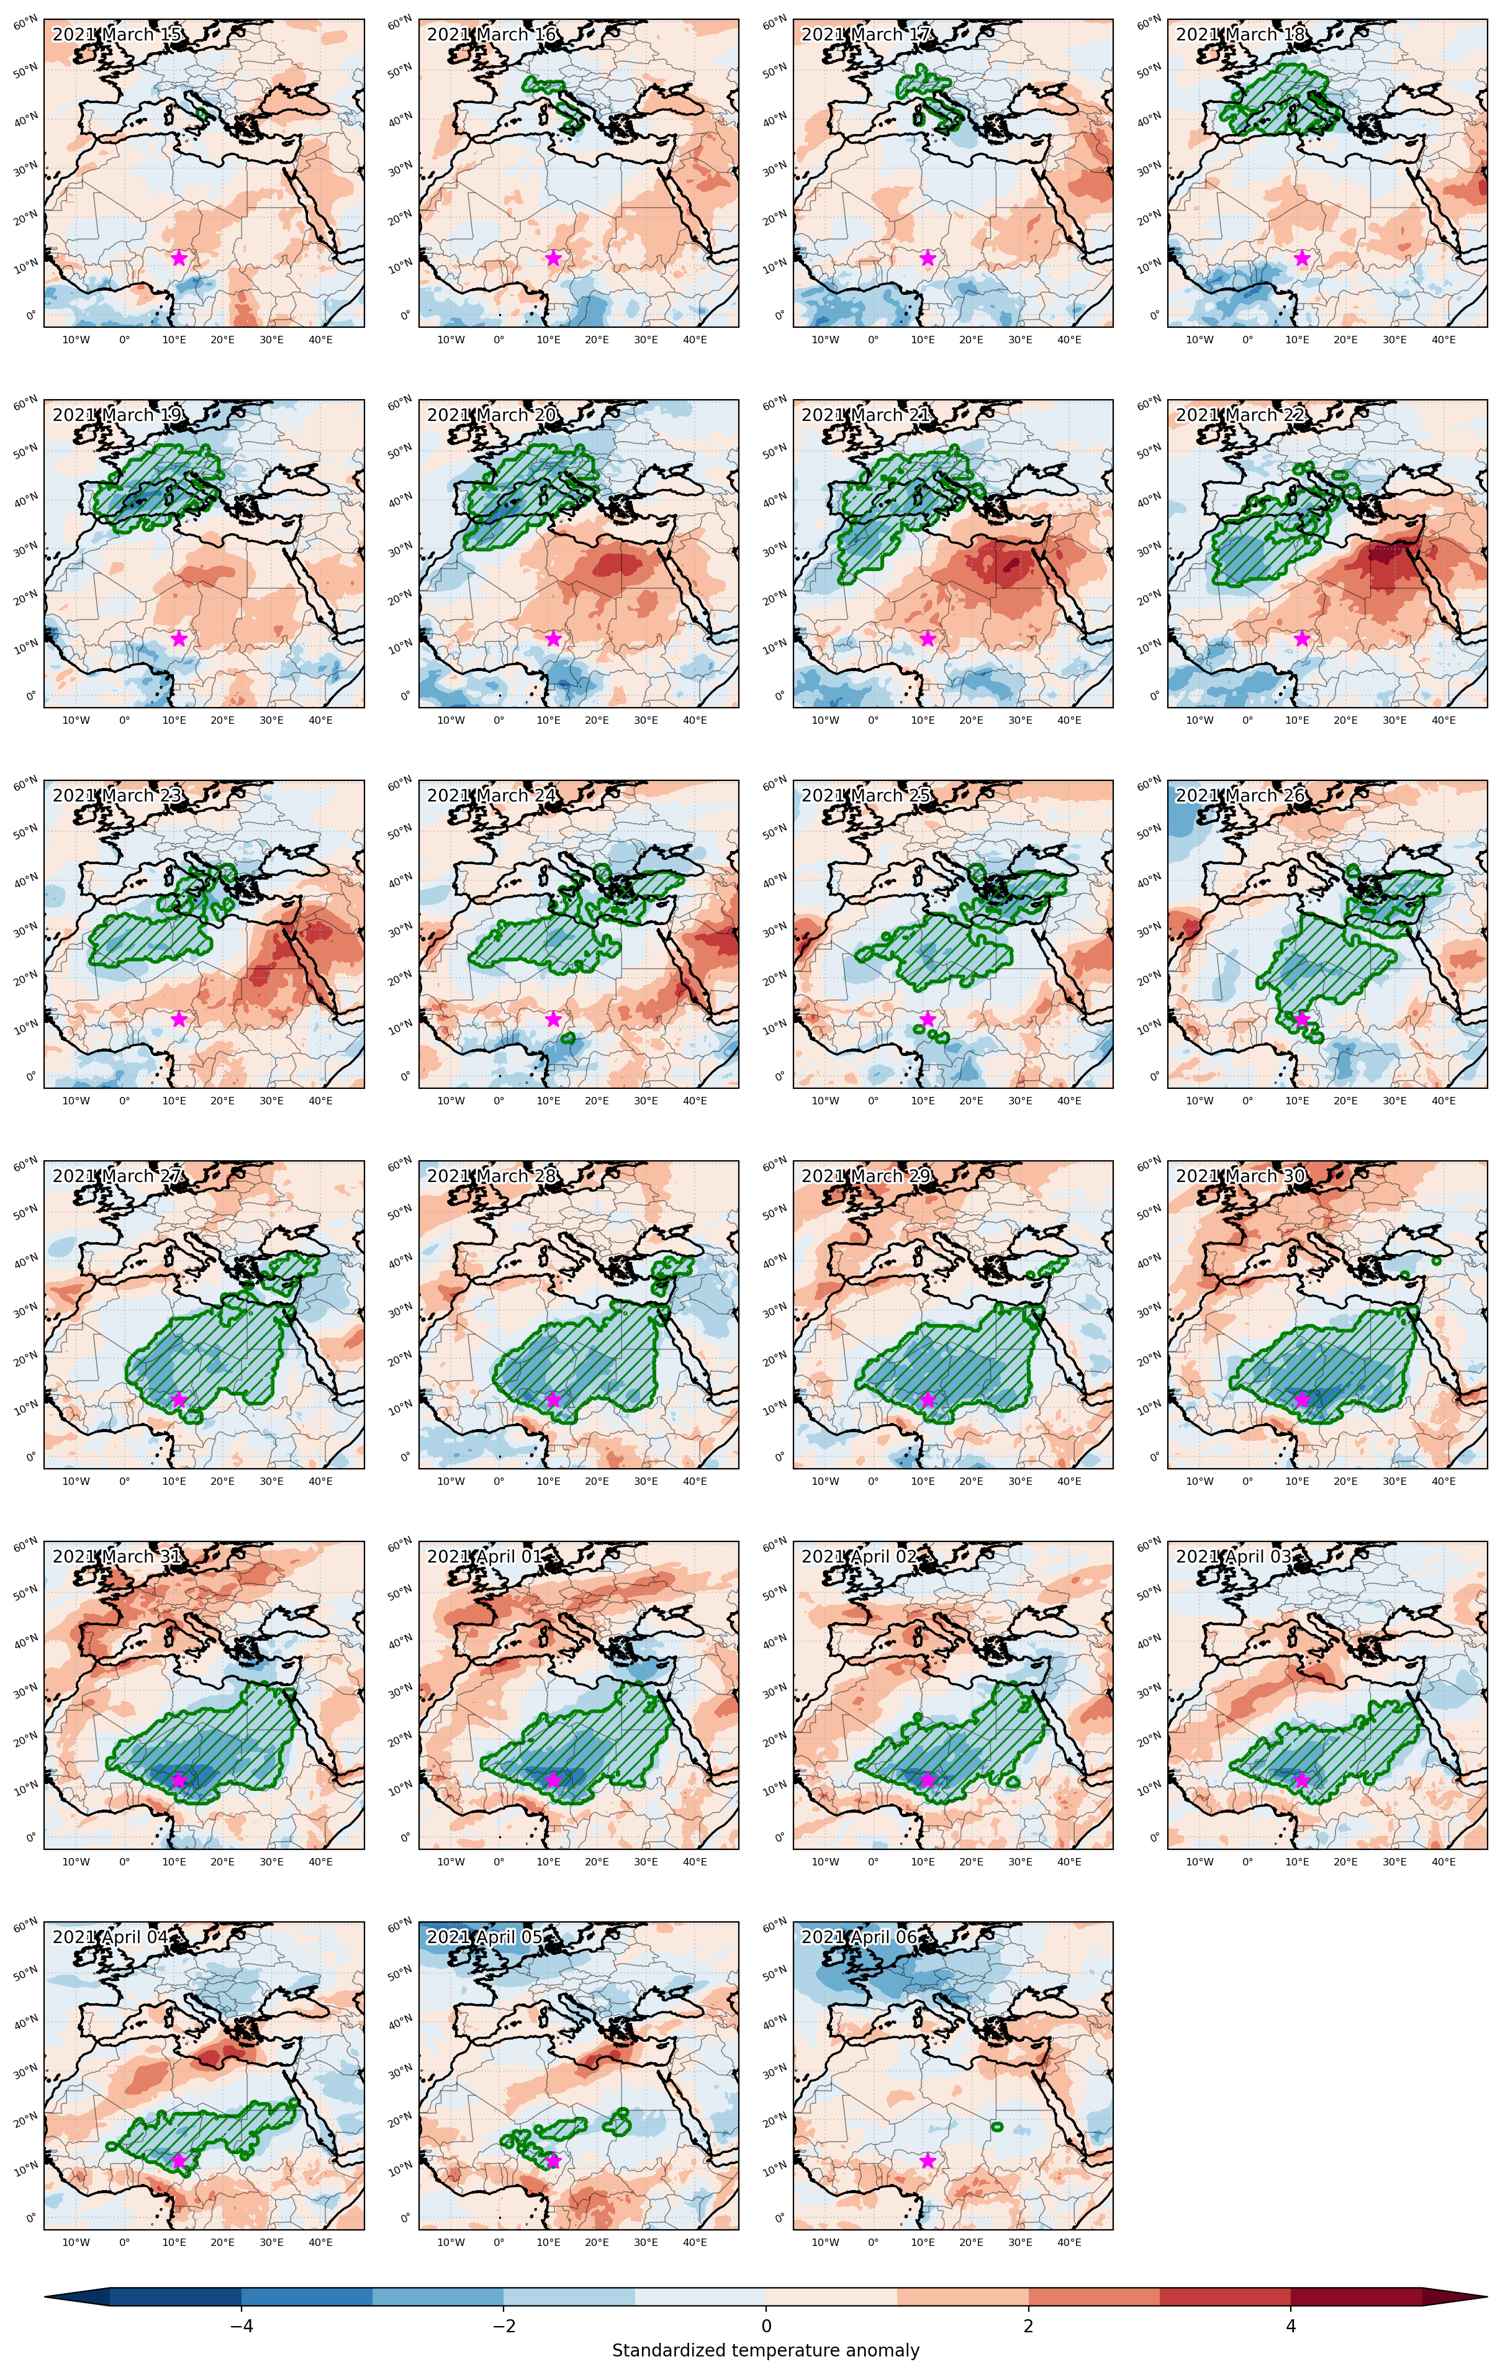
Fig. 3: Maps illustrating the evolution of standardized temperature anomalies during the event.

Event ID: Cold_spell_2021-Mar-15_to_2021-Apr-06_11.0_11.5

Cold spell occuring from June 16 2020 to June 26 2020 at 36.5°N 22.0°E

Download data: JSON

Event type: Cold spell

Countries affected (identified with ArcGIS Online; provided only for geographical reference):

  • Cyprus
  • Egypt
  • Greece
  • Israel
  • Libya
  • Syrian Arab Republic
  • Türkiye

Duration: 11 days

Time span: June 16 2020 to June 26 2020

Statistics over entire affected area:

  • Mean temperature anomaly: -1.8 °C
  • Mean temperature: 22.7 °C
  • Minimum temperature anomaly: -5.2 °C
  • Minimum temperature: 20.0 °C

Event center: 36.5°N 22.0°E

Area affected: 539104 km$^2$


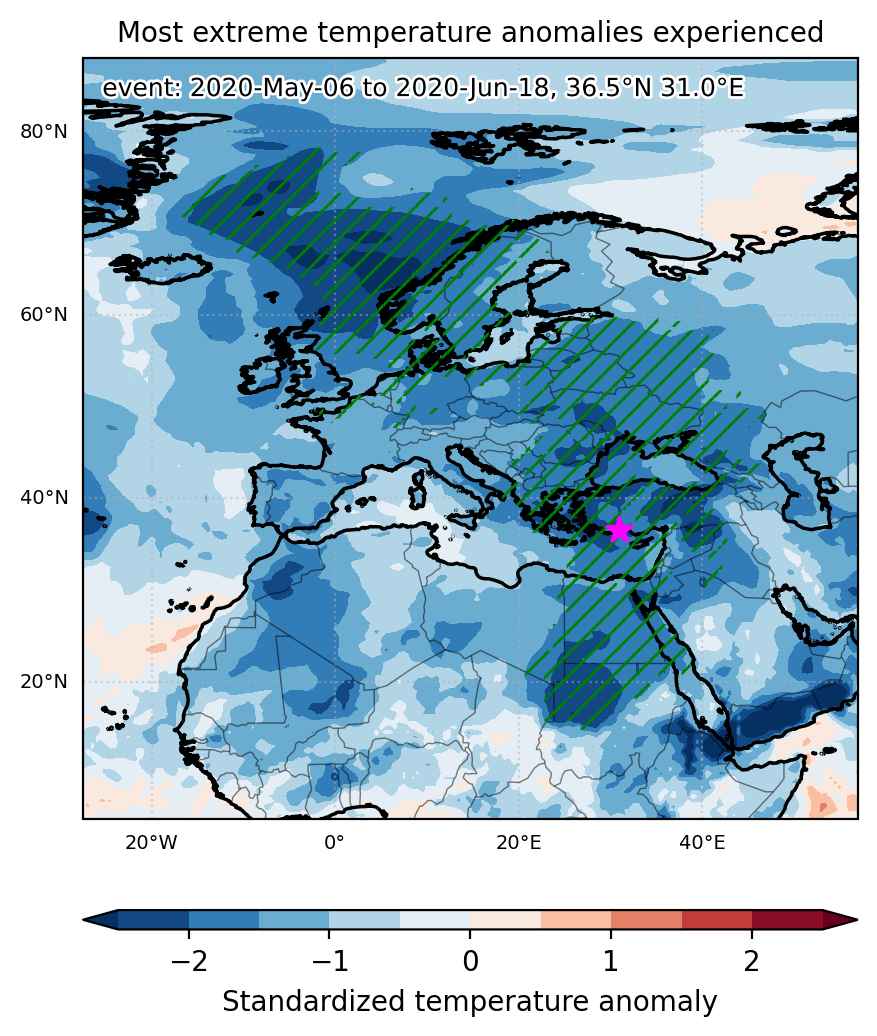
Fig. 1: Map of most extreme temperature anomalies (standardized) experienced during the event. The purple star indicates the center of the extreme event. Green hatching illustrates all areas under the effect of extremes at some time during the event.


Fig. 2: Evolution of temperature at the center of the event. The climatological percentile distribution is illustrated with color shadings.


Fig. 3: Maps illustrating the evolution of standardized temperature anomalies during the event.

Event ID: Cold_spell_2020-Jun-16_to_2020-Jun-26_22.0_36.5

Cold spell occuring from May 06 2020 to June 18 2020 at 36.5°N 31.0°E

Download data: JSON

Event type: Cold spell

Countries affected (identified with ArcGIS Online; provided only for geographical reference):

  • Albania
  • Belarus
  • Belgium
  • Bosnia and Herzegovina
  • Bulgaria
  • Chad
  • Cyprus
  • Denmark
  • Egypt
  • Estonia
  • Finland
  • France
  • Georgia
  • Germany
  • Greece
  • Hungary
  • Iraq
  • Israel
  • Italy
  • Jordan
  • Latvia
  • Lebanon
  • Libya
  • Lithuania
  • Moldova, Republic of
  • Montenegro
  • Netherlands
  • North Macedonia
  • Norway
  • Poland
  • Romania
  • Russian Federation
  • Saudi Arabia
  • Serbia
  • Slovakia
  • Sudan
  • Sweden
  • Syrian Arab Republic
  • Türkiye
  • Ukraine

Duration: 44 days

Time span: May 06 2020 to June 18 2020

Statistics over entire affected area:

  • Mean temperature anomaly: -4.6 °C
  • Mean temperature: 10.5 °C
  • Minimum temperature anomaly: -10.4 °C
  • Minimum temperature: -7.7 °C

Event center: 36.5°N 31.0°E

Area affected: 9237035 km$^2$


Fig. 1: Map of most extreme temperature anomalies (standardized) experienced during the event. The purple star indicates the center of the extreme event. Green hatching illustrates all areas under the effect of extremes at some time during the event.


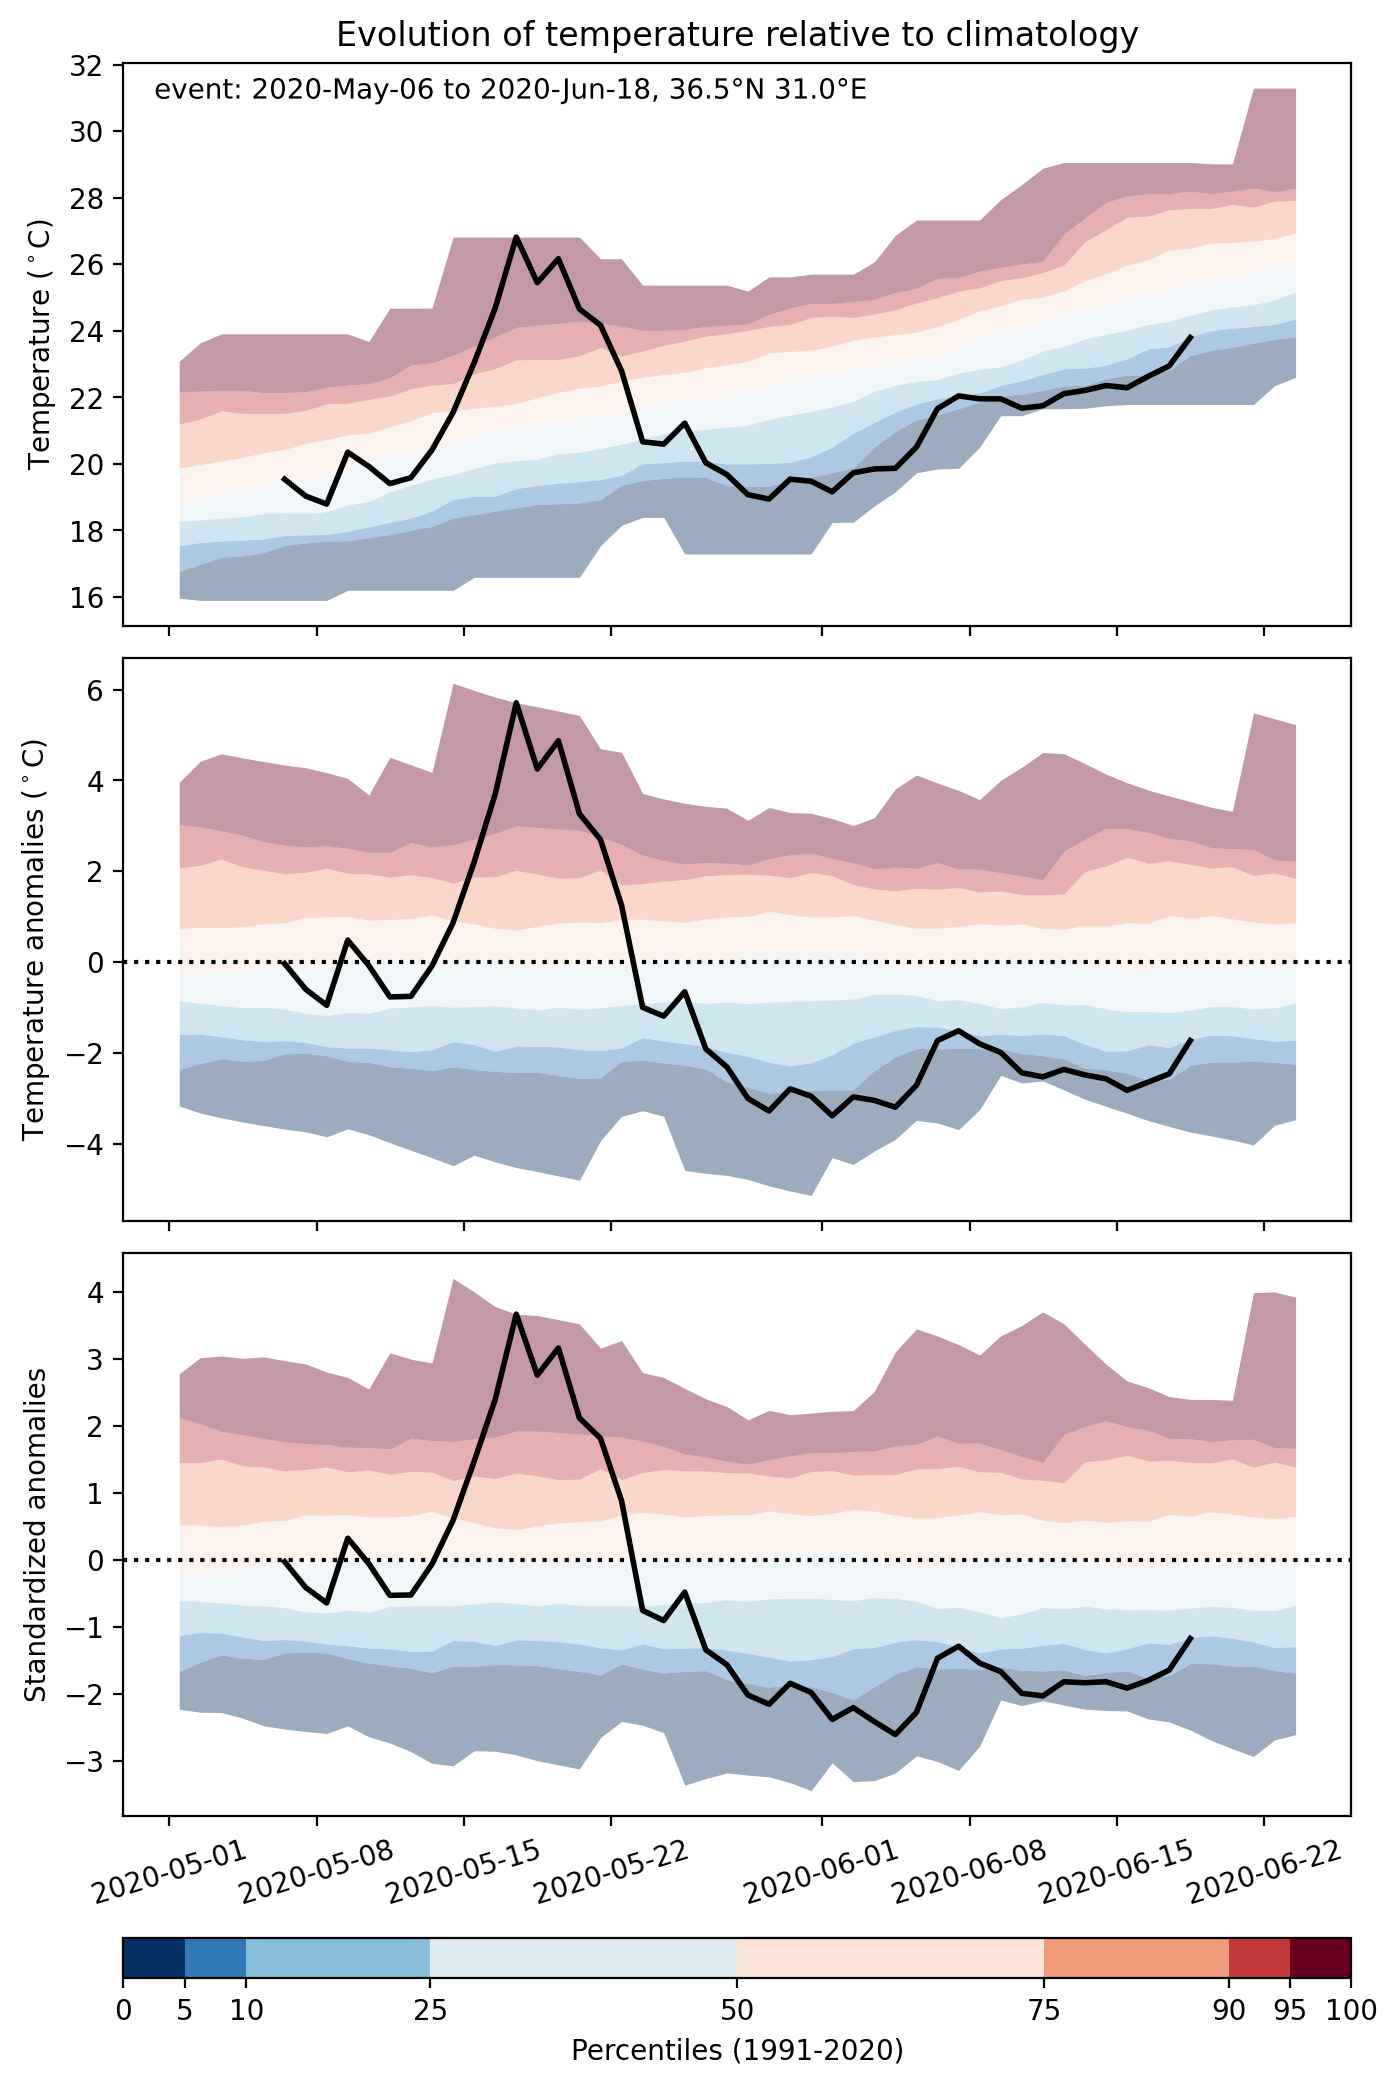
Fig. 2: Evolution of temperature at the center of the event. The climatological percentile distribution is illustrated with color shadings.


Fig. 3: Maps illustrating the evolution of standardized temperature anomalies during the event.

Event ID: Cold_spell_2020-May-06_to_2020-Jun-18_31.0_36.5

Cold spell occuring from March 16 2020 to March 20 2020 at 36.0°N 34.0°E

Download data: JSON

Event type: Cold spell

Countries affected (identified with ArcGIS Online; provided only for geographical reference):

  • Cyprus
  • Syrian Arab Republic
  • Türkiye

Duration: 5 days

Time span: March 16 2020 to March 20 2020

Statistics over entire affected area:

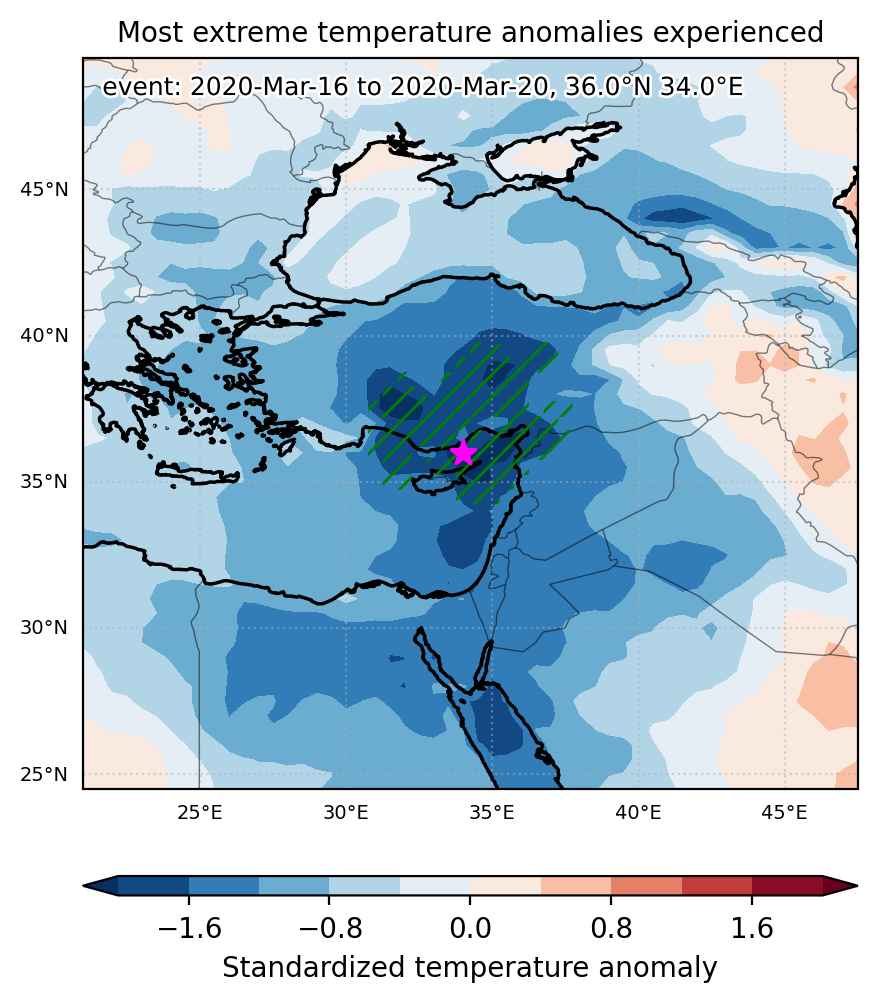
  • Mean temperature anomaly: -5.2 °C
  • Mean temperature: 4.3 °C
  • Minimum temperature anomaly: -10.6 °C
  • Minimum temperature: -7.3 °C

Event center: 36.0°N 34.0°E

Area affected: 227072 km$^2$


Fig. 1: Map of most extreme temperature anomalies (standardized) experienced during the event. The purple star indicates the center of the extreme event. Green hatching illustrates all areas under the effect of extremes at some time during the event.


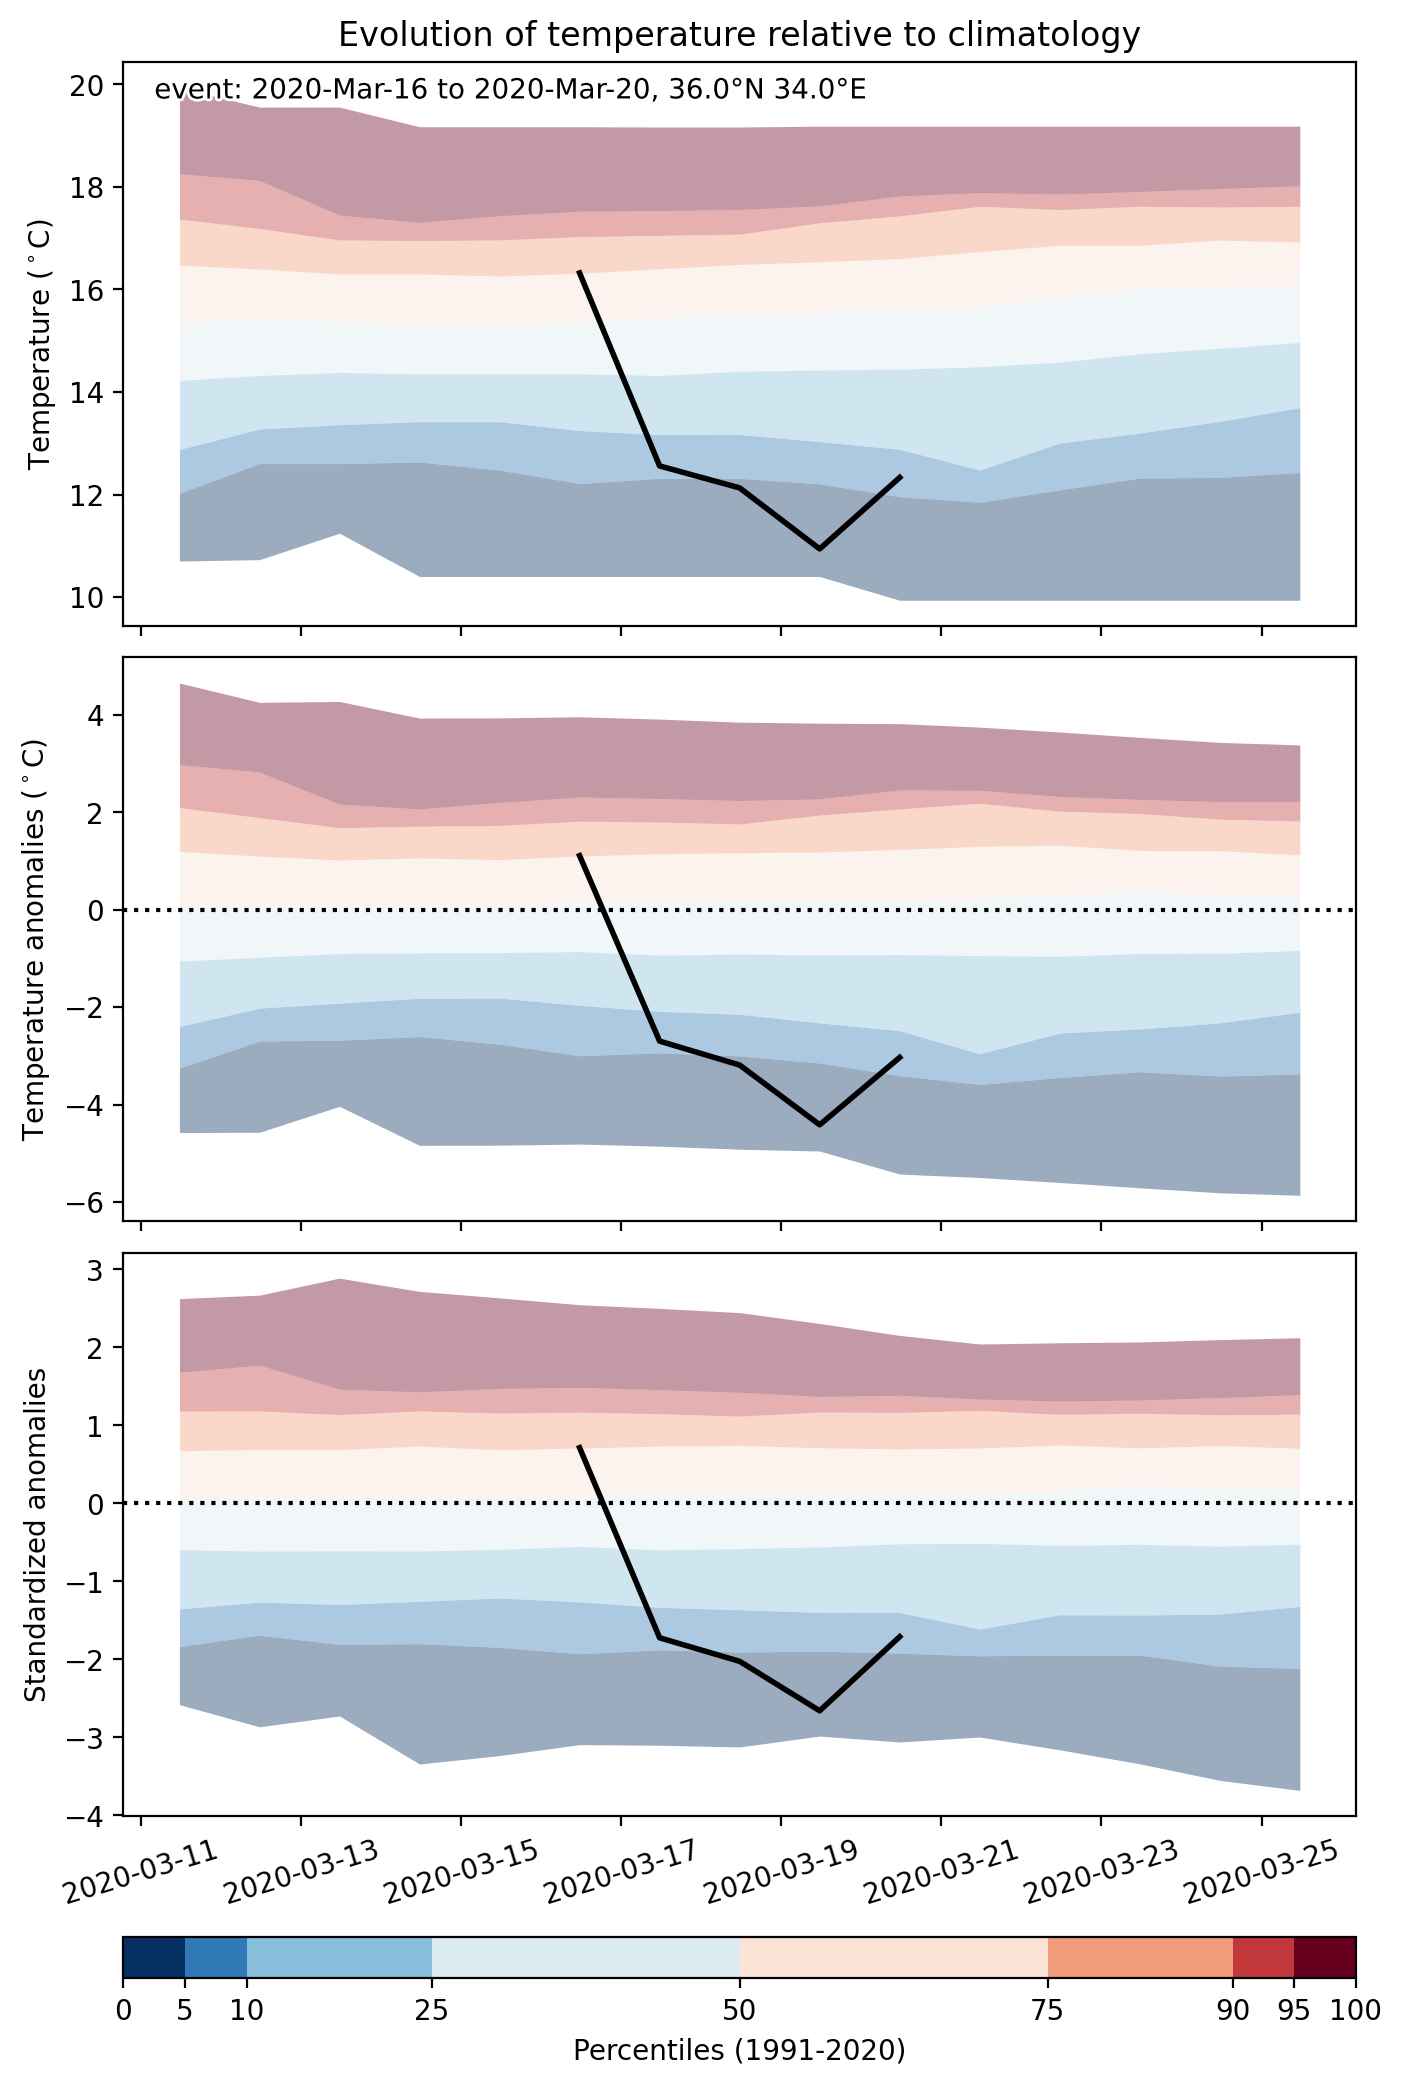
Fig. 2: Evolution of temperature at the center of the event. The climatological percentile distribution is illustrated with color shadings.


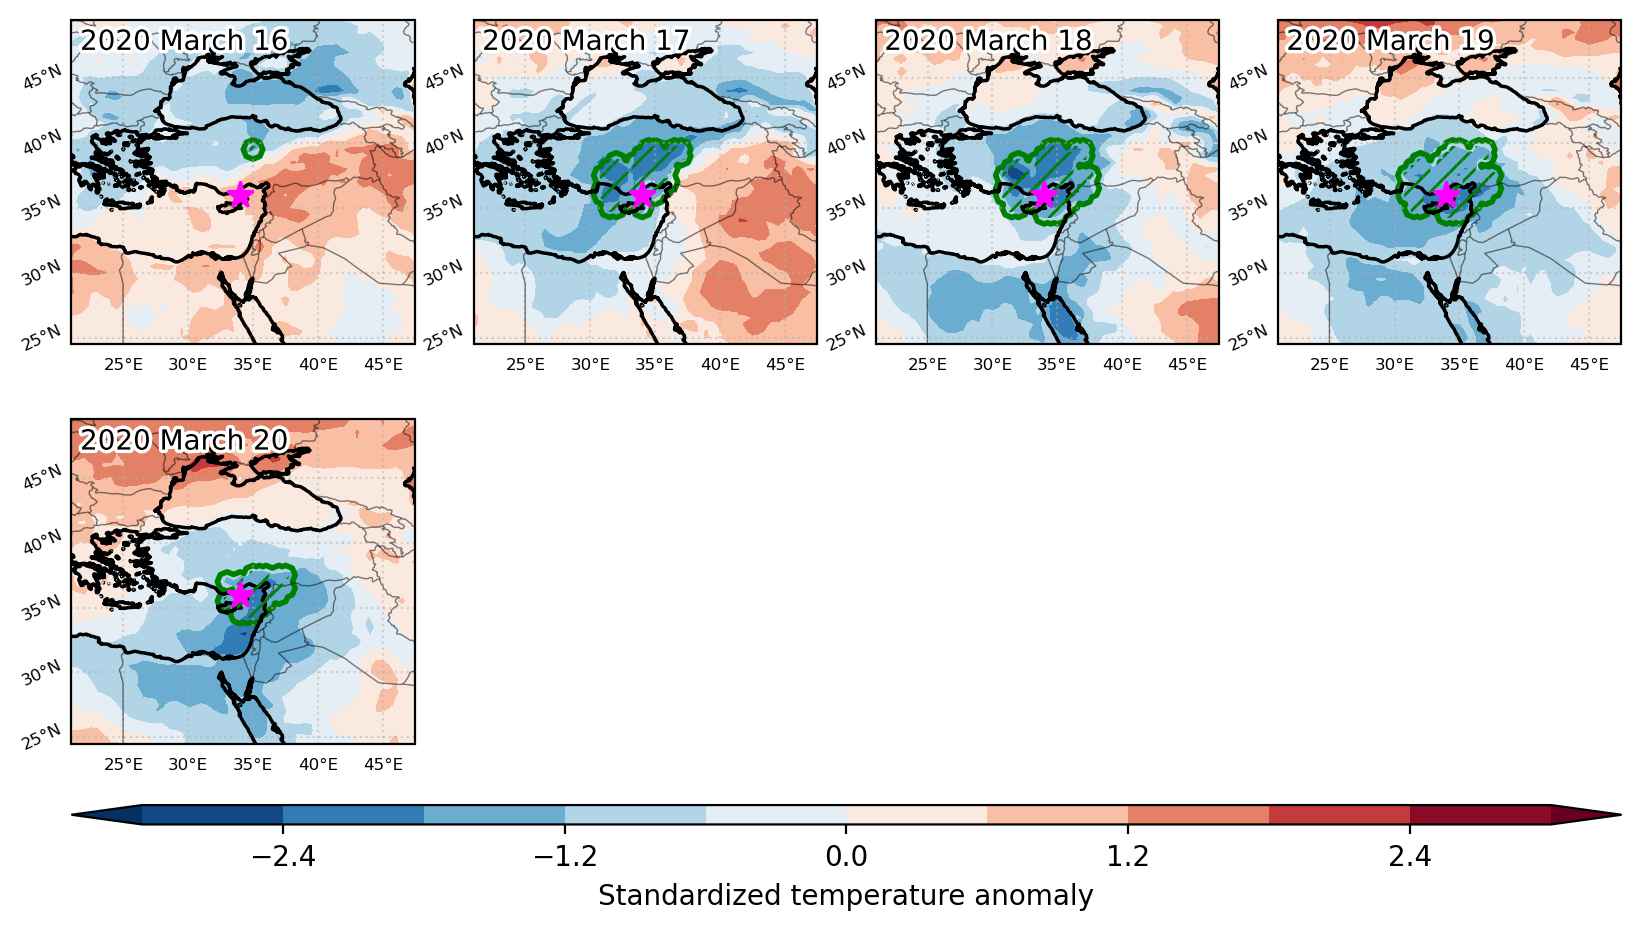
Fig. 3: Maps illustrating the evolution of standardized temperature anomalies during the event.

Event ID: Cold_spell_2020-Mar-16_to_2020-Mar-20_34.0_36.0