Heat wave occuring from February 15 2021 to February 22 2021 at -46.0°S 145.5°E

Download data: JSON

Event type: Heat wave

Countries affected (identified with ArcGIS Online; provided only for geographical reference):

  • Australia

Duration: 8 days

Time span: February 15 2021 to February 22 2021

Statistics over entire affected area:

  • Mean temperature anomaly: 2.4 °C
  • Mean temperature: 12.9 °C
  • Maximum temperature anomaly: 7.0 °C
  • Maximum temperature: 21.0 °C

Event center: -46.0°S 145.5°E

Area affected: 1082278 km$^2$
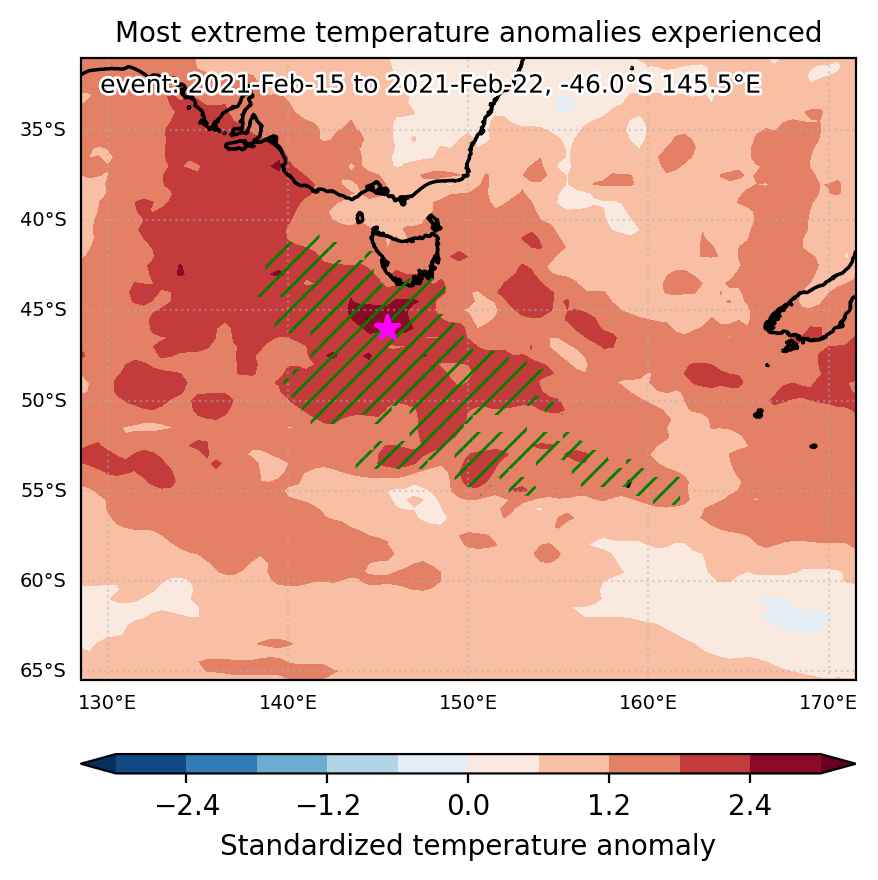

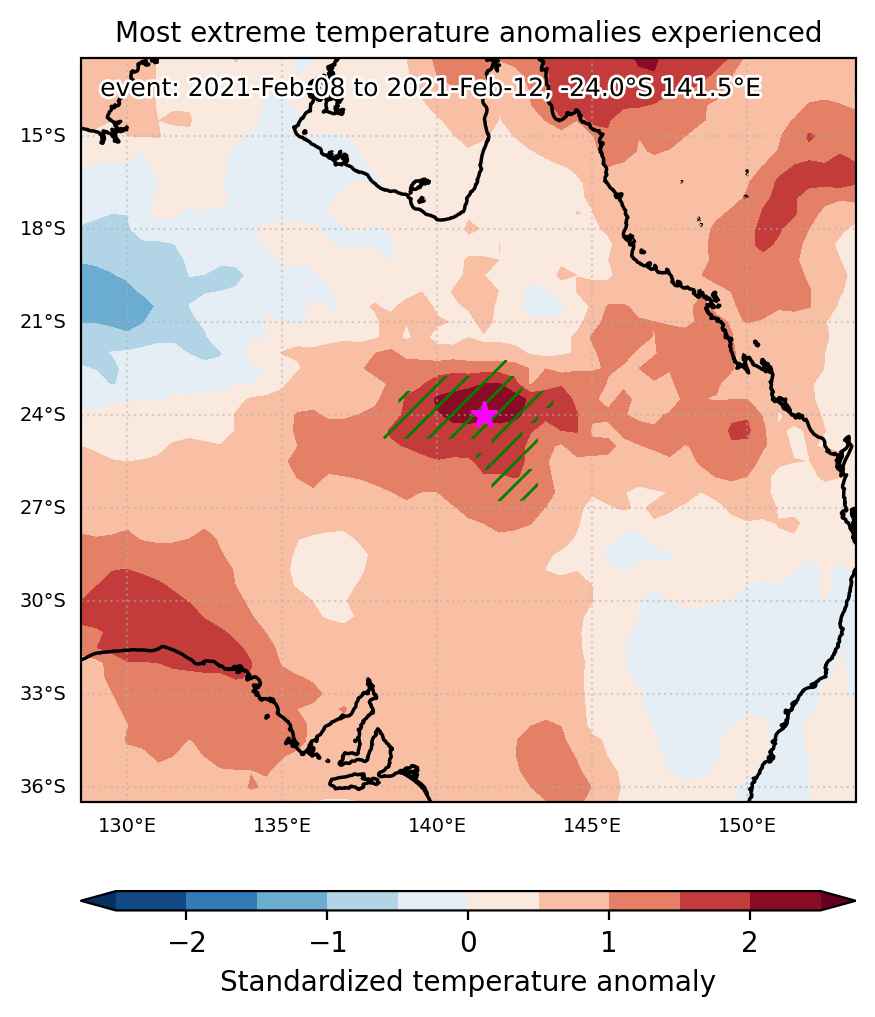
Fig. 1: Map of most extreme temperature anomalies (standardized) experienced during the event. The purple star indicates the center of the extreme event. Green hatching illustrates all areas under the effect of extremes at some time during the event.
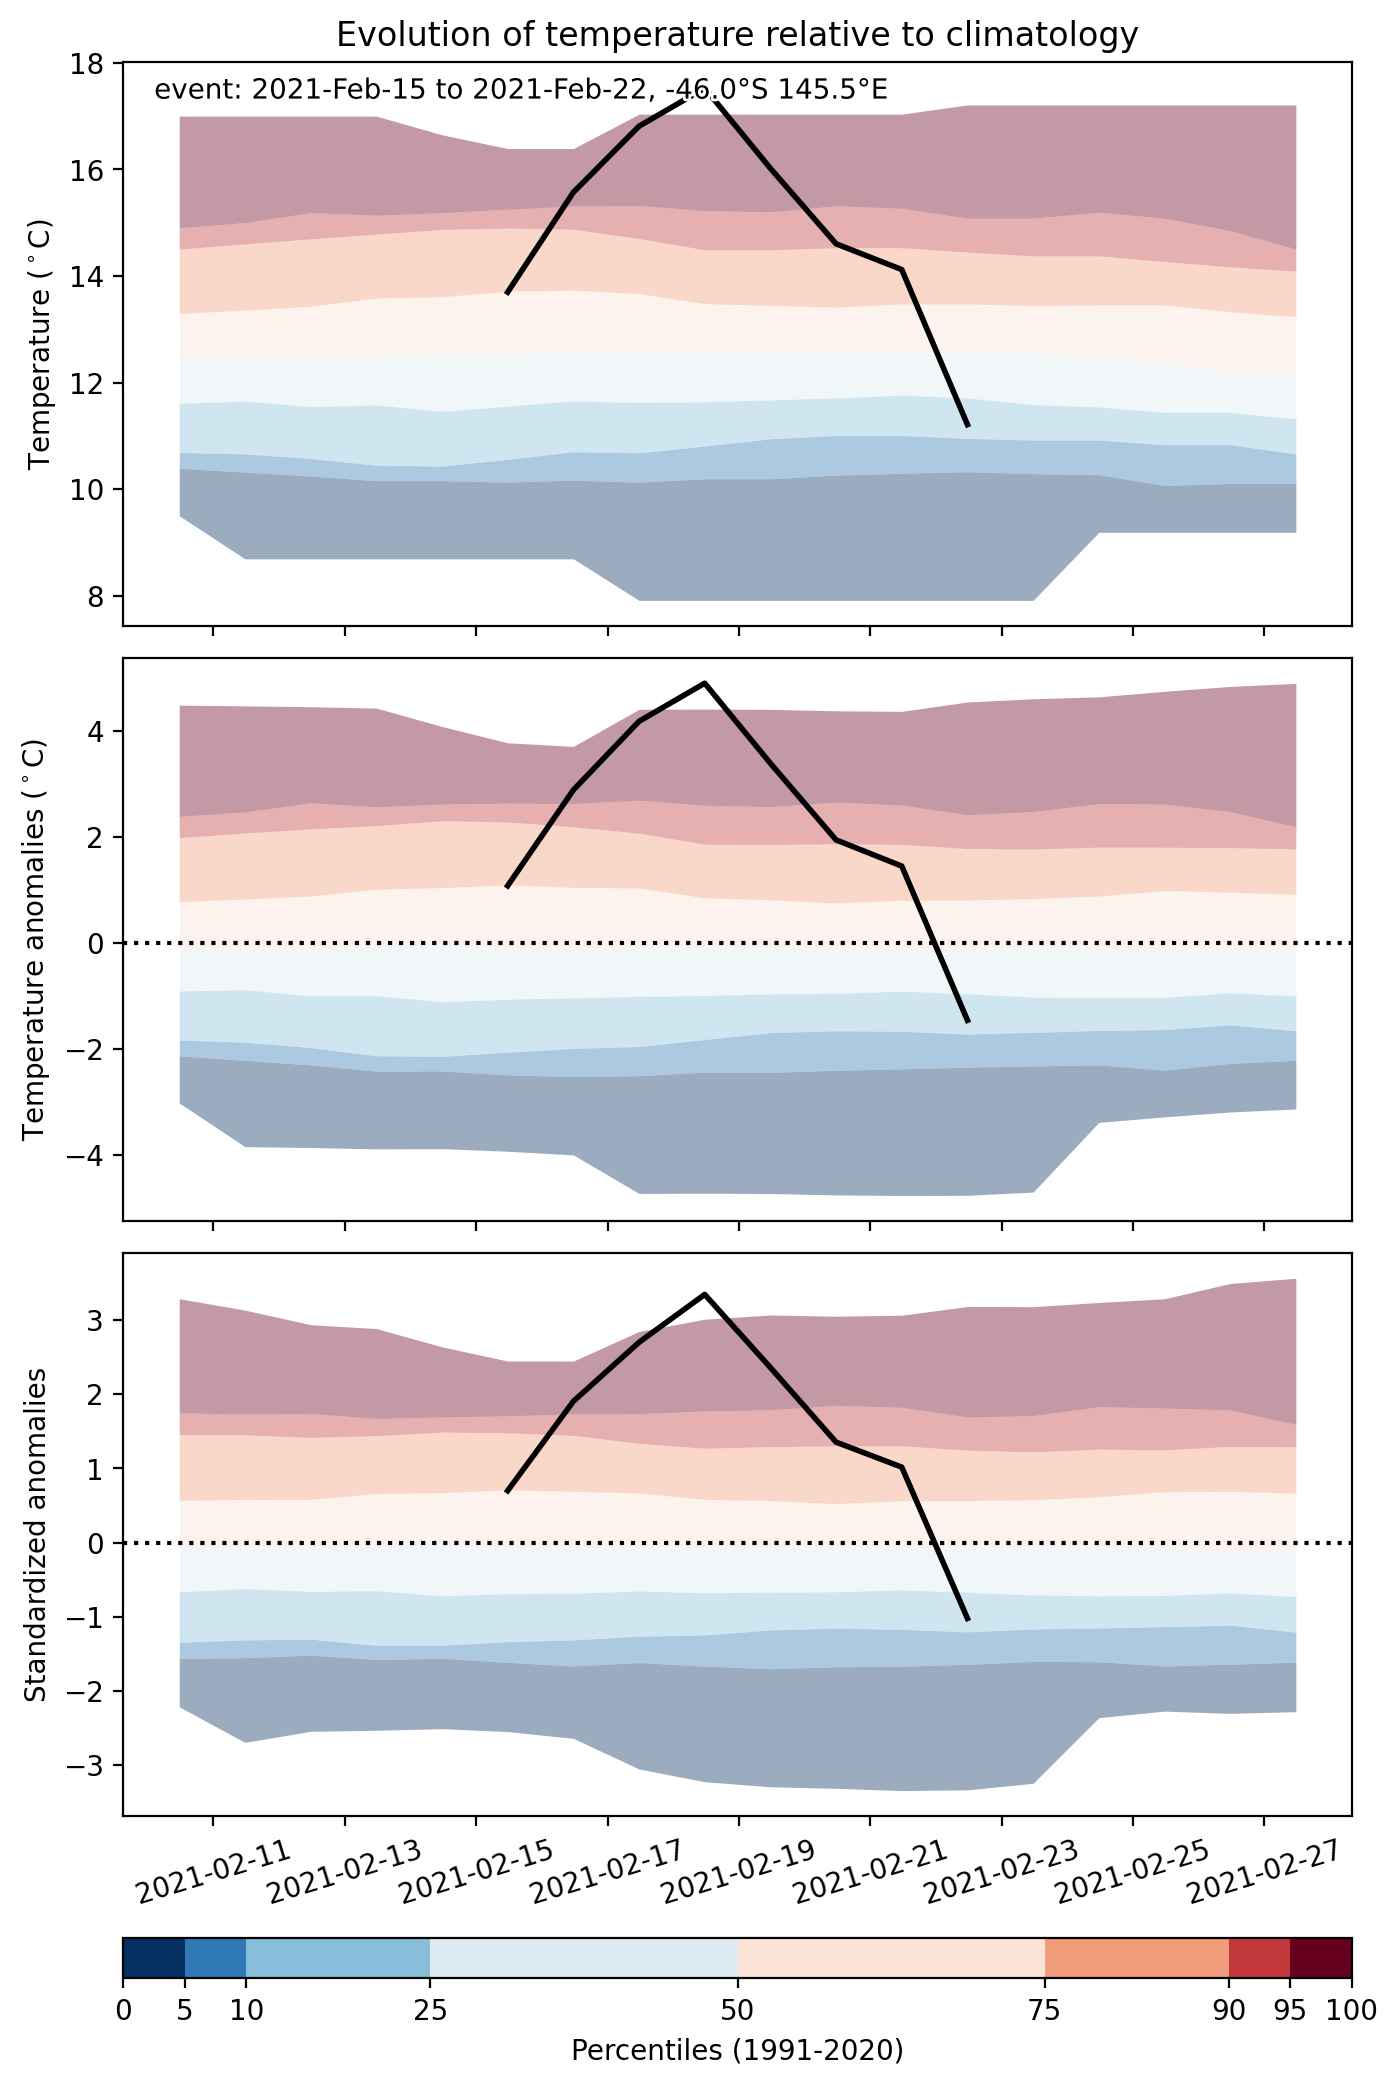


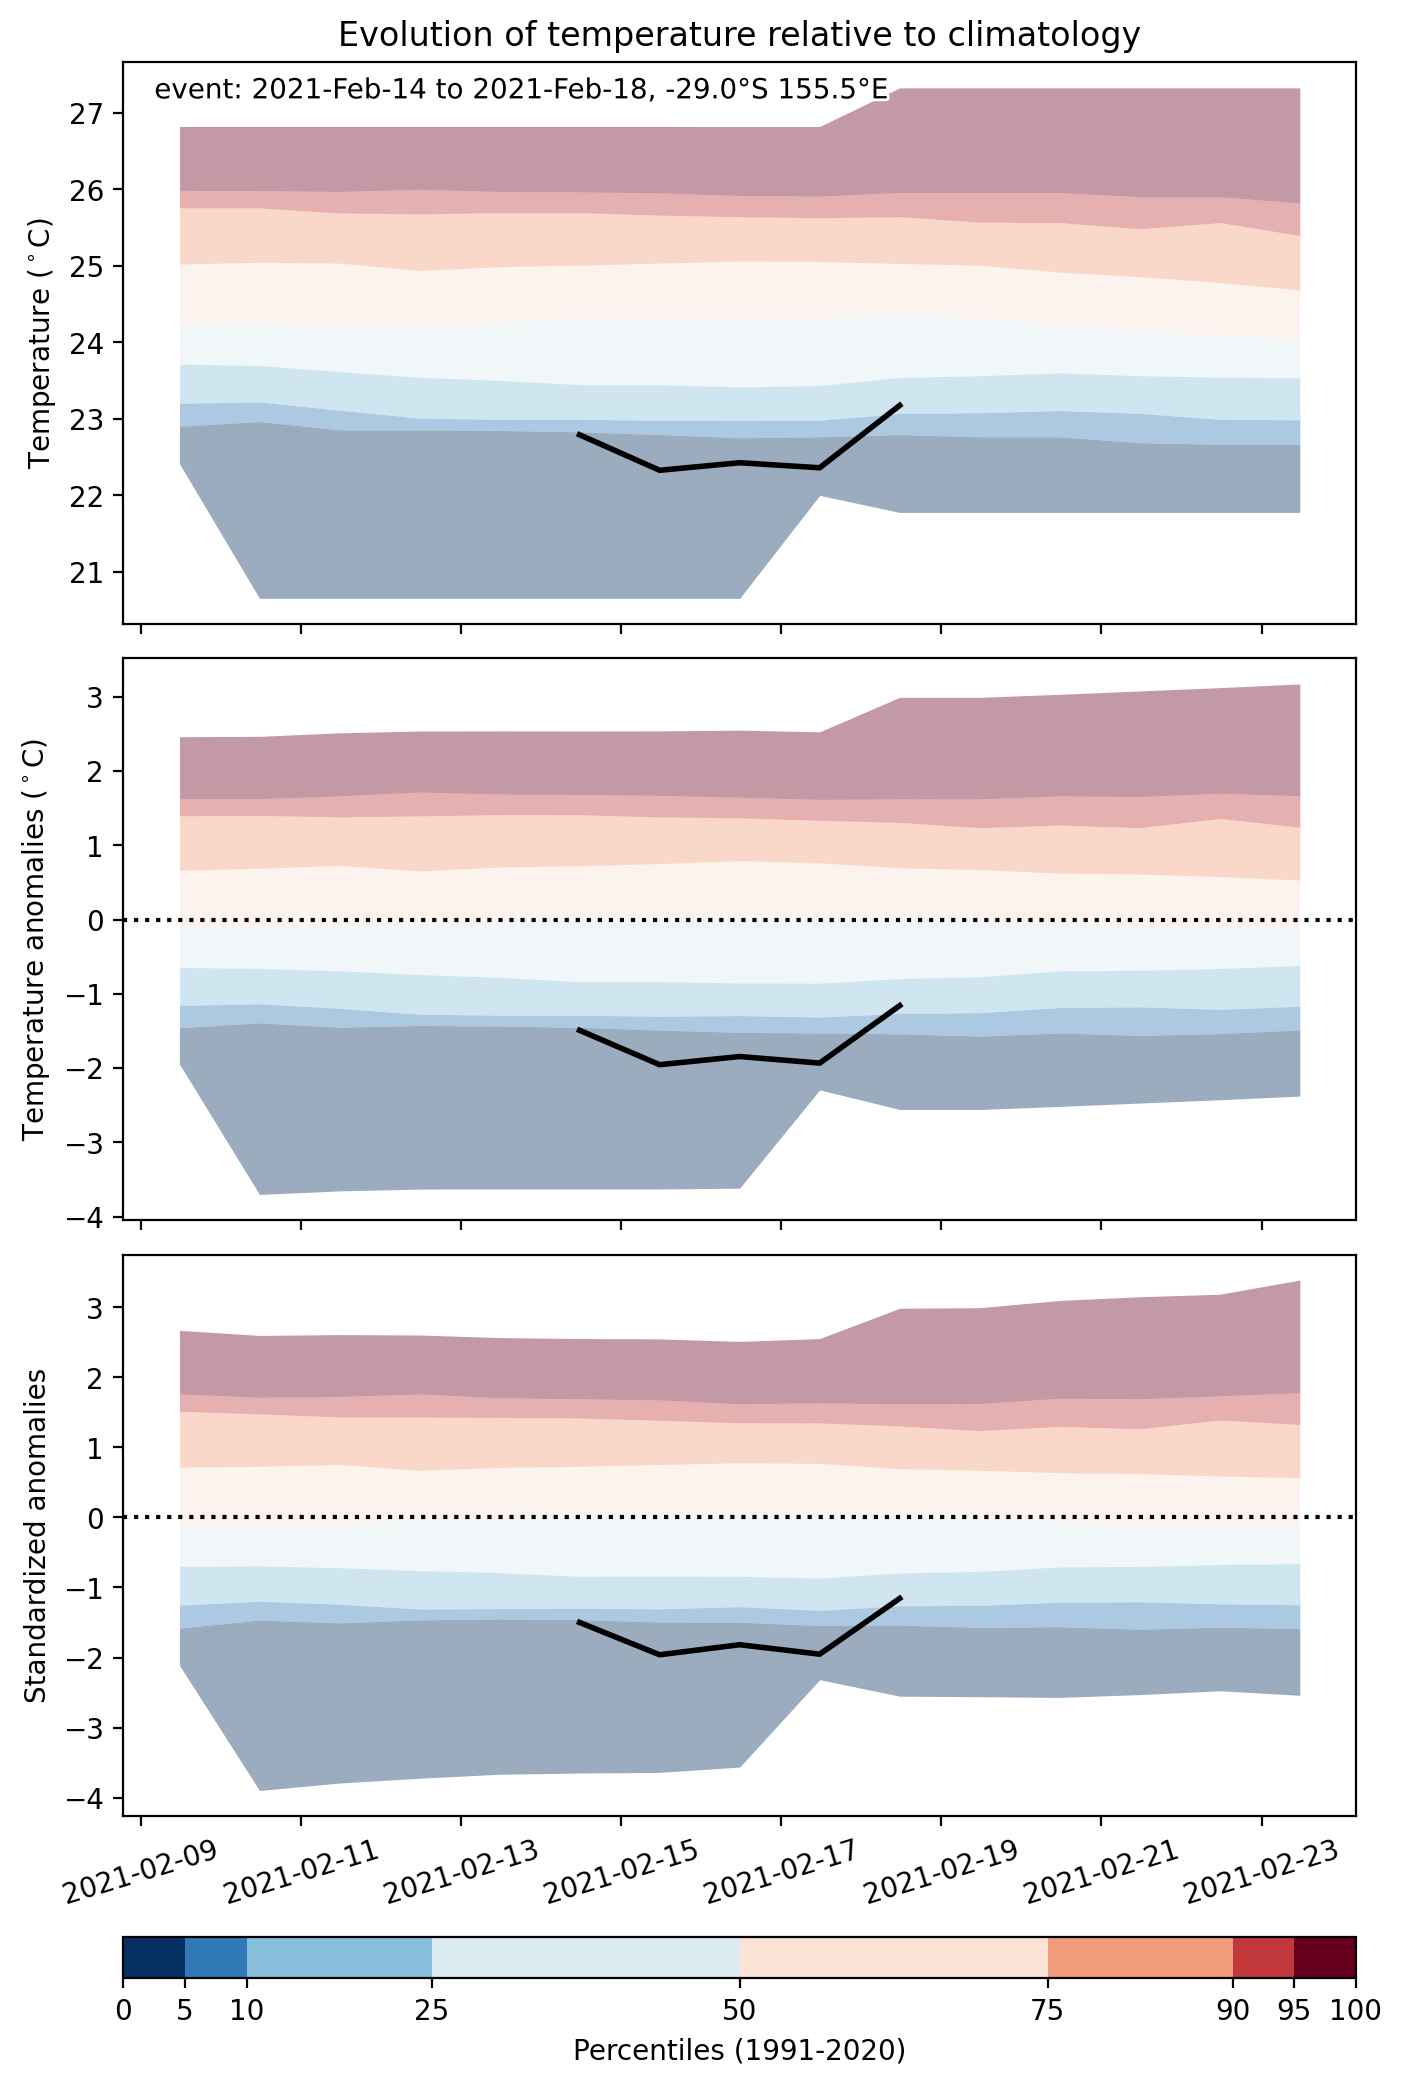
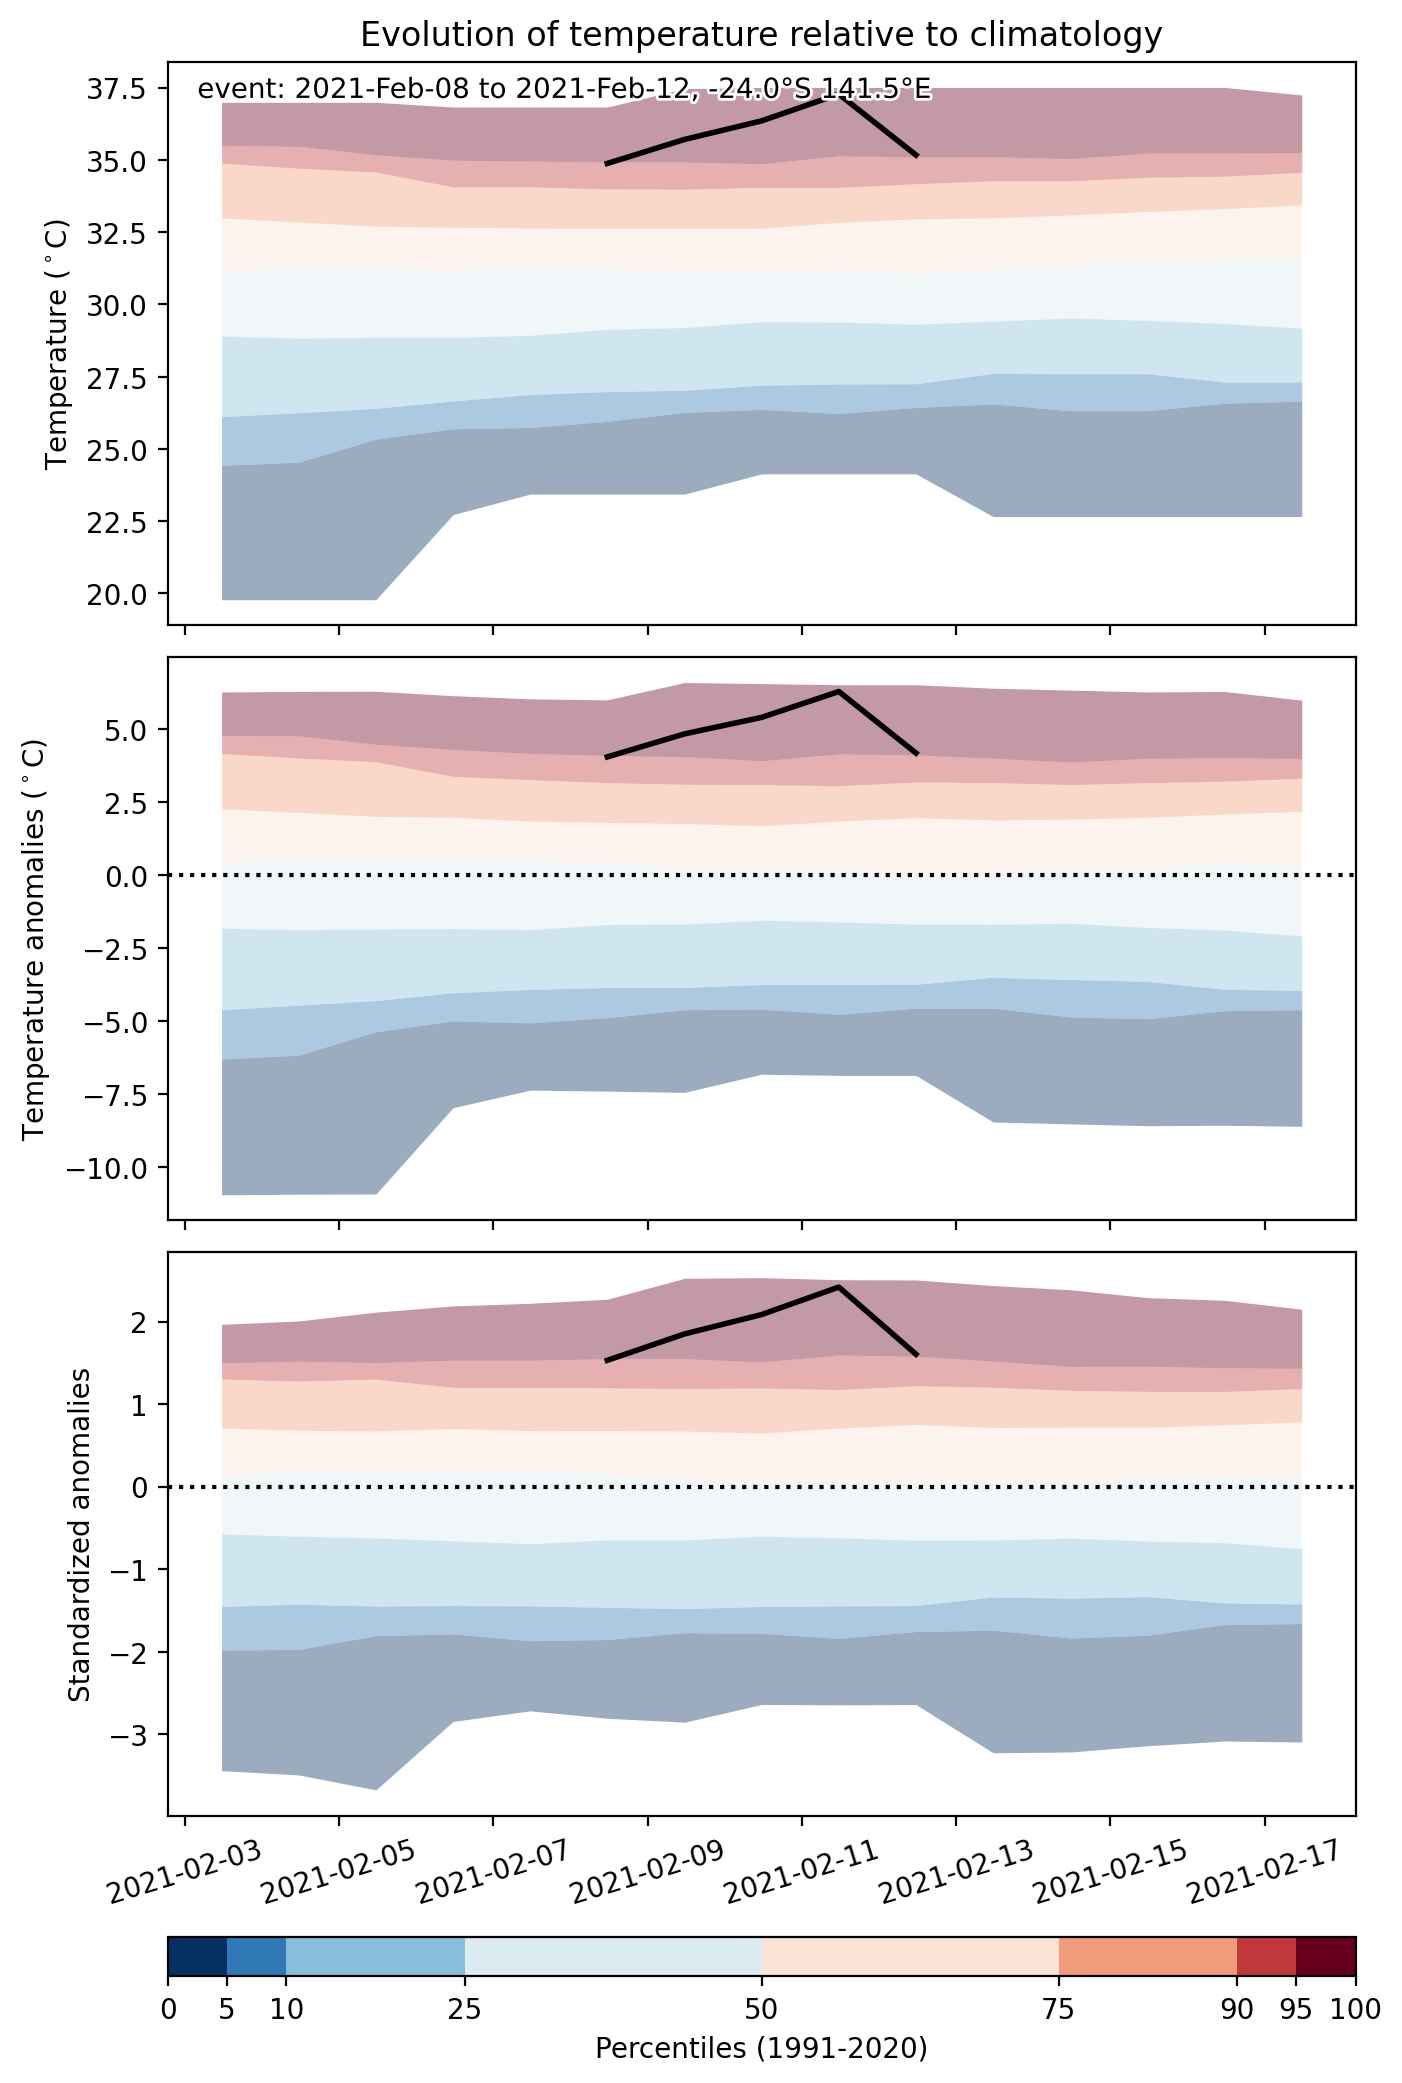
Fig. 2: Evolution of temperature at the center of the event. The climatological percentile distribution is illustrated with color shadings.
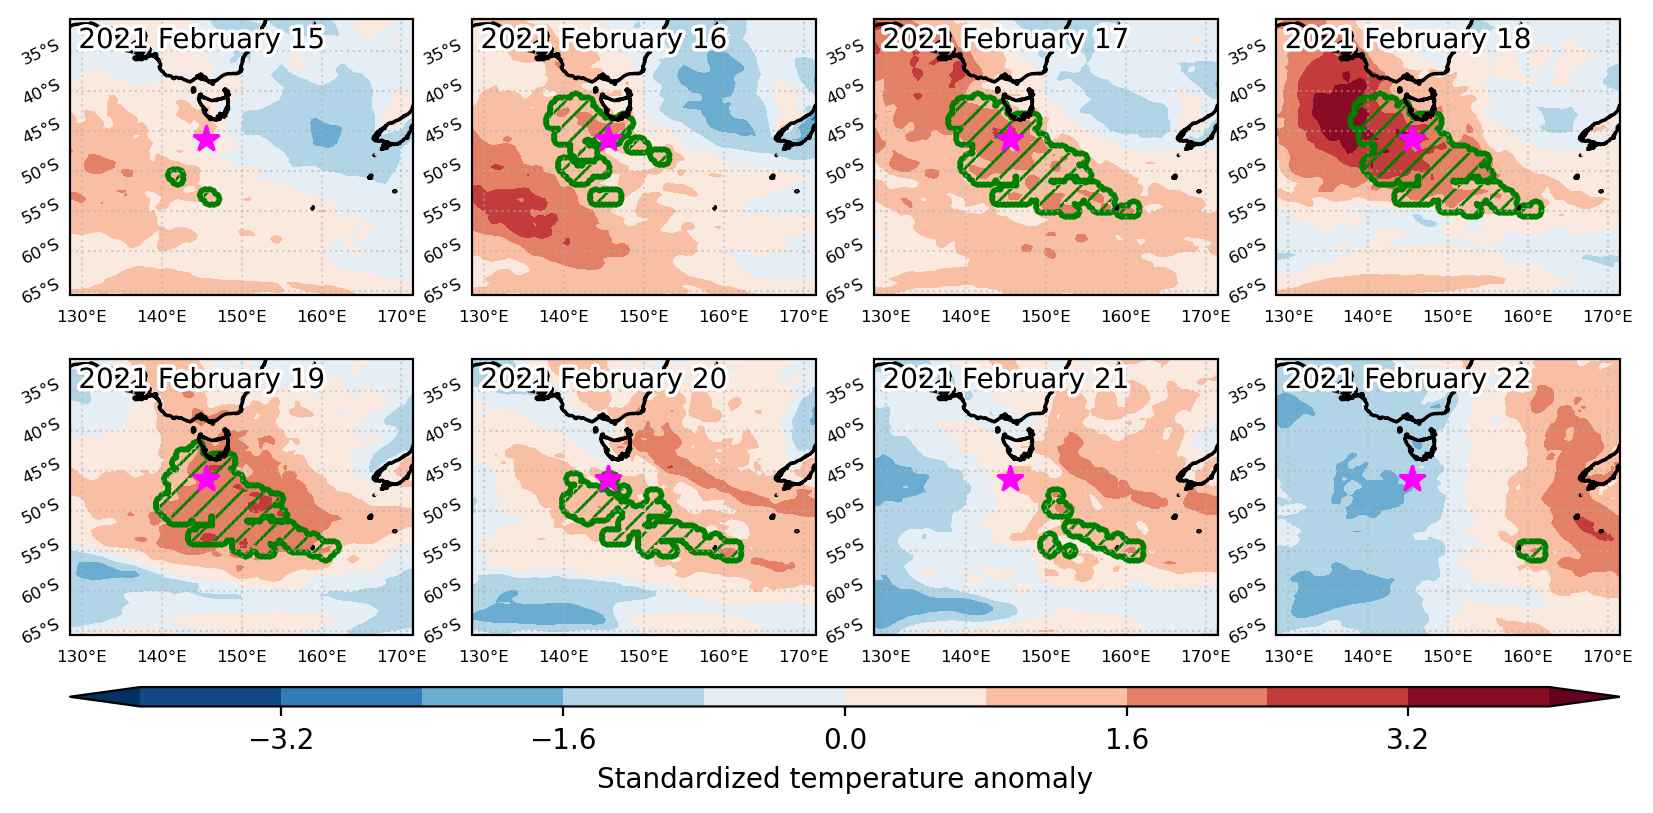


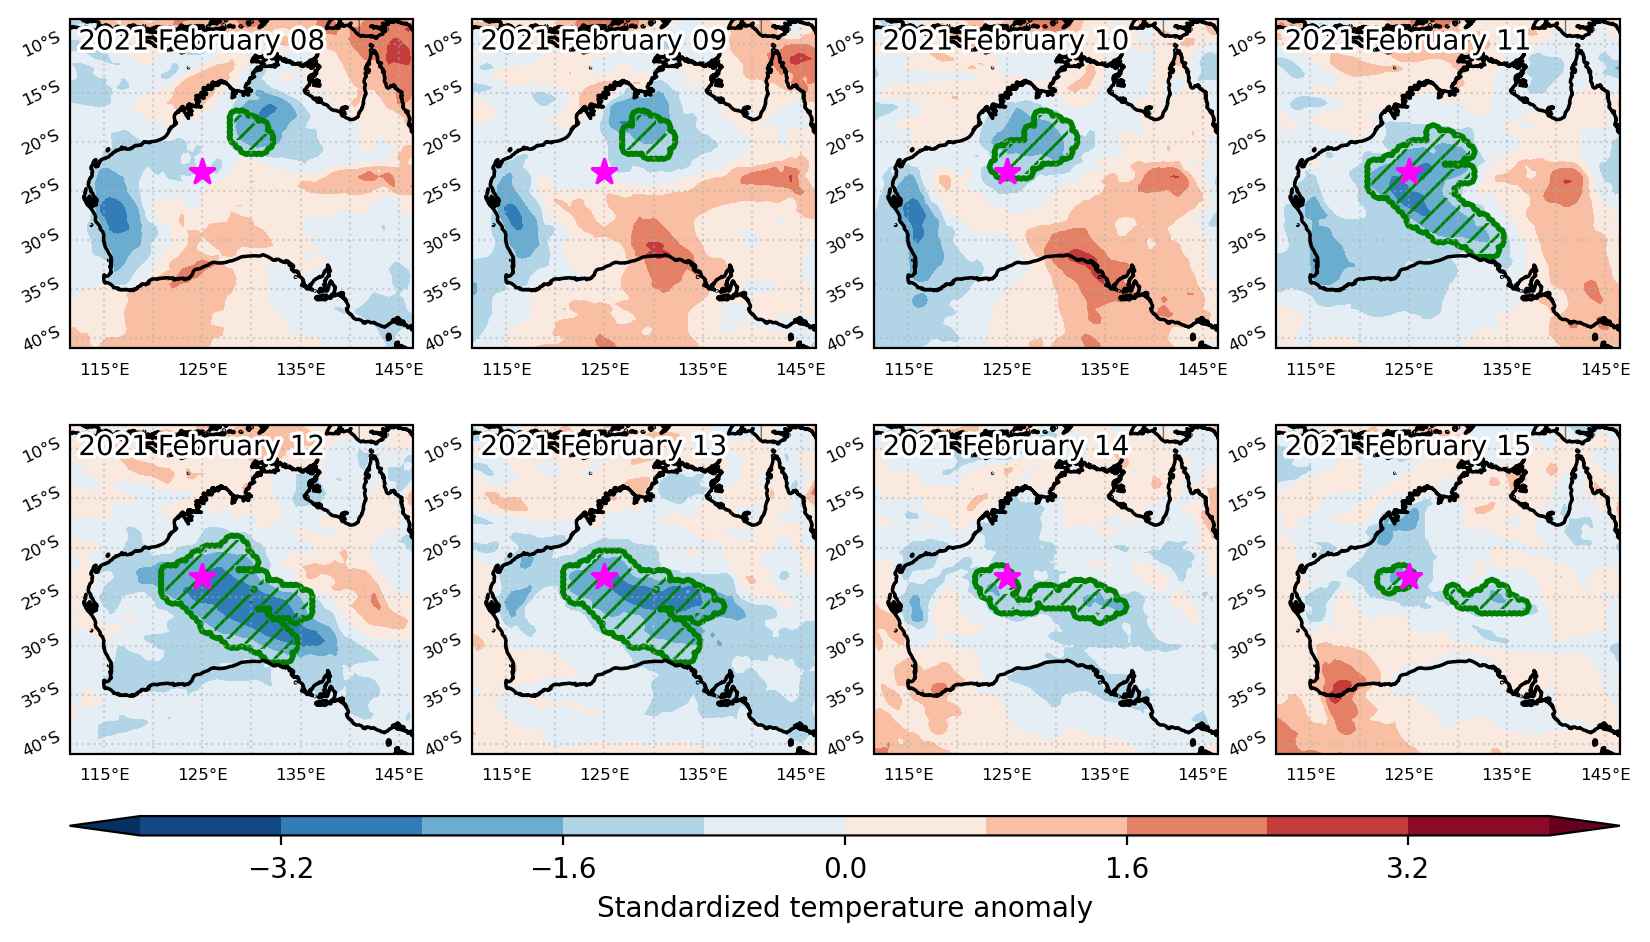
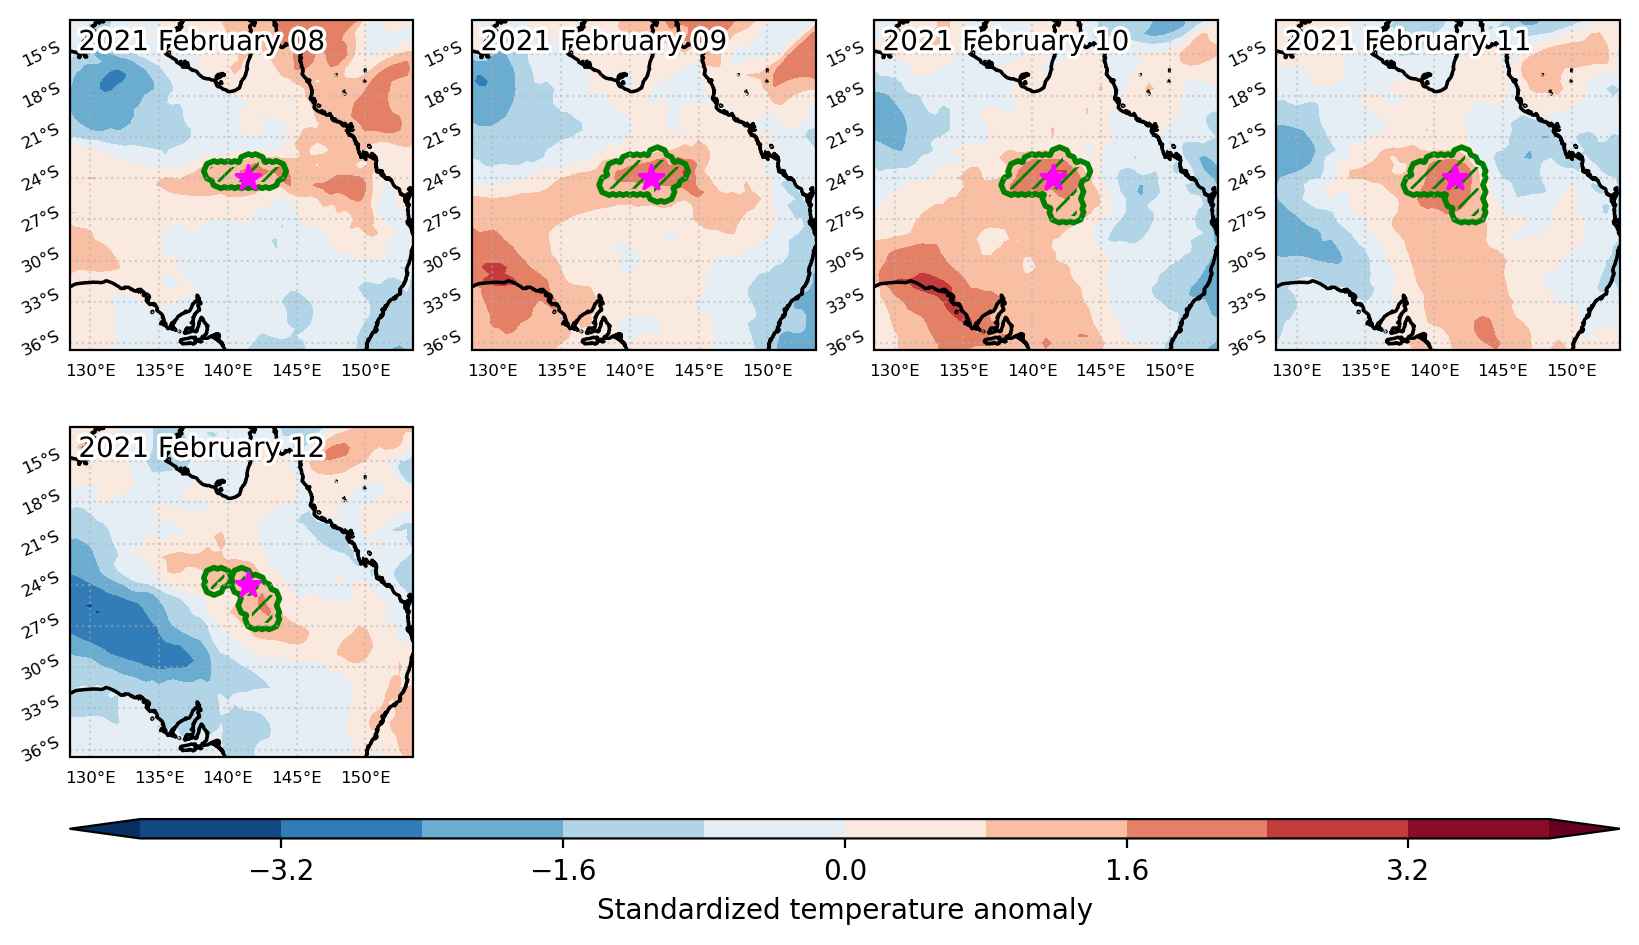
Fig. 3: Maps illustrating the evolution of standardized temperature anomalies during the event.

Event ID: Heat_wave_2021-Feb-15_to_2021-Feb-22_145.5_-46.0
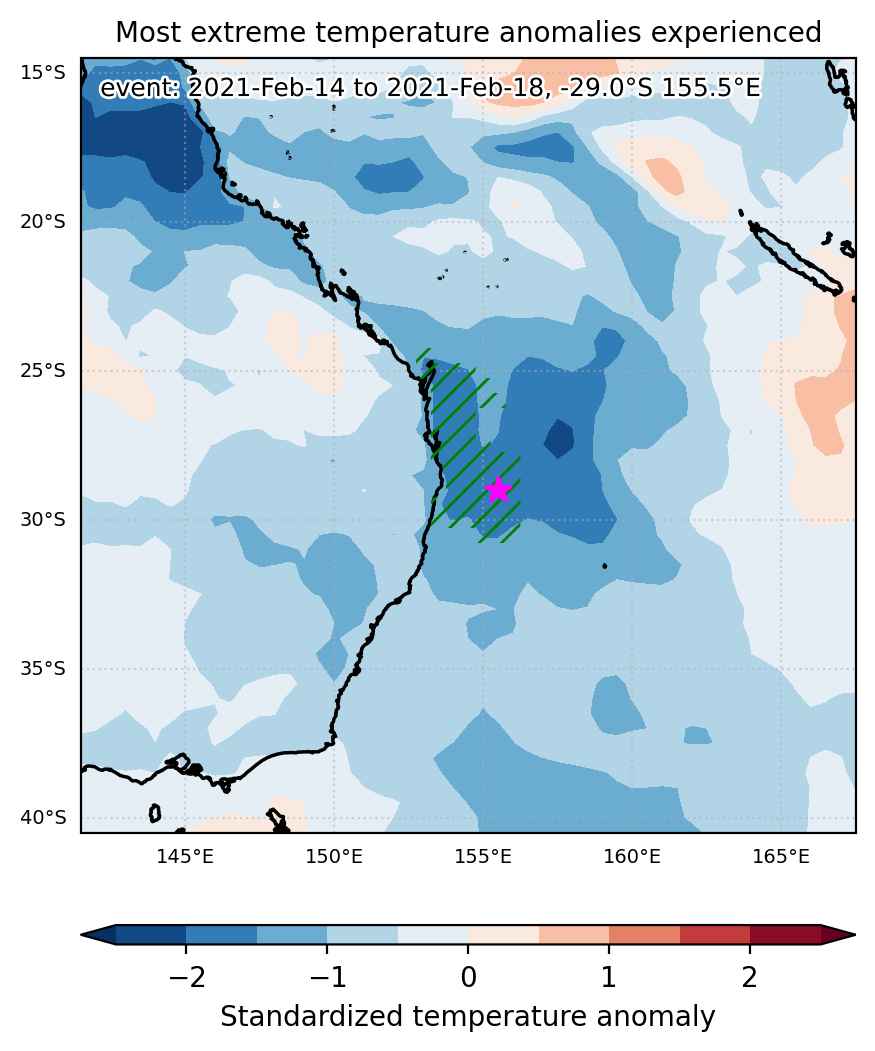
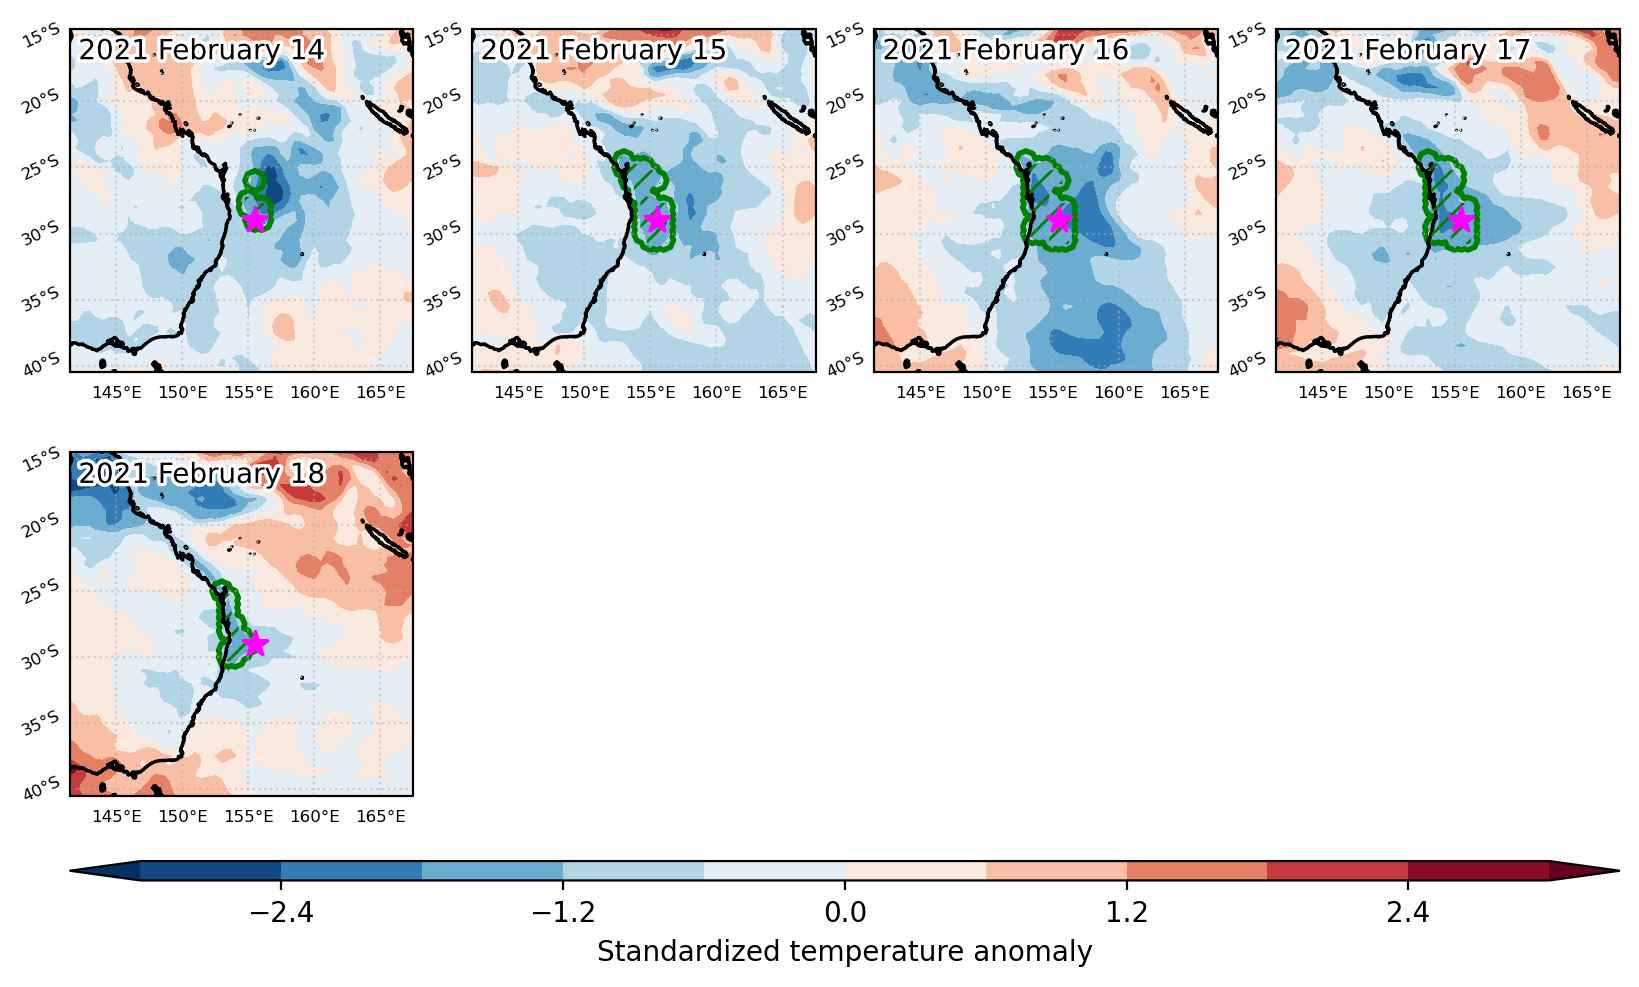
Cold spell occuring from February 14 2021 to February 18 2021 at -29.0°S 155.5°E

Download data: JSON

Event type: Cold spell

Countries affected (identified with ArcGIS Online; provided only for geographical reference):

  • Australia

Duration: 5 days

Time span: February 14 2021 to February 18 2021

Statistics over entire affected area:

  • Mean temperature anomaly: -1.7 °C
  • Mean temperature: 23.0 °C
  • Minimum temperature anomaly: -2.4 °C
  • Minimum temperature: 22.0 °C

Event center: -29.0°S 155.5°E

Area affected: 150267 km$^2$


Fig. 1: Map of most extreme temperature anomalies (standardized) experienced during the event. The purple star indicates the center of the extreme event. Green hatching illustrates all areas under the effect of extremes at some time during the event.


Fig. 2: Evolution of temperature at the center of the event. The climatological percentile distribution is illustrated with color shadings.


Fig. 3: Maps illustrating the evolution of standardized temperature anomalies during the event.

Event ID: Cold_spell_2021-Feb-14_to_2021-Feb-18_155.5_-29.0

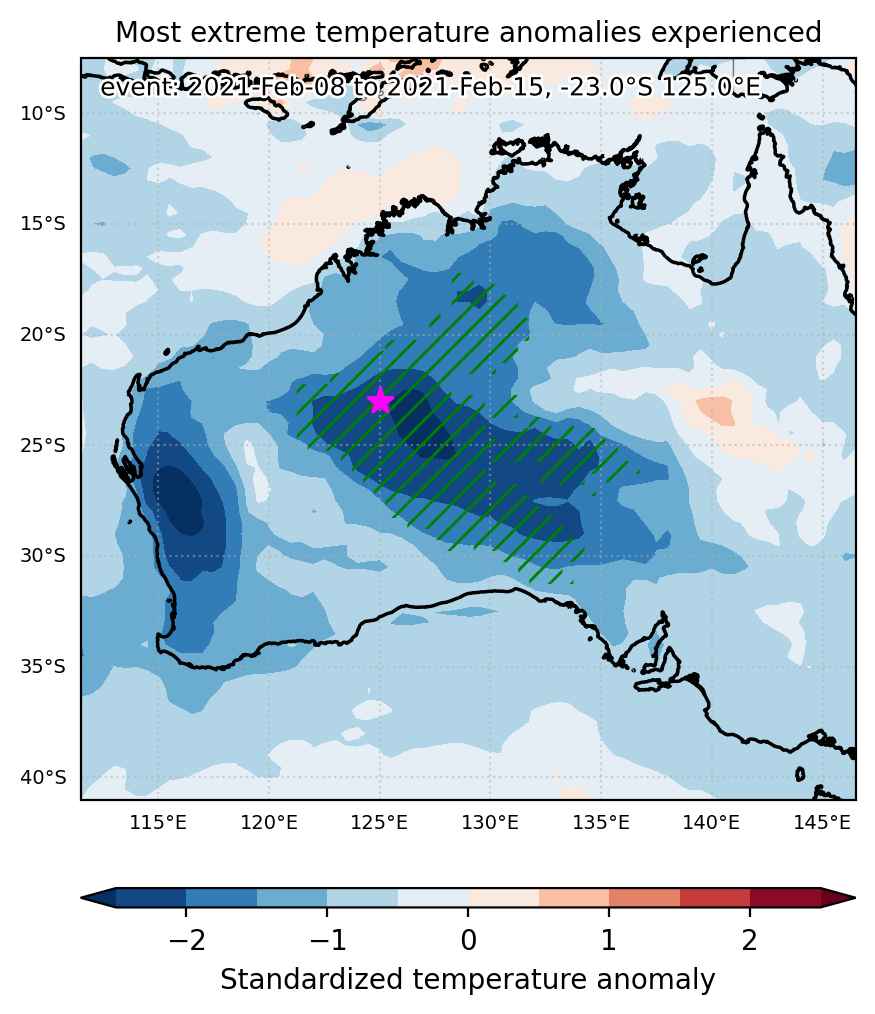
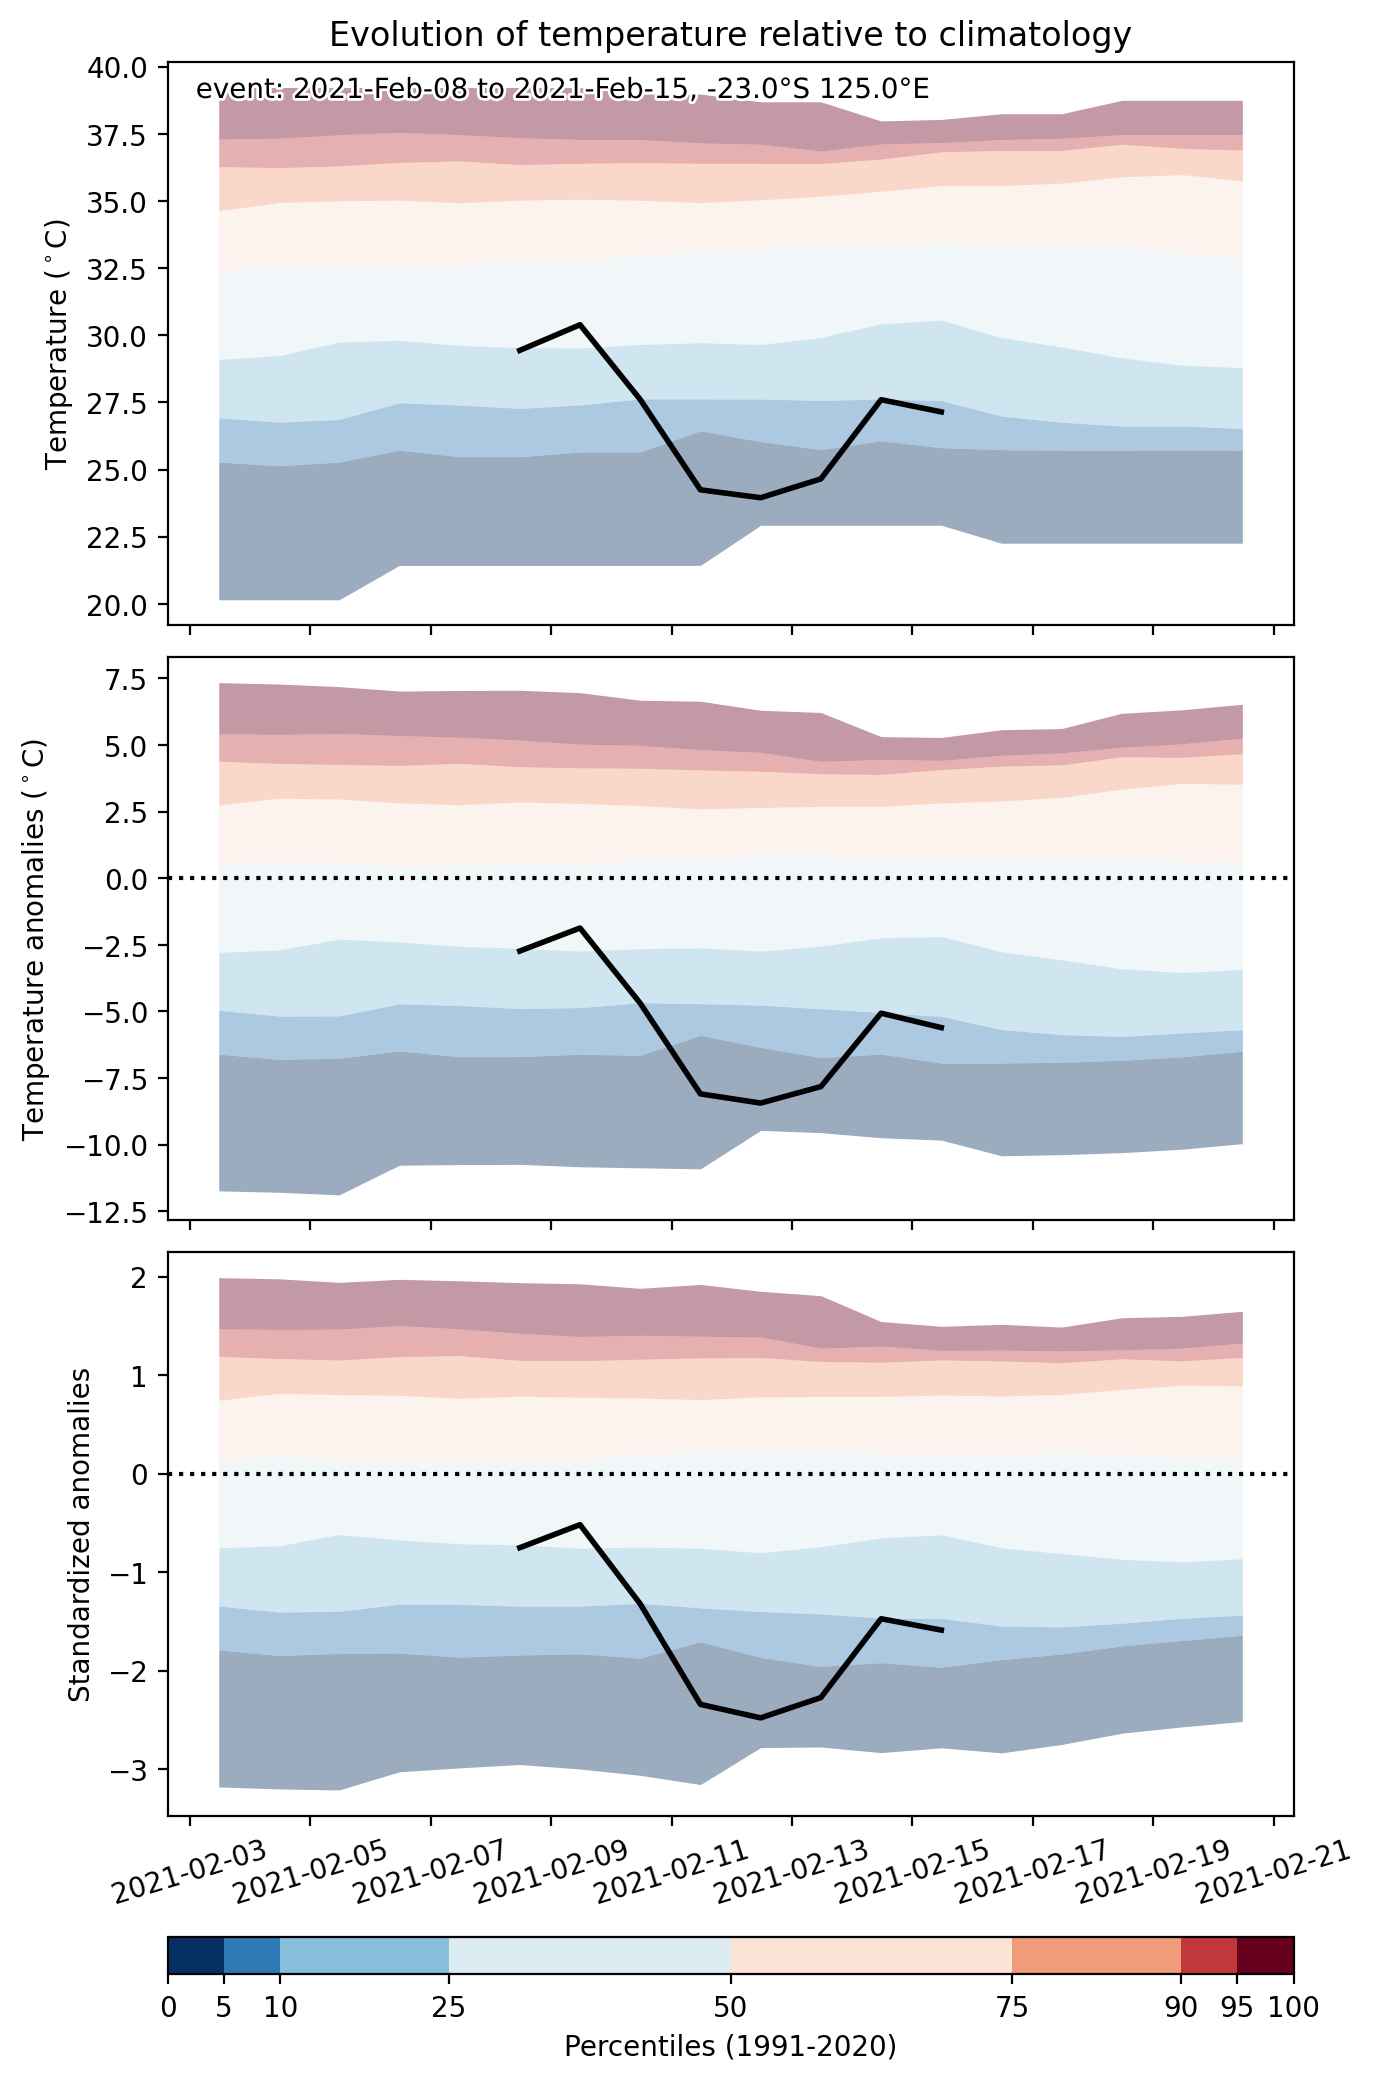
Cold spell occuring from February 08 2021 to February 15 2021 at -23.0°S 125.0°E

Download data: JSON

Event type: Cold spell

Countries affected (identified with ArcGIS Online; provided only for geographical reference):

  • Australia

Duration: 8 days

Time span: February 08 2021 to February 15 2021

Statistics over entire affected area:

  • Mean temperature anomaly: -7.0 °C
  • Mean temperature: 23.1 °C
  • Minimum temperature anomaly: -12.6 °C
  • Minimum temperature: 16.1 °C

Event center: -23.0°S 125.0°E

Area affected: 1046488 km$^2$


Fig. 1: Map of most extreme temperature anomalies (standardized) experienced during the event. The purple star indicates the center of the extreme event. Green hatching illustrates all areas under the effect of extremes at some time during the event.


Fig. 2: Evolution of temperature at the center of the event. The climatological percentile distribution is illustrated with color shadings.


Fig. 3: Maps illustrating the evolution of standardized temperature anomalies during the event.

Event ID: Cold_spell_2021-Feb-08_to_2021-Feb-15_125.0_-23.0

Heat wave occuring from February 08 2021 to February 12 2021 at -24.0°S 141.5°E

Download data: JSON

Event type: Heat wave

Countries affected (identified with ArcGIS Online; provided only for geographical reference):

  • Australia

Duration: 5 days

Time span: February 08 2021 to February 12 2021

Statistics over entire affected area:

  • Mean temperature anomaly: 4.6 °C
  • Mean temperature: 35.4 °C
  • Maximum temperature anomaly: 6.3 °C
  • Maximum temperature: 37.6 °C

Event center: -24.0°S 141.5°E

Area affected: 132412 km$^2$


Fig. 1: Map of most extreme temperature anomalies (standardized) experienced during the event. The purple star indicates the center of the extreme event. Green hatching illustrates all areas under the effect of extremes at some time during the event.


Fig. 2: Evolution of temperature at the center of the event. The climatological percentile distribution is illustrated with color shadings.


Fig. 3: Maps illustrating the evolution of standardized temperature anomalies during the event.

Event ID: Heat_wave_2021-Feb-08_to_2021-Feb-12_141.5_-24.0

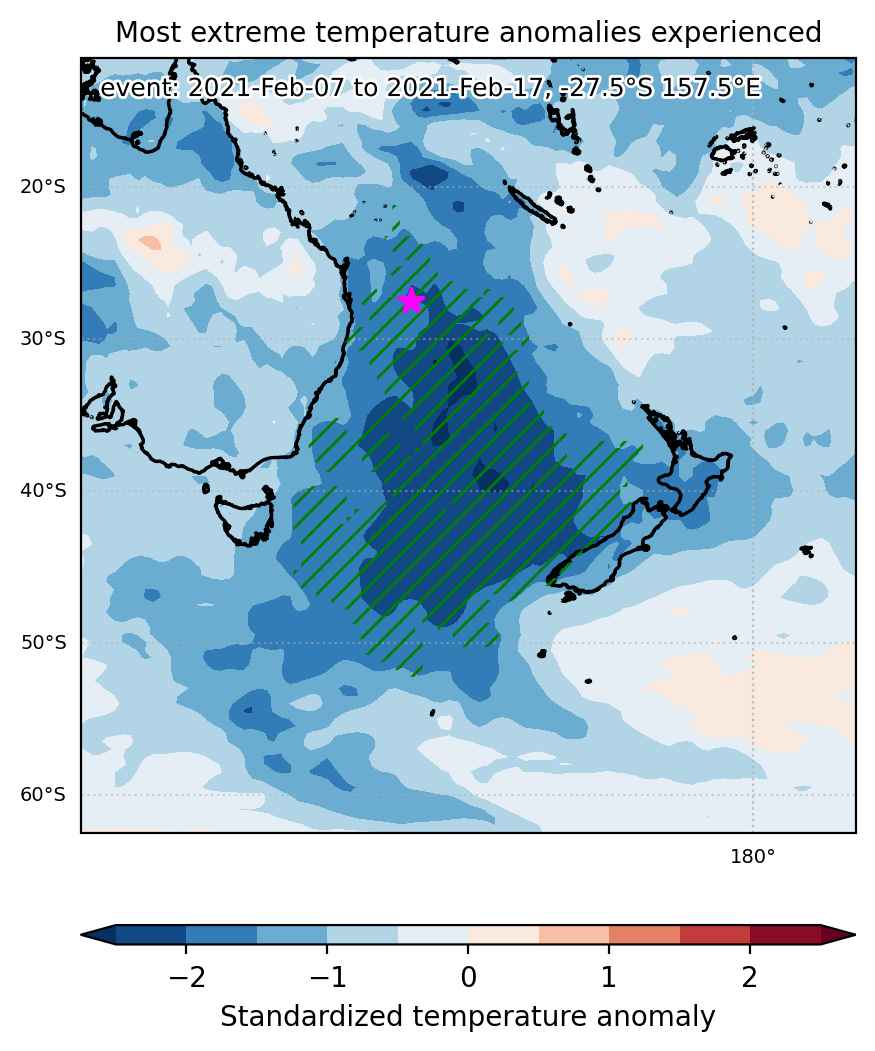
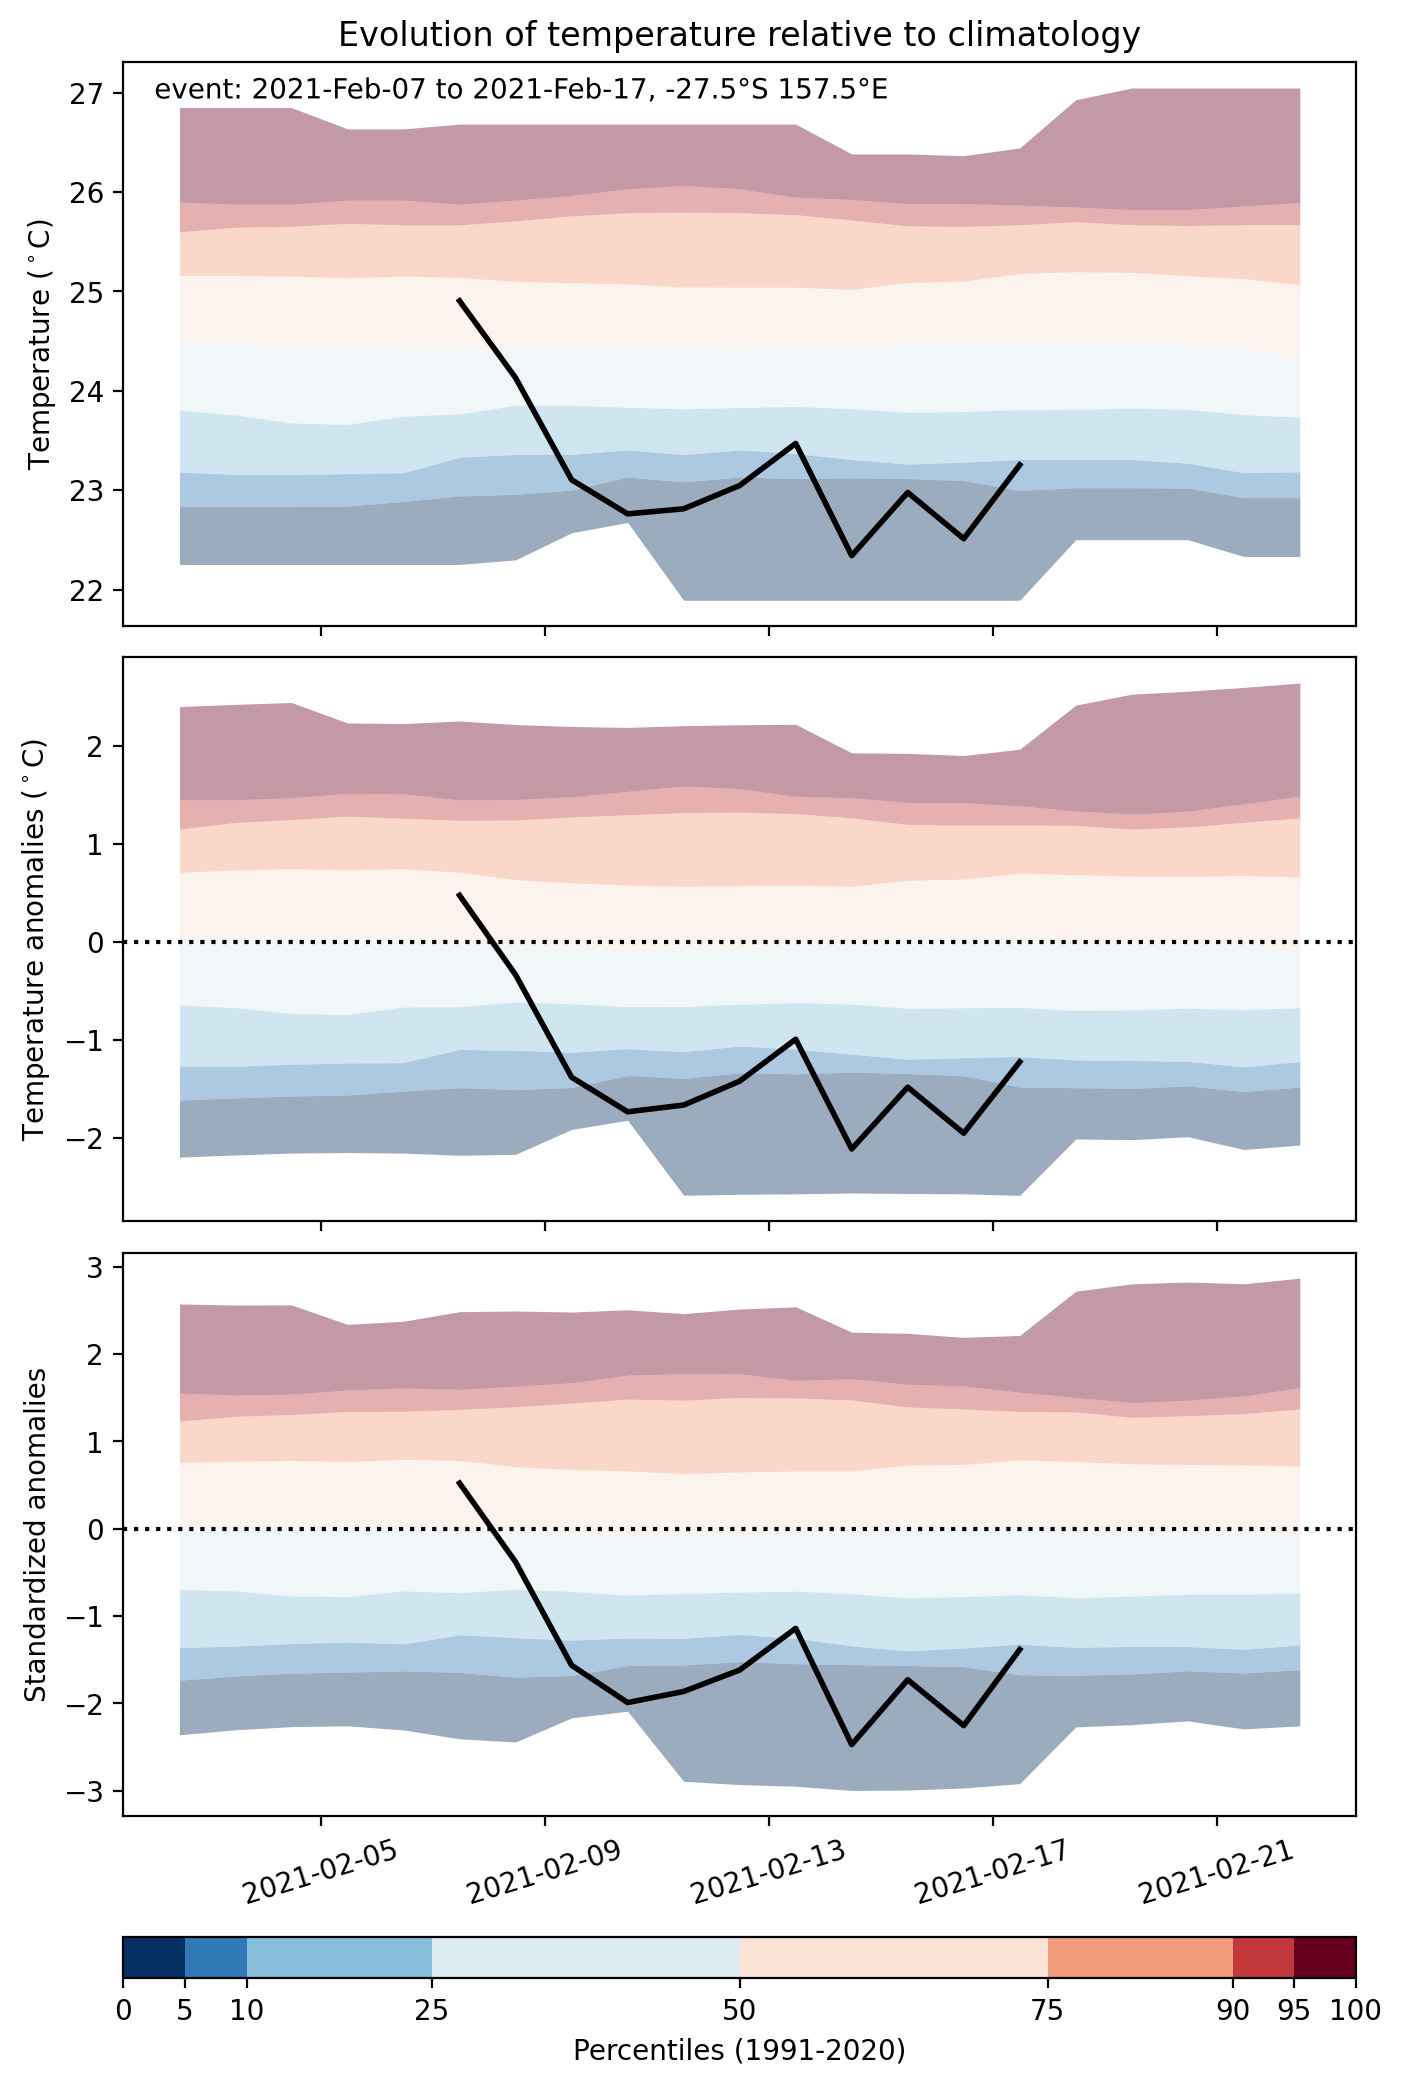
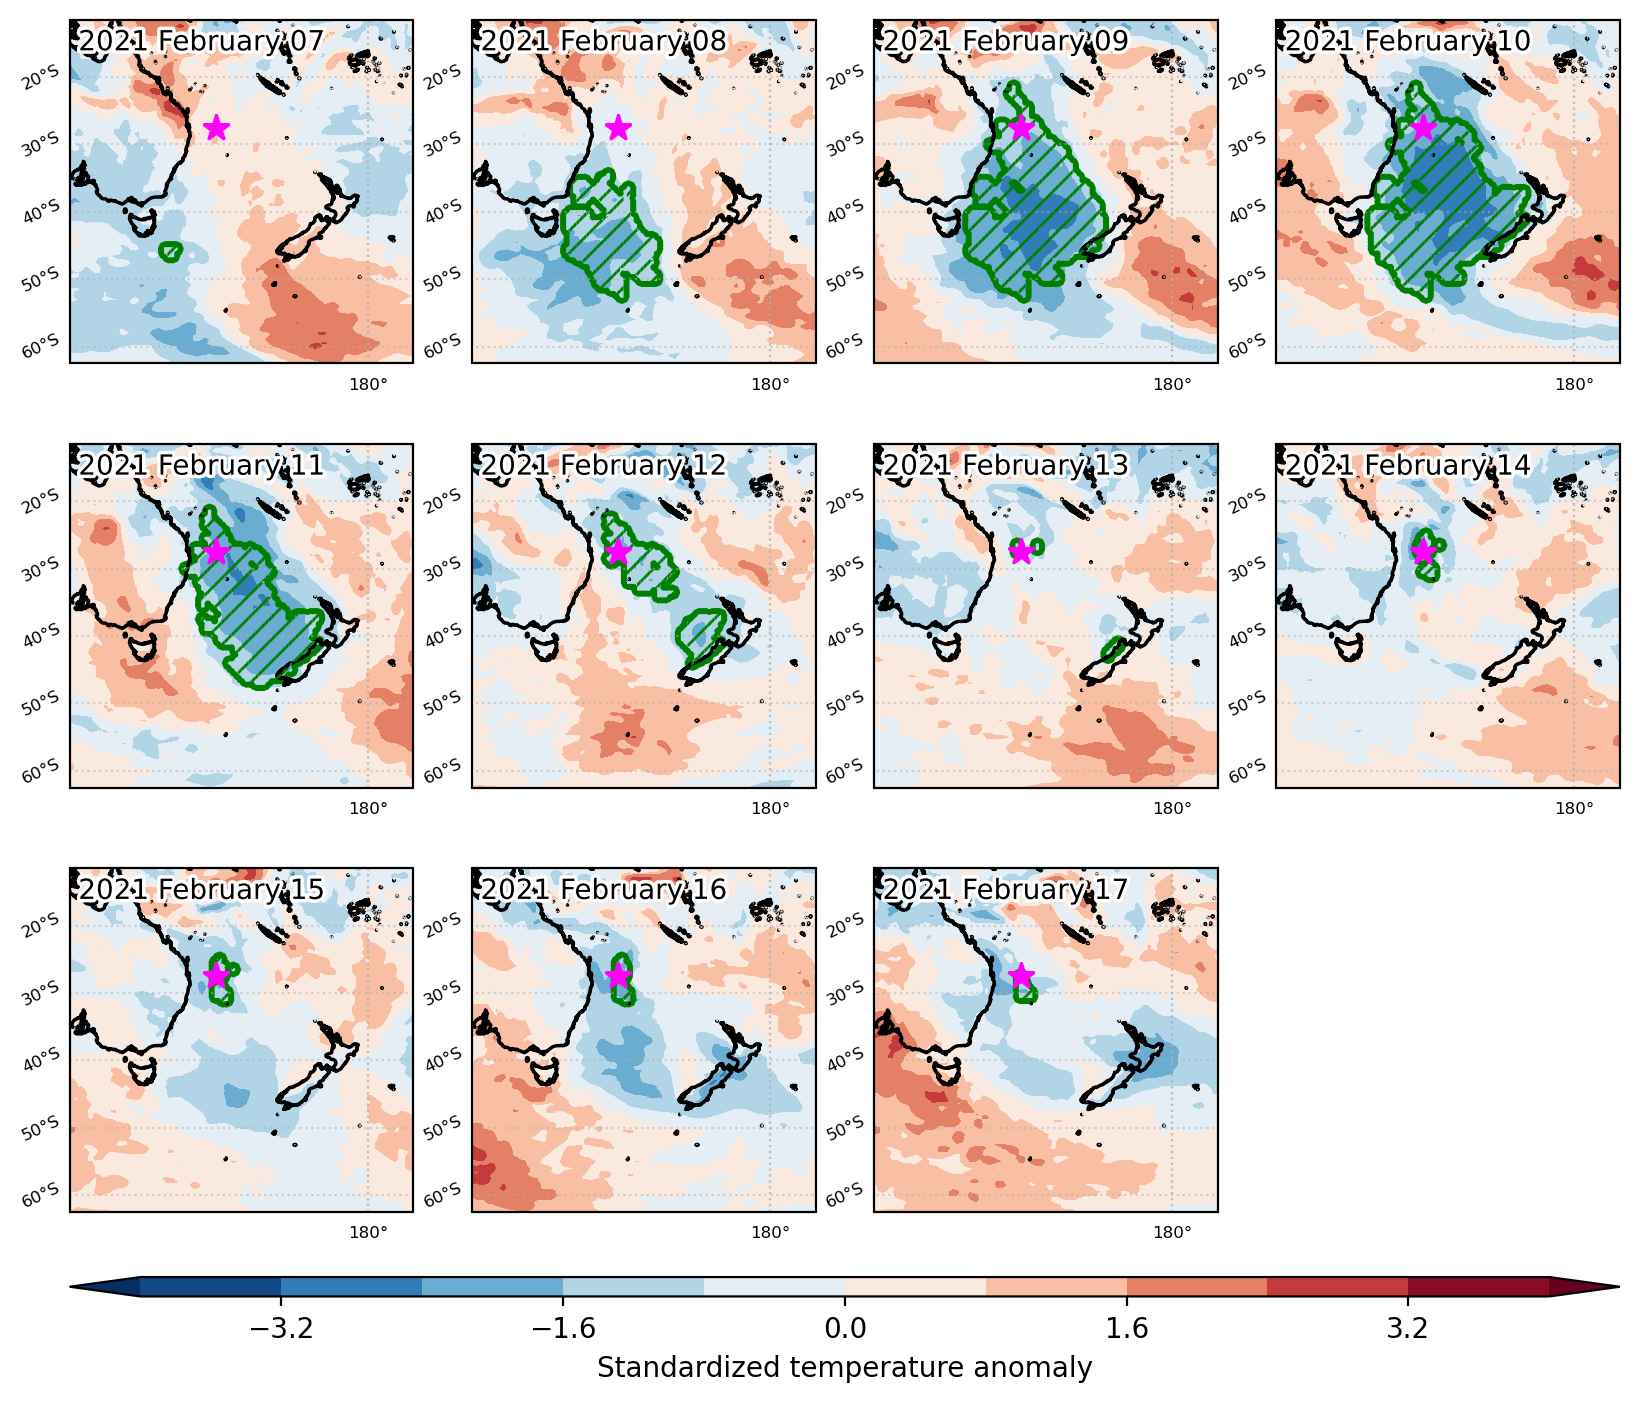
Cold spell occuring from February 07 2021 to February 17 2021 at -27.5°S 157.5°E

Download data: JSON

Event type: Cold spell

Countries affected (identified with ArcGIS Online; provided only for geographical reference):

  • Australia
  • New Zealand

Duration: 11 days

Time span: February 07 2021 to February 17 2021

Statistics over entire affected area:

  • Mean temperature anomaly: -2.6 °C
  • Mean temperature: 15.9 °C
  • Minimum temperature anomaly: -5.0 °C
  • Minimum temperature: 6.7 °C

Event center: -27.5°S 157.5°E

Area affected: 3221272 km$^2$


Fig. 1: Map of most extreme temperature anomalies (standardized) experienced during the event. The purple star indicates the center of the extreme event. Green hatching illustrates all areas under the effect of extremes at some time during the event.


Fig. 2: Evolution of temperature at the center of the event. The climatological percentile distribution is illustrated with color shadings.


Fig. 3: Maps illustrating the evolution of standardized temperature anomalies during the event.

Event ID: Cold_spell_2021-Feb-07_to_2021-Feb-17_157.5_-27.5

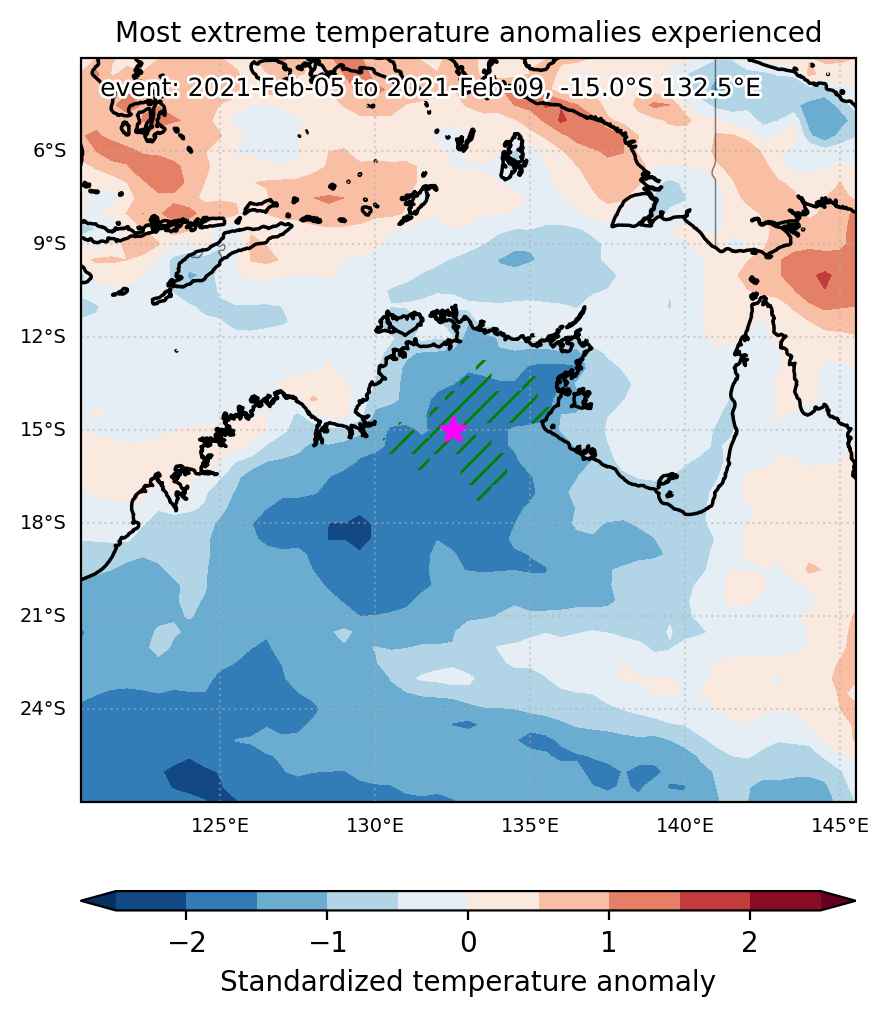
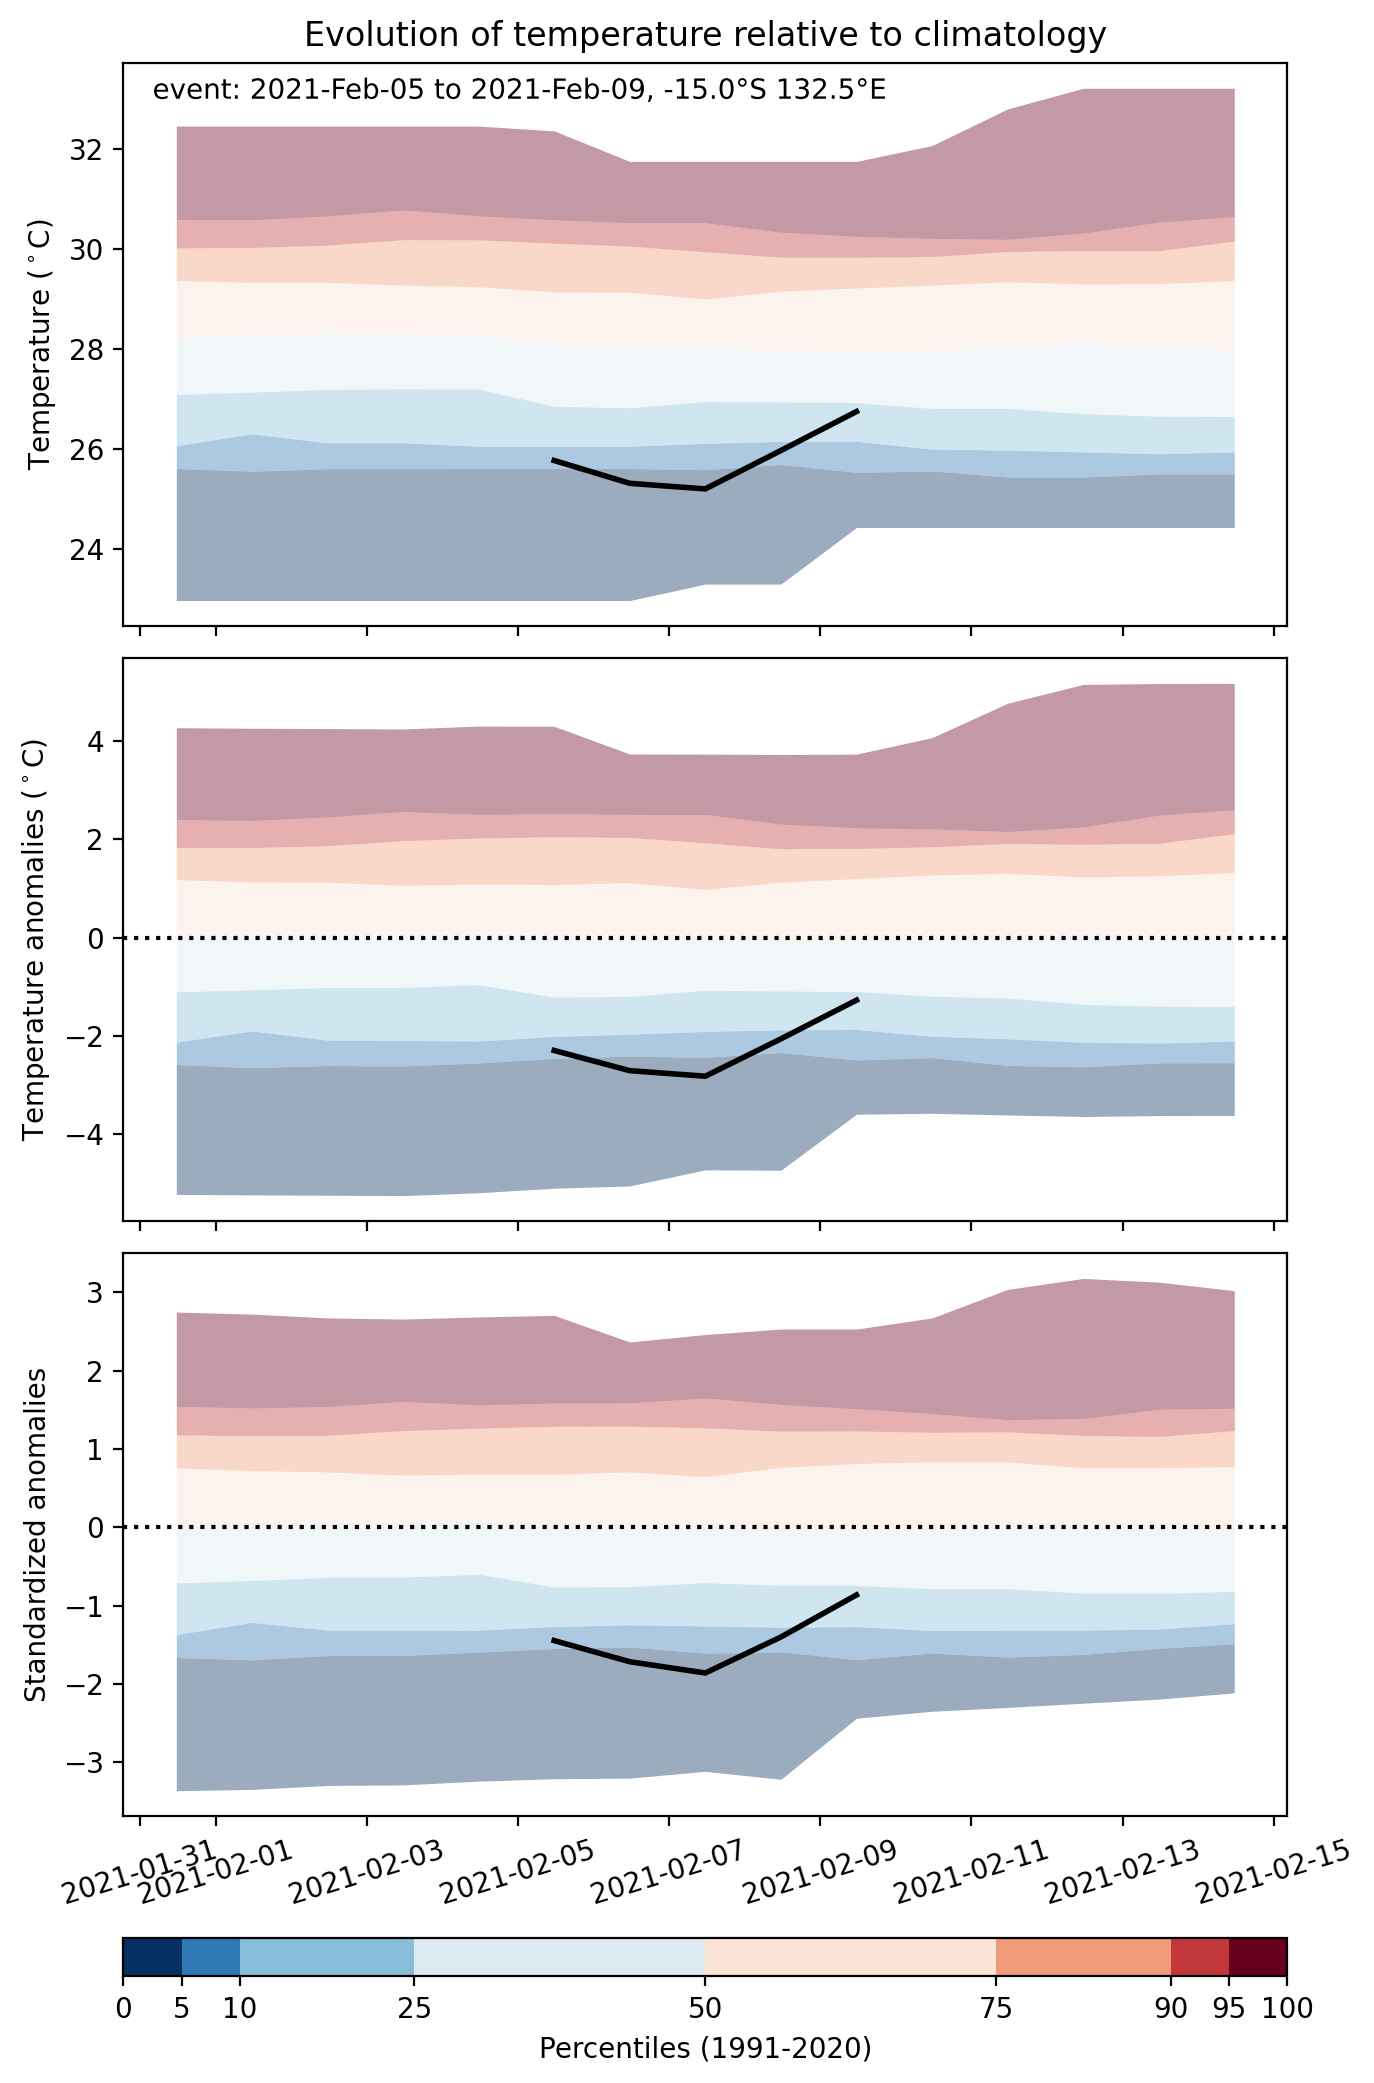
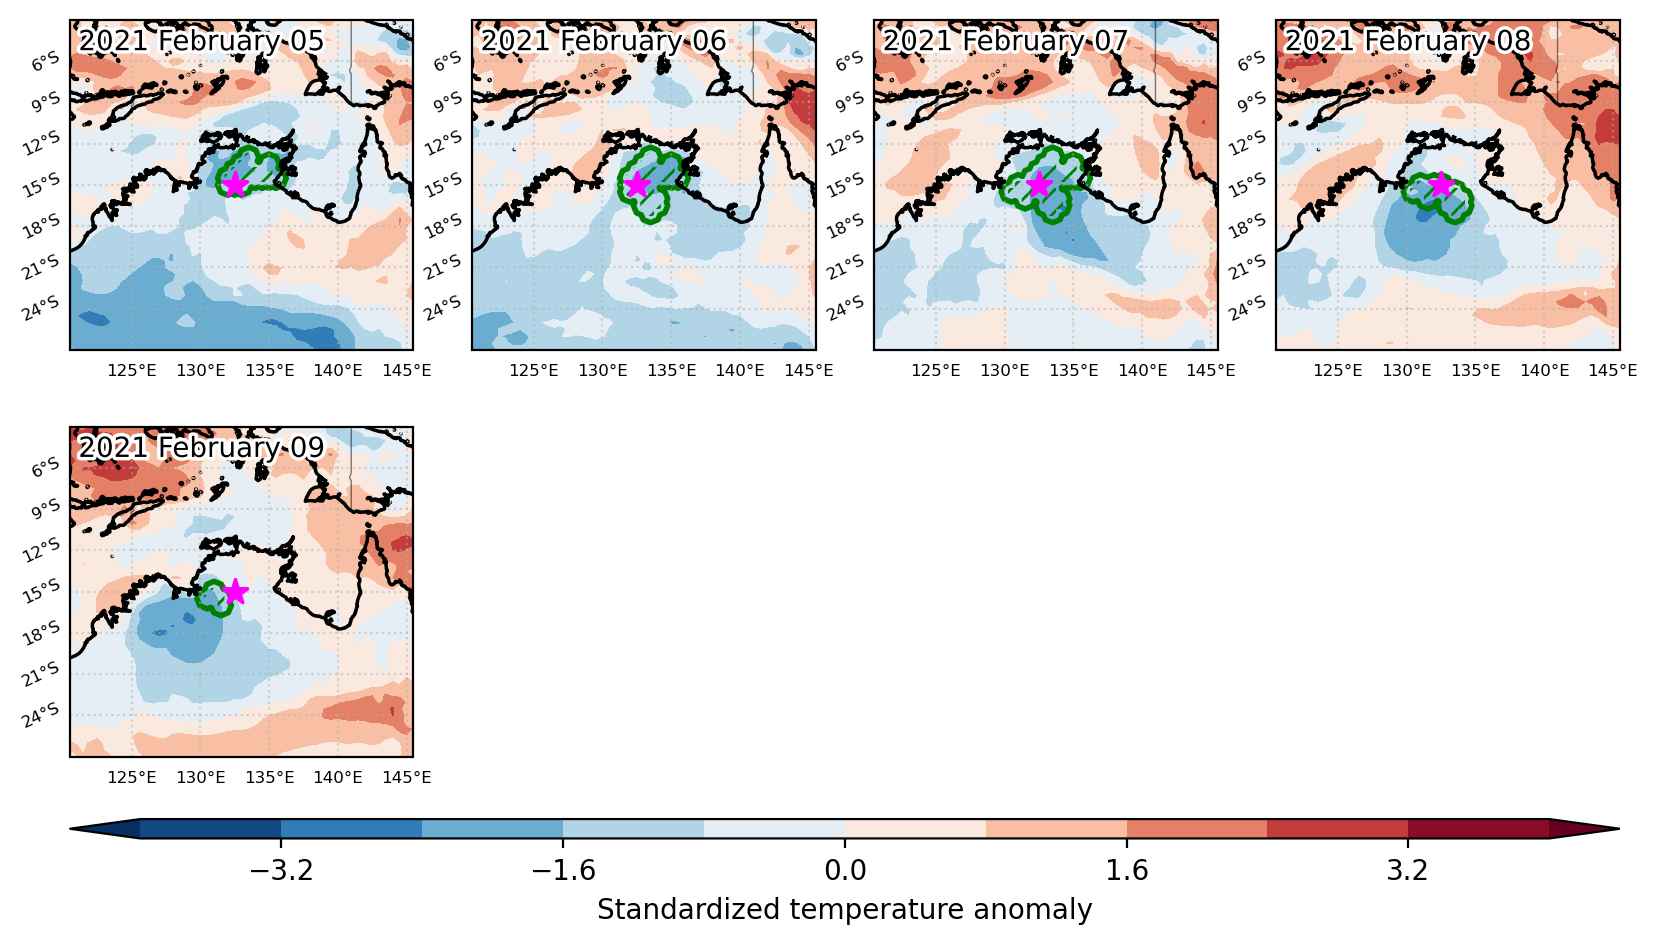
Cold spell occuring from February 05 2021 to February 09 2021 at -15.0°S 132.5°E

Download data: JSON

Event type: Cold spell

Countries affected (identified with ArcGIS Online; provided only for geographical reference):

  • Australia

Duration: 5 days

Time span: February 05 2021 to February 09 2021

Statistics over entire affected area:

  • Mean temperature anomaly: -2.8 °C
  • Mean temperature: 25.3 °C
  • Minimum temperature anomaly: -4.9 °C
  • Minimum temperature: 23.4 °C

Event center: -15.0°S 132.5°E

Area affected: 110491 km$^2$


Fig. 1: Map of most extreme temperature anomalies (standardized) experienced during the event. The purple star indicates the center of the extreme event. Green hatching illustrates all areas under the effect of extremes at some time during the event.


Fig. 2: Evolution of temperature at the center of the event. The climatological percentile distribution is illustrated with color shadings.


Fig. 3: Maps illustrating the evolution of standardized temperature anomalies during the event.

Event ID: Cold_spell_2021-Feb-05_to_2021-Feb-09_132.5_-15.0

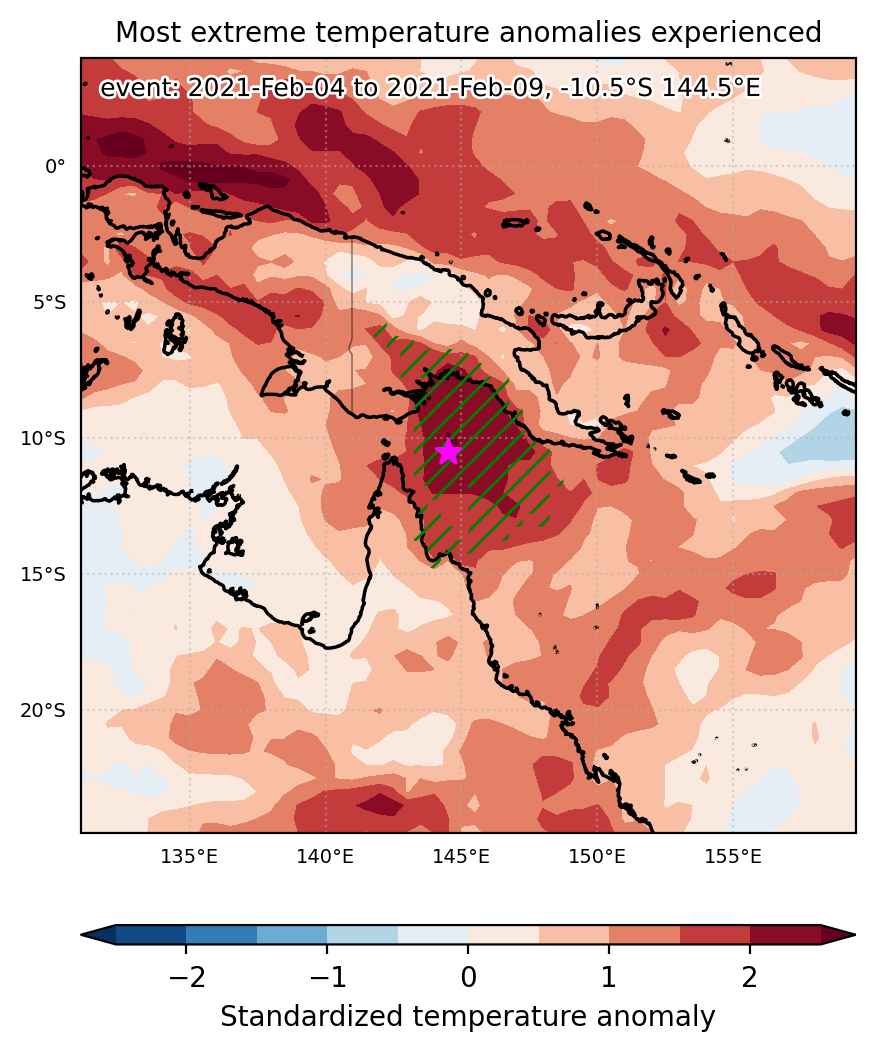
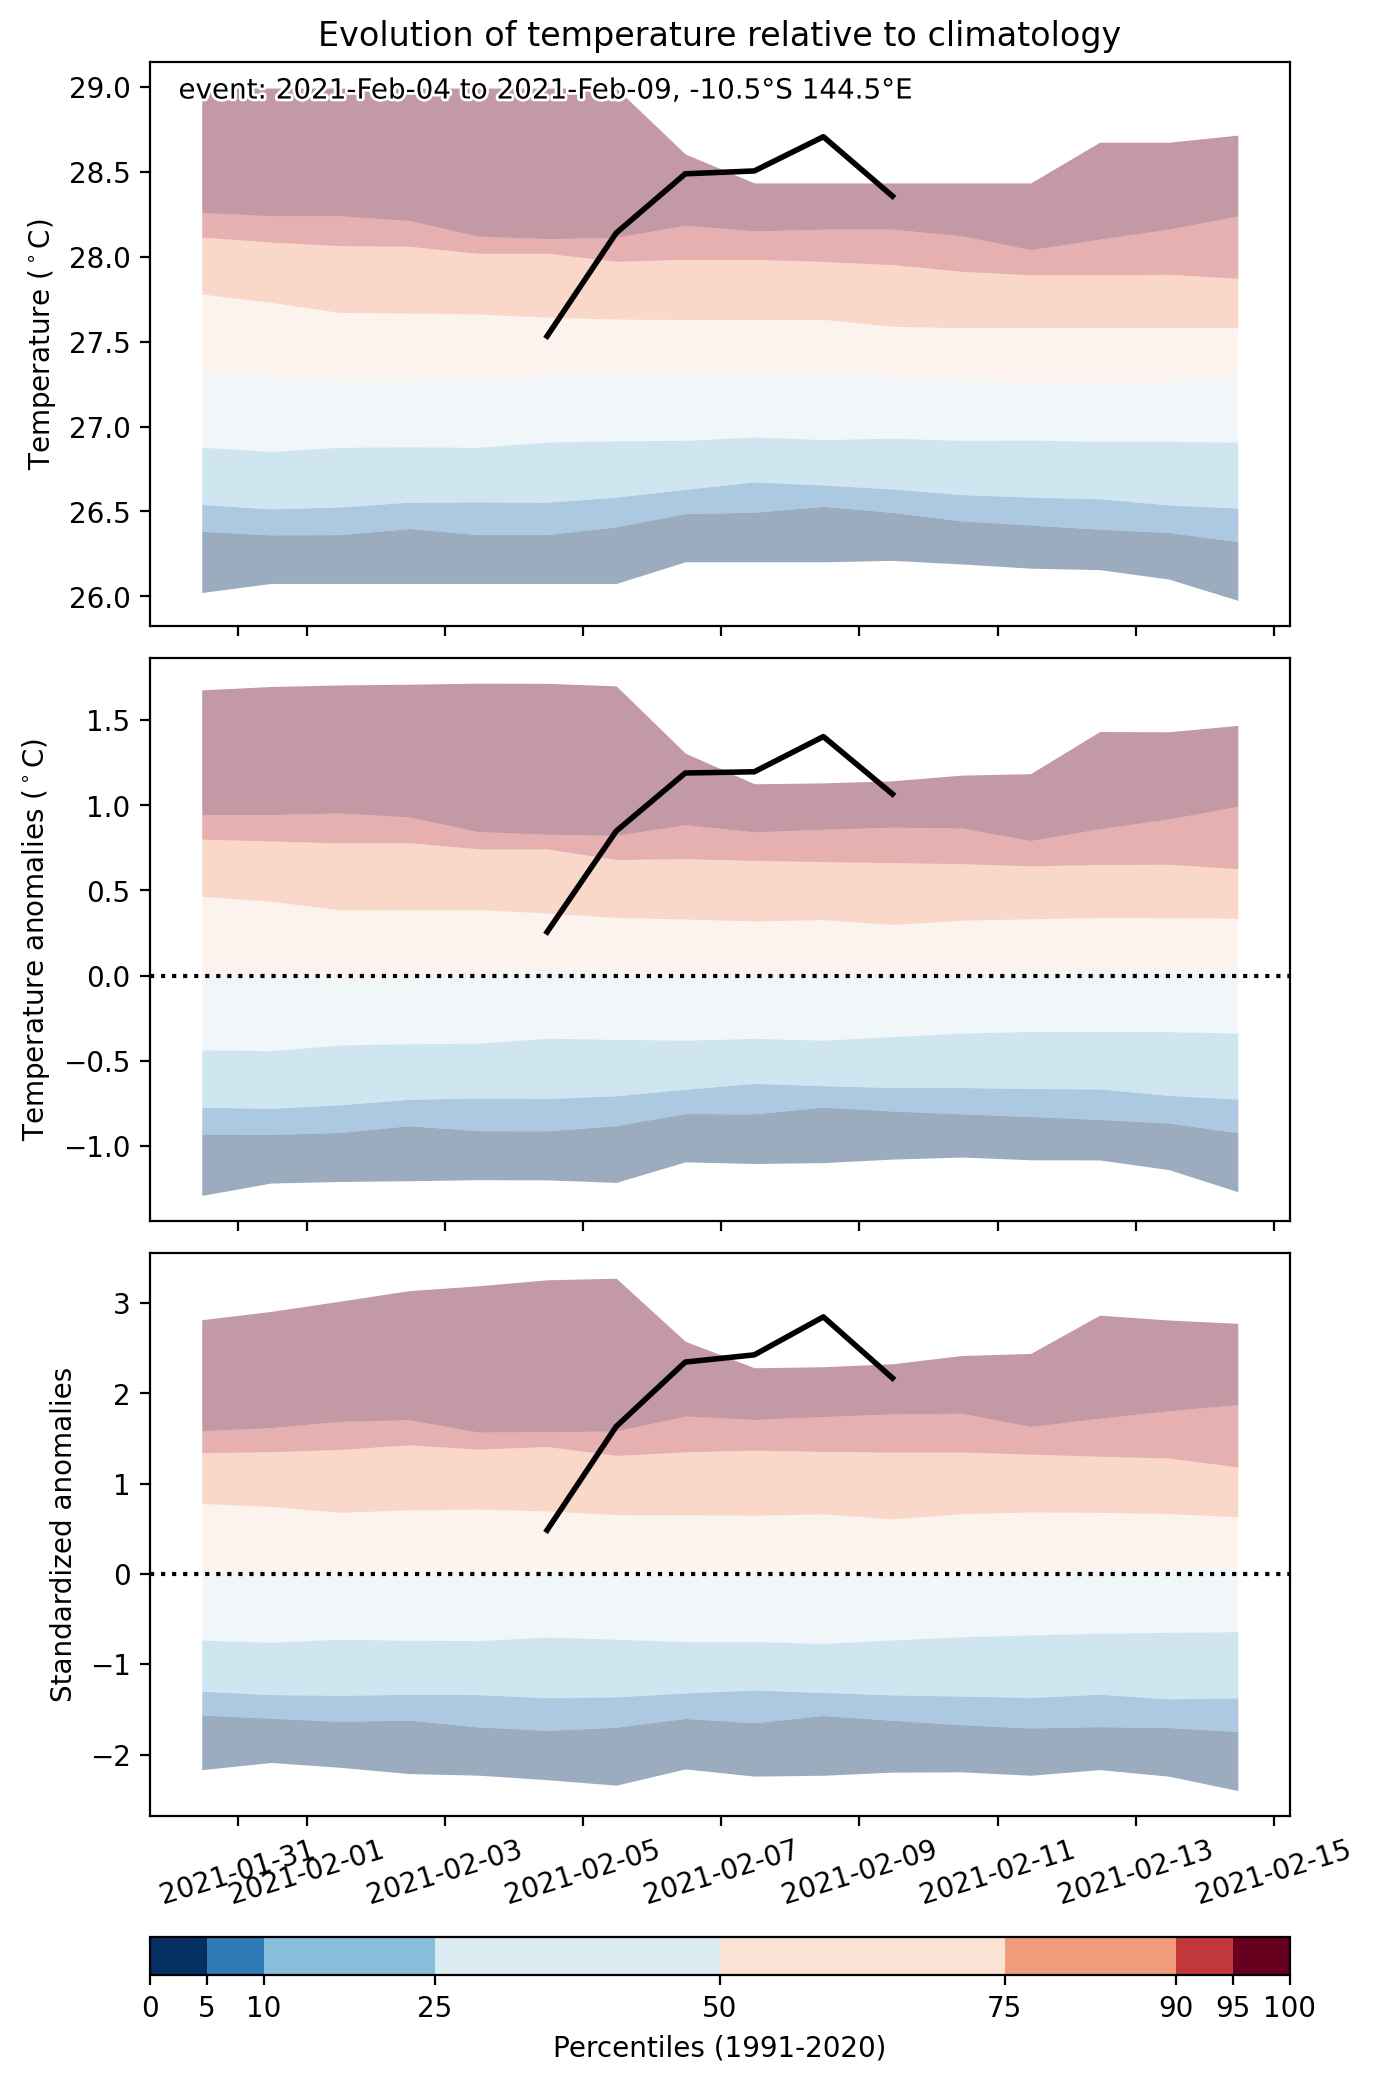
Heat wave occuring from February 04 2021 to February 09 2021 at -10.5°S 144.5°E

Download data: JSON

Event type: Heat wave

Countries affected (identified with ArcGIS Online; provided only for geographical reference):

  • Australia
  • Papua New Guinea

Duration: 6 days

Time span: February 04 2021 to February 09 2021

Statistics over entire affected area:

  • Mean temperature anomaly: 1.3 °C
  • Mean temperature: 28.4 °C
  • Maximum temperature anomaly: 2.4 °C
  • Maximum temperature: 29.9 °C

Event center: -10.5°S 144.5°E

Area affected: 349384 km$^2$


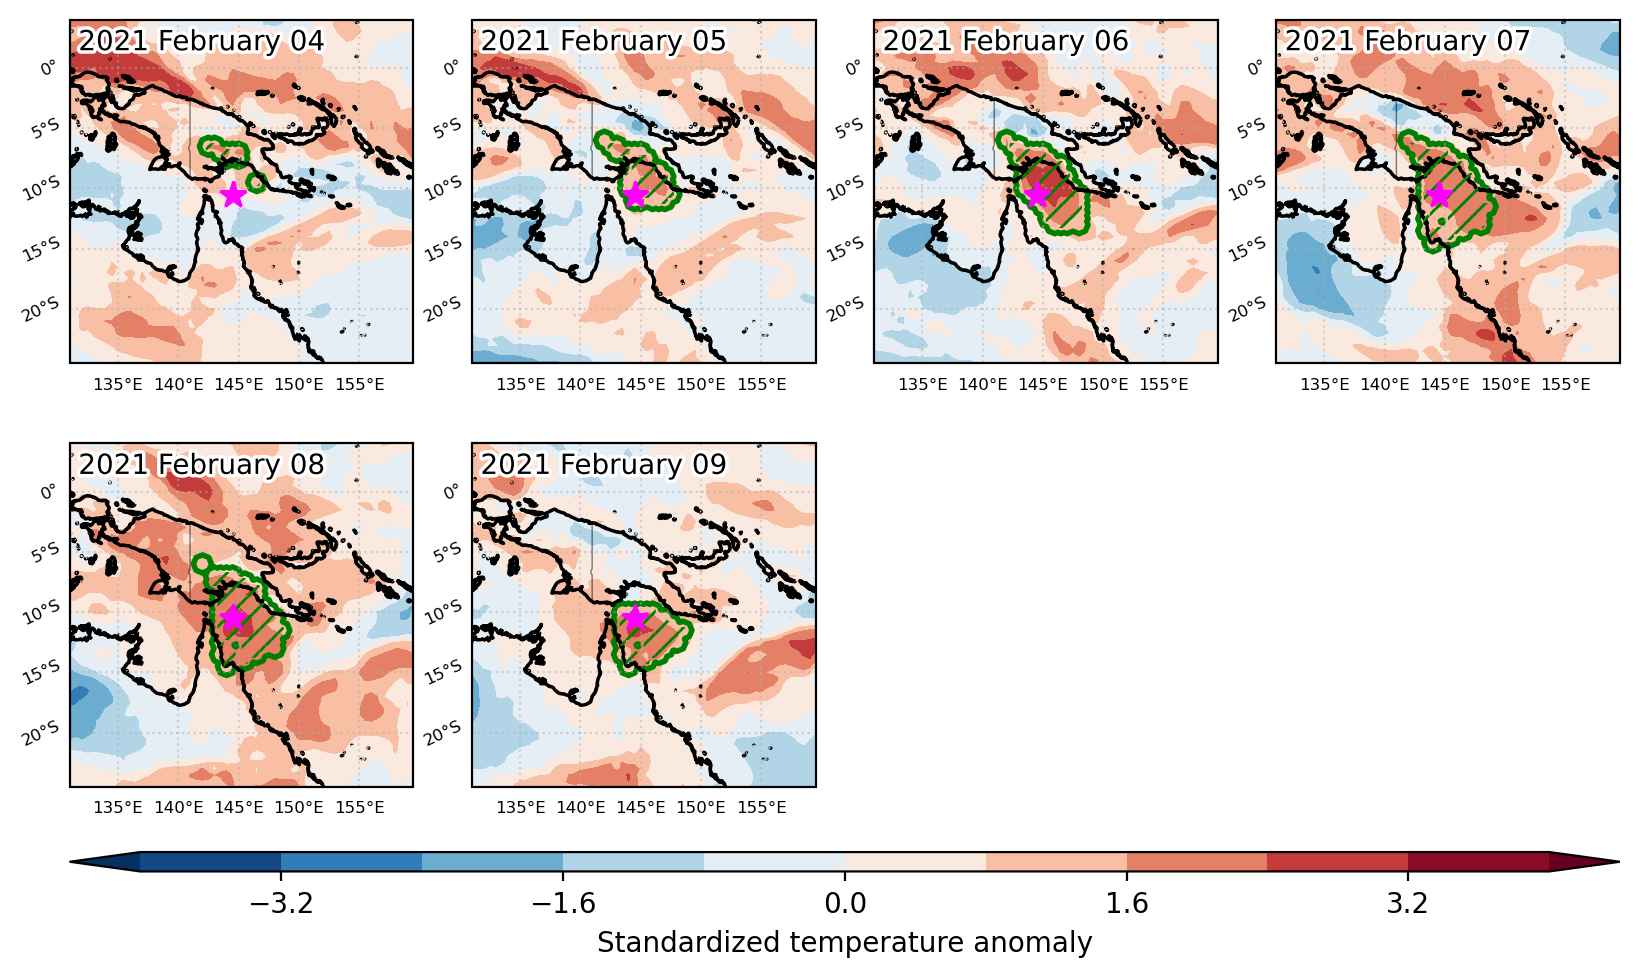
Fig. 1: Map of most extreme temperature anomalies (standardized) experienced during the event. The purple star indicates the center of the extreme event. Green hatching illustrates all areas under the effect of extremes at some time during the event.


Fig. 2: Evolution of temperature at the center of the event. The climatological percentile distribution is illustrated with color shadings.


Fig. 3: Maps illustrating the evolution of standardized temperature anomalies during the event.

Event ID: Heat_wave_2021-Feb-04_to_2021-Feb-09_144.5_-10.5

Heat wave occuring from February 03 2021 to February 07 2021 at -56.5°S 156.5°E

Download data: JSON

Event type: Heat wave

Countries affected (identified with ArcGIS Online; provided only for geographical reference):

  • Australia

Duration: 5 days

Time span: February 03 2021 to February 07 2021

Statistics over entire affected area:

  • Mean temperature anomaly: 2.0 °C
  • Mean temperature: 8.2 °C
  • Maximum temperature anomaly: 3.1 °C
  • Maximum temperature: 10.6 °C

Event center: -56.5°S 156.5°E

Area affected: 236575 km$^2$


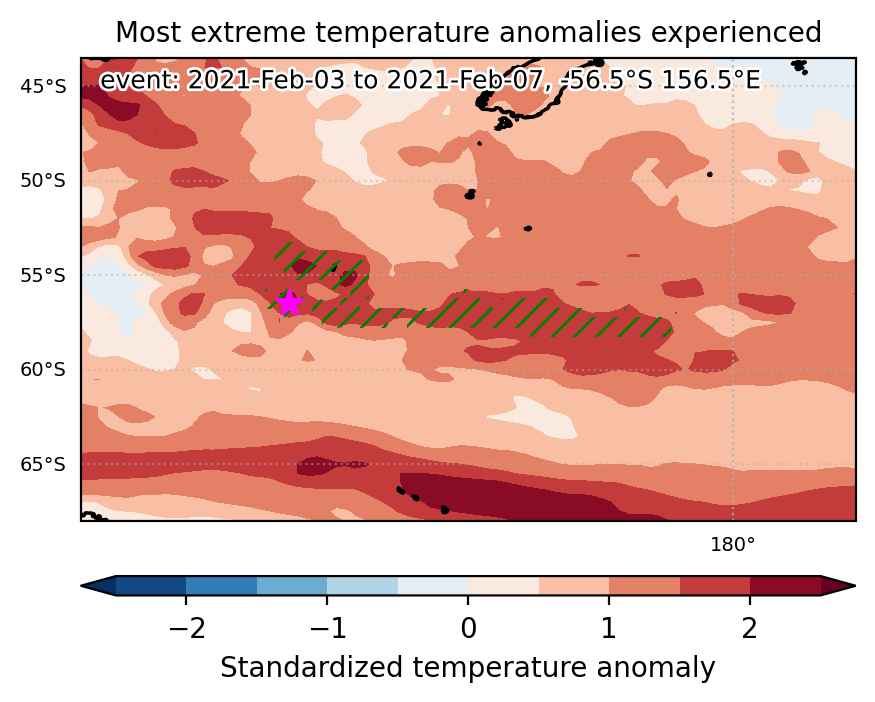
Fig. 1: Map of most extreme temperature anomalies (standardized) experienced during the event. The purple star indicates the center of the extreme event. Green hatching illustrates all areas under the effect of extremes at some time during the event.


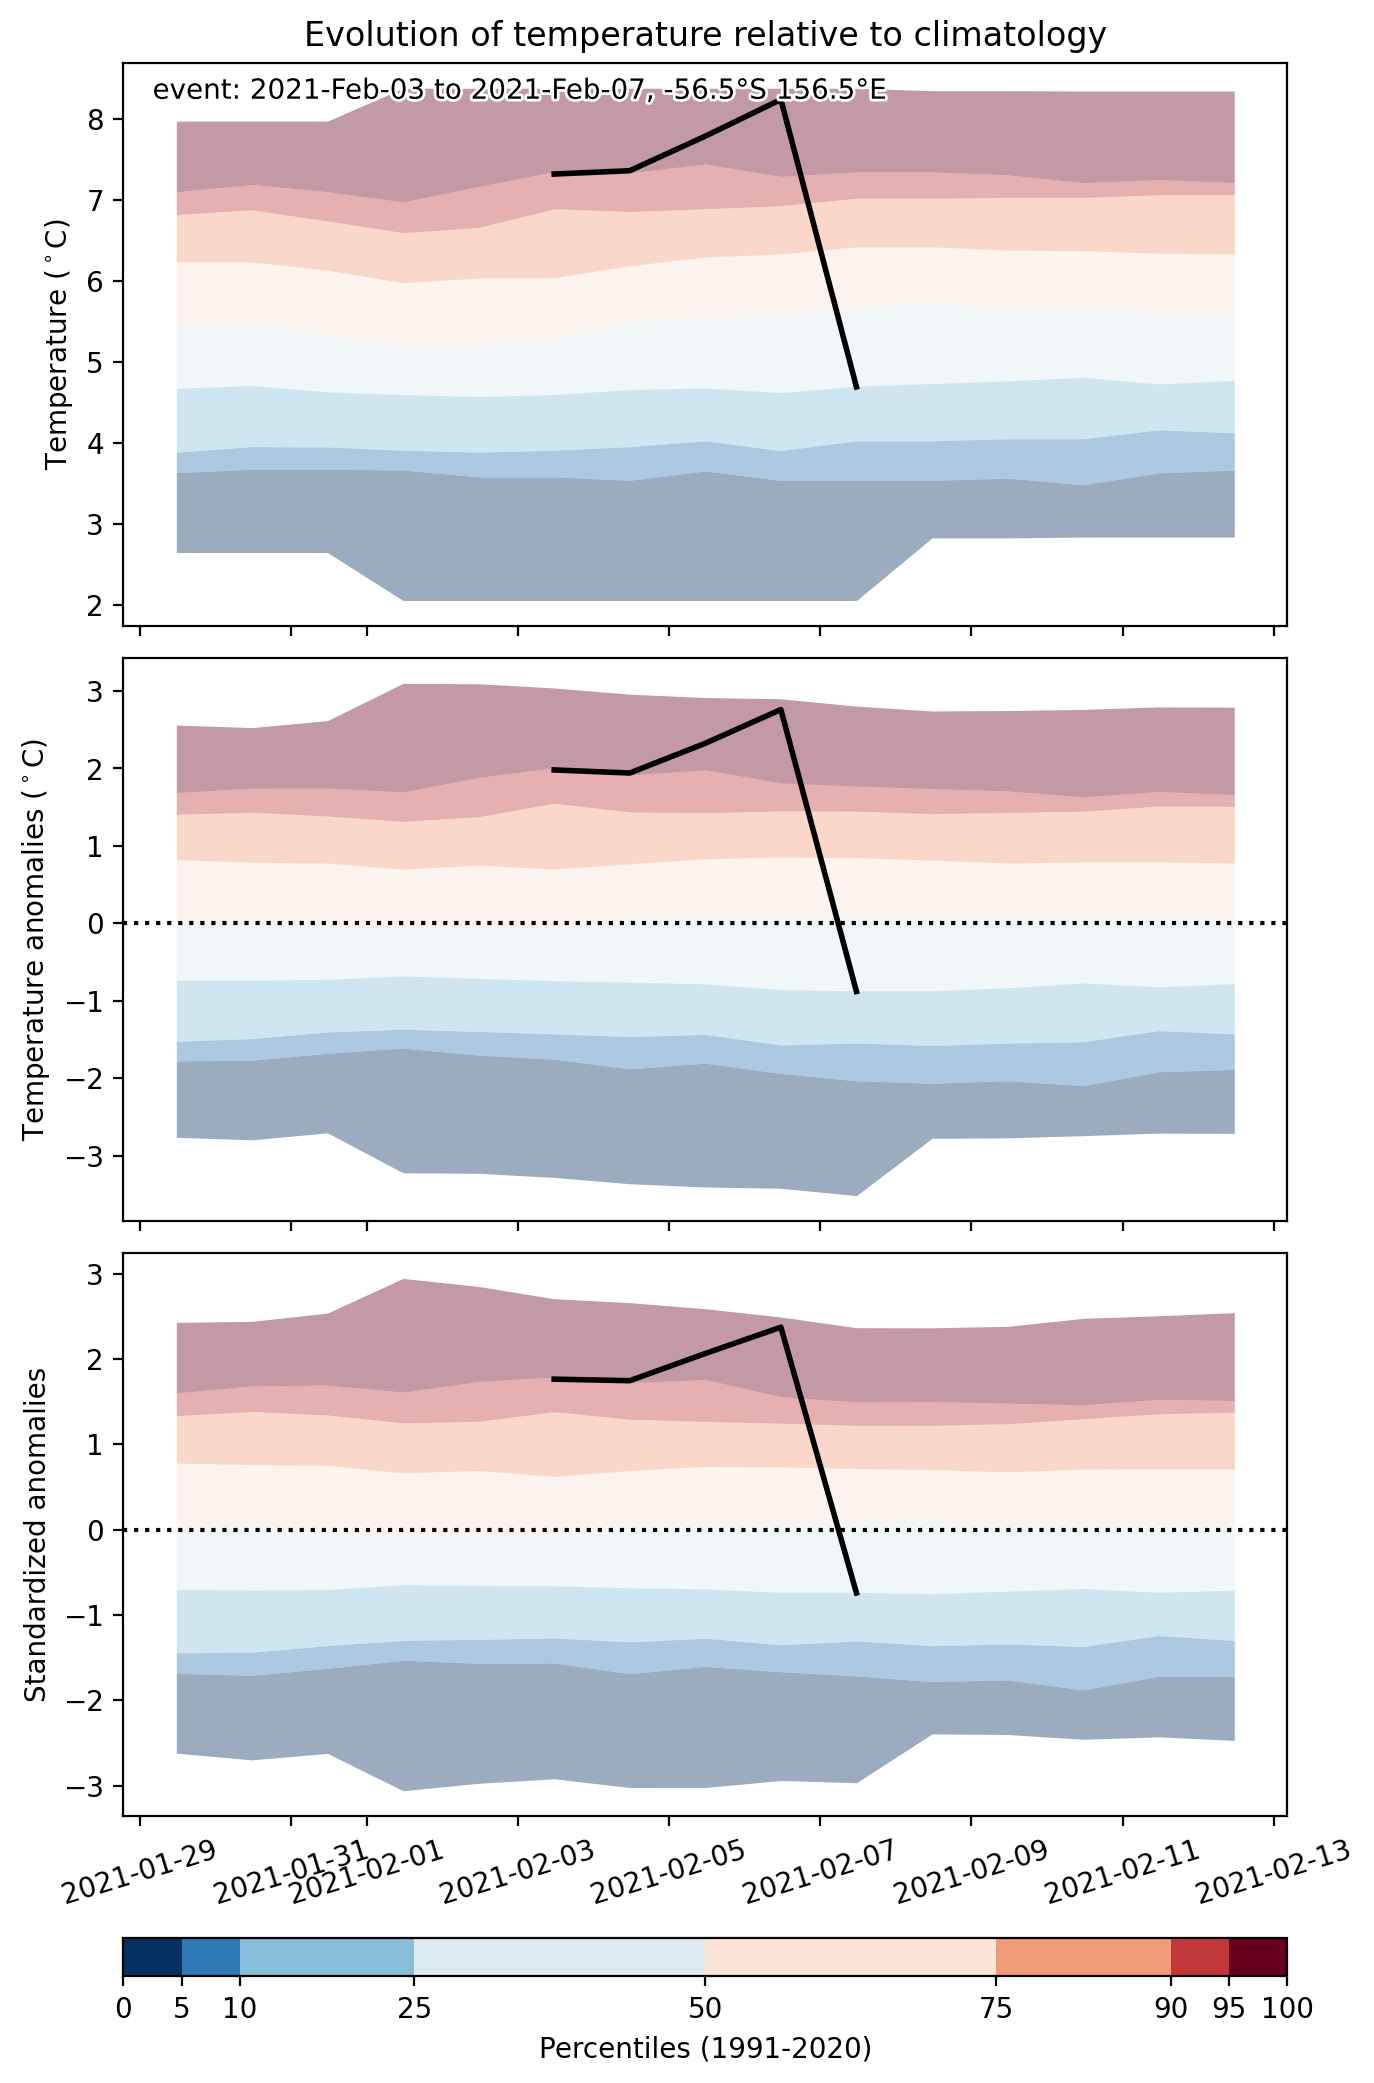
Fig. 2: Evolution of temperature at the center of the event. The climatological percentile distribution is illustrated with color shadings.


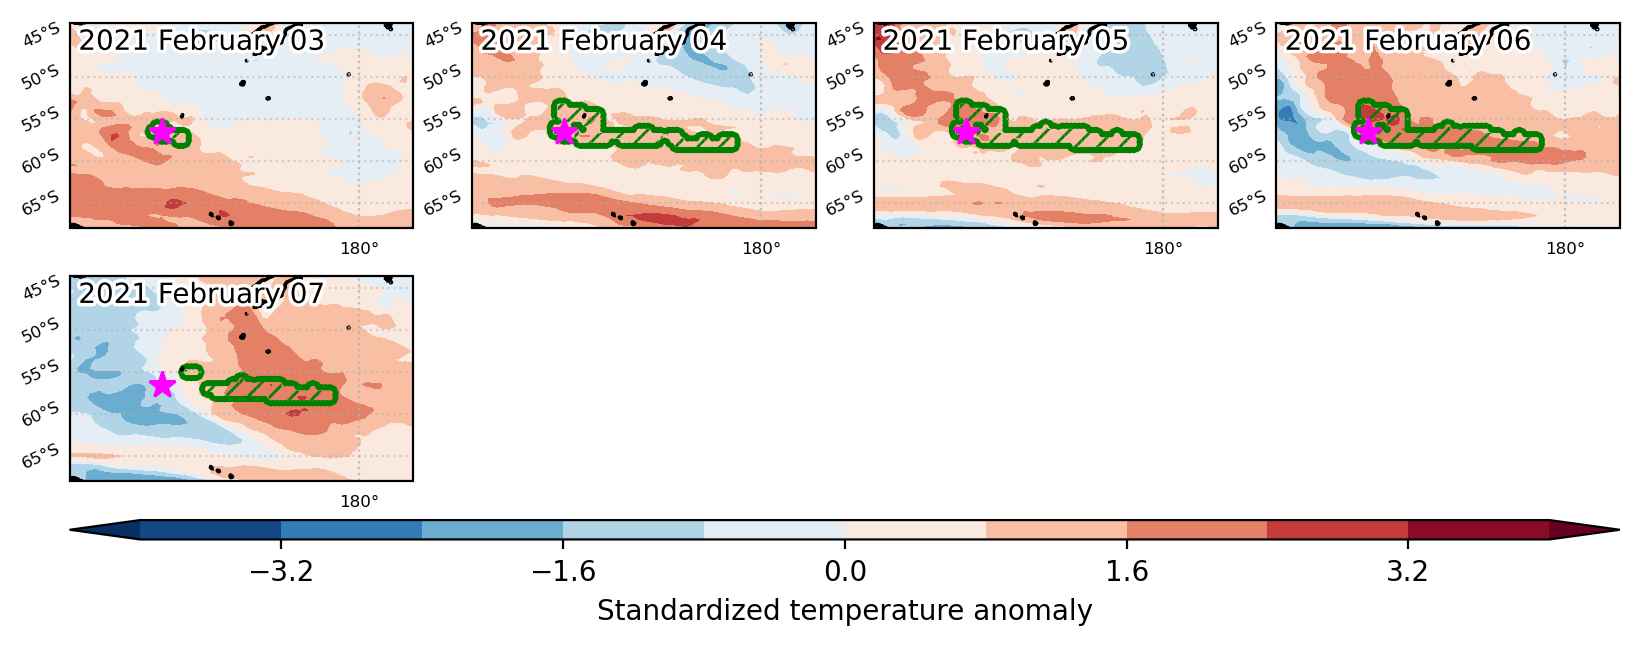
Fig. 3: Maps illustrating the evolution of standardized temperature anomalies during the event.

Event ID: Heat_wave_2021-Feb-03_to_2021-Feb-07_156.5_-56.5

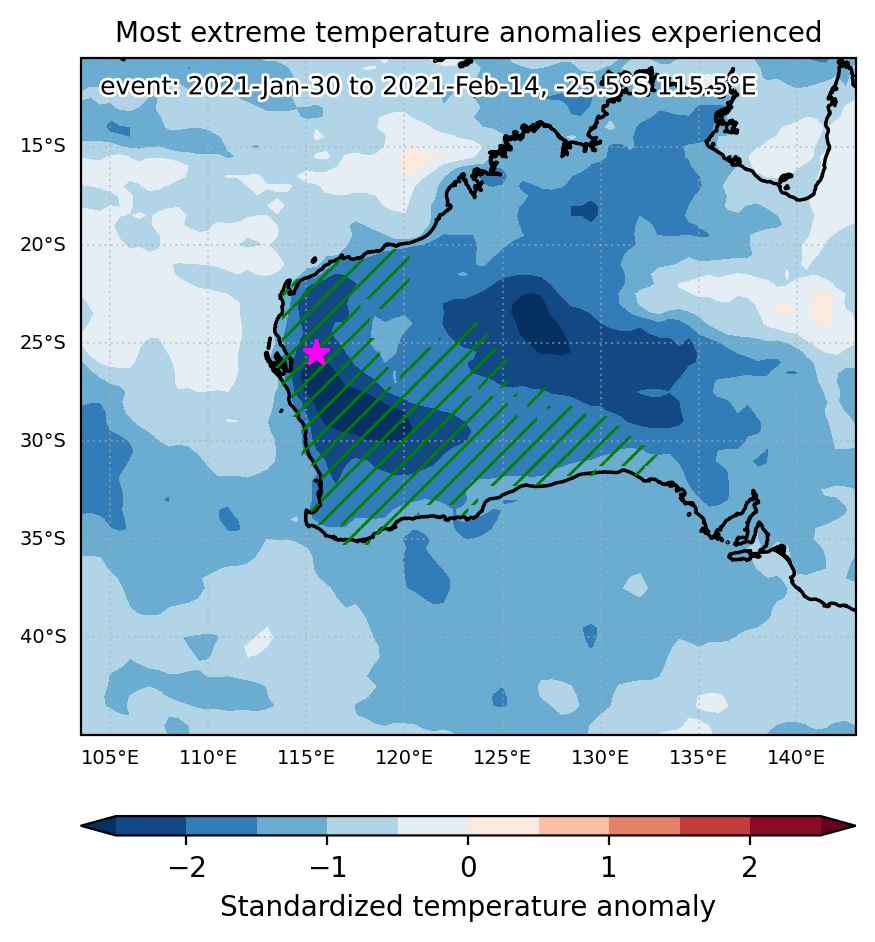
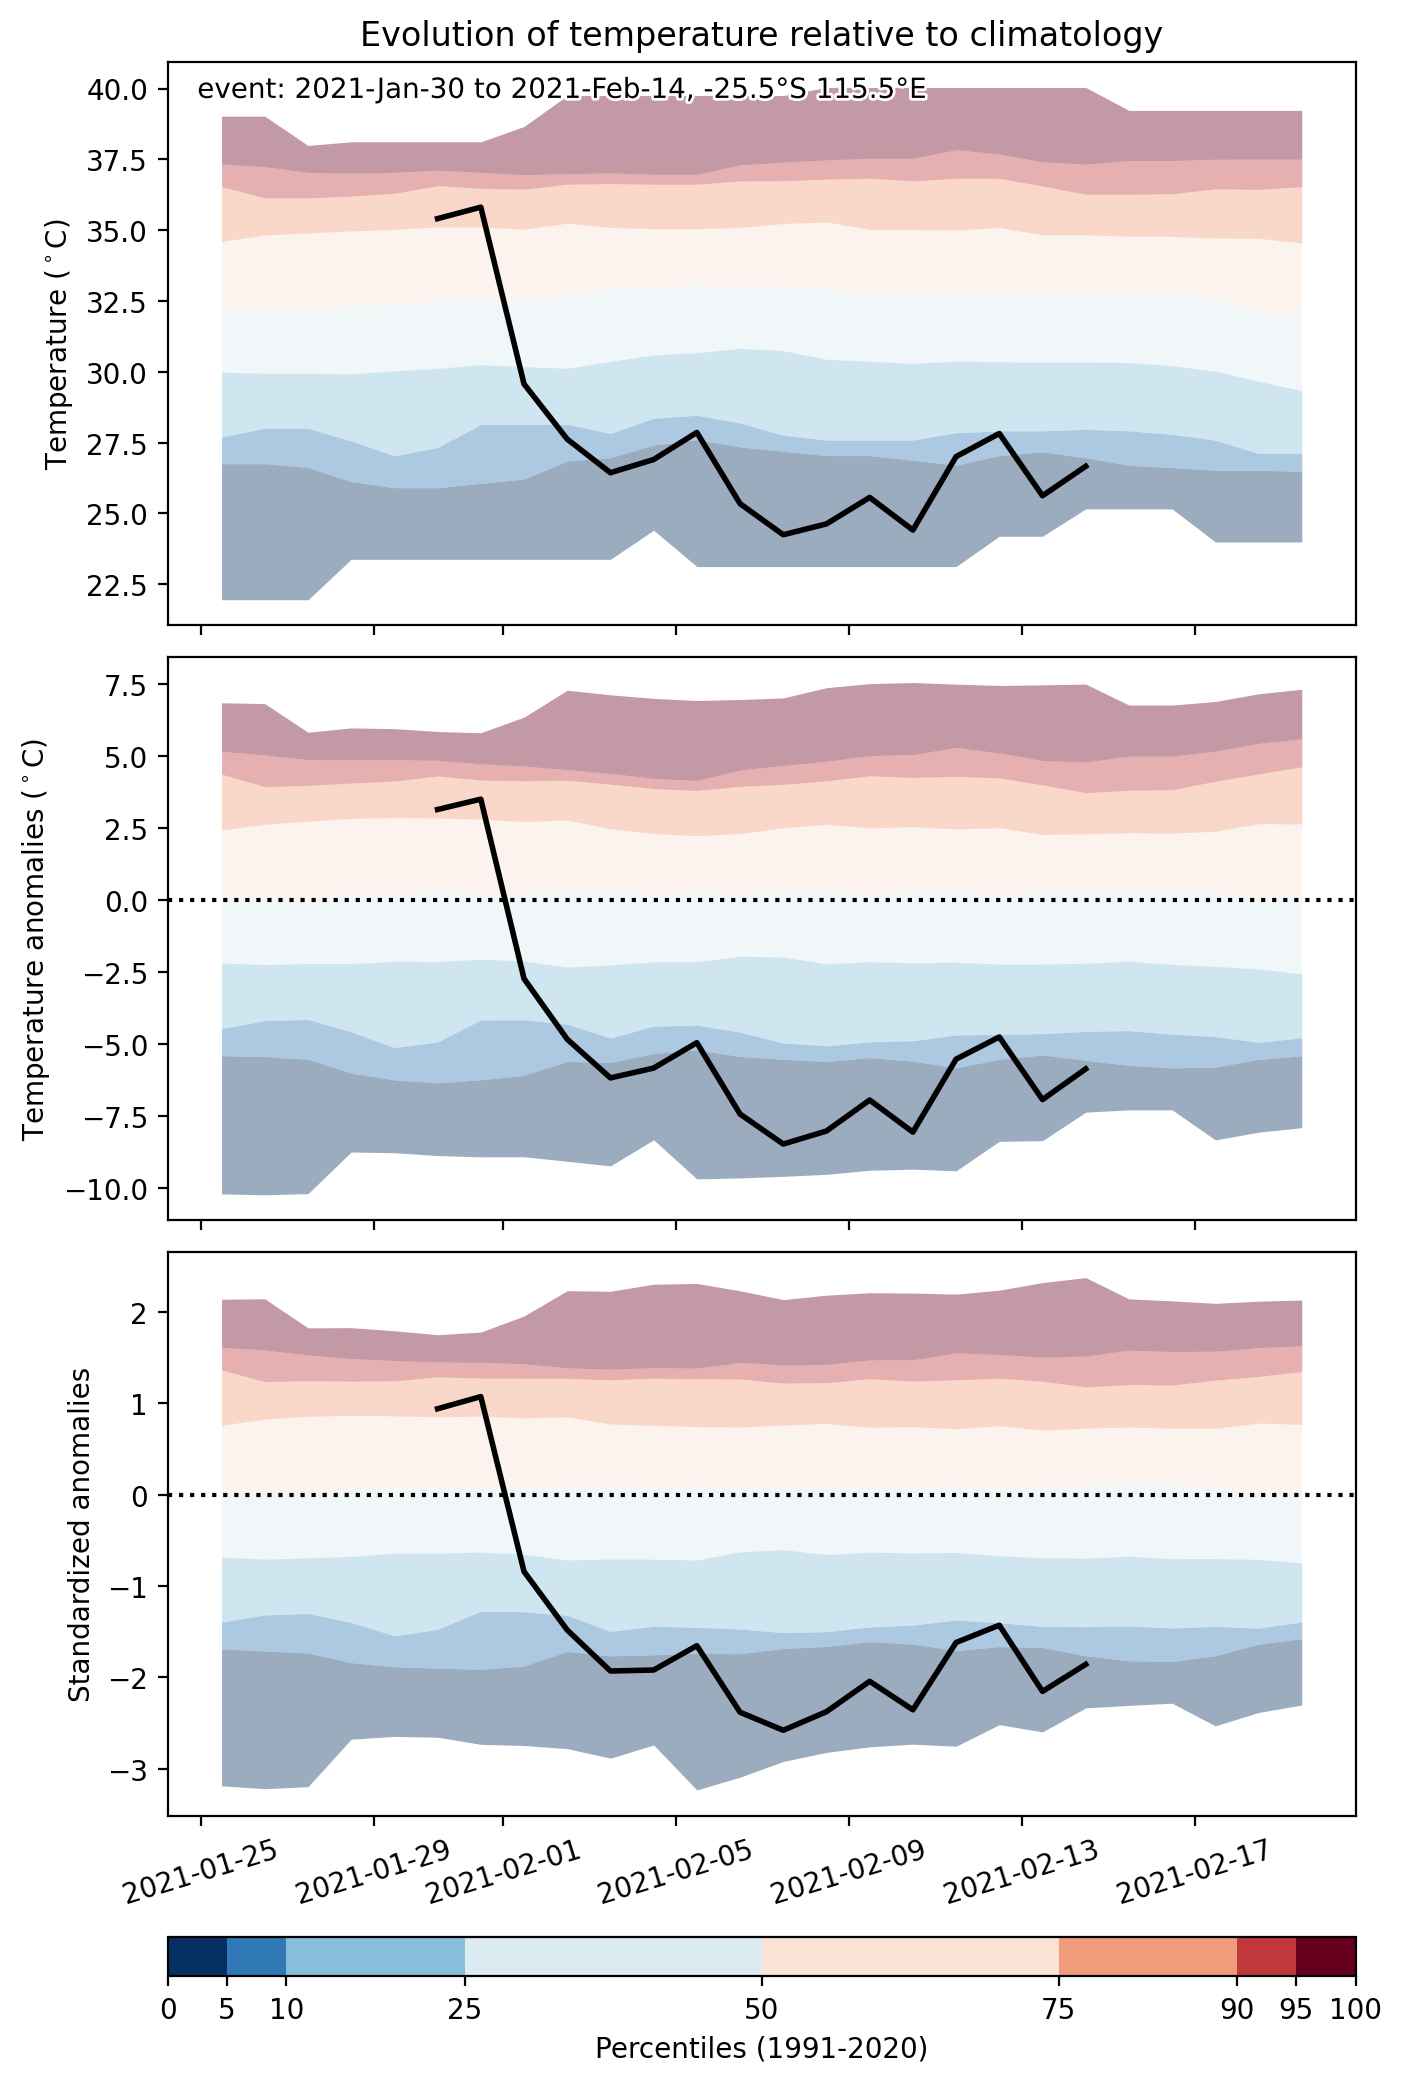
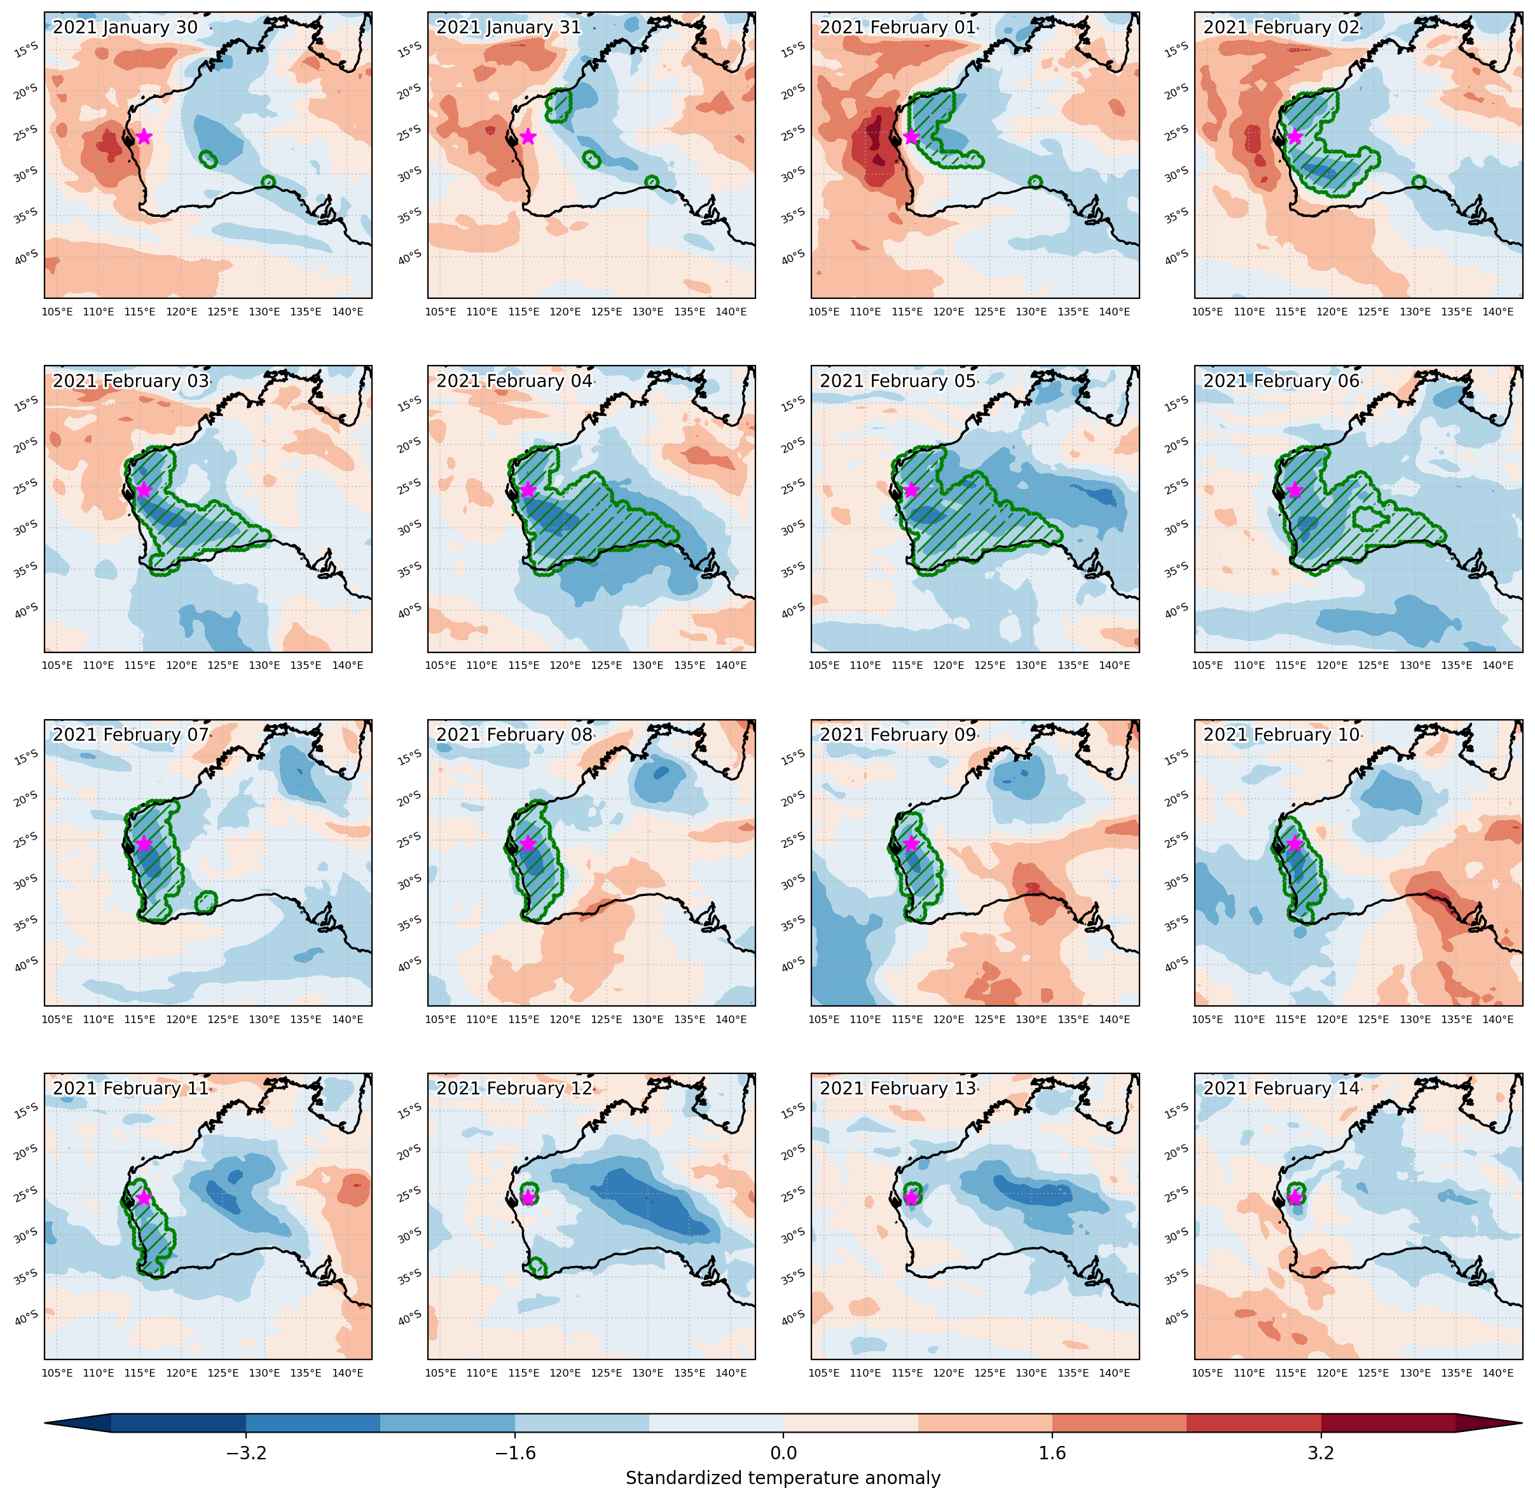
Cold spell occuring from January 30 2021 to February 14 2021 at -25.5°S 115.5°E

Download data: JSON

Event type: Cold spell

Countries affected (identified with ArcGIS Online; provided only for geographical reference):

  • Australia

Duration: 16 days

Time span: January 30 2021 to February 14 2021

Statistics over entire affected area:

  • Mean temperature anomaly: -6.7 °C
  • Mean temperature: 21.3 °C
  • Minimum temperature anomaly: -11.4 °C
  • Minimum temperature: 14.3 °C

Event center: -25.5°S 115.5°E

Area affected: 1459829 km$^2$


Fig. 1: Map of most extreme temperature anomalies (standardized) experienced during the event. The purple star indicates the center of the extreme event. Green hatching illustrates all areas under the effect of extremes at some time during the event.


Fig. 2: Evolution of temperature at the center of the event. The climatological percentile distribution is illustrated with color shadings.


Fig. 3: Maps illustrating the evolution of standardized temperature anomalies during the event.

Event ID: Cold_spell_2021-Jan-30_to_2021-Feb-14_115.5_-25.5

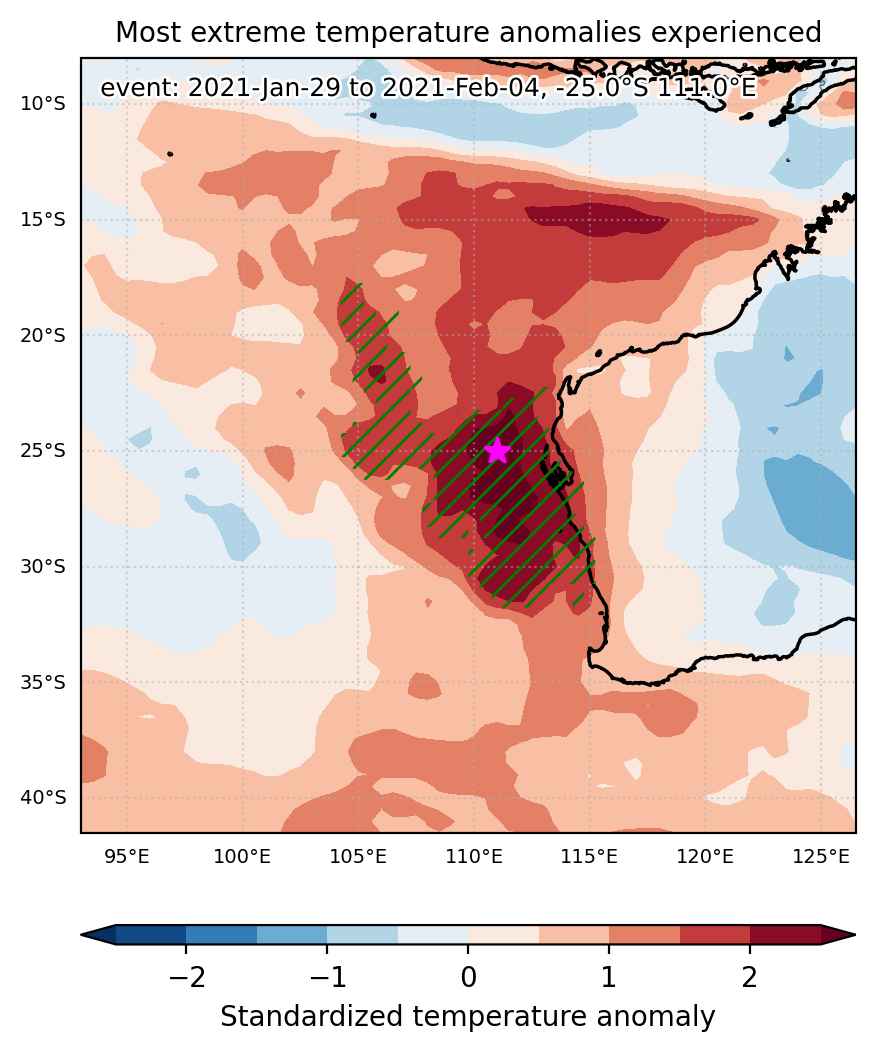
Heat wave occuring from January 29 2021 to February 04 2021 at -25.0°S 111.0°E

Download data: JSON

Event type: Heat wave

Countries affected (identified with ArcGIS Online; provided only for geographical reference):

  • Australia

Duration: 7 days

Time span: January 29 2021 to February 04 2021

Statistics over entire affected area:

  • Mean temperature anomaly: 2.5 °C
  • Mean temperature: 25.4 °C
  • Maximum temperature anomaly: 7.1 °C
  • Maximum temperature: 36.3 °C

Event center: -25.0°S 111.0°E

Area affected: 716477 km$^2$


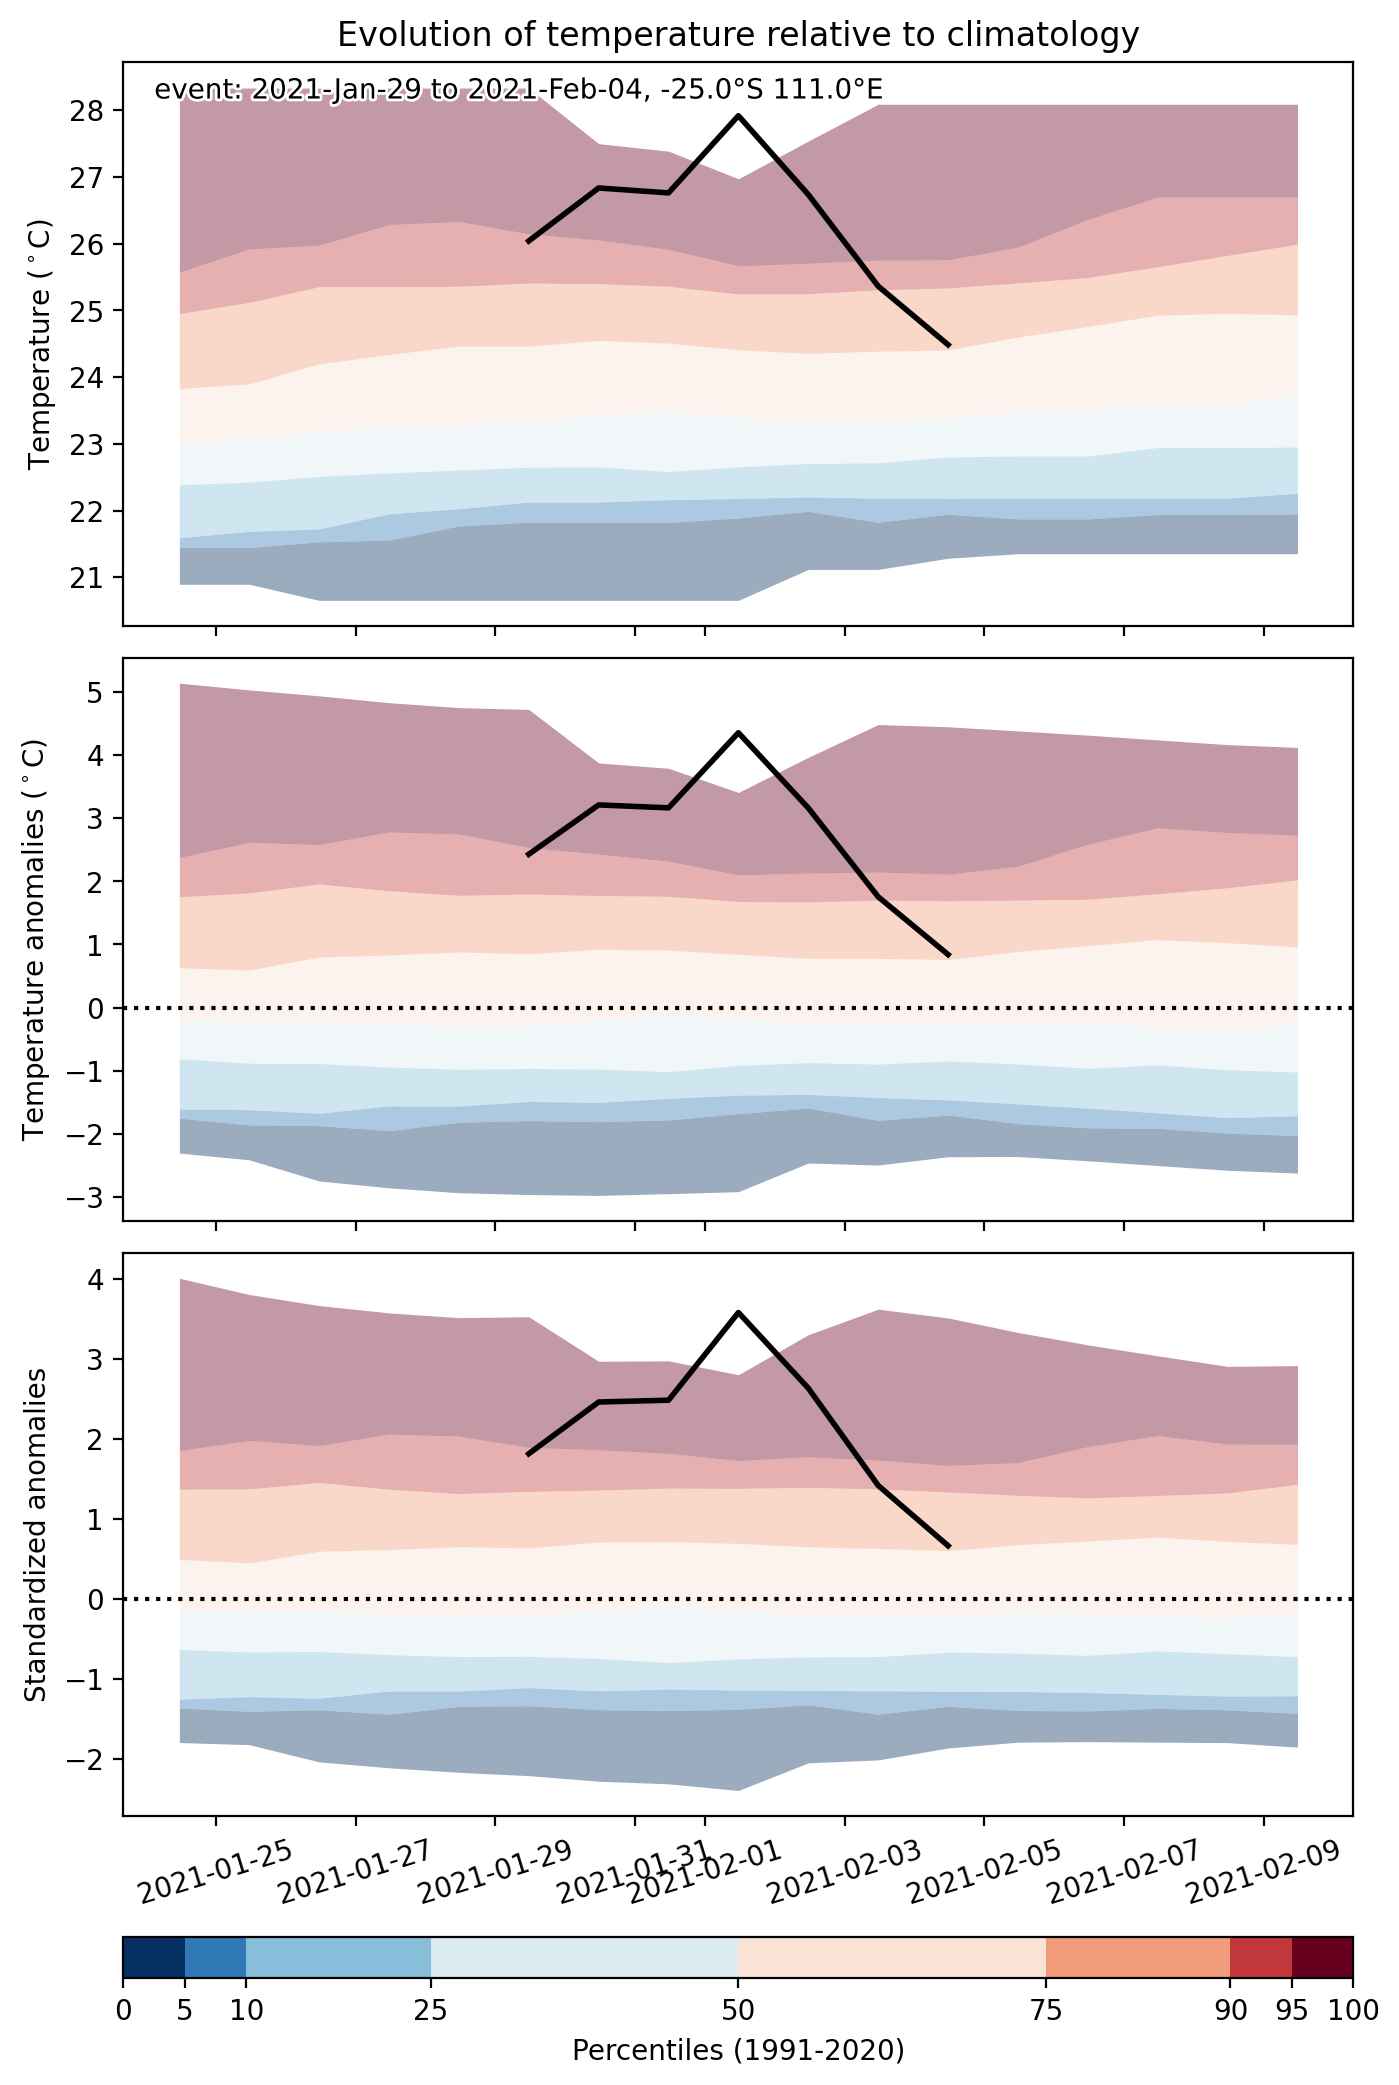
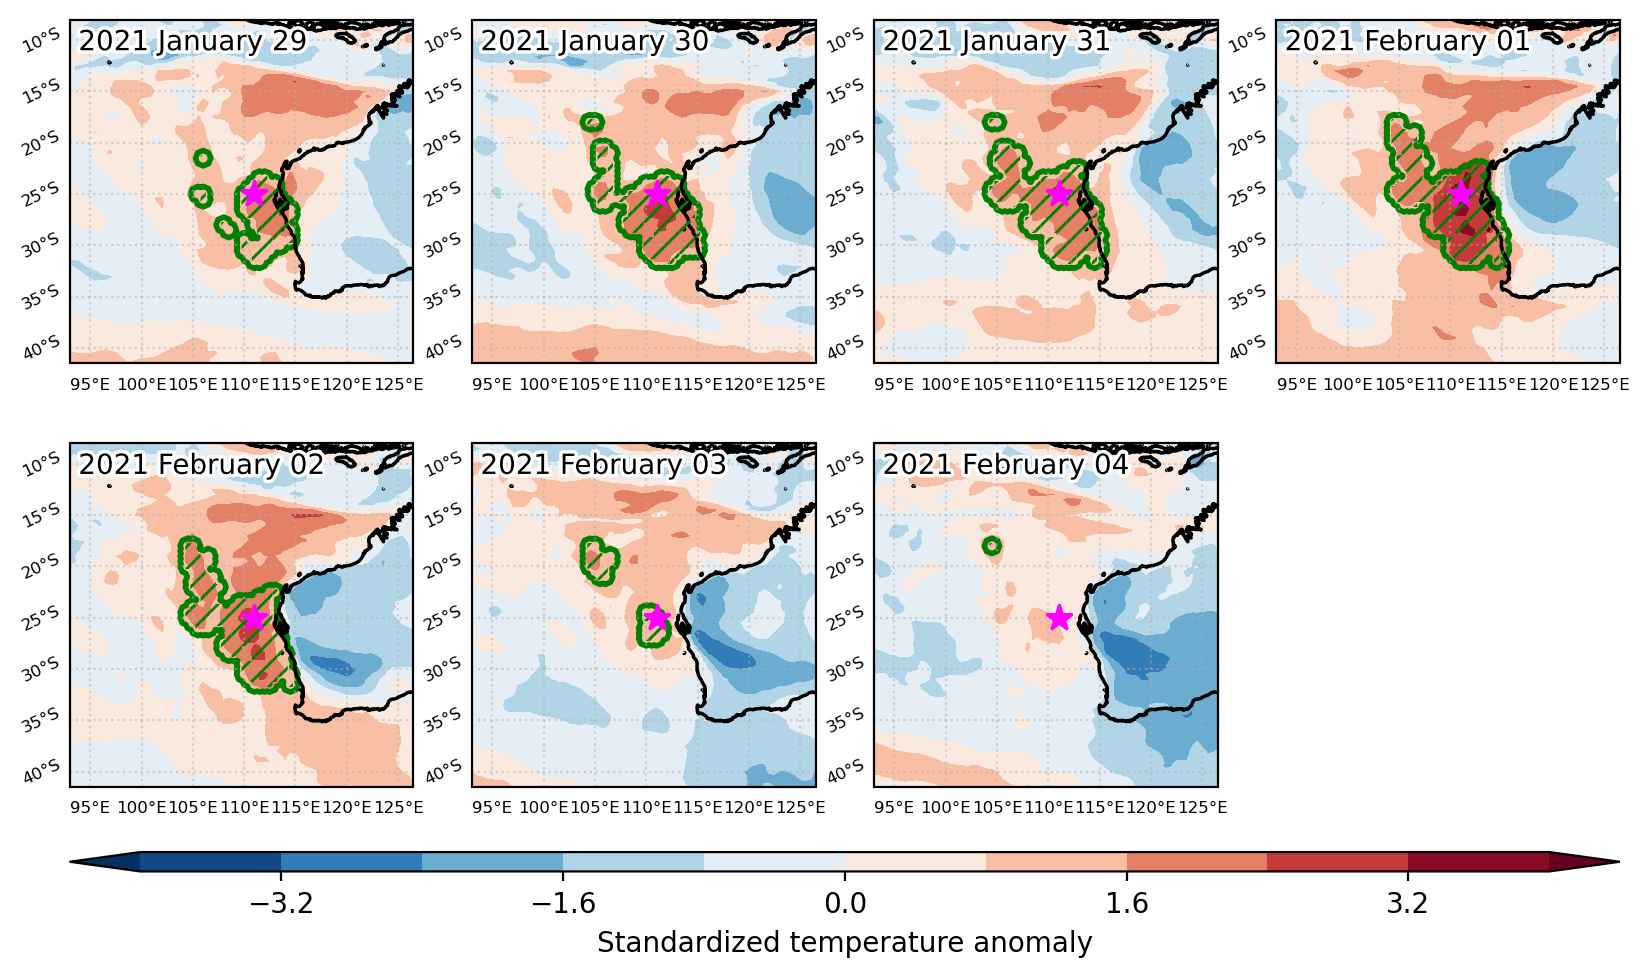
Fig. 1: Map of most extreme temperature anomalies (standardized) experienced during the event. The purple star indicates the center of the extreme event. Green hatching illustrates all areas under the effect of extremes at some time during the event.


Fig. 2: Evolution of temperature at the center of the event. The climatological percentile distribution is illustrated with color shadings.


Fig. 3: Maps illustrating the evolution of standardized temperature anomalies during the event.

Event ID: Heat_wave_2021-Jan-29_to_2021-Feb-04_111.0_-25.0