Heat wave occuring from March 02 2023 to March 12 2023 at -13.5°S 50.0°E

Download data: JSON

Event type: Heat wave

Countries affected (identified with ArcGIS Online; provided only for geographical reference):

  • Madagascar

Duration: 11 days

Time span: March 02 2023 to March 12 2023

Statistics over entire affected area:

  • Mean temperature anomaly: 1.6 °C
  • Mean temperature: 27.9 °C
  • Maximum temperature anomaly: 3.8 °C
  • Maximum temperature: 29.3 °C

Event center: -13.5°S 50.0°E

Area affected: 413235 km$^2$
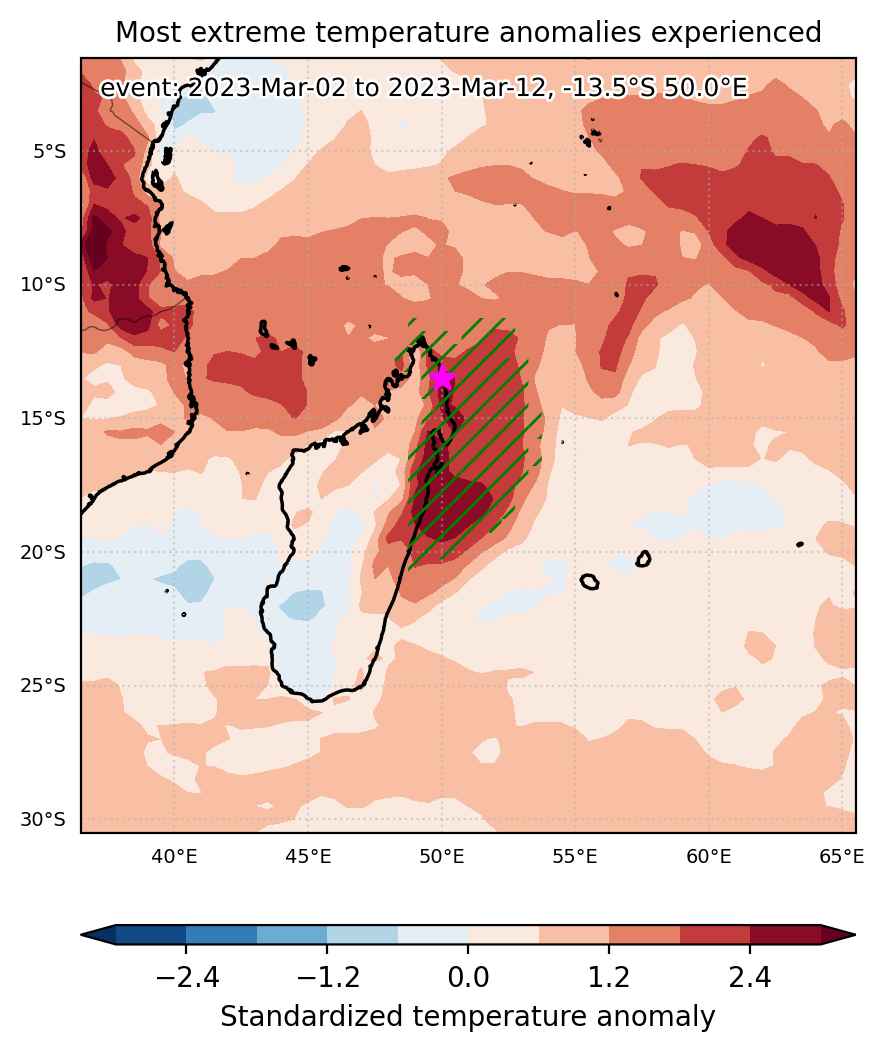

Fig. 1: Map of most extreme temperature anomalies (standardized) experienced during the event. The purple star indicates the center of the extreme event. Green hatching illustrates all areas under the effect of extremes at some time during the event.
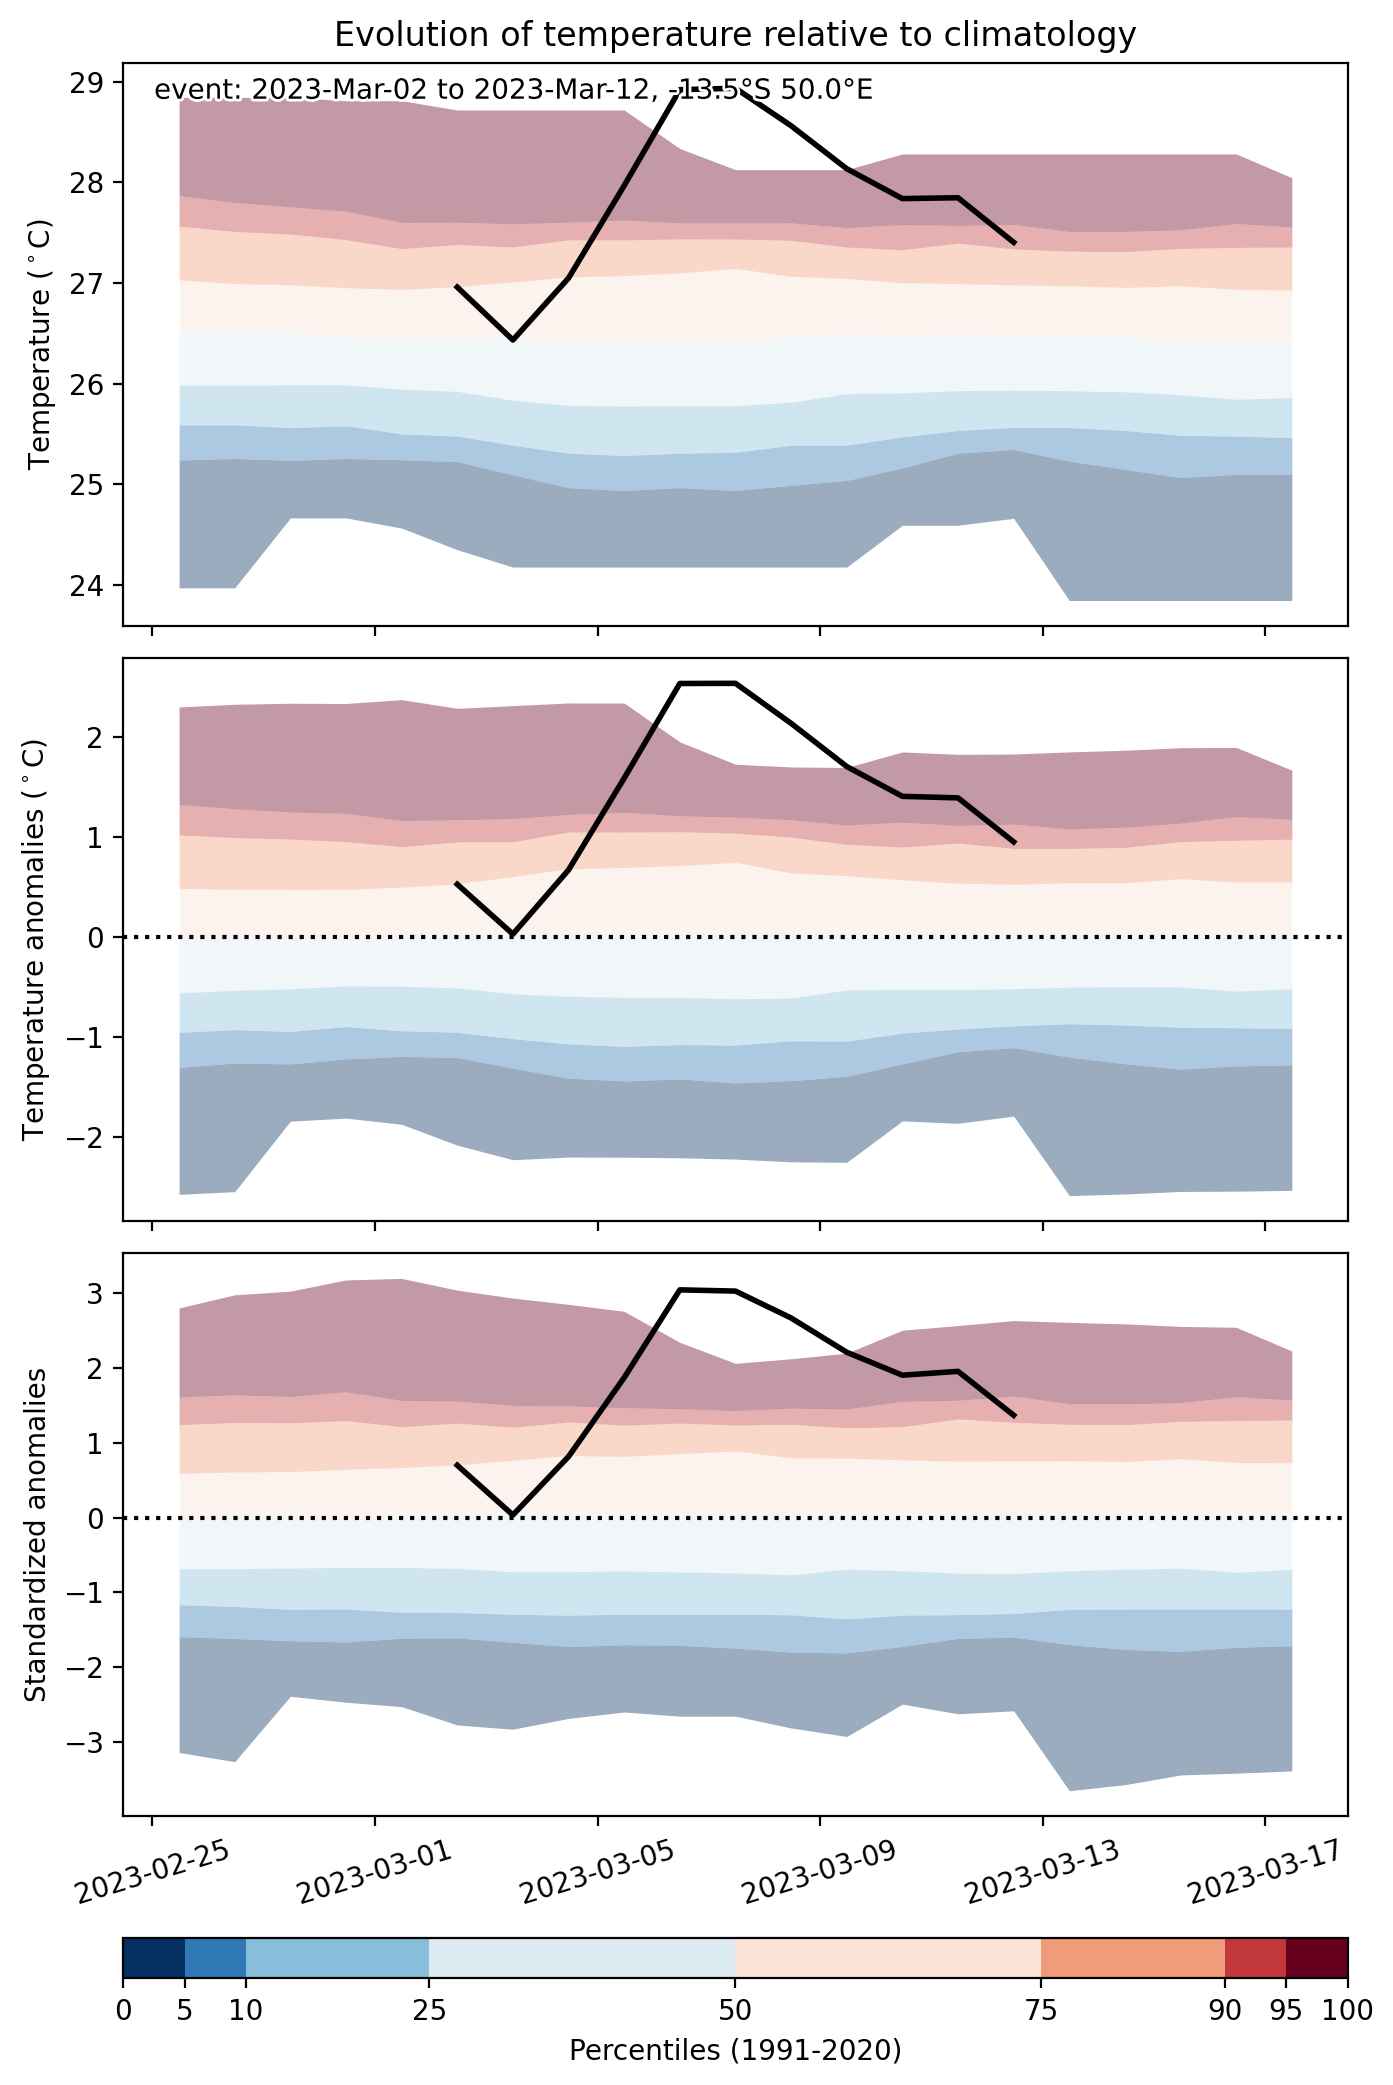


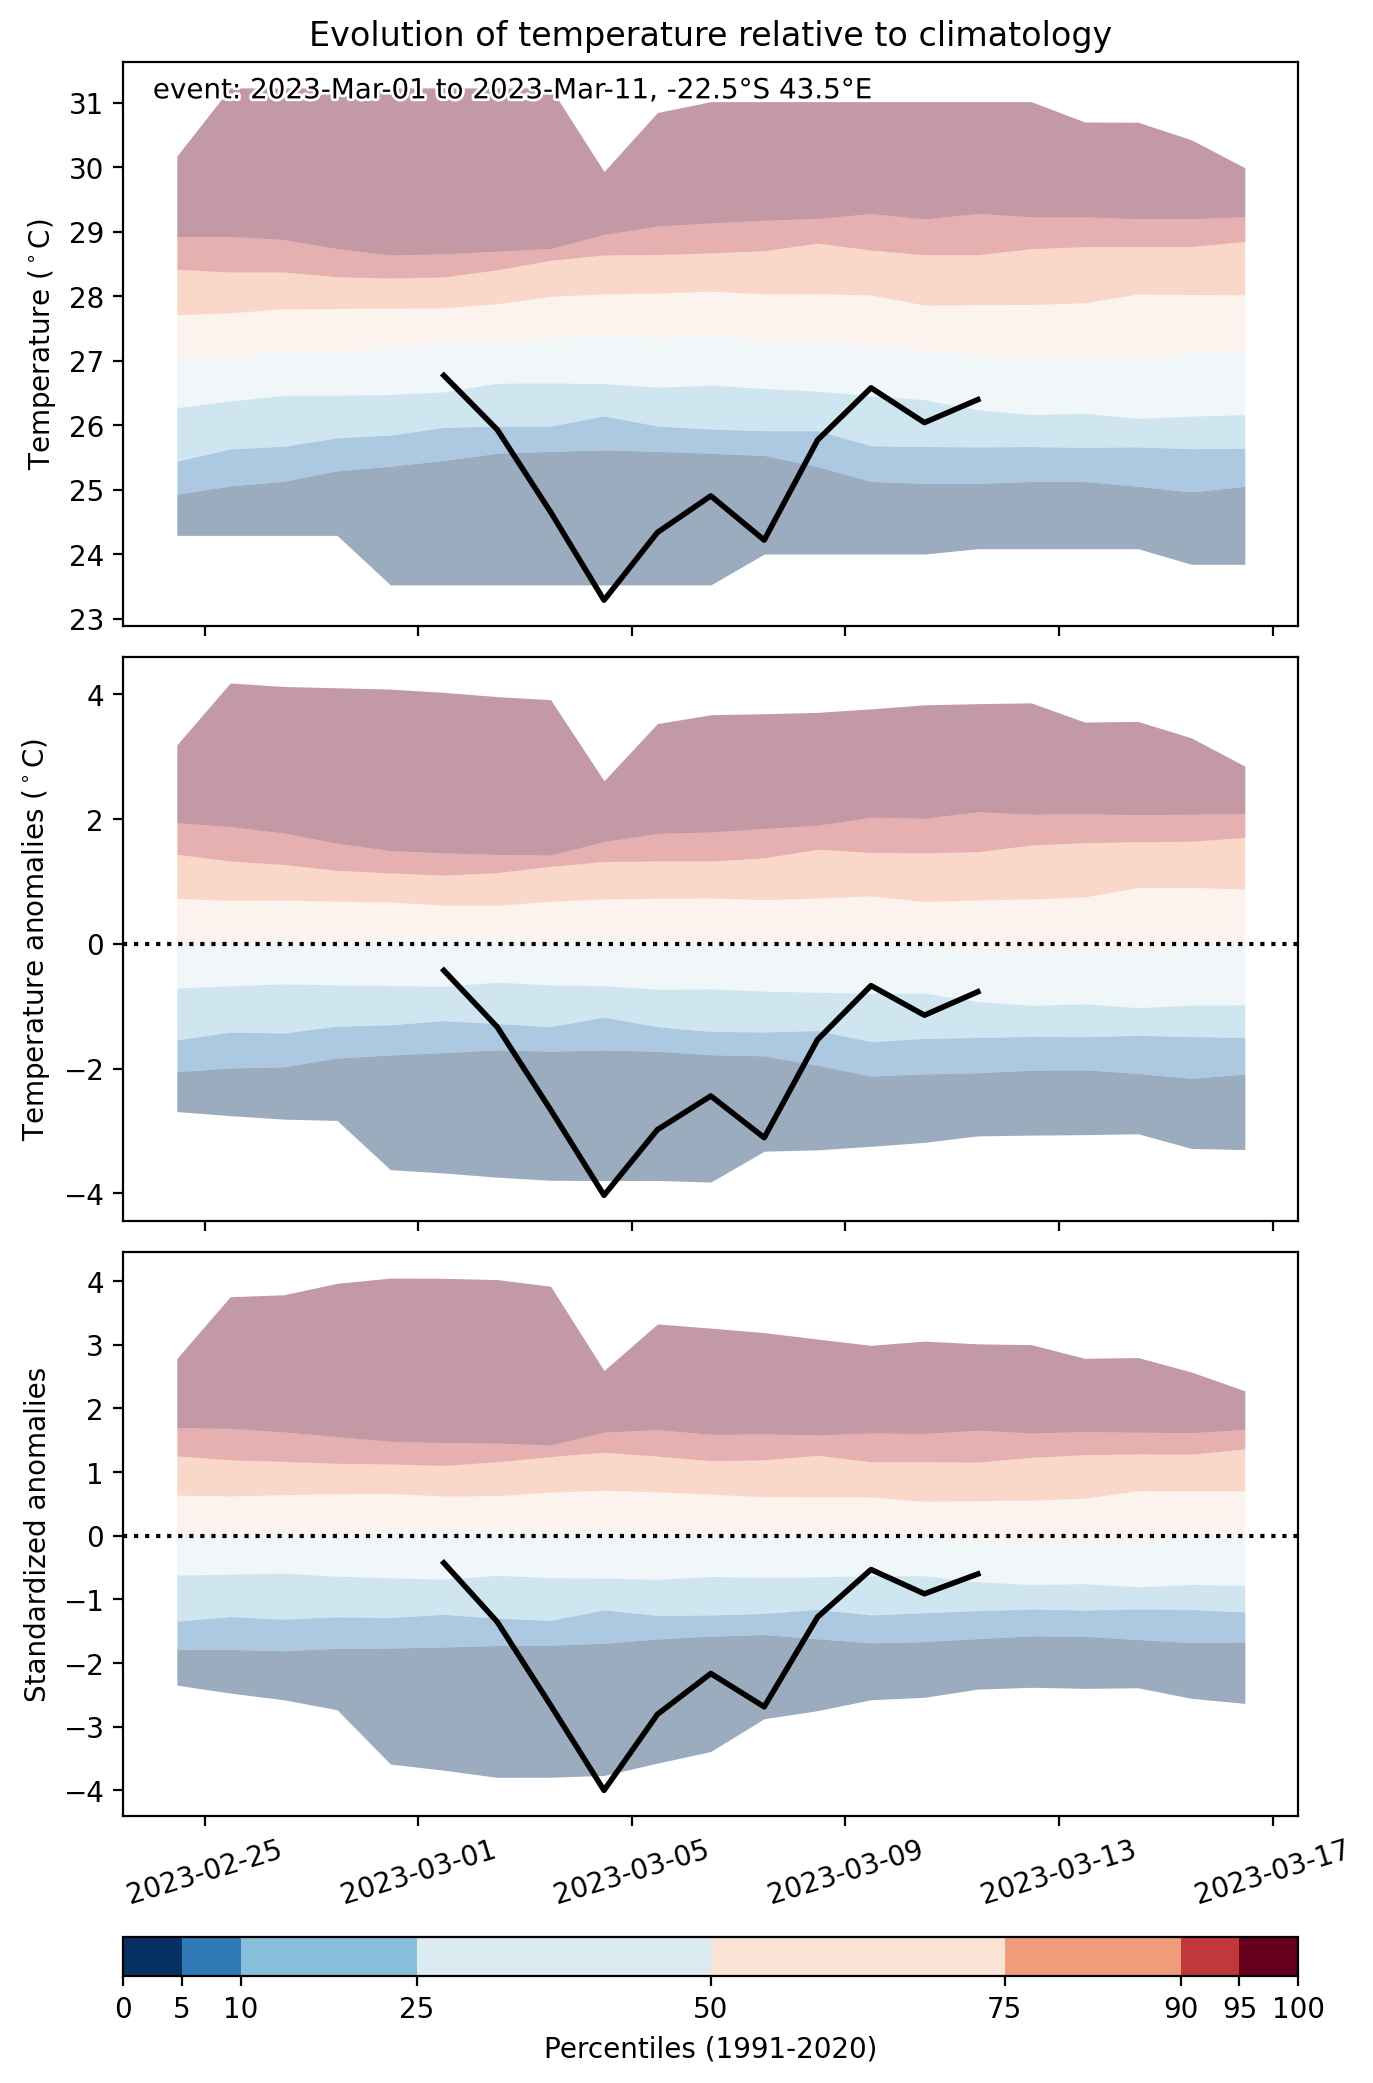
Fig. 2: Evolution of temperature at the center of the event. The climatological percentile distribution is illustrated with color shadings.
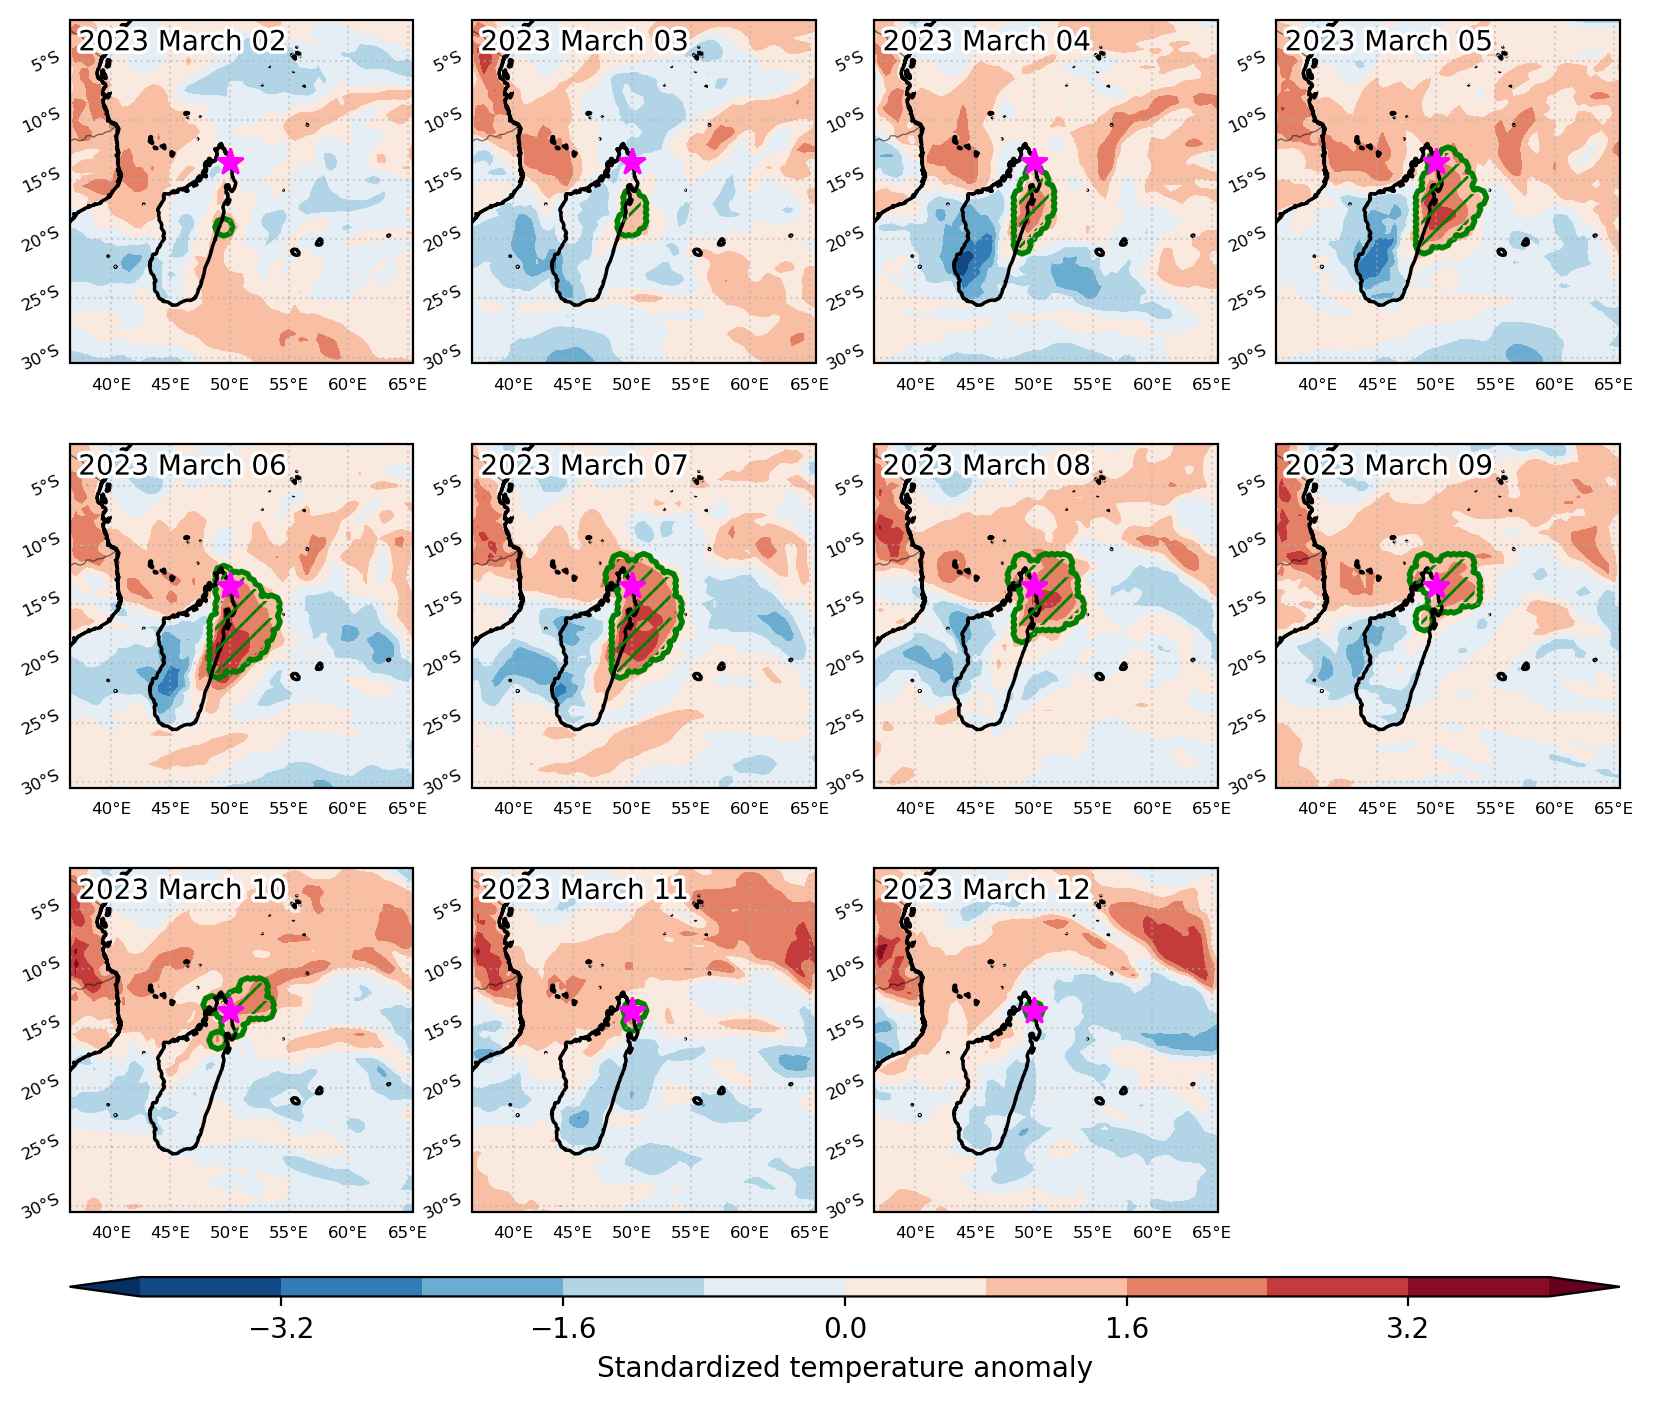


Fig. 3: Maps illustrating the evolution of standardized temperature anomalies during the event.

Event ID: Heat_wave_2023-Mar-02_to_2023-Mar-12_50.0_-13.5
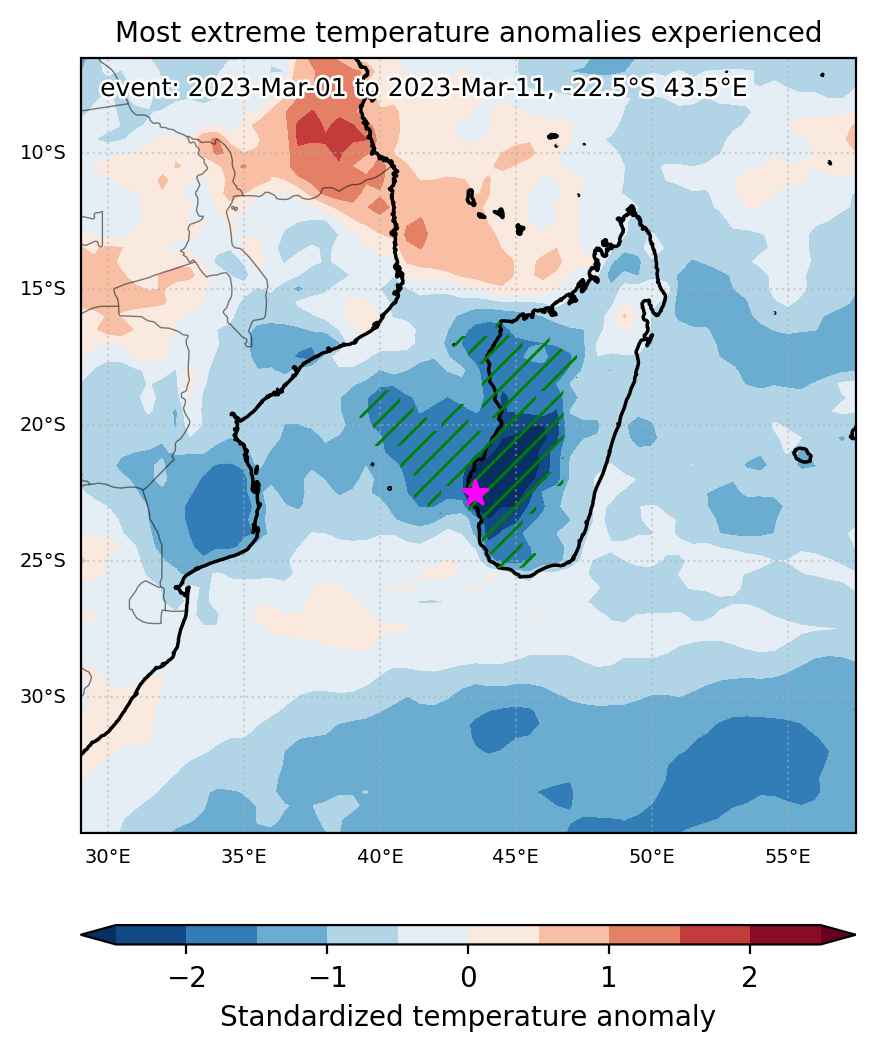
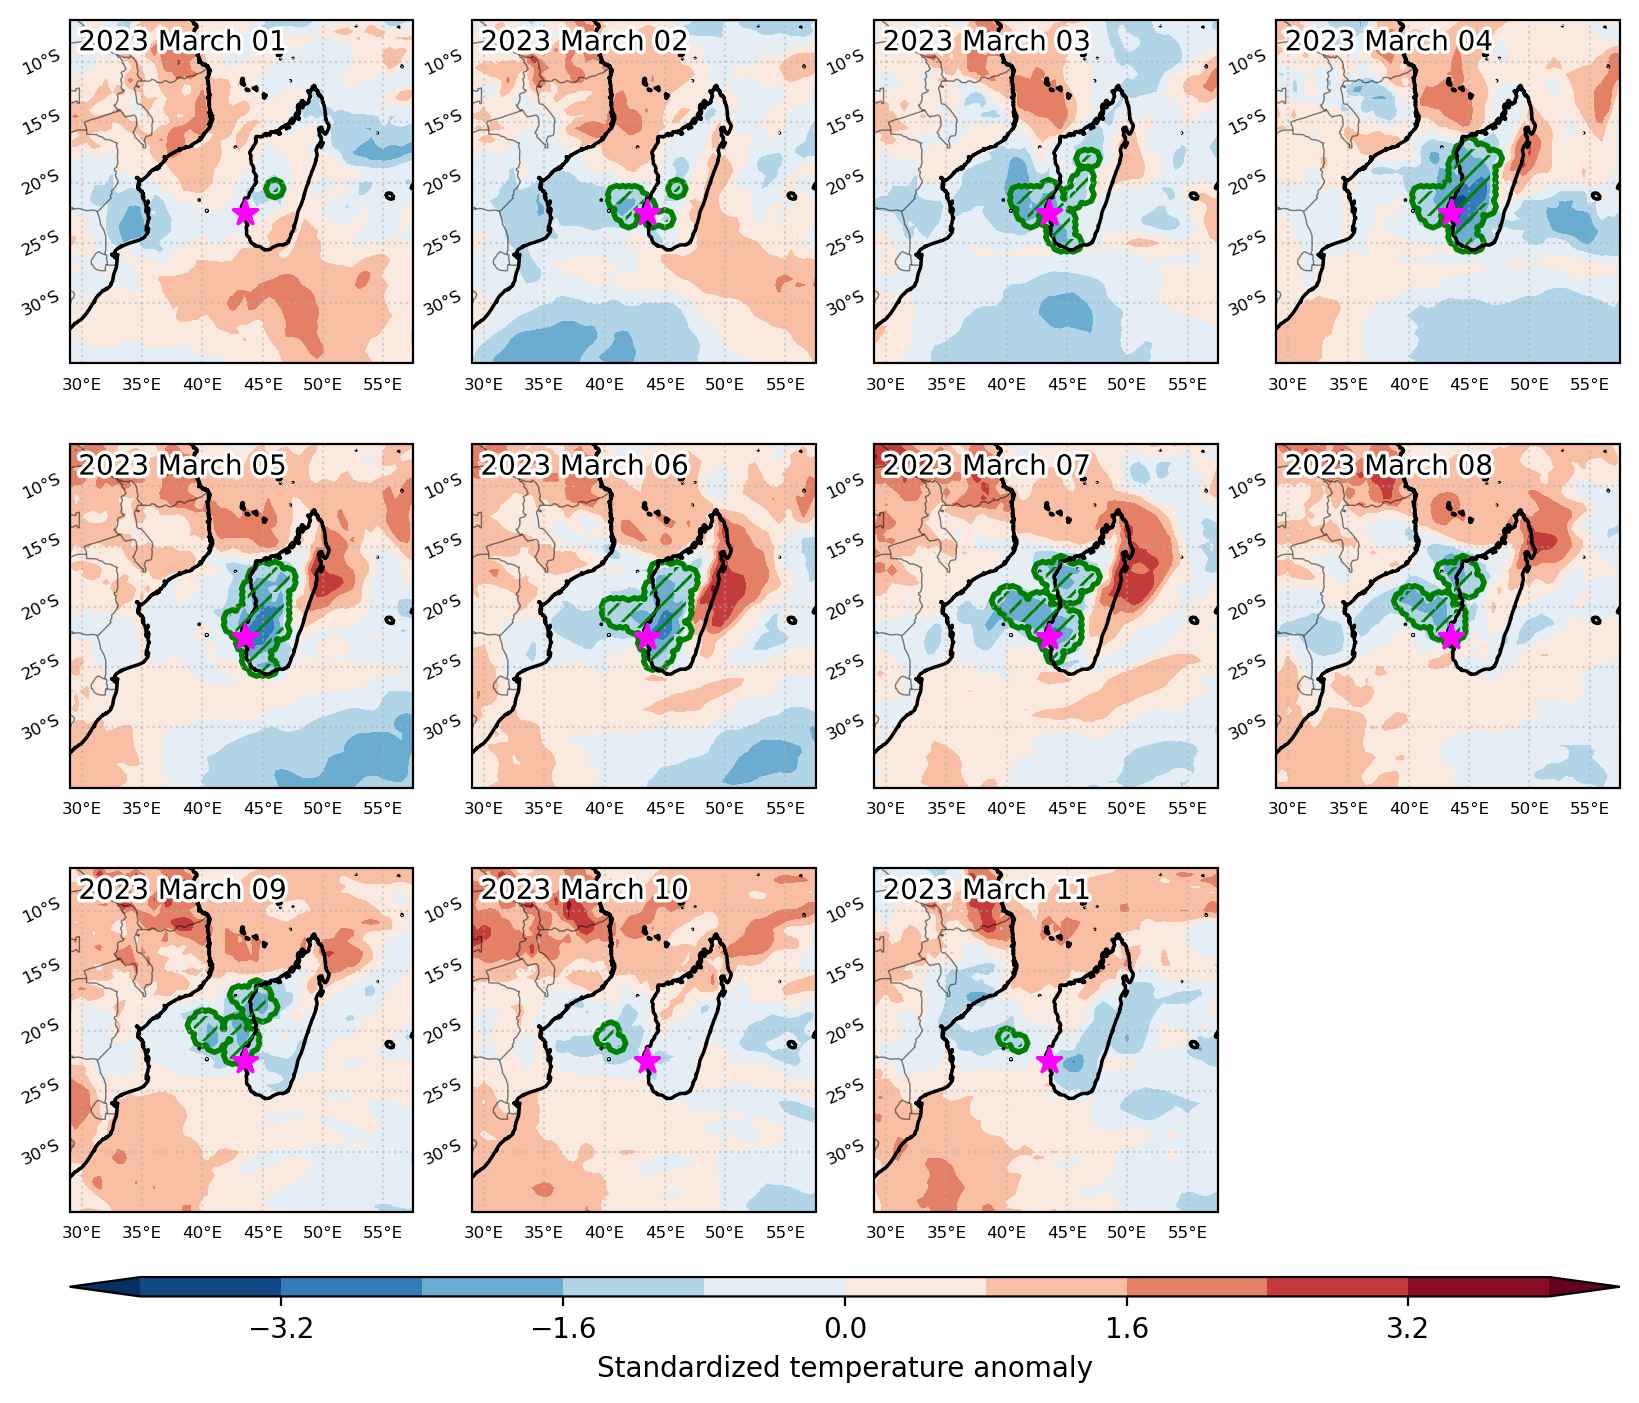
Cold spell occuring from March 01 2023 to March 11 2023 at -22.5°S 43.5°E

Download data: JSON

Event type: Cold spell

Countries affected (identified with ArcGIS Online; provided only for geographical reference):

  • Madagascar

Duration: 11 days

Time span: March 01 2023 to March 11 2023

Statistics over entire affected area:

  • Mean temperature anomaly: -1.8 °C
  • Mean temperature: 24.7 °C
  • Minimum temperature anomaly: -4.2 °C
  • Minimum temperature: 19.1 °C

Event center: -22.5°S 43.5°E

Area affected: 379032 km$^2$


Fig. 1: Map of most extreme temperature anomalies (standardized) experienced during the event. The purple star indicates the center of the extreme event. Green hatching illustrates all areas under the effect of extremes at some time during the event.


Fig. 2: Evolution of temperature at the center of the event. The climatological percentile distribution is illustrated with color shadings.


Fig. 3: Maps illustrating the evolution of standardized temperature anomalies during the event.

Event ID: Cold_spell_2023-Mar-01_to_2023-Mar-11_43.5_-22.5

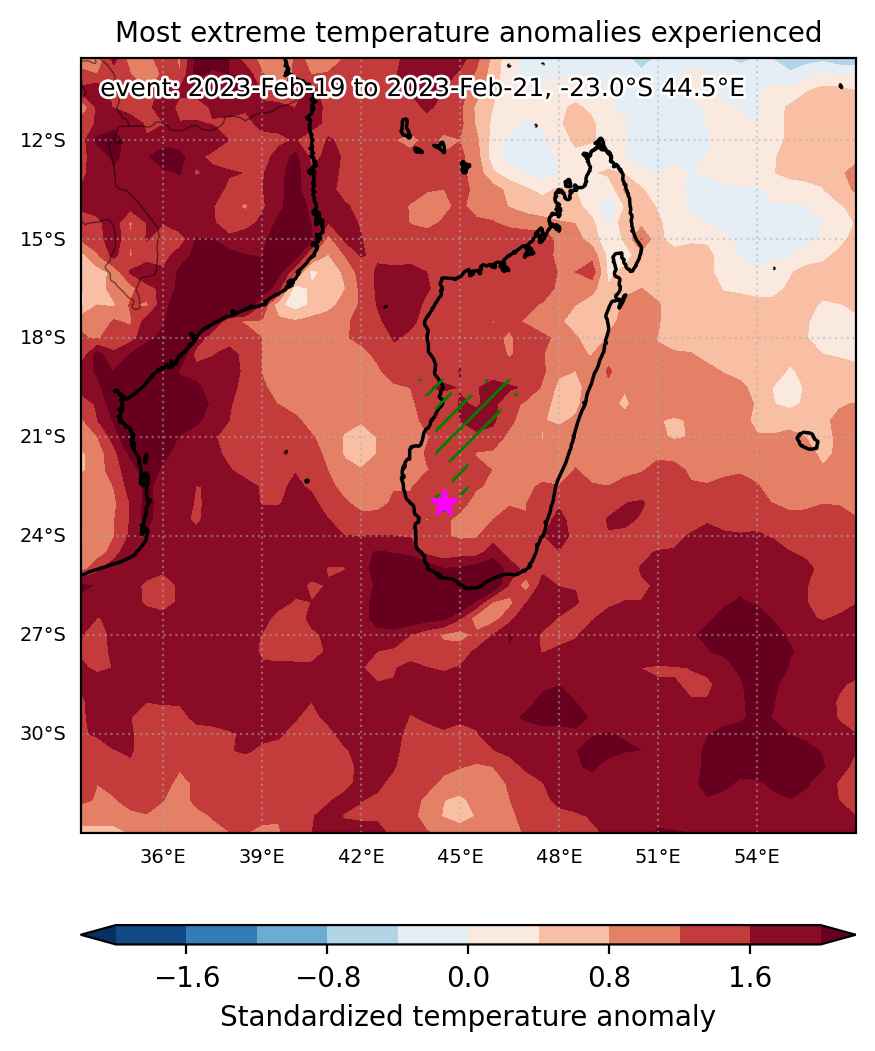
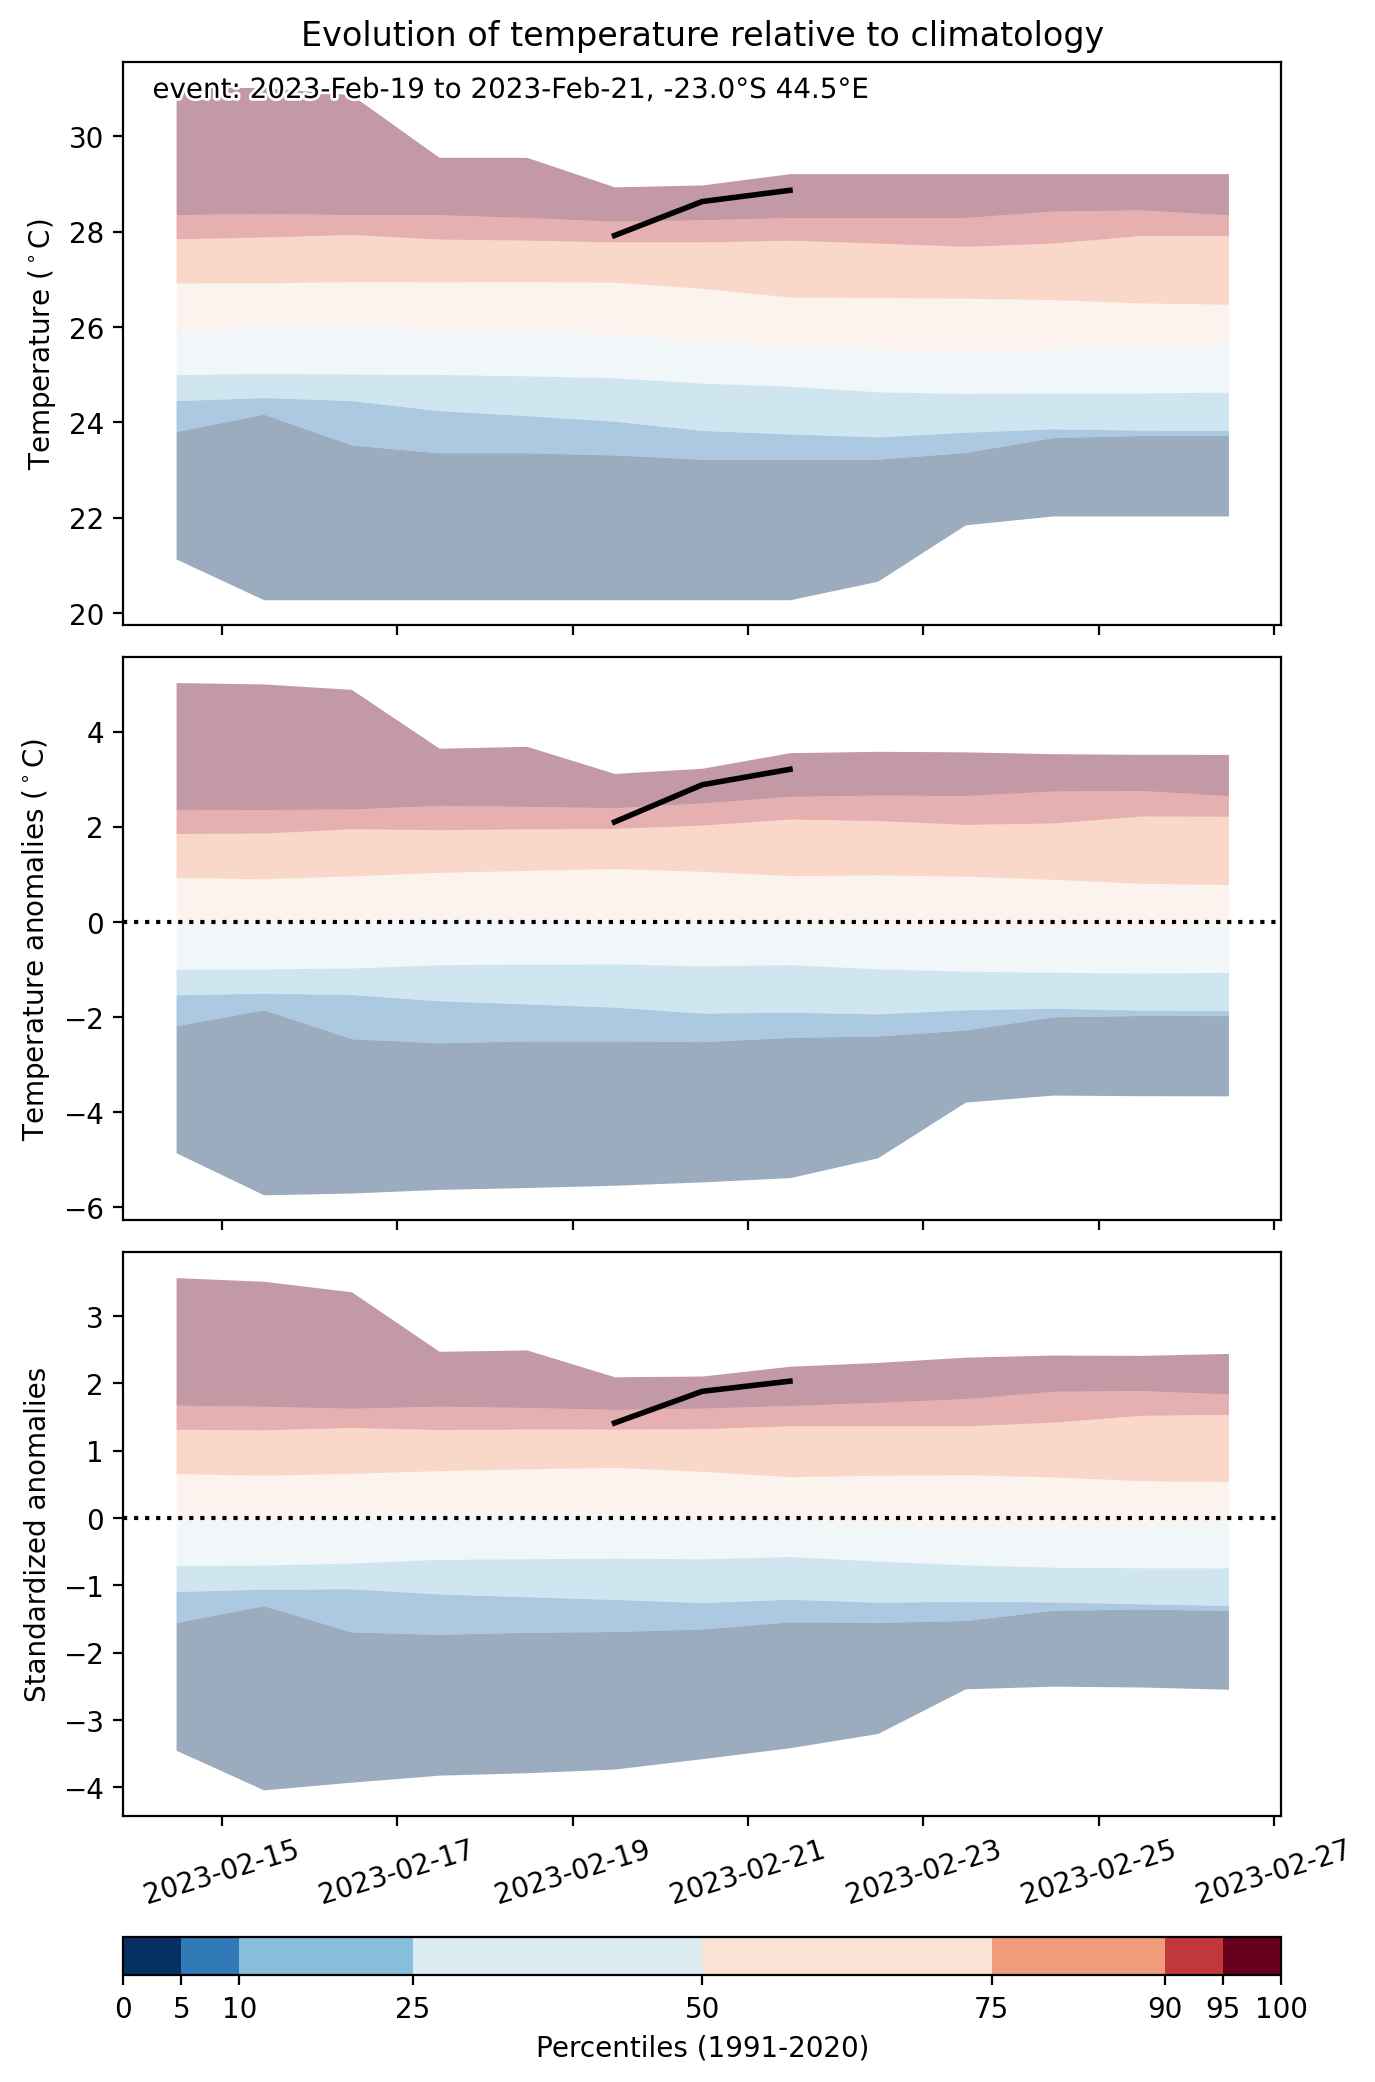
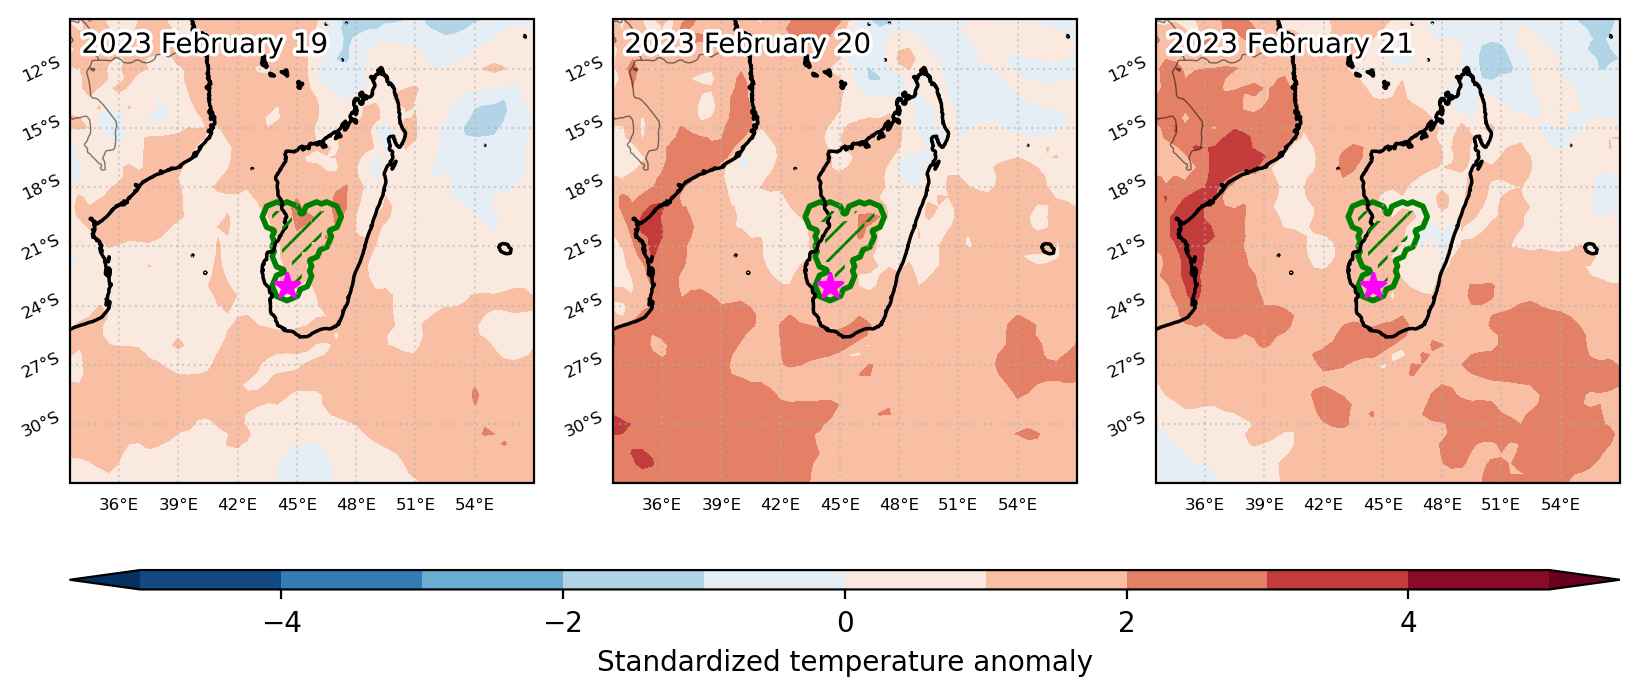
Heat wave occuring from February 19 2023 to February 21 2023 at -23.0°S 44.5°E

Download data: JSON

Event type: Heat wave

Countries affected (identified with ArcGIS Online; provided only for geographical reference):

  • Madagascar

Duration: 3 days

Time span: February 19 2023 to February 21 2023

Statistics over entire affected area:

  • Mean temperature anomaly: 1.8 °C
  • Mean temperature: 27.6 °C
  • Maximum temperature anomaly: 3.2 °C
  • Maximum temperature: 29.1 °C

Event center: -23.0°S 44.5°E

Area affected: 57831 km$^2$


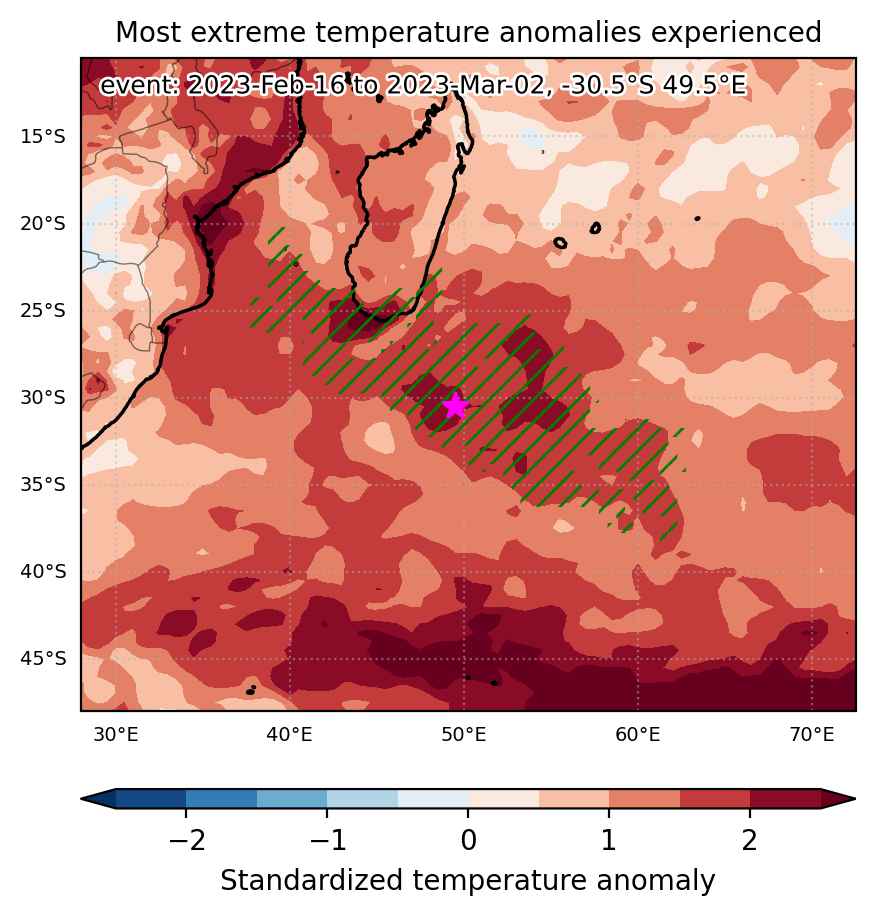
Fig. 1: Map of most extreme temperature anomalies (standardized) experienced during the event. The purple star indicates the center of the extreme event. Green hatching illustrates all areas under the effect of extremes at some time during the event.


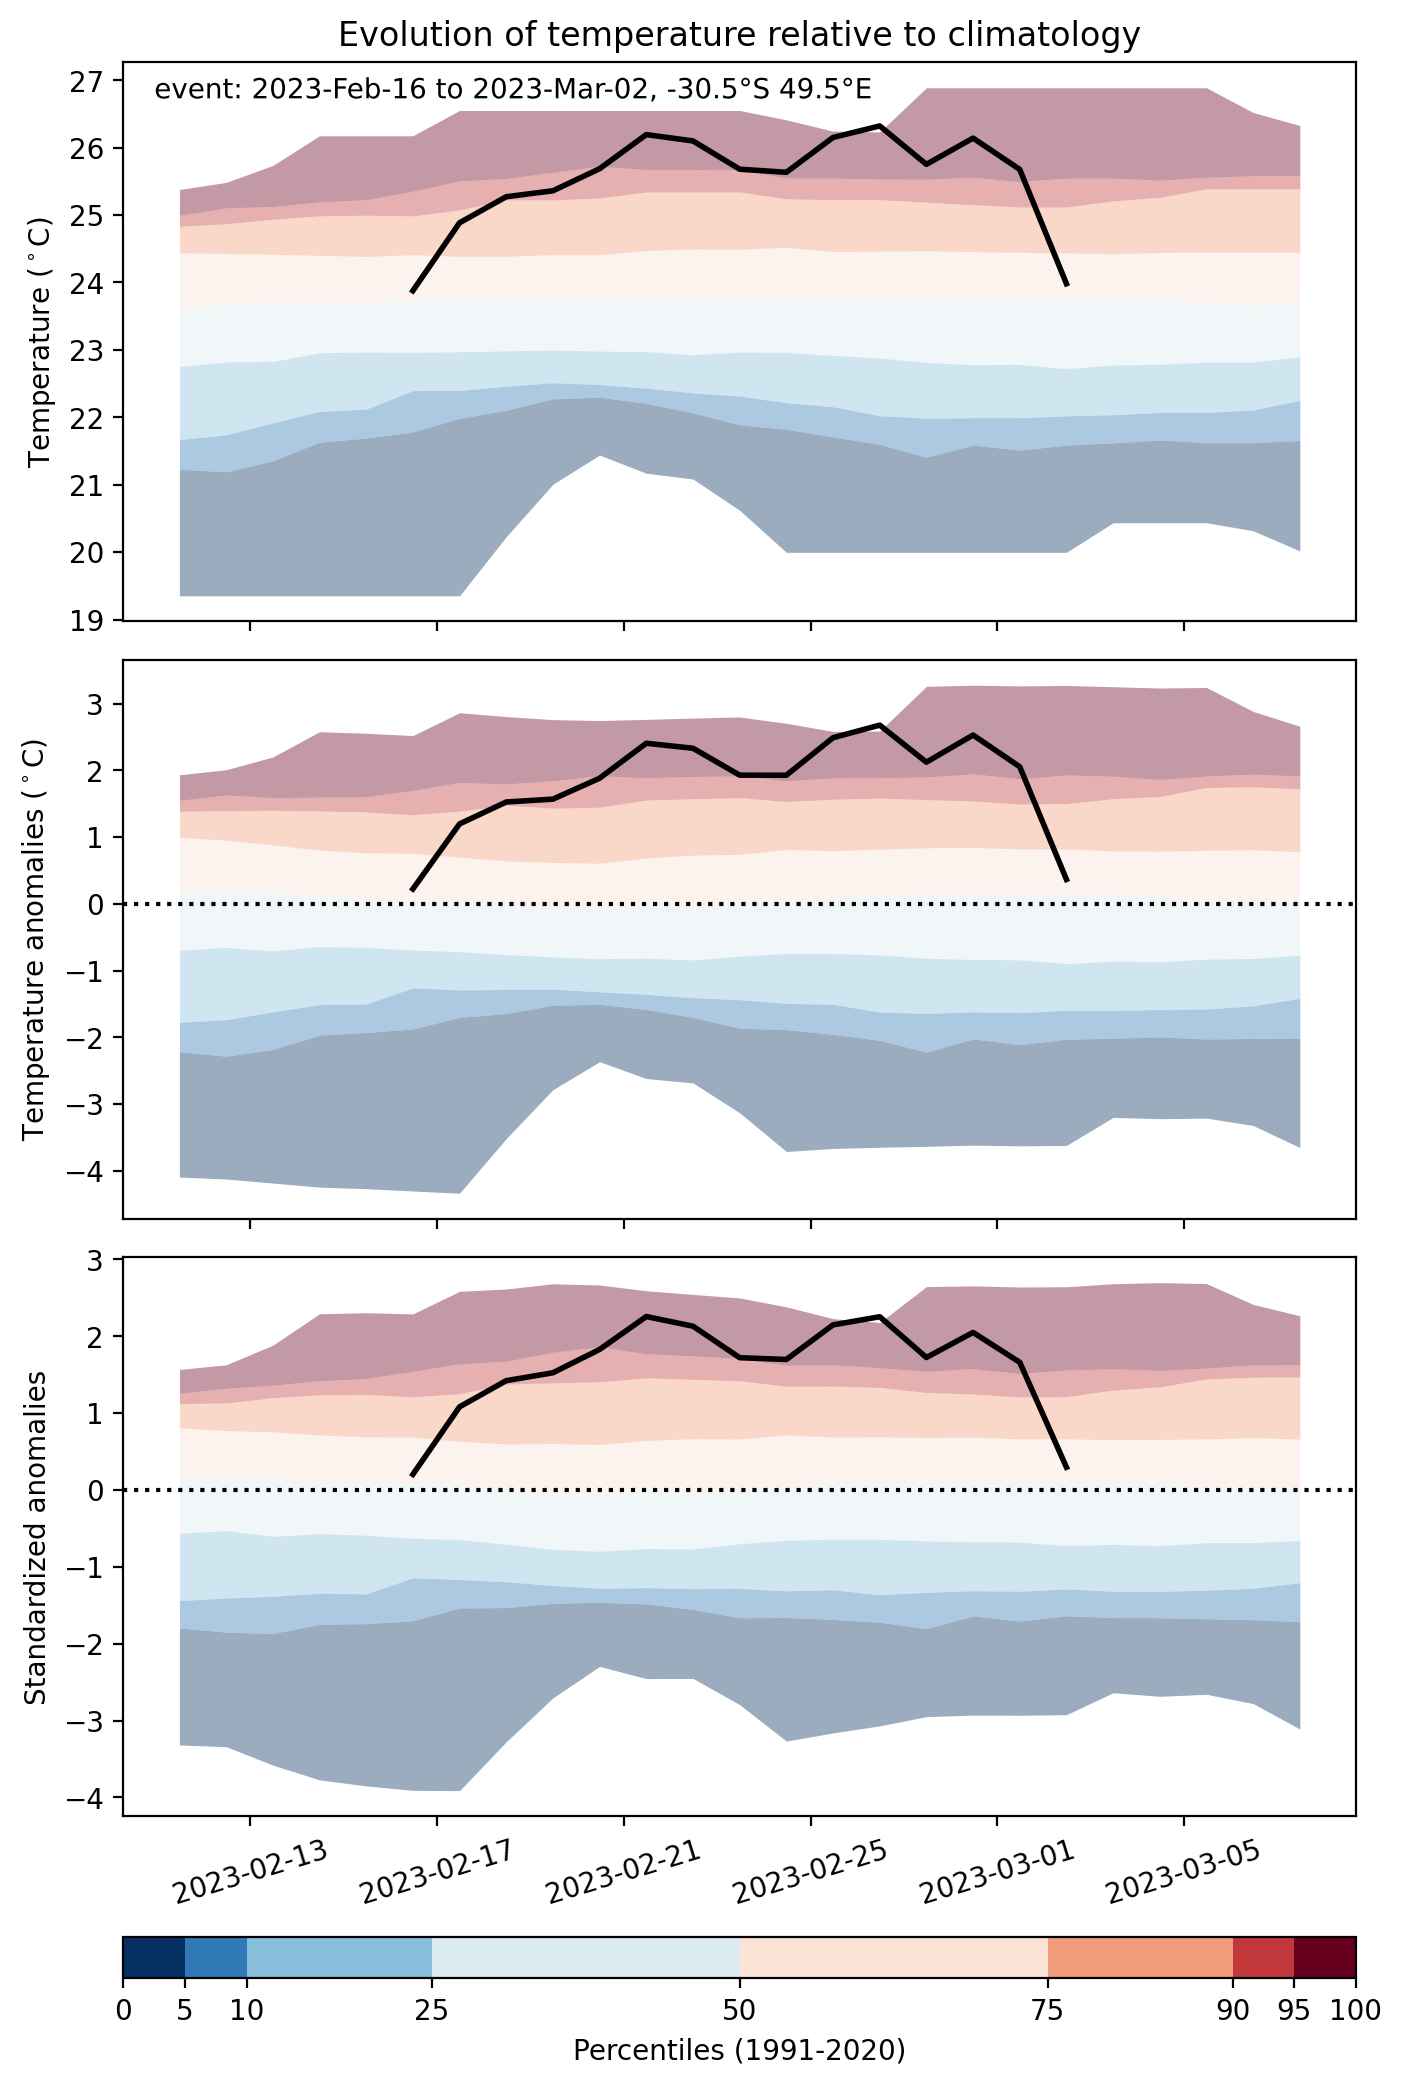
Fig. 2: Evolution of temperature at the center of the event. The climatological percentile distribution is illustrated with color shadings.


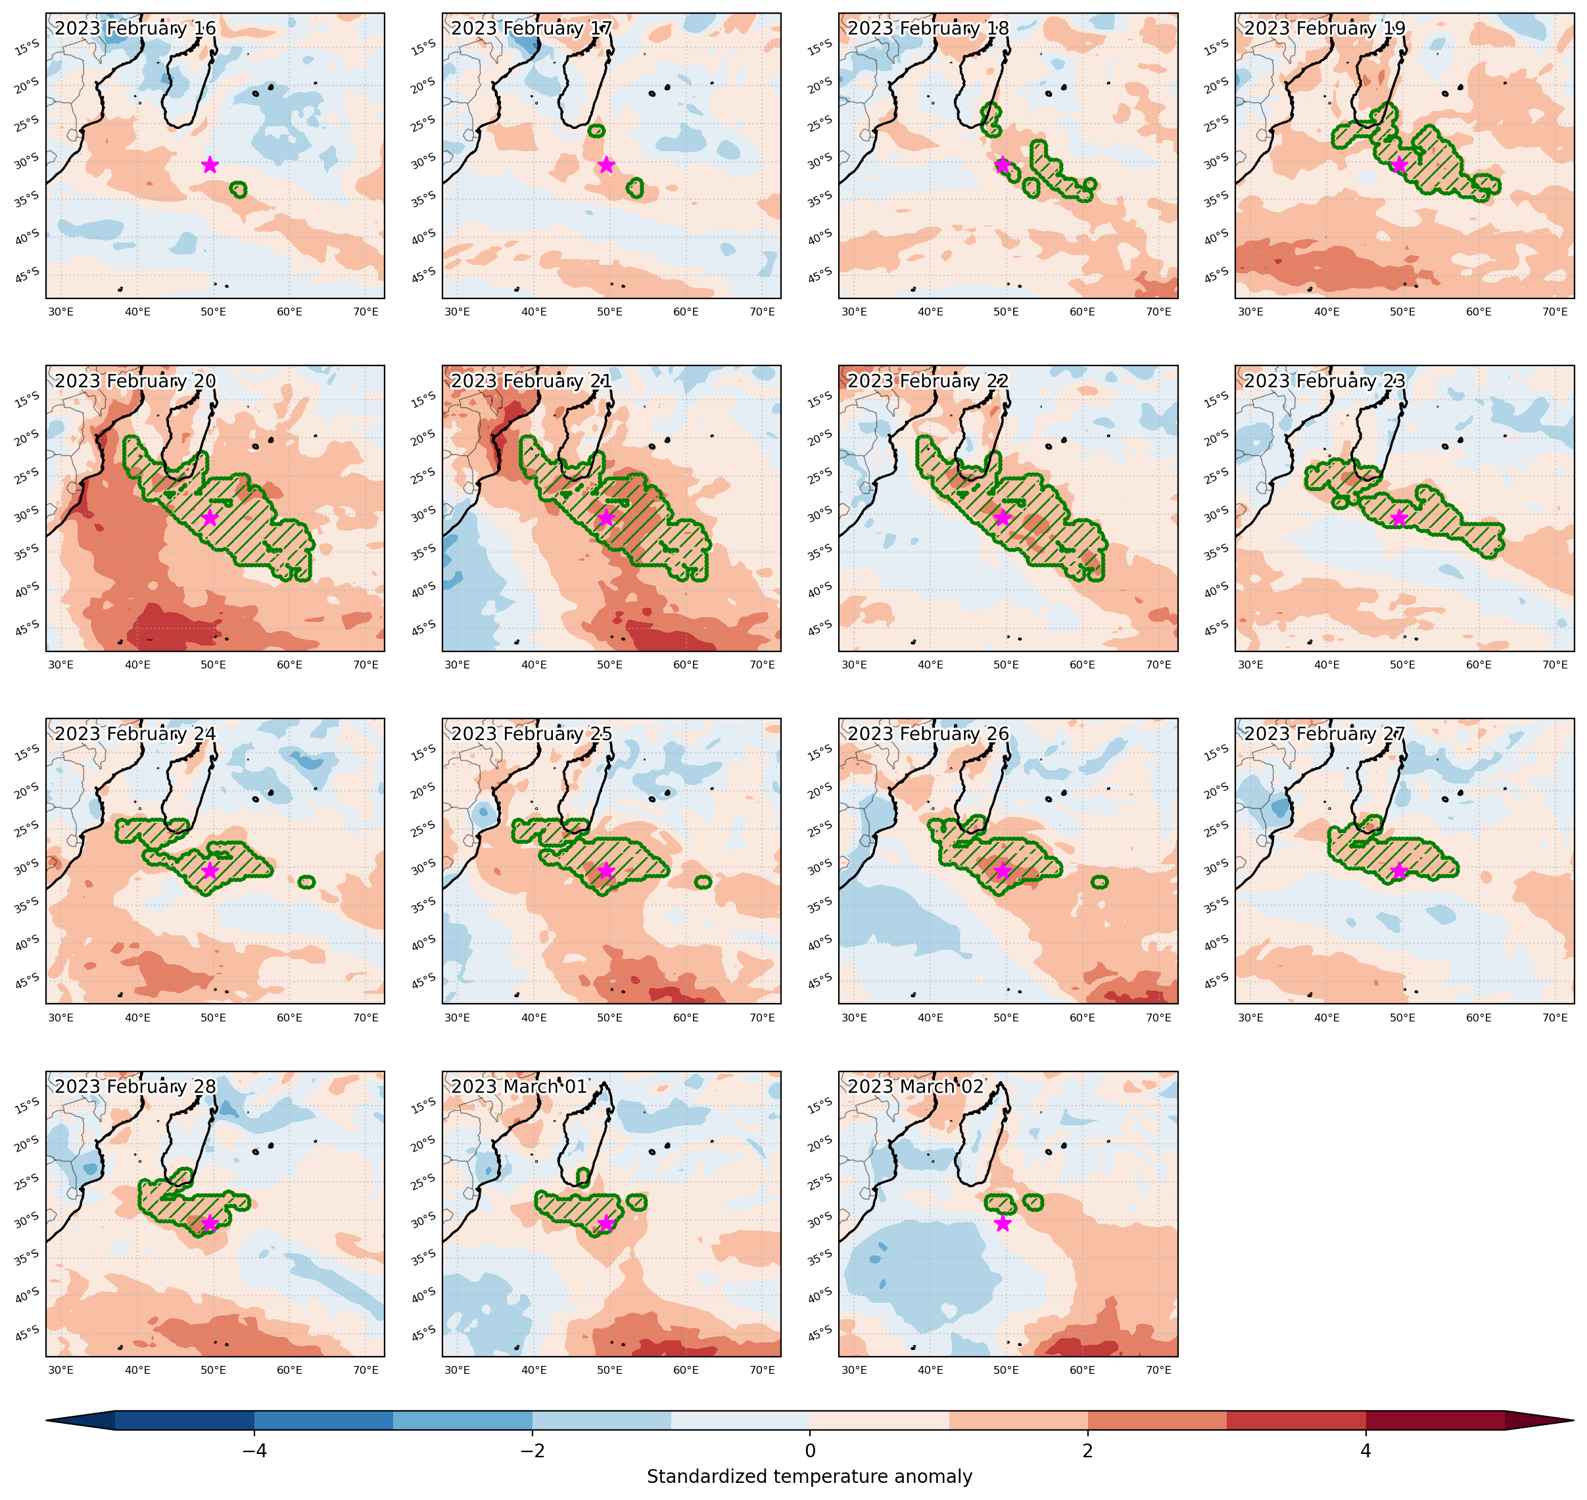
Fig. 3: Maps illustrating the evolution of standardized temperature anomalies during the event.

Event ID: Heat_wave_2023-Feb-19_to_2023-Feb-21_44.5_-23.0

Heat wave occuring from February 16 2023 to March 02 2023 at -30.5°S 49.5°E

Download data: JSON

Event type: Heat wave

Countries affected (identified with ArcGIS Online; provided only for geographical reference):

  • Madagascar

Duration: 15 days

Time span: February 16 2023 to March 02 2023

Statistics over entire affected area:

  • Mean temperature anomaly: 1.8 °C
  • Mean temperature: 25.8 °C
  • Maximum temperature anomaly: 4.8 °C
  • Maximum temperature: 31.8 °C

Event center: -30.5°S 49.5°E

Area affected: 1629443 km$^2$


Fig. 1: Map of most extreme temperature anomalies (standardized) experienced during the event. The purple star indicates the center of the extreme event. Green hatching illustrates all areas under the effect of extremes at some time during the event.


Fig. 2: Evolution of temperature at the center of the event. The climatological percentile distribution is illustrated with color shadings.


Fig. 3: Maps illustrating the evolution of standardized temperature anomalies during the event.

Event ID: Heat_wave_2023-Feb-16_to_2023-Mar-02_49.5_-30.5

Cold spell occuring from January 30 2023 to February 09 2023 at -25.5°S 46.0°E

Download data: JSON

Event type: Cold spell

Countries affected (identified with ArcGIS Online; provided only for geographical reference):

  • Madagascar

Duration: 11 days

Time span: January 30 2023 to February 09 2023

Statistics over entire affected area:

  • Mean temperature anomaly: -1.8 °C
  • Mean temperature: 22.6 °C
  • Minimum temperature anomaly: -4.0 °C
  • Minimum temperature: 17.7 °C

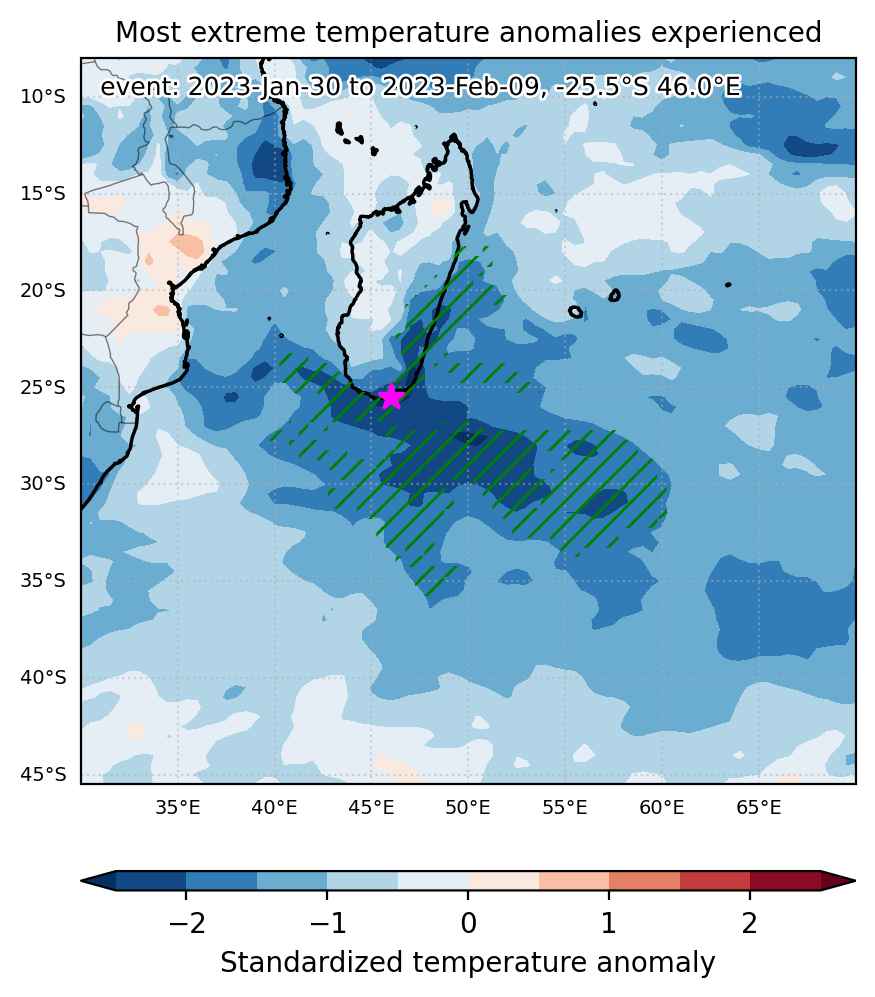
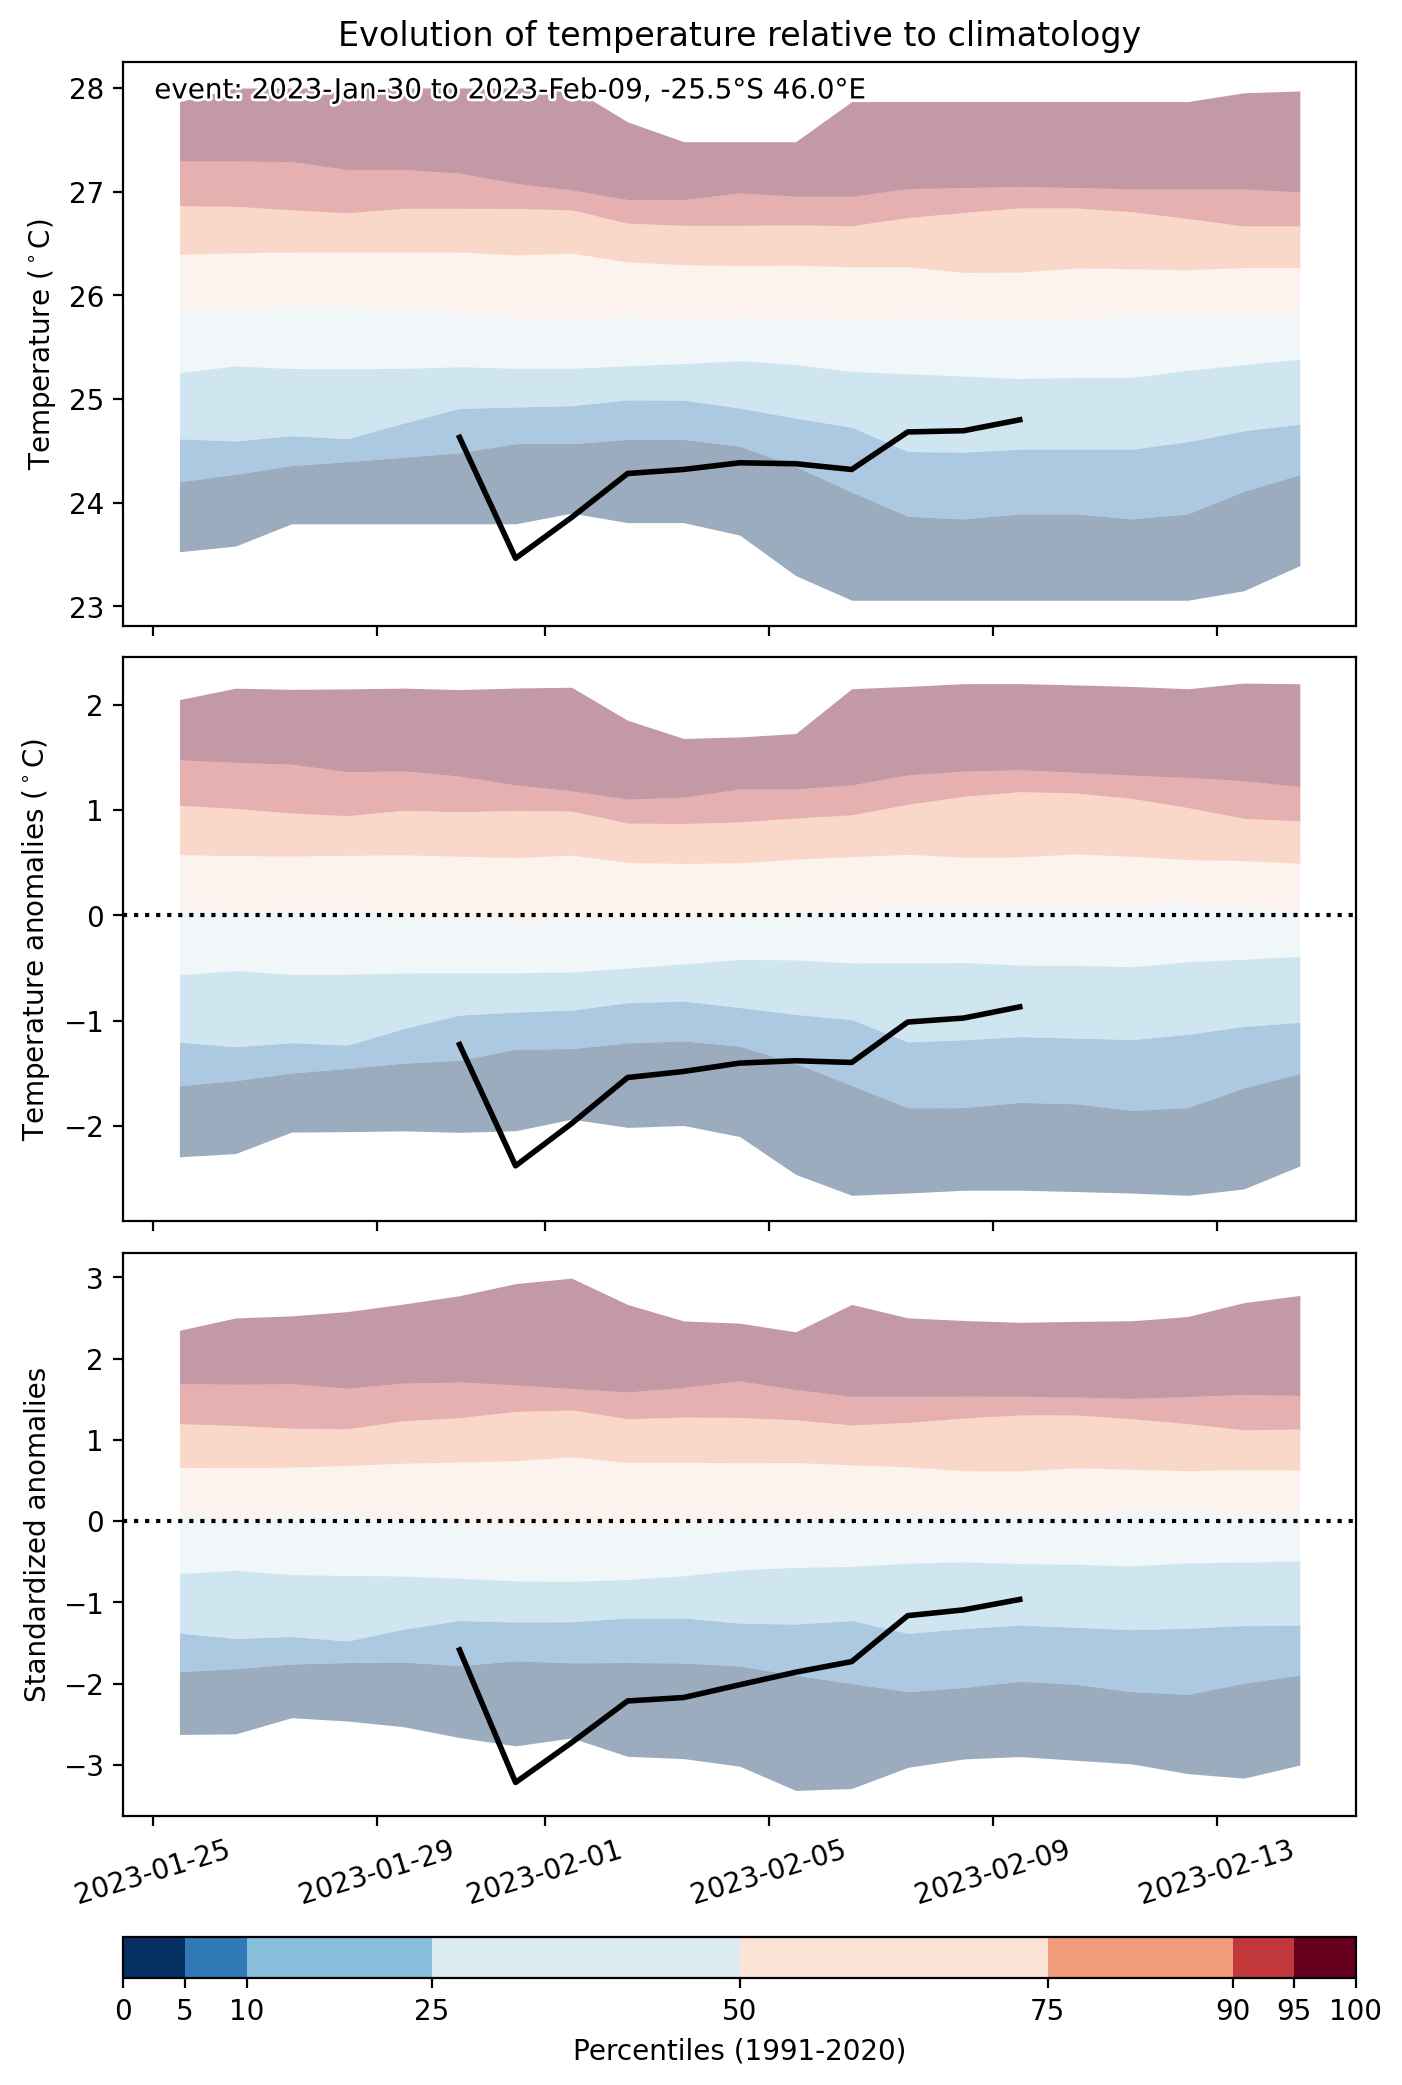
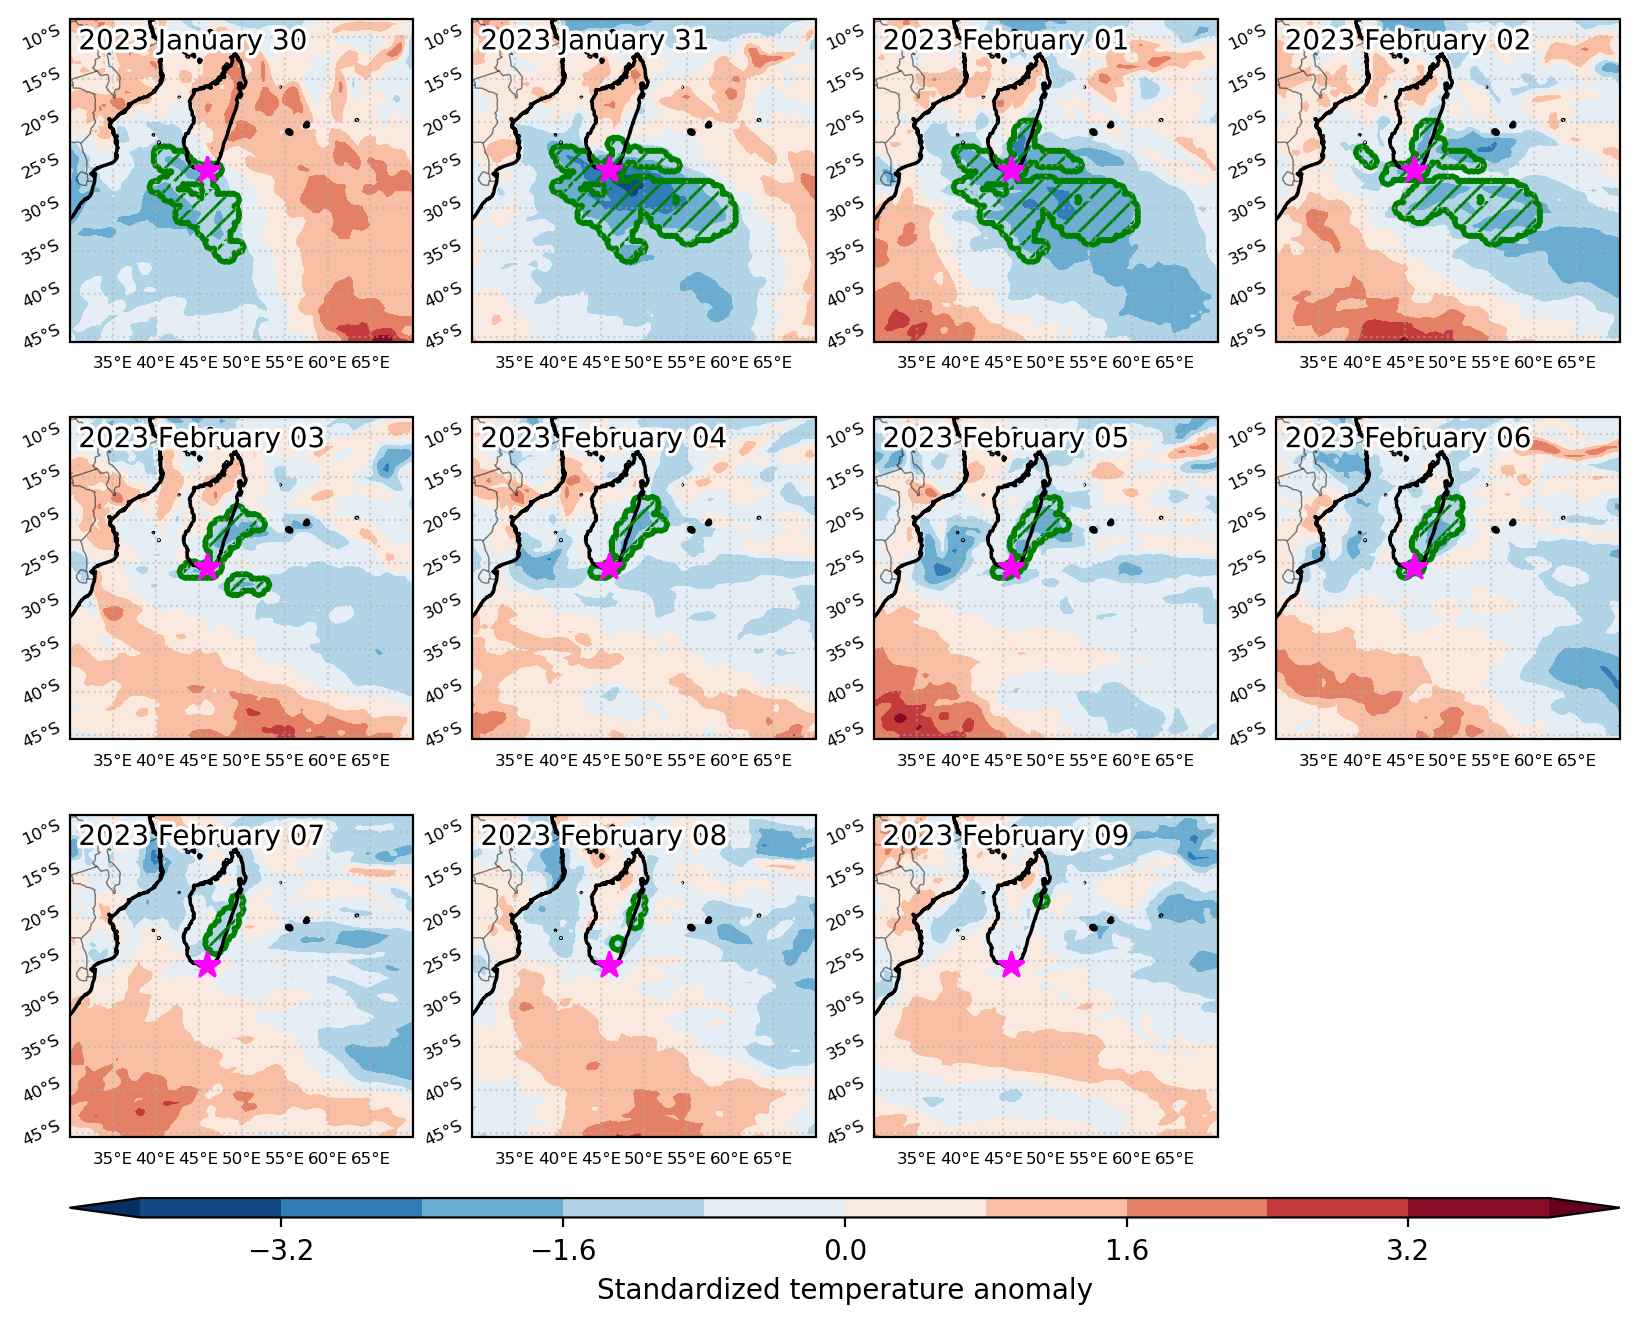
Event center: -25.5°S 46.0°E

Area affected: 1311843 km$^2$


Fig. 1: Map of most extreme temperature anomalies (standardized) experienced during the event. The purple star indicates the center of the extreme event. Green hatching illustrates all areas under the effect of extremes at some time during the event.


Fig. 2: Evolution of temperature at the center of the event. The climatological percentile distribution is illustrated with color shadings.


Fig. 3: Maps illustrating the evolution of standardized temperature anomalies during the event.

Event ID: Cold_spell_2023-Jan-30_to_2023-Feb-09_46.0_-25.5

Heat wave occuring from January 27 2023 to February 01 2023 at -19.0°S 48.5°E

Download data: JSON

Event type: Heat wave

Countries affected (identified with ArcGIS Online; provided only for geographical reference):

  • Madagascar

Duration: 6 days

Time span: January 27 2023 to February 01 2023

Statistics over entire affected area:

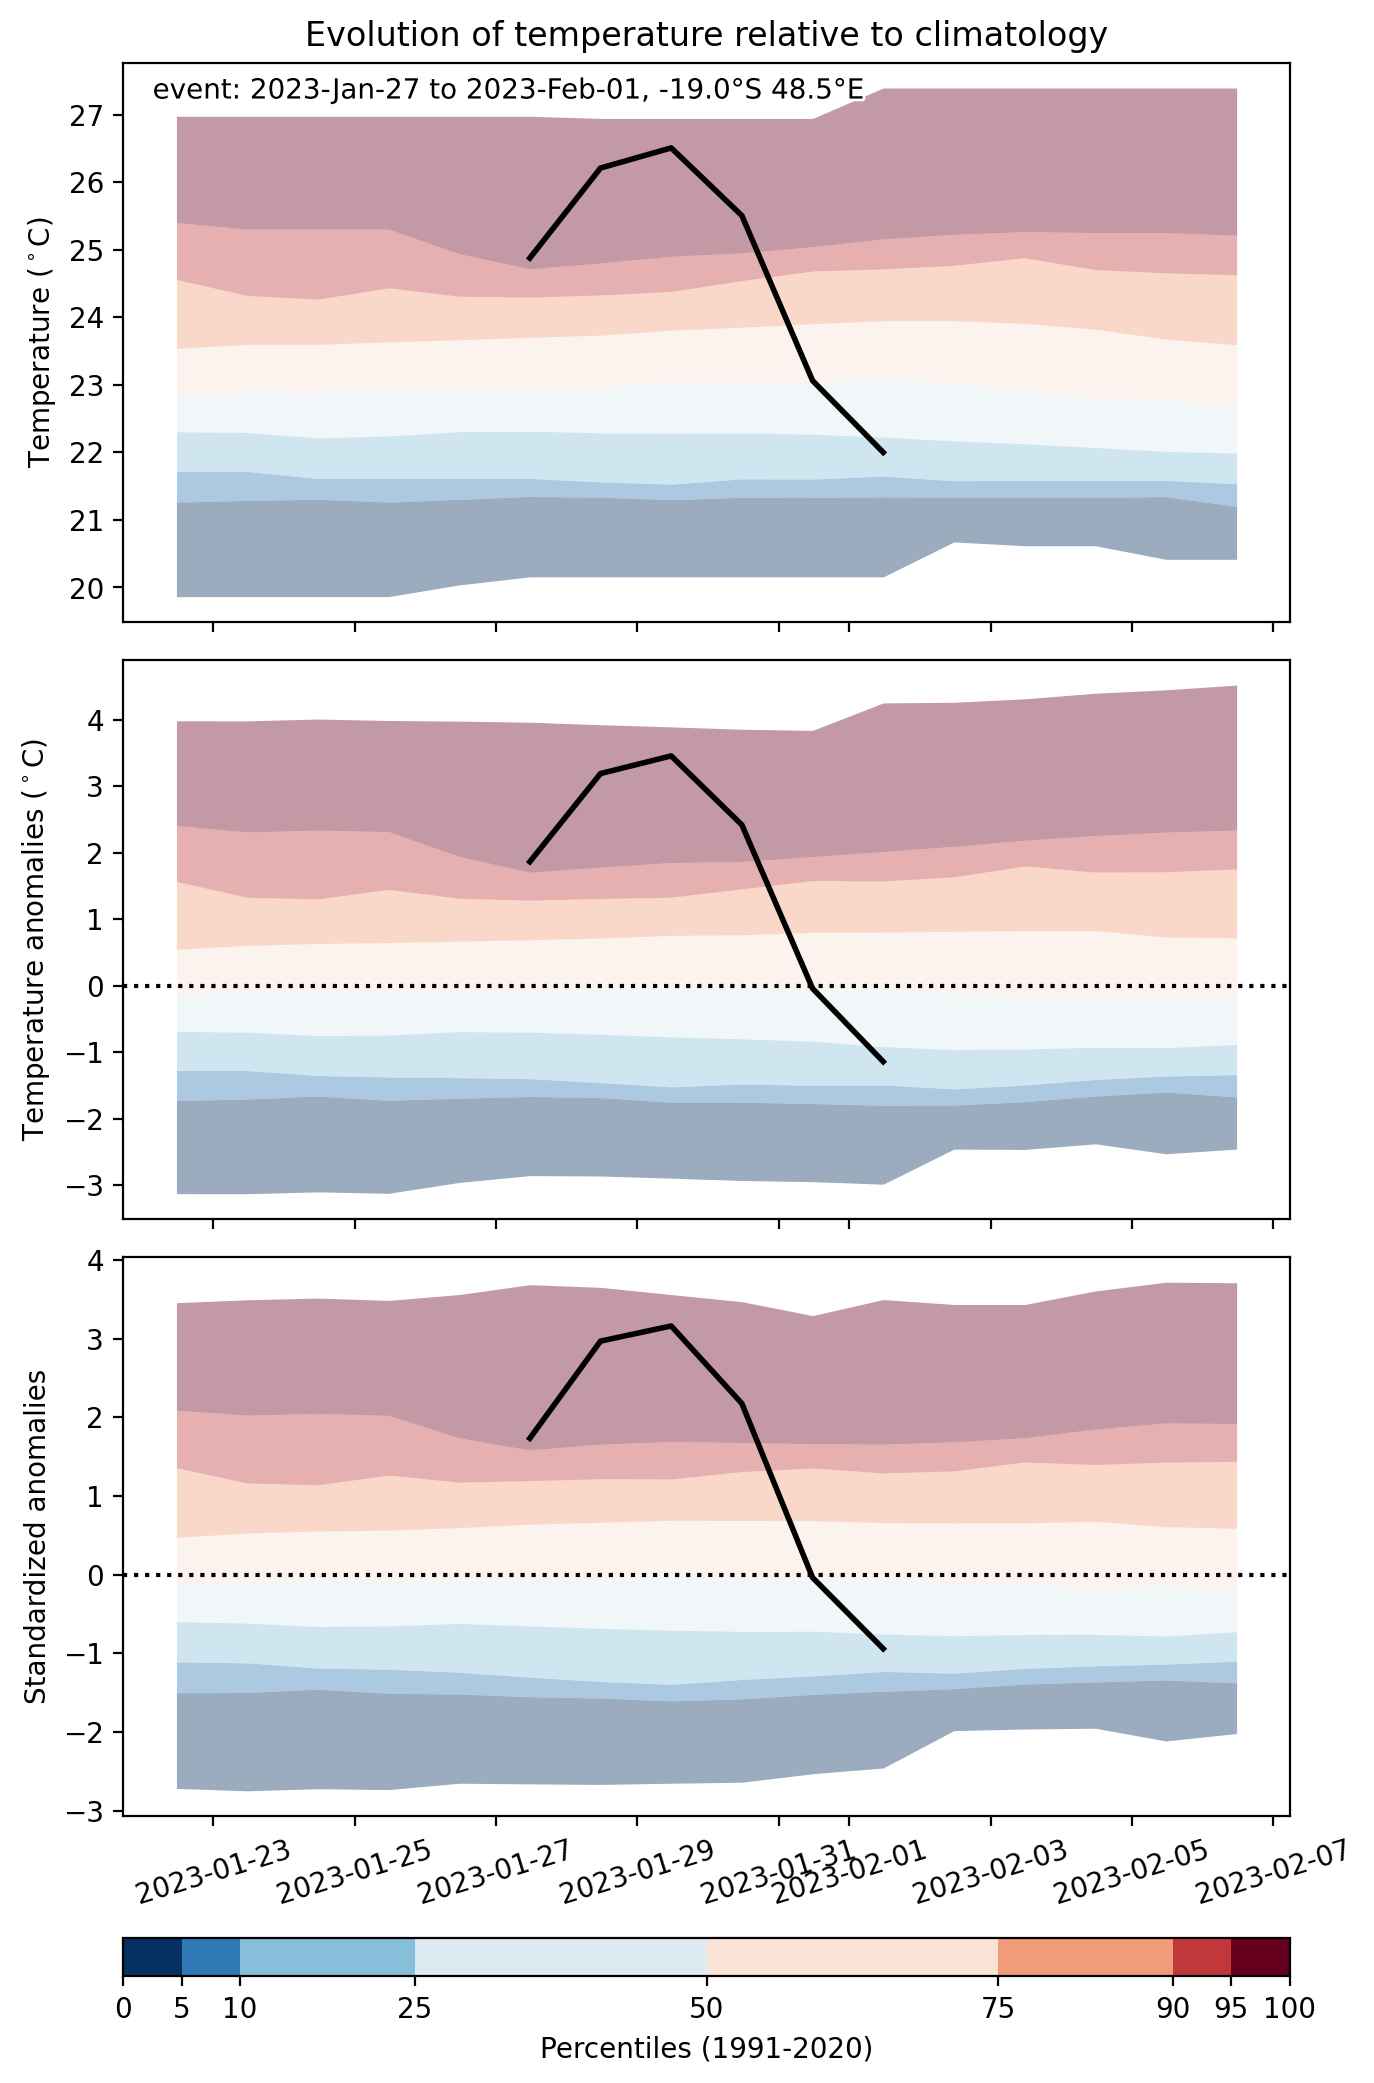
  • Mean temperature anomaly: 1.5 °C
  • Mean temperature: 27.1 °C
  • Maximum temperature anomaly: 3.7 °C
  • Maximum temperature: 30.3 °C

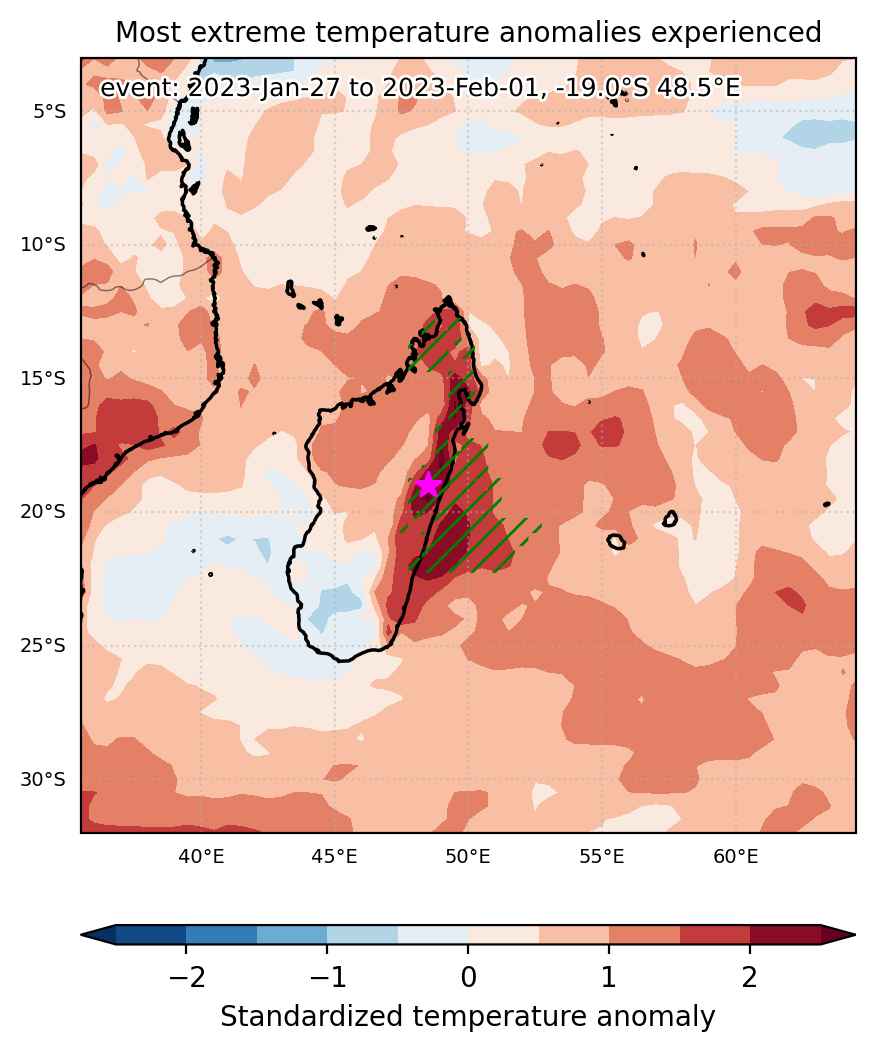
Event center: -19.0°S 48.5°E

Area affected: 242564 km$^2$


Fig. 1: Map of most extreme temperature anomalies (standardized) experienced during the event. The purple star indicates the center of the extreme event. Green hatching illustrates all areas under the effect of extremes at some time during the event.


Fig. 2: Evolution of temperature at the center of the event. The climatological percentile distribution is illustrated with color shadings.


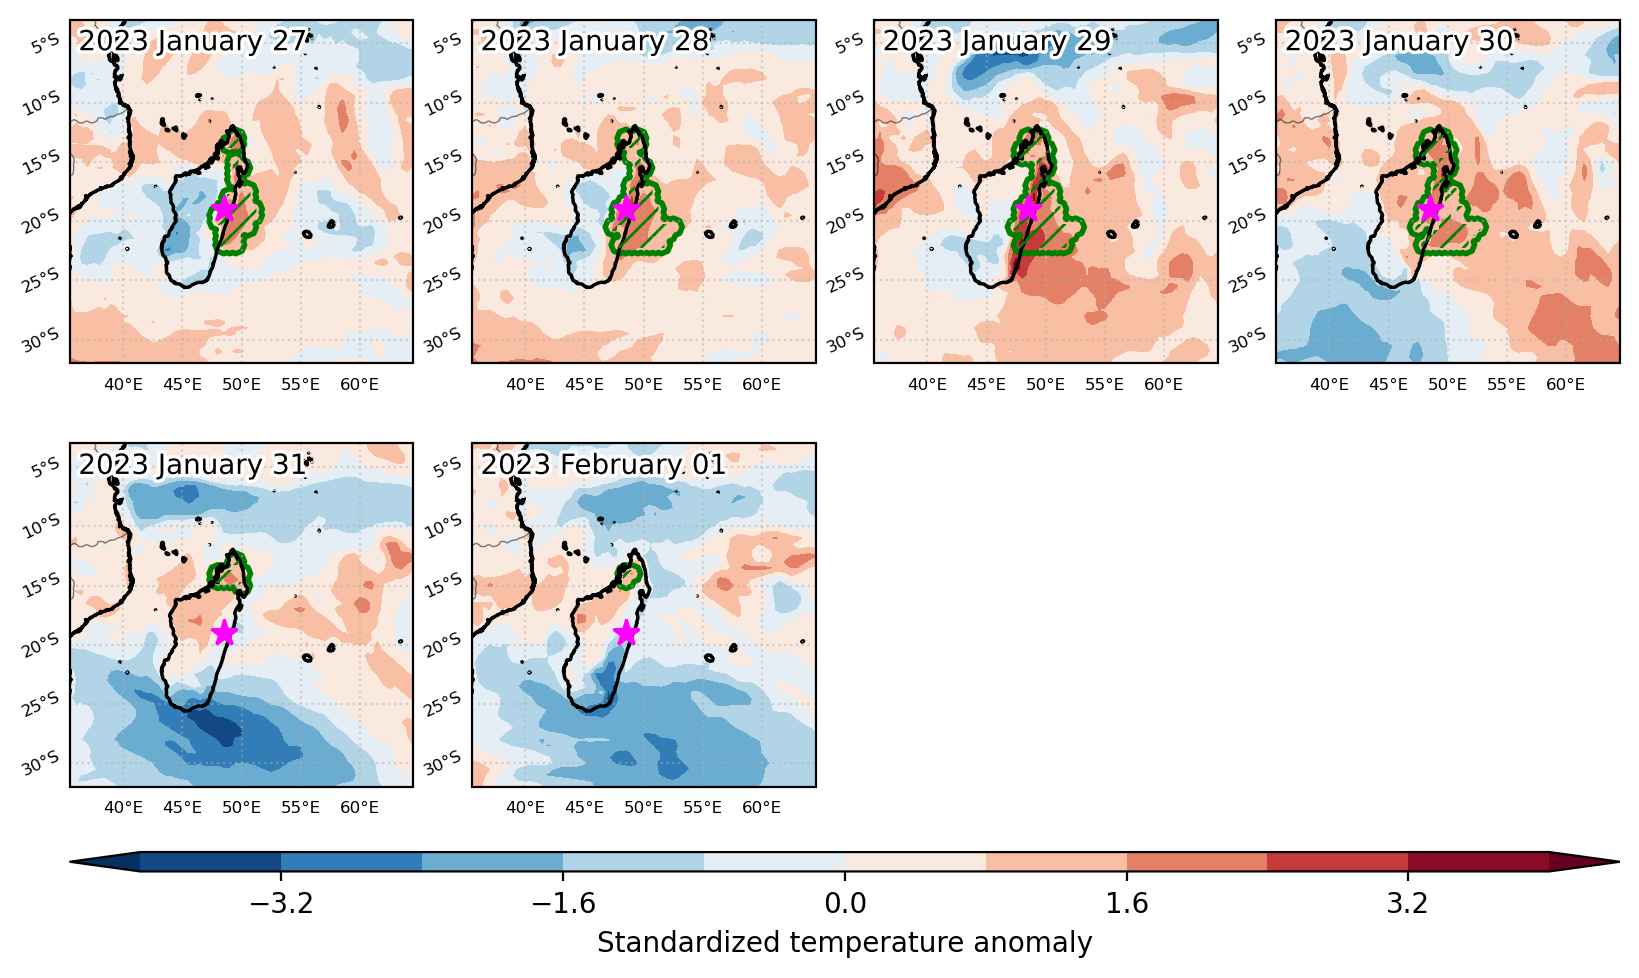
Fig. 3: Maps illustrating the evolution of standardized temperature anomalies during the event.

Event ID: Heat_wave_2023-Jan-27_to_2023-Feb-01_48.5_-19.0

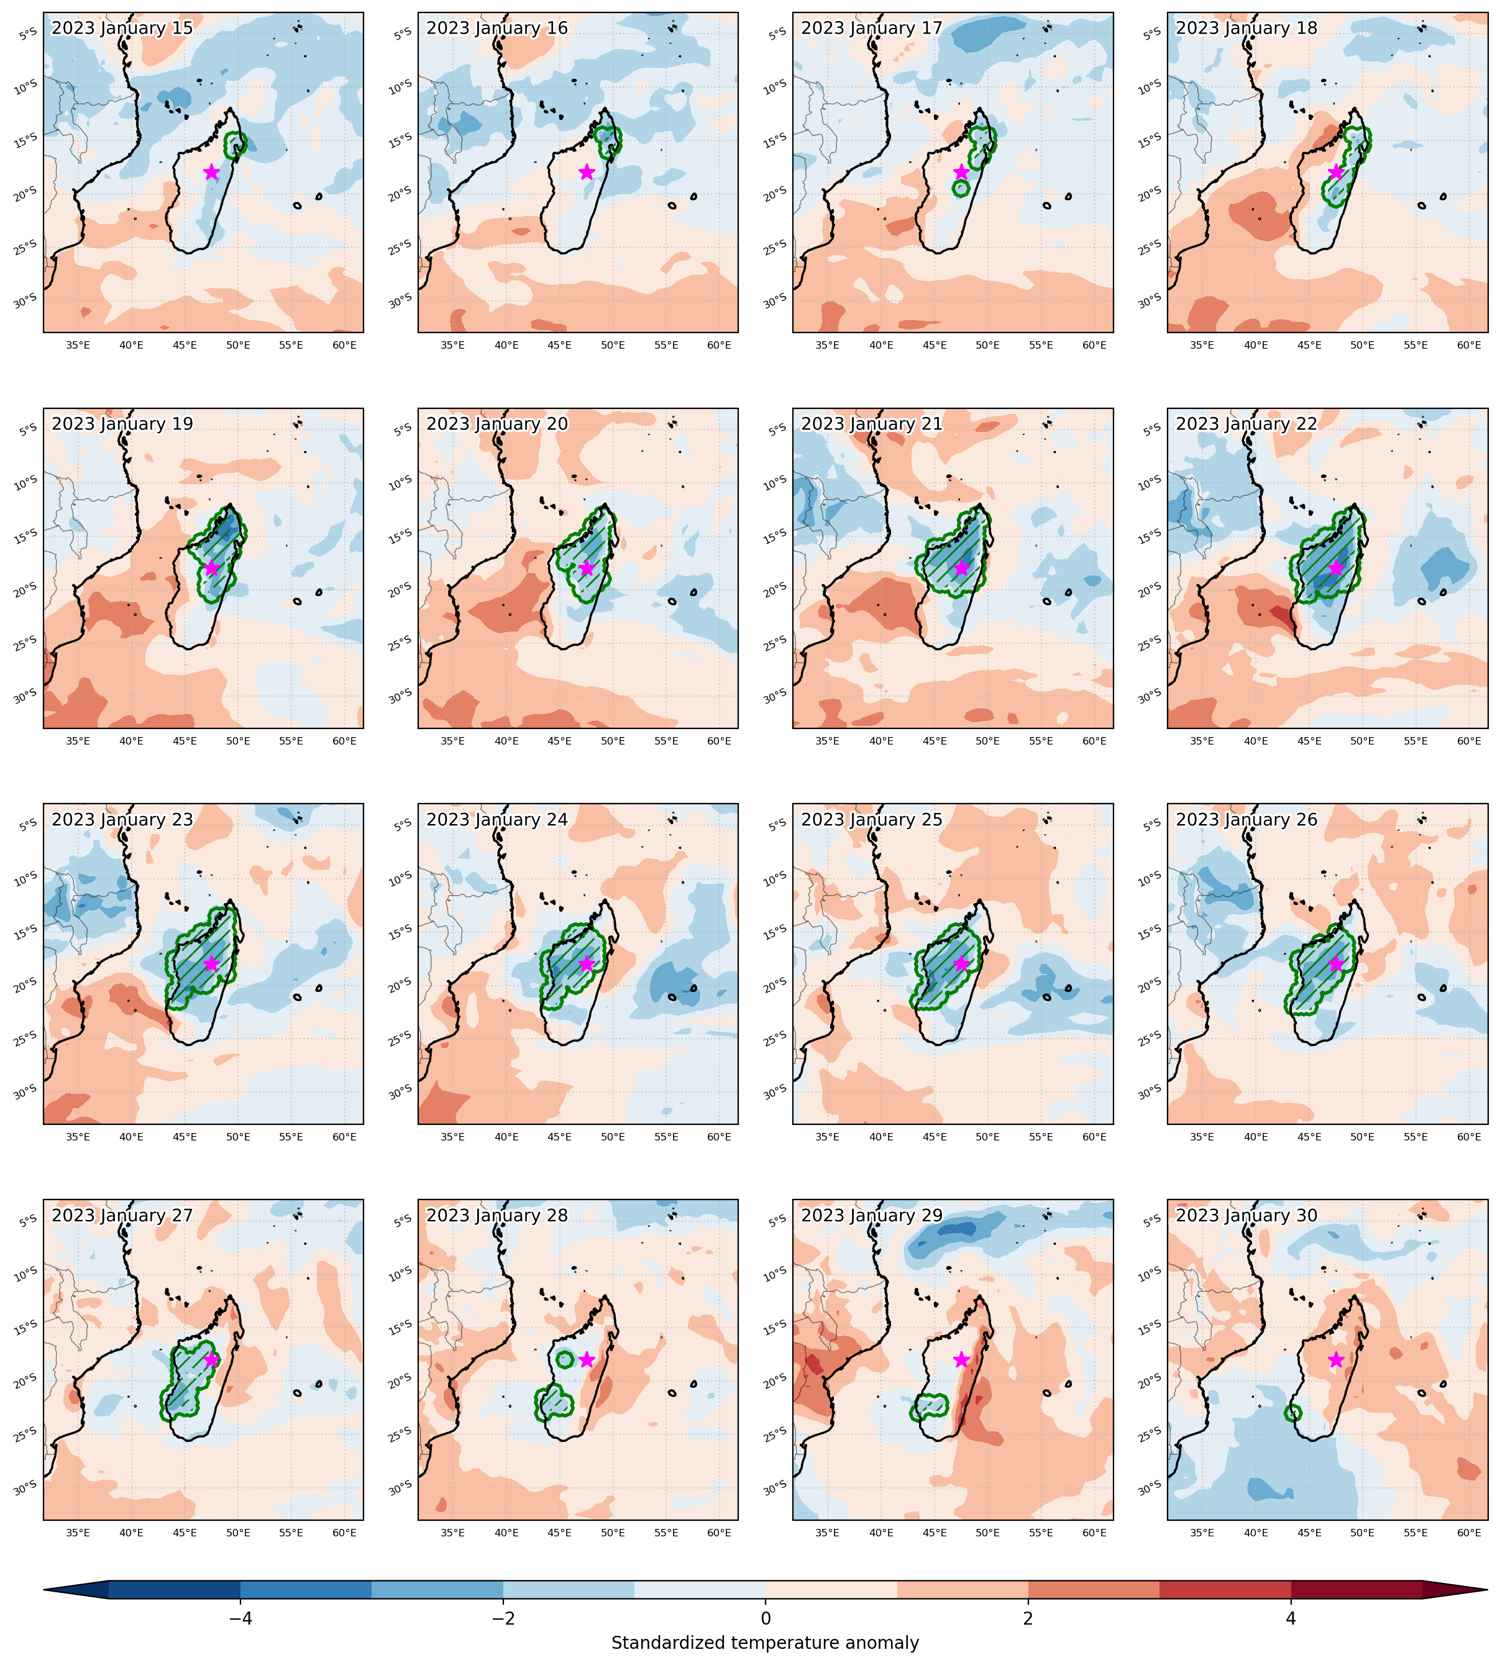
Cold spell occuring from January 15 2023 to January 30 2023 at -18.0°S 47.5°E

Download data: JSON

Event type: Cold spell

Countries affected (identified with ArcGIS Online; provided only for geographical reference):

  • Madagascar

Duration: 16 days

Time span: January 15 2023 to January 30 2023

Statistics over entire affected area:

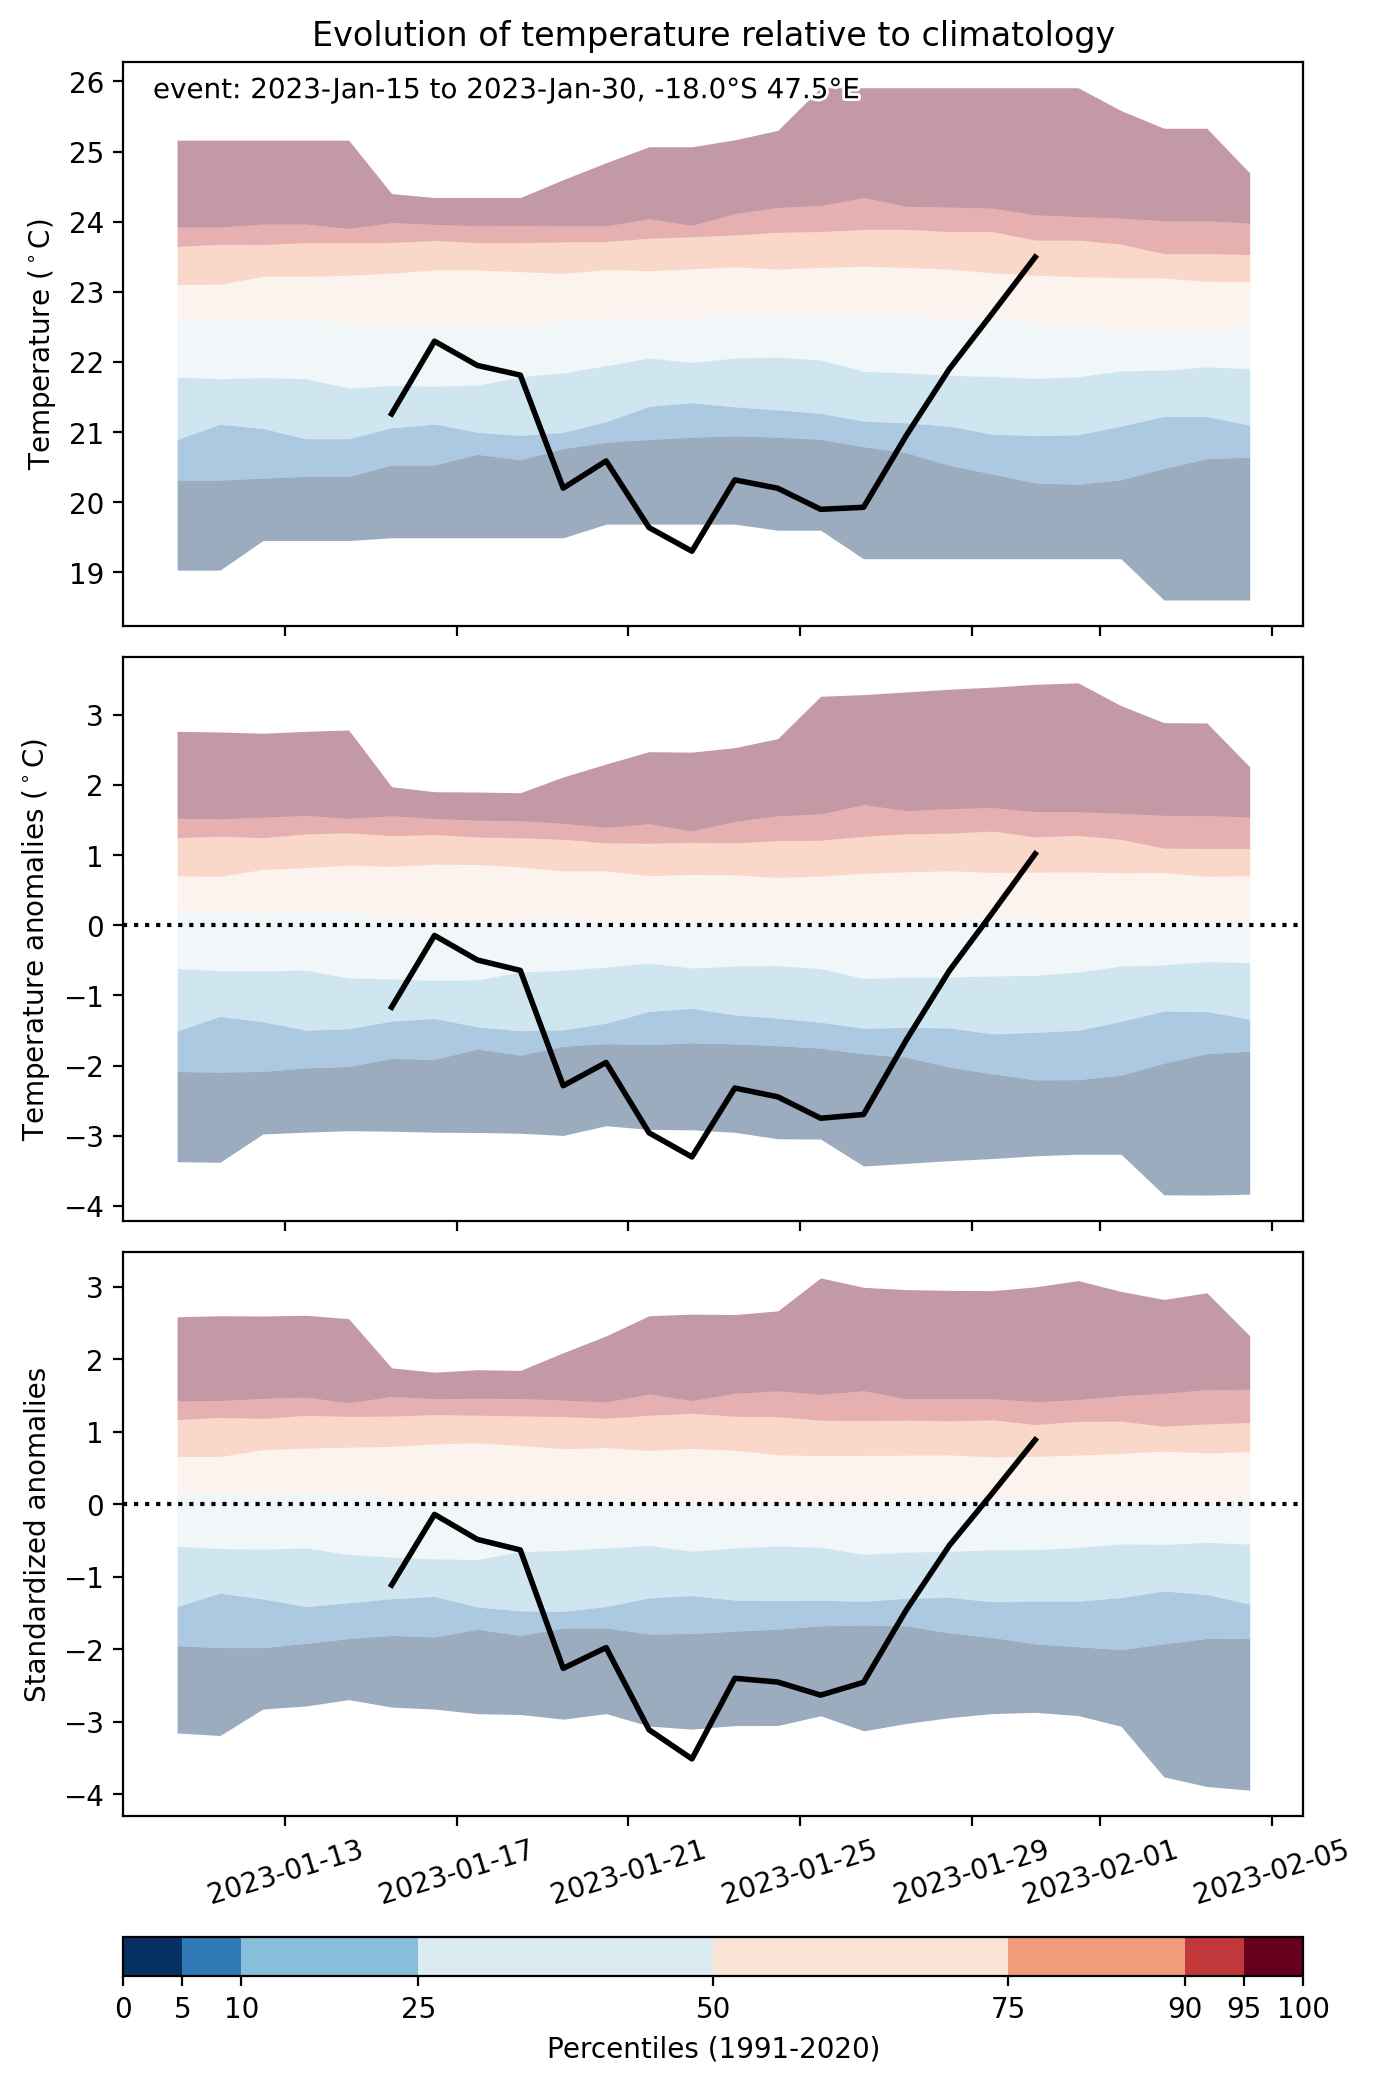
  • Mean temperature anomaly: -2.2 °C
  • Mean temperature: 22.4 °C
  • Minimum temperature anomaly: -4.1 °C
  • Minimum temperature: 15.5 °C

Event center: -18.0°S 47.5°E

Area affected: 405781 km$^2$


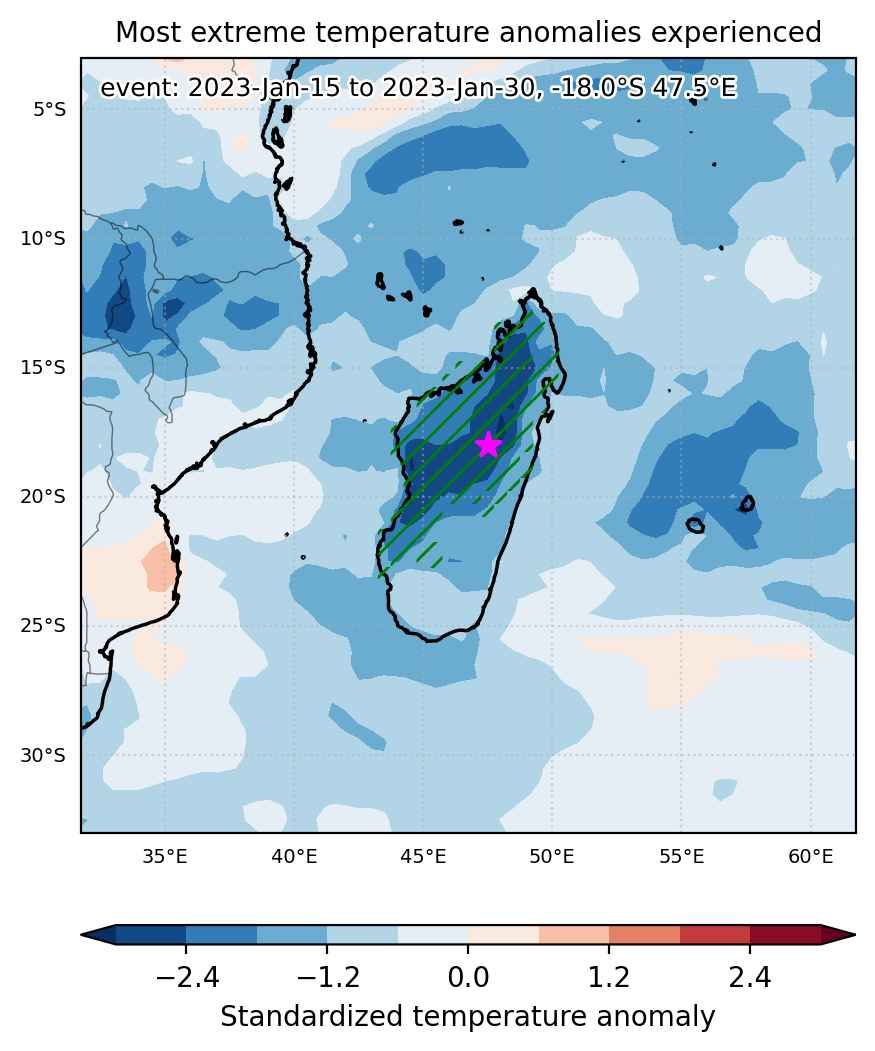
Fig. 1: Map of most extreme temperature anomalies (standardized) experienced during the event. The purple star indicates the center of the extreme event. Green hatching illustrates all areas under the effect of extremes at some time during the event.


Fig. 2: Evolution of temperature at the center of the event. The climatological percentile distribution is illustrated with color shadings.


Fig. 3: Maps illustrating the evolution of standardized temperature anomalies during the event.

Event ID: Cold_spell_2023-Jan-15_to_2023-Jan-30_47.5_-18.0

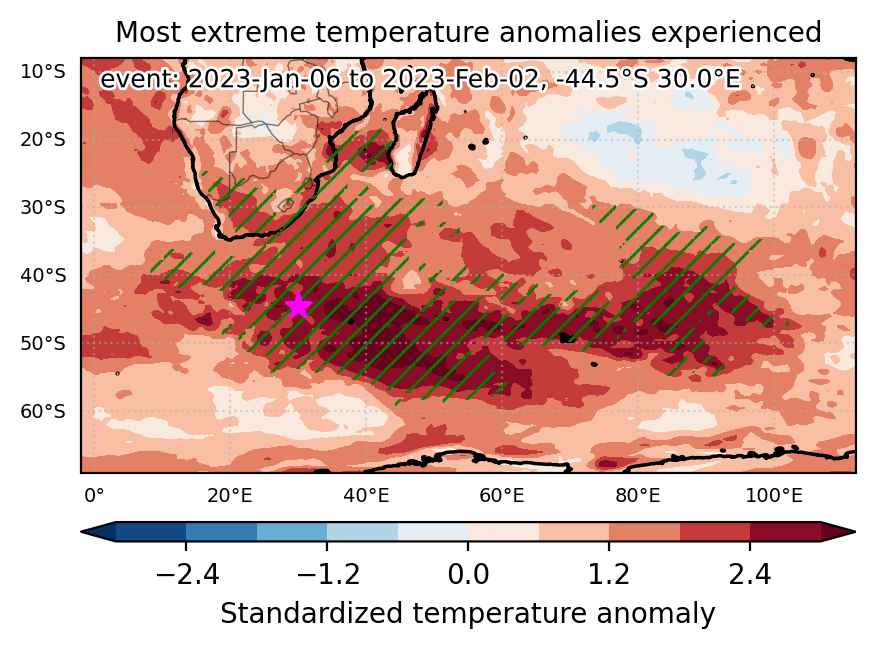
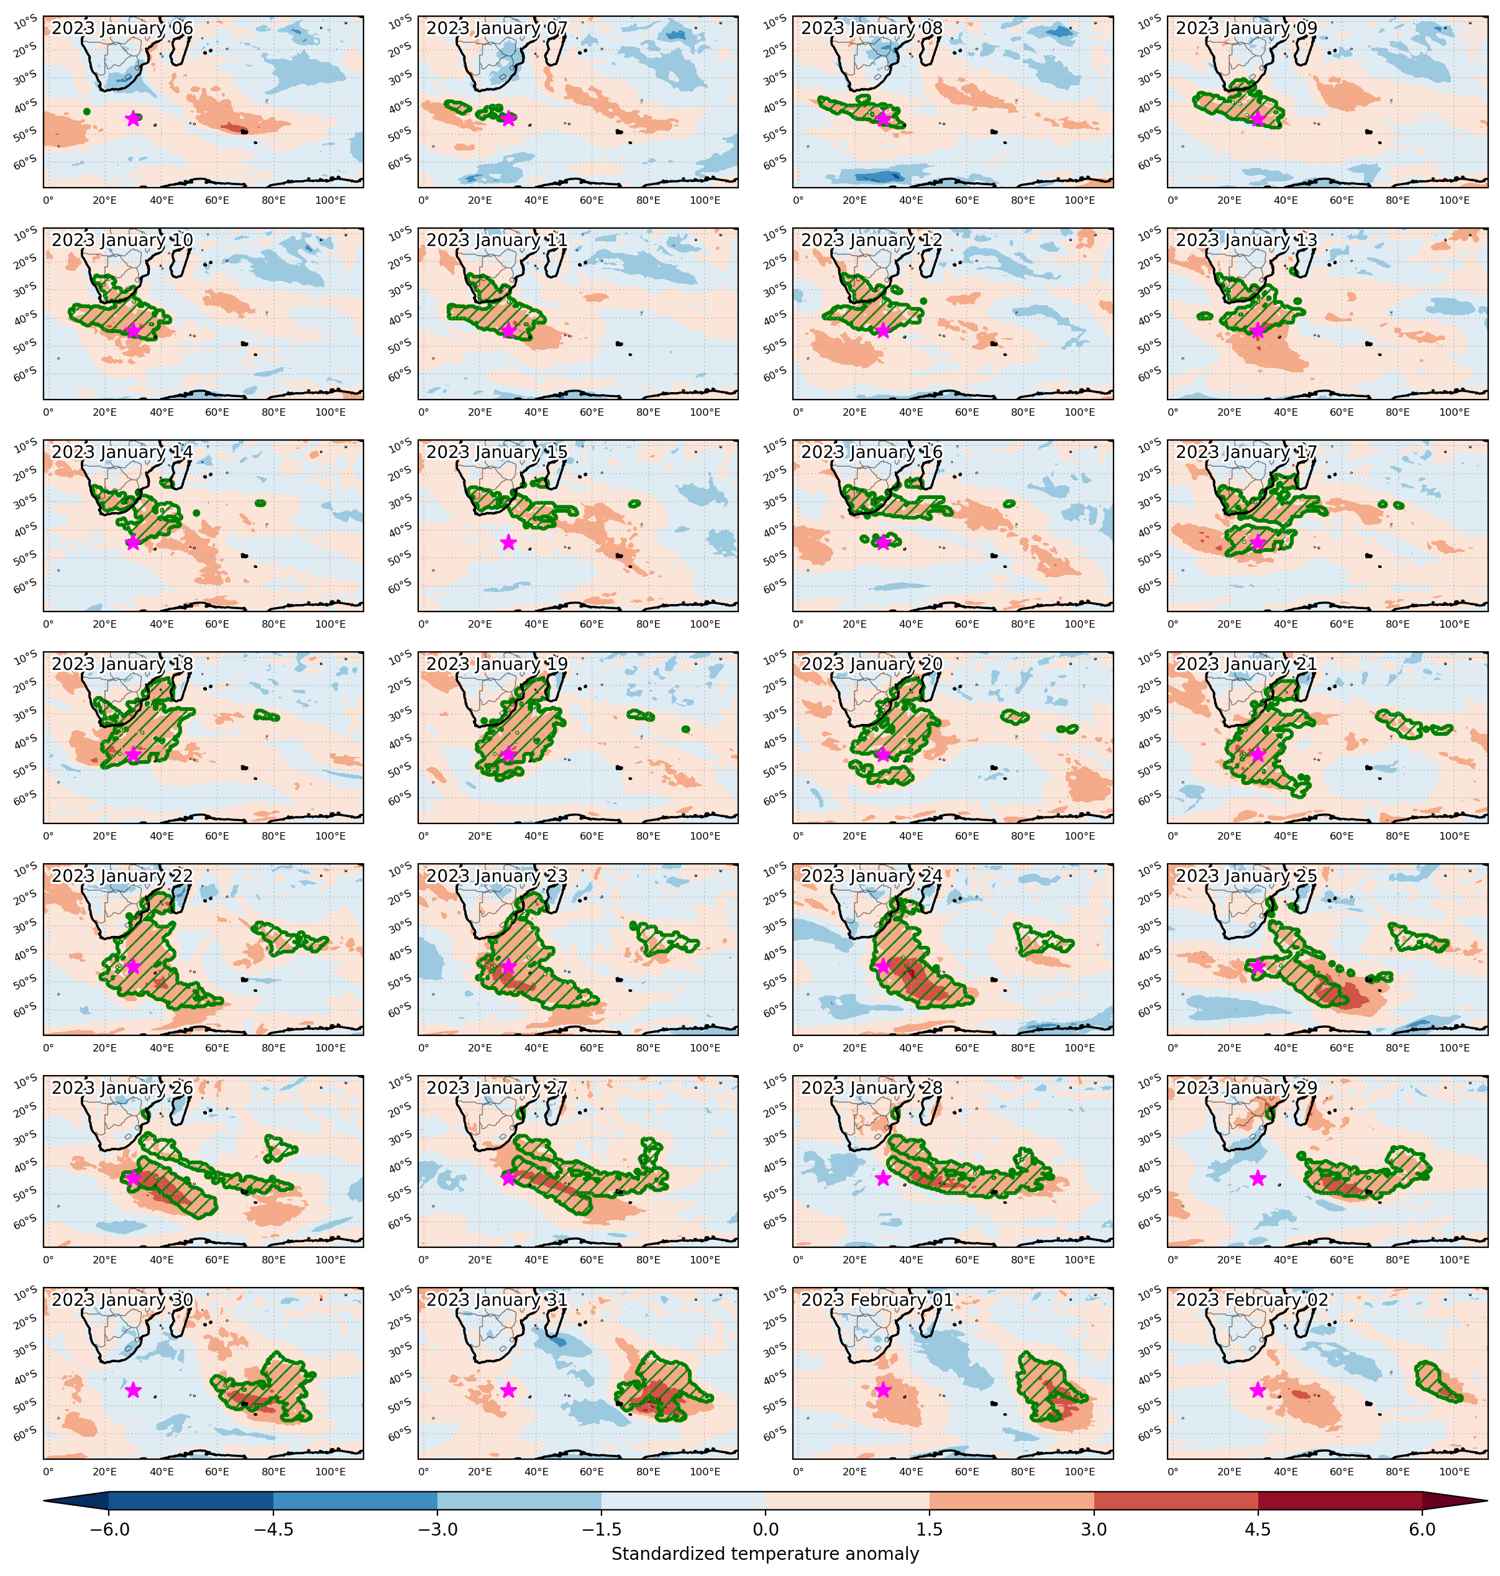
Heat wave occuring from January 06 2023 to February 02 2023 at -44.5°S 30.0°E

Download data: JSON

Event type: Heat wave

Countries affected (identified with ArcGIS Online; provided only for geographical reference):

  • Botswana
  • Eswatini
  • French Southern Territories
  • Lesotho
  • Madagascar
  • Mozambique
  • Namibia
  • South Africa

Duration: 28 days

Time span: January 06 2023 to February 02 2023

Statistics over entire affected area:

  • Mean temperature anomaly: 3.0 °C
  • Mean temperature: 17.9 °C
  • Maximum temperature anomaly: 9.8 °C
  • Maximum temperature: 36.1 °C

Event center: -44.5°S 30.0°E

Area affected: 13158331 km$^2$


Fig. 1: Map of most extreme temperature anomalies (standardized) experienced during the event. The purple star indicates the center of the extreme event. Green hatching illustrates all areas under the effect of extremes at some time during the event.


Fig. 2: Evolution of temperature at the center of the event. The climatological percentile distribution is illustrated with color shadings.


Fig. 3: Maps illustrating the evolution of standardized temperature anomalies during the event.

Event ID: Heat_wave_2023-Jan-06_to_2023-Feb-02_30.0_-44.5

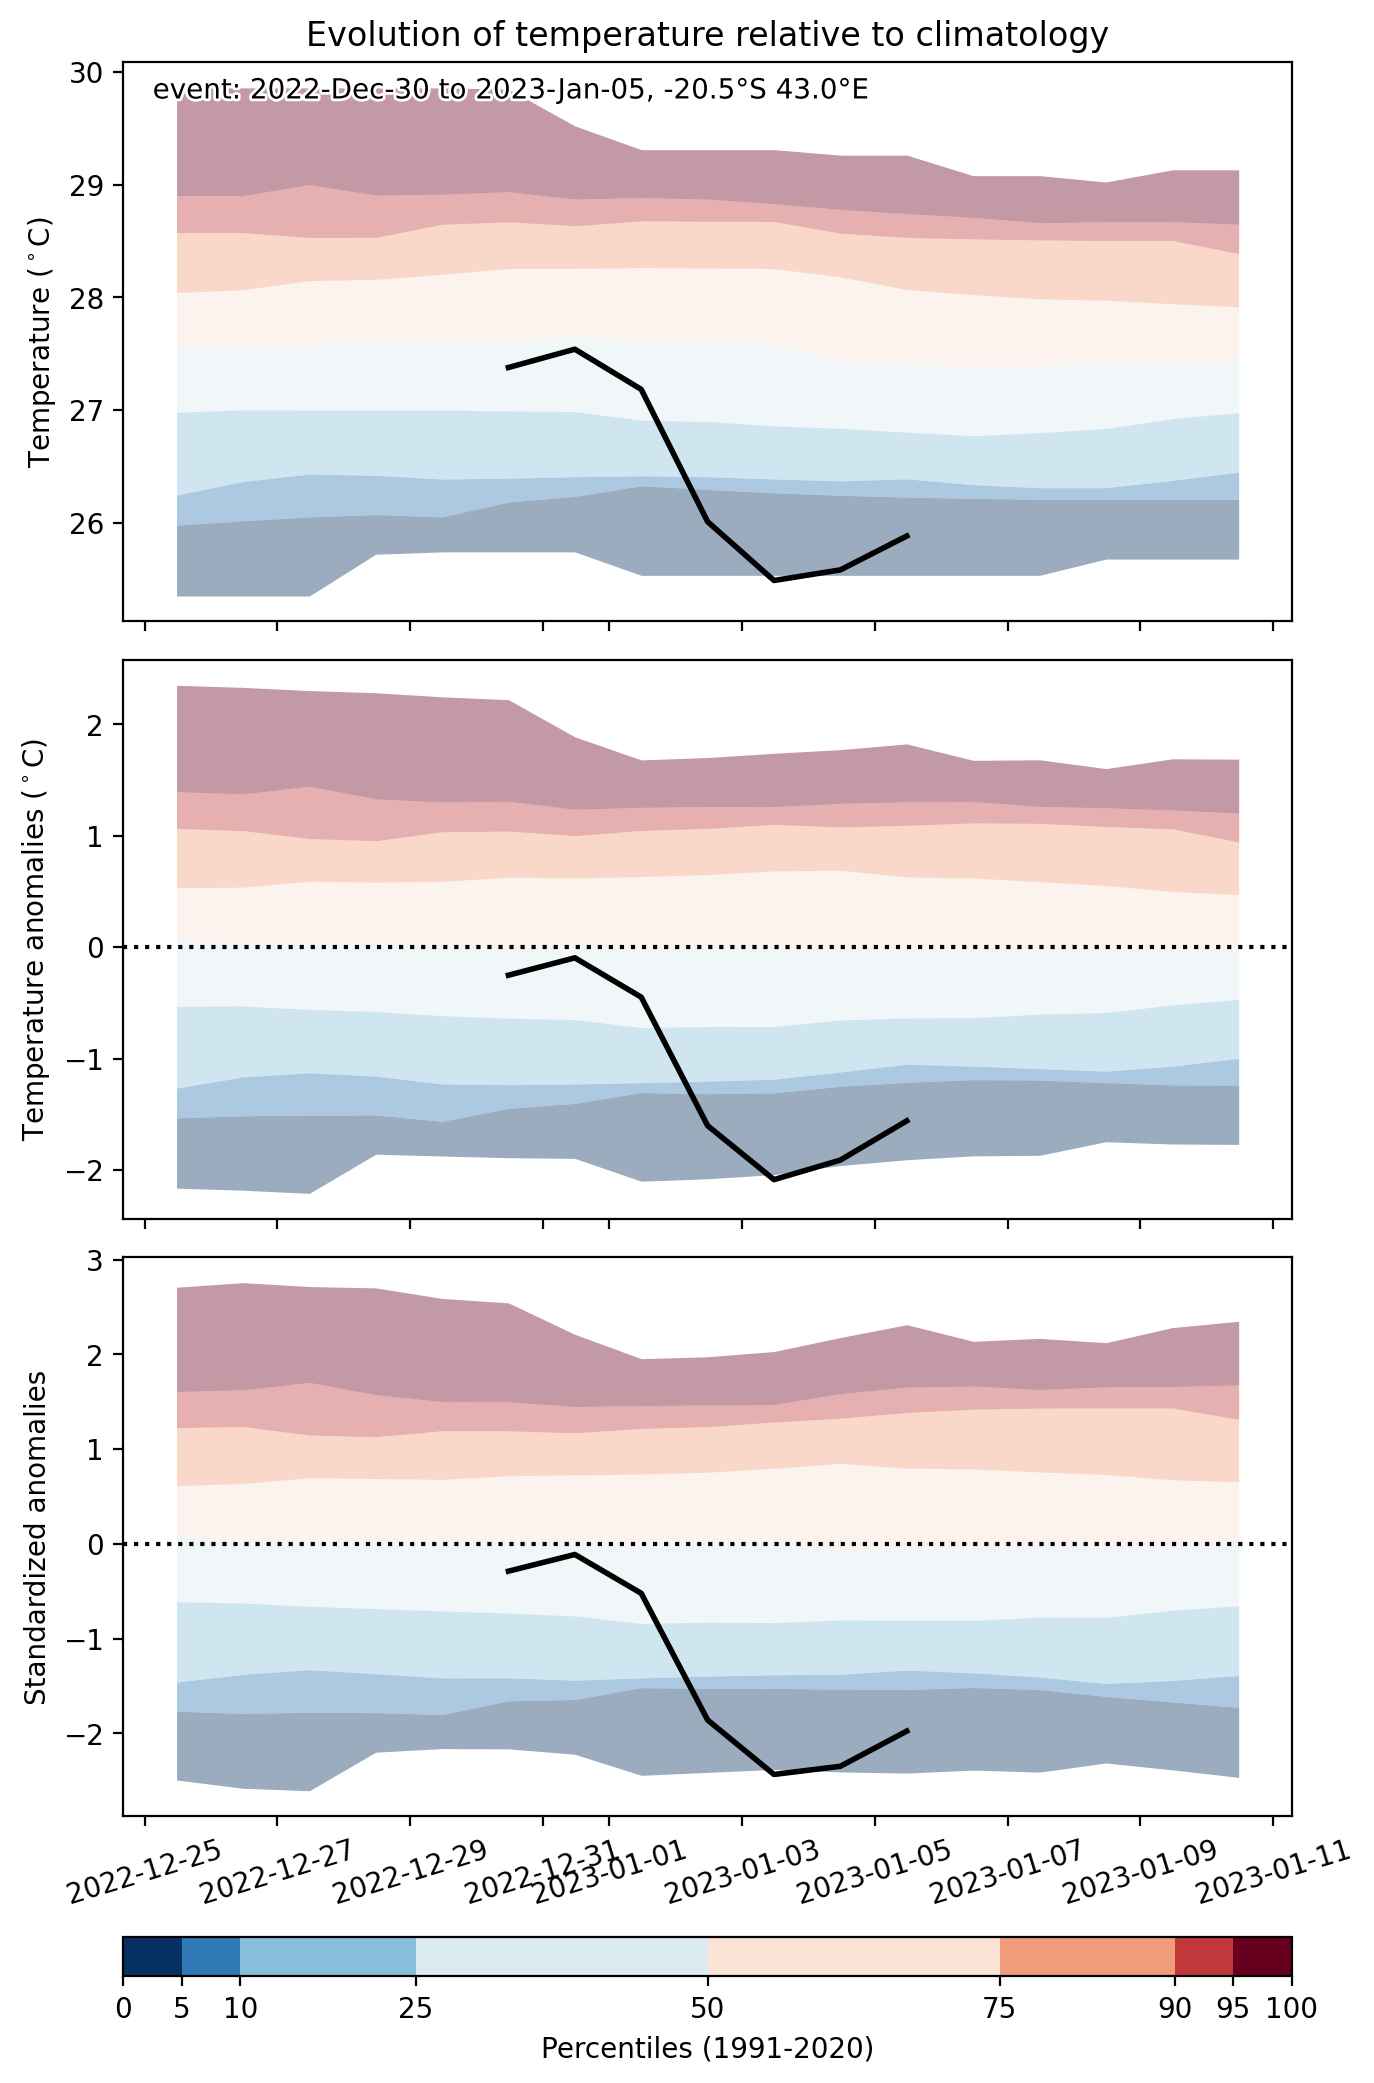
Cold spell occuring from December 30 2022 to January 05 2023 at -20.5°S 43.0°E

Download data: JSON

Event type: Cold spell

Countries affected (identified with ArcGIS Online; provided only for geographical reference):

  • Madagascar
  • Mozambique

Duration: 7 days

Time span: December 30 2022 to January 05 2023

Statistics over entire affected area:

  • Mean temperature anomaly: -1.8 °C
  • Mean temperature: 25.3 °C
  • Minimum temperature anomaly: -3.5 °C
  • Minimum temperature: 21.5 °C

Event center: -20.5°S 43.0°E

Area affected: 283719 km$^2$


Fig. 1: Map of most extreme temperature anomalies (standardized) experienced during the event. The purple star indicates the center of the extreme event. Green hatching illustrates all areas under the effect of extremes at some time during the event.


Fig. 2: Evolution of temperature at the center of the event. The climatological percentile distribution is illustrated with color shadings.


Fig. 3: Maps illustrating the evolution of standardized temperature anomalies during the event.

Event ID: Cold_spell_2022-Dec-30_to_2023-Jan-05_43.0_-20.5

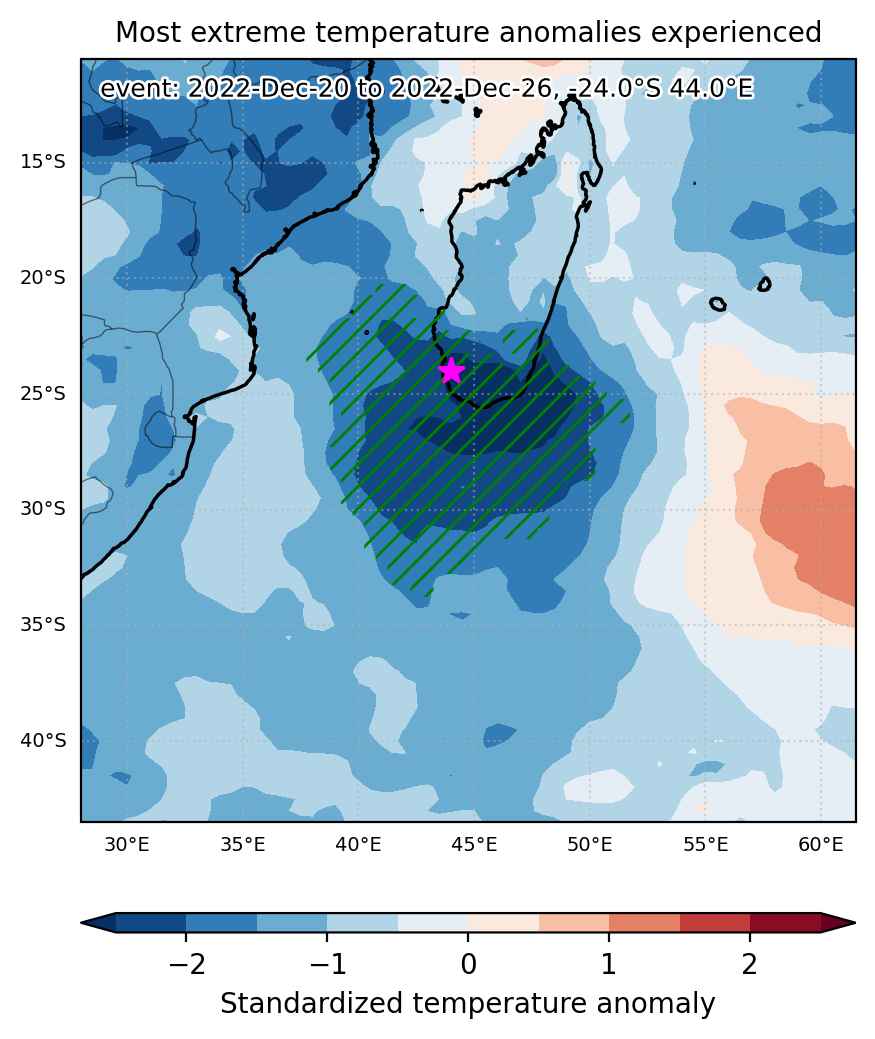
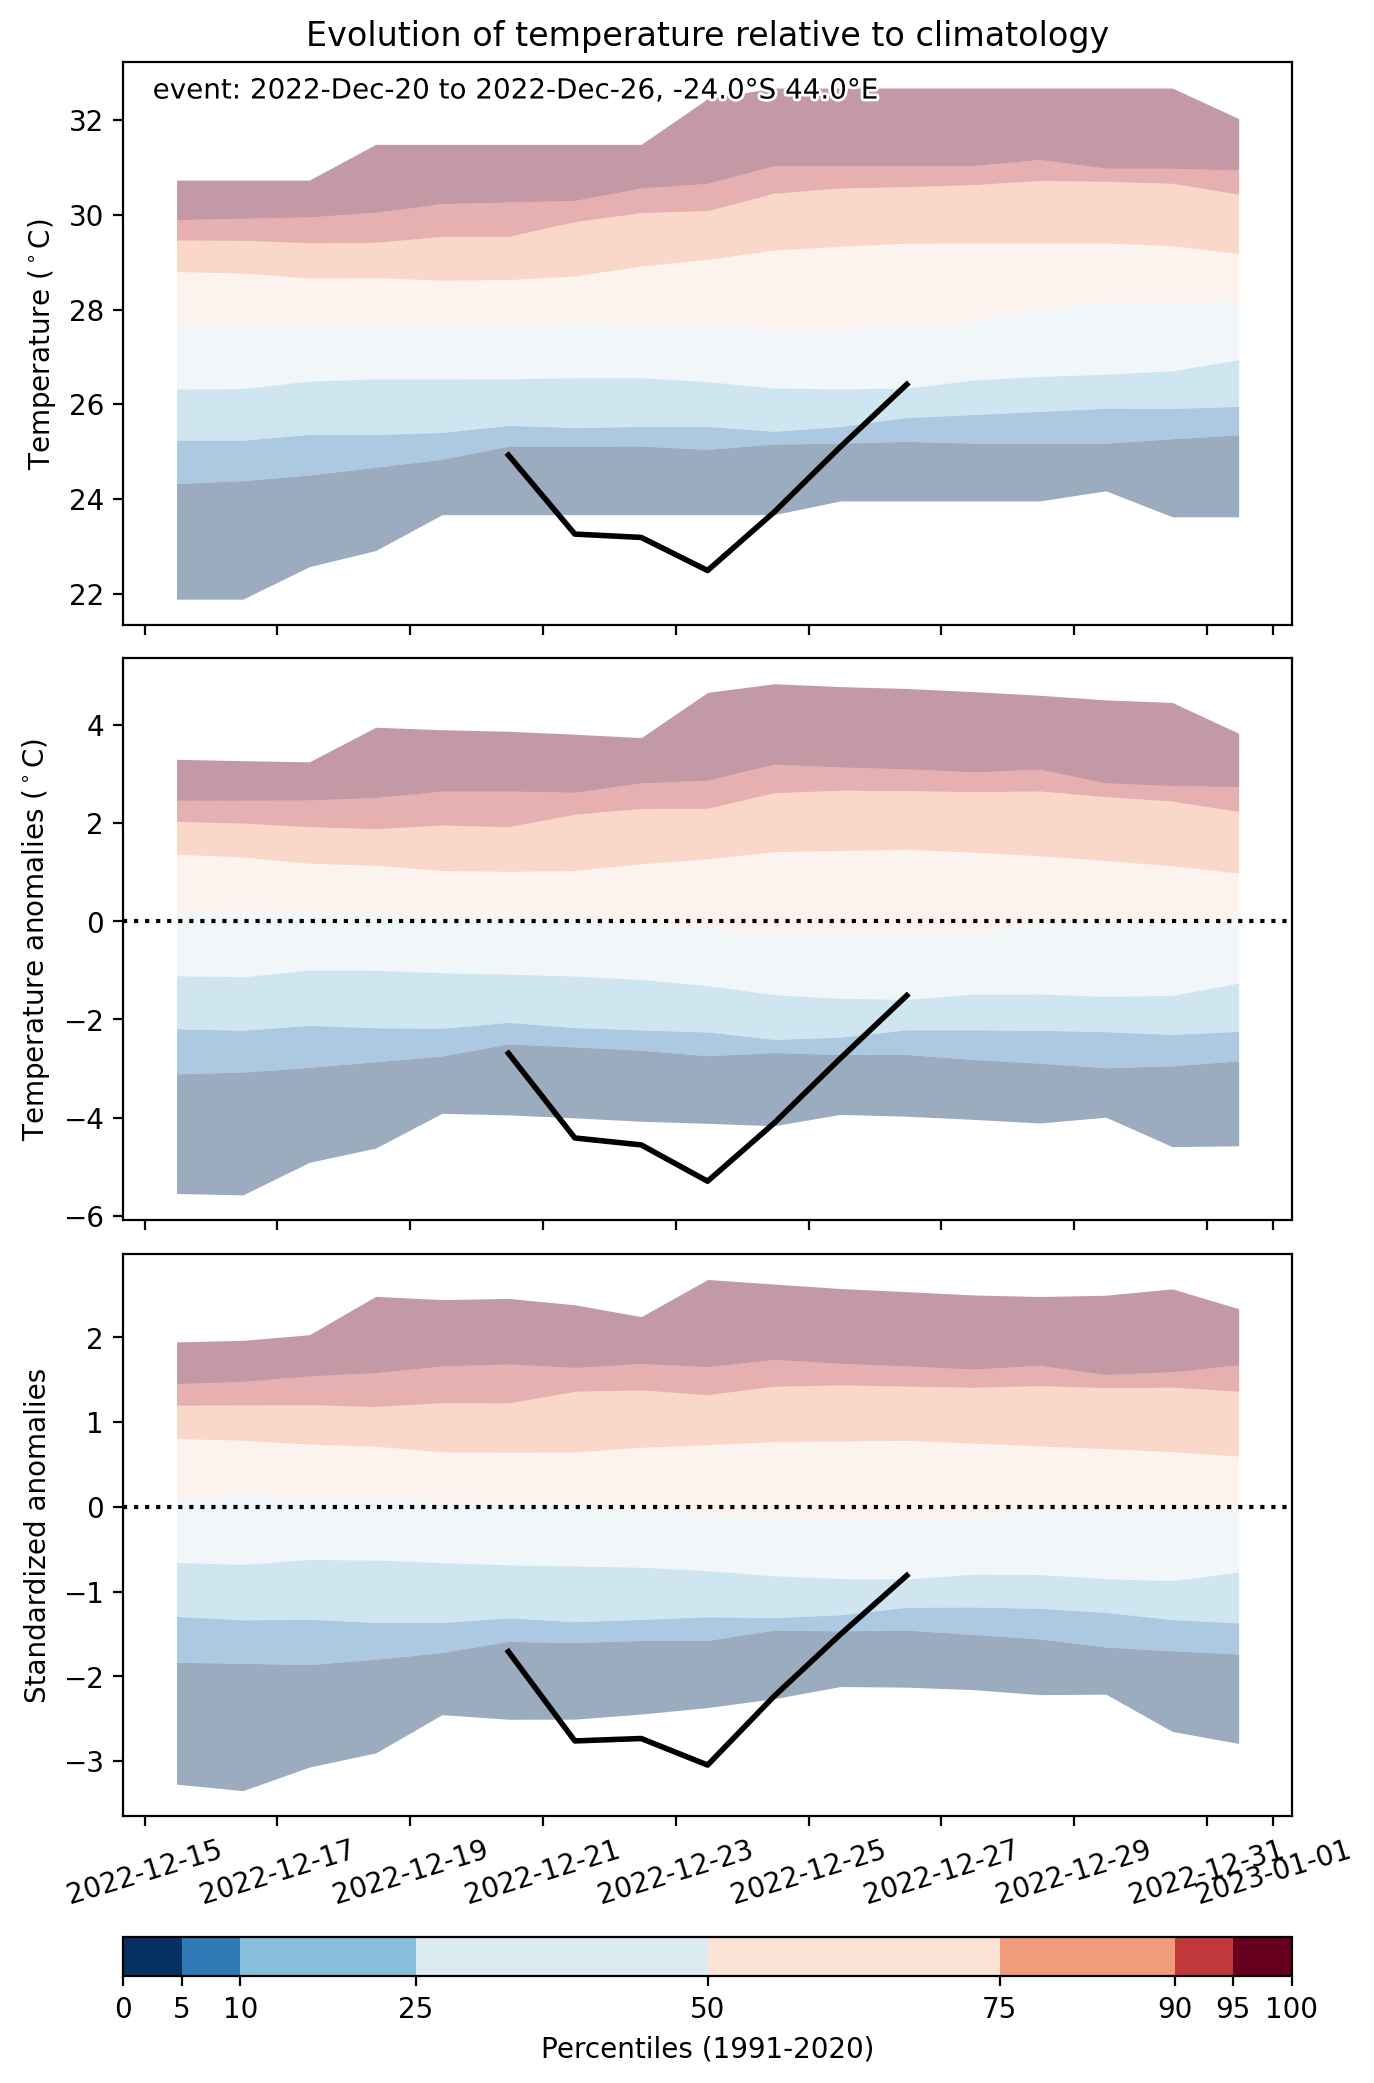
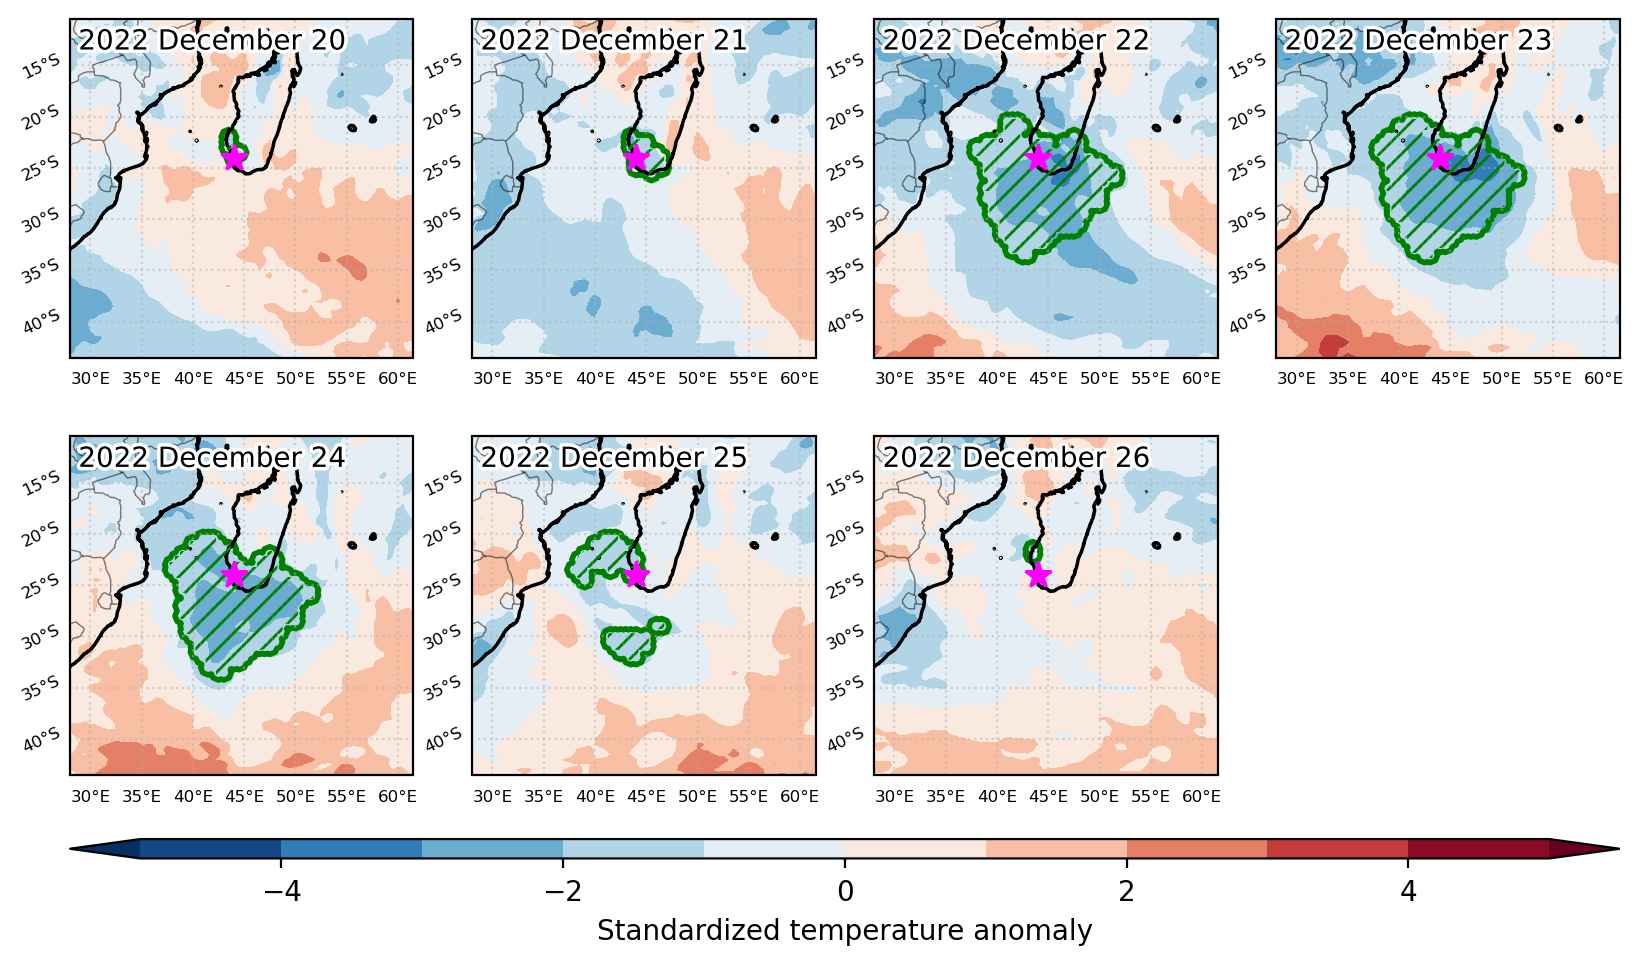
Cold spell occuring from December 20 2022 to December 26 2022 at -24.0°S 44.0°E

Download data: JSON

Event type: Cold spell

Countries affected (identified with ArcGIS Online; provided only for geographical reference):

  • Madagascar

Duration: 7 days

Time span: December 20 2022 to December 26 2022

Statistics over entire affected area:

  • Mean temperature anomaly: -2.5 °C
  • Mean temperature: 22.3 °C
  • Minimum temperature anomaly: -6.5 °C
  • Minimum temperature: 17.8 °C

Event center: -24.0°S 44.0°E

Area affected: 1196678 km$^2$


Fig. 1: Map of most extreme temperature anomalies (standardized) experienced during the event. The purple star indicates the center of the extreme event. Green hatching illustrates all areas under the effect of extremes at some time during the event.


Fig. 2: Evolution of temperature at the center of the event. The climatological percentile distribution is illustrated with color shadings.


Fig. 3: Maps illustrating the evolution of standardized temperature anomalies during the event.

Event ID: Cold_spell_2022-Dec-20_to_2022-Dec-26_44.0_-24.0