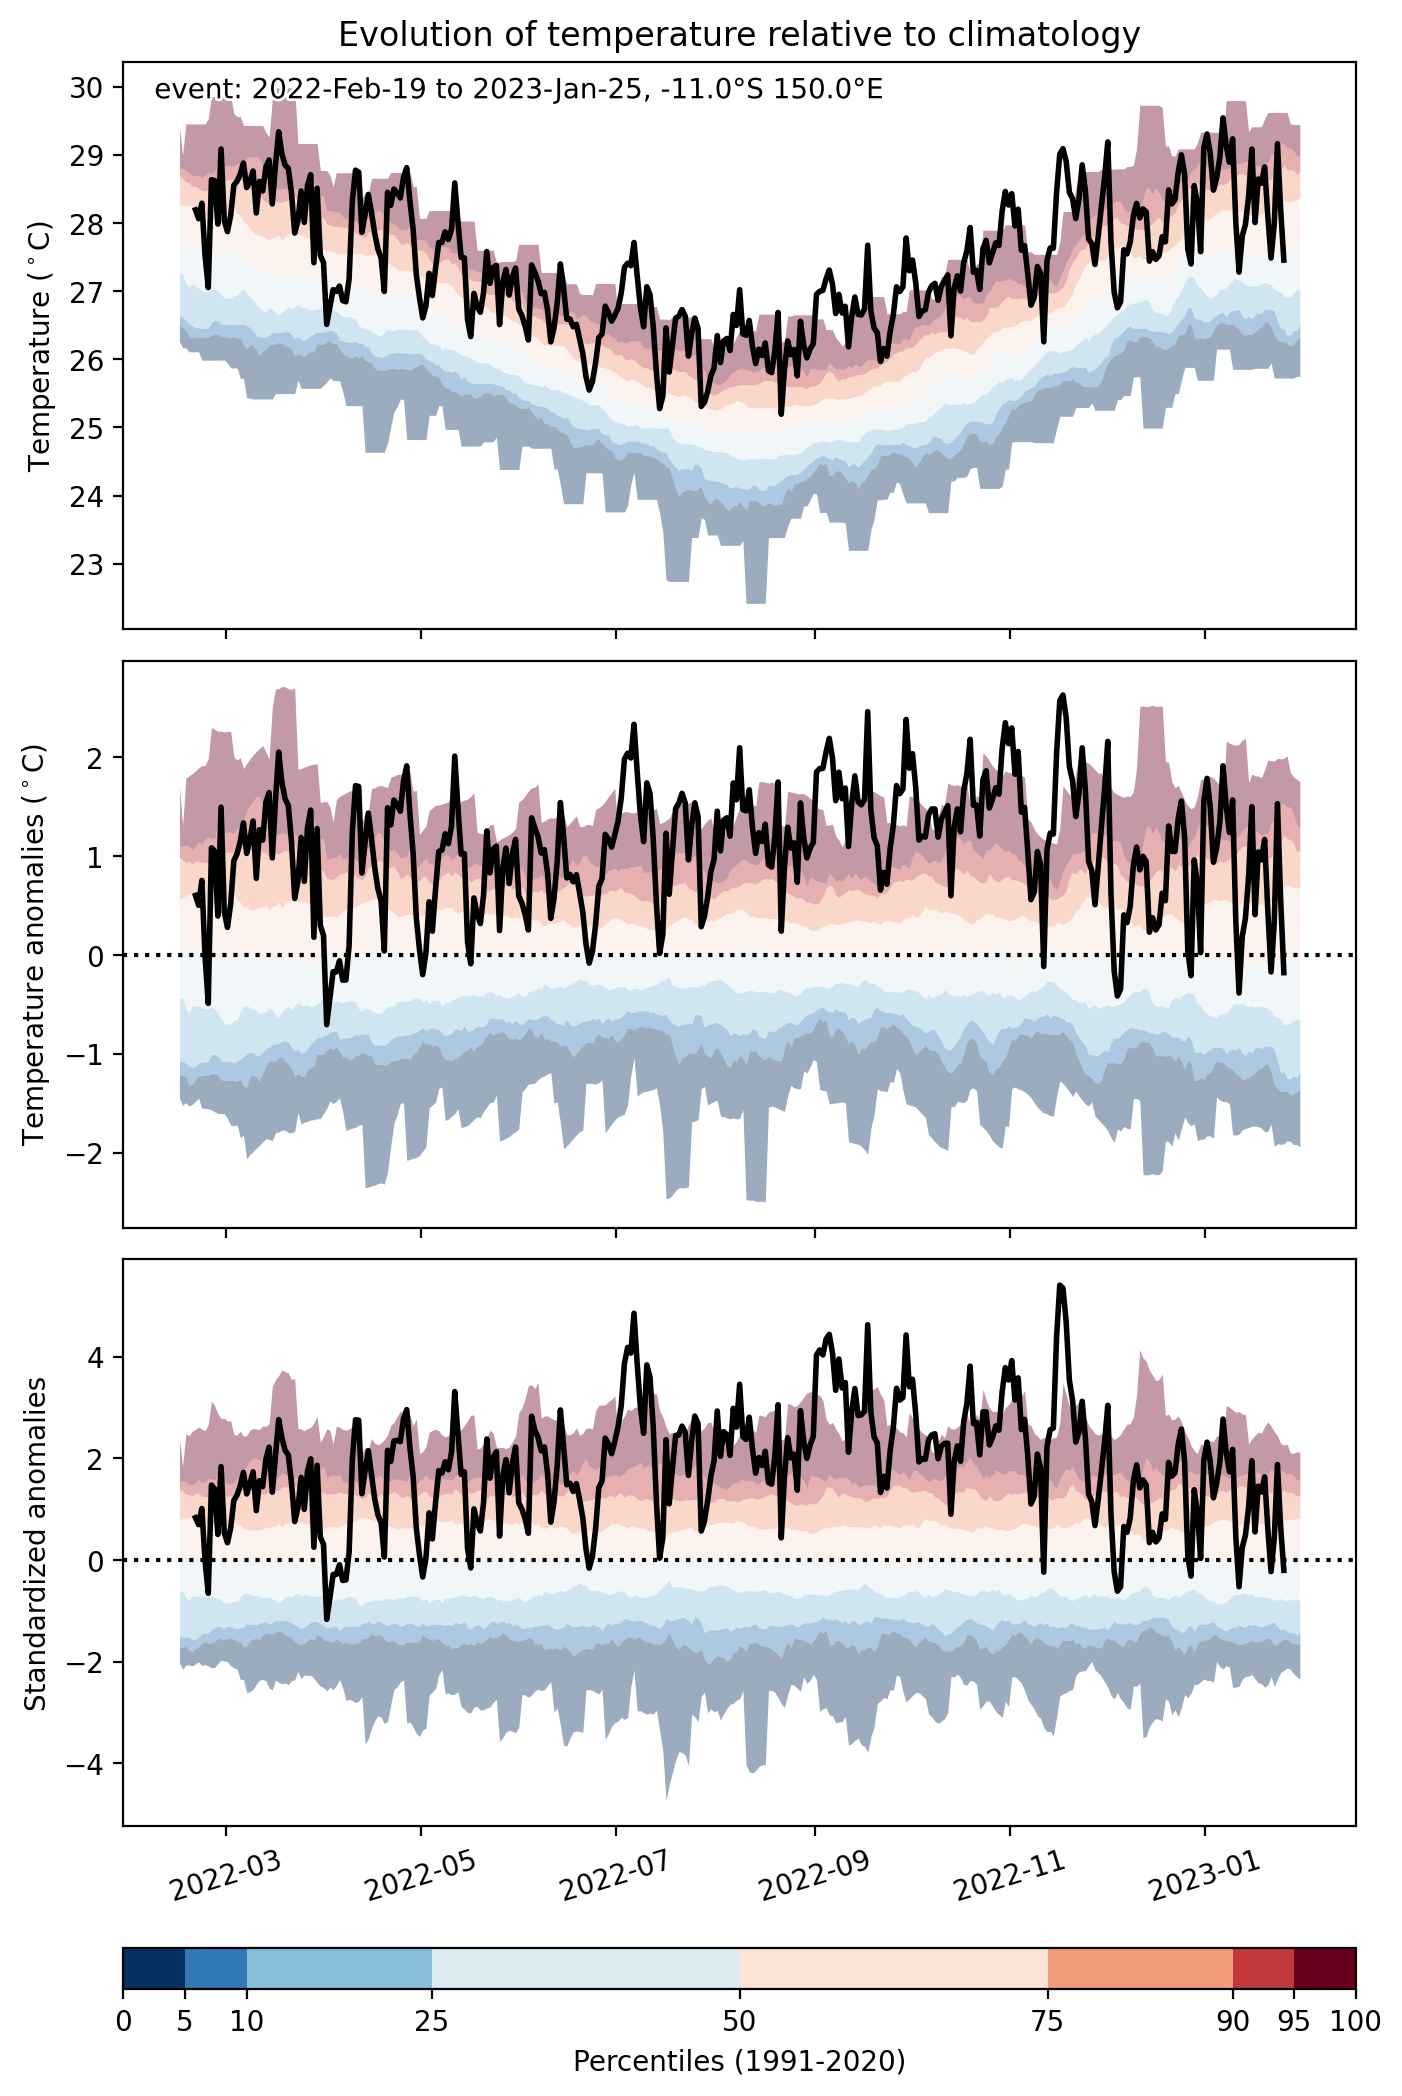
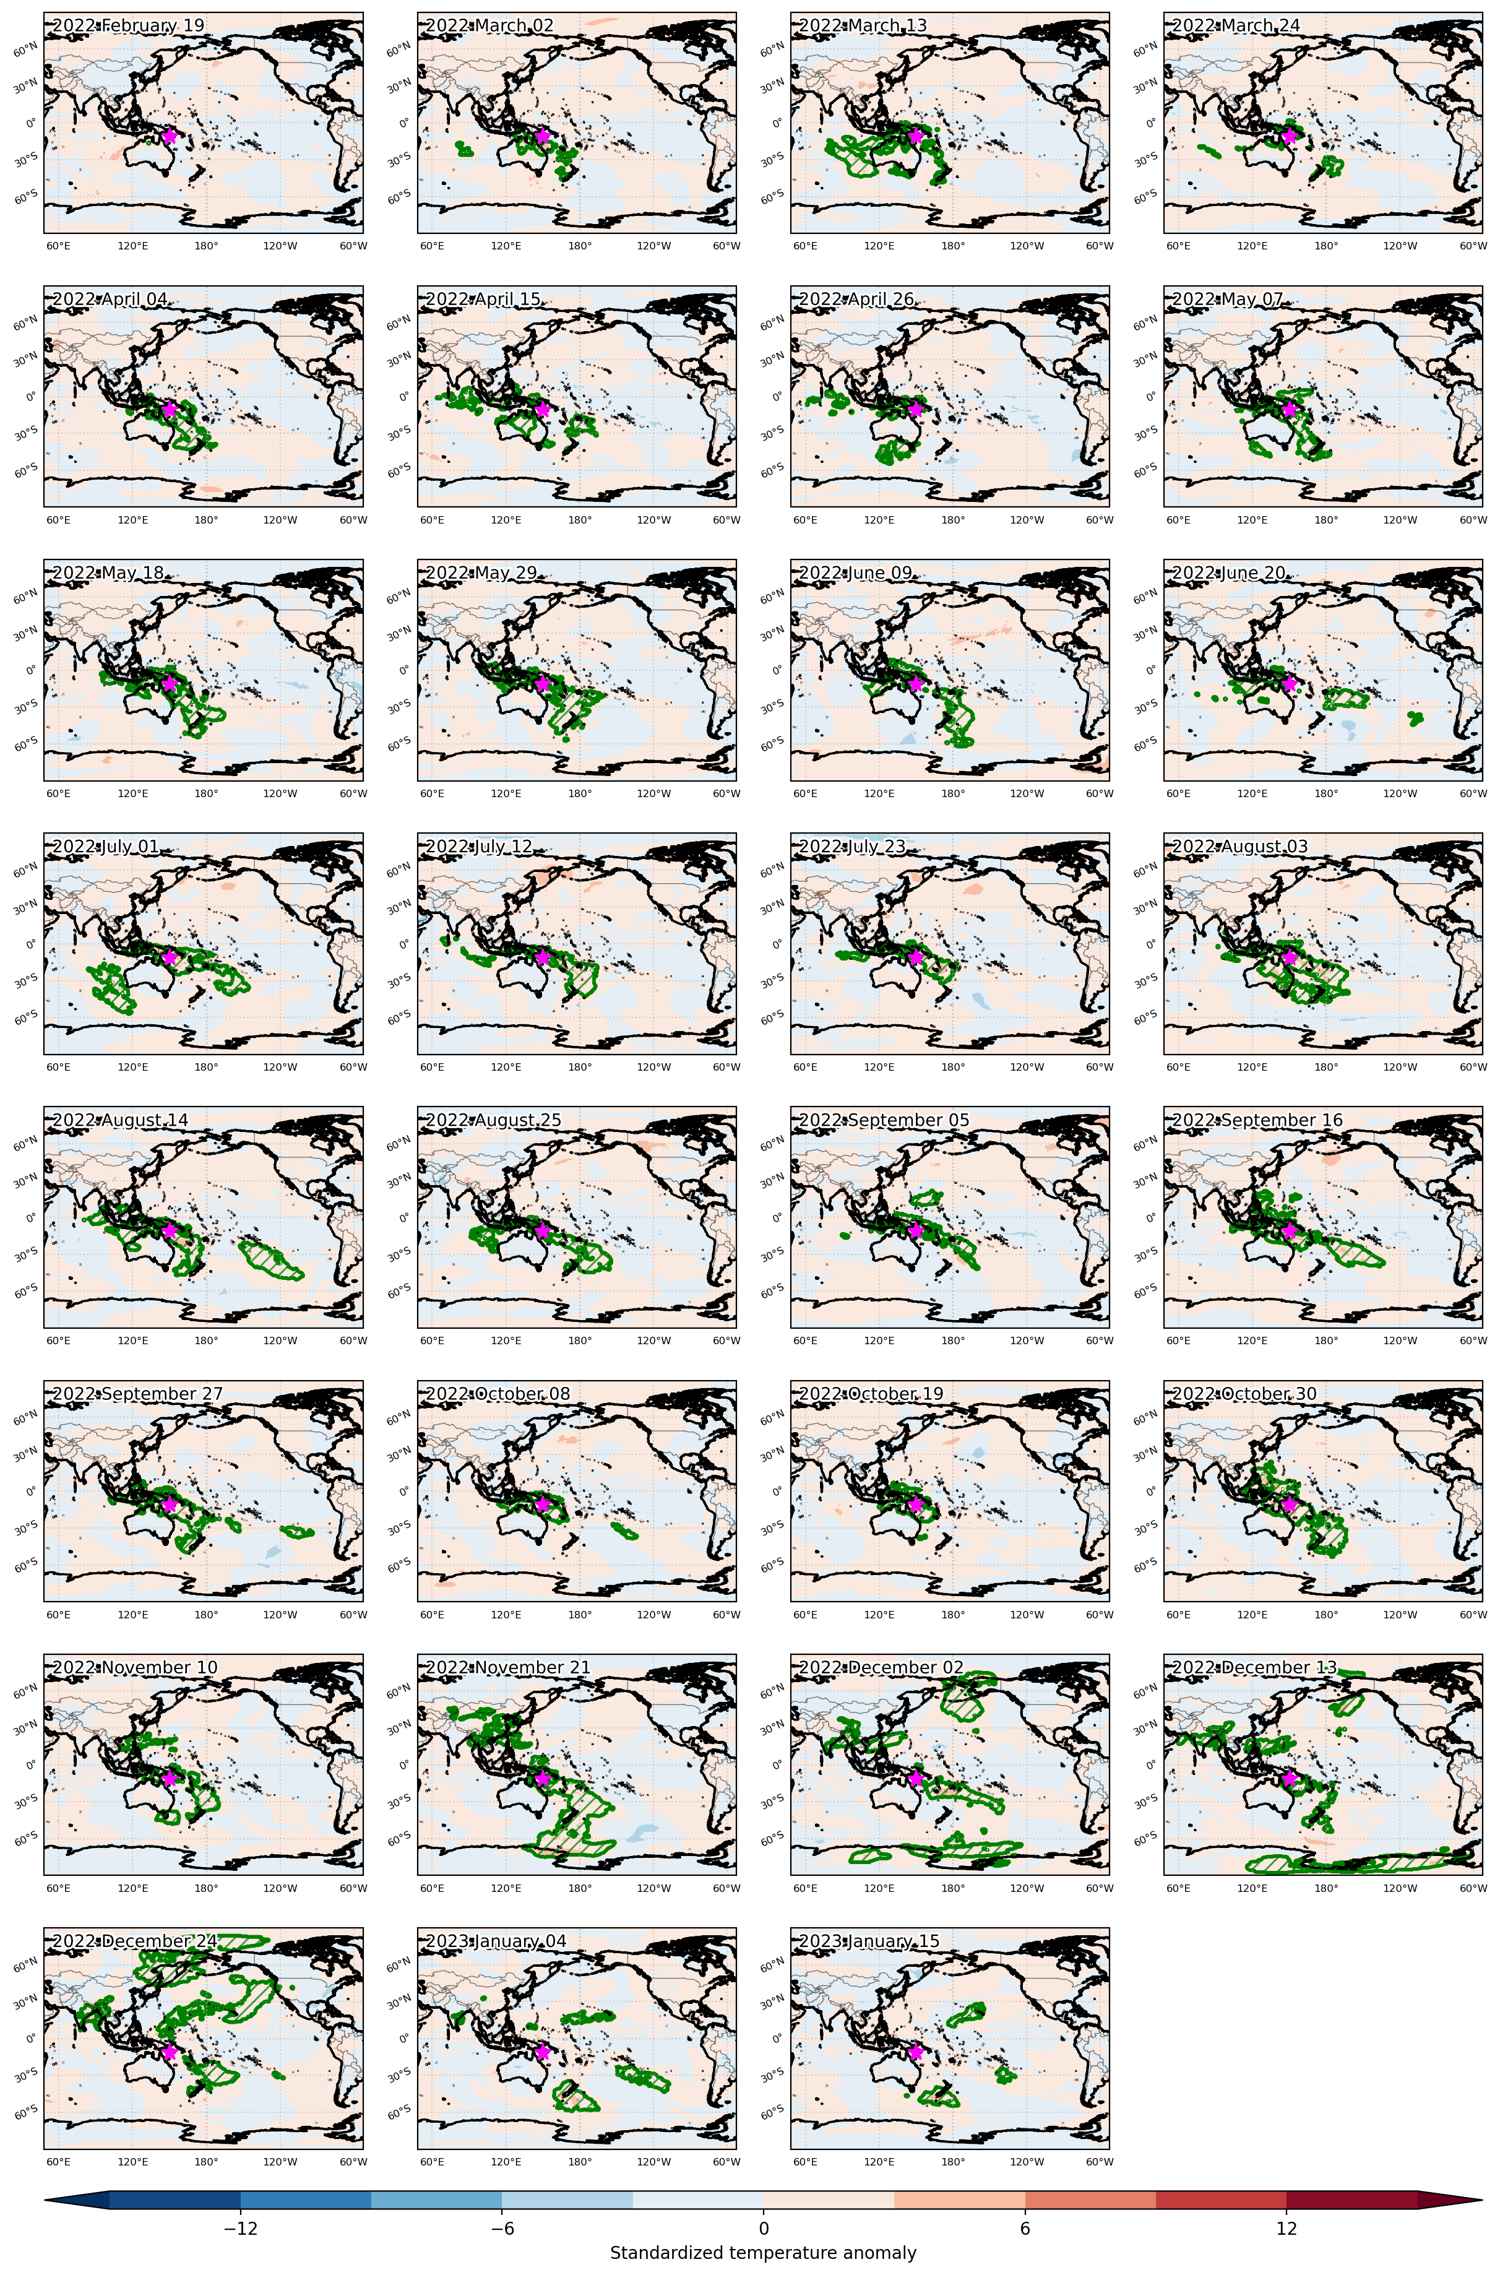
Heat wave occuring from June 25 2022 to July 11 2022 at 11.5°N 109.5°E

Download data: JSON

Event type: Heat wave

Countries affected (identified with ArcGIS Online; provided only for geographical reference):

  • Cambodia
  • Indonesia
  • Lao People’s Democratic Republic
  • Malaysia
  • Philippines
  • Thailand
  • Viet Nam

Duration: 17 days

Time span: June 25 2022 to July 11 2022

Statistics over entire affected area:

  • Mean temperature anomaly: 1.3 °C
  • Mean temperature: 28.8 °C
  • Maximum temperature anomaly: 3.3 °C
  • Maximum temperature: 32.8 °C

Event center: 11.5°N 109.5°E

Area affected: 2249700 km$^2$
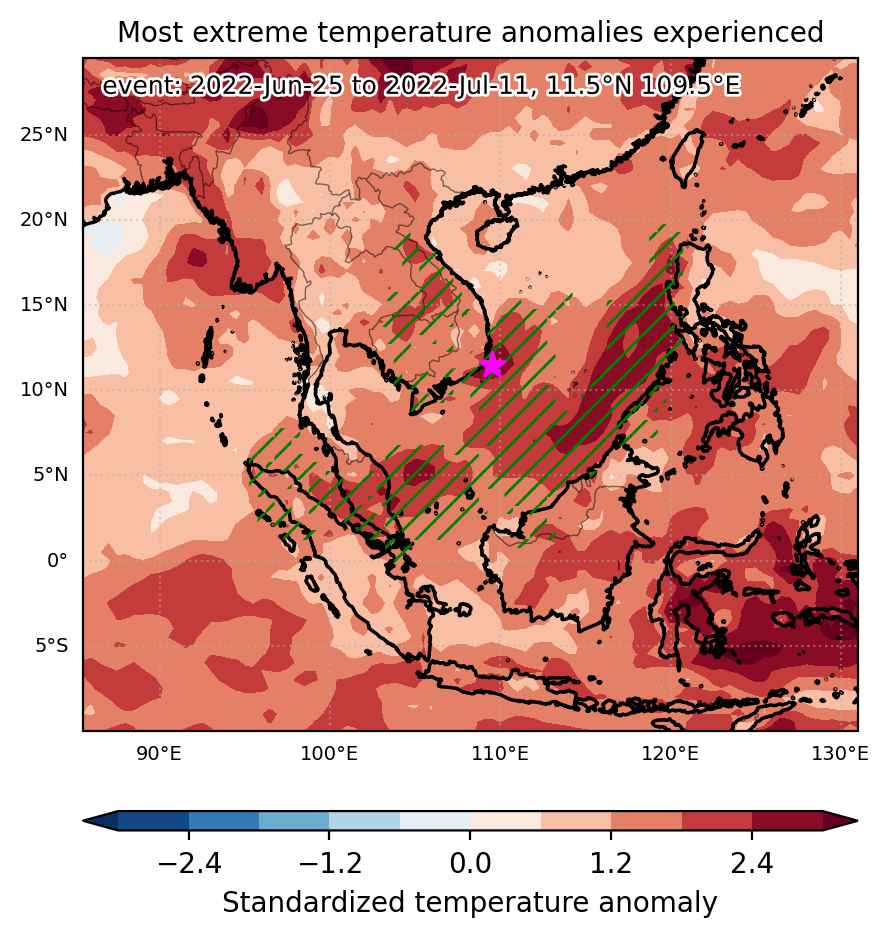

Fig. 1: Map of most extreme temperature anomalies (standardized) experienced during the event. The purple star indicates the center of the extreme event. Green hatching illustrates all areas under the effect of extremes at some time during the event.
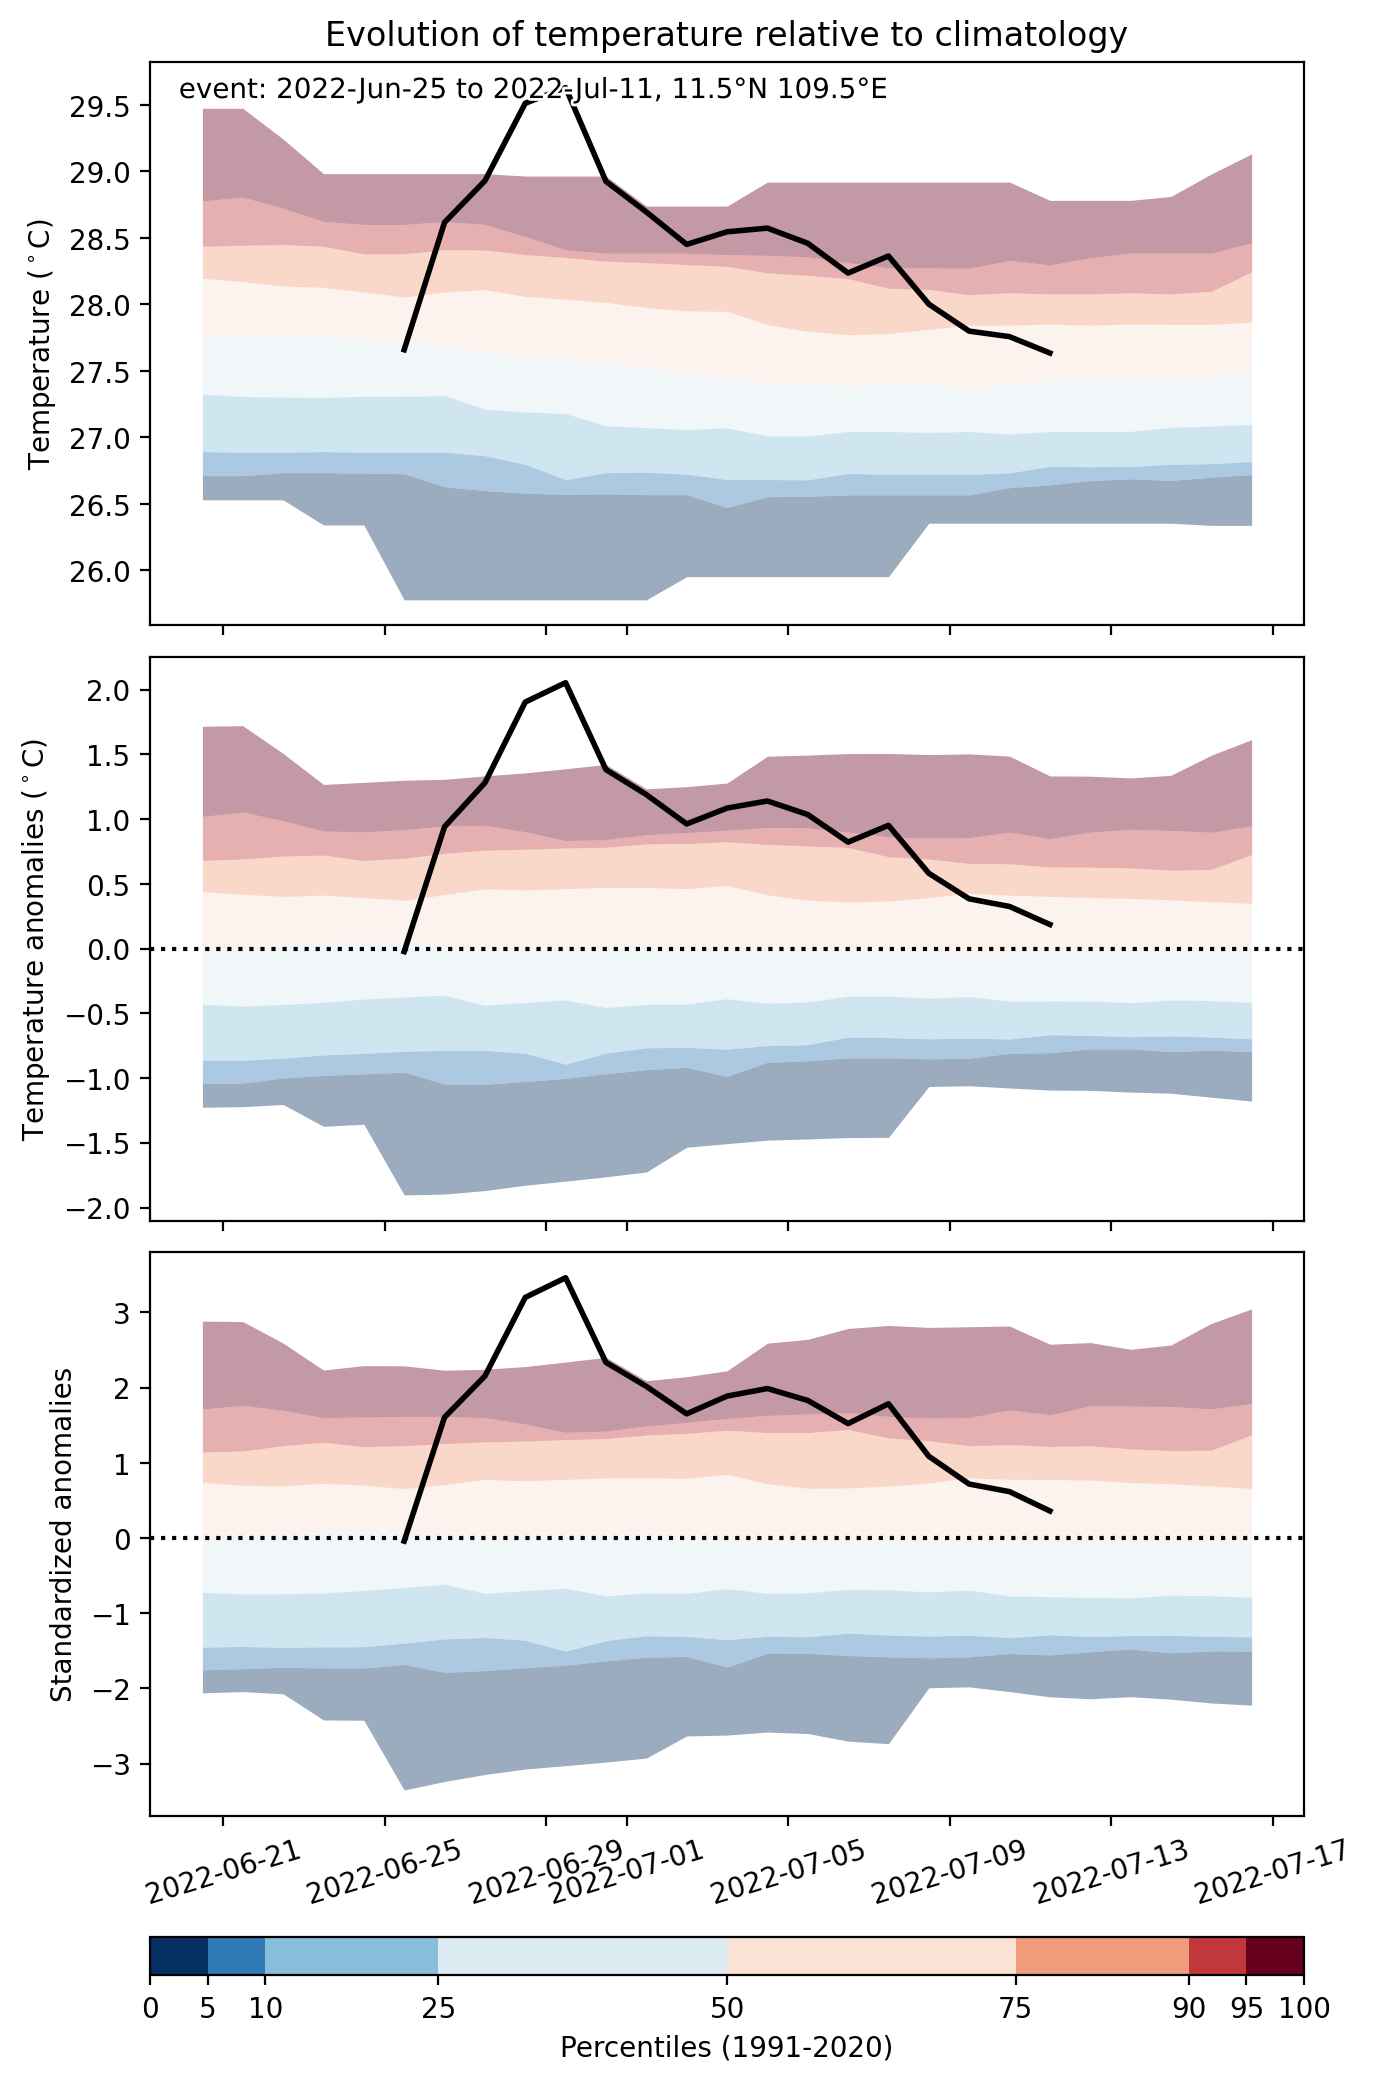


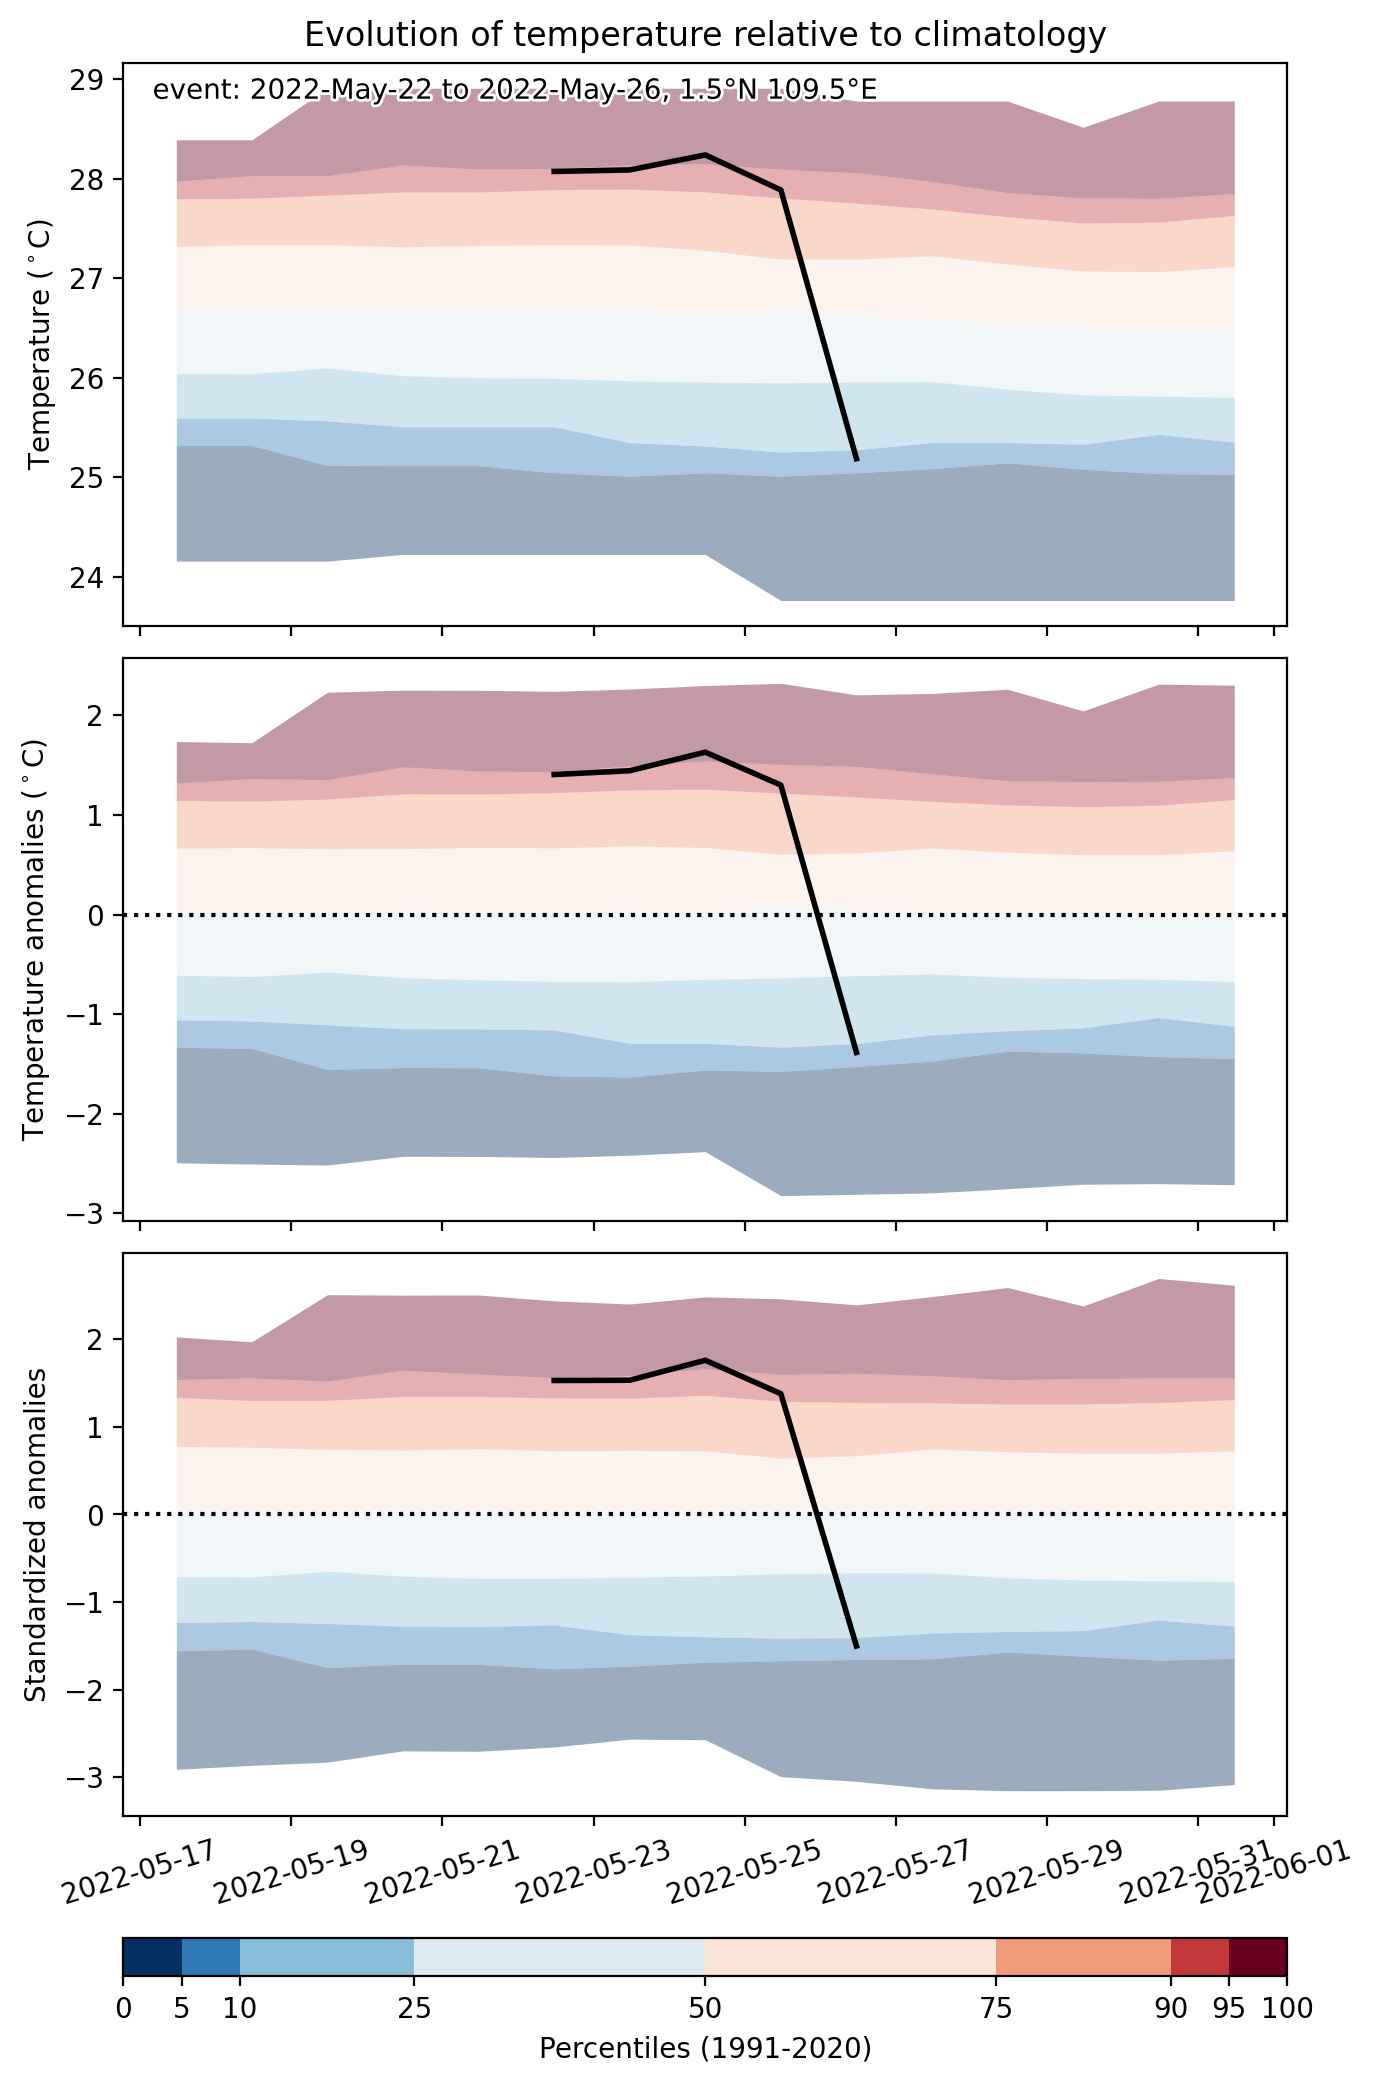
Fig. 2: Evolution of temperature at the center of the event. The climatological percentile distribution is illustrated with color shadings.
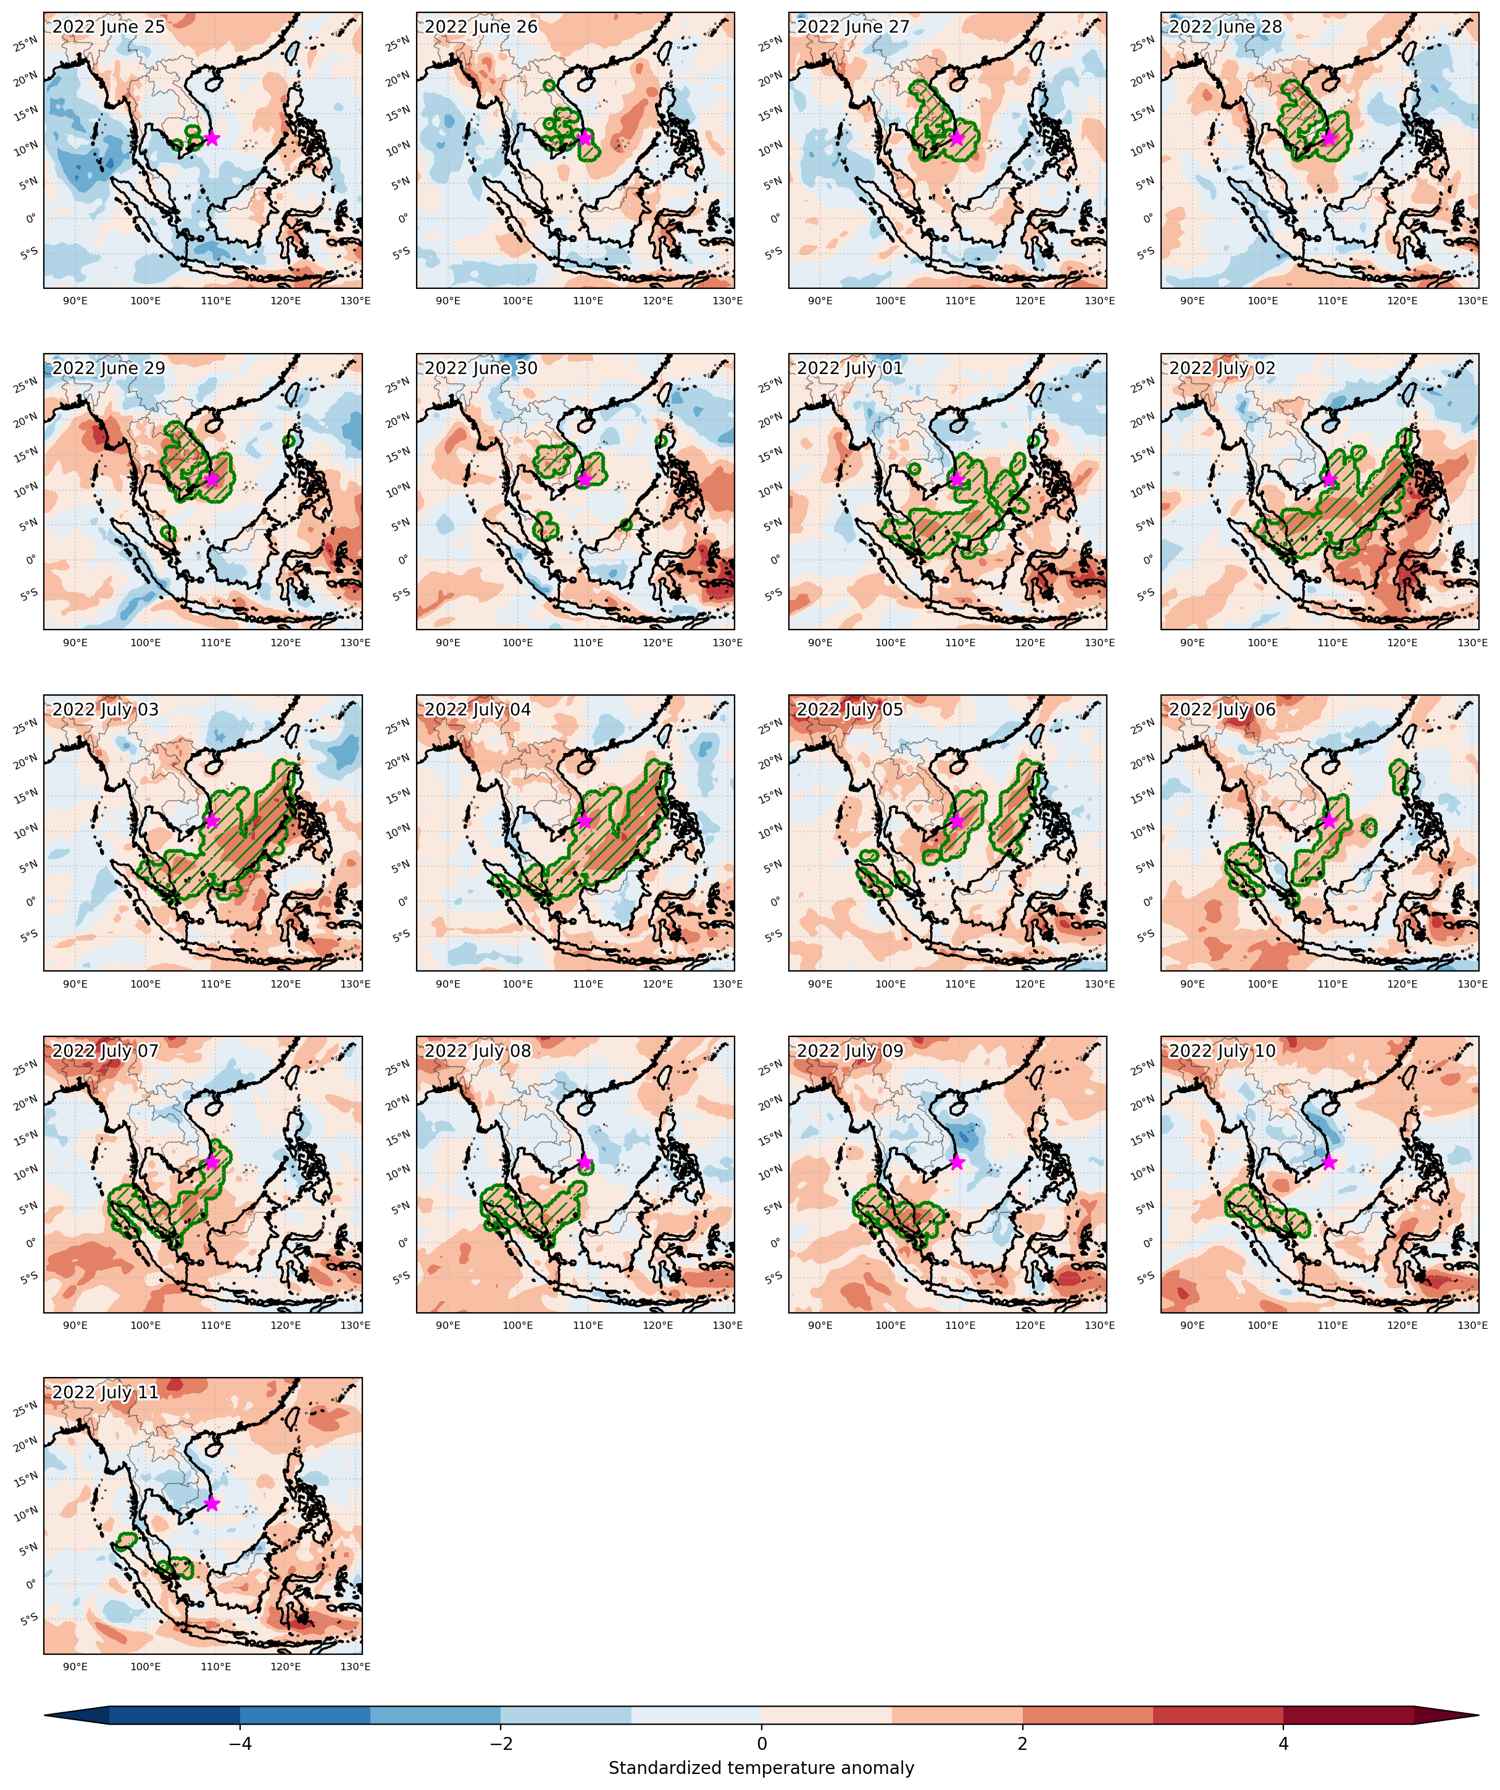


Fig. 3: Maps illustrating the evolution of standardized temperature anomalies during the event.

Event ID: Heat_wave_2022-Jun-25_to_2022-Jul-11_109.5_11.5
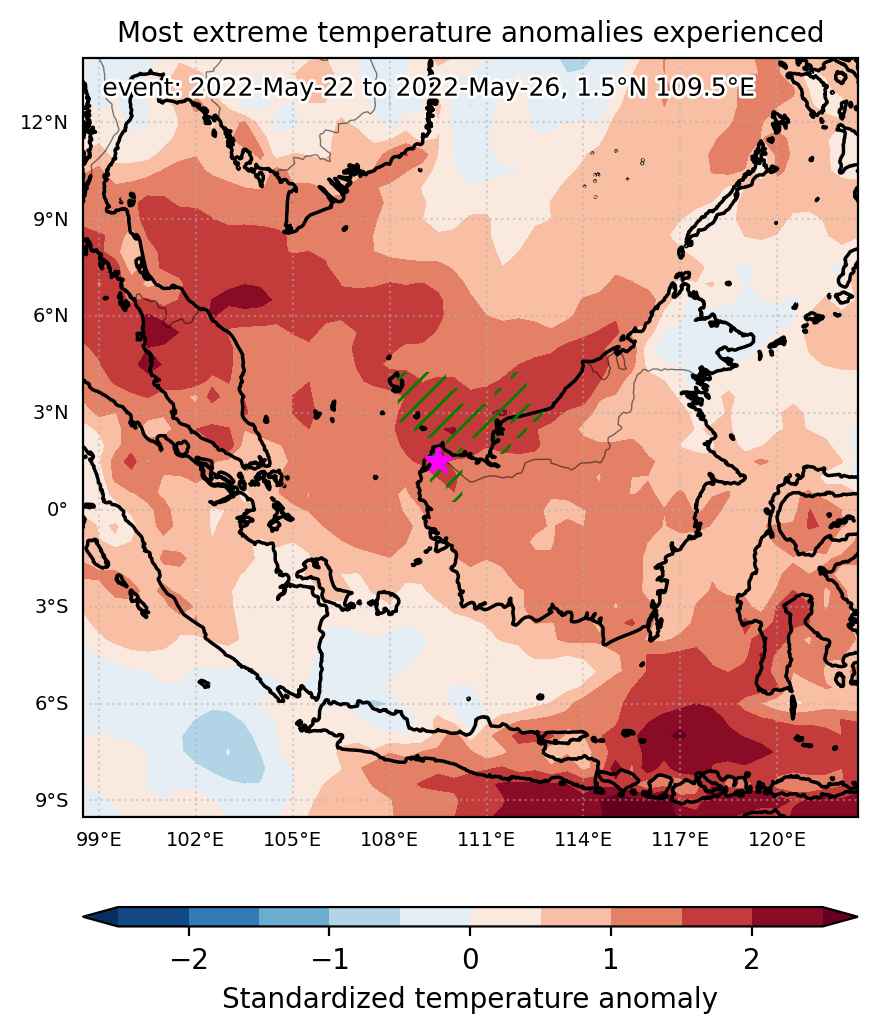
Heat wave occuring from May 22 2022 to May 26 2022 at 1.5°N 109.5°E

Download data: JSON

Event type: Heat wave

Countries affected (identified with ArcGIS Online; provided only for geographical reference):

  • Indonesia
  • Malaysia

Duration: 5 days

Time span: May 22 2022 to May 26 2022

Statistics over entire affected area:

  • Mean temperature anomaly: 1.3 °C
  • Mean temperature: 29.0 °C
  • Maximum temperature anomaly: 2.1 °C
  • Maximum temperature: 29.8 °C

Event center: 1.5°N 109.5°E

Area affected: 95697 km$^2$


Fig. 1: Map of most extreme temperature anomalies (standardized) experienced during the event. The purple star indicates the center of the extreme event. Green hatching illustrates all areas under the effect of extremes at some time during the event.


Fig. 2: Evolution of temperature at the center of the event. The climatological percentile distribution is illustrated with color shadings.


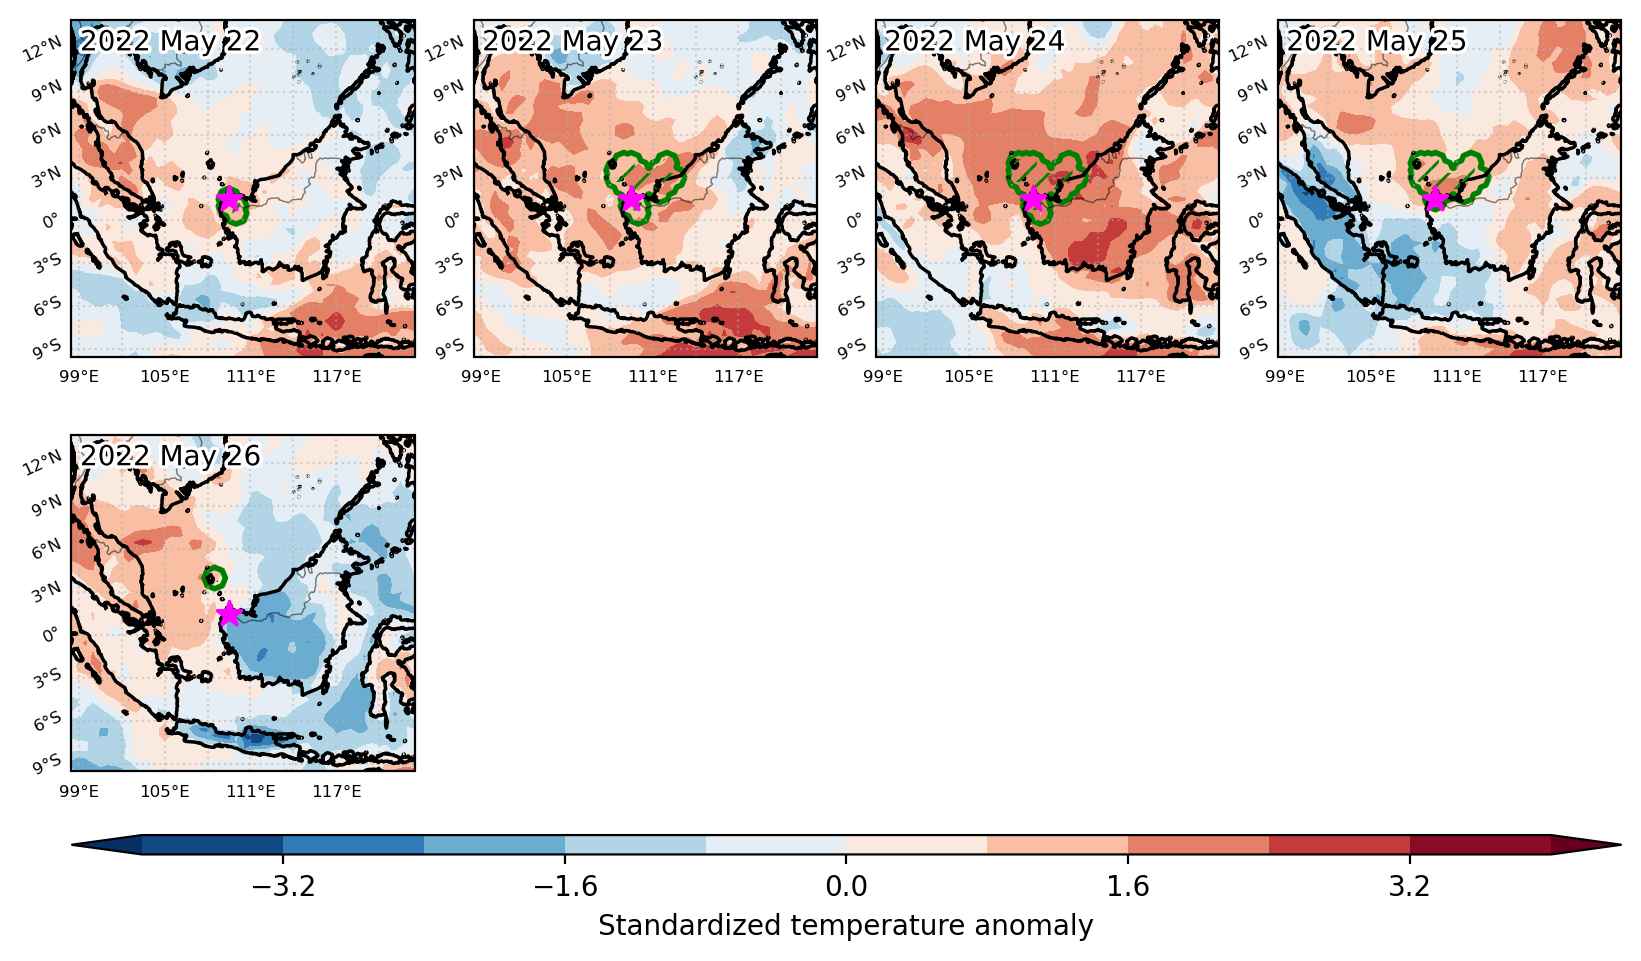
Fig. 3: Maps illustrating the evolution of standardized temperature anomalies during the event.

Event ID: Heat_wave_2022-May-22_to_2022-May-26_109.5_1.5

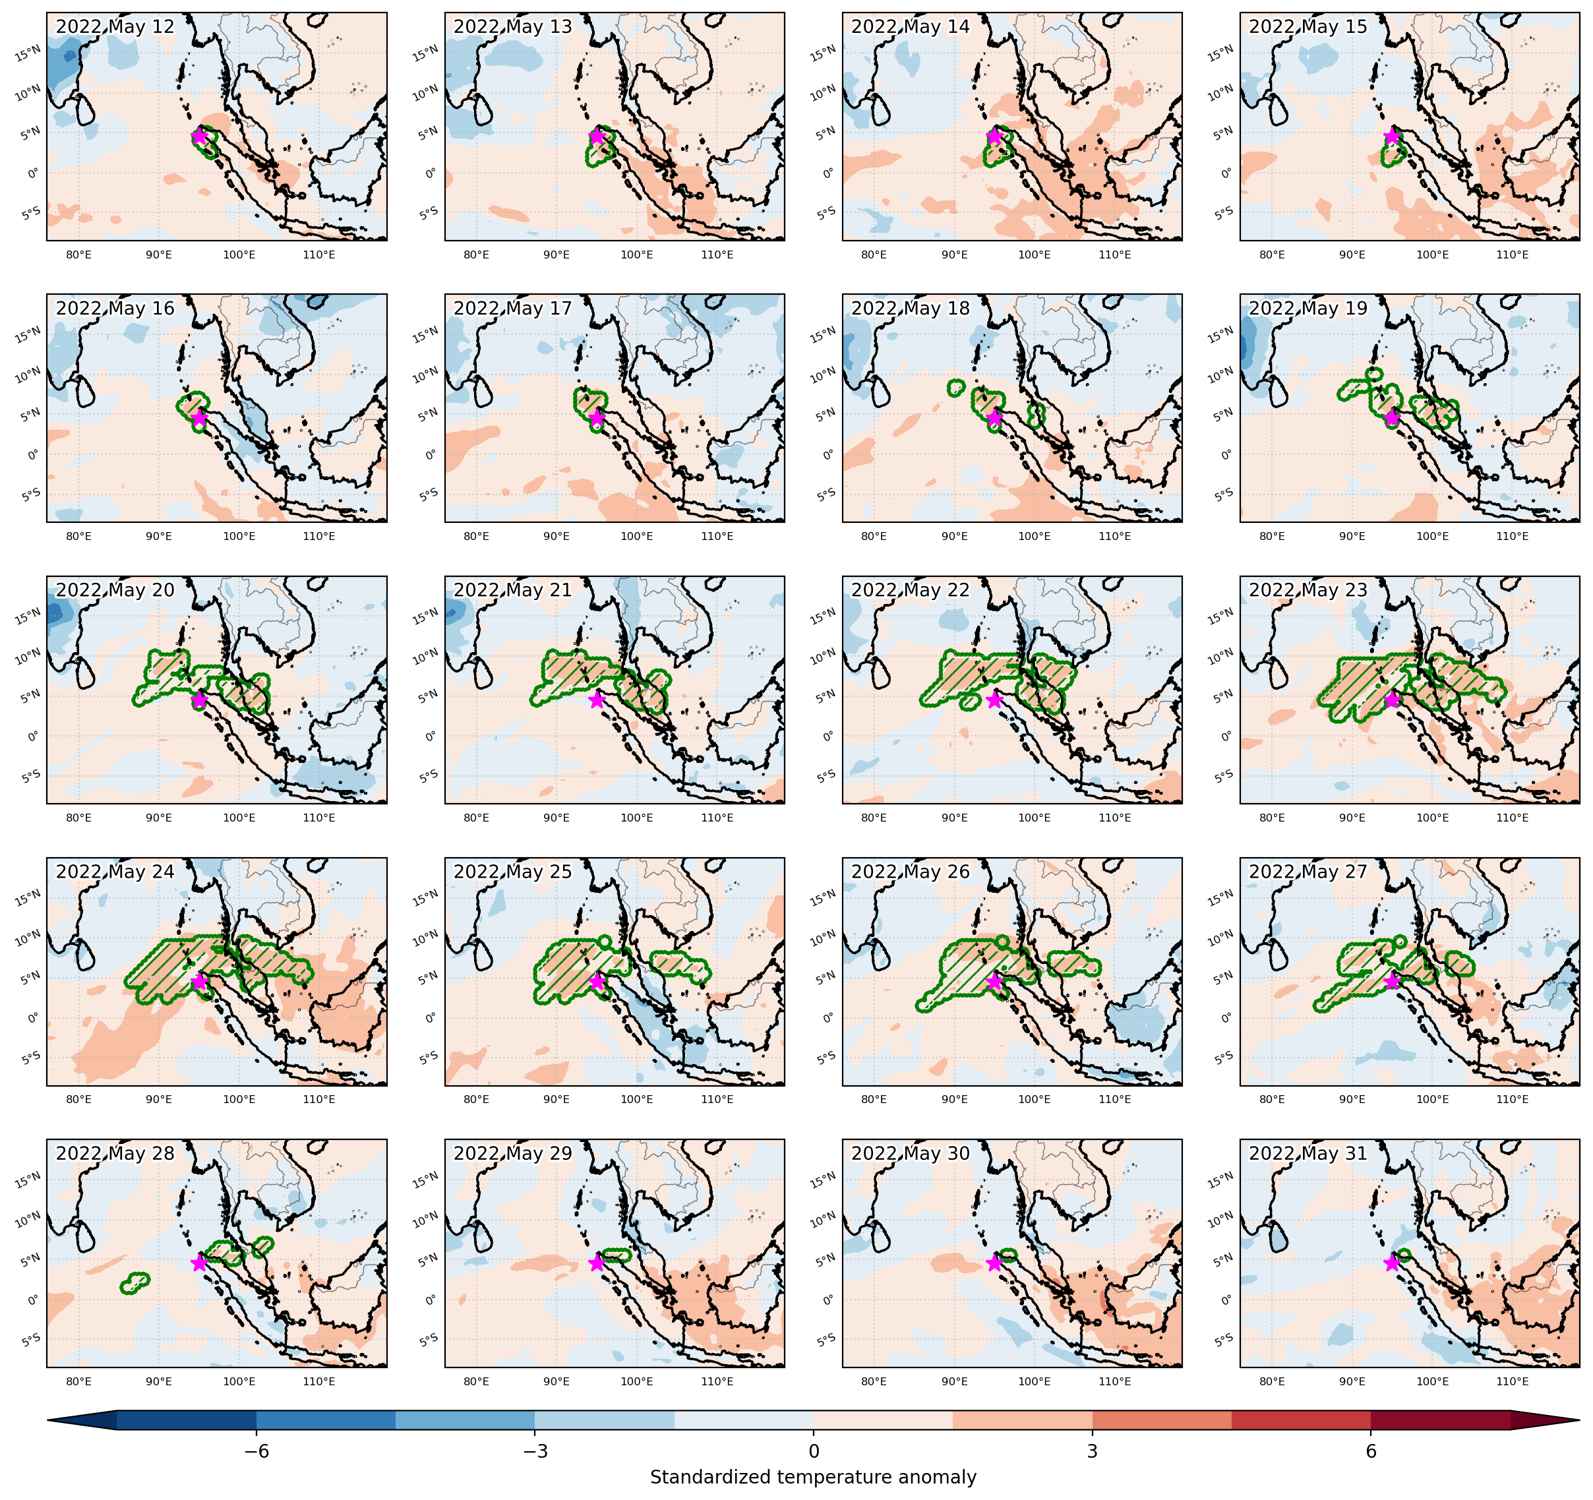
Heat wave occuring from May 12 2022 to May 31 2022 at 4.5°N 95.0°E

Download data: JSON

Event type: Heat wave

Countries affected (identified with ArcGIS Online; provided only for geographical reference):

  • India
  • Indonesia
  • Malaysia

Duration: 20 days

Time span: May 12 2022 to May 31 2022

Statistics over entire affected area:

  • Mean temperature anomaly: 1.1 °C
  • Mean temperature: 29.0 °C
  • Maximum temperature anomaly: 2.5 °C
  • Maximum temperature: 31.0 °C

Event center: 4.5°N 95.0°E

Area affected: 1081033 km$^2$


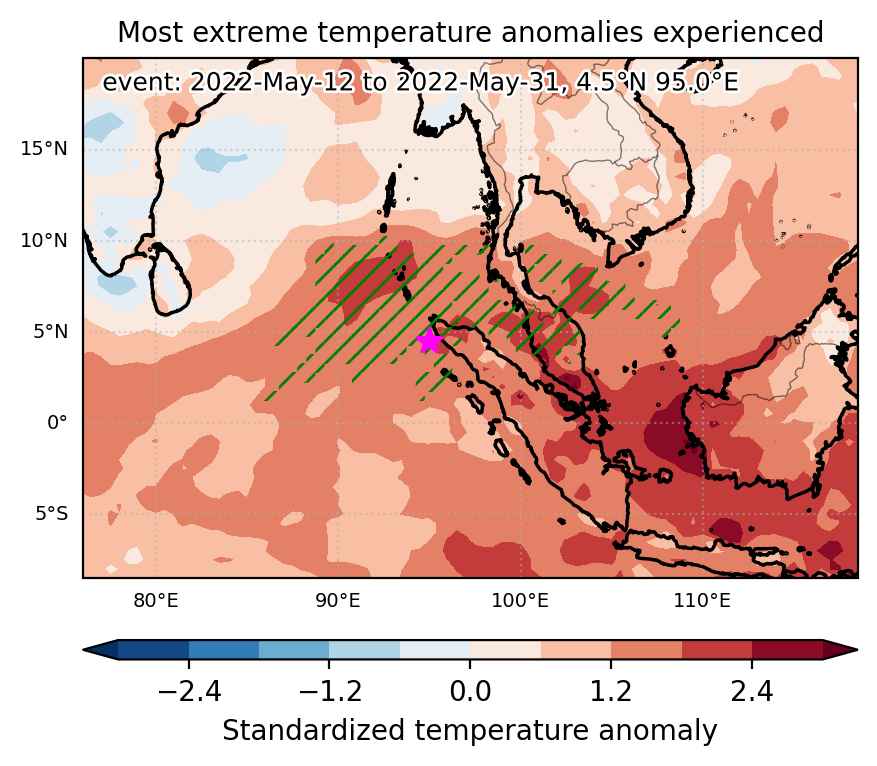
Fig. 1: Map of most extreme temperature anomalies (standardized) experienced during the event. The purple star indicates the center of the extreme event. Green hatching illustrates all areas under the effect of extremes at some time during the event.


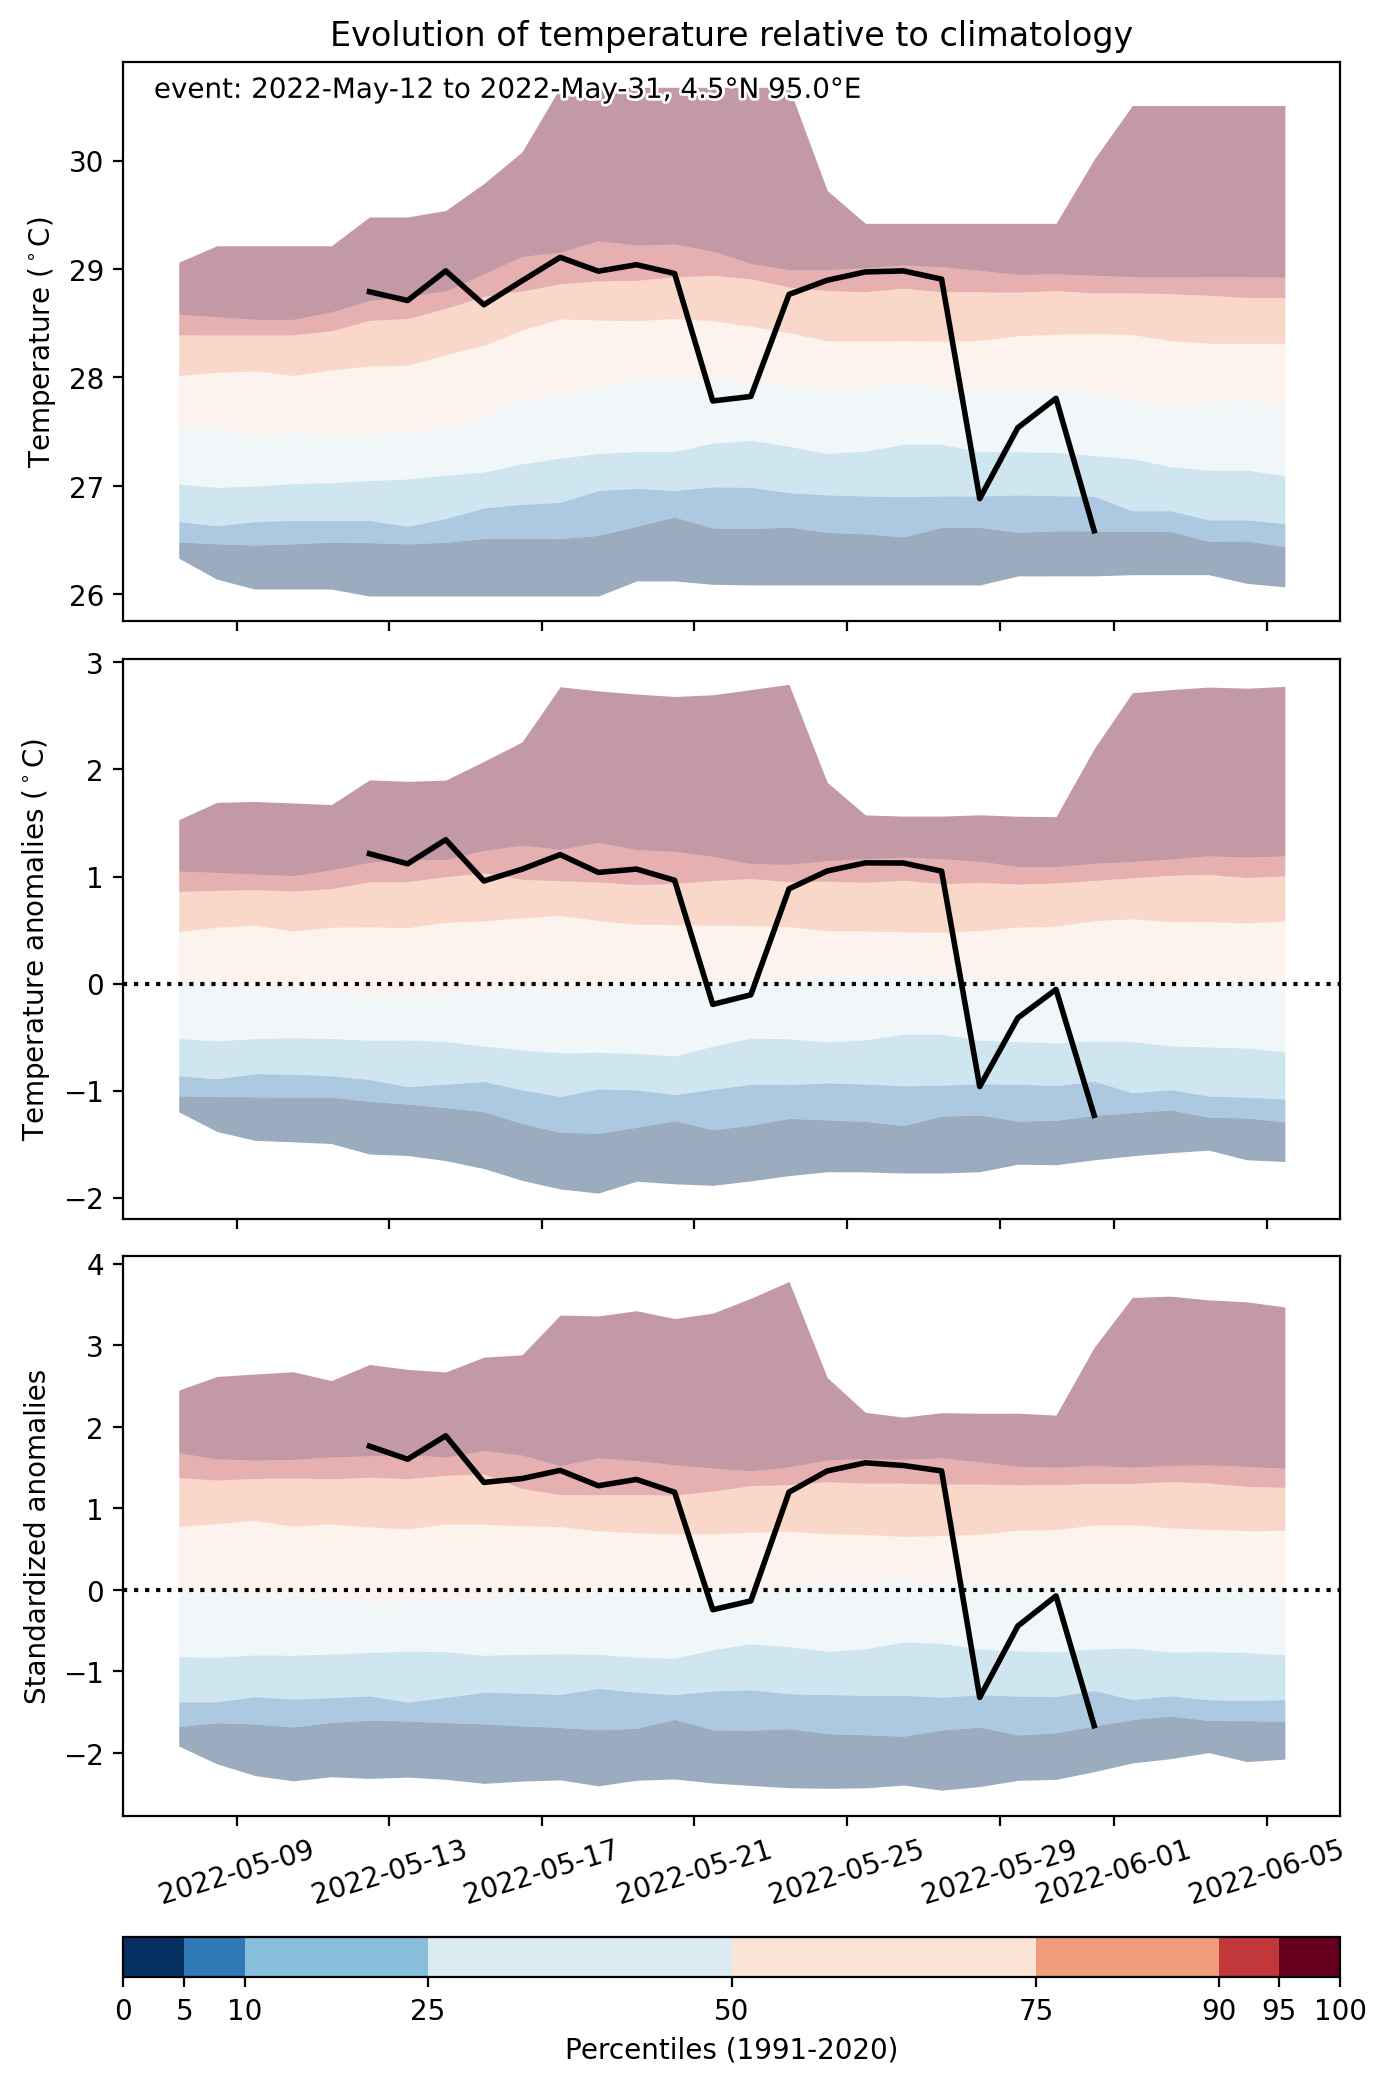
Fig. 2: Evolution of temperature at the center of the event. The climatological percentile distribution is illustrated with color shadings.


Fig. 3: Maps illustrating the evolution of standardized temperature anomalies during the event.

Event ID: Heat_wave_2022-May-12_to_2022-May-31_95.0_4.5

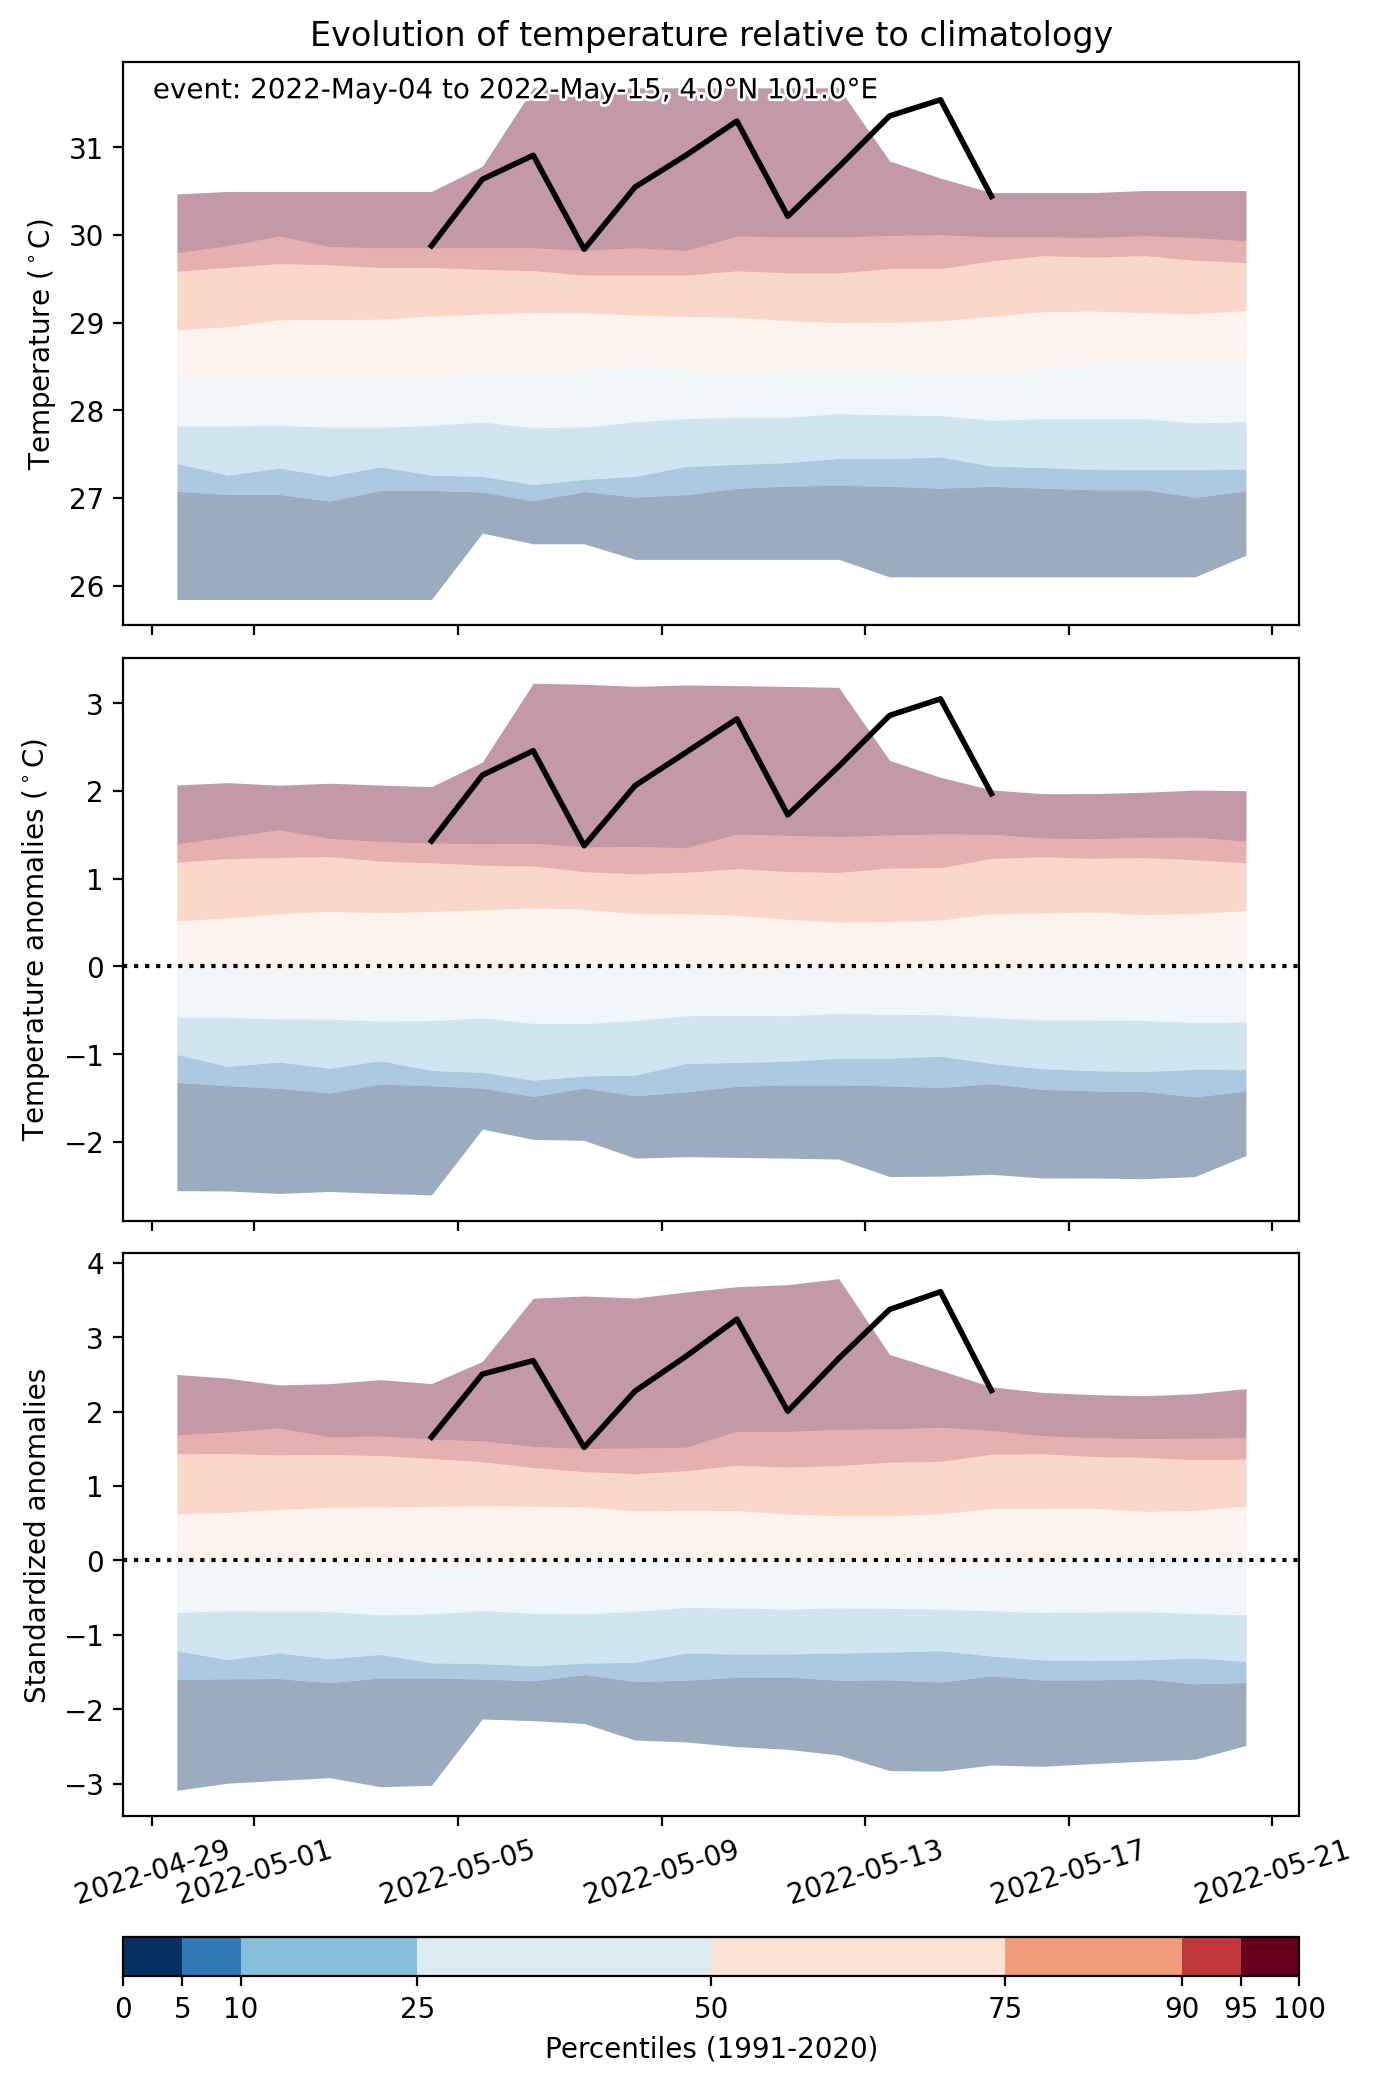
Heat wave occuring from May 04 2022 to May 15 2022 at 4.0°N 101.0°E

Download data: JSON

Event type: Heat wave

Countries affected (identified with ArcGIS Online; provided only for geographical reference):

  • Indonesia
  • Malaysia

Duration: 12 days

Time span: May 04 2022 to May 15 2022

Statistics over entire affected area:

  • Mean temperature anomaly: 1.3 °C
  • Mean temperature: 29.1 °C
  • Maximum temperature anomaly: 3.1 °C
  • Maximum temperature: 31.5 °C

Event center: 4.0°N 101.0°E

Area affected: 438608 km$^2$


Fig. 1: Map of most extreme temperature anomalies (standardized) experienced during the event. The purple star indicates the center of the extreme event. Green hatching illustrates all areas under the effect of extremes at some time during the event.


Fig. 2: Evolution of temperature at the center of the event. The climatological percentile distribution is illustrated with color shadings.


Fig. 3: Maps illustrating the evolution of standardized temperature anomalies during the event.

Event ID: Heat_wave_2022-May-04_to_2022-May-15_101.0_4.0

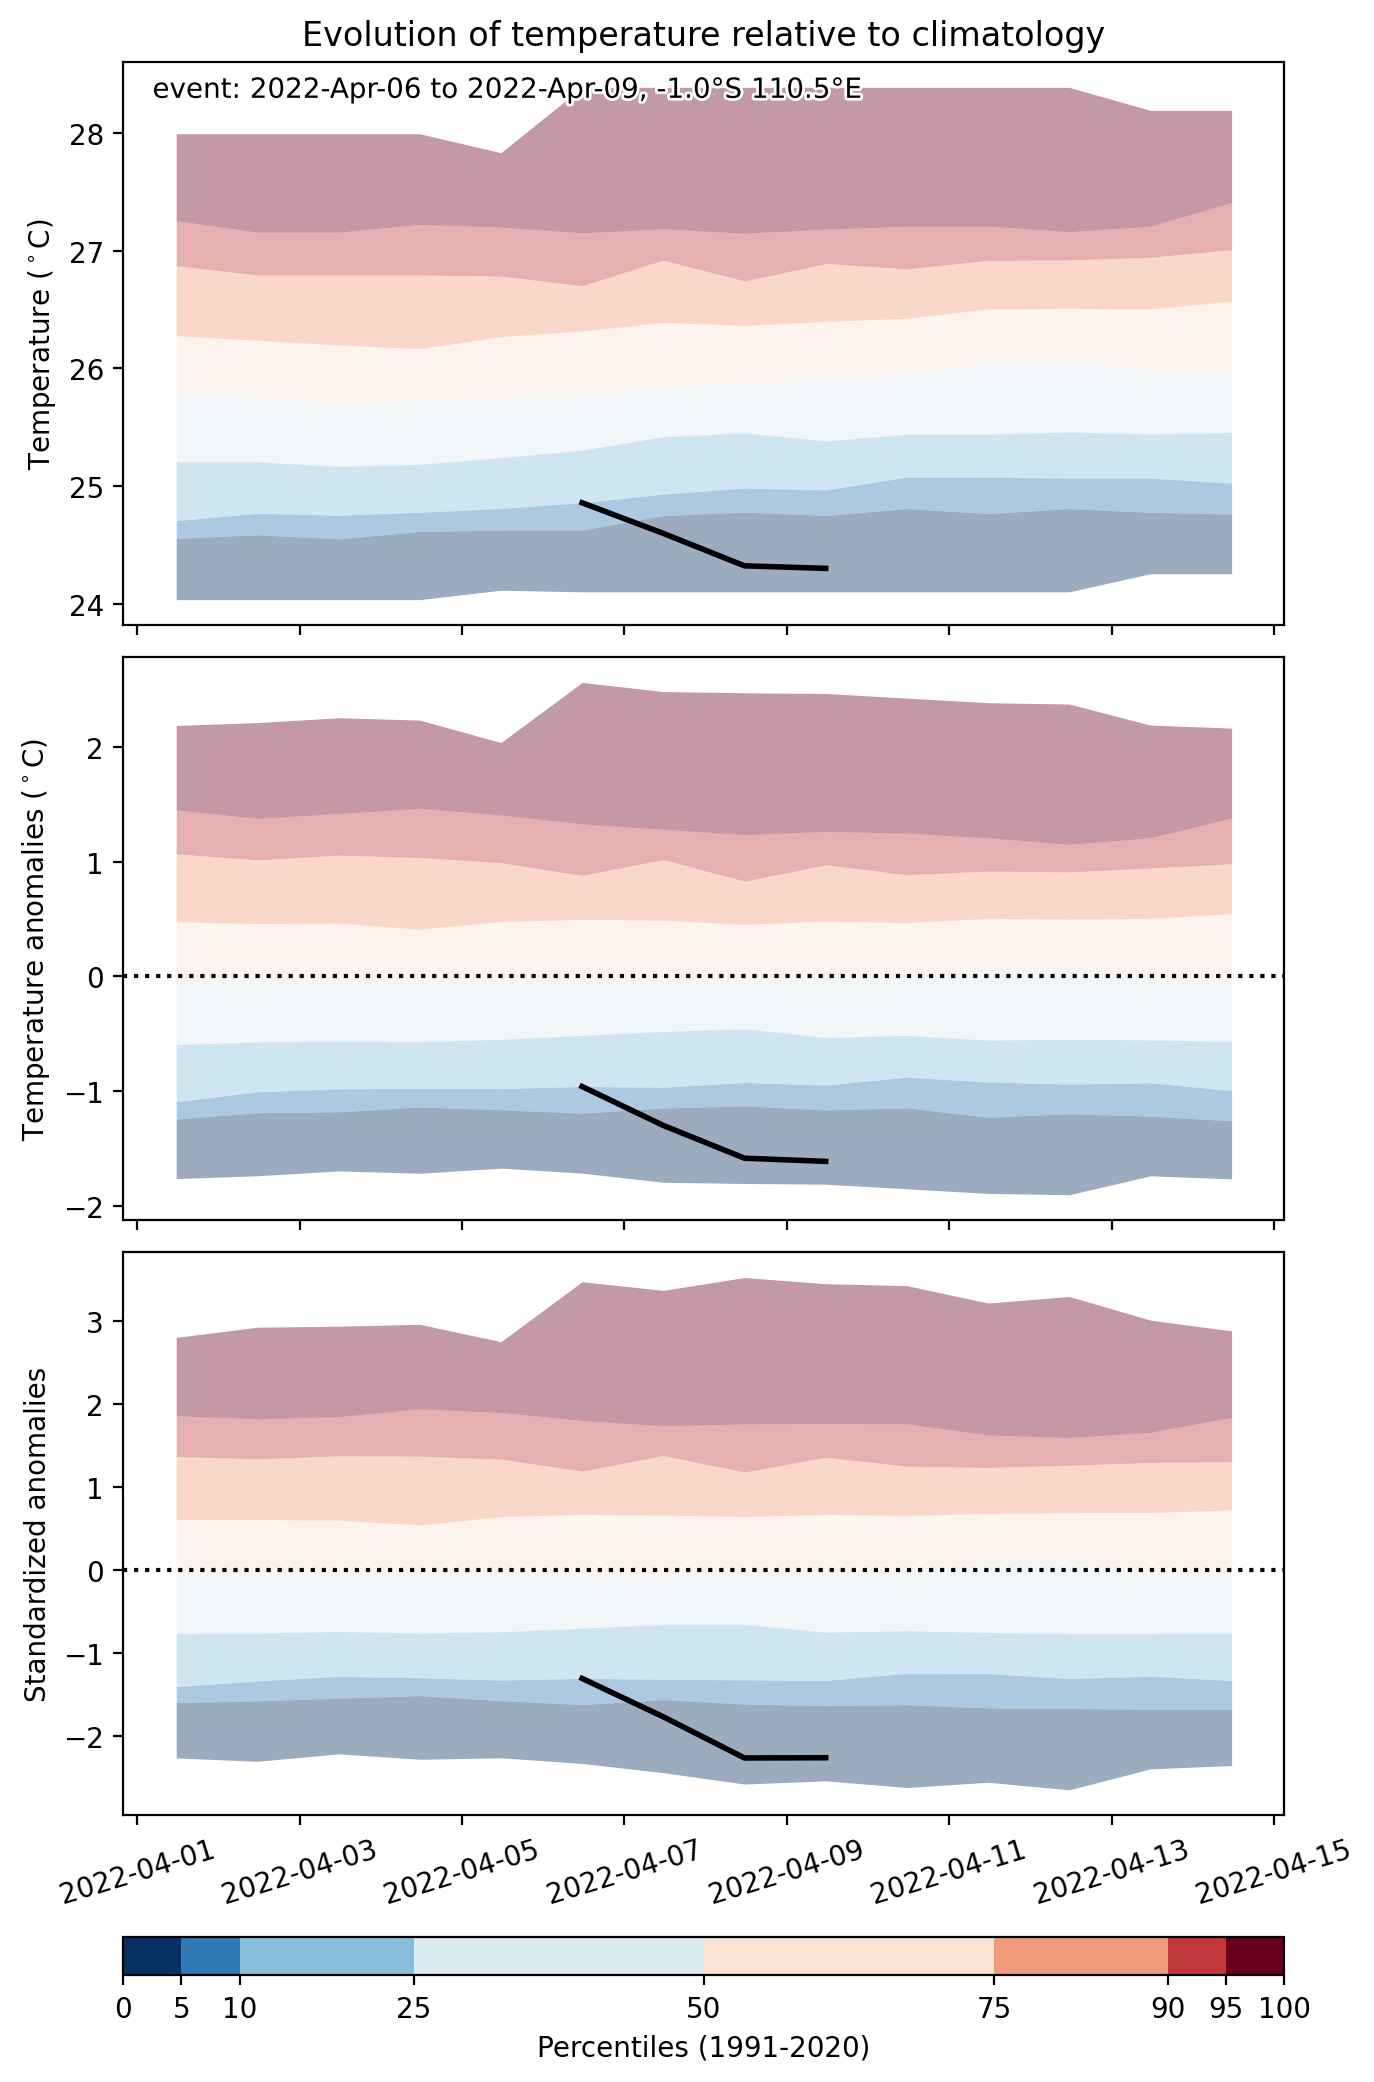
Cold spell occuring from April 06 2022 to April 09 2022 at -1.0°S 110.5°E

Download data: JSON

Event type: Cold spell

Countries affected (identified with ArcGIS Online; provided only for geographical reference):

  • Indonesia
  • Malaysia

Duration: 4 days

Time span: April 06 2022 to April 09 2022

Statistics over entire affected area:

  • Mean temperature anomaly: -1.3 °C
  • Mean temperature: 24.8 °C
  • Minimum temperature anomaly: -1.7 °C
  • Minimum temperature: 22.6 °C

Event center: -1.0°S 110.5°E

Area affected: 64901 km$^2$


Fig. 1: Map of most extreme temperature anomalies (standardized) experienced during the event. The purple star indicates the center of the extreme event. Green hatching illustrates all areas under the effect of extremes at some time during the event.


Fig. 2: Evolution of temperature at the center of the event. The climatological percentile distribution is illustrated with color shadings.


Fig. 3: Maps illustrating the evolution of standardized temperature anomalies during the event.

Event ID: Cold_spell_2022-Apr-06_to_2022-Apr-09_110.5_-1.0

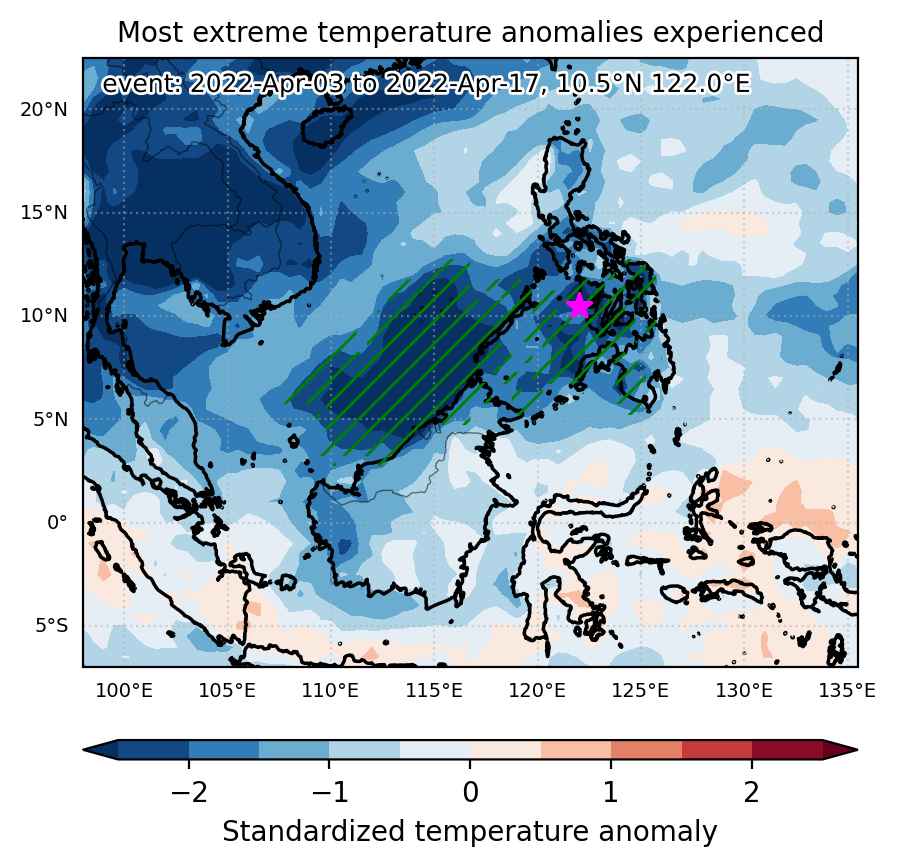
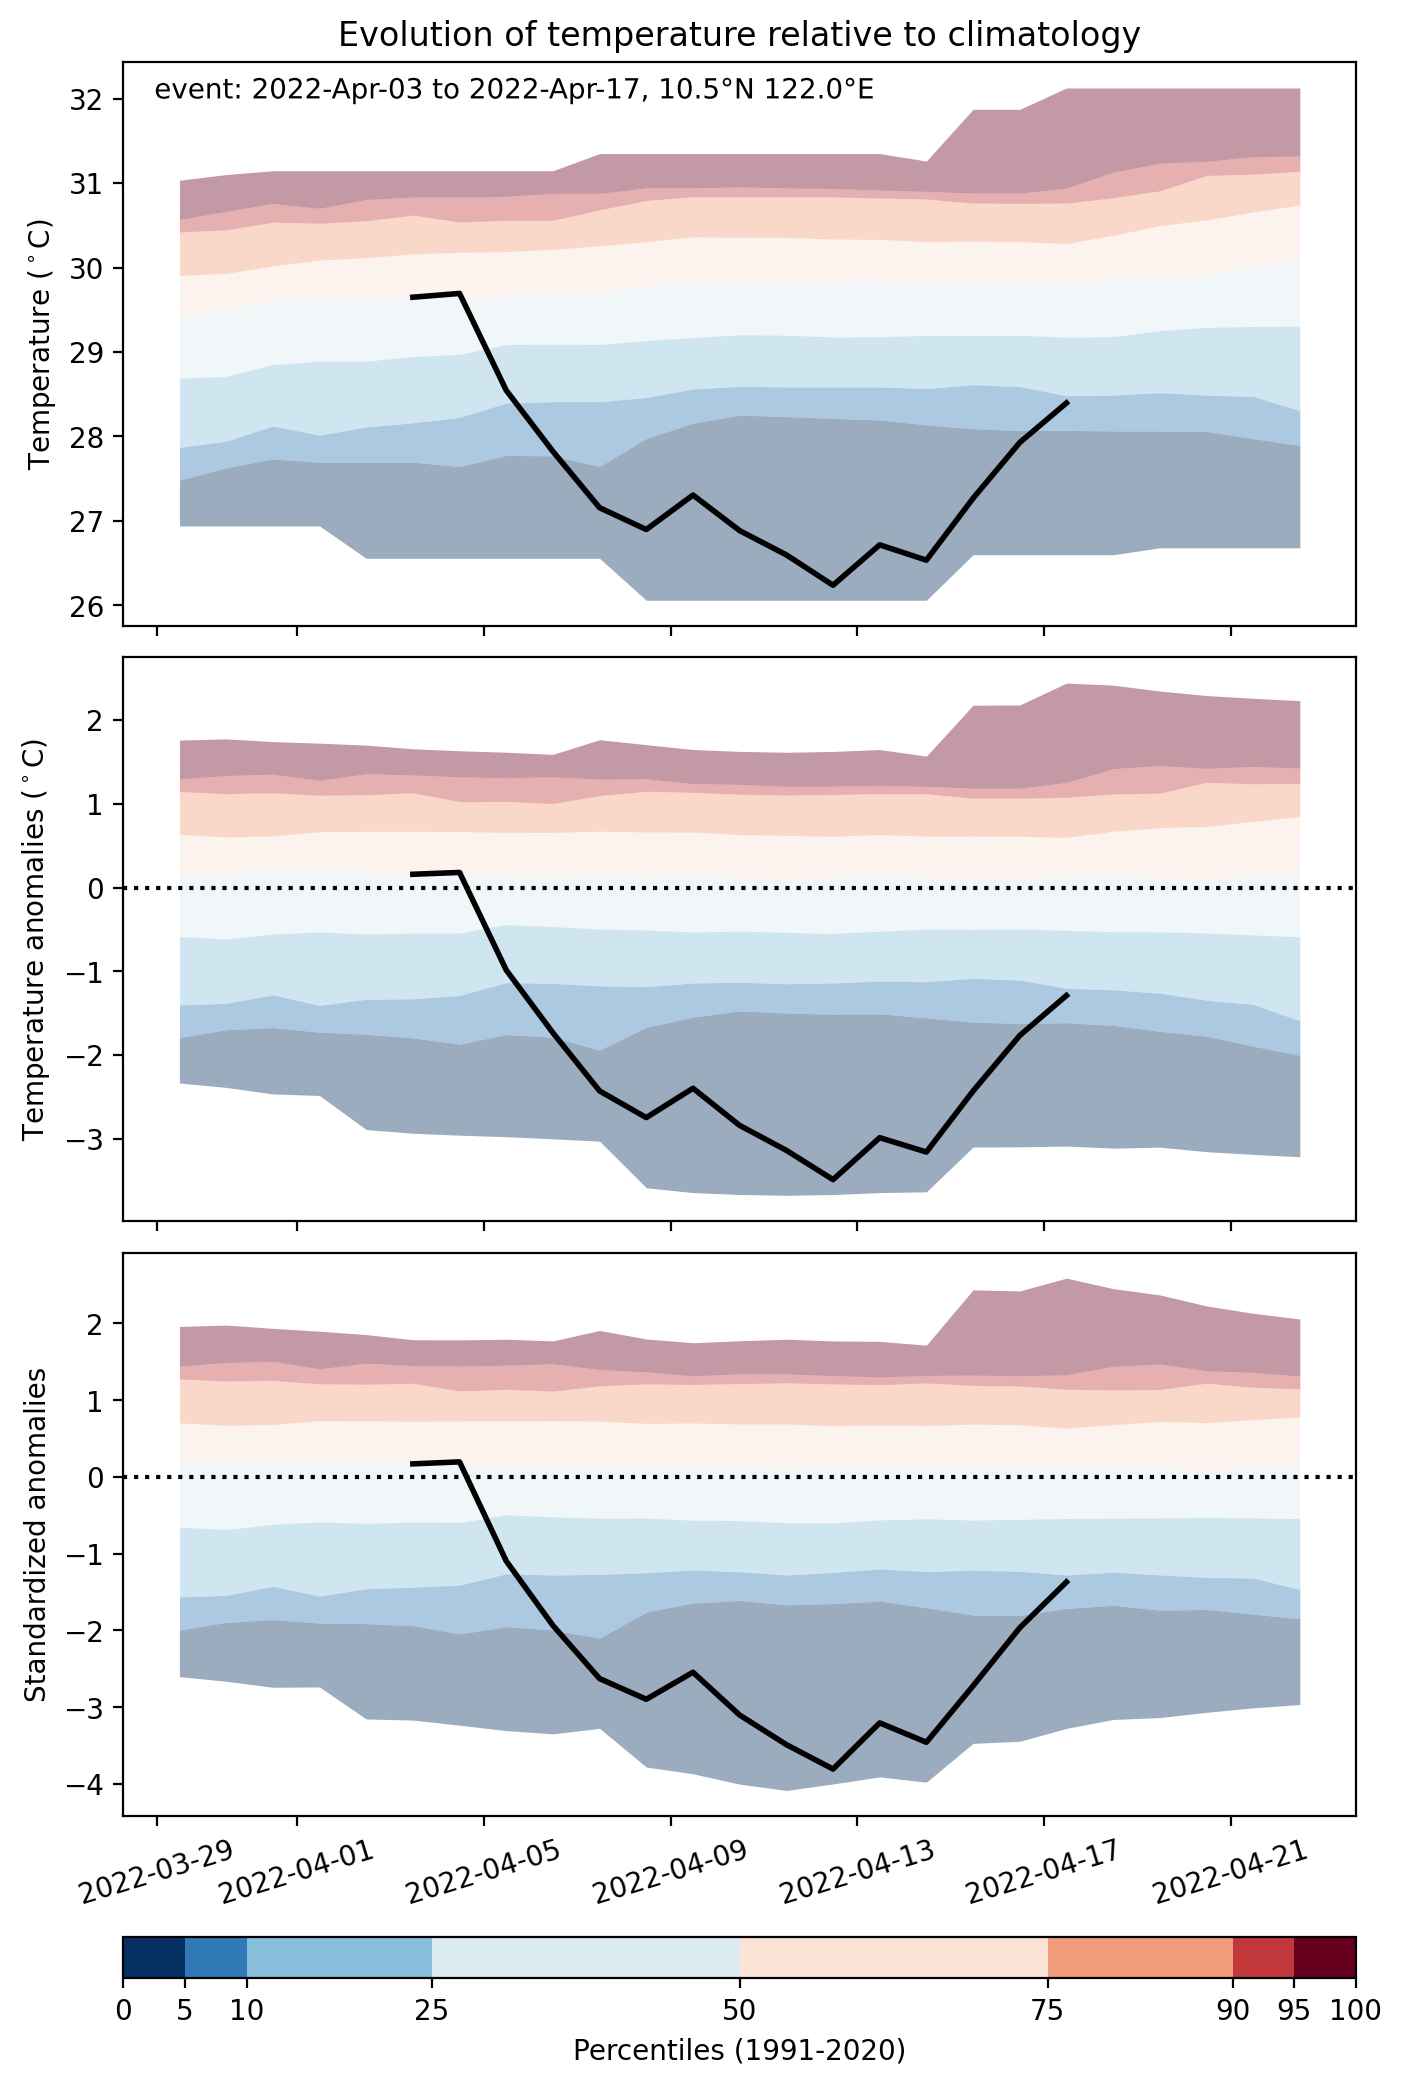
Cold spell occuring from April 03 2022 to April 17 2022 at 10.5°N 122.0°E

Download data: JSON

Event type: Cold spell

Countries affected (identified with ArcGIS Online; provided only for geographical reference):

  • Brunei Darussalam
  • Malaysia
  • Philippines

Duration: 15 days

Time span: April 03 2022 to April 17 2022

Statistics over entire affected area:

  • Mean temperature anomaly: -1.2 °C
  • Mean temperature: 26.2 °C
  • Minimum temperature anomaly: -3.5 °C
  • Minimum temperature: 21.3 °C

Event center: 10.5°N 122.0°E

Area affected: 1116353 km$^2$


Fig. 1: Map of most extreme temperature anomalies (standardized) experienced during the event. The purple star indicates the center of the extreme event. Green hatching illustrates all areas under the effect of extremes at some time during the event.


Fig. 2: Evolution of temperature at the center of the event. The climatological percentile distribution is illustrated with color shadings.


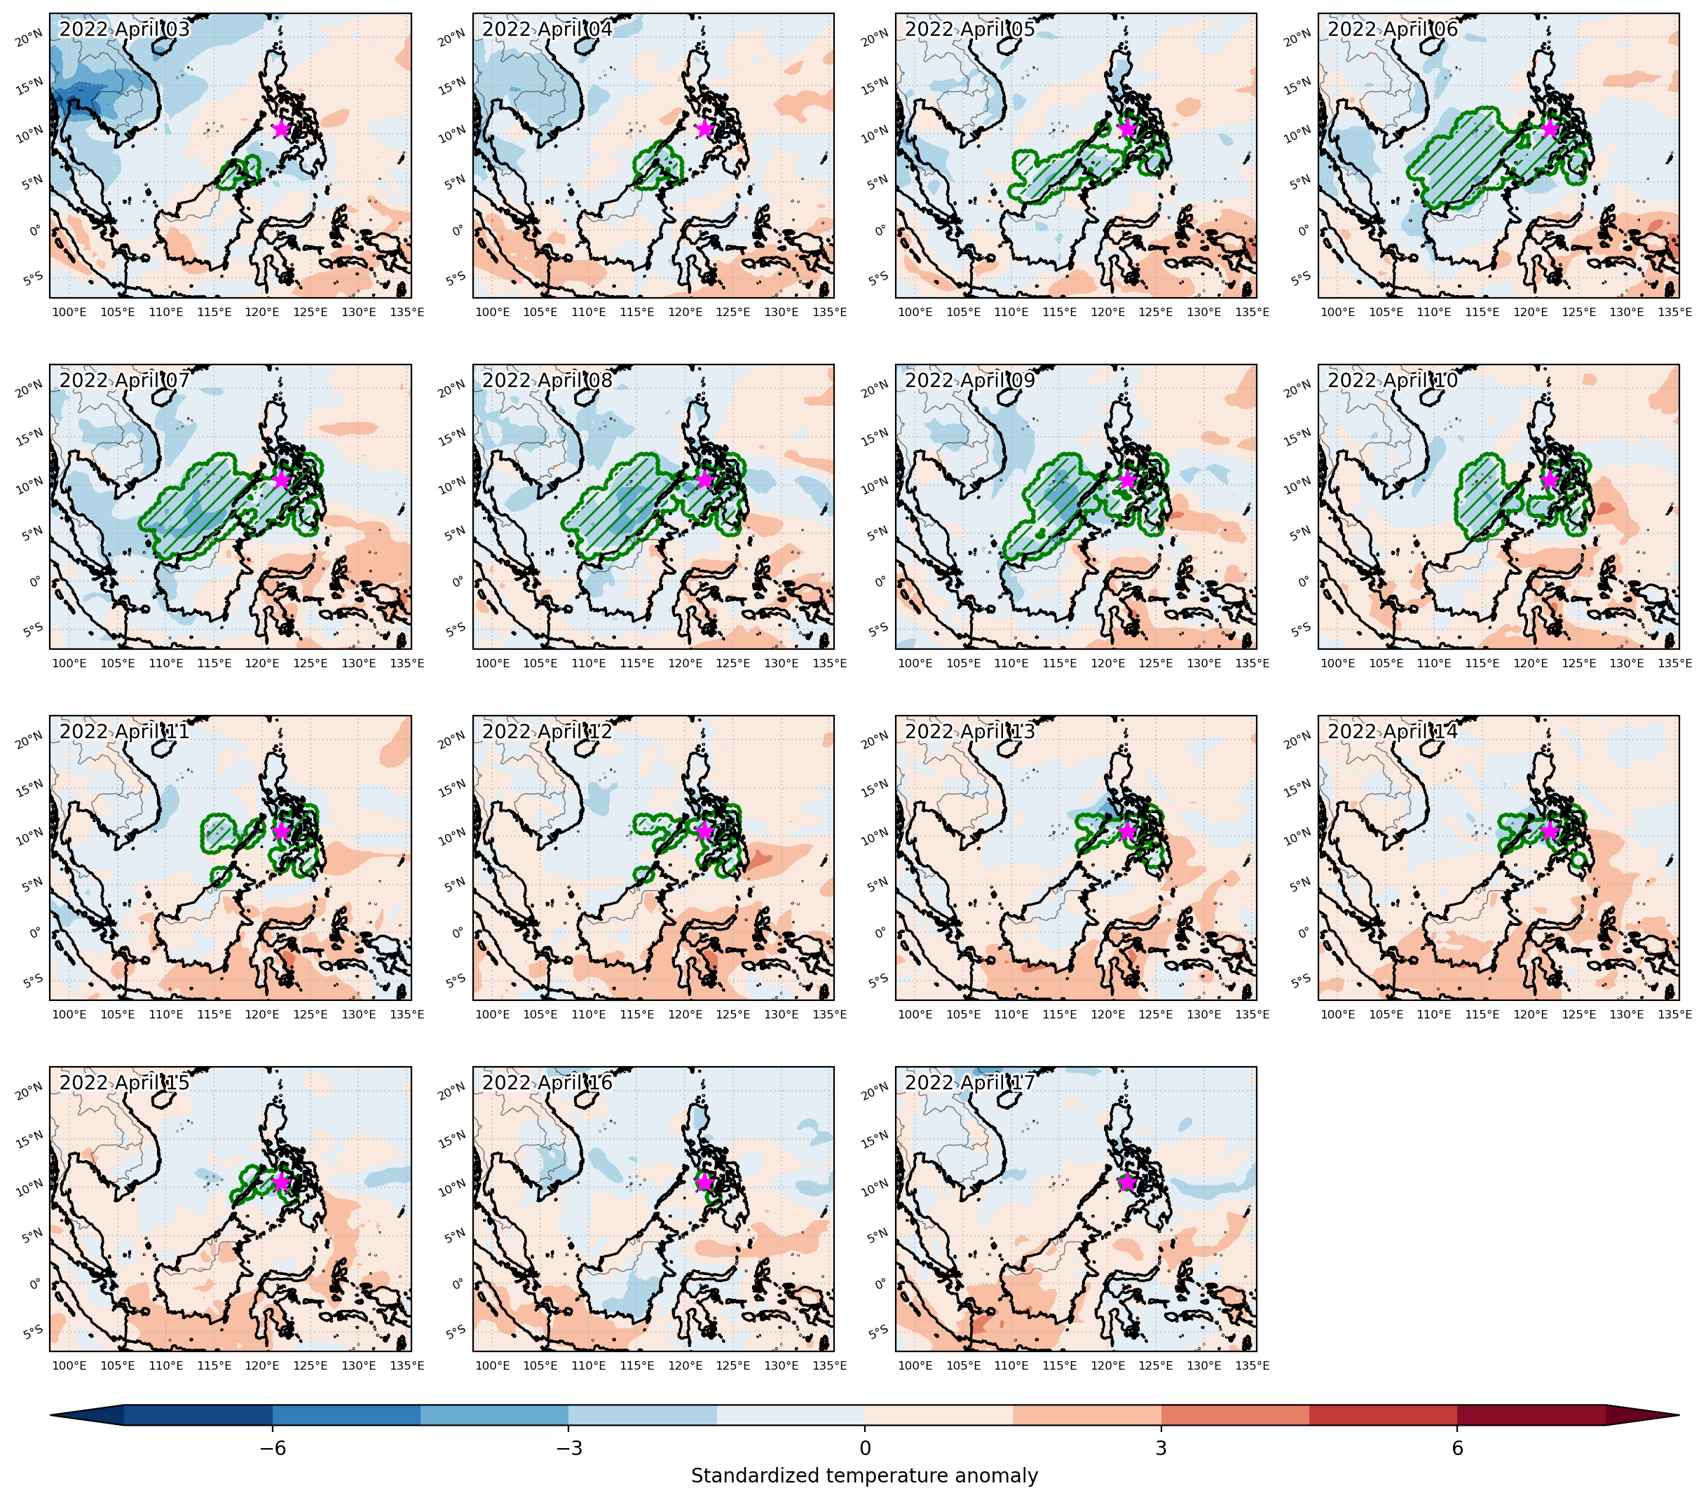
Fig. 3: Maps illustrating the evolution of standardized temperature anomalies during the event.

Event ID: Cold_spell_2022-Apr-03_to_2022-Apr-17_122.0_10.5

Cold spell occuring from March 30 2022 to April 15 2022 at 15.0°N 103.5°E

Download data: JSON

Event type: Cold spell

Countries affected (identified with ArcGIS Online; provided only for geographical reference):

  • Cambodia
  • China
  • India
  • Lao People’s Democratic Republic
  • Malaysia
  • Myanmar
  • Sri Lanka
  • Thailand
  • Viet Nam

Duration: 17 days

Time span: March 30 2022 to April 15 2022

Statistics over entire affected area:

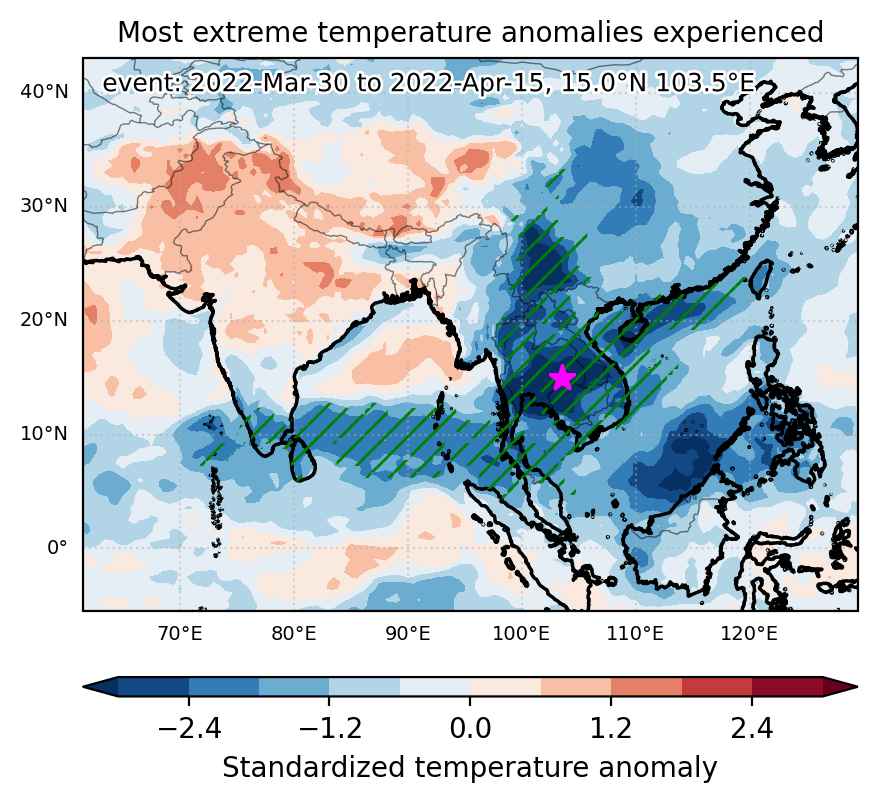
  • Mean temperature anomaly: -3.1 °C
  • Mean temperature: 22.3 °C
  • Minimum temperature anomaly: -12.5 °C
  • Minimum temperature: -8.4 °C

Event center: 15.0°N 103.5°E

Area affected: 3821113 km$^2$


Fig. 1: Map of most extreme temperature anomalies (standardized) experienced during the event. The purple star indicates the center of the extreme event. Green hatching illustrates all areas under the effect of extremes at some time during the event.


Fig. 2: Evolution of temperature at the center of the event. The climatological percentile distribution is illustrated with color shadings.


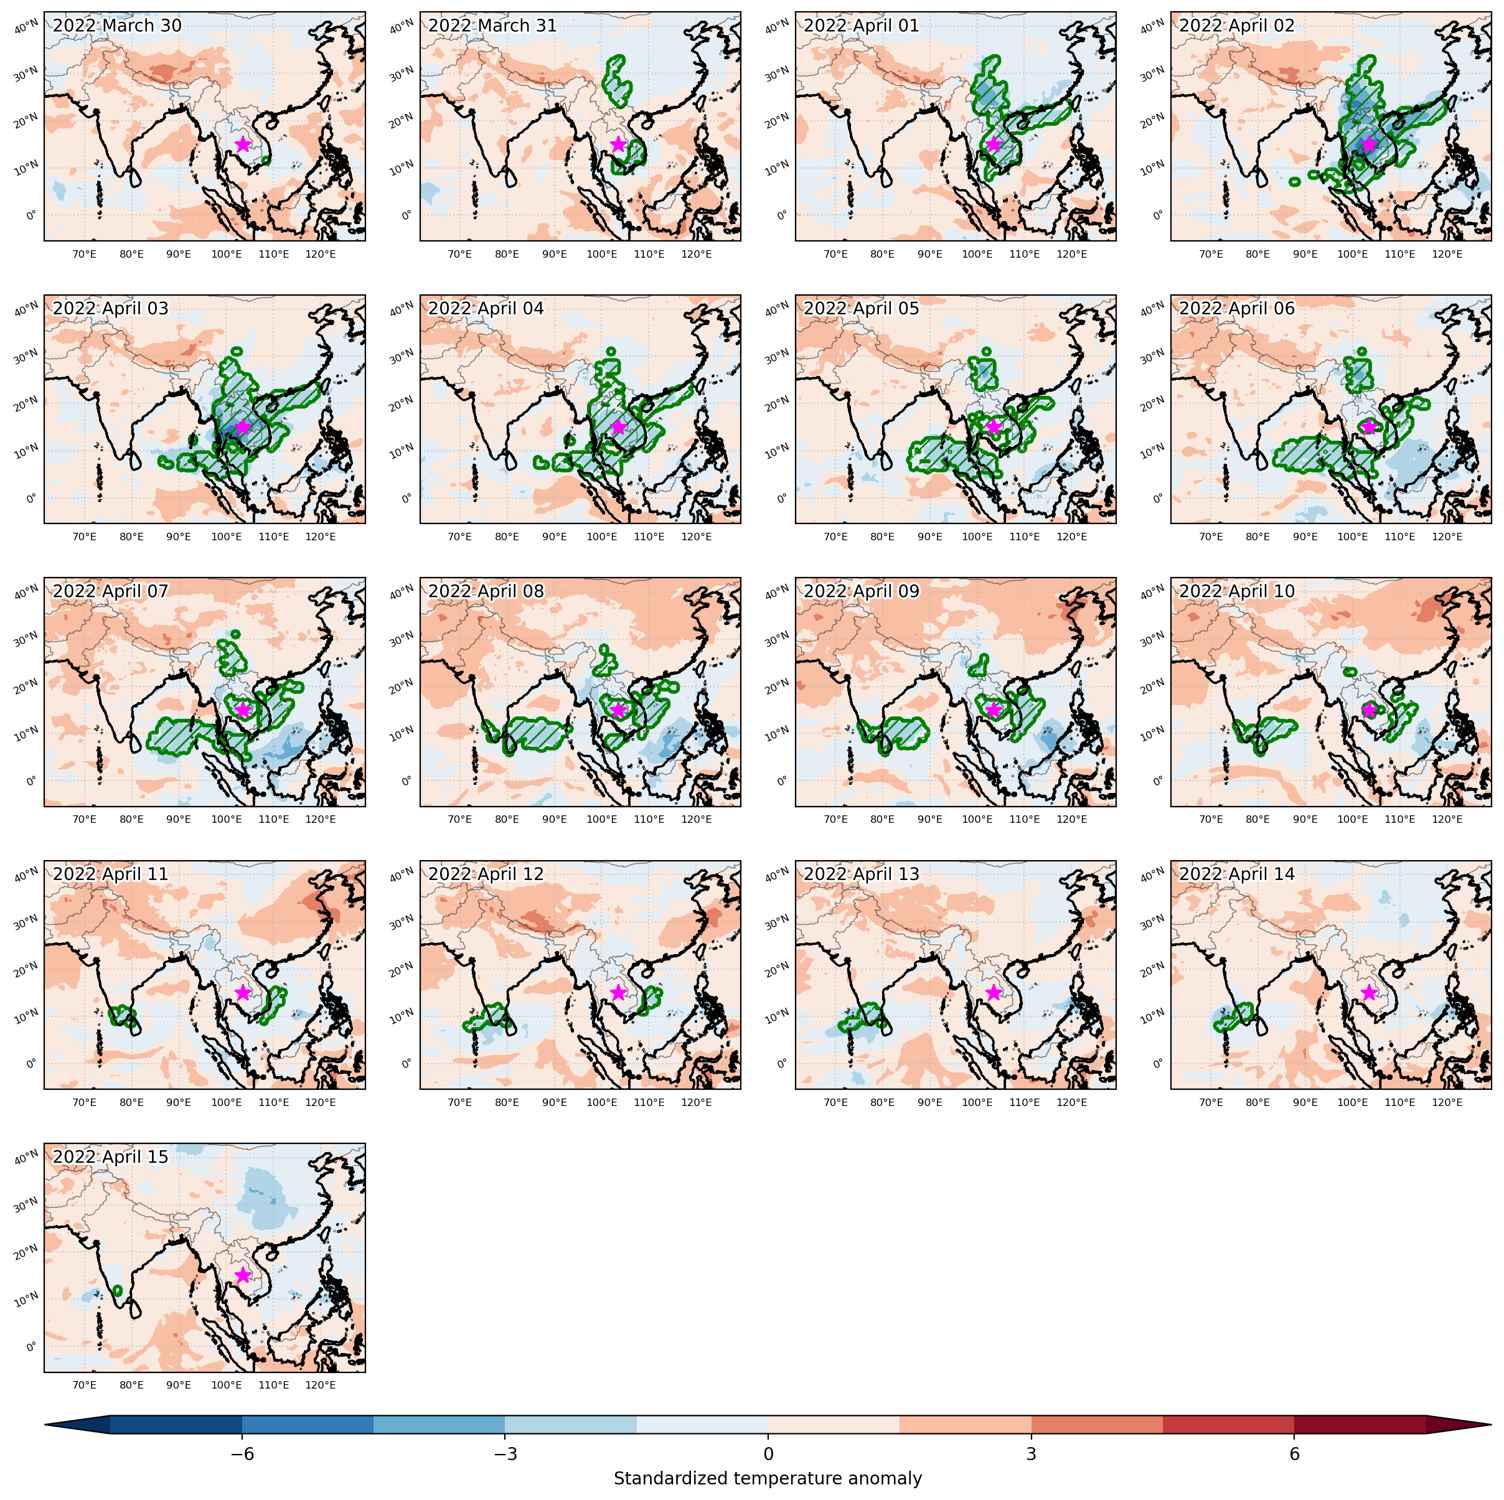
Fig. 3: Maps illustrating the evolution of standardized temperature anomalies during the event.

Event ID: Cold_spell_2022-Mar-30_to_2022-Apr-15_103.5_15.0

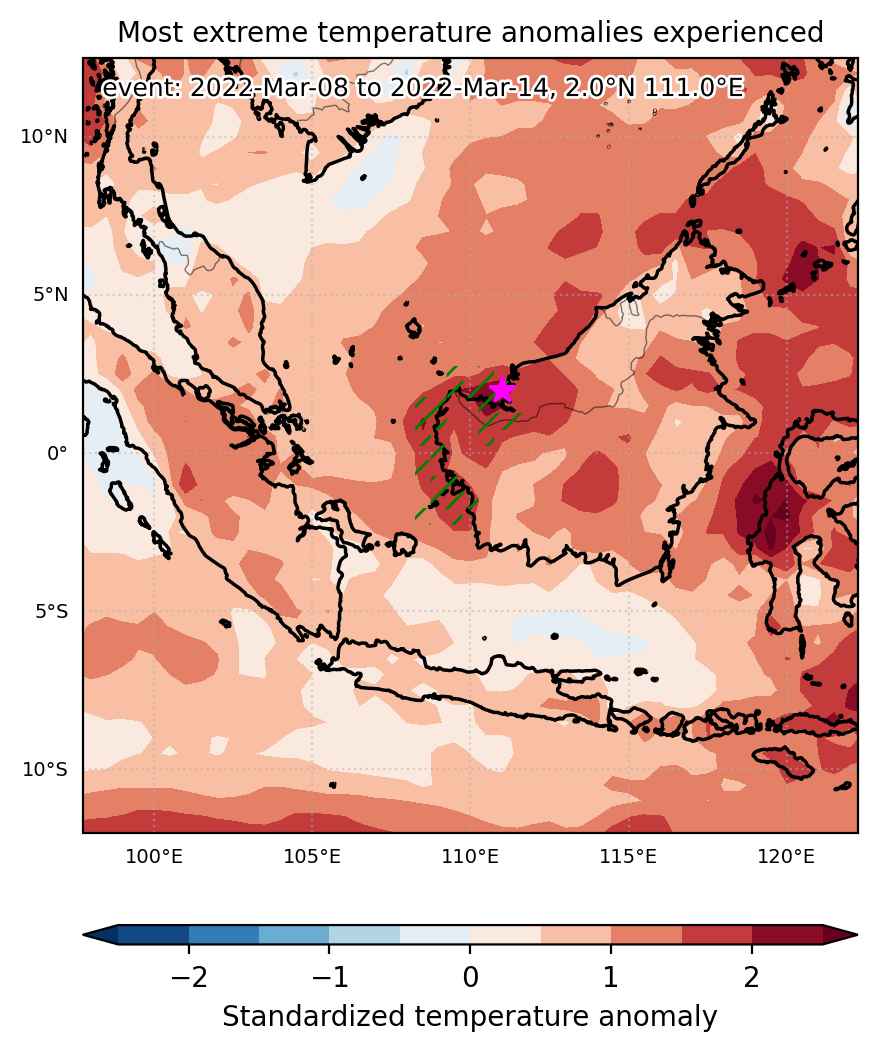
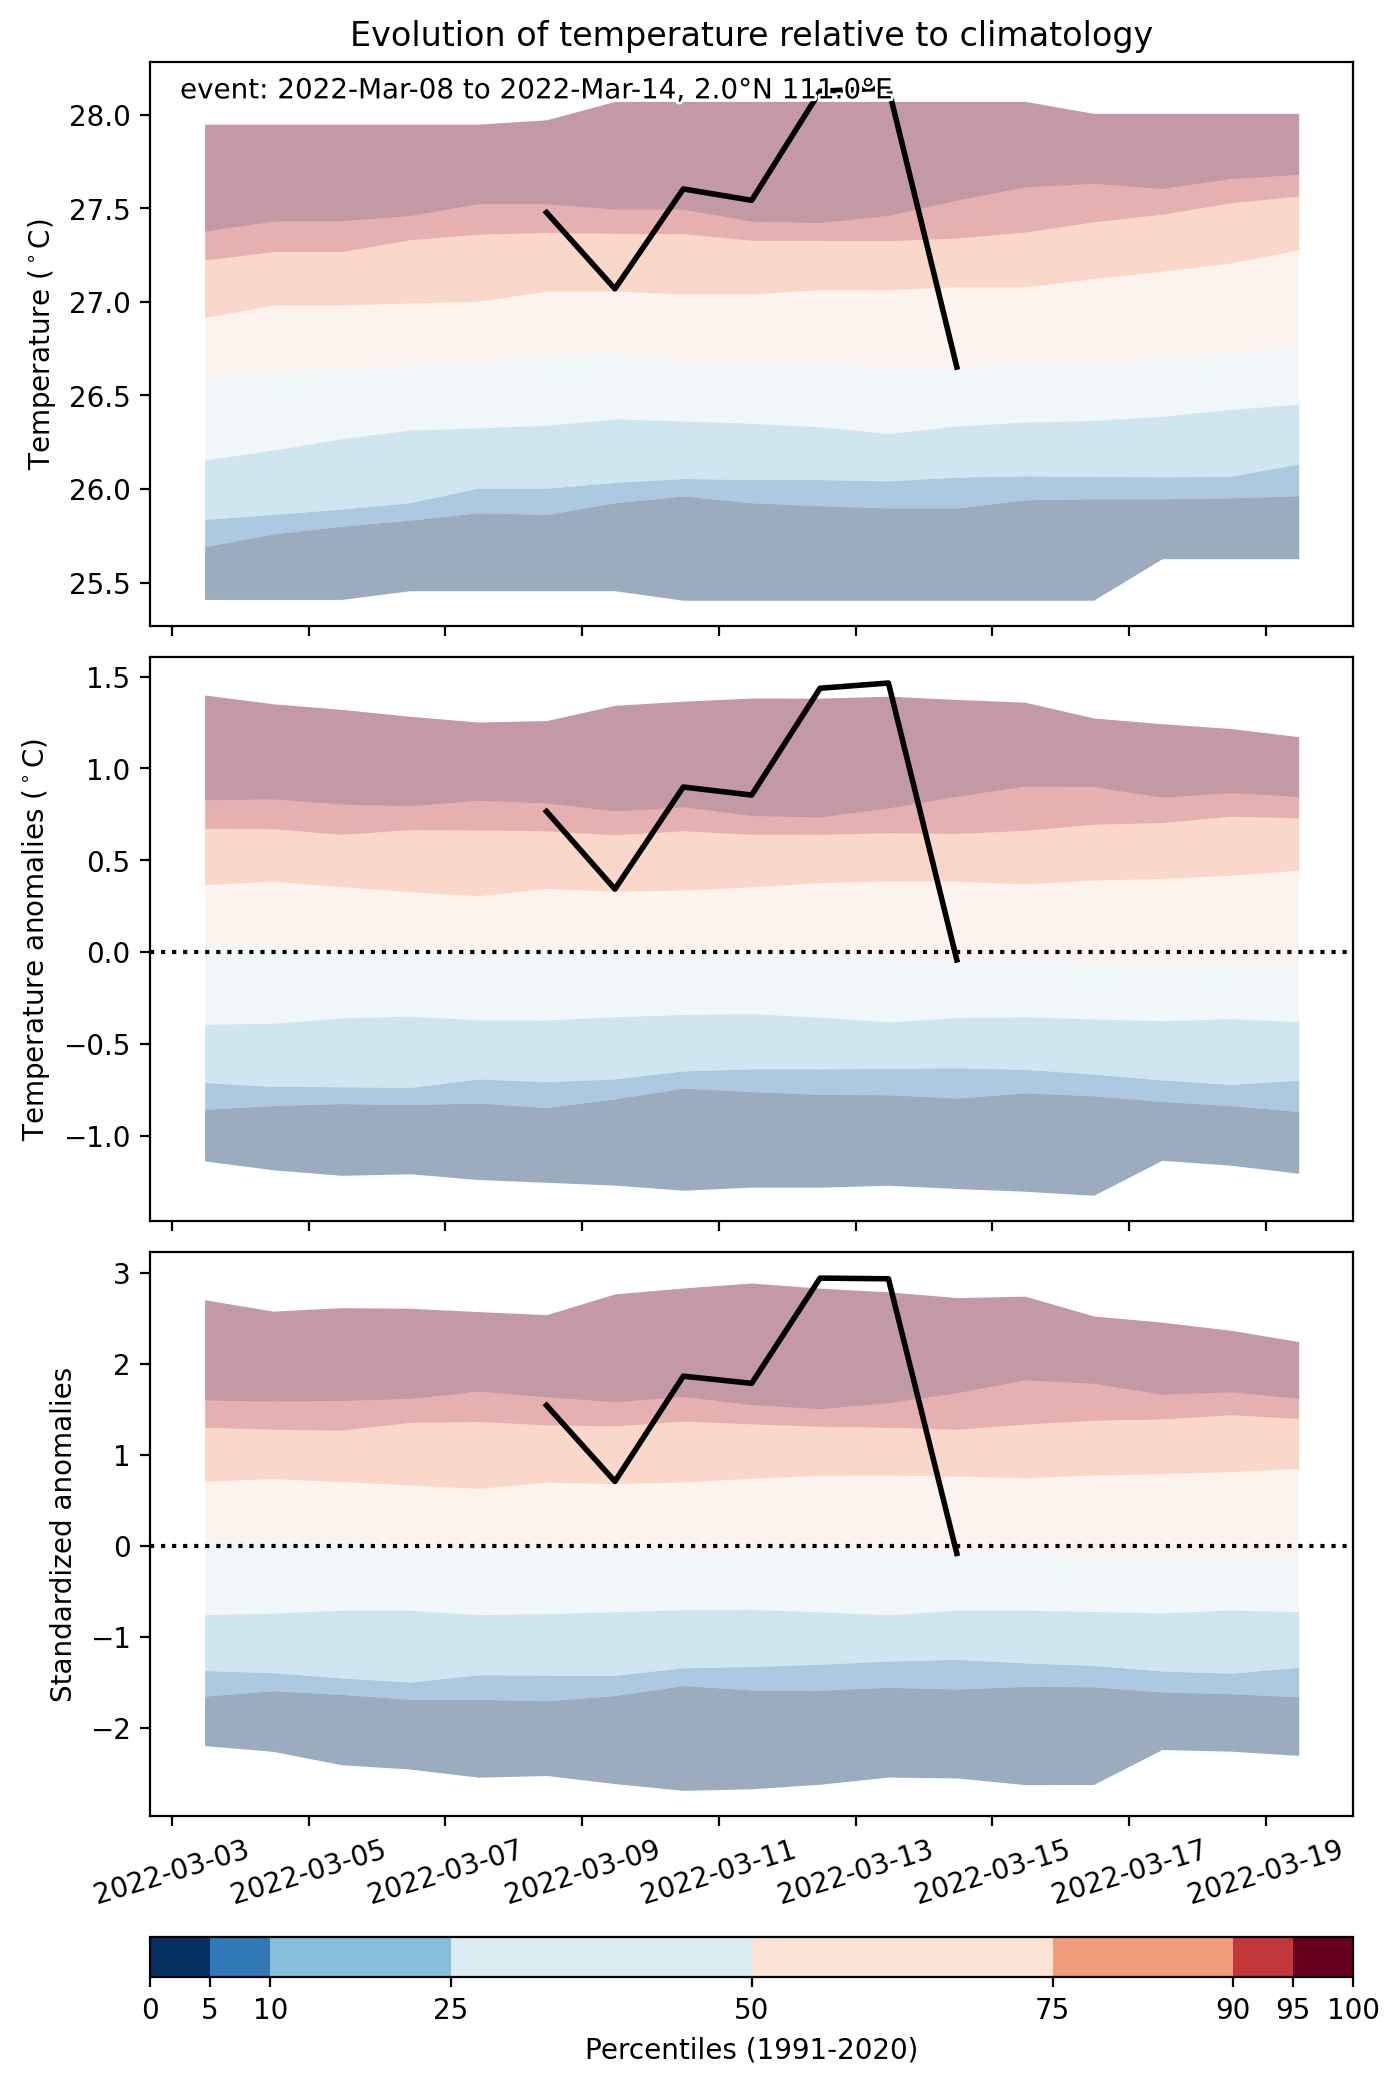
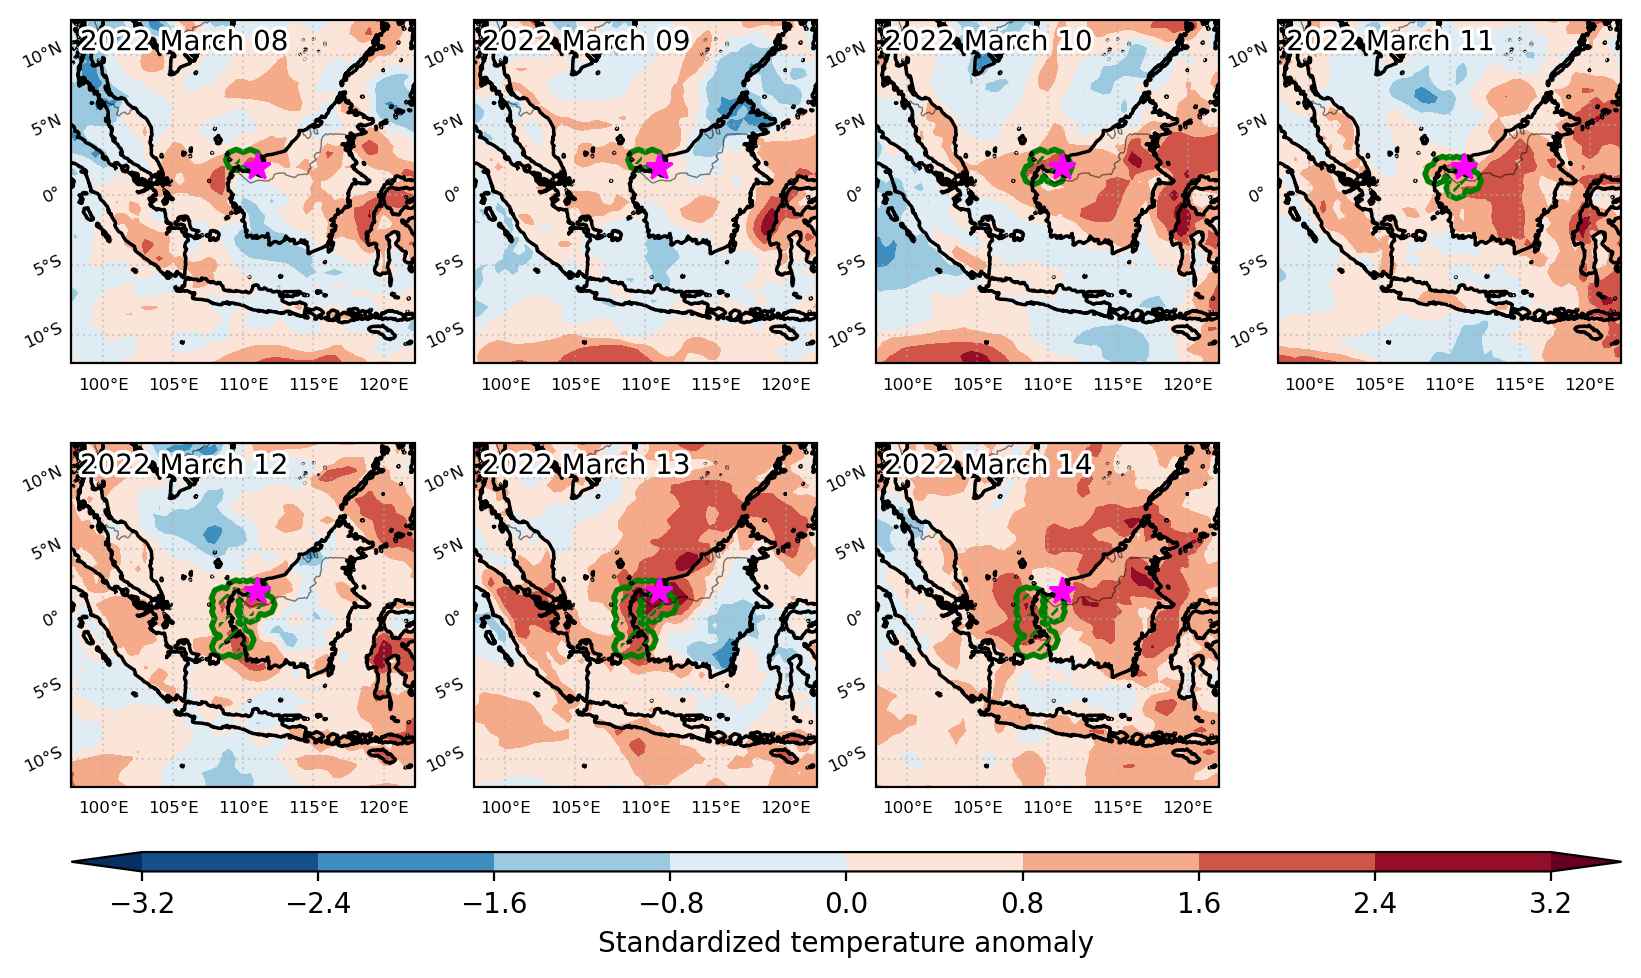
Heat wave occuring from March 08 2022 to March 14 2022 at 2.0°N 111.0°E

Download data: JSON

Event type: Heat wave

Countries affected (identified with ArcGIS Online; provided only for geographical reference):

  • Indonesia
  • Malaysia

Duration: 7 days

Time span: March 08 2022 to March 14 2022

Statistics over entire affected area:

  • Mean temperature anomaly: 1.1 °C
  • Mean temperature: 27.9 °C
  • Maximum temperature anomaly: 2.2 °C
  • Maximum temperature: 28.7 °C

Event center: 2.0°N 111.0°E

Area affected: 77249 km$^2$


Fig. 1: Map of most extreme temperature anomalies (standardized) experienced during the event. The purple star indicates the center of the extreme event. Green hatching illustrates all areas under the effect of extremes at some time during the event.


Fig. 2: Evolution of temperature at the center of the event. The climatological percentile distribution is illustrated with color shadings.


Fig. 3: Maps illustrating the evolution of standardized temperature anomalies during the event.

Event ID: Heat_wave_2022-Mar-08_to_2022-Mar-14_111.0_2.0

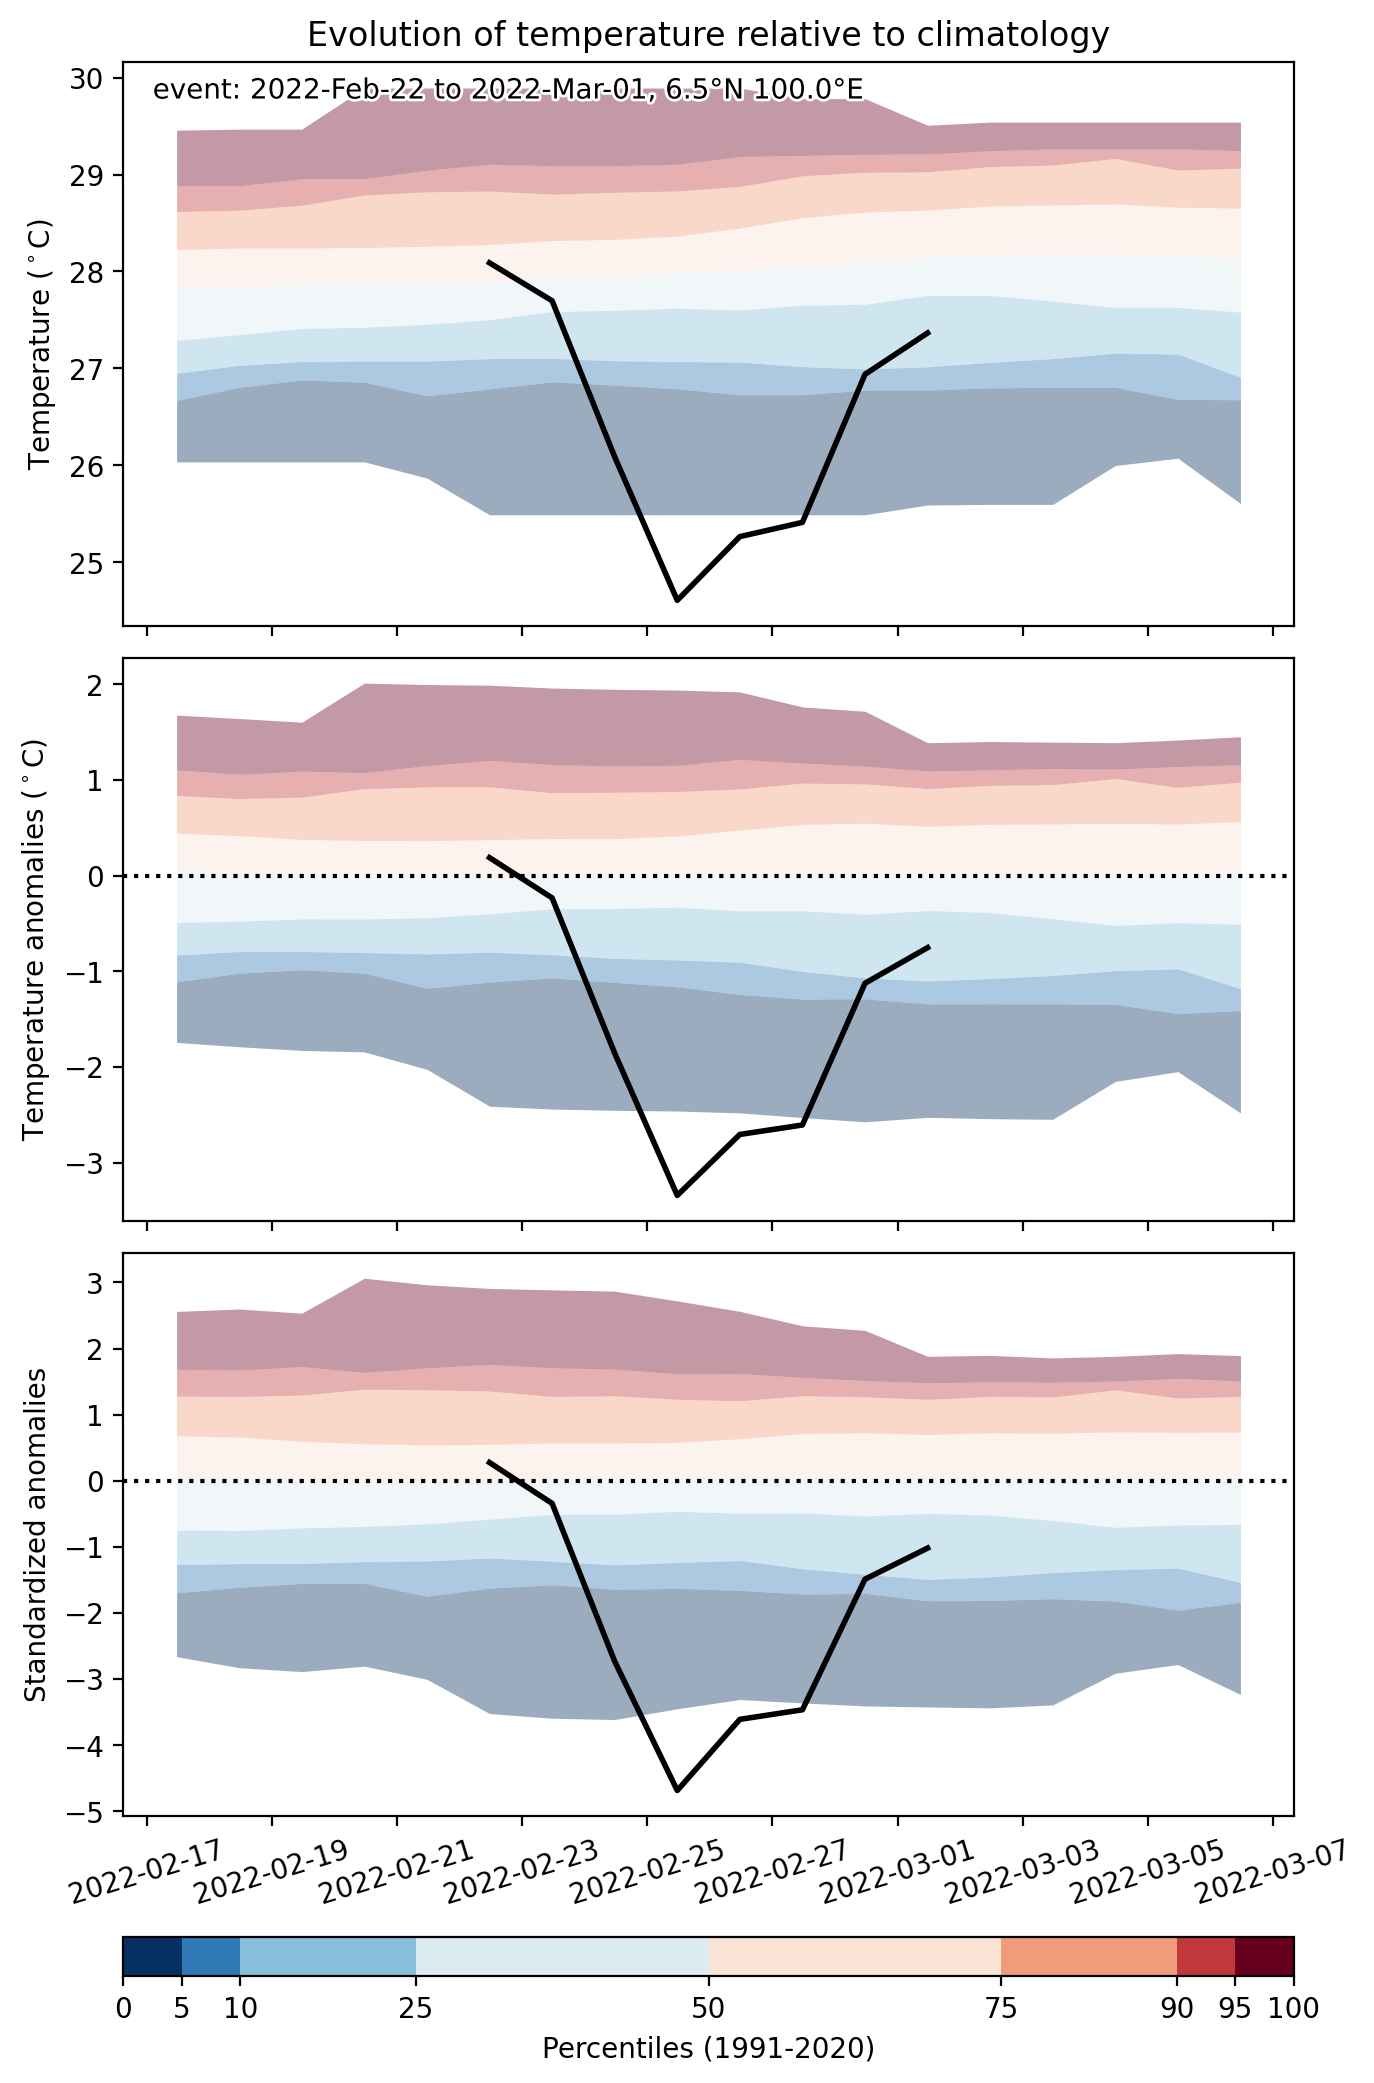
Cold spell occuring from February 22 2022 to March 01 2022 at 6.5°N 100.0°E

Download data: JSON

Event type: Cold spell

Countries affected (identified with ArcGIS Online; provided only for geographical reference):

  • Indonesia
  • Malaysia
  • Thailand

Duration: 8 days

Time span: February 22 2022 to March 01 2022

Statistics over entire affected area:

  • Mean temperature anomaly: -1.7 °C
  • Mean temperature: 25.3 °C
  • Minimum temperature anomaly: -4.6 °C
  • Minimum temperature: 19.8 °C

Event center: 6.5°N 100.0°E

Area affected: 304229 km$^2$


Fig. 1: Map of most extreme temperature anomalies (standardized) experienced during the event. The purple star indicates the center of the extreme event. Green hatching illustrates all areas under the effect of extremes at some time during the event.


Fig. 2: Evolution of temperature at the center of the event. The climatological percentile distribution is illustrated with color shadings.


Fig. 3: Maps illustrating the evolution of standardized temperature anomalies during the event.

Event ID: Cold_spell_2022-Feb-22_to_2022-Mar-01_100.0_6.5

Heat wave occuring from February 19 2022 to January 25 2023 at -11.0°S 150.0°E

Download data: JSON

Event type: Heat wave

Countries affected (identified with ArcGIS Online; provided only for geographical reference):

  • Antarctica
  • Australia
  • Bangladesh
  • Bhutan
  • Cambodia
  • Canada
  • China
  • Christmas Island
  • Cook Islands
  • Fiji
  • French Polynesia
  • Hong Kong
  • India
  • Indonesia
  • Japan
  • Kazakhstan
  • Korea, Democratic People’s Republic of
  • Korea, Republic of
  • Kyrgyzstan
  • Lao People’s Democratic Republic
  • Malaysia
  • Maldives
  • Mongolia
  • Myanmar
  • Nepal
  • New Caledonia
  • New Zealand
  • Norfolk Island
  • Northern Mariana Islands
  • Oman
  • Pakistan
  • Papua New Guinea
  • Philippines
  • Russian Federation
  • Solomon Islands
  • Sri Lanka
  • Taiwan, Province of China
  • Thailand
  • Timor-Leste
  • Tonga
  • United States
  • Vanuatu
  • Viet Nam

Duration: 341 days

Time span: February 19 2022 to January 25 2023

Statistics over entire affected area:

  • Mean temperature anomaly: 2.6 °C
  • Mean temperature: 19.0 °C
  • Maximum temperature anomaly: 33.4 °C
  • Maximum temperature: 37.4 °C

Event center: -11.0°S 150.0°E

Area affected: 154052228 km$^2$


Fig. 1: Map of most extreme temperature anomalies (standardized) experienced during the event. The purple star indicates the center of the extreme event. Green hatching illustrates all areas under the effect of extremes at some time during the event.


Fig. 2: Evolution of temperature at the center of the event. The climatological percentile distribution is illustrated with color shadings.


Fig. 3: Maps illustrating the evolution of standardized temperature anomalies during the event.

Event ID: Heat_wave_2022-Feb-19_to_2023-Jan-25_150.0_-11.0