Heat wave occuring from July 31 2011 to August 03 2011 at 7.5°N 356.0°E

Download data: JSON

Event type: Heat wave

Countries affected (identified with ArcGIS Online; provided only for geographical reference):

  • Côte d’Ivoire
  • Ghana

Duration: 4 days

Time span: July 31 2011 to August 03 2011

Statistics over entire affected area:

  • Mean temperature anomaly: 1.4 °C
  • Mean temperature: 26.4 °C
  • Maximum temperature anomaly: 2.1 °C
  • Maximum temperature: 27.4 °C

Event center: 7.5°N 356.0°E

Area affected: 55059 km$^2$
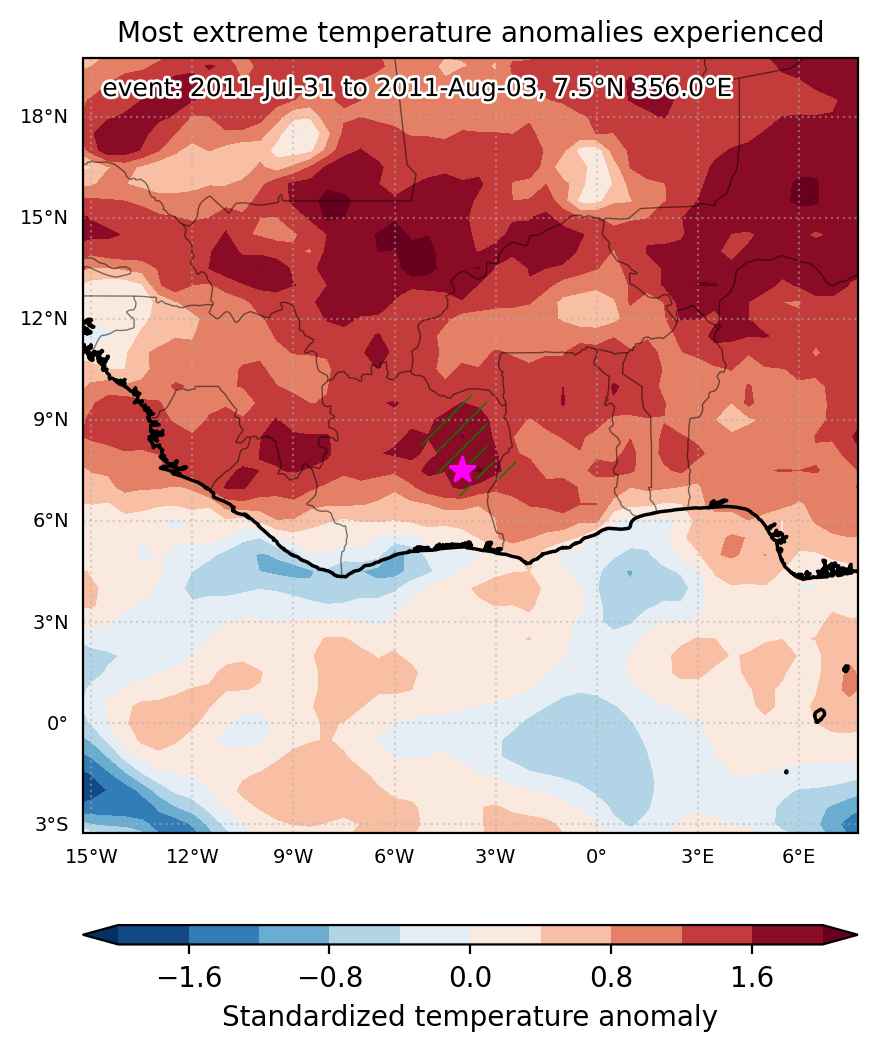

Fig. 1: Map of most extreme temperature anomalies (standardized) experienced during the event. The purple star indicates the center of the extreme event. Green hatching illustrates all areas under the effect of extremes at some time during the event.
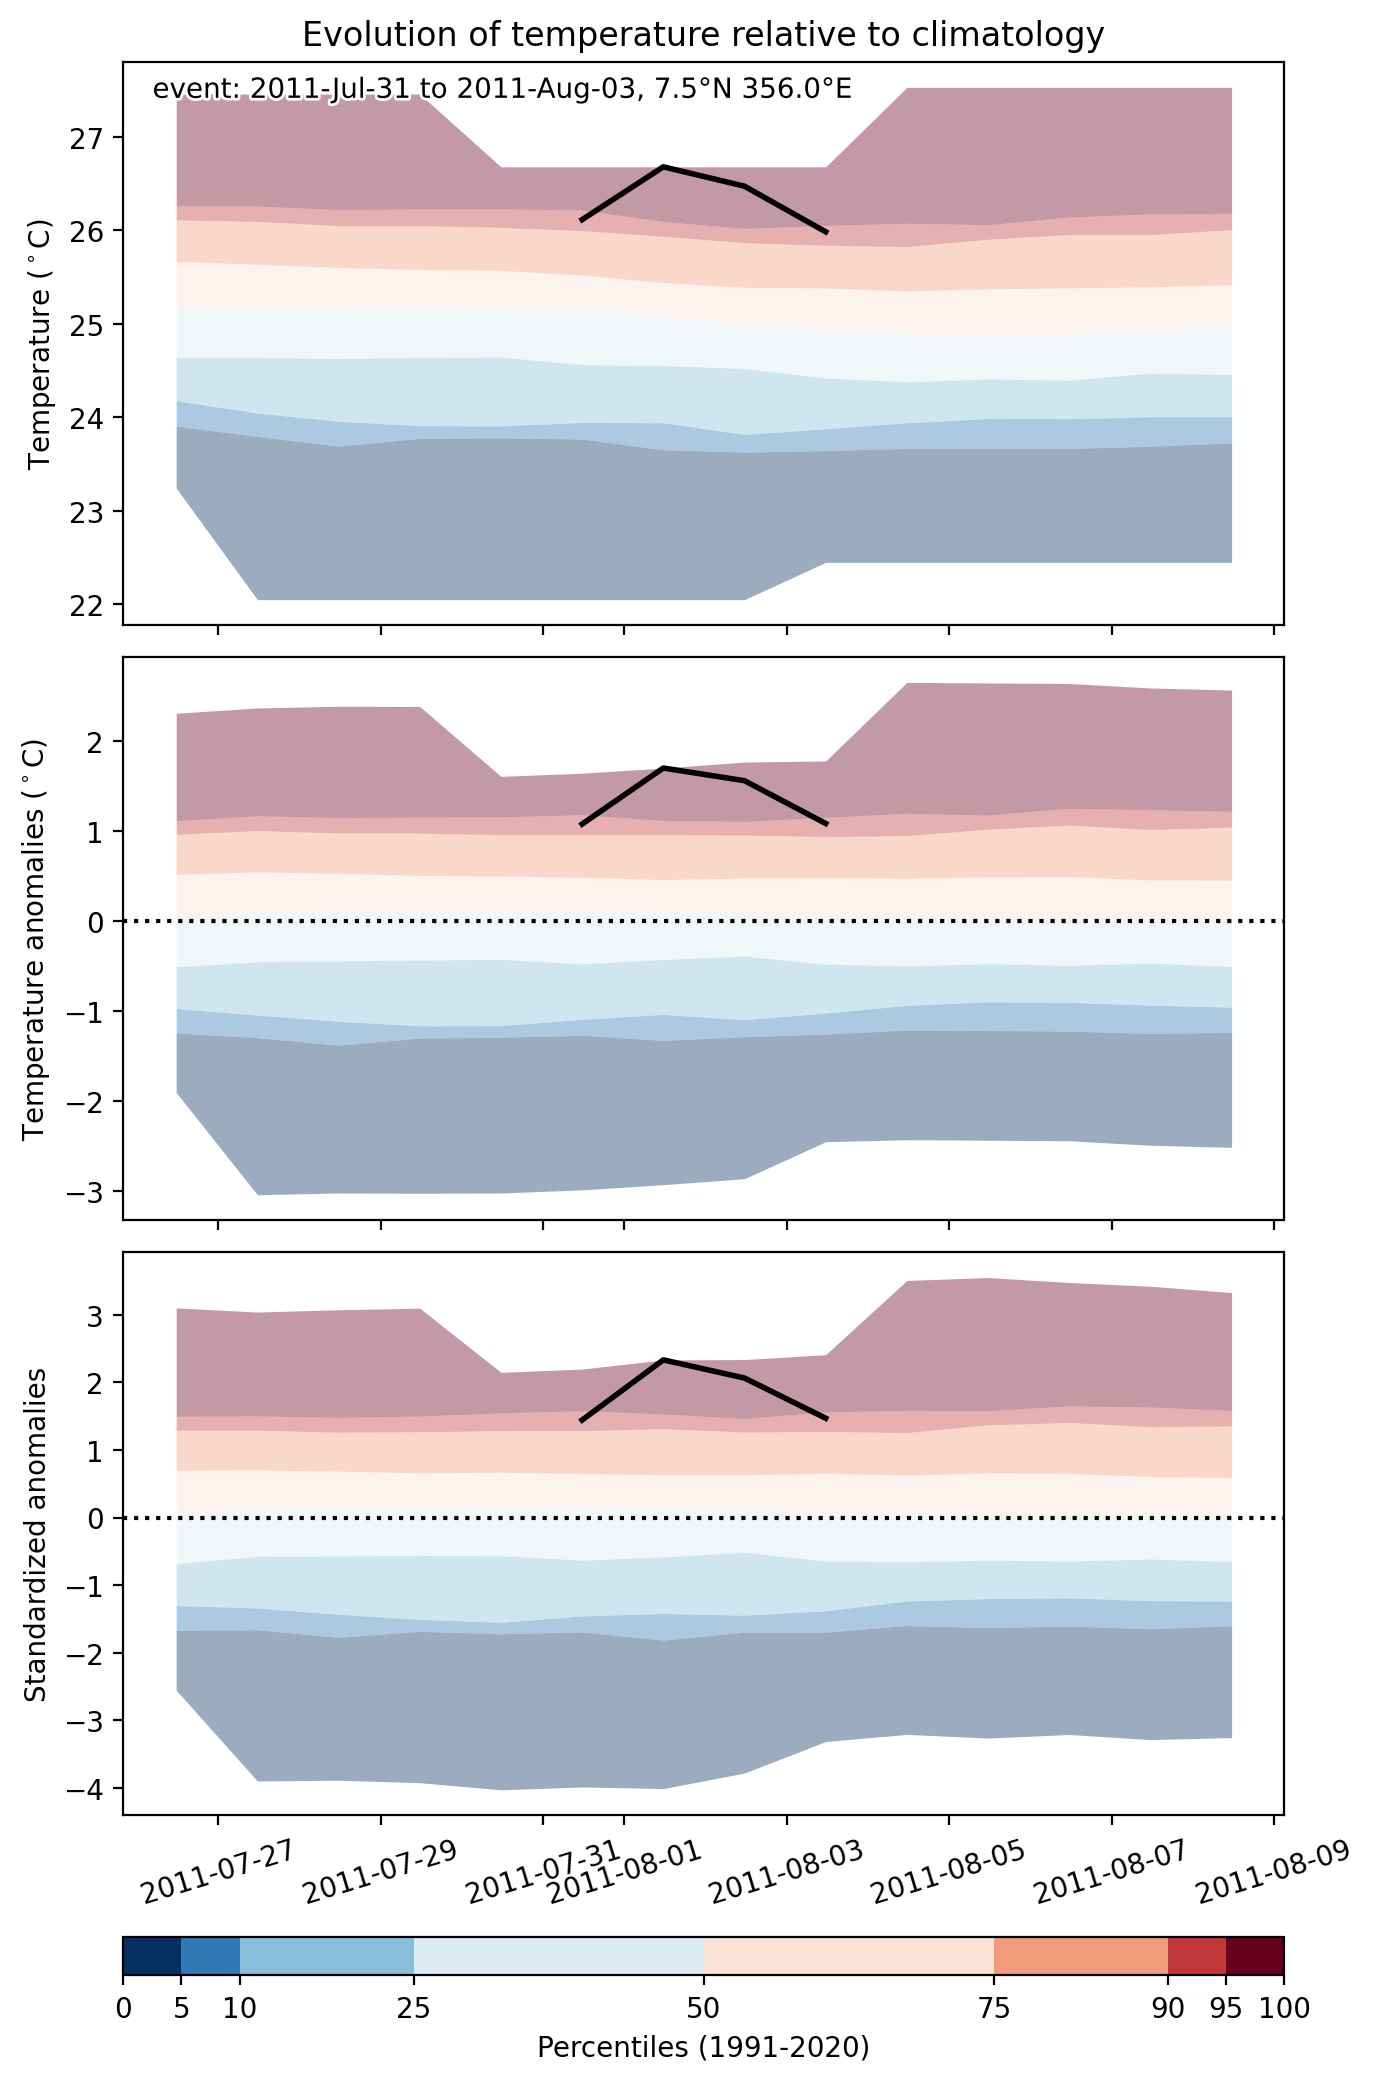


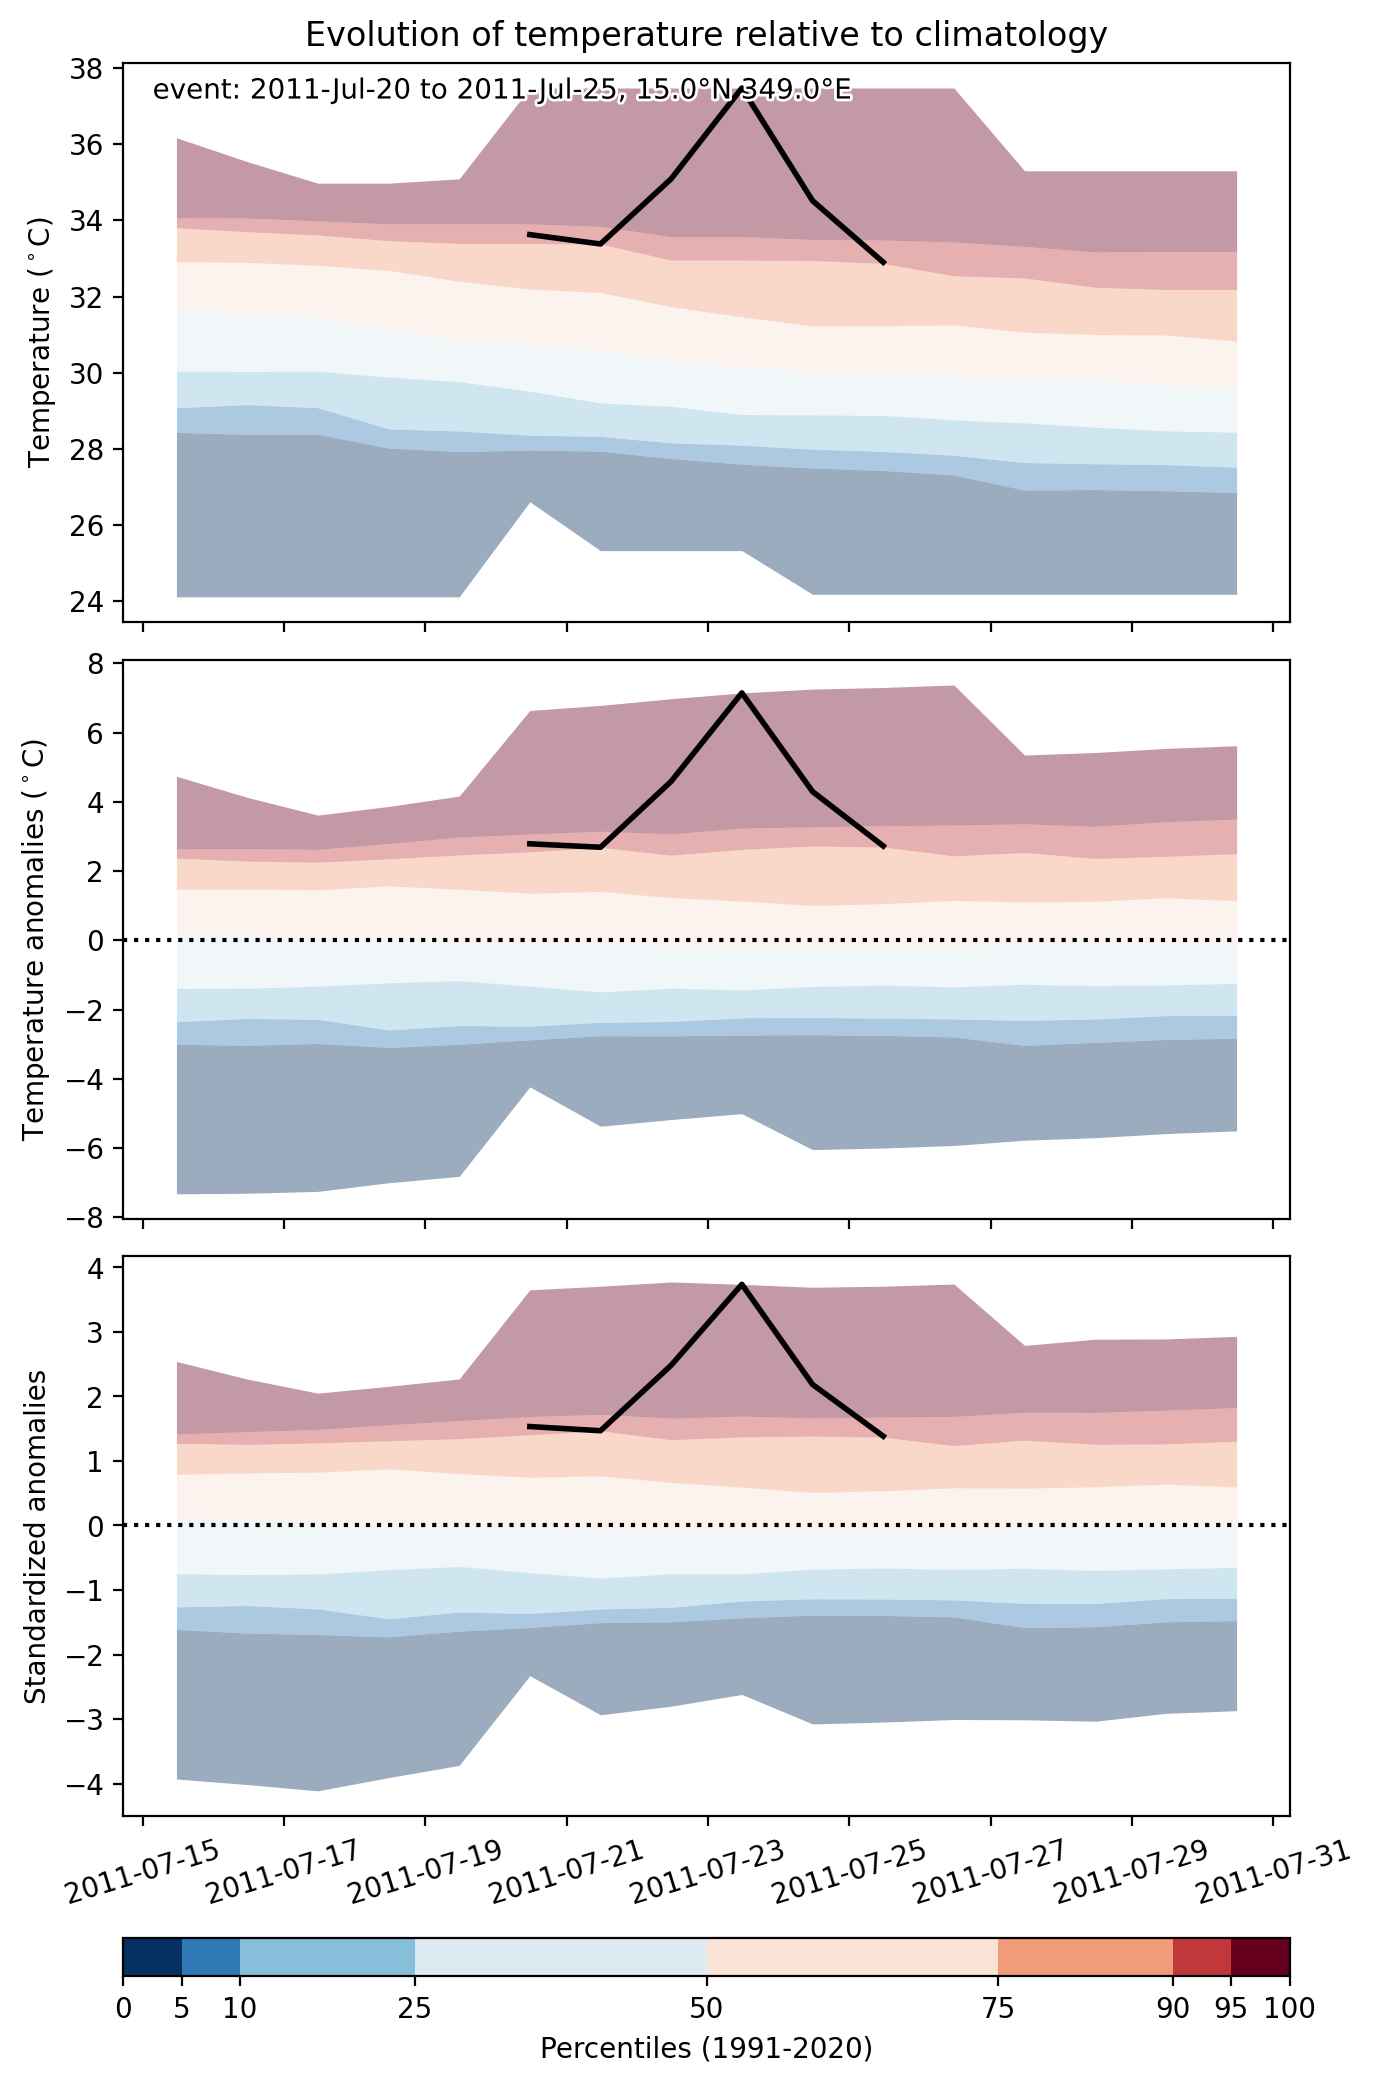
Fig. 2: Evolution of temperature at the center of the event. The climatological percentile distribution is illustrated with color shadings.
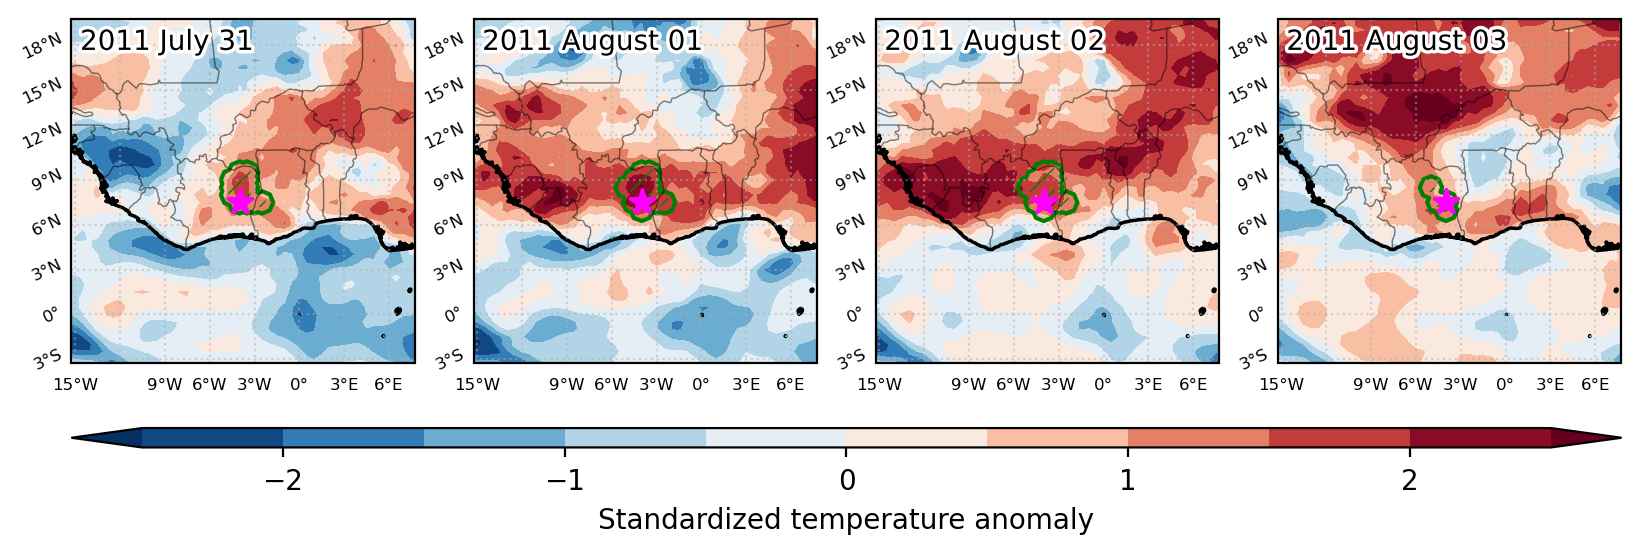


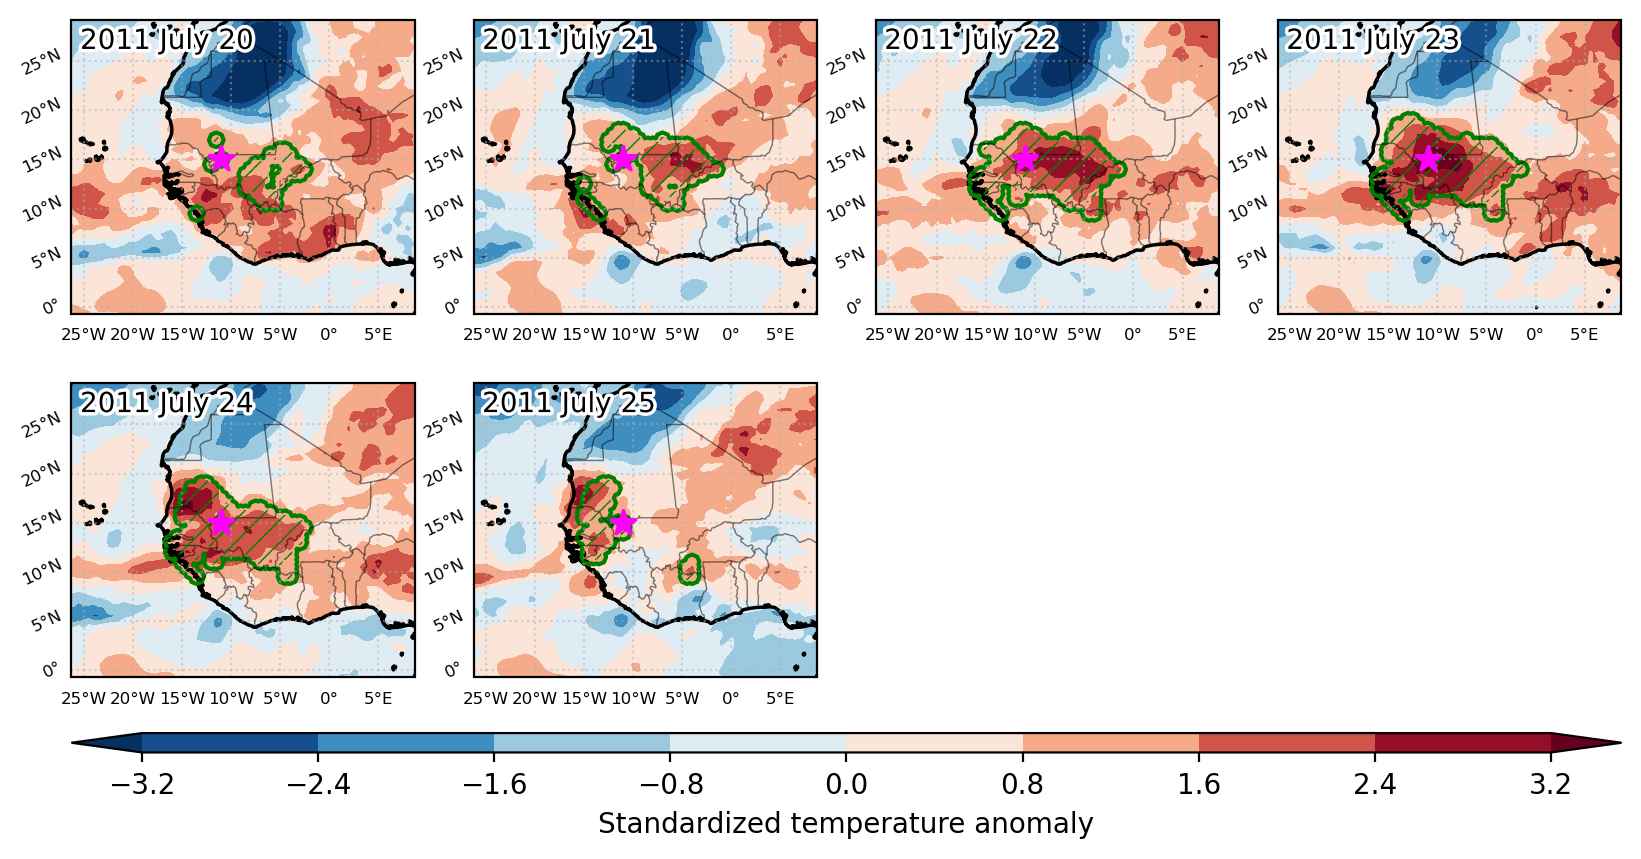
Fig. 3: Maps illustrating the evolution of standardized temperature anomalies during the event.

Event ID: Heat_wave_2011-Jul-31_to_2011-Aug-03_356.0_7.5
Heat wave occuring from July 20 2011 to July 25 2011 at 15.0°N 349.0°E

Download data: JSON

Event type: Heat wave

Countries affected (identified with ArcGIS Online; provided only for geographical reference):

  • Burkina Faso
  • Côte d’Ivoire
  • Gambia
  • Guinea
  • Guinea-Bissau
  • Mali
  • Mauritania
  • Senegal

Duration: 6 days

Time span: July 20 2011 to July 25 2011

Statistics over entire affected area:

  • Mean temperature anomaly: 3.0 °C
  • Mean temperature: 31.7 °C
  • Maximum temperature anomaly: 7.1 °C
  • Maximum temperature: 38.4 °C

Event center: 15.0°N 349.0°E

Area affected: 904208 km$^2$


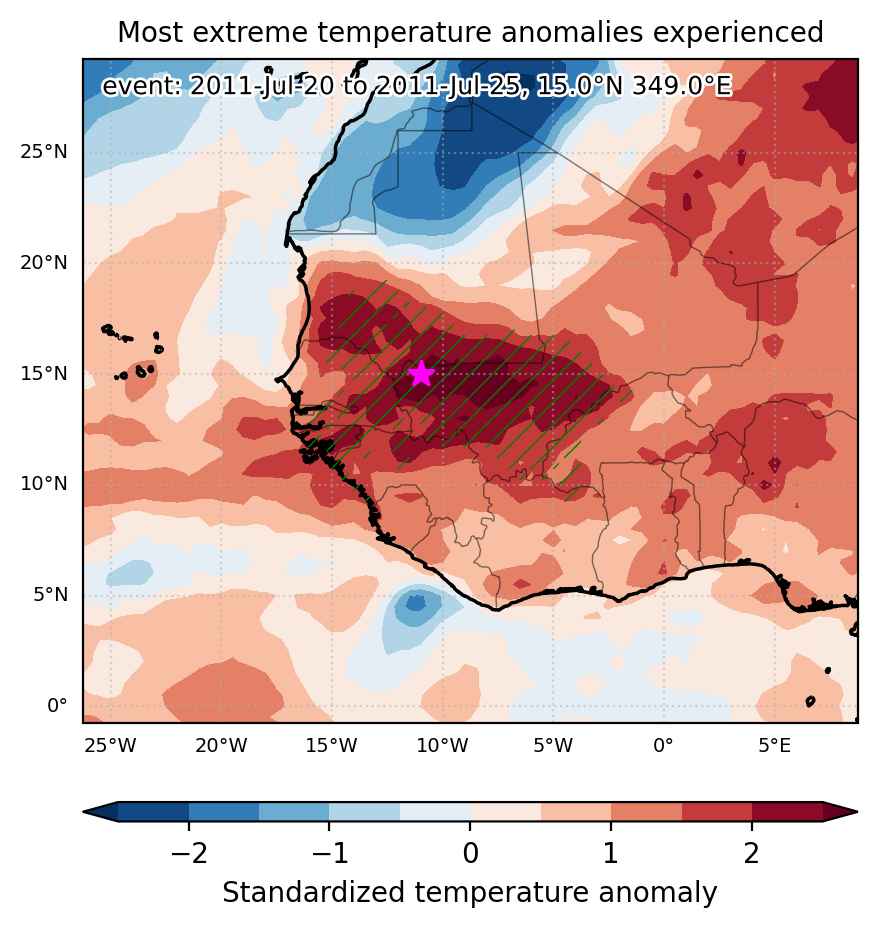
Fig. 1: Map of most extreme temperature anomalies (standardized) experienced during the event. The purple star indicates the center of the extreme event. Green hatching illustrates all areas under the effect of extremes at some time during the event.


Fig. 2: Evolution of temperature at the center of the event. The climatological percentile distribution is illustrated with color shadings.


Fig. 3: Maps illustrating the evolution of standardized temperature anomalies during the event.

Event ID: Heat_wave_2011-Jul-20_to_2011-Jul-25_349.0_15.0

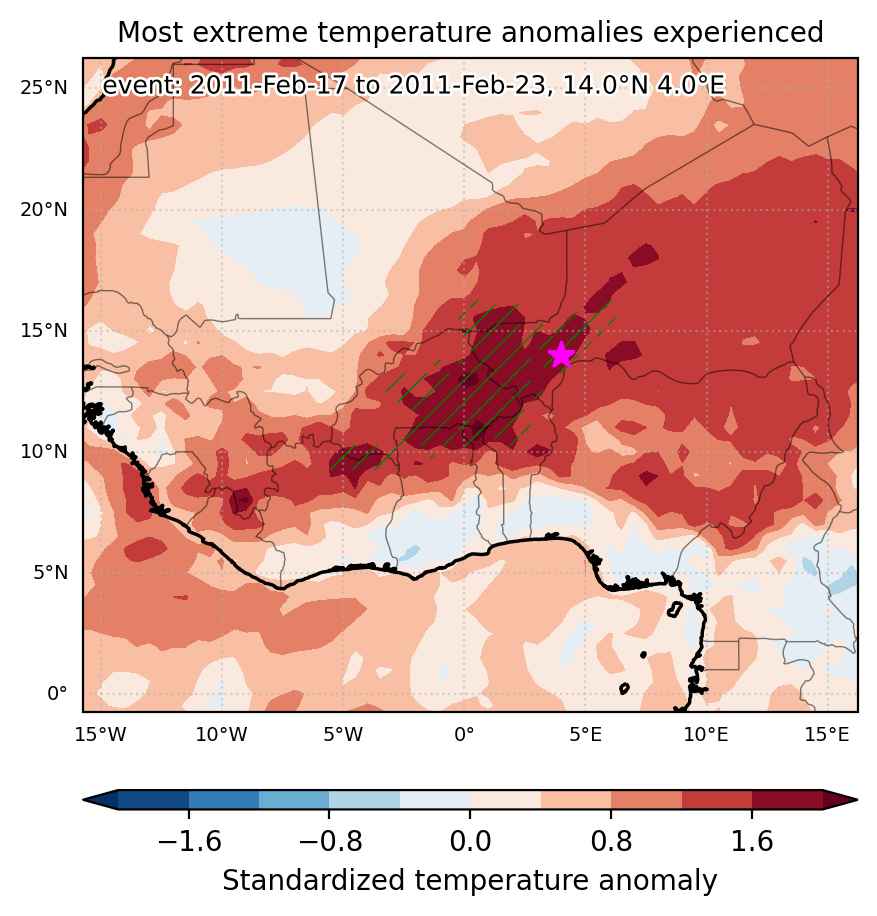
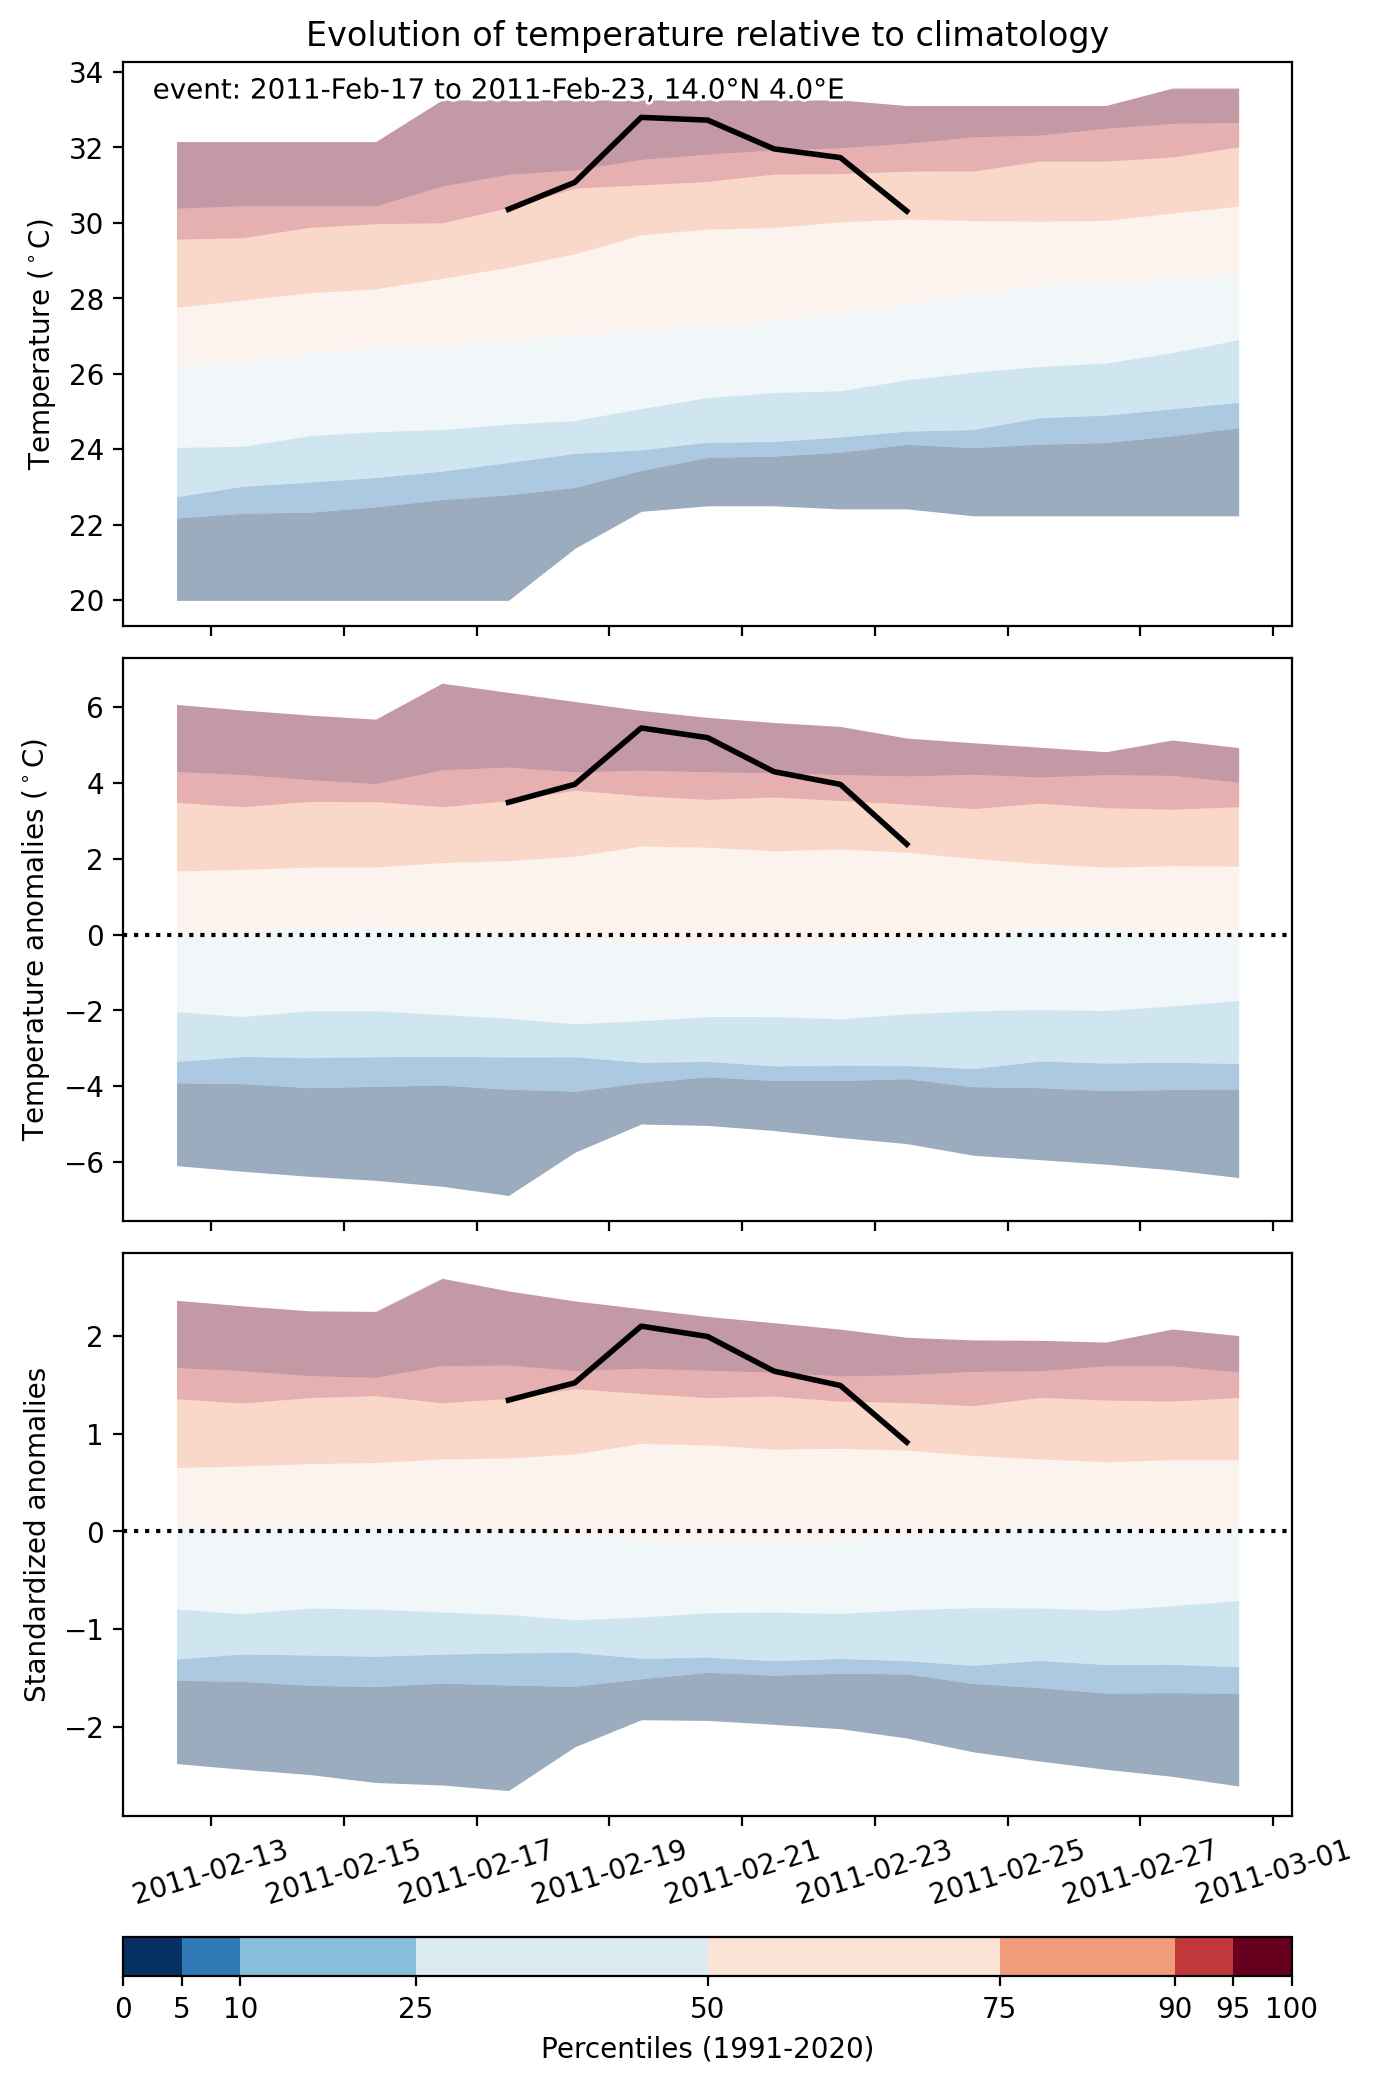
Heat wave occuring from February 17 2011 to February 23 2011 at 14.0°N 4.0°E

Download data: JSON

Event type: Heat wave

Countries affected (identified with ArcGIS Online; provided only for geographical reference):

  • Benin
  • Burkina Faso
  • Côte d’Ivoire
  • Ghana
  • Mali
  • Niger
  • Togo

Duration: 7 days

Time span: February 17 2011 to February 23 2011

Statistics over entire affected area:

  • Mean temperature anomaly: 3.5 °C
  • Mean temperature: 32.0 °C
  • Maximum temperature anomaly: 5.4 °C
  • Maximum temperature: 35.3 °C

Event center: 14.0°N 4.0°E

Area affected: 379568 km$^2$


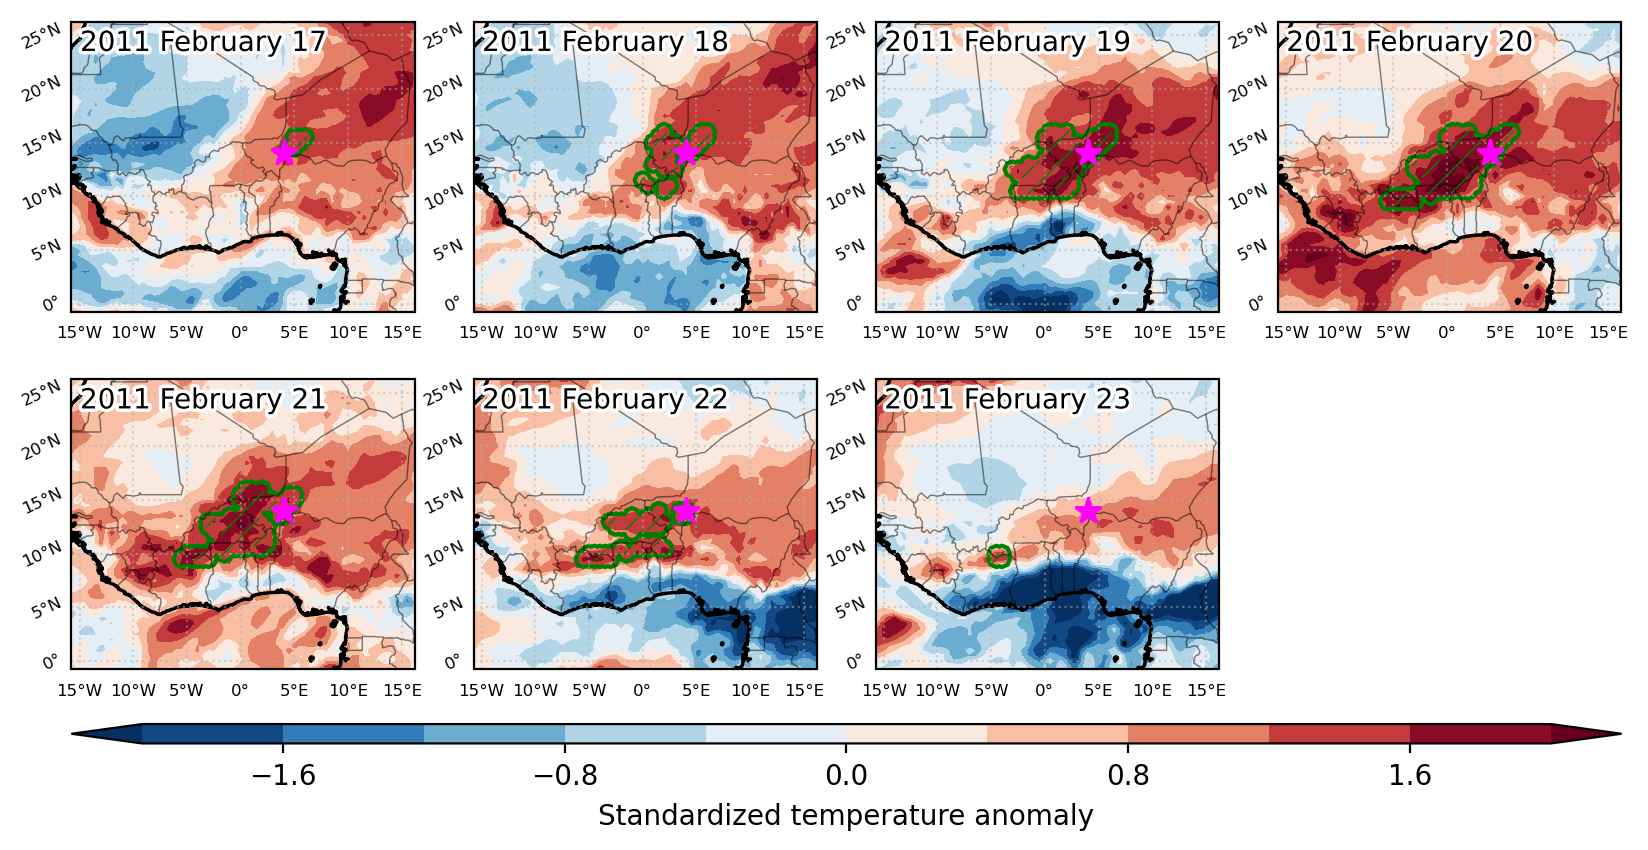
Fig. 1: Map of most extreme temperature anomalies (standardized) experienced during the event. The purple star indicates the center of the extreme event. Green hatching illustrates all areas under the effect of extremes at some time during the event.


Fig. 2: Evolution of temperature at the center of the event. The climatological percentile distribution is illustrated with color shadings.


Fig. 3: Maps illustrating the evolution of standardized temperature anomalies during the event.

Event ID: Heat_wave_2011-Feb-17_to_2011-Feb-23_4.0_14.0

Heat wave occuring from January 20 2011 to February 09 2011 at 22.5°N 359.0°E

Download data: JSON

Event type: Heat wave

Countries affected (identified with ArcGIS Online; provided only for geographical reference):

  • Algeria
  • Benin
  • Burkina Faso
  • Cameroon
  • Chad
  • Côte d’Ivoire
  • Egypt
  • Eritrea
  • Ethiopia
  • Ghana
  • Guinea
  • Libya
  • Mali
  • Mauritania
  • Niger
  • Nigeria
  • Saudi Arabia
  • Senegal
  • Sierra Leone
  • Sudan
  • Togo
  • Tunisia

Duration: 21 days

Time span: January 20 2011 to February 09 2011

Statistics over entire affected area:

  • Mean temperature anomaly: 5.6 °C
  • Mean temperature: 23.2 °C
  • Maximum temperature anomaly: 11.7 °C
  • Maximum temperature: 32.9 °C

Event center: 22.5°N 1.0°W

Area affected: 9975057 km$^2$


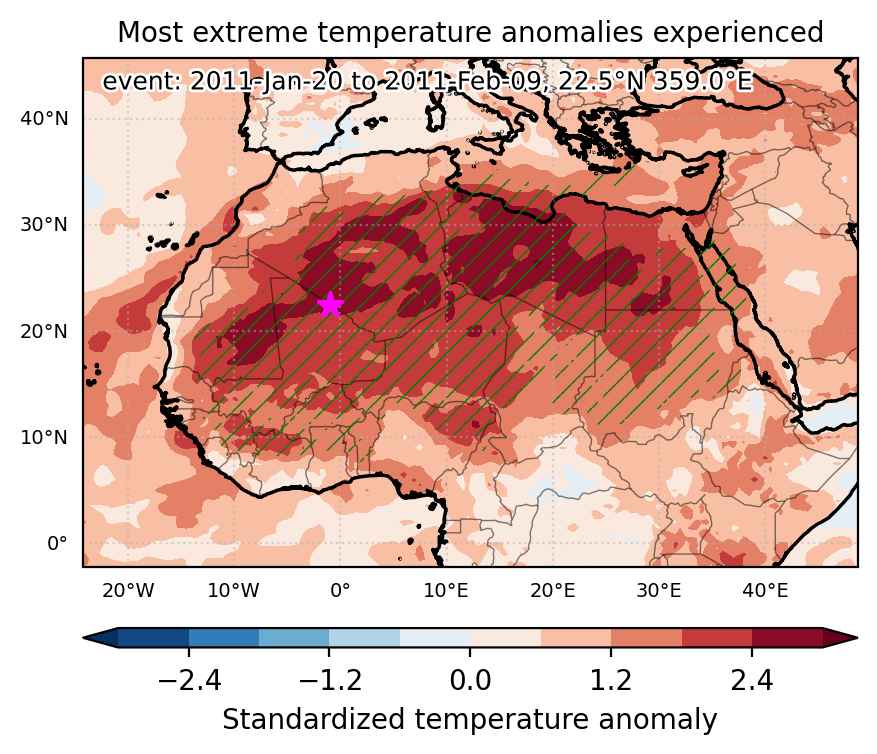
Fig. 1: Map of most extreme temperature anomalies (standardized) experienced during the event. The purple star indicates the center of the extreme event. Green hatching illustrates all areas under the effect of extremes at some time during the event.


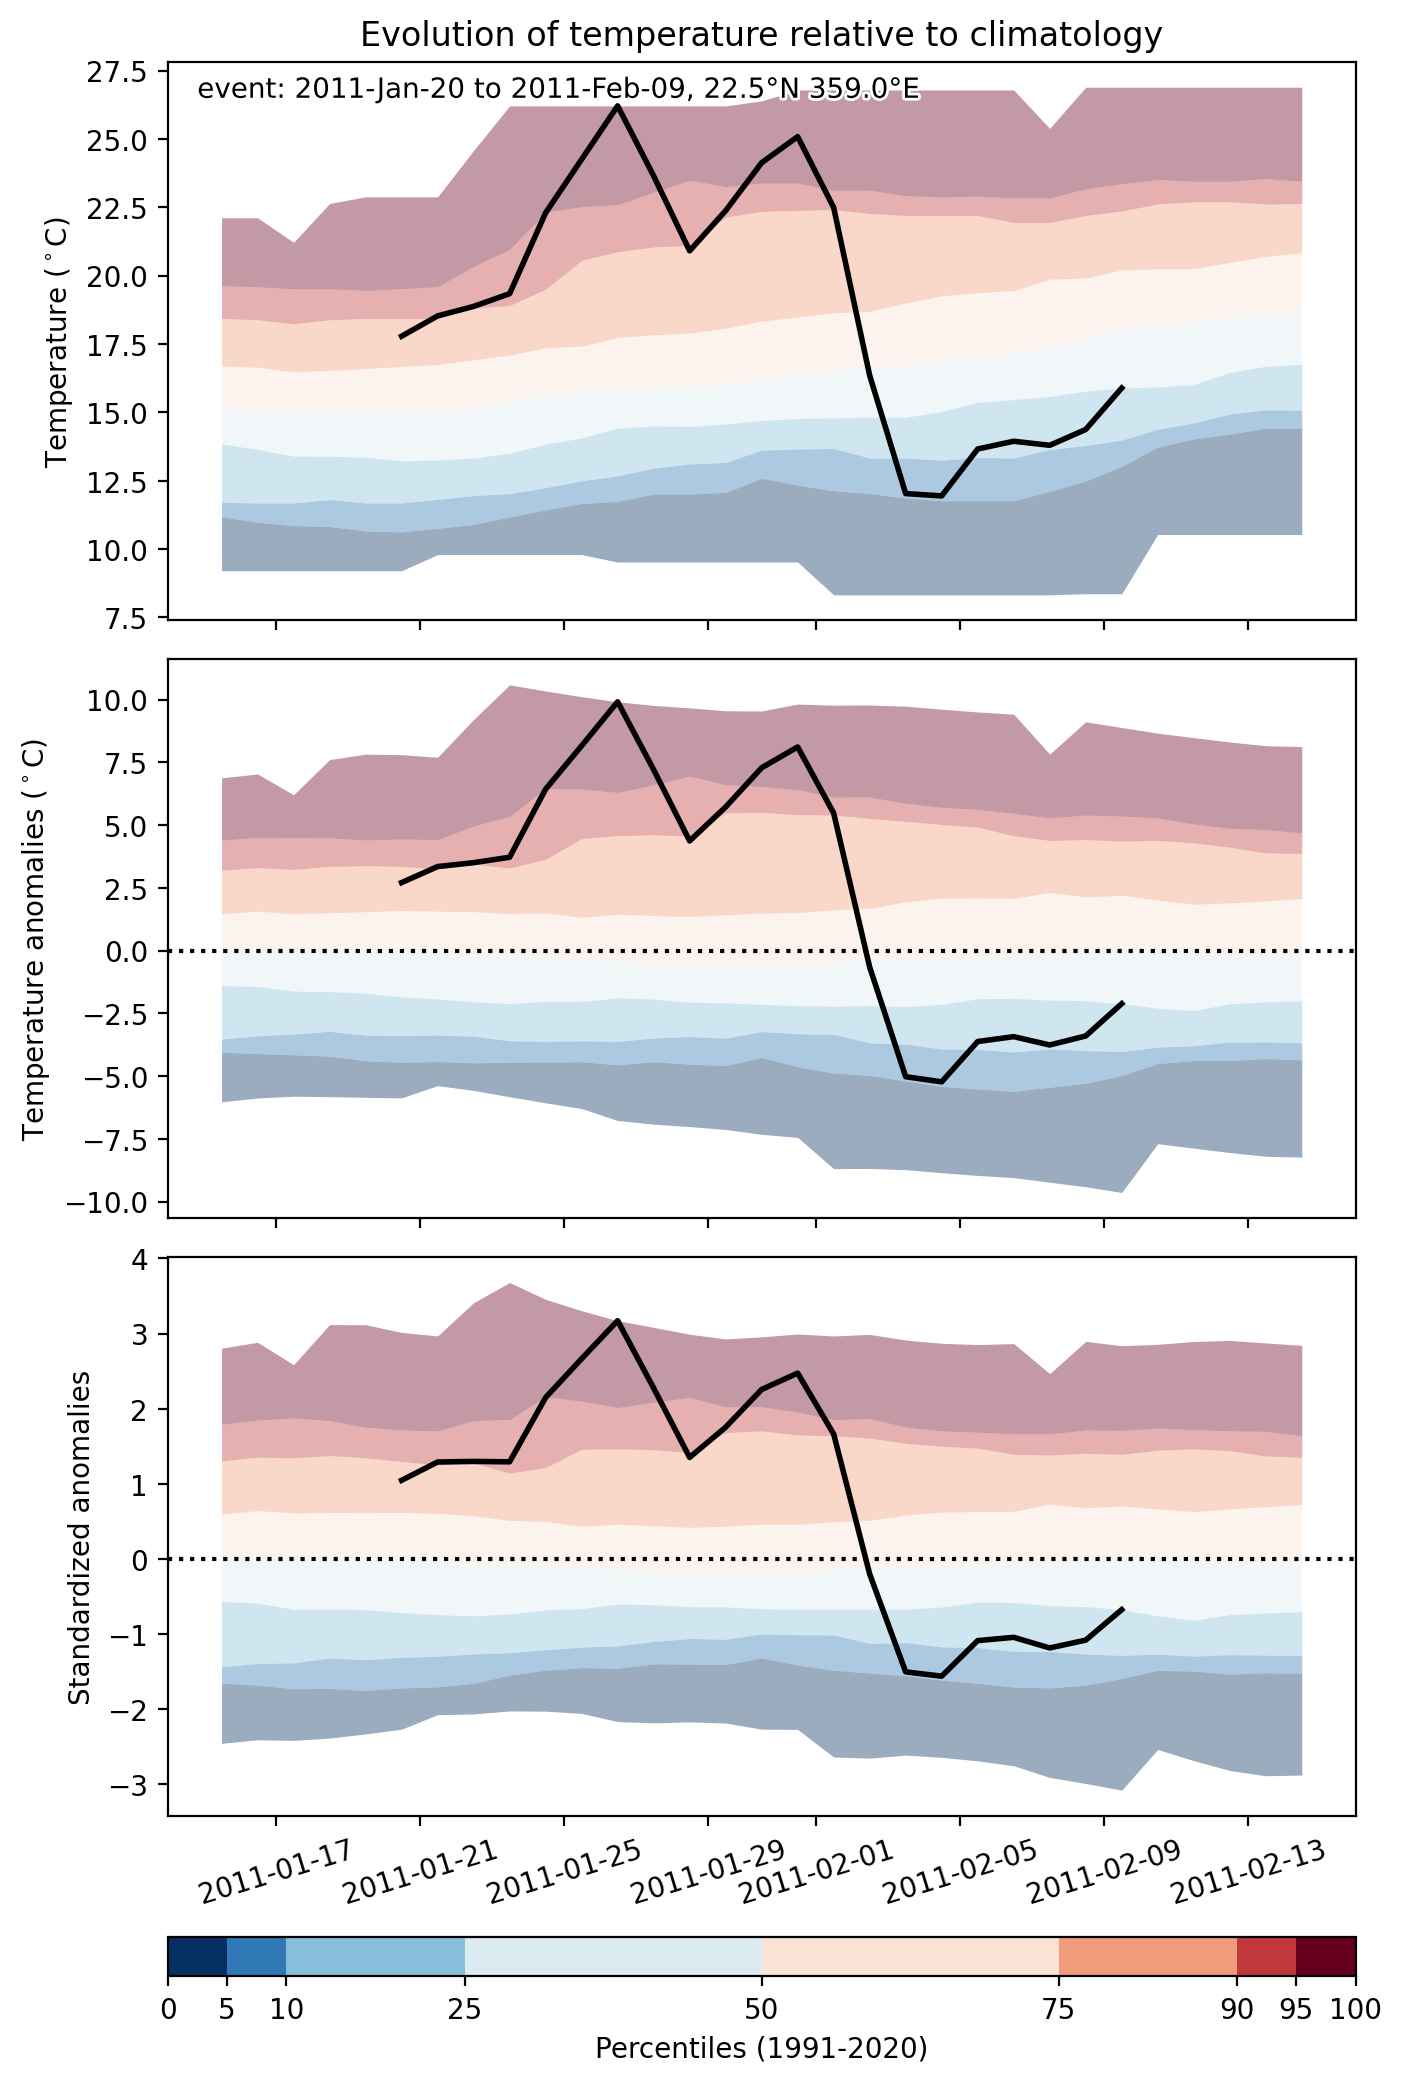
Fig. 2: Evolution of temperature at the center of the event. The climatological percentile distribution is illustrated with color shadings.


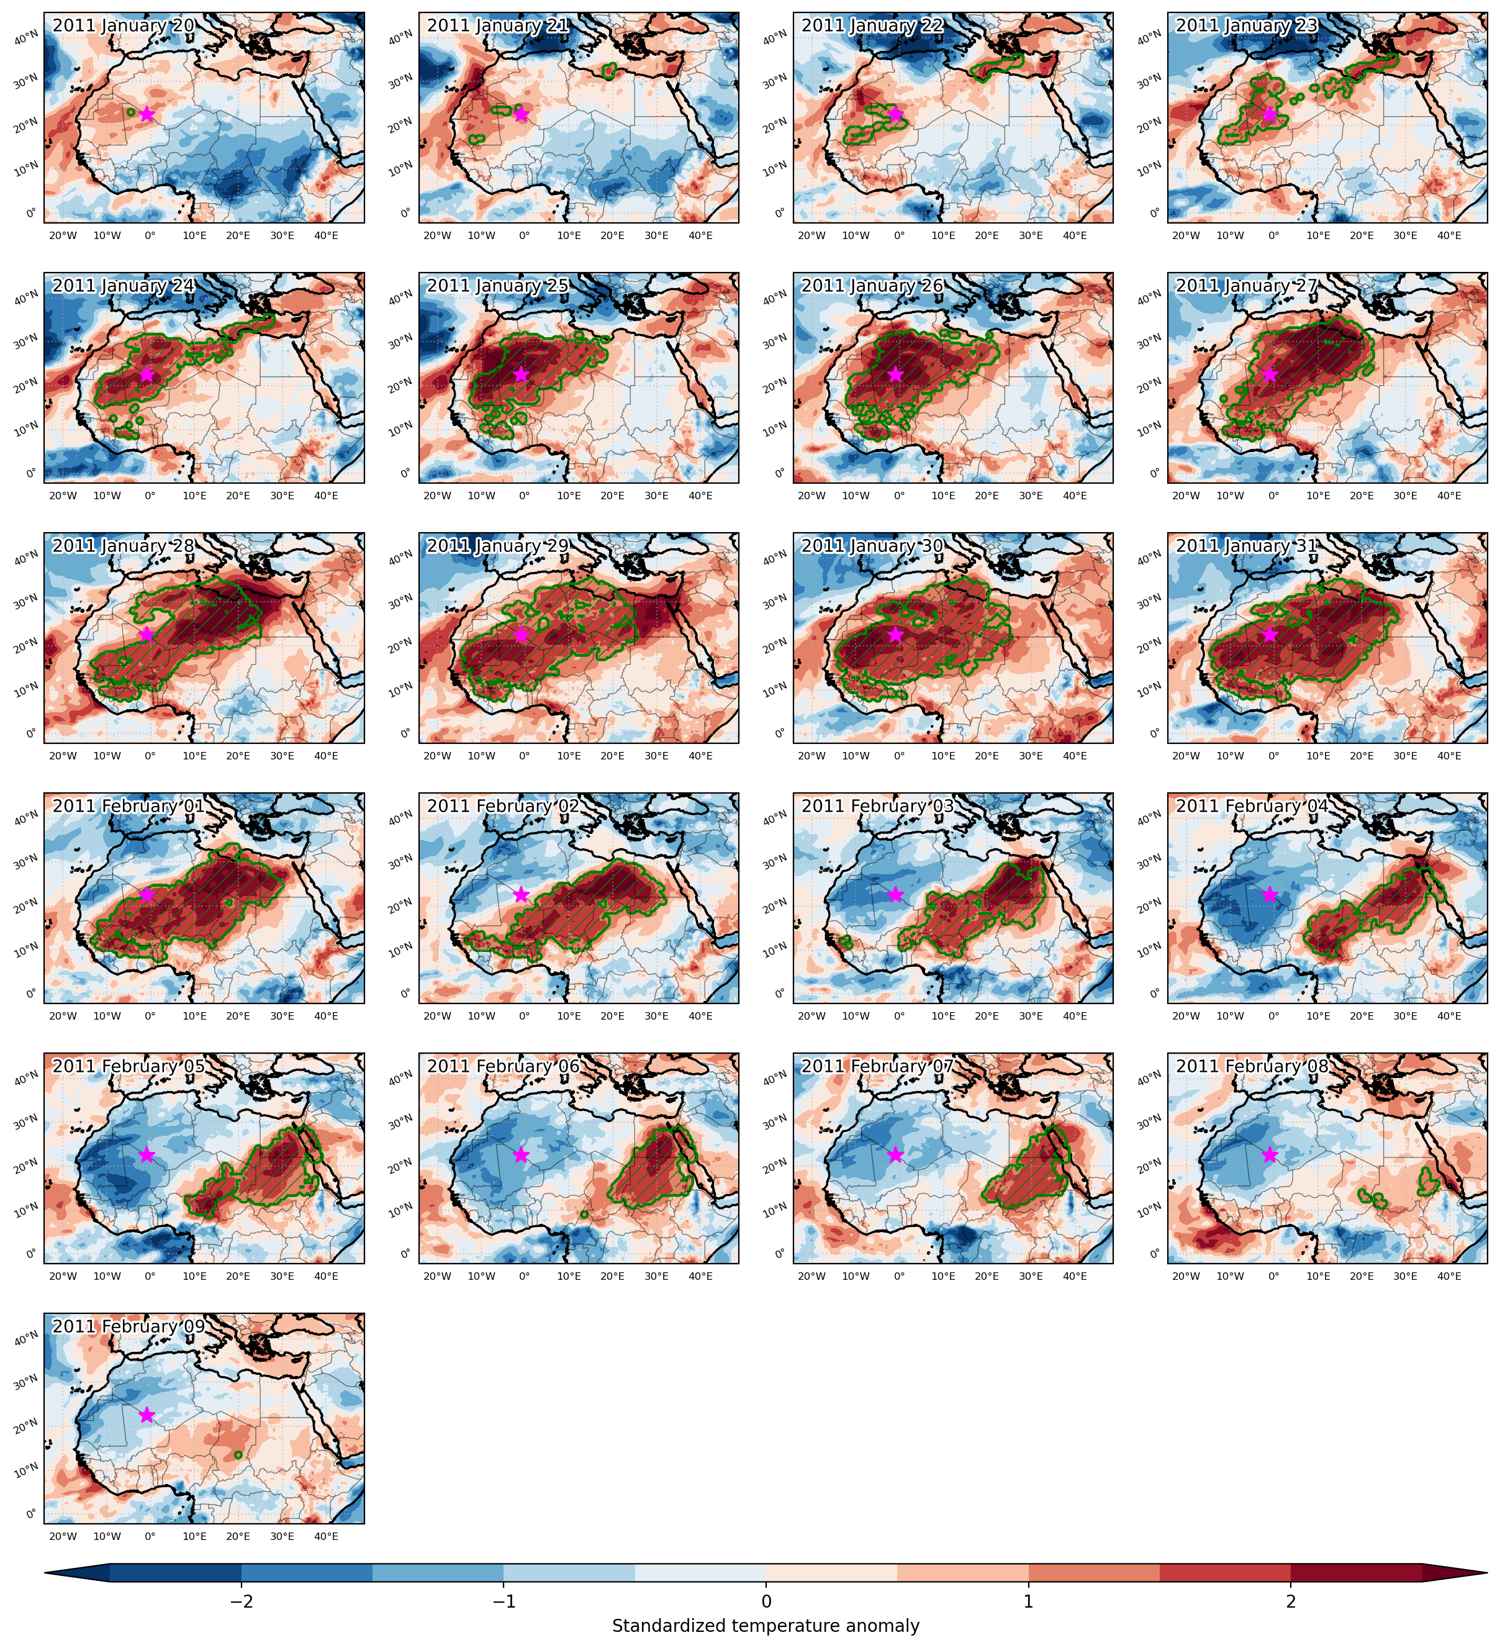
Fig. 3: Maps illustrating the evolution of standardized temperature anomalies during the event.

Event ID: Heat_wave_2011-Jan-20_to_2011-Feb-09_359.0_22.5

Heat wave occuring from December 14 2010 to December 30 2010 at 9.0°N 353.0°E

Download data: JSON

Event type: Heat wave

Countries affected (identified with ArcGIS Online; provided only for geographical reference):

  • Benin
  • Burkina Faso
  • Côte d’Ivoire
  • Ghana
  • Guinea
  • Liberia
  • Mali
  • Nigeria
  • Togo

Duration: 17 days

Time span: December 14 2010 to December 30 2010

Statistics over entire affected area:

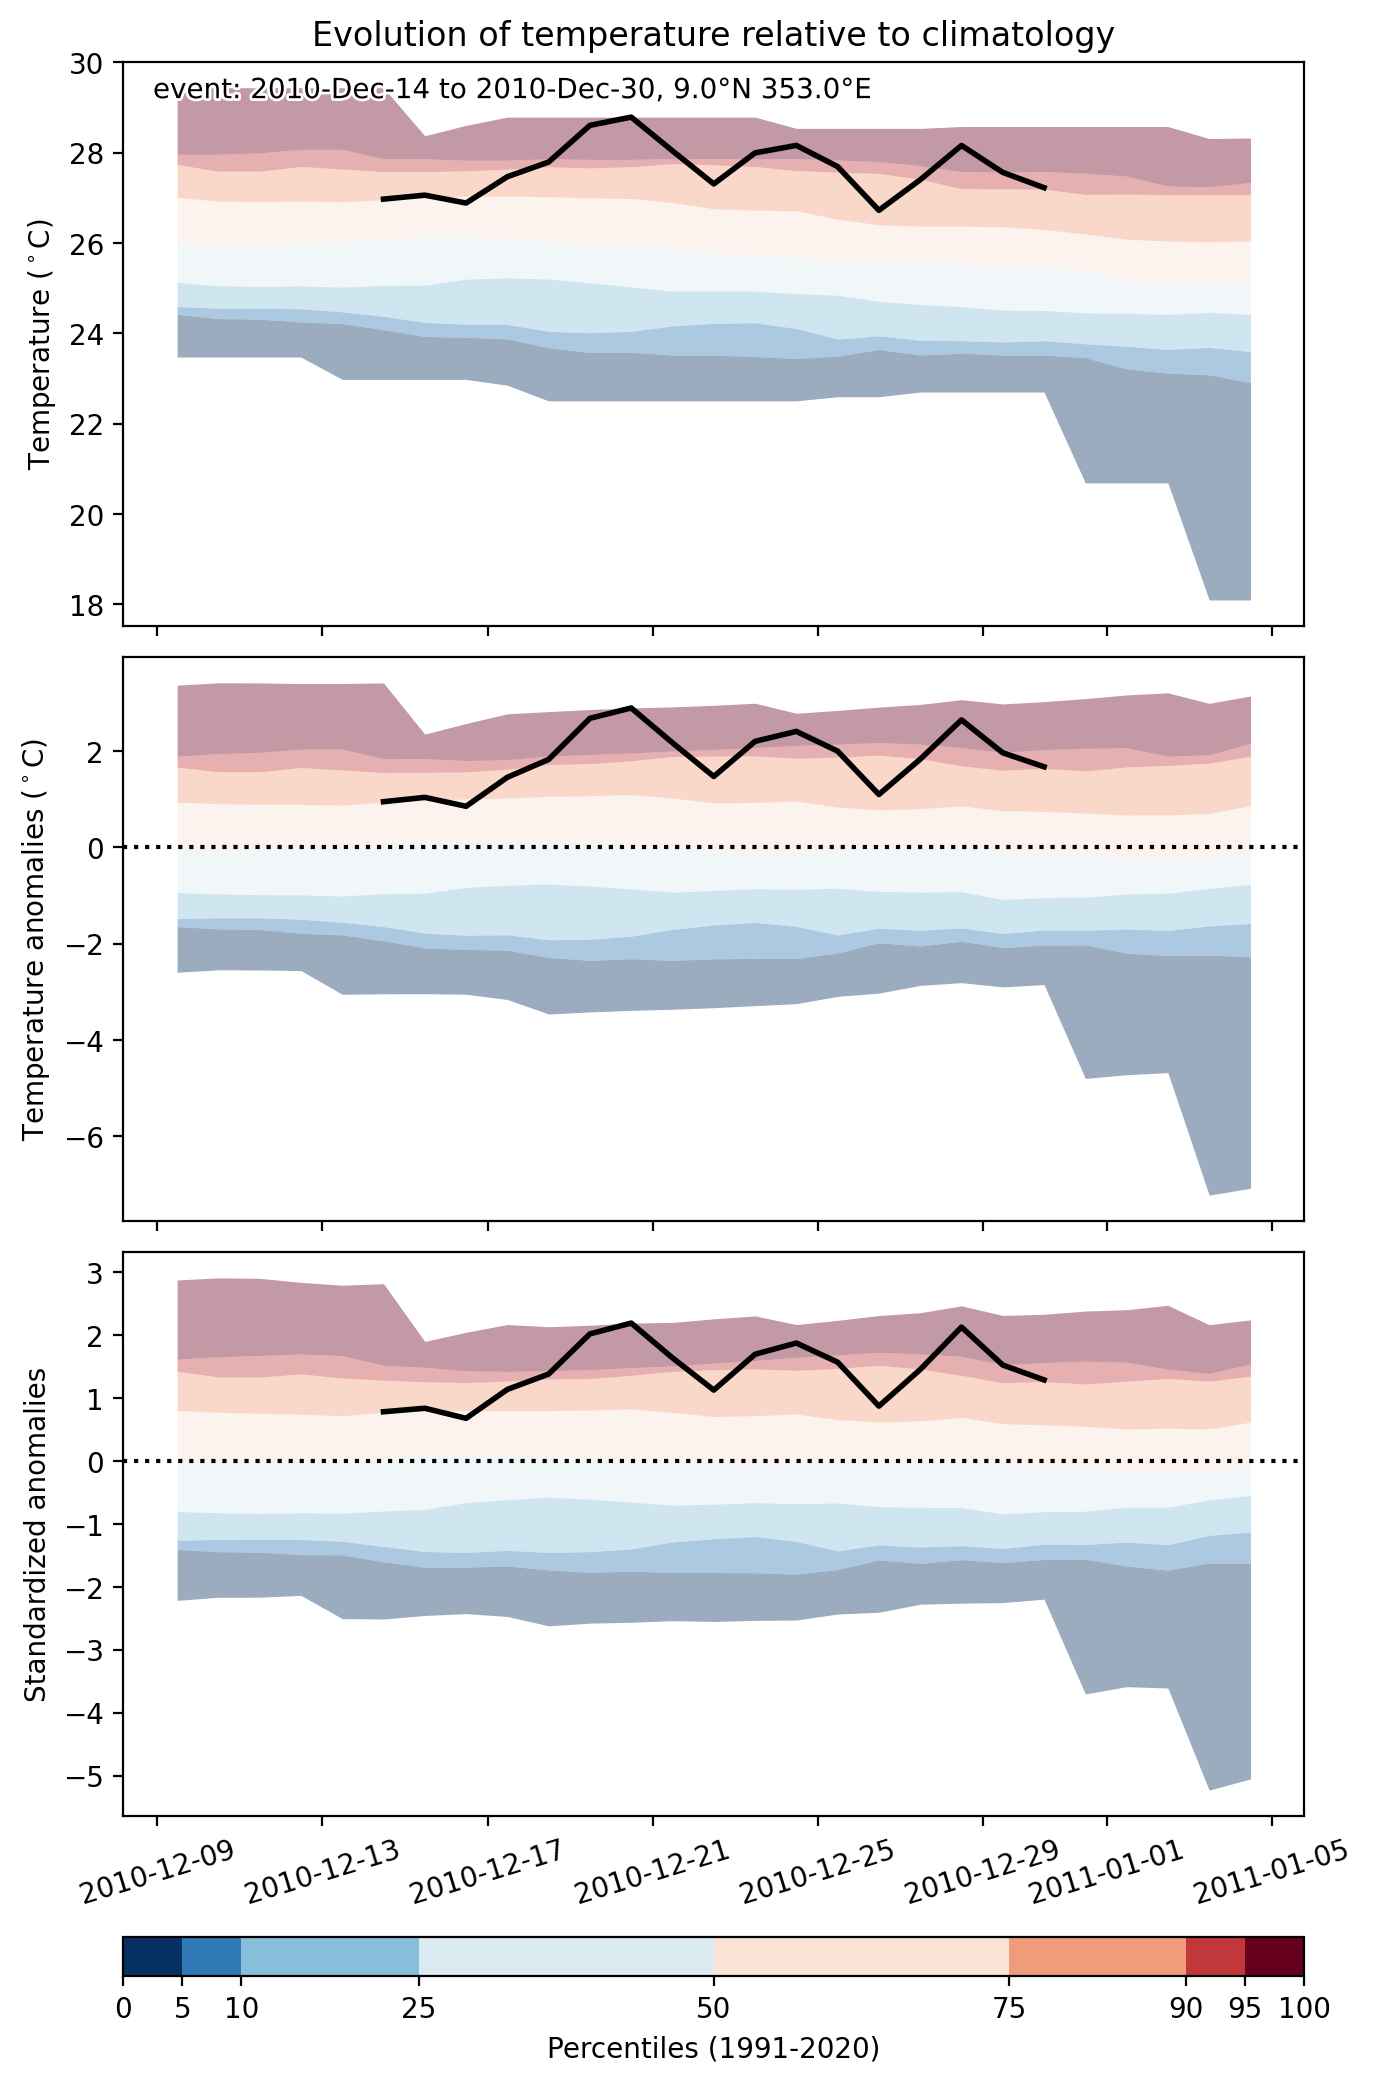
  • Mean temperature anomaly: 1.6 °C
  • Mean temperature: 27.9 °C
  • Maximum temperature anomaly: 3.3 °C
  • Maximum temperature: 30.7 °C

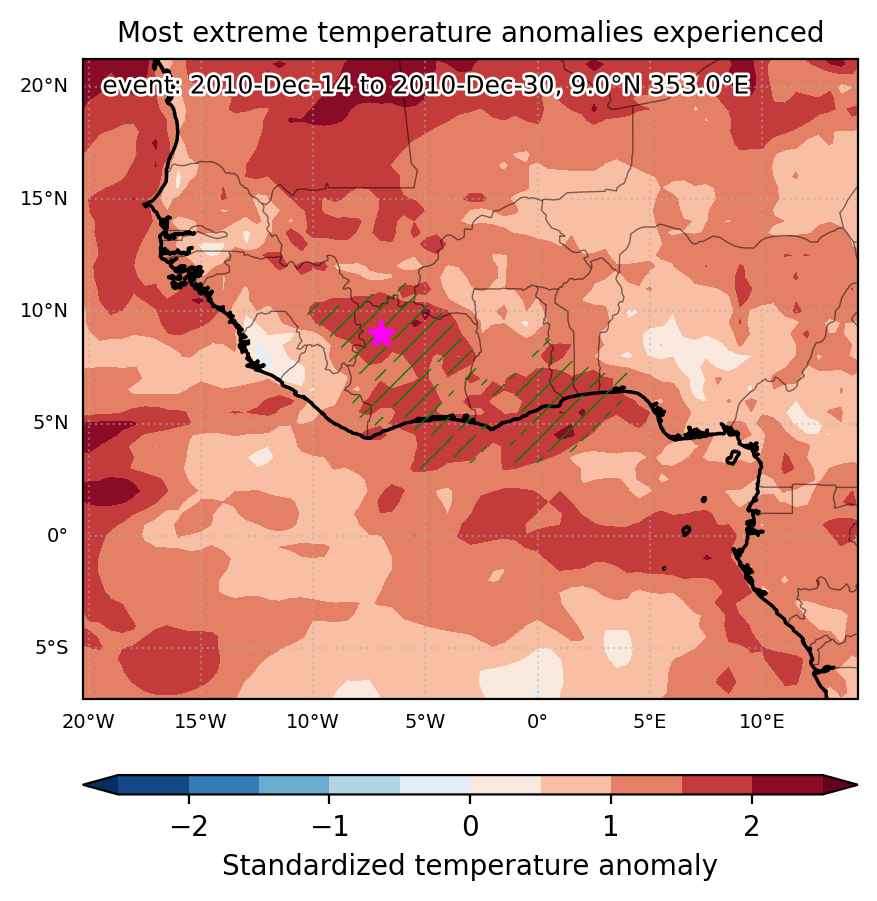
Event center: 9.0°N 353.0°E

Area affected: 579547 km$^2$


Fig. 1: Map of most extreme temperature anomalies (standardized) experienced during the event. The purple star indicates the center of the extreme event. Green hatching illustrates all areas under the effect of extremes at some time during the event.


Fig. 2: Evolution of temperature at the center of the event. The climatological percentile distribution is illustrated with color shadings.


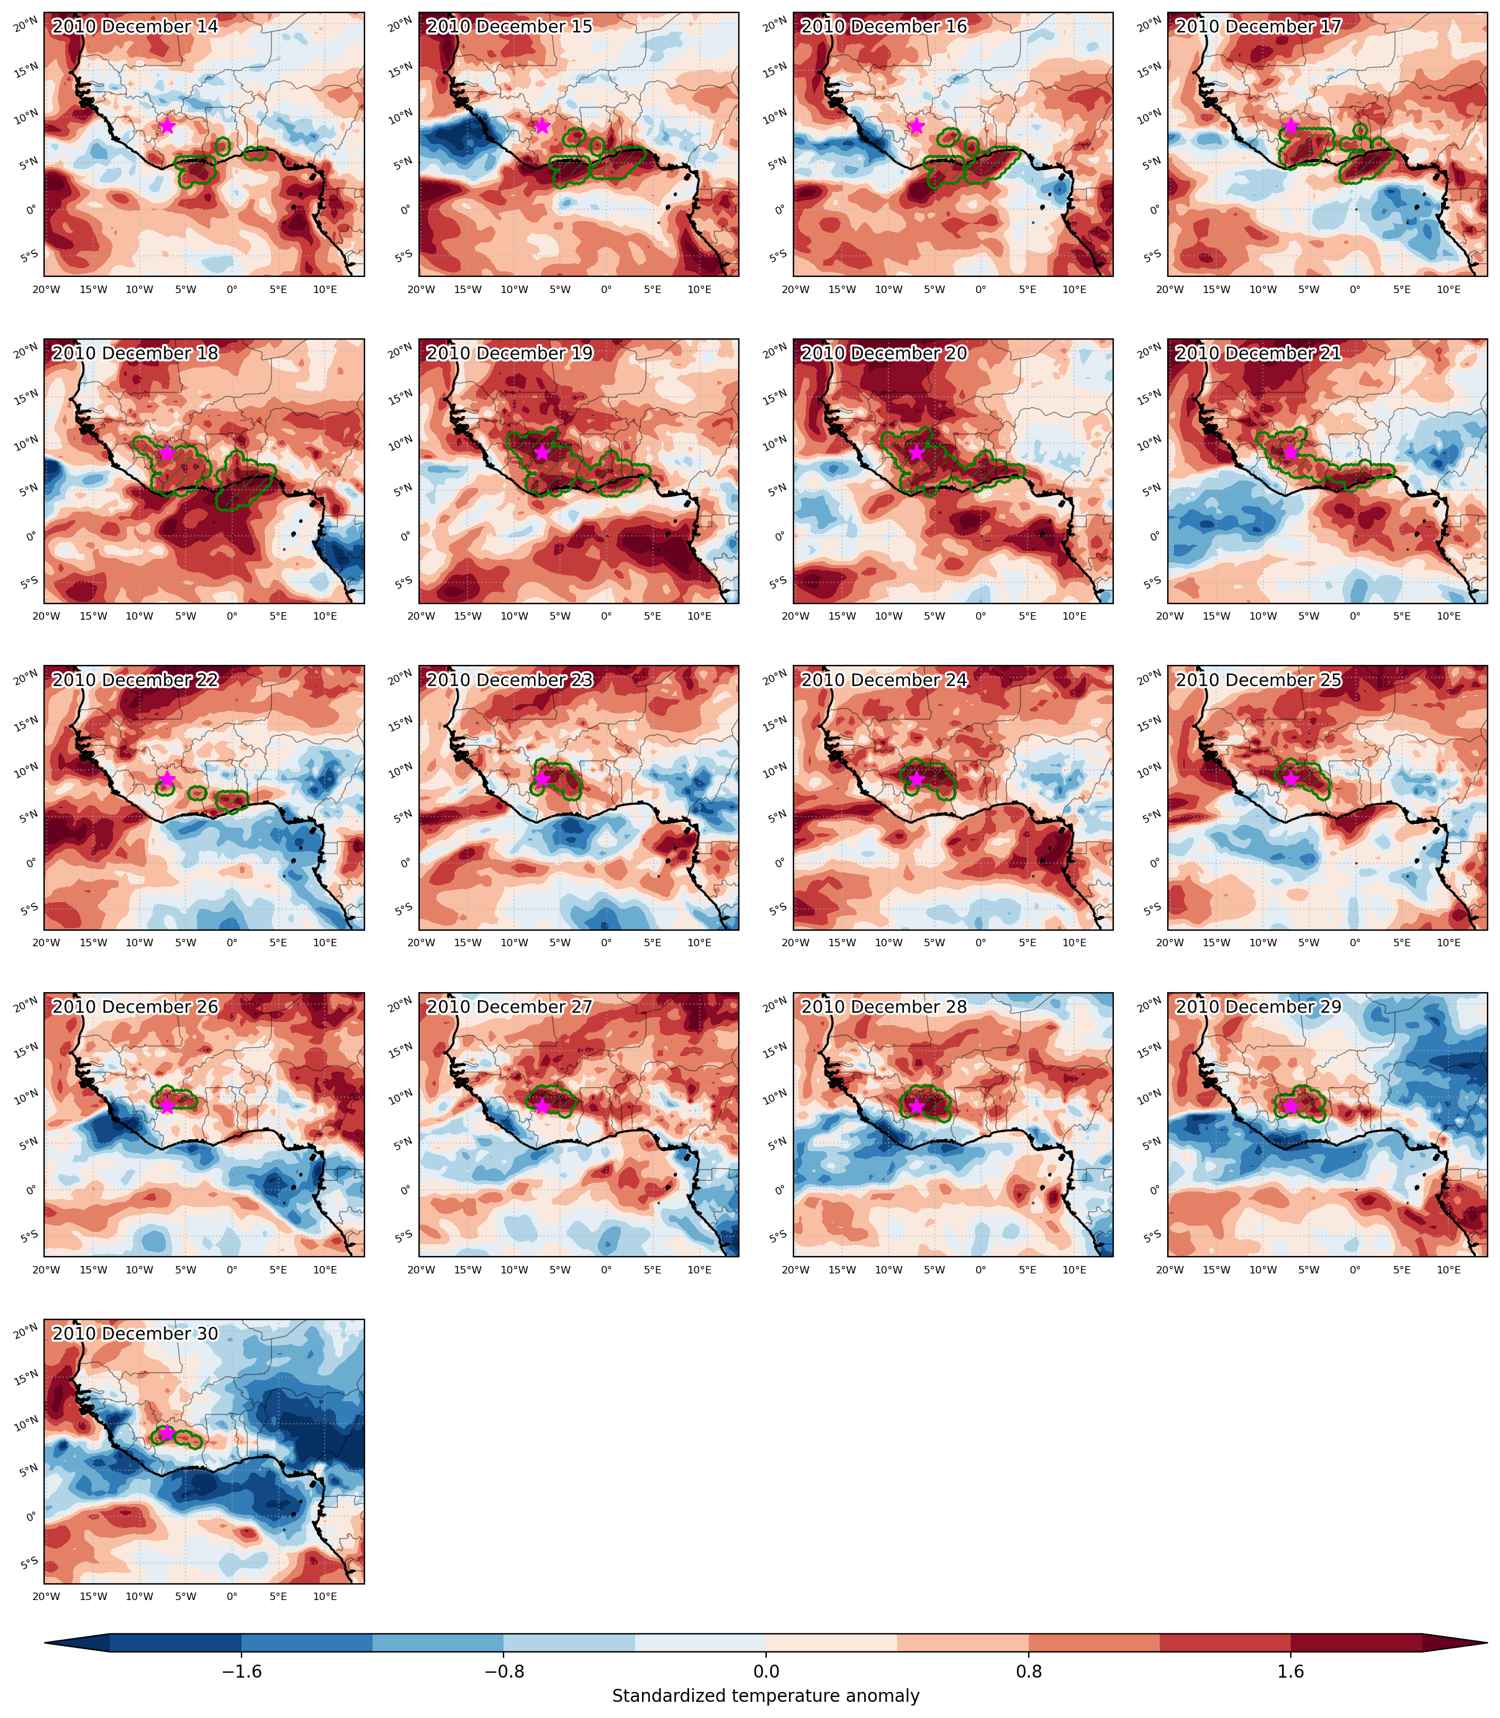
Fig. 3: Maps illustrating the evolution of standardized temperature anomalies during the event.

Event ID: Heat_wave_2010-Dec-14_to_2010-Dec-30_353.0_9.0

Heat wave occuring from September 27 2010 to September 30 2010 at 4.5°N 353.5°E

Download data: JSON

Event type: Heat wave

Countries affected (identified with ArcGIS Online; provided only for geographical reference):

  • Côte d’Ivoire

Duration: 4 days

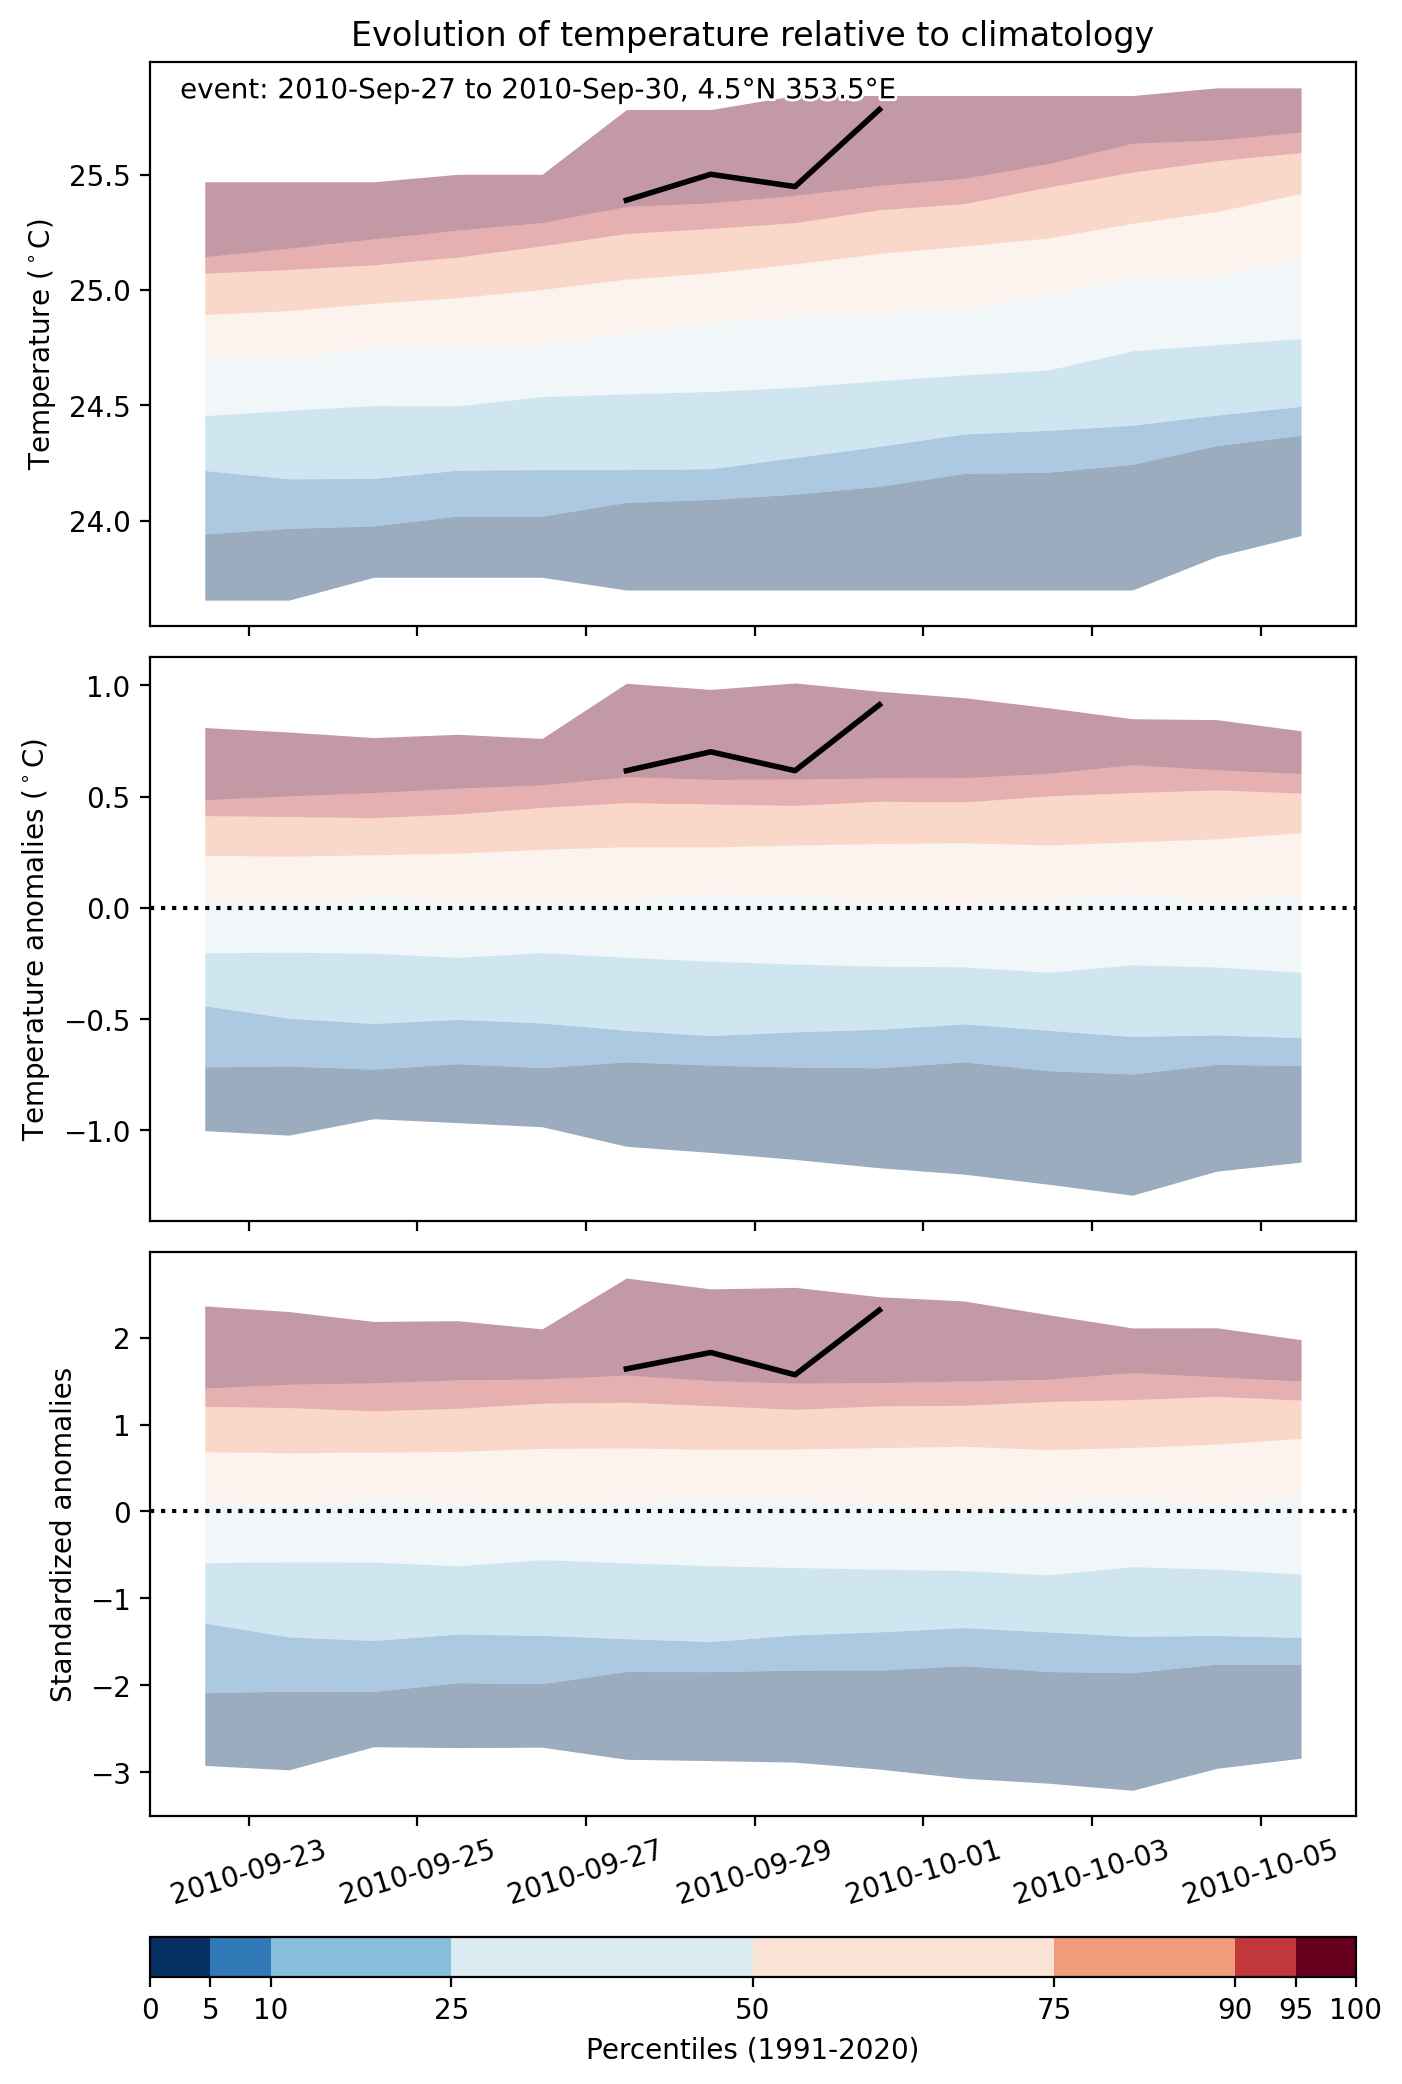
Time span: September 27 2010 to September 30 2010

Statistics over entire affected area:

  • Mean temperature anomaly: 0.7 °C
  • Mean temperature: 25.8 °C
  • Maximum temperature anomaly: 1.1 °C
  • Maximum temperature: 26.2 °C

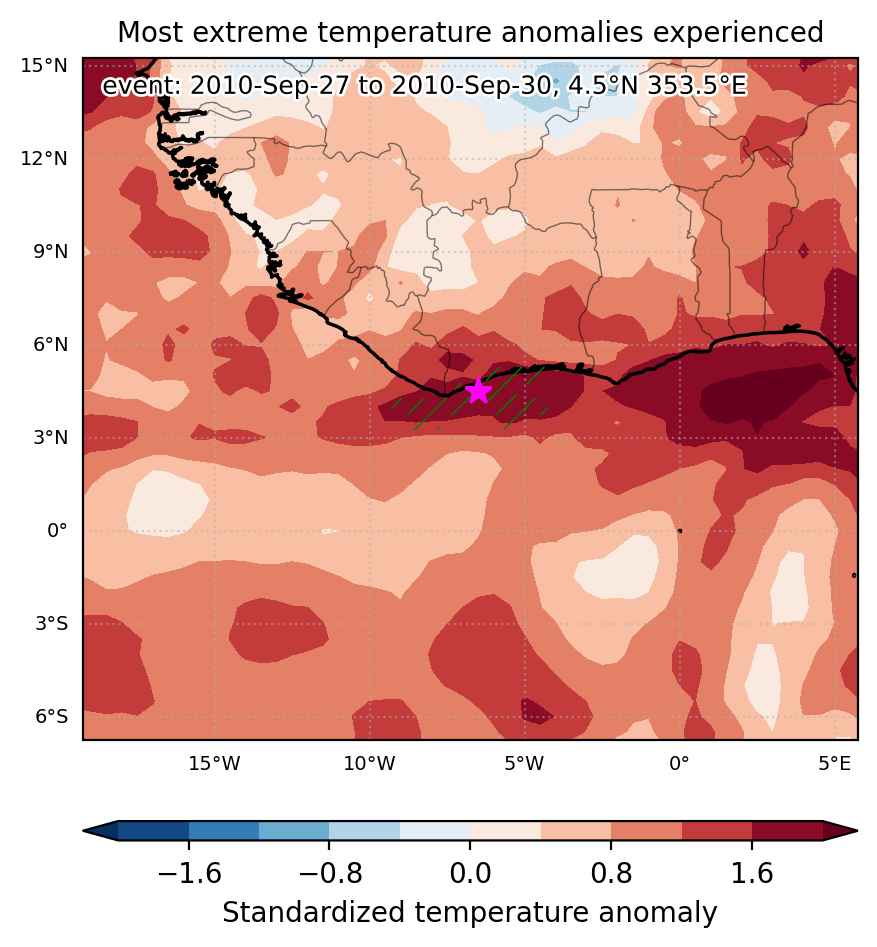
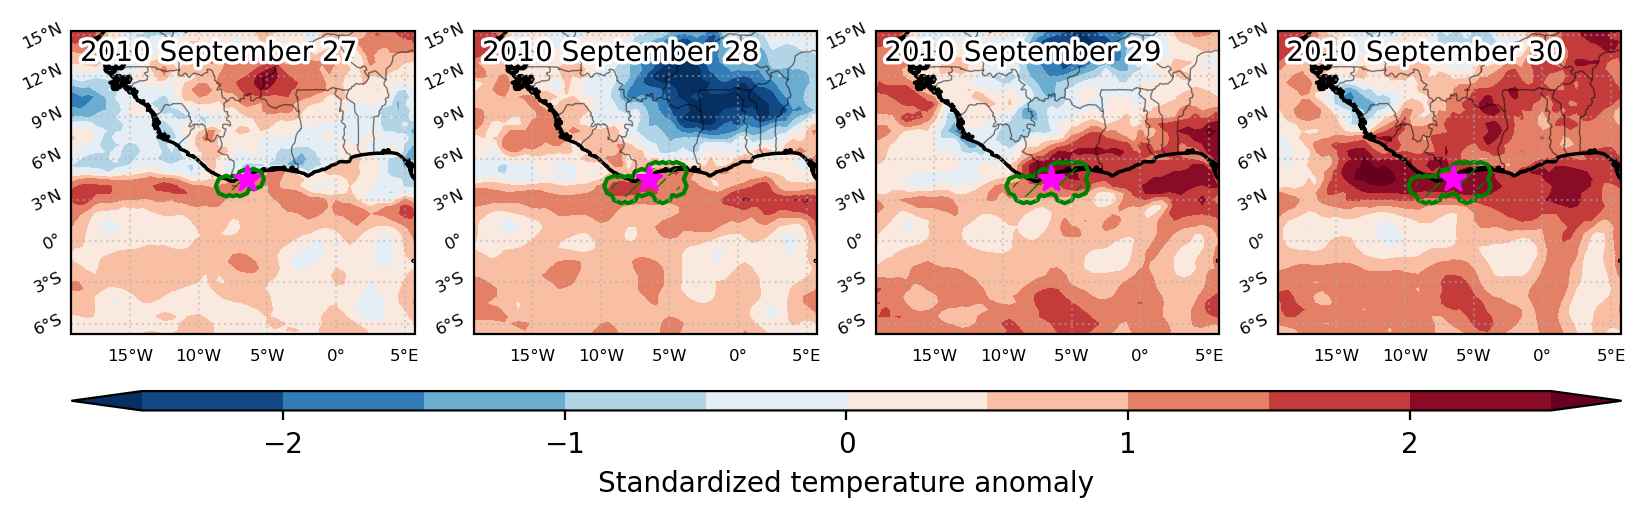
Event center: 4.5°N 353.5°E

Area affected: 61651 km$^2$


Fig. 1: Map of most extreme temperature anomalies (standardized) experienced during the event. The purple star indicates the center of the extreme event. Green hatching illustrates all areas under the effect of extremes at some time during the event.


Fig. 2: Evolution of temperature at the center of the event. The climatological percentile distribution is illustrated with color shadings.


Fig. 3: Maps illustrating the evolution of standardized temperature anomalies during the event.

Event ID: Heat_wave_2010-Sep-27_to_2010-Sep-30_353.5_4.5

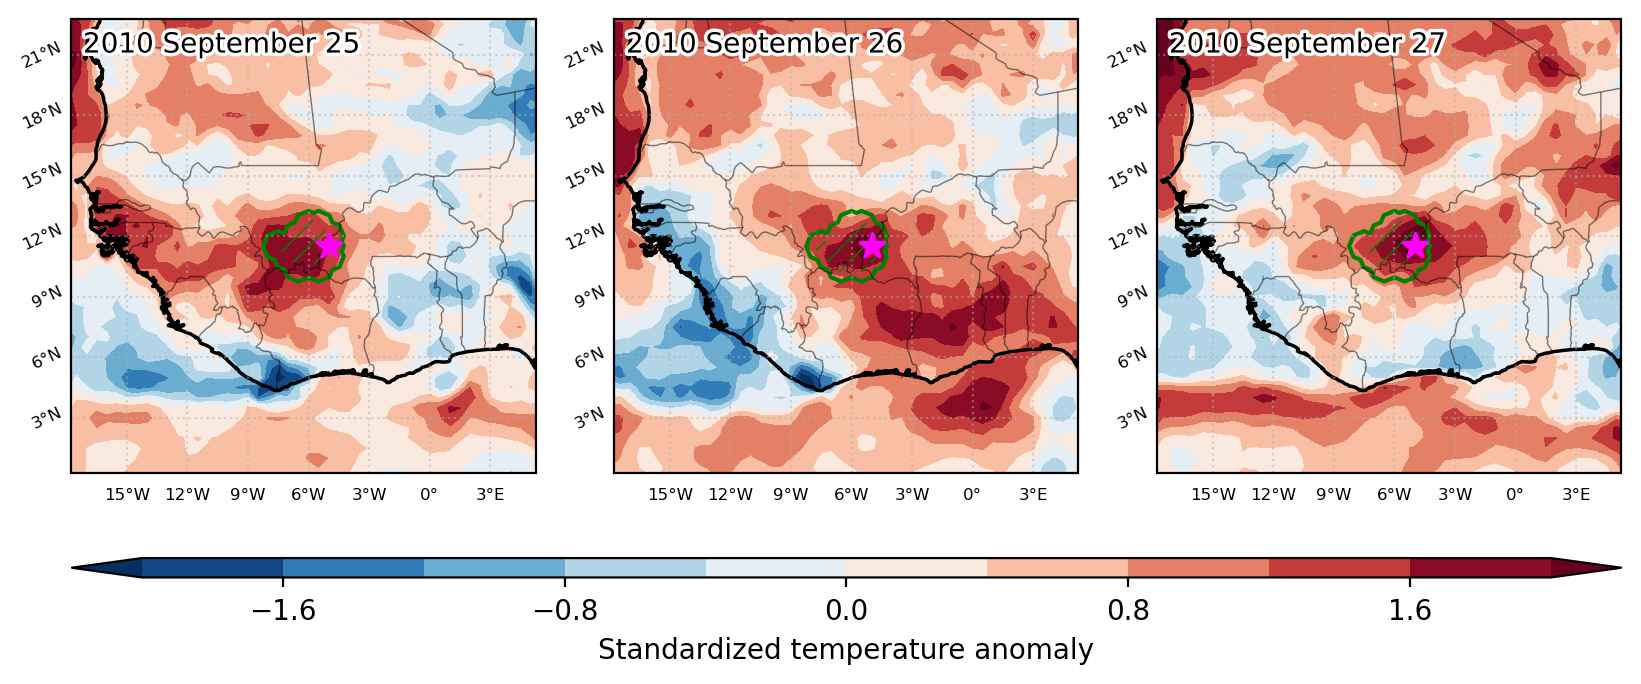
Heat wave occuring from September 25 2010 to September 27 2010 at 11.5°N 355.0°E

Download data: JSON

Event type: Heat wave

Countries affected (identified with ArcGIS Online; provided only for geographical reference):

  • Burkina Faso
  • Côte d’Ivoire
  • Mali

Duration: 3 days

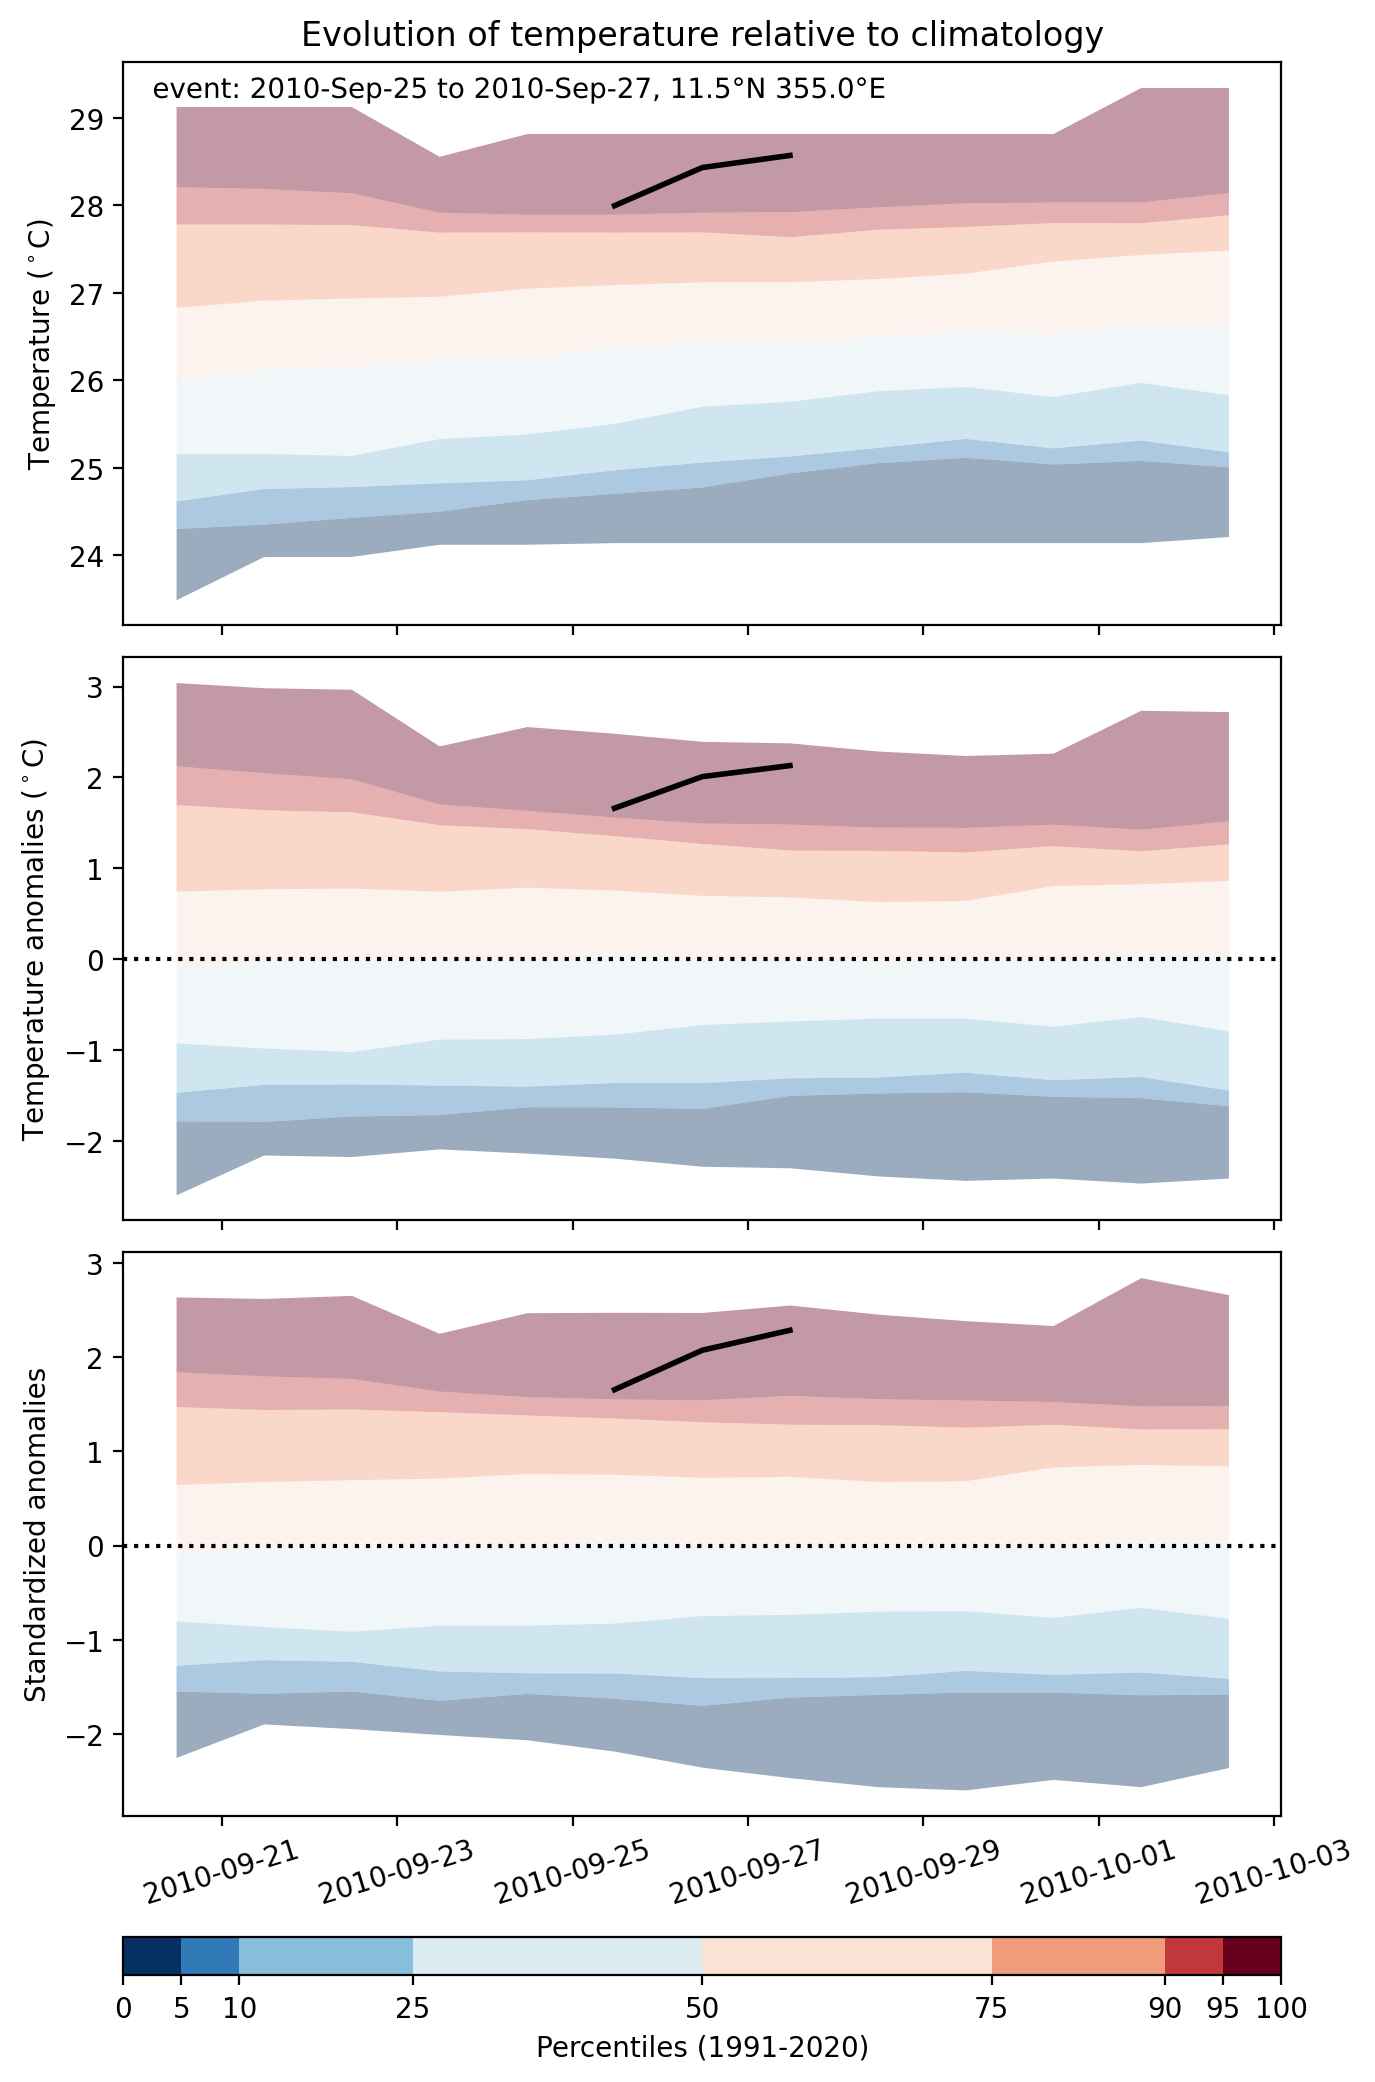
Time span: September 25 2010 to September 27 2010

Statistics over entire affected area:

  • Mean temperature anomaly: 1.7 °C
  • Mean temperature: 27.9 °C
  • Maximum temperature anomaly: 2.2 °C
  • Maximum temperature: 29.0 °C

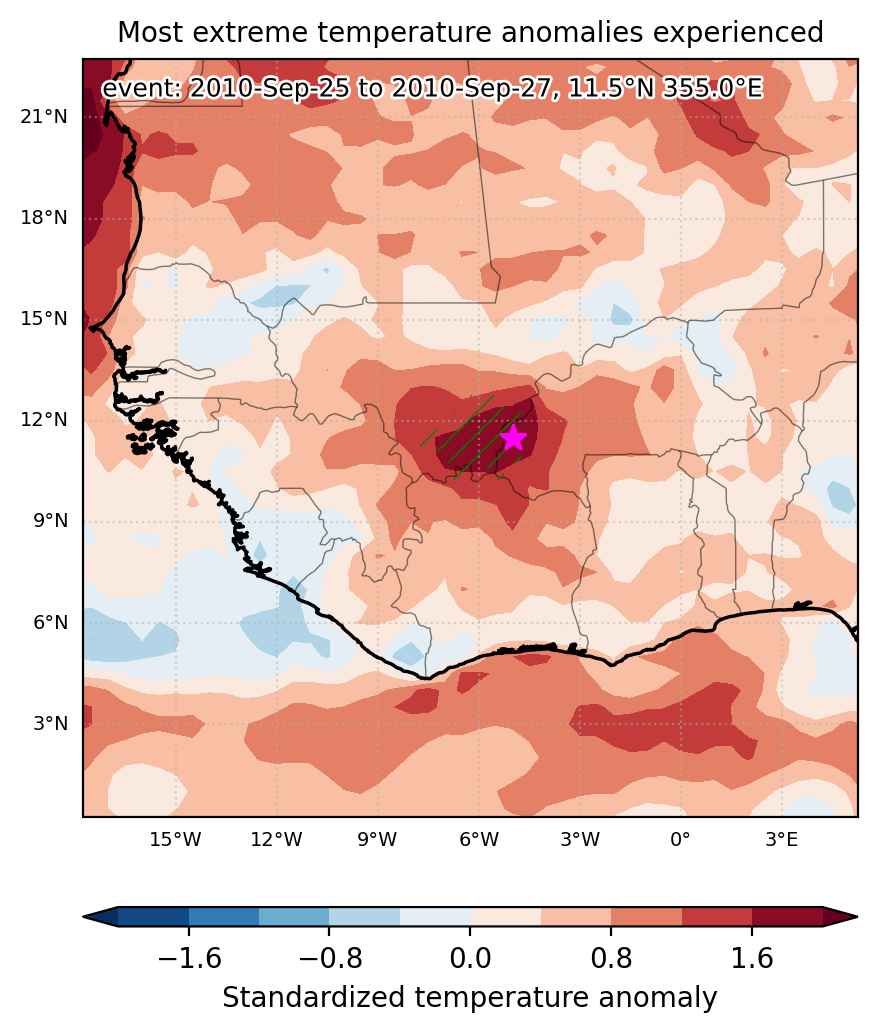
Event center: 11.5°N 355.0°E

Area affected: 57553 km$^2$


Fig. 1: Map of most extreme temperature anomalies (standardized) experienced during the event. The purple star indicates the center of the extreme event. Green hatching illustrates all areas under the effect of extremes at some time during the event.


Fig. 2: Evolution of temperature at the center of the event. The climatological percentile distribution is illustrated with color shadings.


Fig. 3: Maps illustrating the evolution of standardized temperature anomalies during the event.

Event ID: Heat_wave_2010-Sep-25_to_2010-Sep-27_355.0_11.5

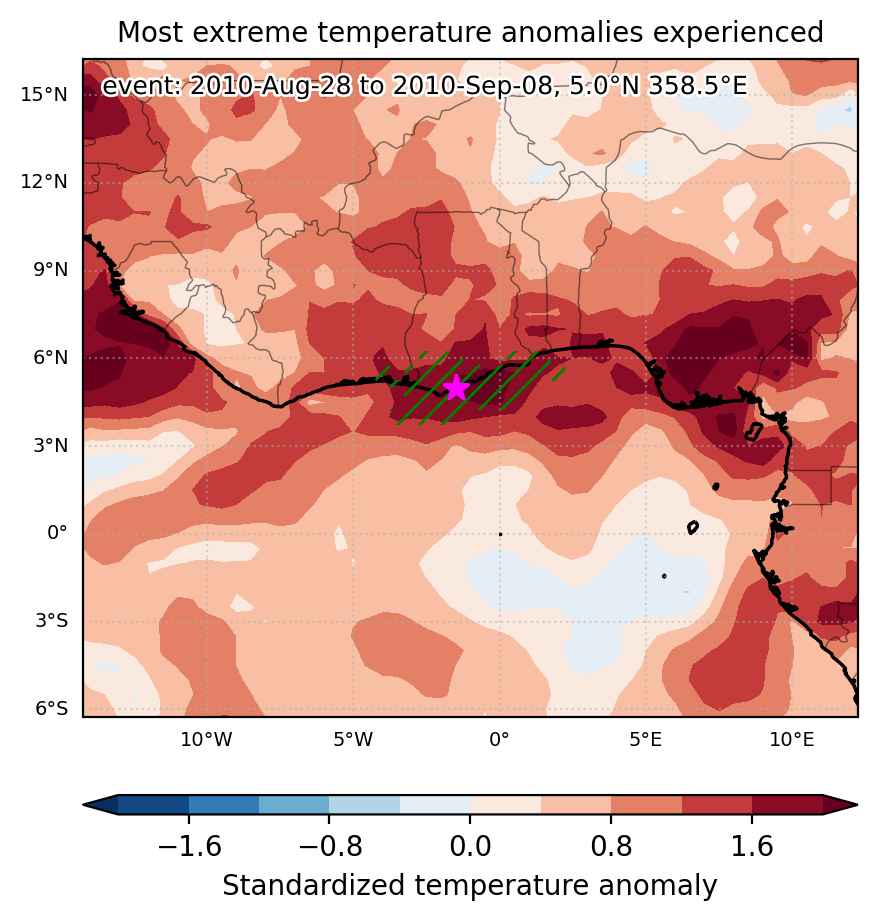
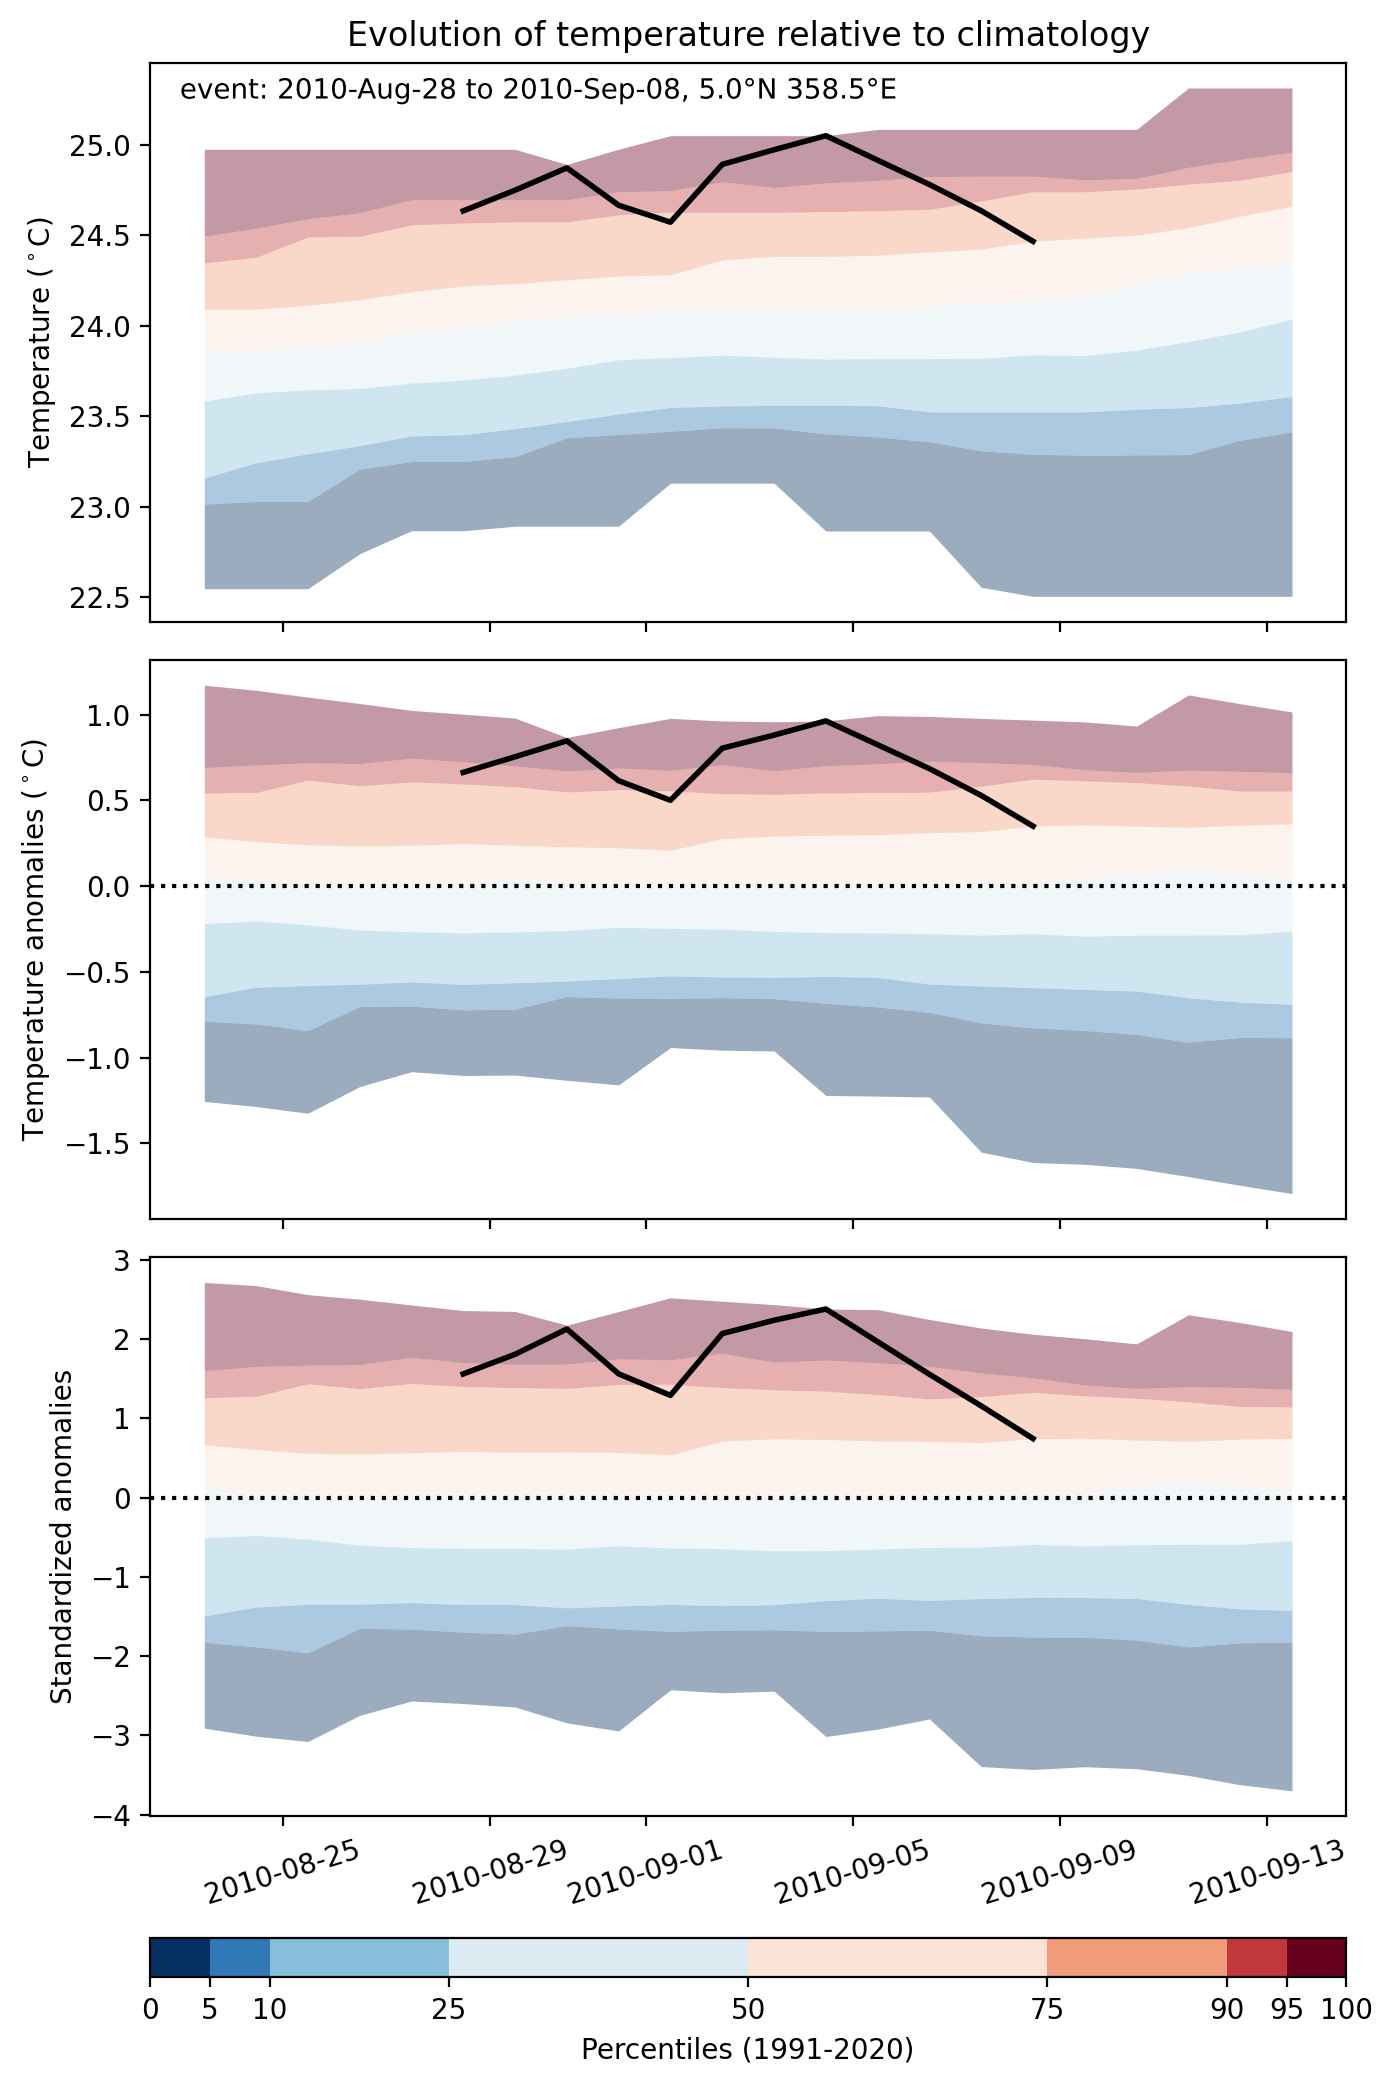
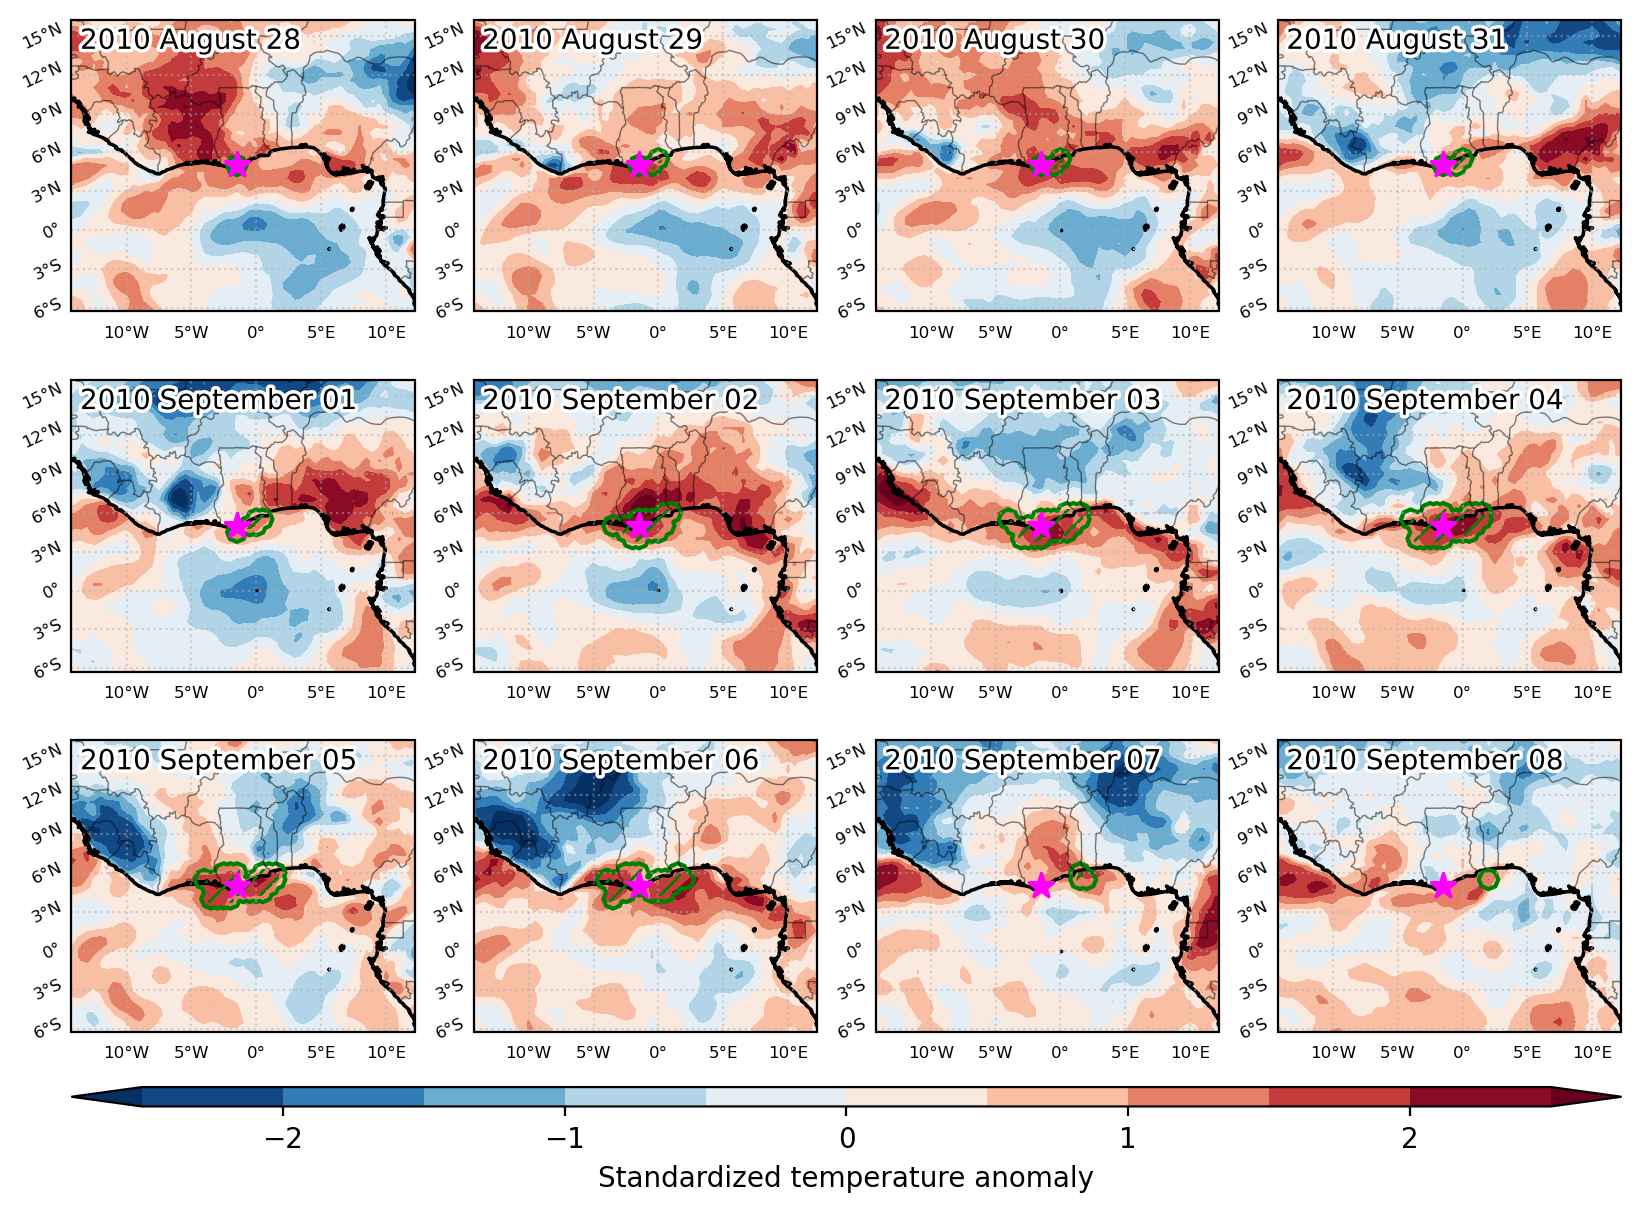
Heat wave occuring from August 28 2010 to September 08 2010 at 5.0°N 358.5°E

Download data: JSON

Event type: Heat wave

Countries affected (identified with ArcGIS Online; provided only for geographical reference):

  • Côte d’Ivoire
  • Ghana

Duration: 12 days

Time span: August 28 2010 to September 08 2010

Statistics over entire affected area:

  • Mean temperature anomaly: 0.7 °C
  • Mean temperature: 25.2 °C
  • Maximum temperature anomaly: 1.4 °C
  • Maximum temperature: 26.5 °C

Event center: 5.0°N 358.5°E

Area affected: 126230 km$^2$


Fig. 1: Map of most extreme temperature anomalies (standardized) experienced during the event. The purple star indicates the center of the extreme event. Green hatching illustrates all areas under the effect of extremes at some time during the event.


Fig. 2: Evolution of temperature at the center of the event. The climatological percentile distribution is illustrated with color shadings.


Fig. 3: Maps illustrating the evolution of standardized temperature anomalies during the event.

Event ID: Heat_wave_2010-Aug-28_to_2010-Sep-08_358.5_5.0

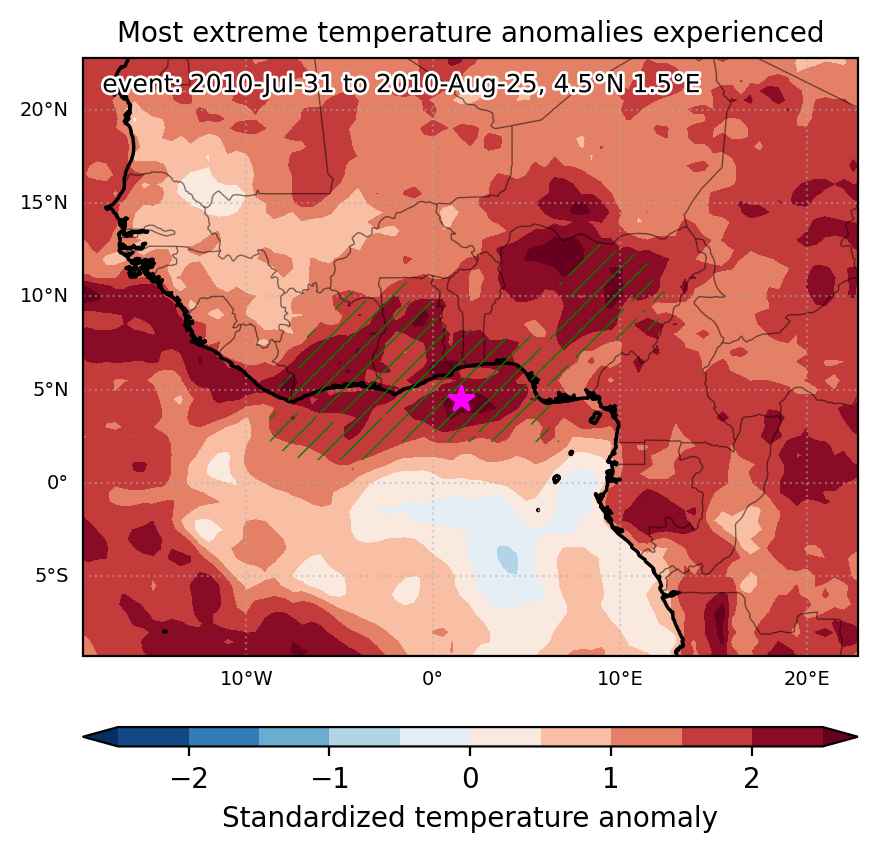
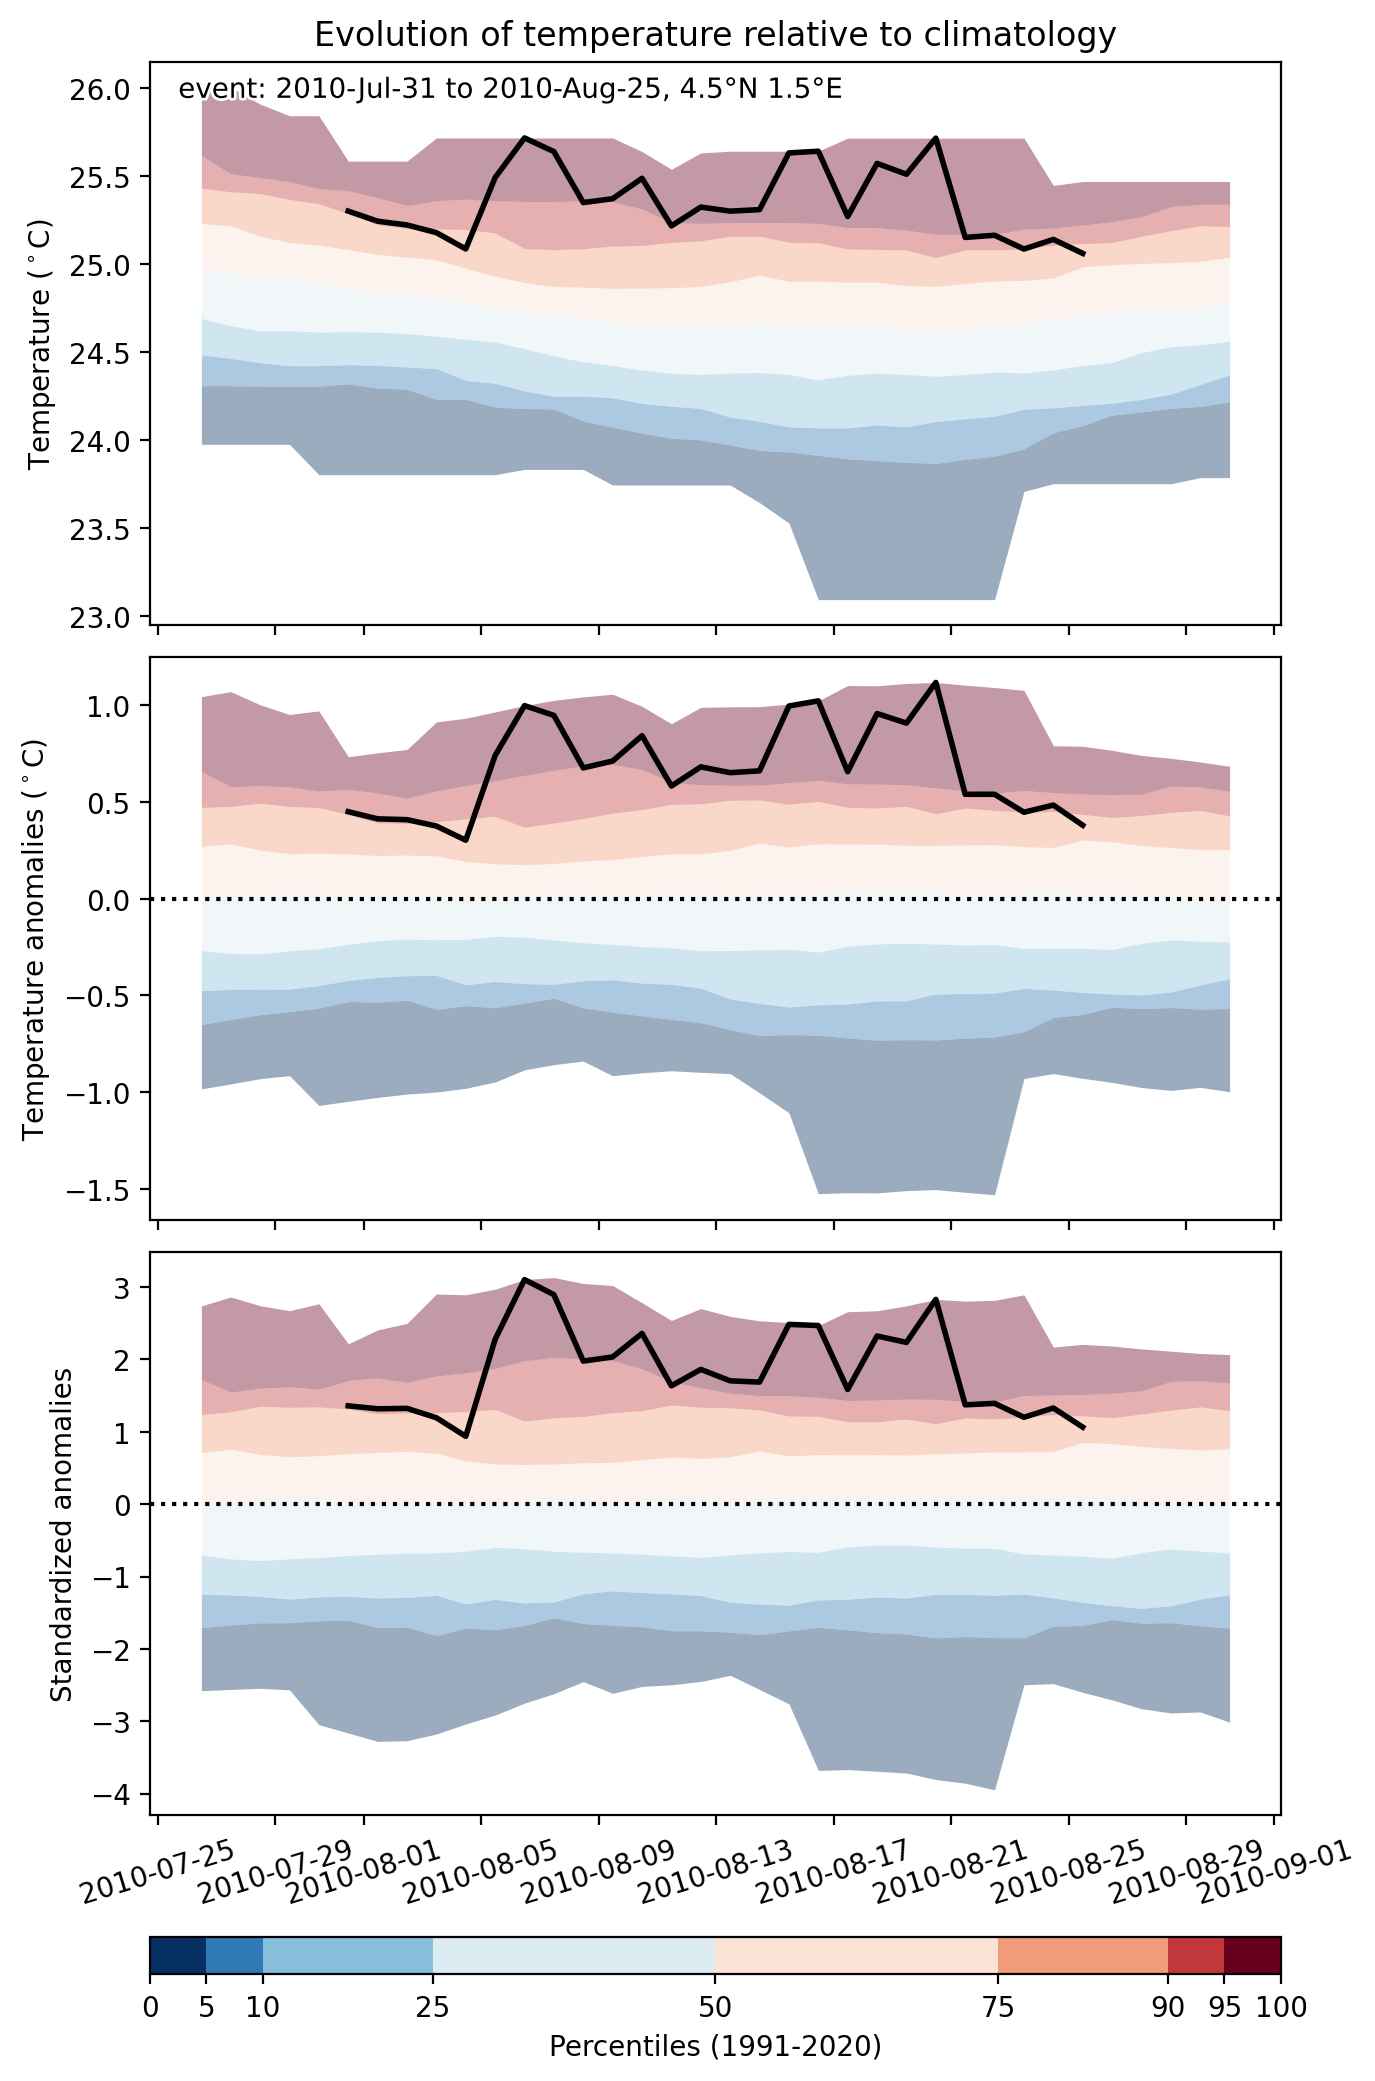
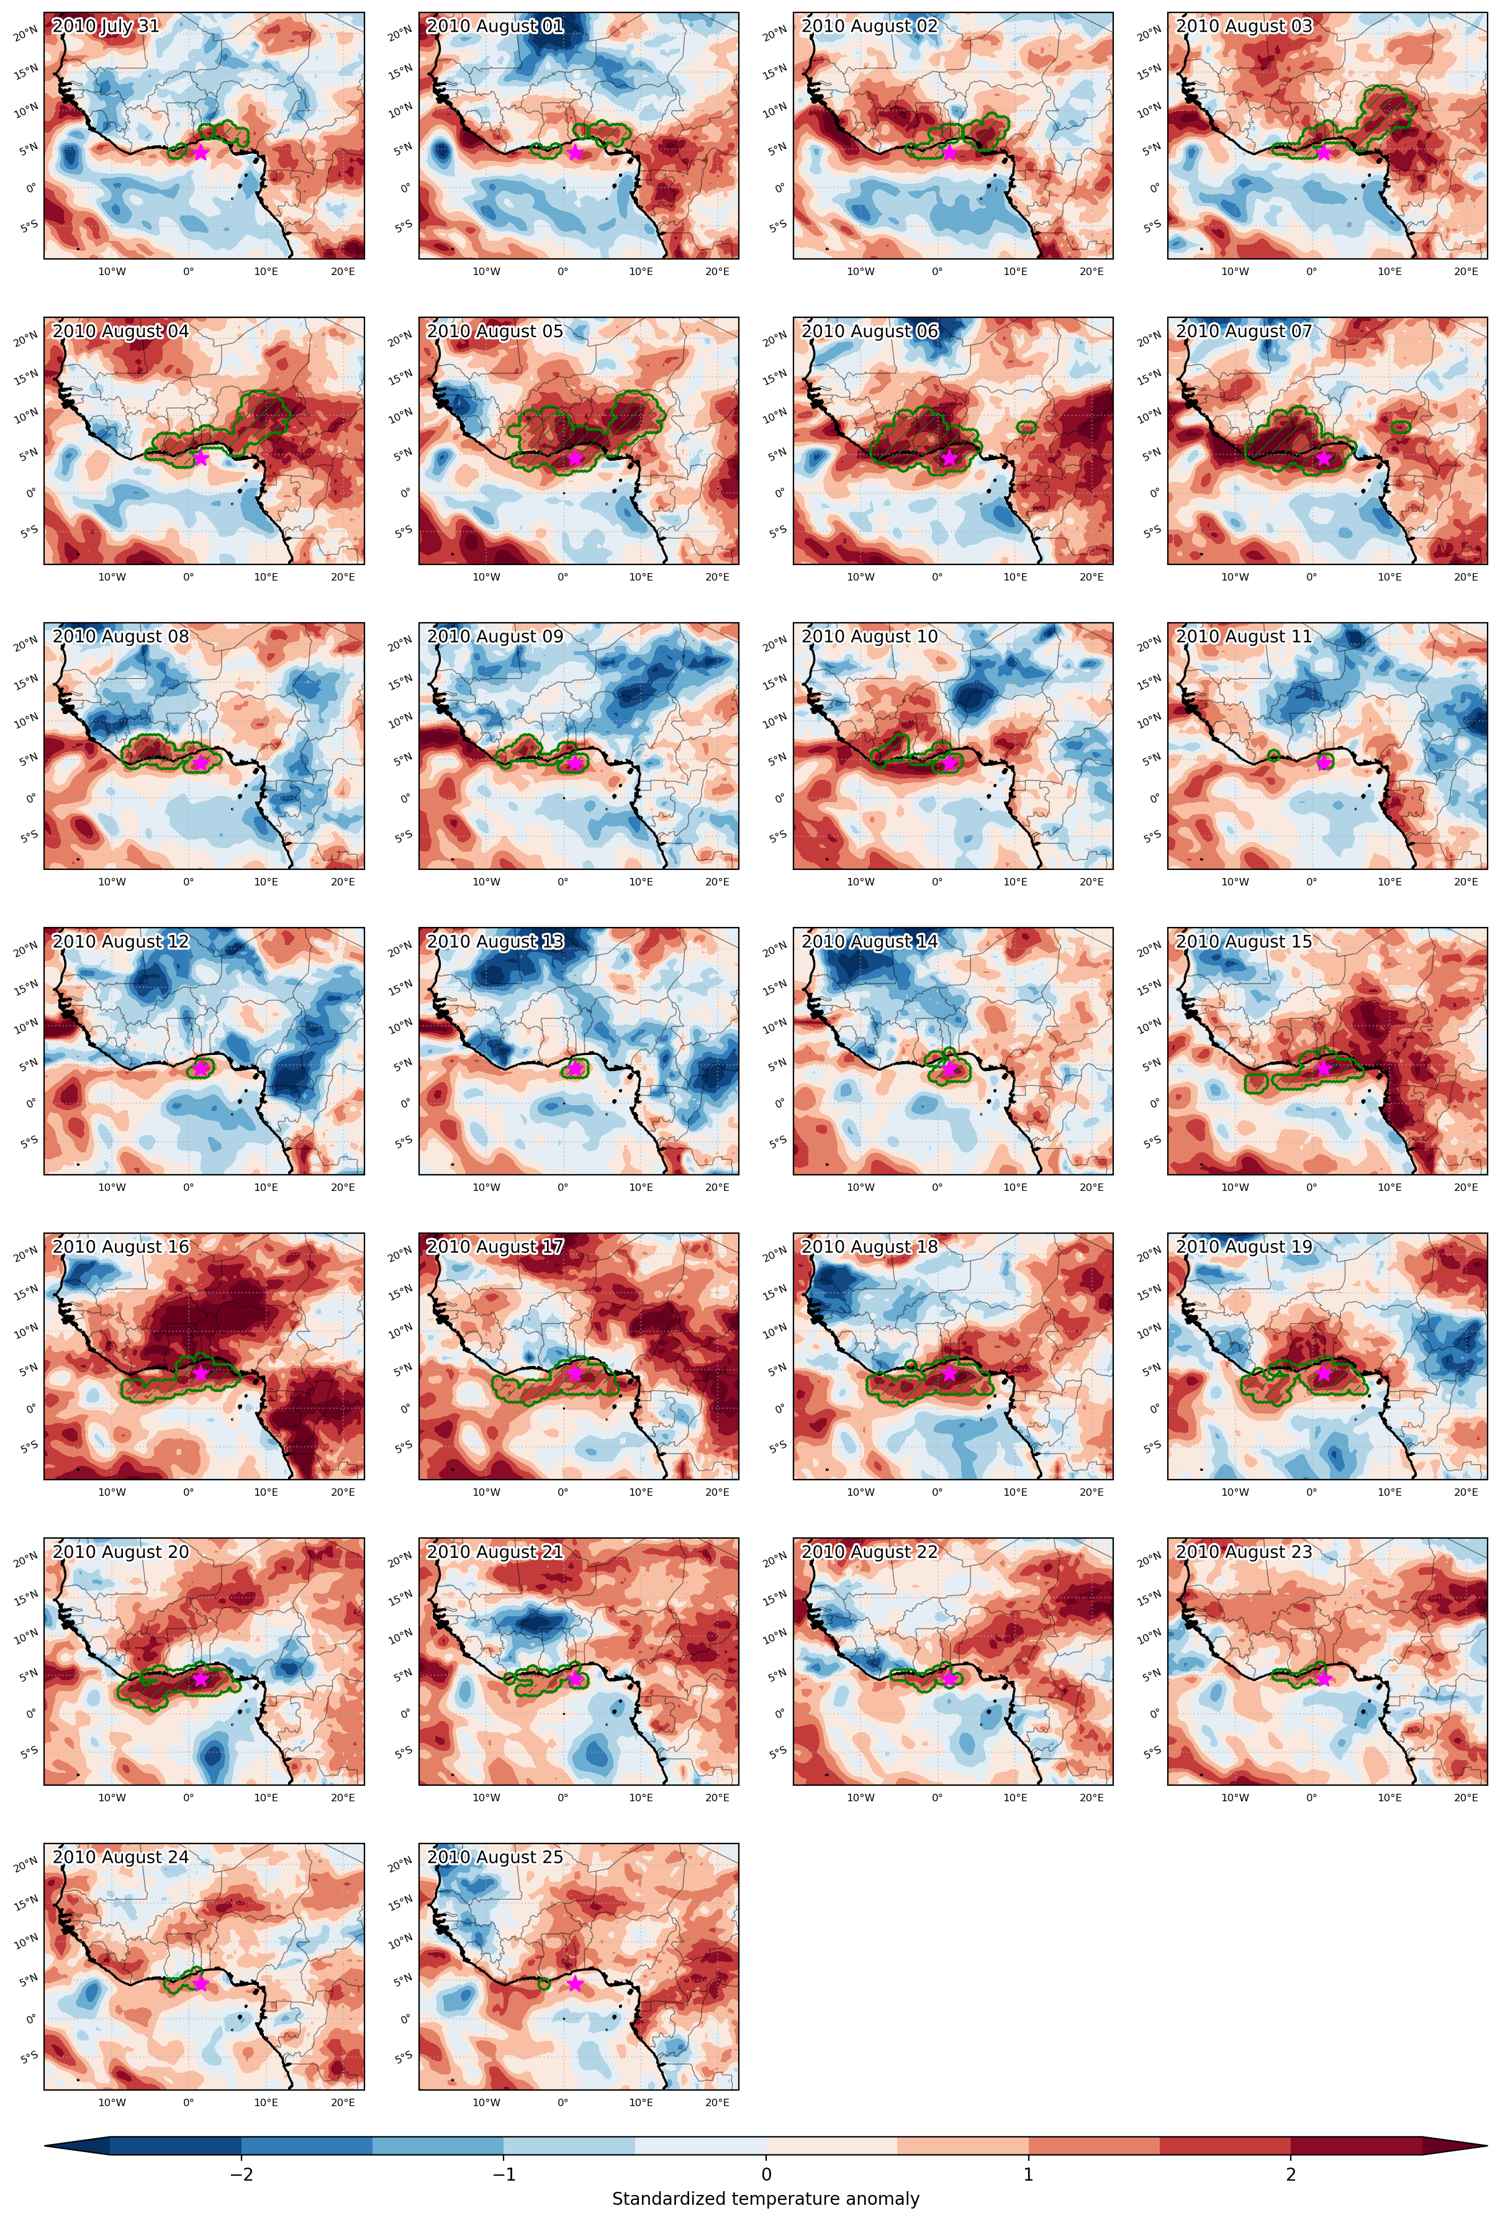
Heat wave occuring from July 31 2010 to August 25 2010 at 4.5°N 1.5°E

Download data: JSON

Event type: Heat wave

Countries affected (identified with ArcGIS Online; provided only for geographical reference):

  • Benin
  • Burkina Faso
  • Côte d’Ivoire
  • Ghana
  • Liberia
  • Nigeria
  • Togo

Duration: 26 days

Time span: July 31 2010 to August 25 2010

Statistics over entire affected area:

  • Mean temperature anomaly: 1.1 °C
  • Mean temperature: 25.7 °C
  • Maximum temperature anomaly: 3.1 °C
  • Maximum temperature: 29.2 °C

Event center: 4.5°N 1.5°E

Area affected: 1451646 km$^2$


Fig. 1: Map of most extreme temperature anomalies (standardized) experienced during the event. The purple star indicates the center of the extreme event. Green hatching illustrates all areas under the effect of extremes at some time during the event.


Fig. 2: Evolution of temperature at the center of the event. The climatological percentile distribution is illustrated with color shadings.


Fig. 3: Maps illustrating the evolution of standardized temperature anomalies during the event.

Event ID: Heat_wave_2010-Jul-31_to_2010-Aug-25_1.5_4.5

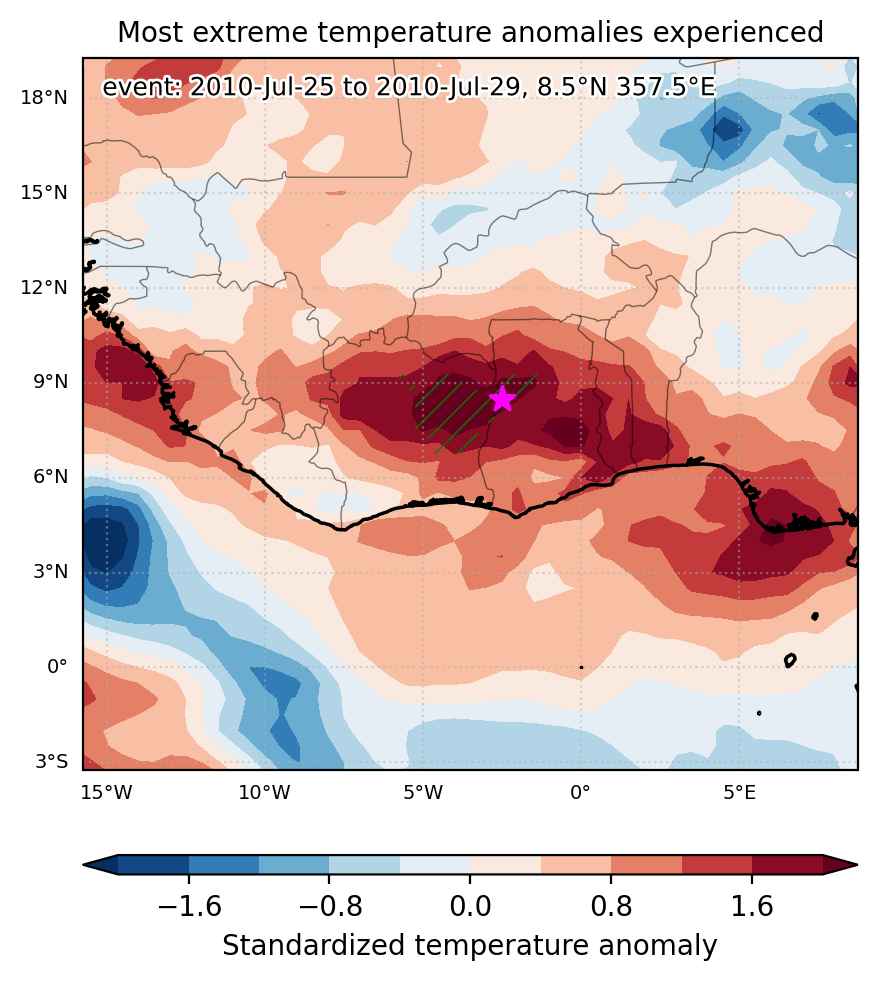
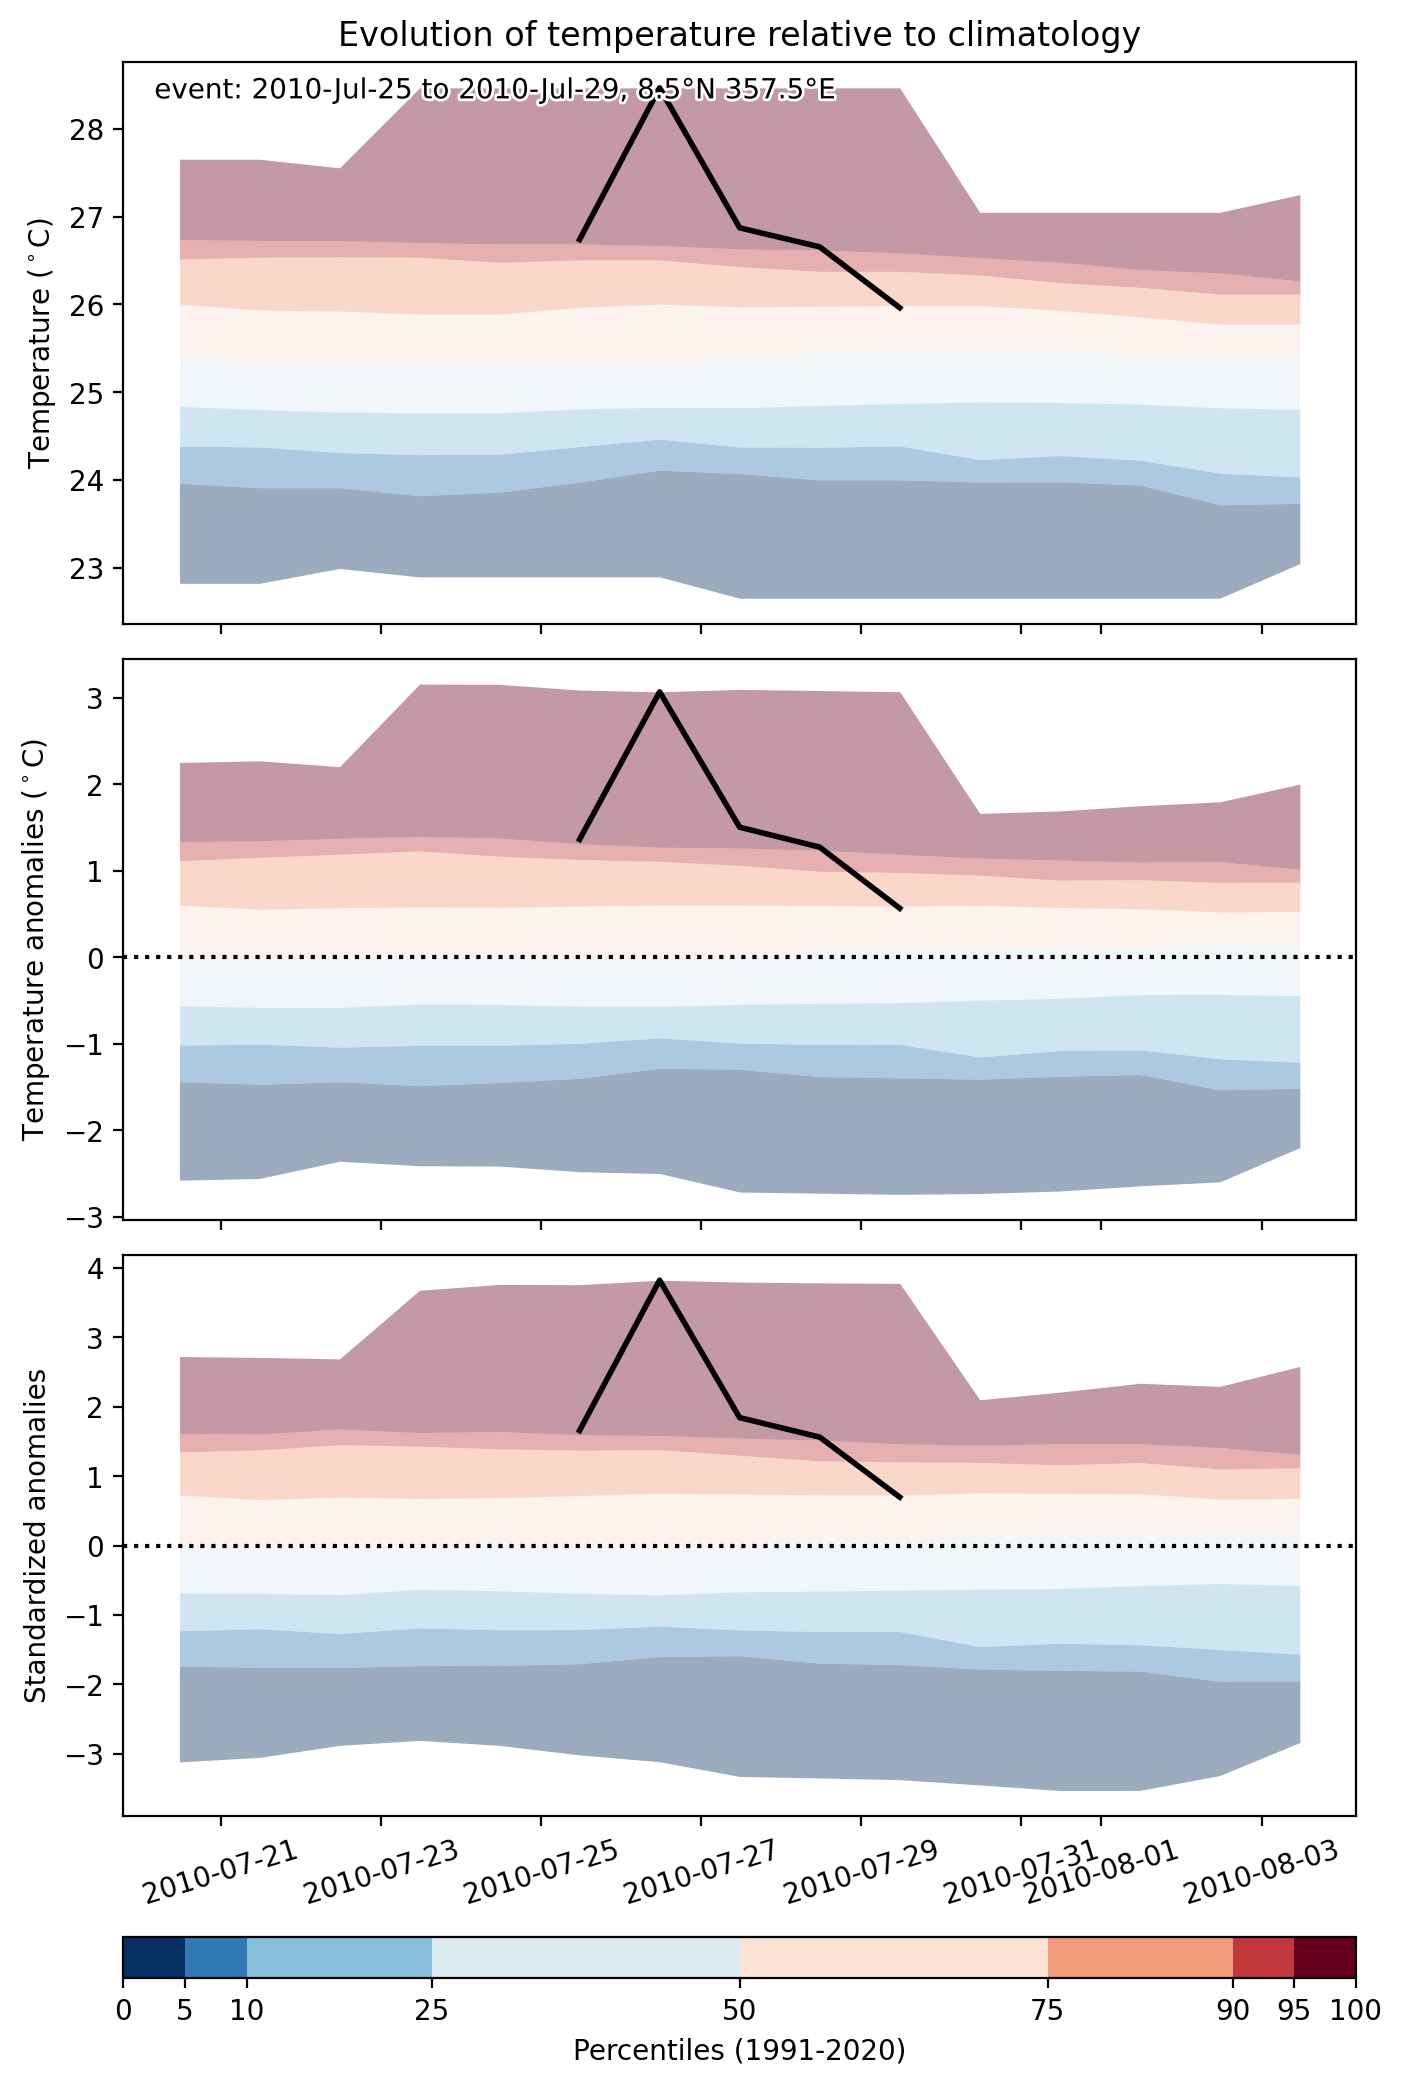
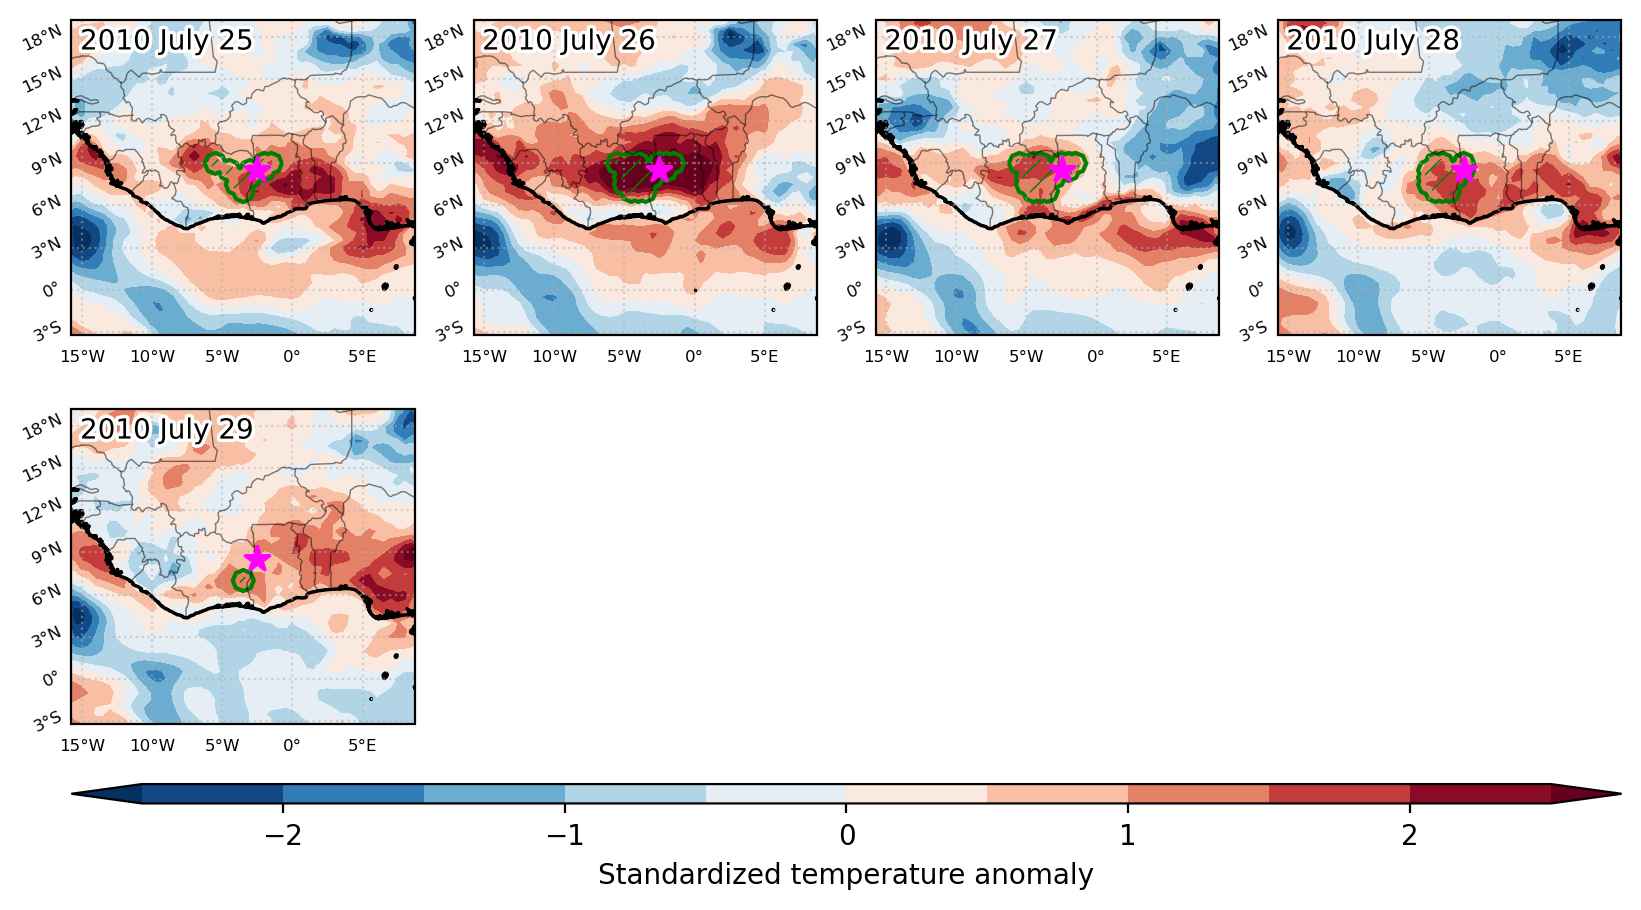
Heat wave occuring from July 25 2010 to July 29 2010 at 8.5°N 357.5°E

Download data: JSON

Event type: Heat wave

Countries affected (identified with ArcGIS Online; provided only for geographical reference):

  • Côte d’Ivoire
  • Ghana

Duration: 5 days

Time span: July 25 2010 to July 29 2010

Statistics over entire affected area:

  • Mean temperature anomaly: 1.6 °C
  • Mean temperature: 26.8 °C
  • Maximum temperature anomaly: 3.1 °C
  • Maximum temperature: 29.1 °C

Event center: 8.5°N 357.5°E

Area affected: 76485 km$^2$


Fig. 1: Map of most extreme temperature anomalies (standardized) experienced during the event. The purple star indicates the center of the extreme event. Green hatching illustrates all areas under the effect of extremes at some time during the event.


Fig. 2: Evolution of temperature at the center of the event. The climatological percentile distribution is illustrated with color shadings.


Fig. 3: Maps illustrating the evolution of standardized temperature anomalies during the event.

Event ID: Heat_wave_2010-Jul-25_to_2010-Jul-29_357.5_8.5