Heat wave occuring from March 31 2023 to April 05 2023 at 5.0°N 354.5°E

Download data: JSON

Event type: Heat wave

Countries affected (identified with ArcGIS Online; provided only for geographical reference):

  • Côte d’Ivoire

Duration: 6 days

Time span: March 31 2023 to April 05 2023

Statistics over entire affected area:

  • Mean temperature anomaly: 0.8 °C
  • Mean temperature: 28.3 °C
  • Maximum temperature anomaly: 1.0 °C
  • Maximum temperature: 28.6 °C

Event center: 5.0°N 354.5°E

Area affected: 55464 km$^2$
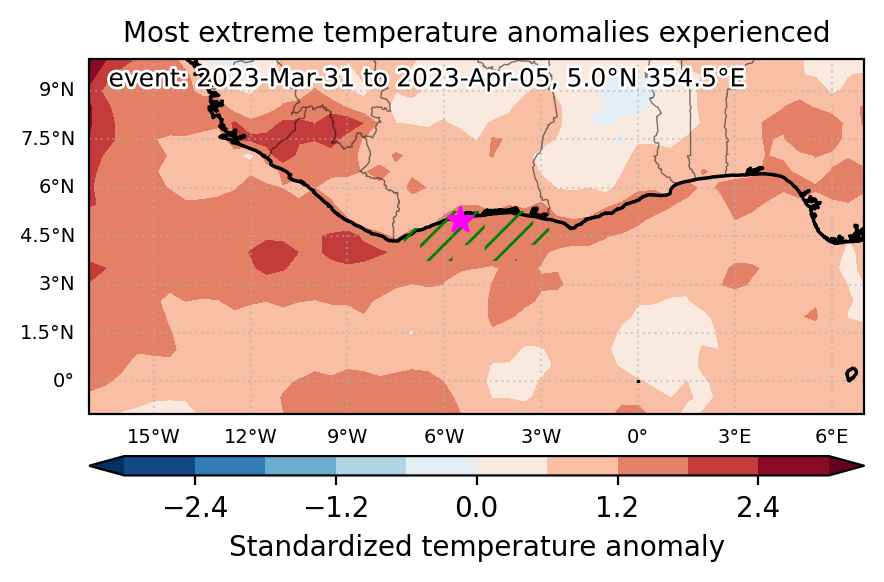

Fig. 1: Map of most extreme temperature anomalies (standardized) experienced during the event. The purple star indicates the center of the extreme event. Green hatching illustrates all areas under the effect of extremes at some time during the event.
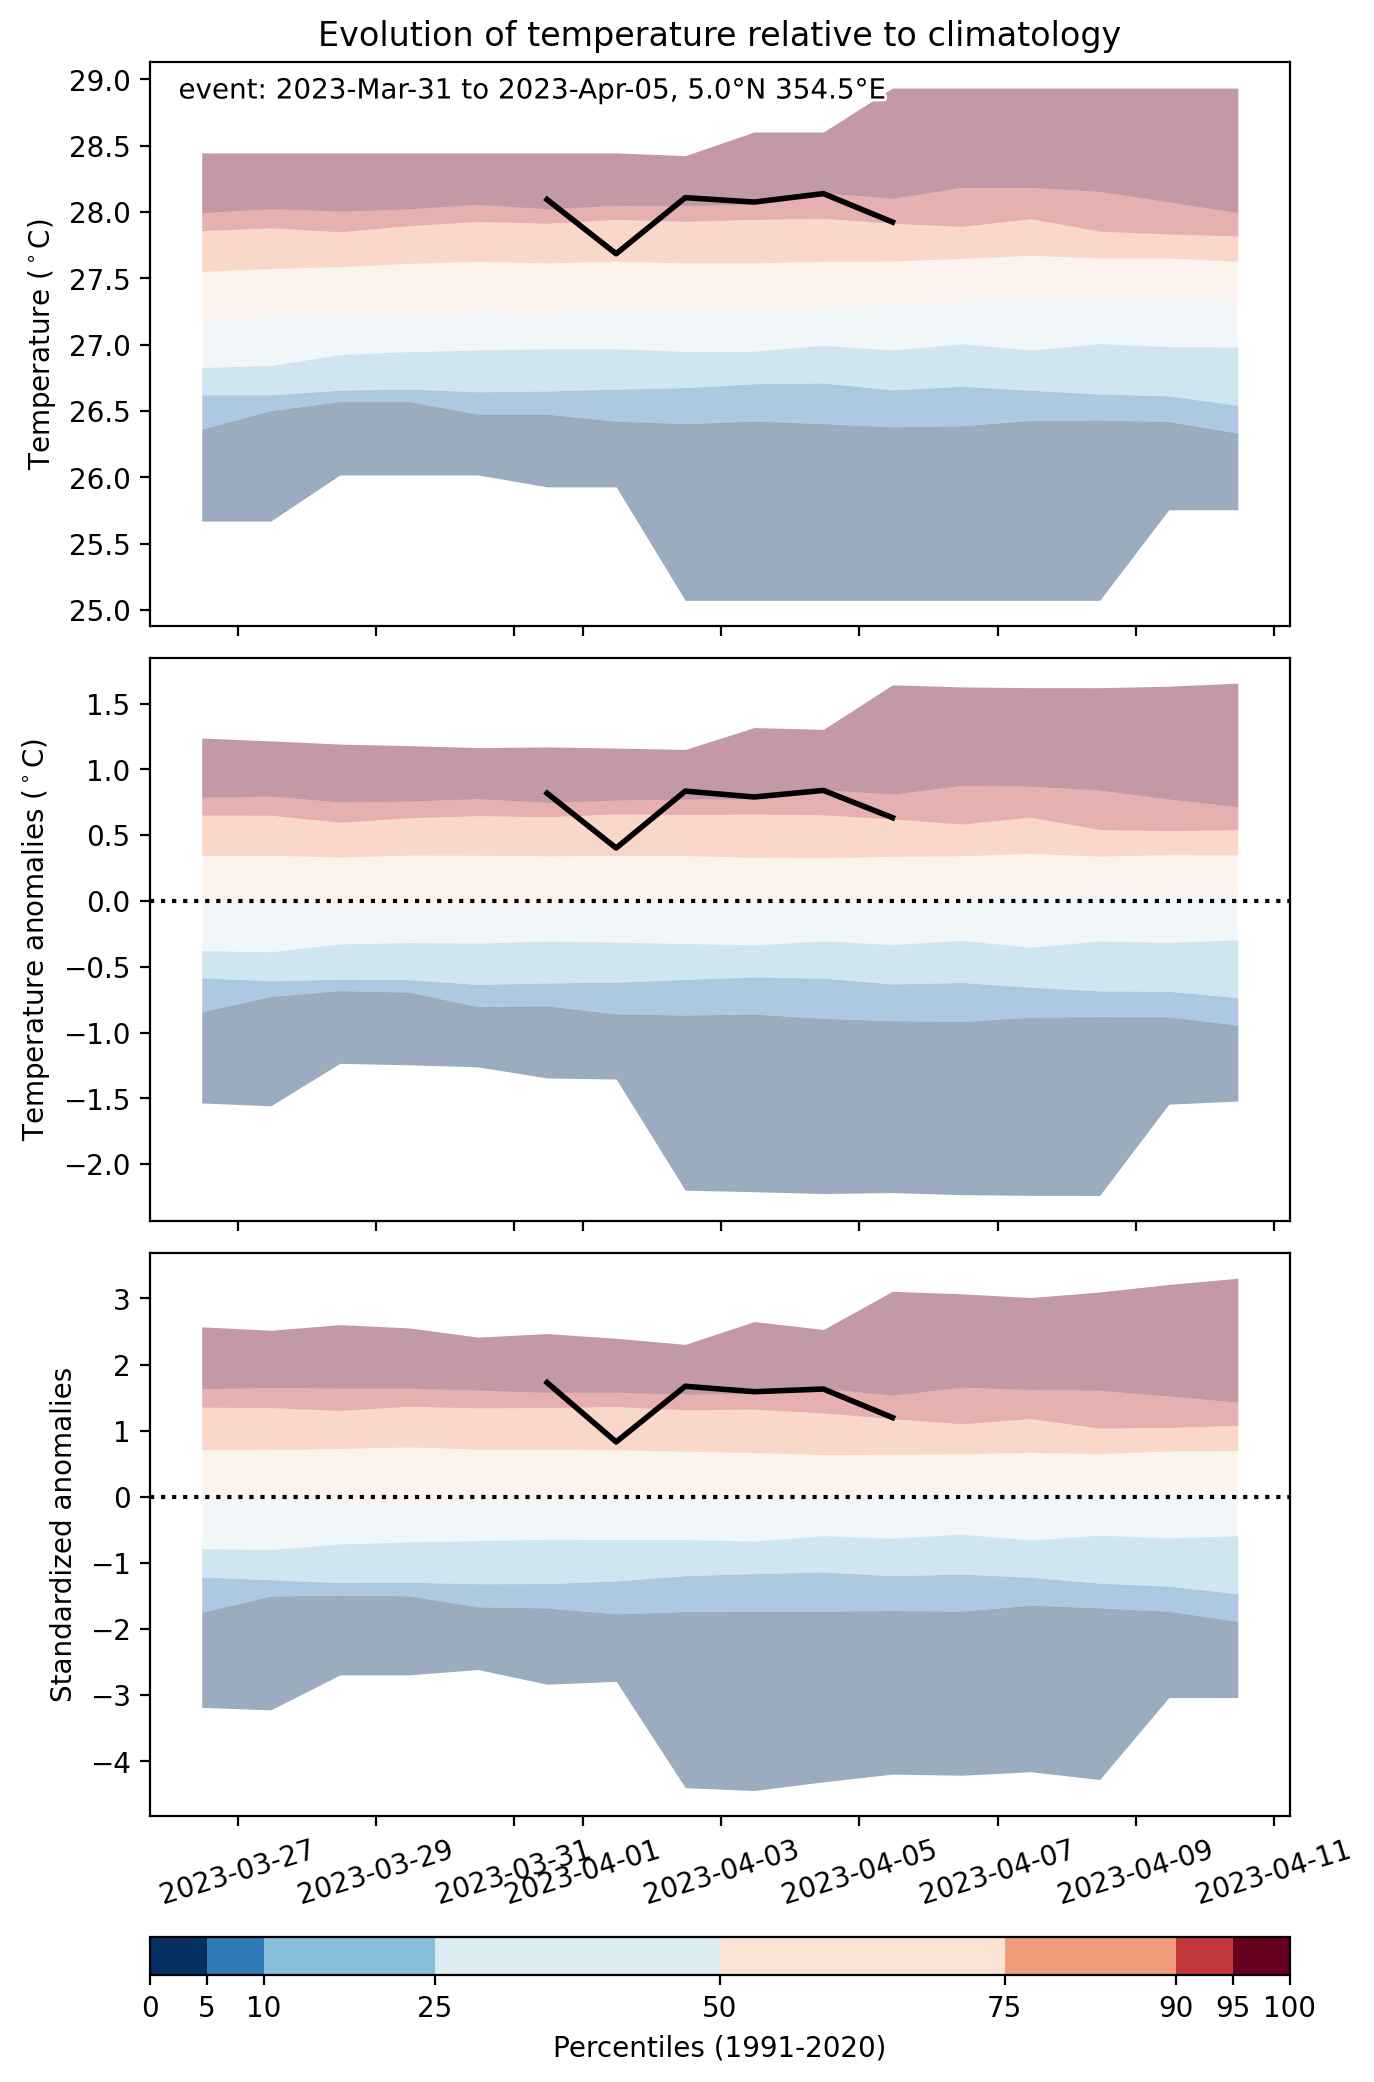


Fig. 2: Evolution of temperature at the center of the event. The climatological percentile distribution is illustrated with color shadings.
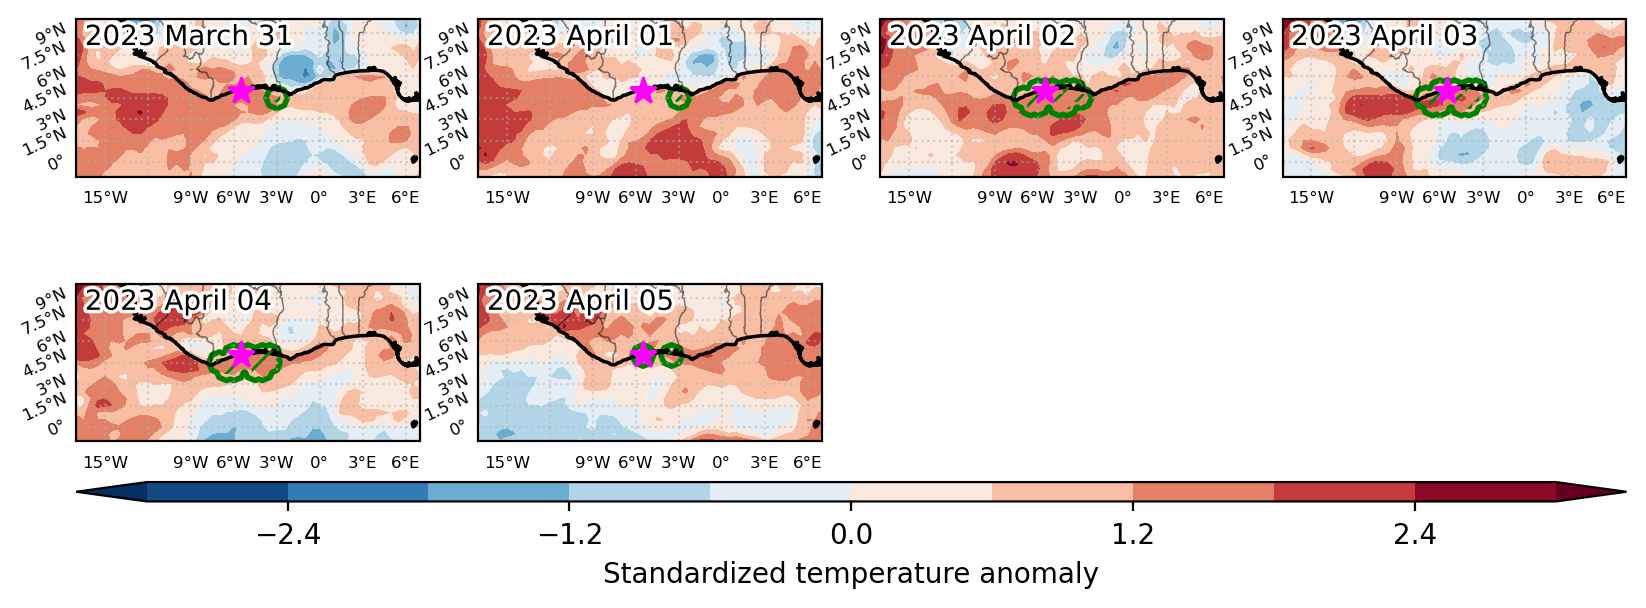


Fig. 3: Maps illustrating the evolution of standardized temperature anomalies during the event.

Event ID: Heat_wave_2023-Mar-31_to_2023-Apr-05_354.5_5.0
Heat wave occuring from March 24 2023 to March 28 2023 at 7.5°N 349.0°E

Download data: JSON

Event type: Heat wave

Countries affected (identified with ArcGIS Online; provided only for geographical reference):

  • Côte d’Ivoire
  • Guinea
  • Liberia
  • Sierra Leone

Duration: 5 days

Time span: March 24 2023 to March 28 2023

Statistics over entire affected area:

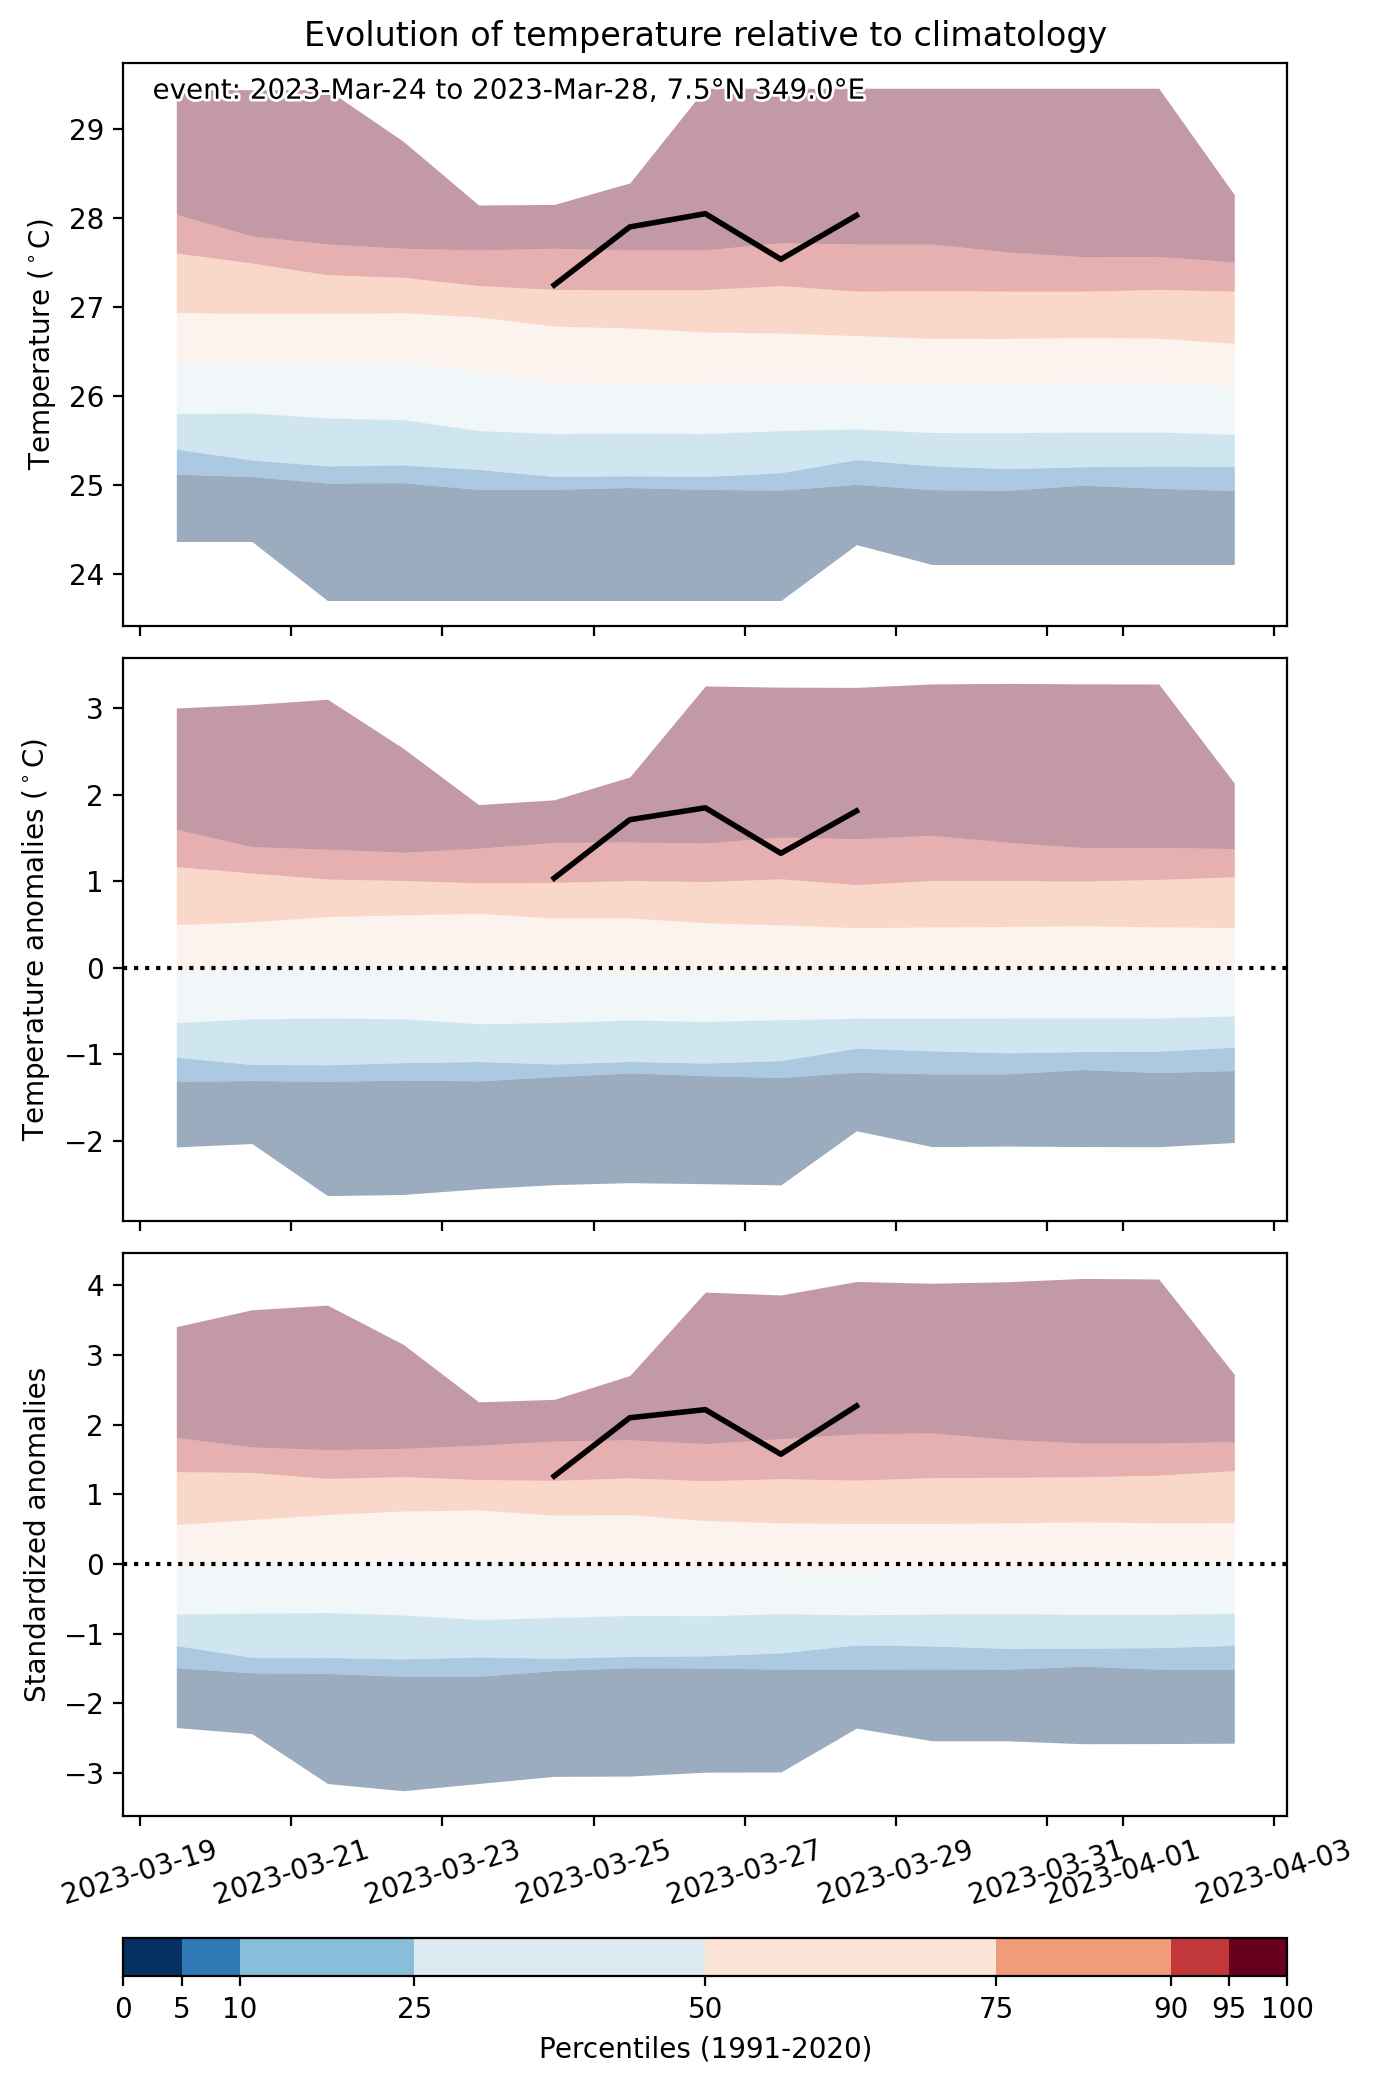
  • Mean temperature anomaly: 1.6 °C
  • Mean temperature: 28.0 °C
  • Maximum temperature anomaly: 2.9 °C
  • Maximum temperature: 30.0 °C

Event center: 7.5°N 349.0°E

Area affected: 58230 km$^2$


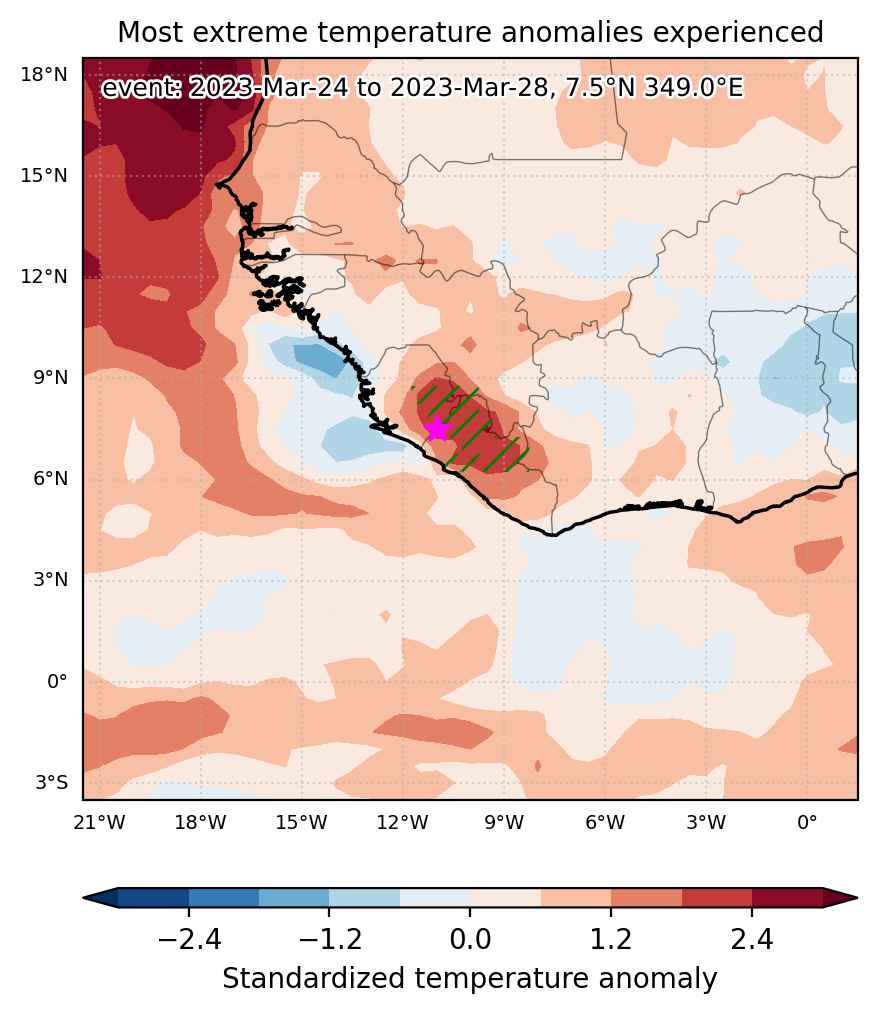
Fig. 1: Map of most extreme temperature anomalies (standardized) experienced during the event. The purple star indicates the center of the extreme event. Green hatching illustrates all areas under the effect of extremes at some time during the event.


Fig. 2: Evolution of temperature at the center of the event. The climatological percentile distribution is illustrated with color shadings.


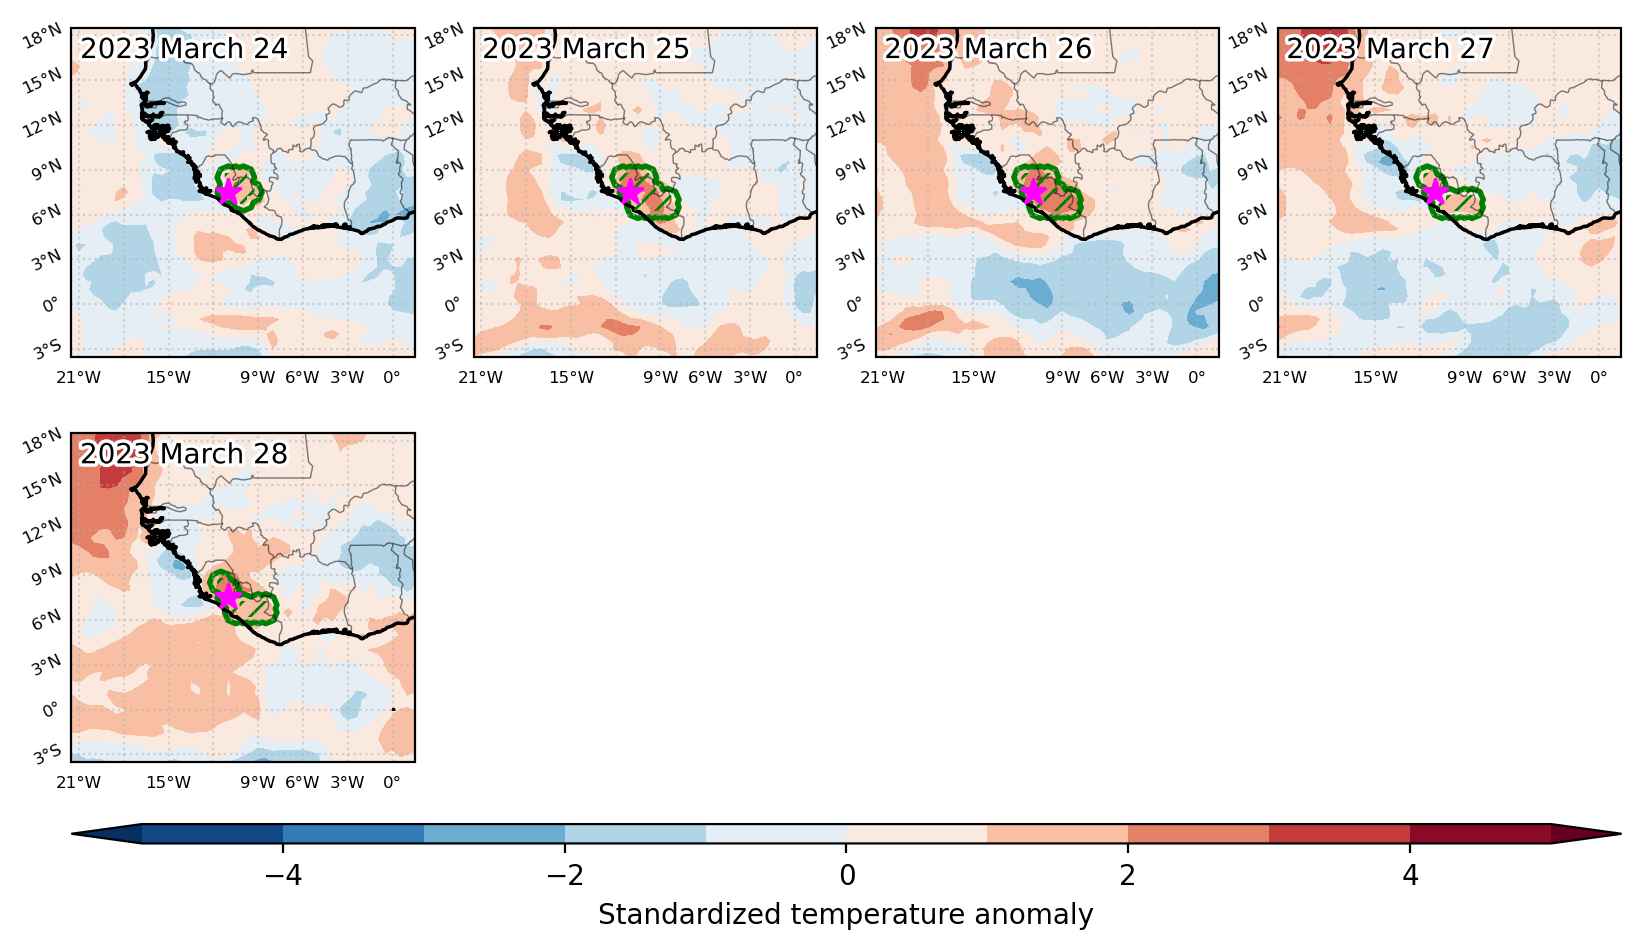
Fig. 3: Maps illustrating the evolution of standardized temperature anomalies during the event.

Event ID: Heat_wave_2023-Mar-24_to_2023-Mar-28_349.0_7.5

Heat wave occuring from March 07 2023 to March 13 2023 at 7.0°N 349.5°E

Download data: JSON

Event type: Heat wave

Countries affected (identified with ArcGIS Online; provided only for geographical reference):

  • Côte d’Ivoire
  • Liberia
  • Sierra Leone

Duration: 7 days

Time span: March 07 2023 to March 13 2023

Statistics over entire affected area:

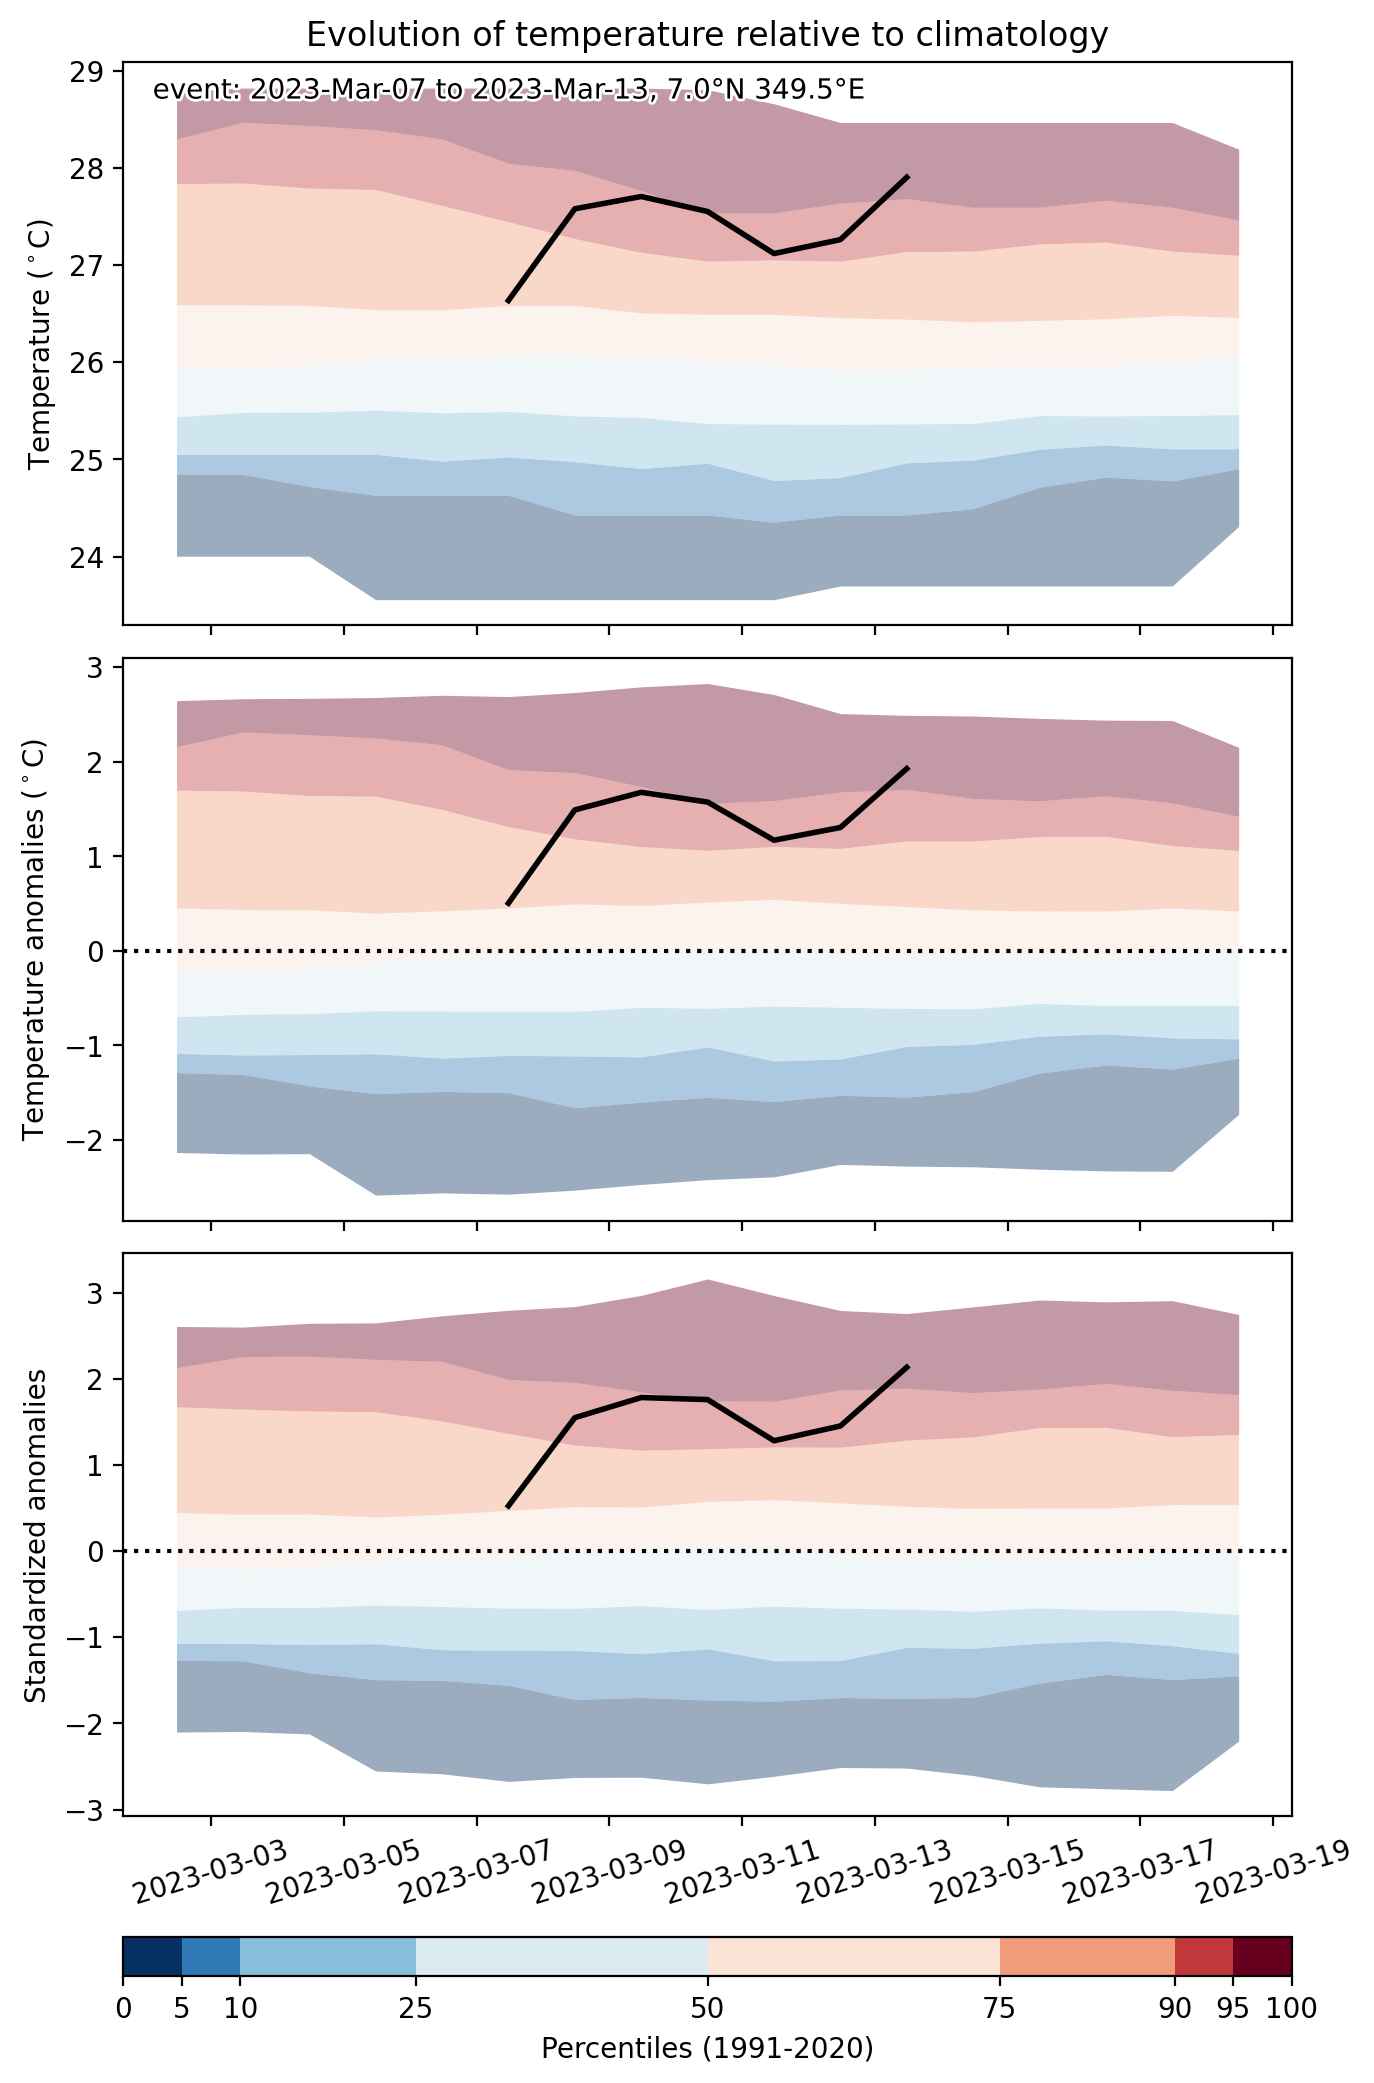
  • Mean temperature anomaly: 1.4 °C
  • Mean temperature: 27.9 °C
  • Maximum temperature anomaly: 2.2 °C
  • Maximum temperature: 29.2 °C

Event center: 7.0°N 349.5°E

Area affected: 82932 km$^2$


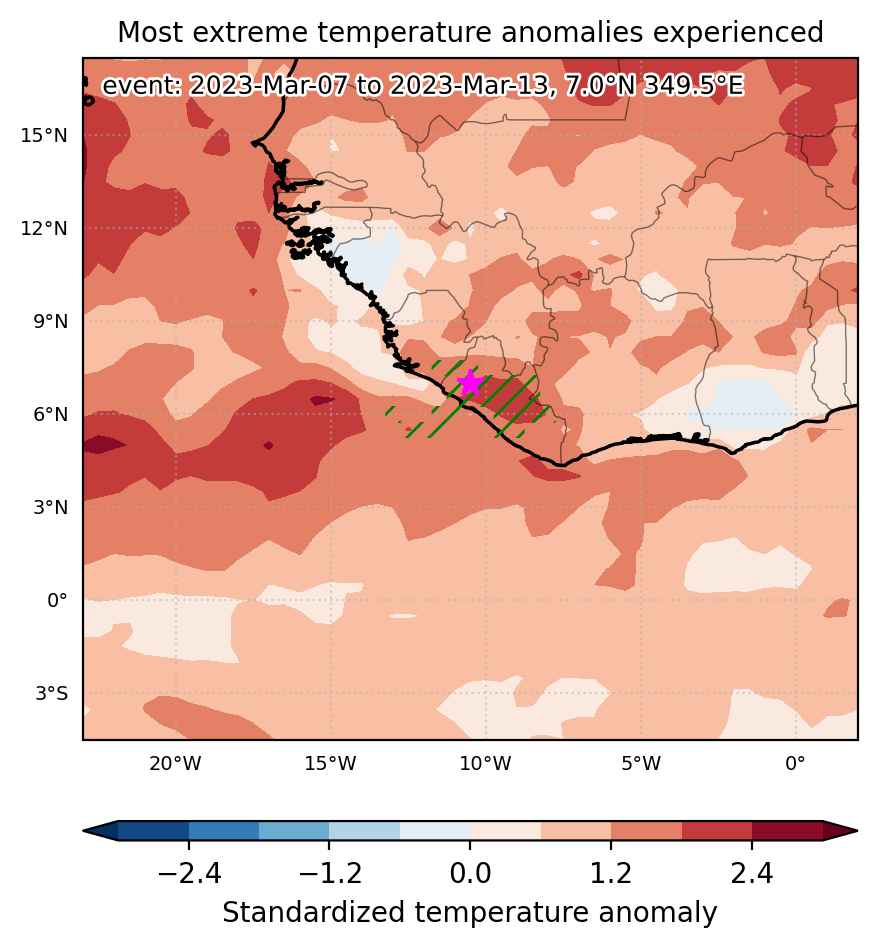
Fig. 1: Map of most extreme temperature anomalies (standardized) experienced during the event. The purple star indicates the center of the extreme event. Green hatching illustrates all areas under the effect of extremes at some time during the event.


Fig. 2: Evolution of temperature at the center of the event. The climatological percentile distribution is illustrated with color shadings.


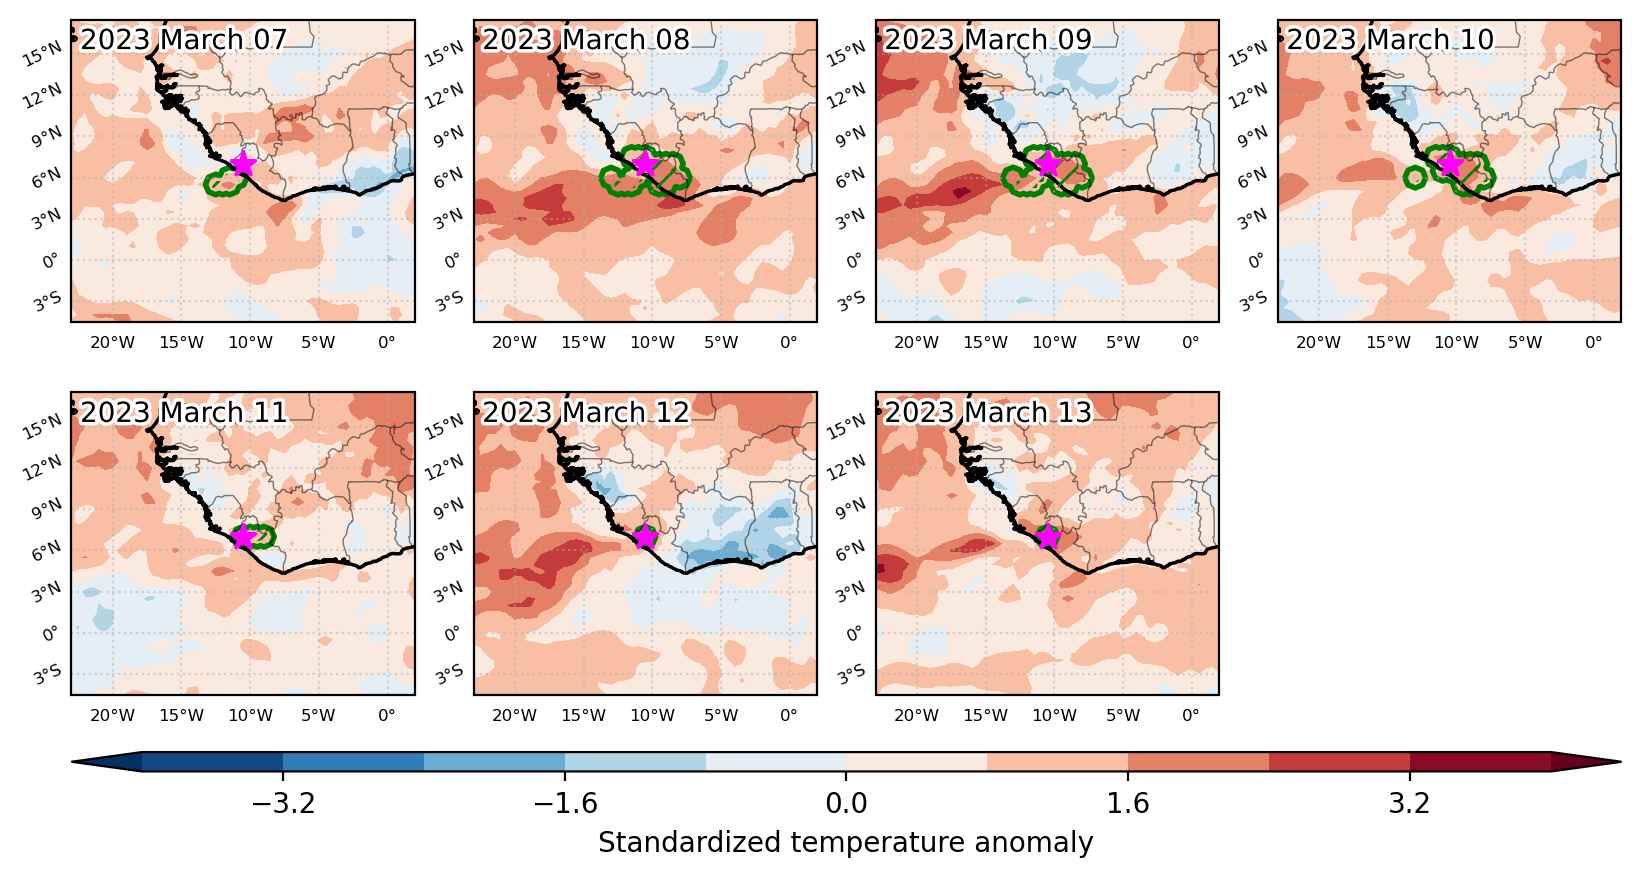
Fig. 3: Maps illustrating the evolution of standardized temperature anomalies during the event.

Event ID: Heat_wave_2023-Mar-07_to_2023-Mar-13_349.5_7.0

Heat wave occuring from February 15 2023 to March 08 2023 at 8.5°N 349.5°E

Download data: JSON

Event type: Heat wave

Countries affected (identified with ArcGIS Online; provided only for geographical reference):

  • Côte d’Ivoire
  • Ghana
  • Guinea
  • Liberia
  • Mali
  • Sierra Leone
  • Togo

Duration: 22 days

Time span: February 15 2023 to March 08 2023

Statistics over entire affected area:

  • Mean temperature anomaly: 1.5 °C
  • Mean temperature: 28.9 °C
  • Maximum temperature anomaly: 3.7 °C
  • Maximum temperature: 32.8 °C

Event center: 8.5°N 349.5°E

Area affected: 810760 km$^2$


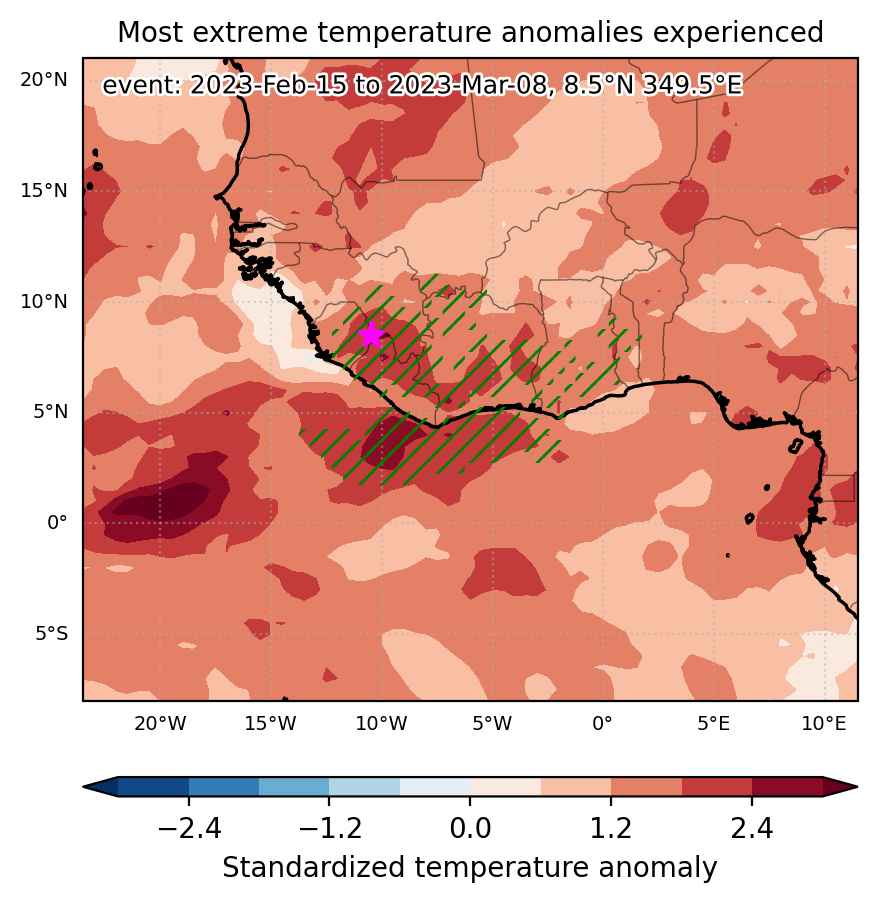
Fig. 1: Map of most extreme temperature anomalies (standardized) experienced during the event. The purple star indicates the center of the extreme event. Green hatching illustrates all areas under the effect of extremes at some time during the event.


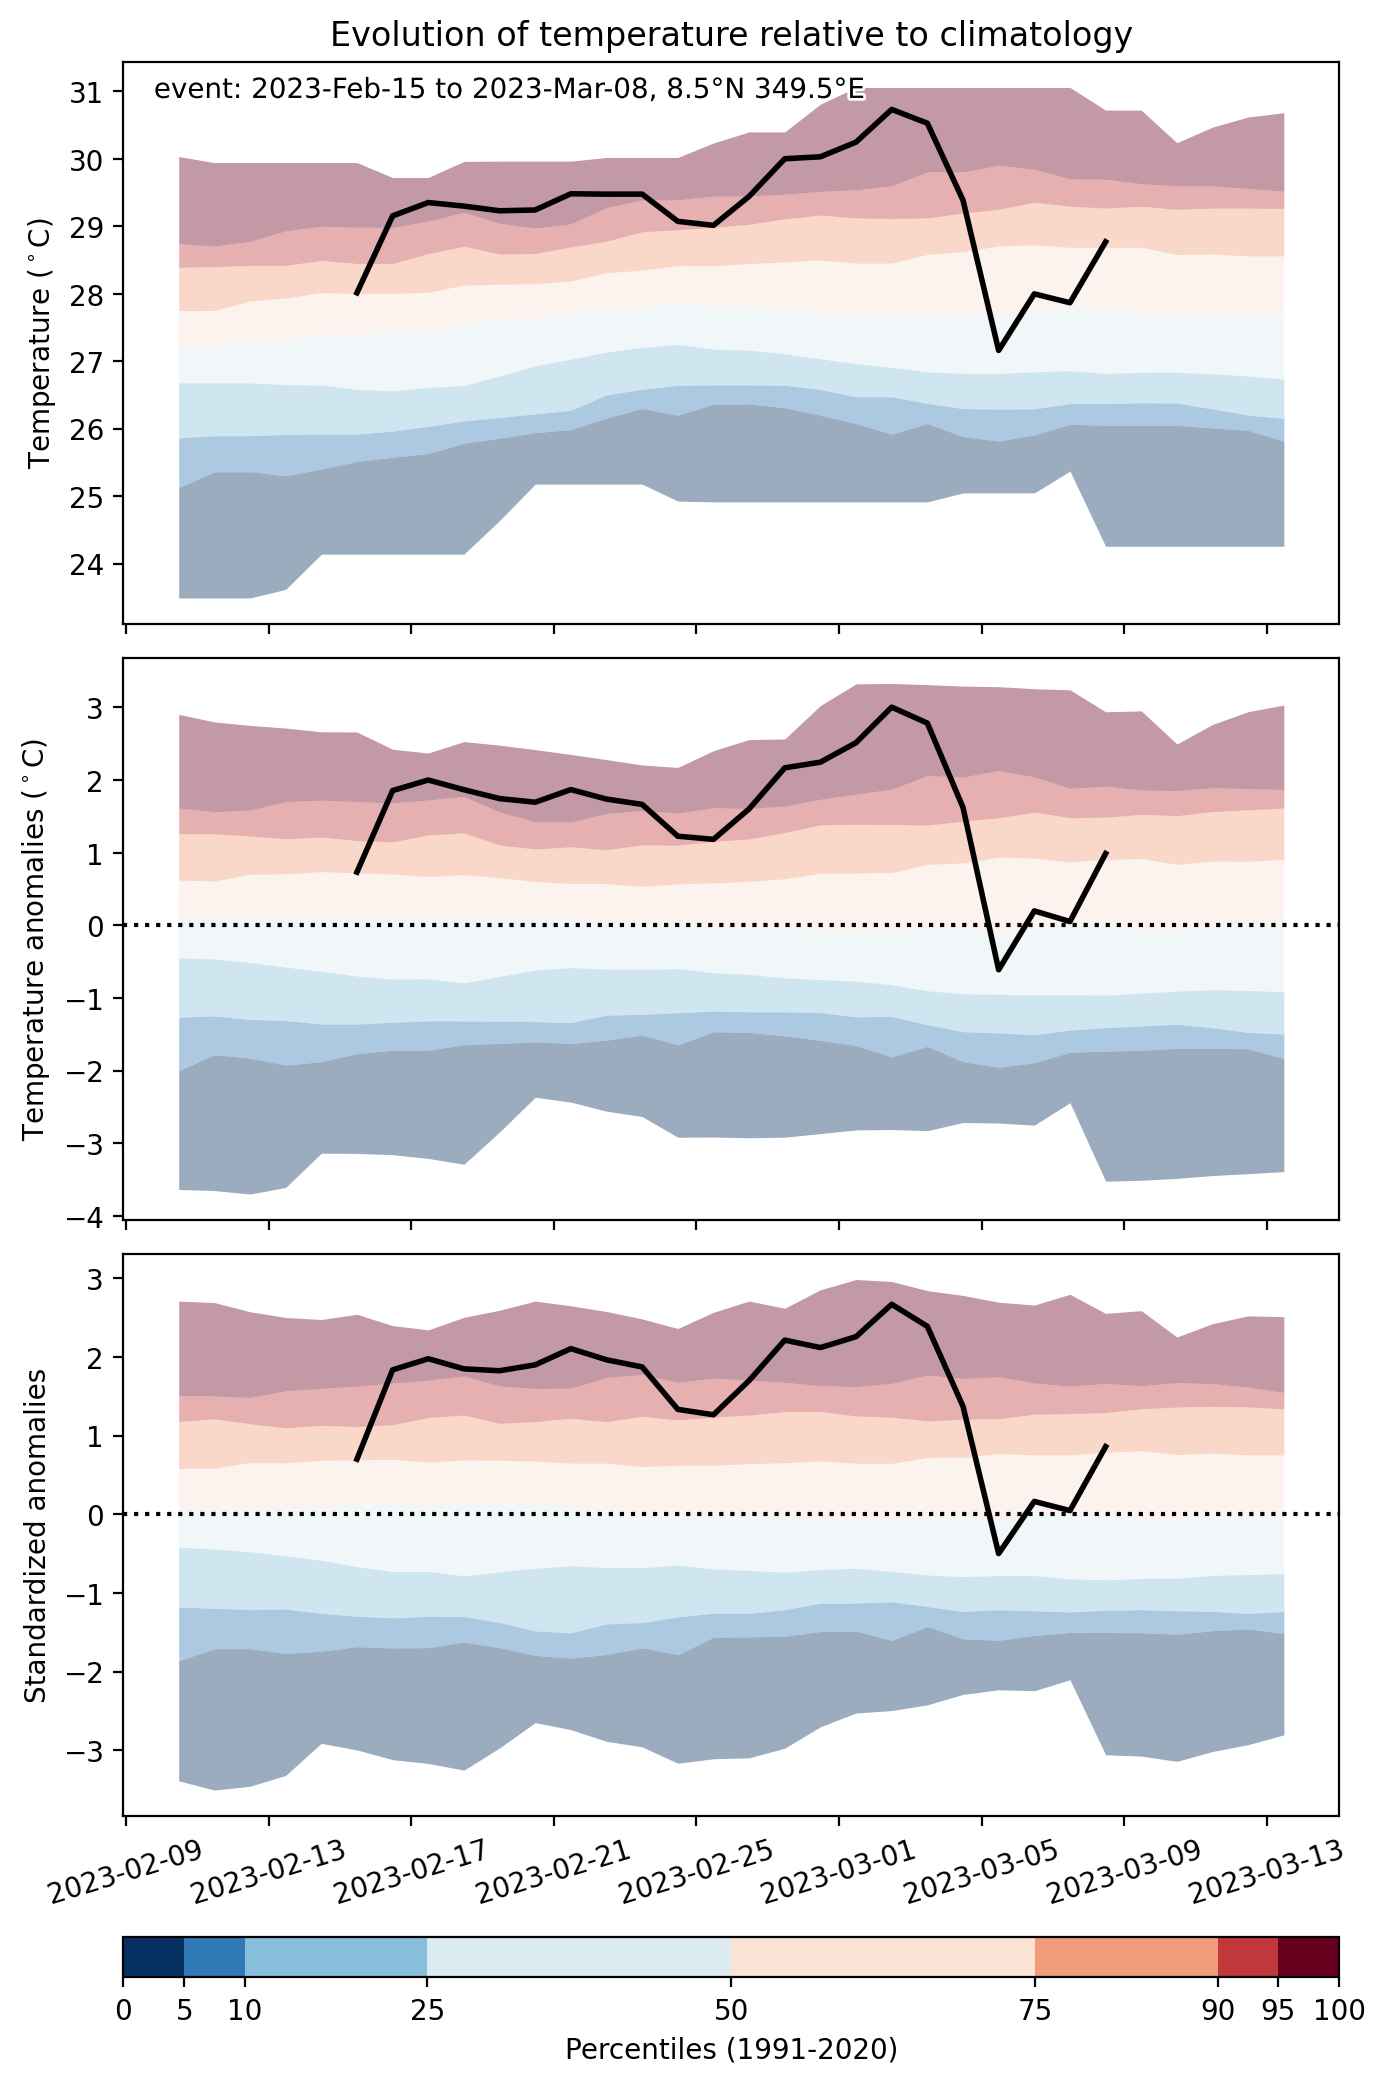
Fig. 2: Evolution of temperature at the center of the event. The climatological percentile distribution is illustrated with color shadings.


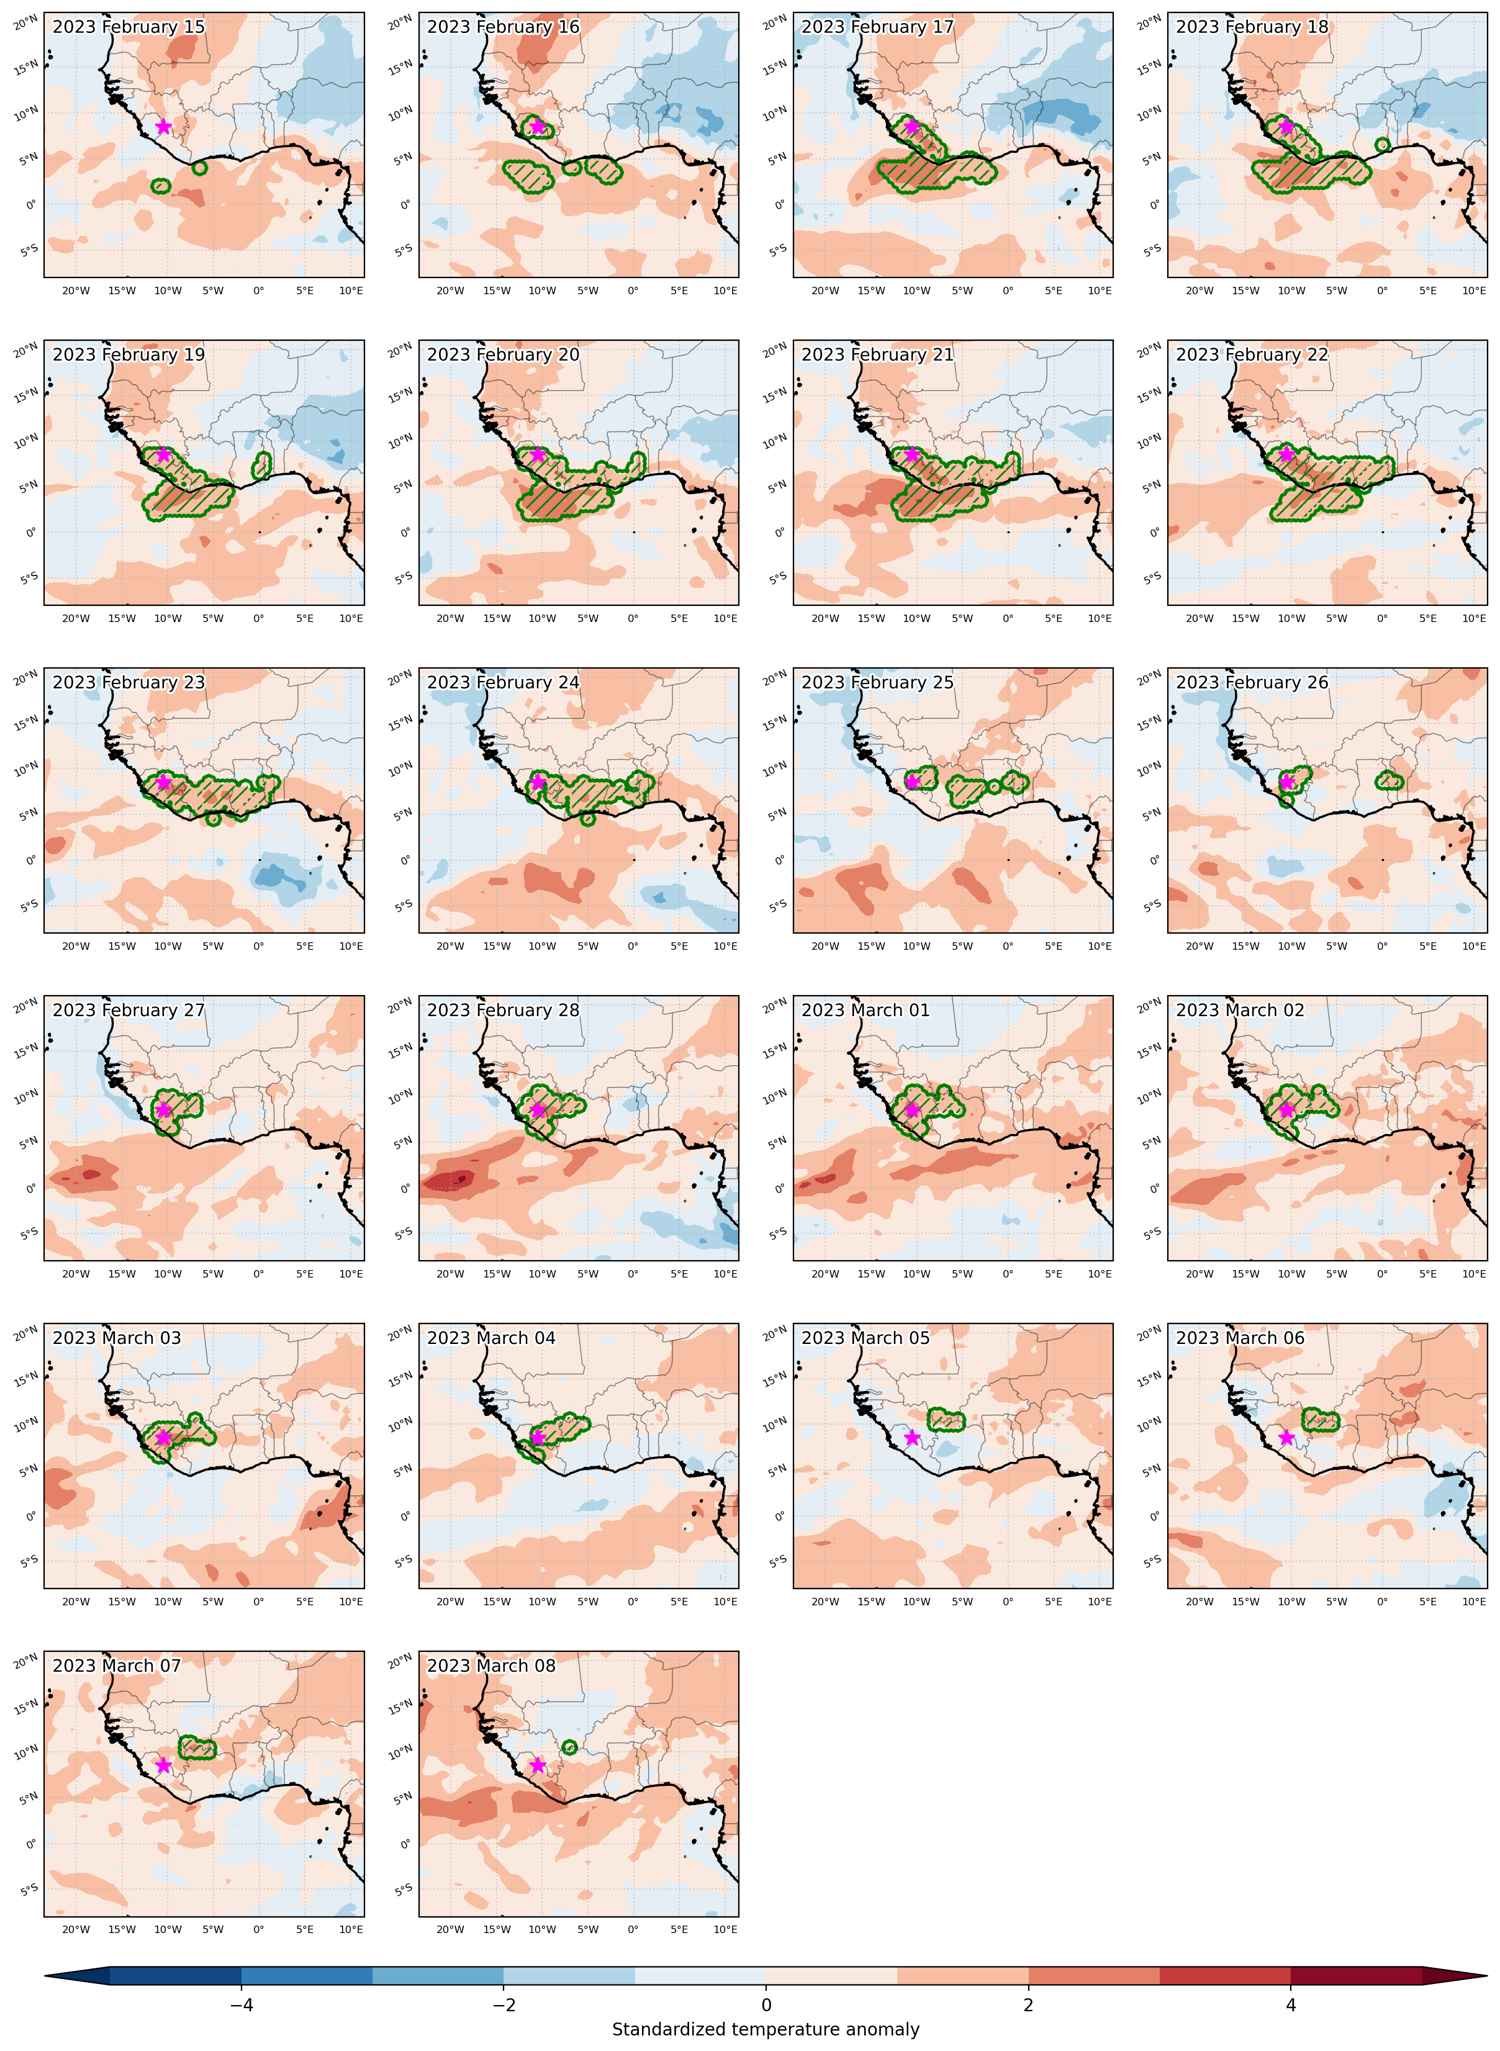
Fig. 3: Maps illustrating the evolution of standardized temperature anomalies during the event.

Event ID: Heat_wave_2023-Feb-15_to_2023-Mar-08_349.5_8.5

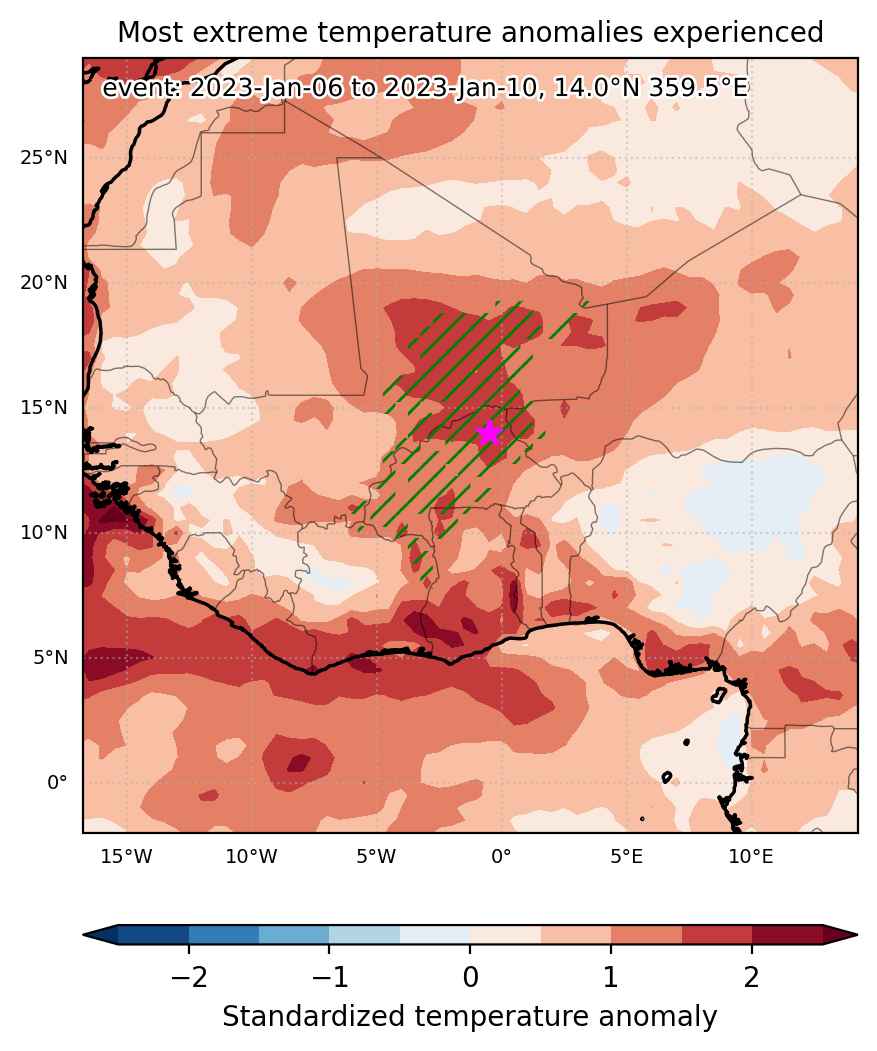
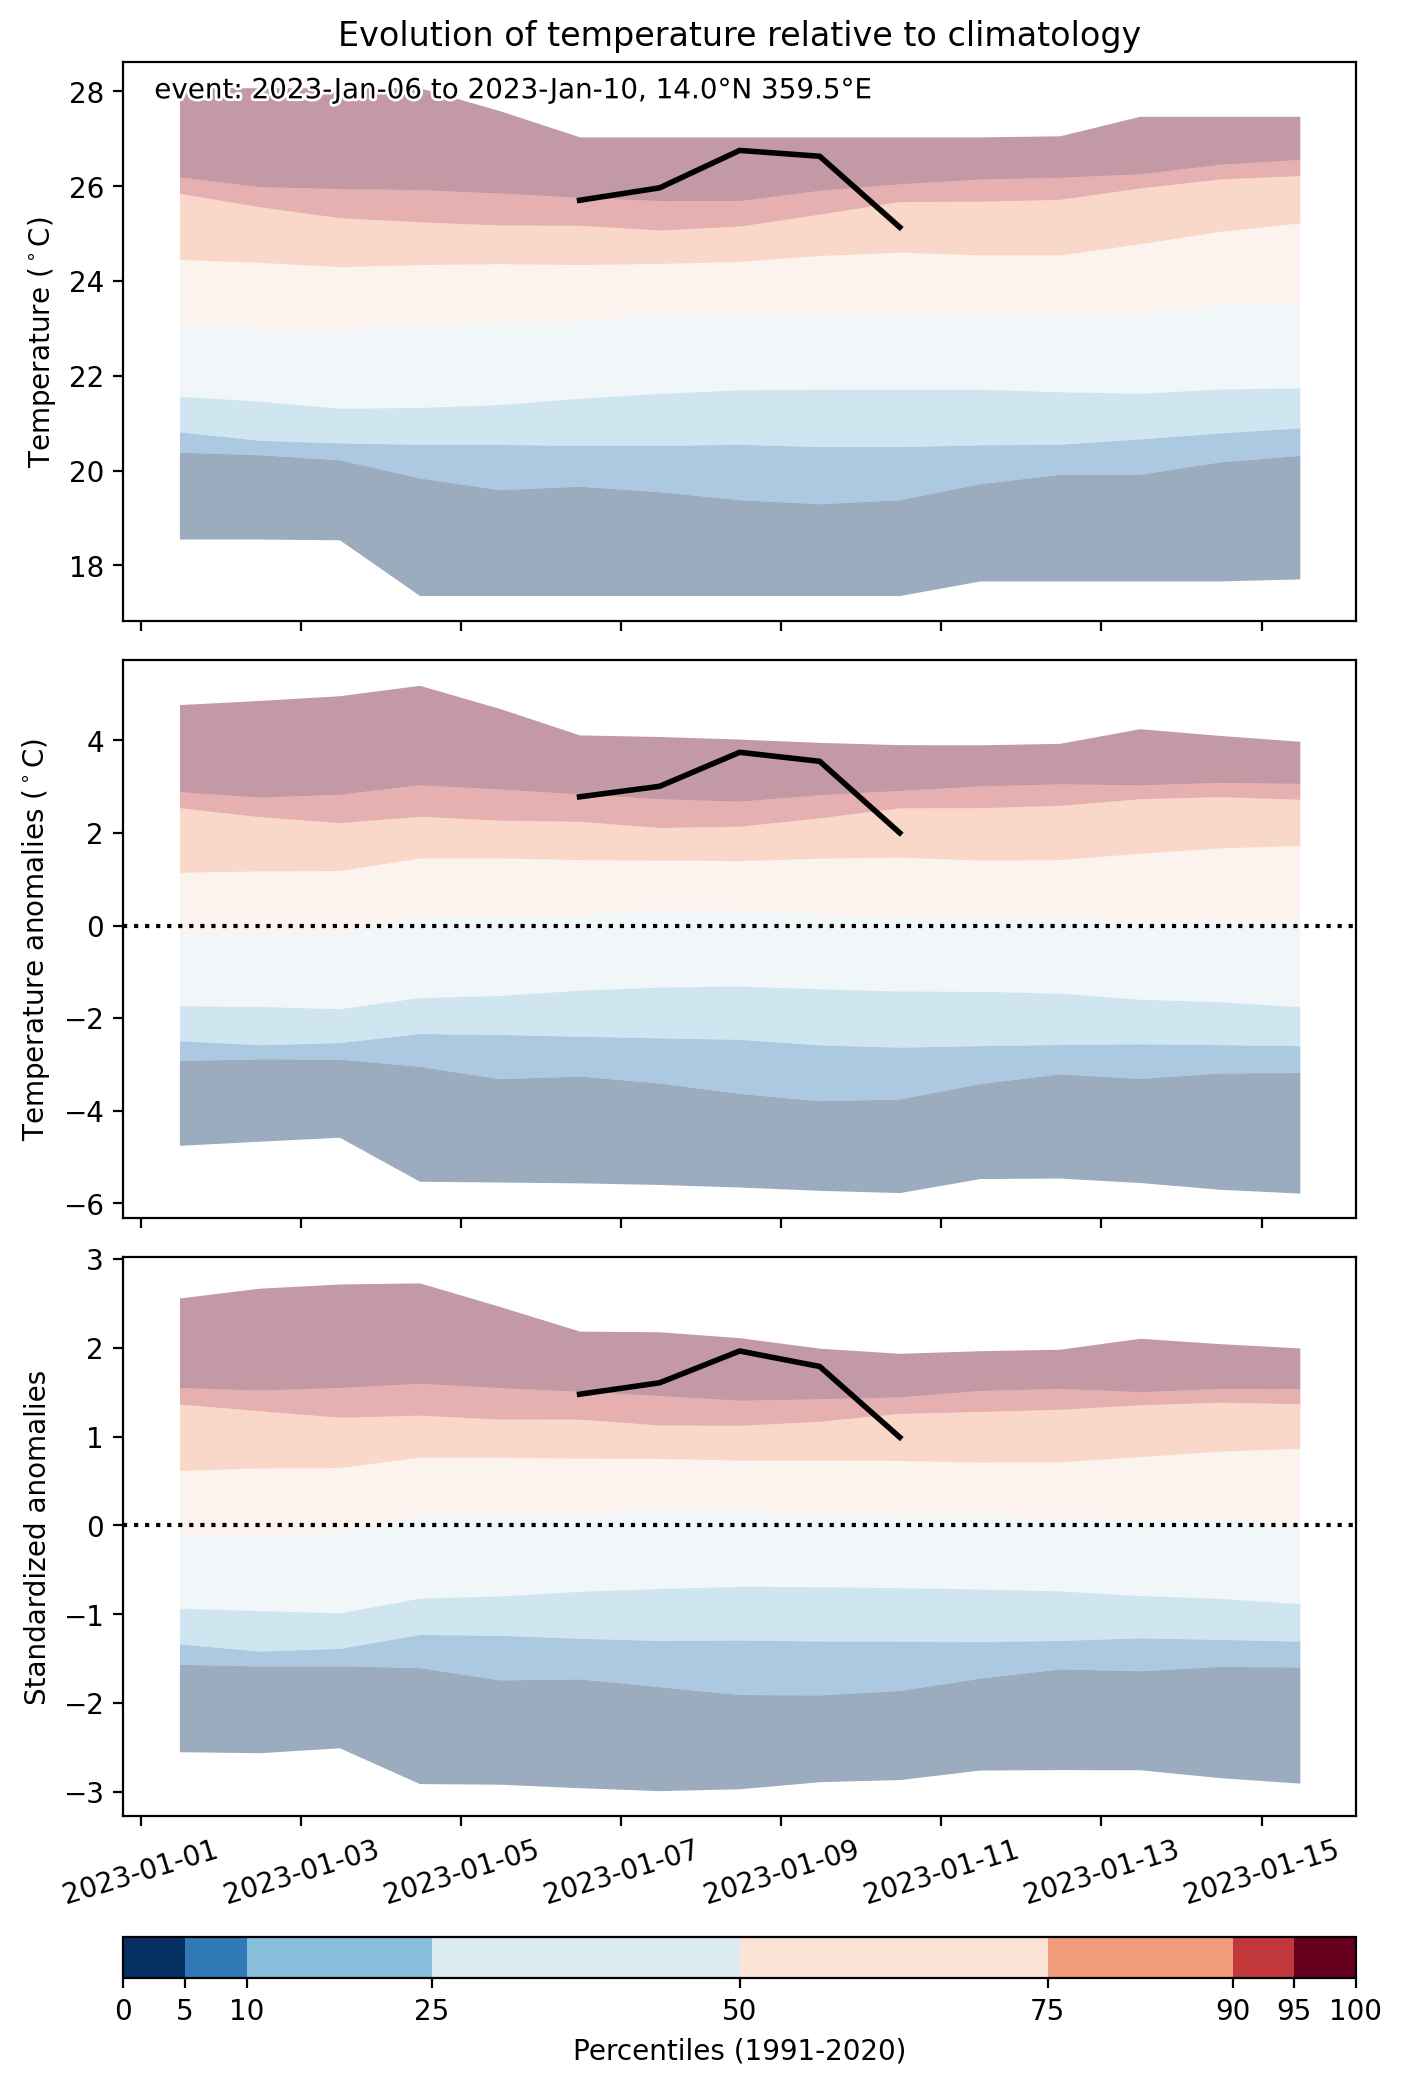
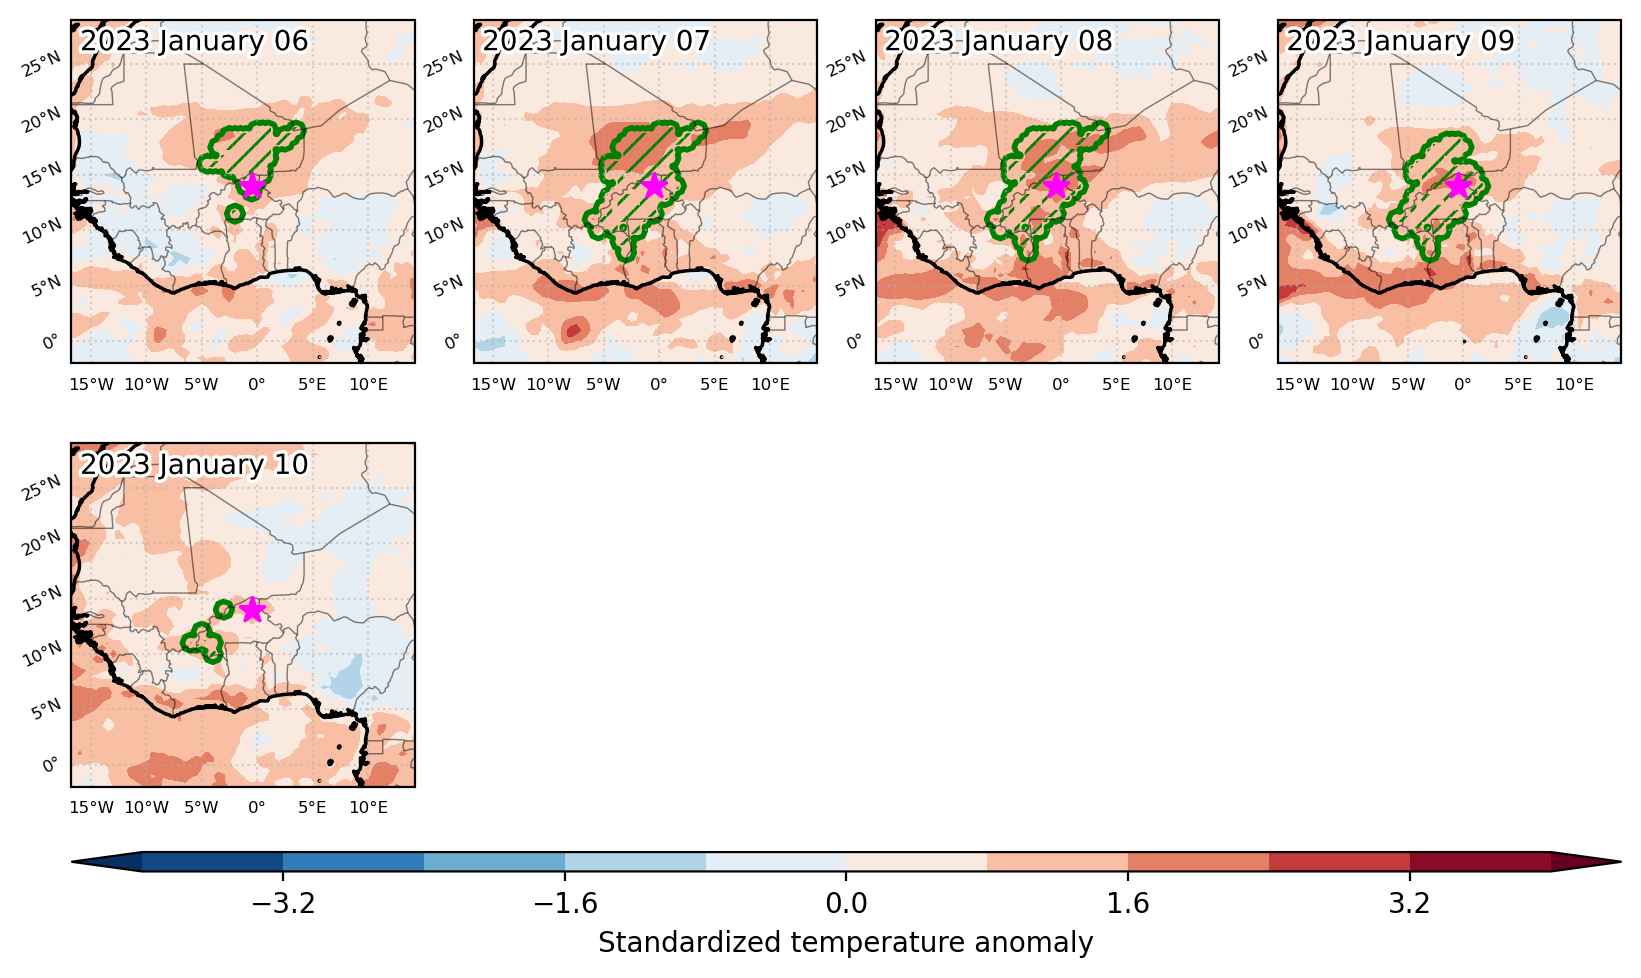
Heat wave occuring from January 06 2023 to January 10 2023 at 14.0°N 359.5°E

Download data: JSON

Event type: Heat wave

Countries affected (identified with ArcGIS Online; provided only for geographical reference):

  • Algeria
  • Burkina Faso
  • Côte d’Ivoire
  • Ghana
  • Mali
  • Niger

Duration: 5 days

Time span: January 06 2023 to January 10 2023

Statistics over entire affected area:

  • Mean temperature anomaly: 2.9 °C
  • Mean temperature: 25.7 °C
  • Maximum temperature anomaly: 4.6 °C
  • Maximum temperature: 29.0 °C

Event center: 14.0°N 359.5°E

Area affected: 507984 km$^2$


Fig. 1: Map of most extreme temperature anomalies (standardized) experienced during the event. The purple star indicates the center of the extreme event. Green hatching illustrates all areas under the effect of extremes at some time during the event.


Fig. 2: Evolution of temperature at the center of the event. The climatological percentile distribution is illustrated with color shadings.


Fig. 3: Maps illustrating the evolution of standardized temperature anomalies during the event.

Event ID: Heat_wave_2023-Jan-06_to_2023-Jan-10_359.5_14.0

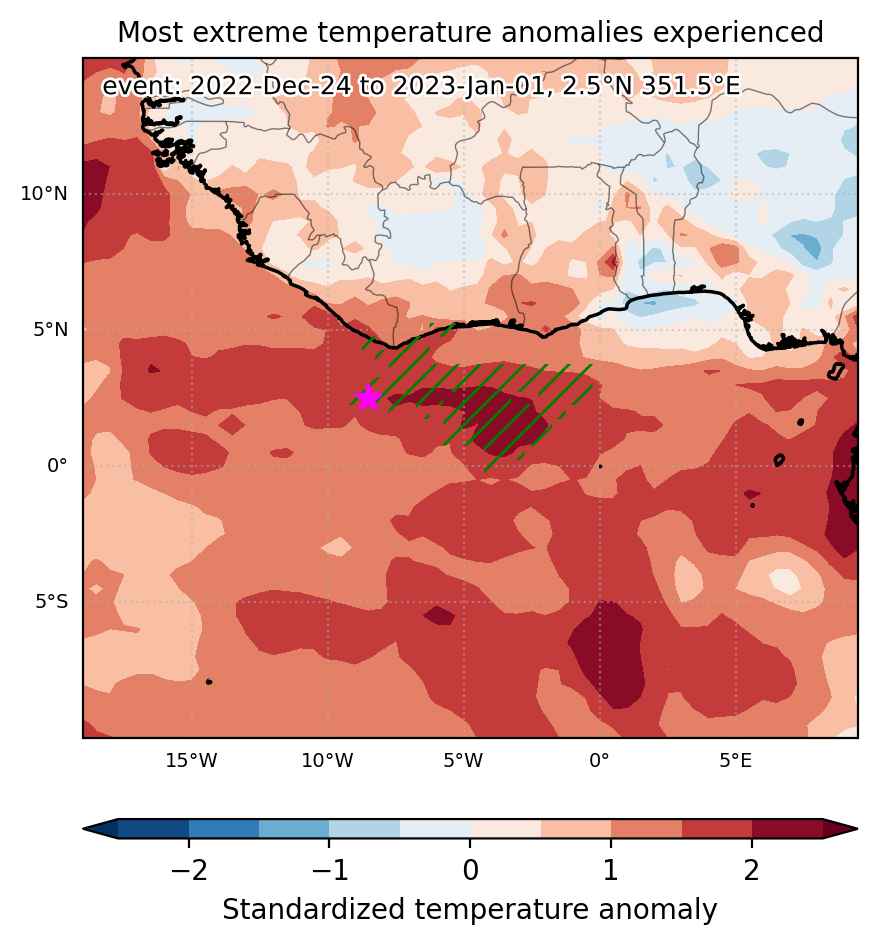
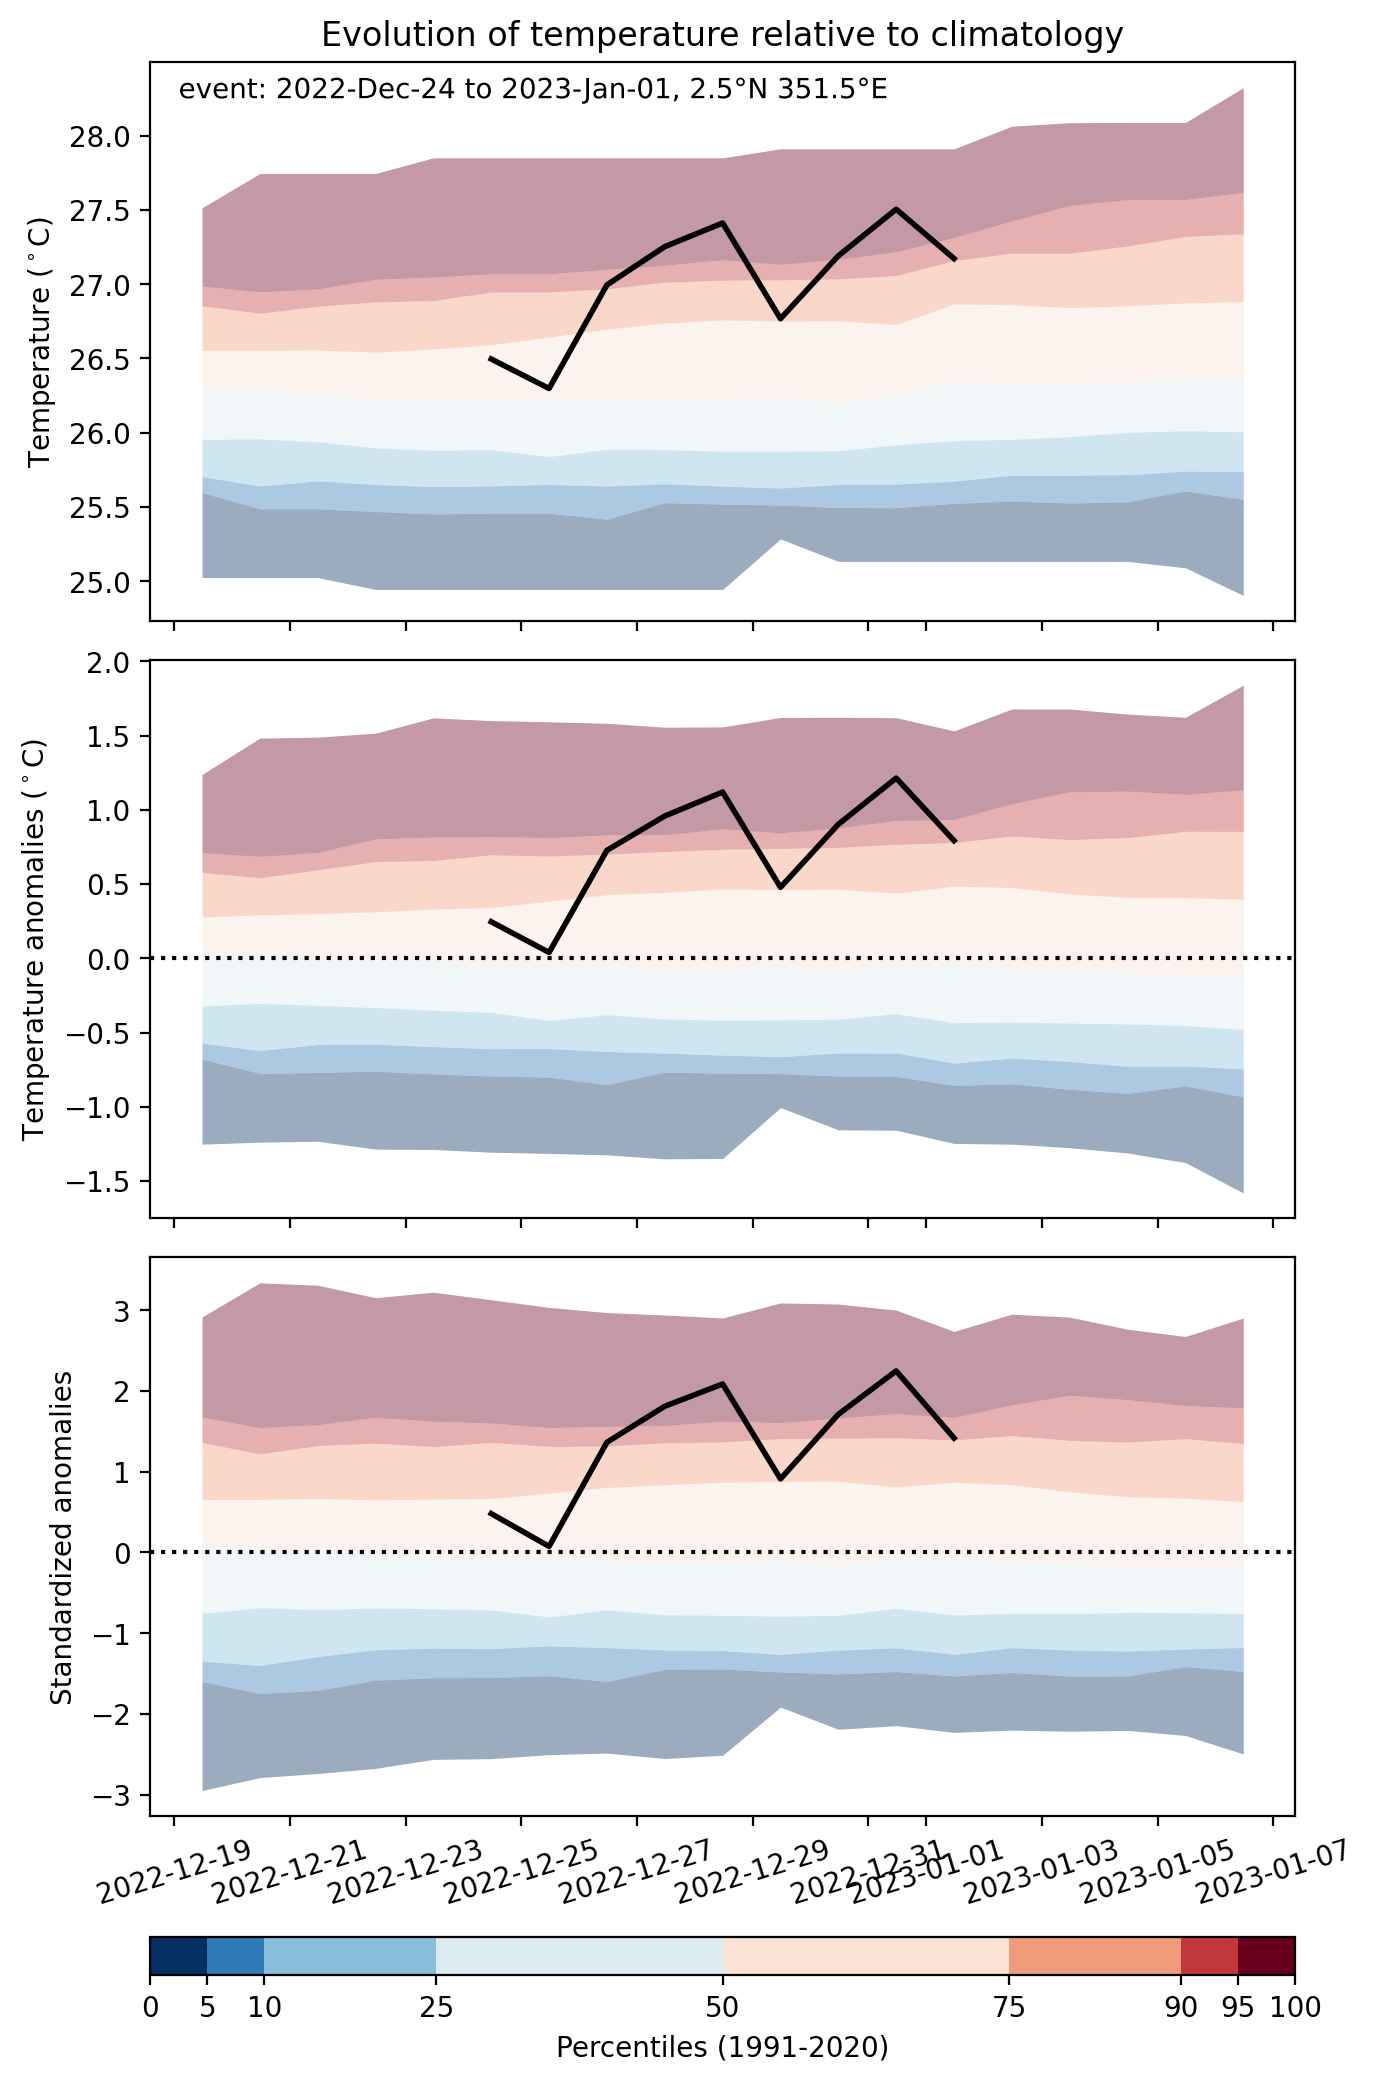
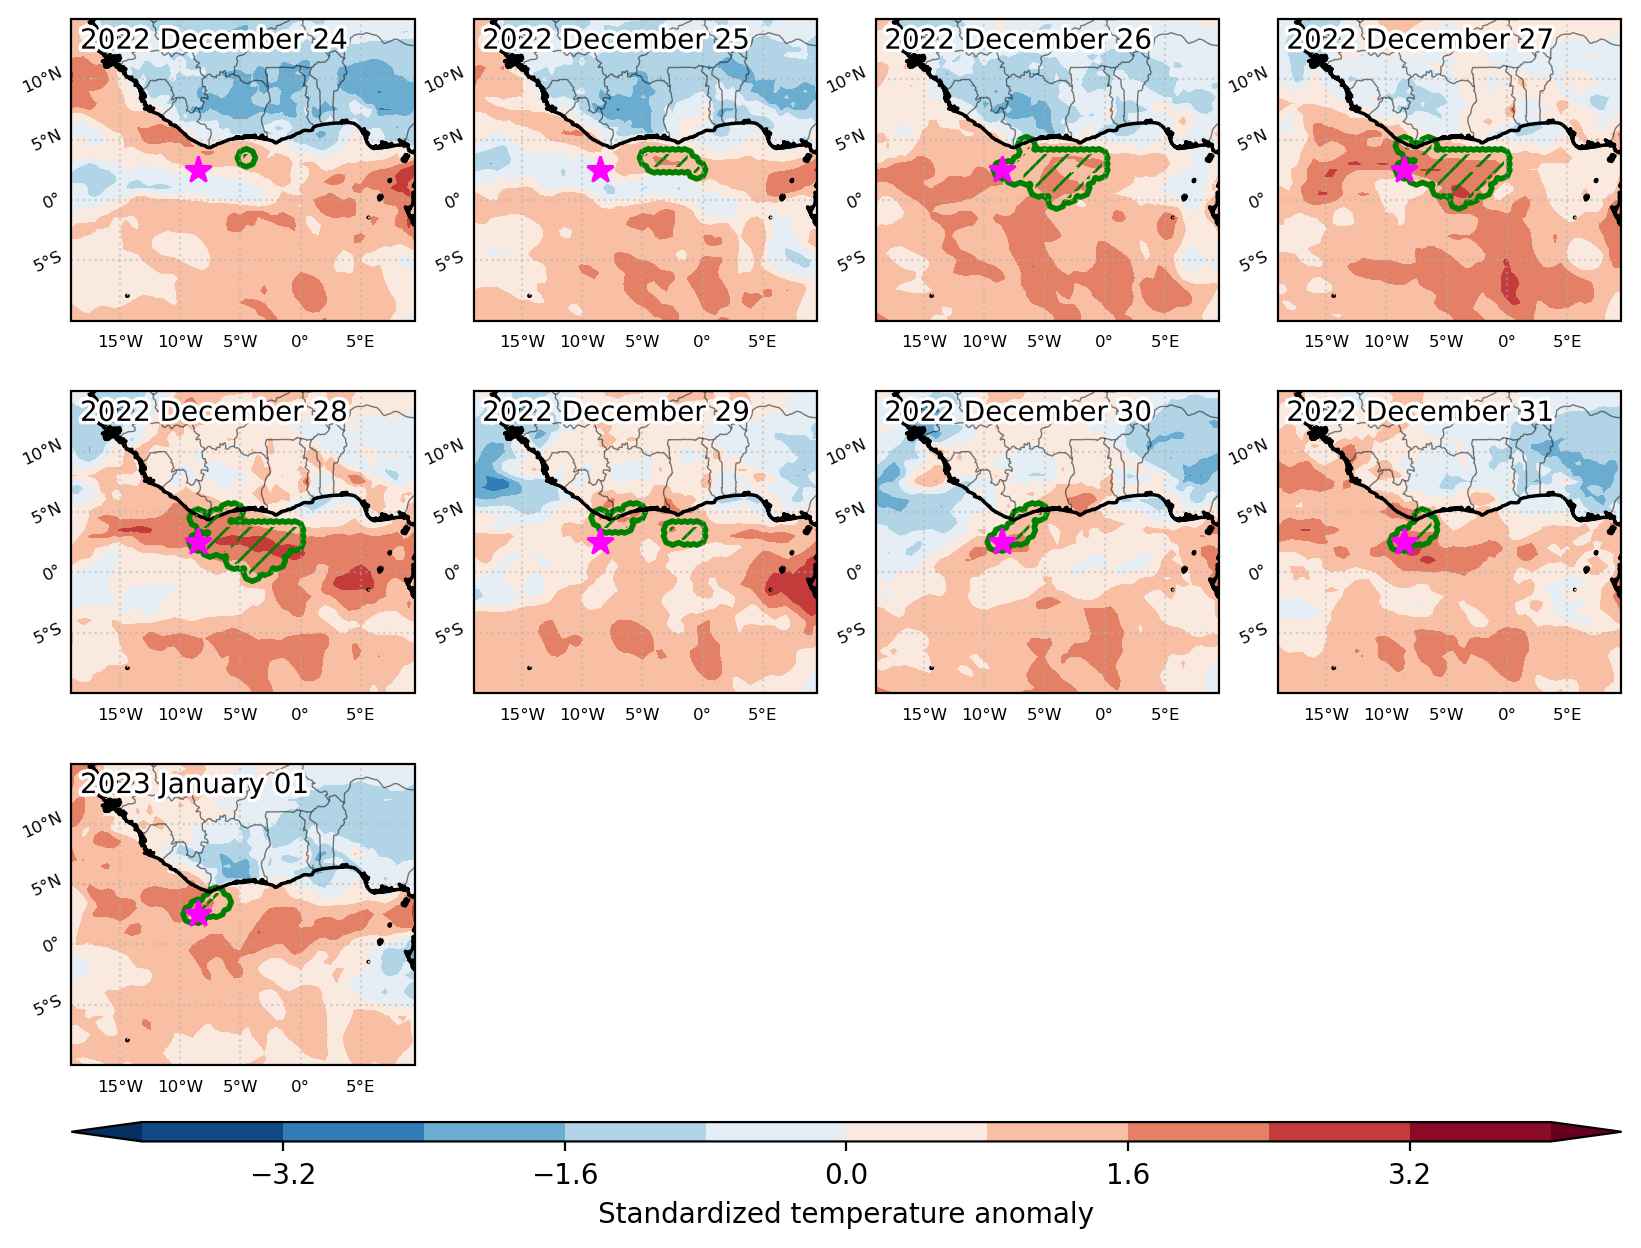
Heat wave occuring from December 24 2022 to January 01 2023 at 2.5°N 351.5°E

Download data: JSON

Event type: Heat wave

Countries affected (identified with ArcGIS Online; provided only for geographical reference):

  • Côte d’Ivoire

Duration: 9 days

Time span: December 24 2022 to January 01 2023

Statistics over entire affected area:

  • Mean temperature anomaly: 0.9 °C
  • Mean temperature: 27.6 °C
  • Maximum temperature anomaly: 1.5 °C
  • Maximum temperature: 28.2 °C

Event center: 2.5°N 351.5°E

Area affected: 268605 km$^2$


Fig. 1: Map of most extreme temperature anomalies (standardized) experienced during the event. The purple star indicates the center of the extreme event. Green hatching illustrates all areas under the effect of extremes at some time during the event.


Fig. 2: Evolution of temperature at the center of the event. The climatological percentile distribution is illustrated with color shadings.


Fig. 3: Maps illustrating the evolution of standardized temperature anomalies during the event.

Event ID: Heat_wave_2022-Dec-24_to_2023-Jan-01_351.5_2.5

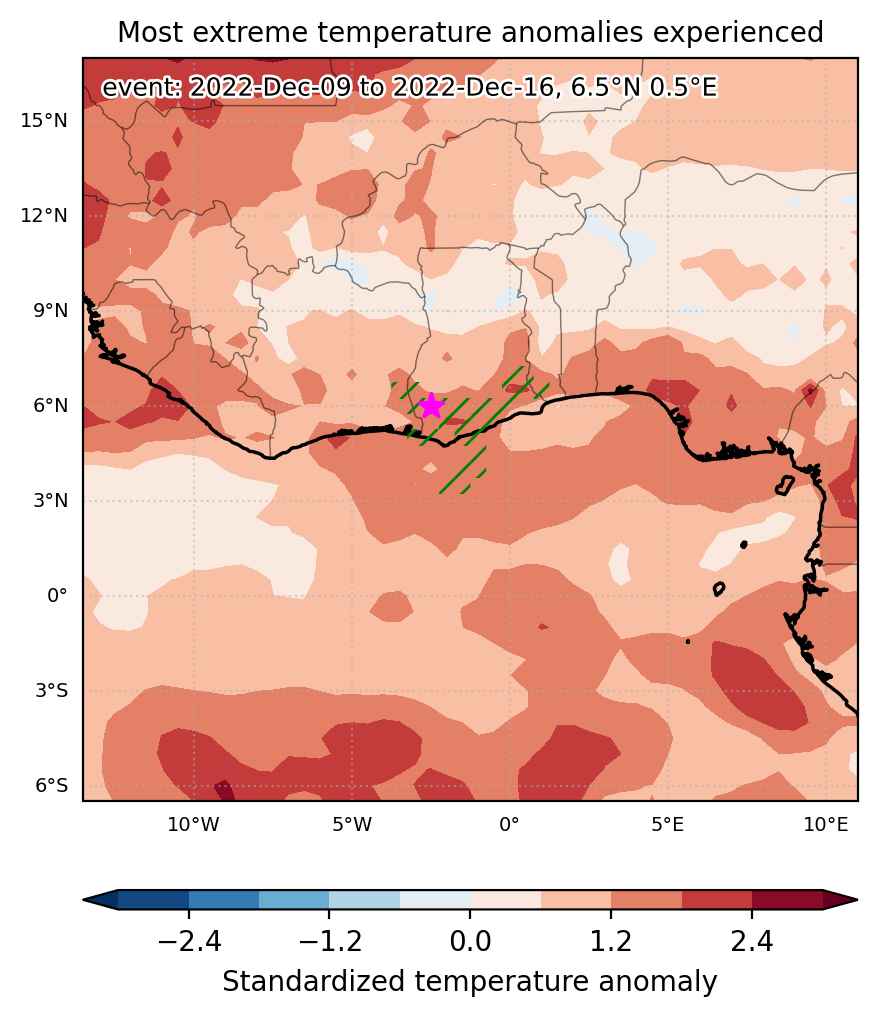
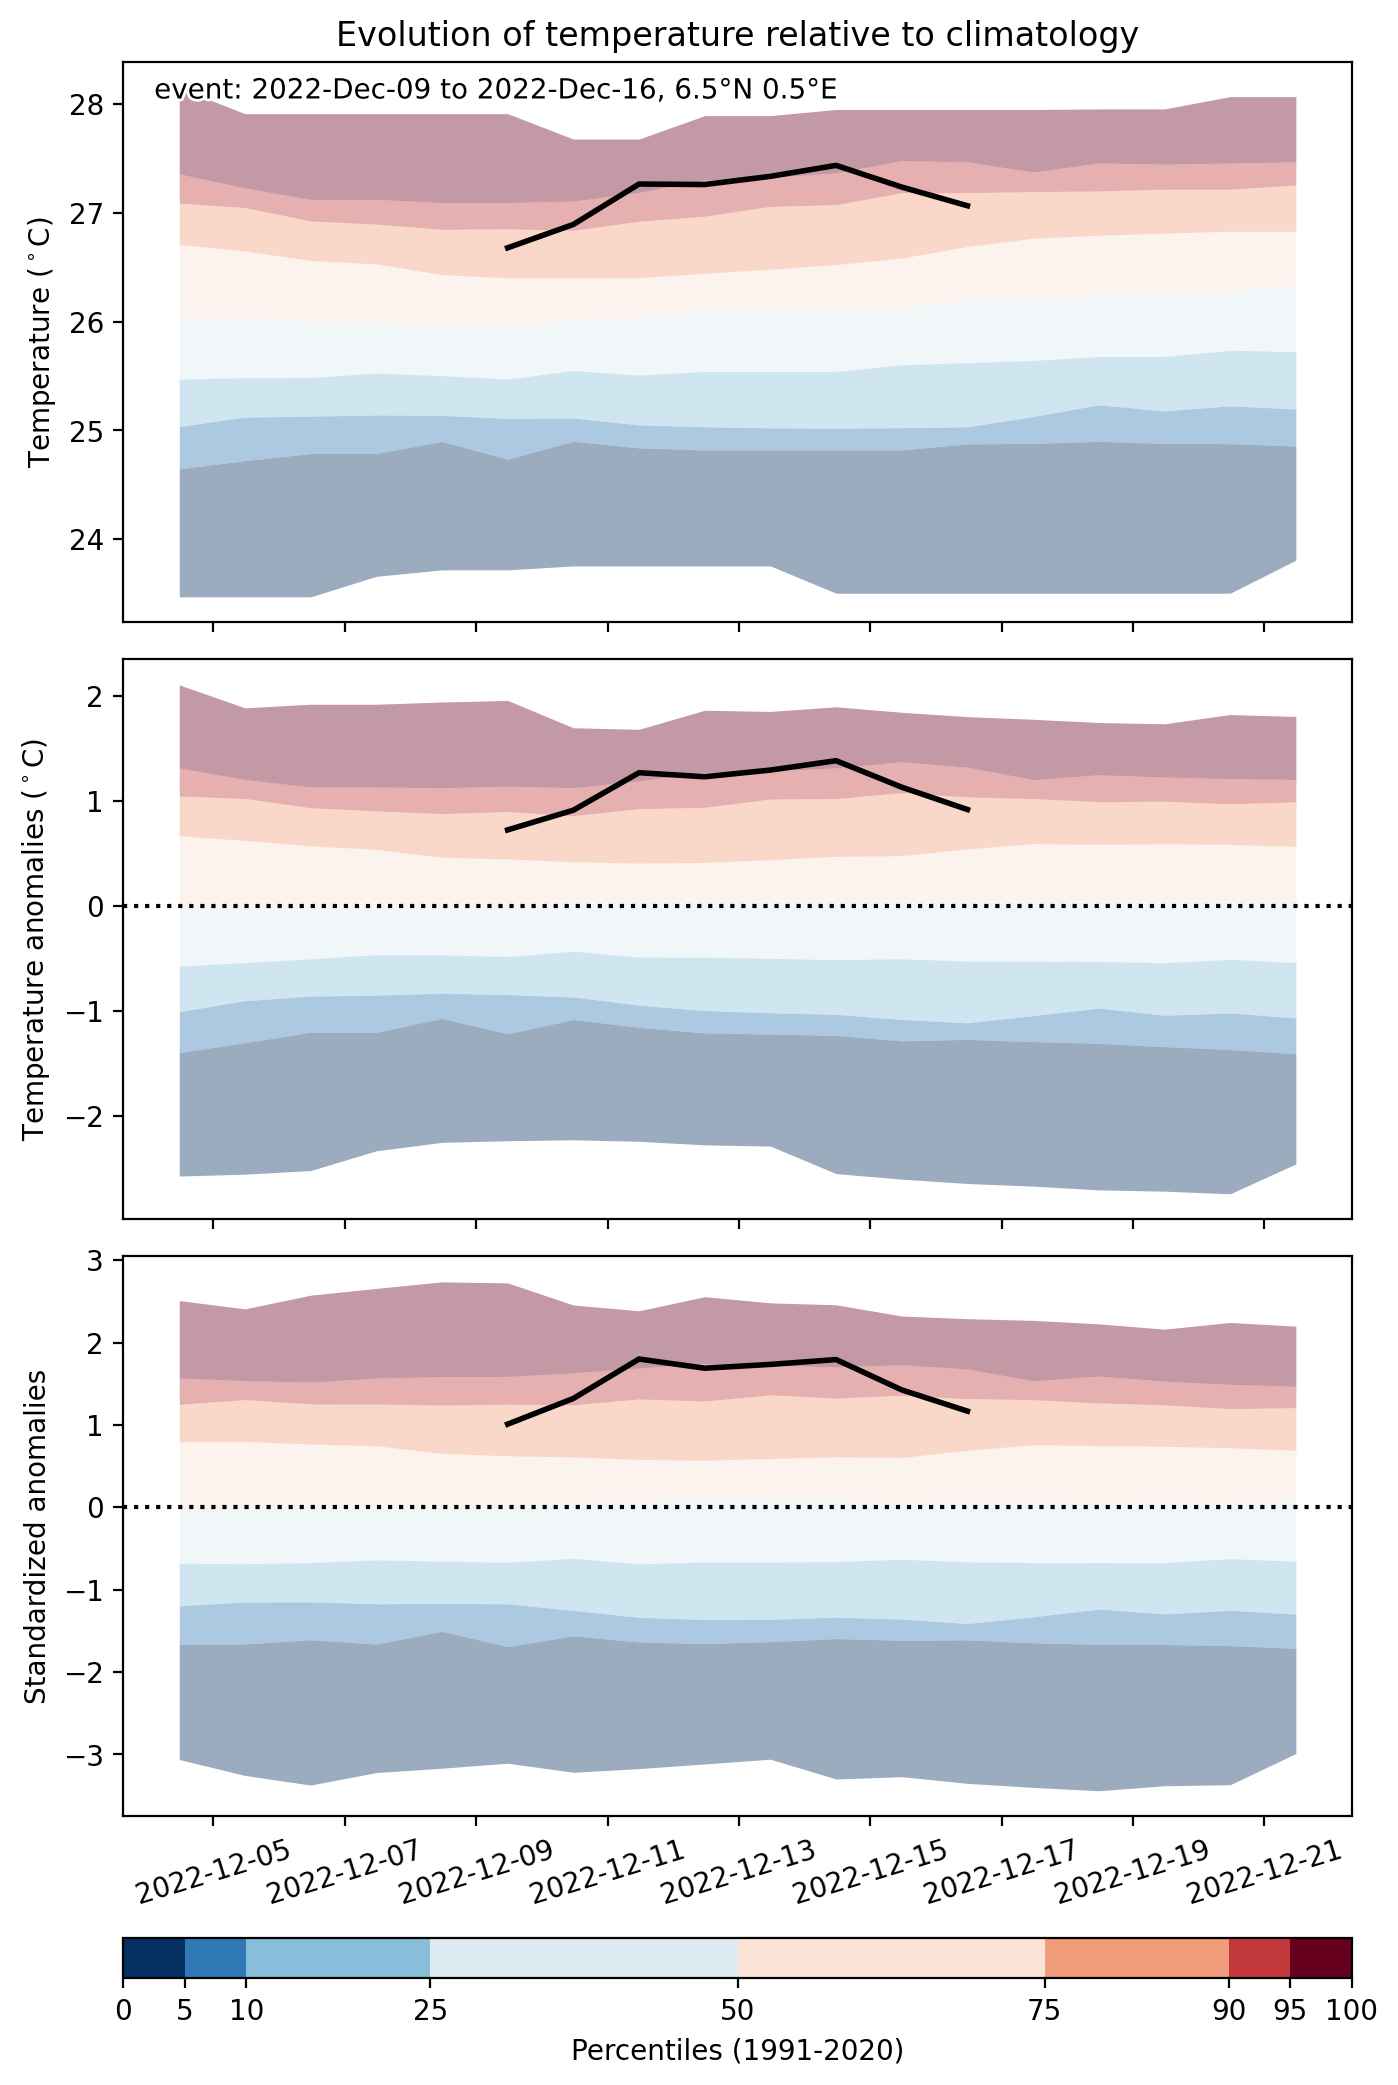
Heat wave occuring from December 09 2022 to December 16 2022 at 6.5°N 0.5°E

Download data: JSON

Event type: Heat wave

Countries affected (identified with ArcGIS Online; provided only for geographical reference):

  • Côte d’Ivoire
  • Ghana
  • Togo

Duration: 8 days

Time span: December 09 2022 to December 16 2022

Statistics over entire affected area:

  • Mean temperature anomaly: 1.0 °C
  • Mean temperature: 27.4 °C
  • Maximum temperature anomaly: 1.4 °C
  • Maximum temperature: 28.3 °C

Event center: 6.0°N 357.5°E

Area affected: 83055 km$^2$


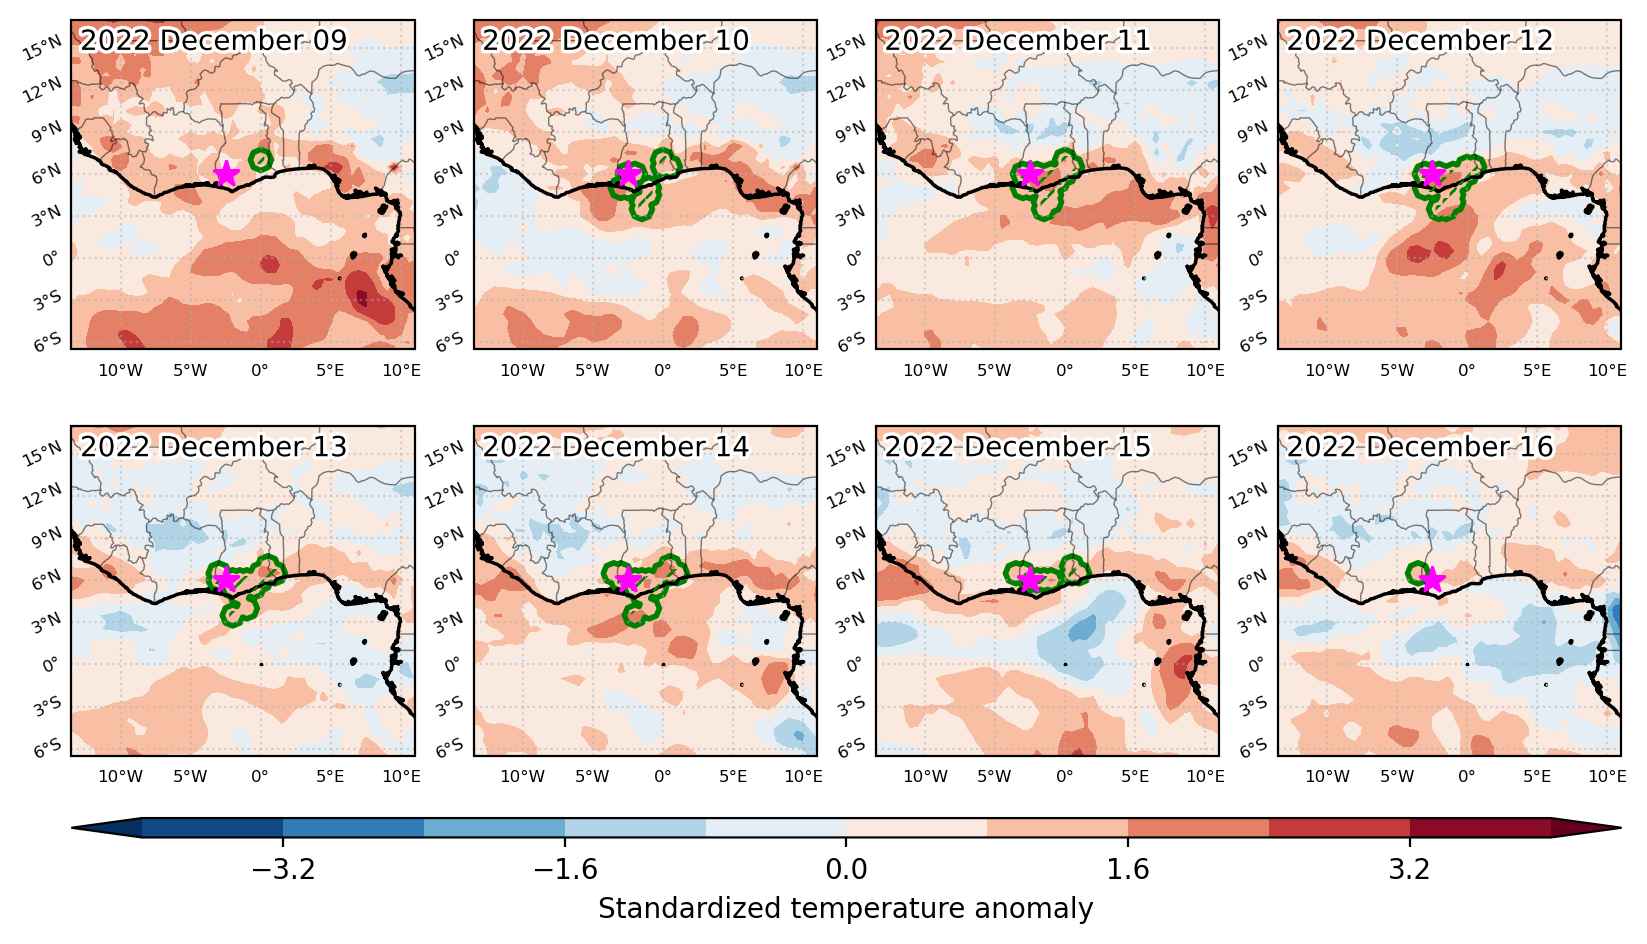
Fig. 1: Map of most extreme temperature anomalies (standardized) experienced during the event. The purple star indicates the center of the extreme event. Green hatching illustrates all areas under the effect of extremes at some time during the event.


Fig. 2: Evolution of temperature at the center of the event. The climatological percentile distribution is illustrated with color shadings.


Fig. 3: Maps illustrating the evolution of standardized temperature anomalies during the event.

Event ID: Heat_wave_2022-Dec-09_to_2022-Dec-16_0.5_6.5

Heat wave occuring from November 01 2022 to February 23 2023 at -13.5°S 355.0°E

Download data: JSON

Event type: Heat wave

Countries affected (identified with ArcGIS Online; provided only for geographical reference):

  • Algeria
  • Angola
  • Antarctica
  • Argentina
  • Benin
  • Bolivia, Plurinational State of
  • Brazil
  • Burkina Faso
  • Cameroon
  • Chile
  • Congo
  • Côte d’Ivoire
  • Equatorial Guinea
  • Eswatini
  • Gabon
  • Gambia
  • Ghana
  • Guinea
  • Guinea-Bissau
  • Liberia
  • Madagascar
  • Mali
  • Mauritania
  • Morocco
  • Mozambique
  • Namibia
  • Niger
  • Nigeria
  • Paraguay
  • Peru
  • Senegal
  • Sierra Leone
  • South Africa
  • Togo
  • Uruguay

Duration: 115 days

Time span: November 01 2022 to February 23 2023

Statistics over entire affected area:

  • Mean temperature anomaly: 2.3 °C
  • Mean temperature: 17.9 °C
  • Maximum temperature anomaly: 12.2 °C
  • Maximum temperature: 38.9 °C

Event center: -13.5°S 355.0°E

Area affected: 48958616 km$^2$


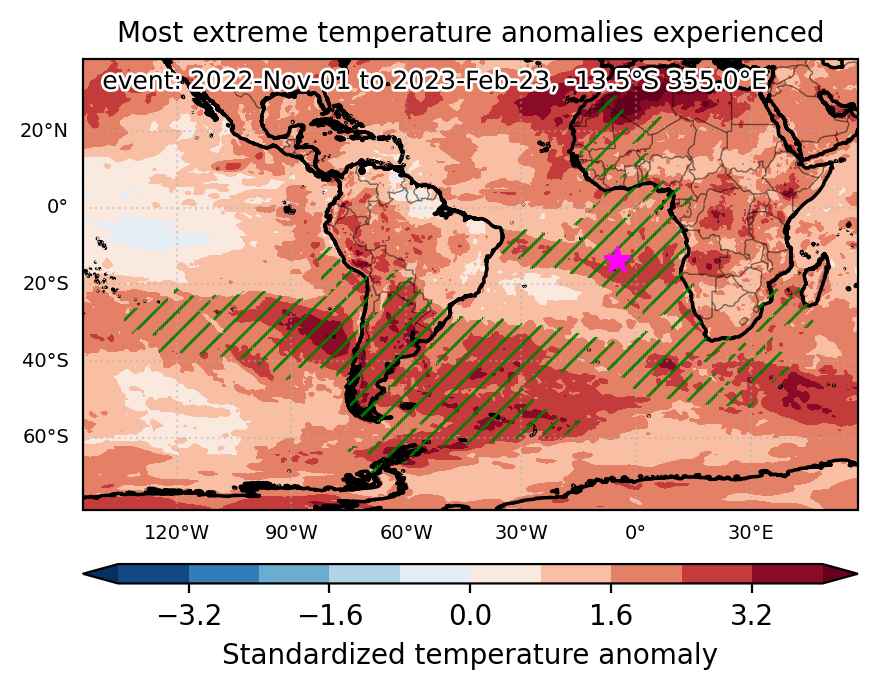
Fig. 1: Map of most extreme temperature anomalies (standardized) experienced during the event. The purple star indicates the center of the extreme event. Green hatching illustrates all areas under the effect of extremes at some time during the event.


Fig. 2: Evolution of temperature at the center of the event. The climatological percentile distribution is illustrated with color shadings.


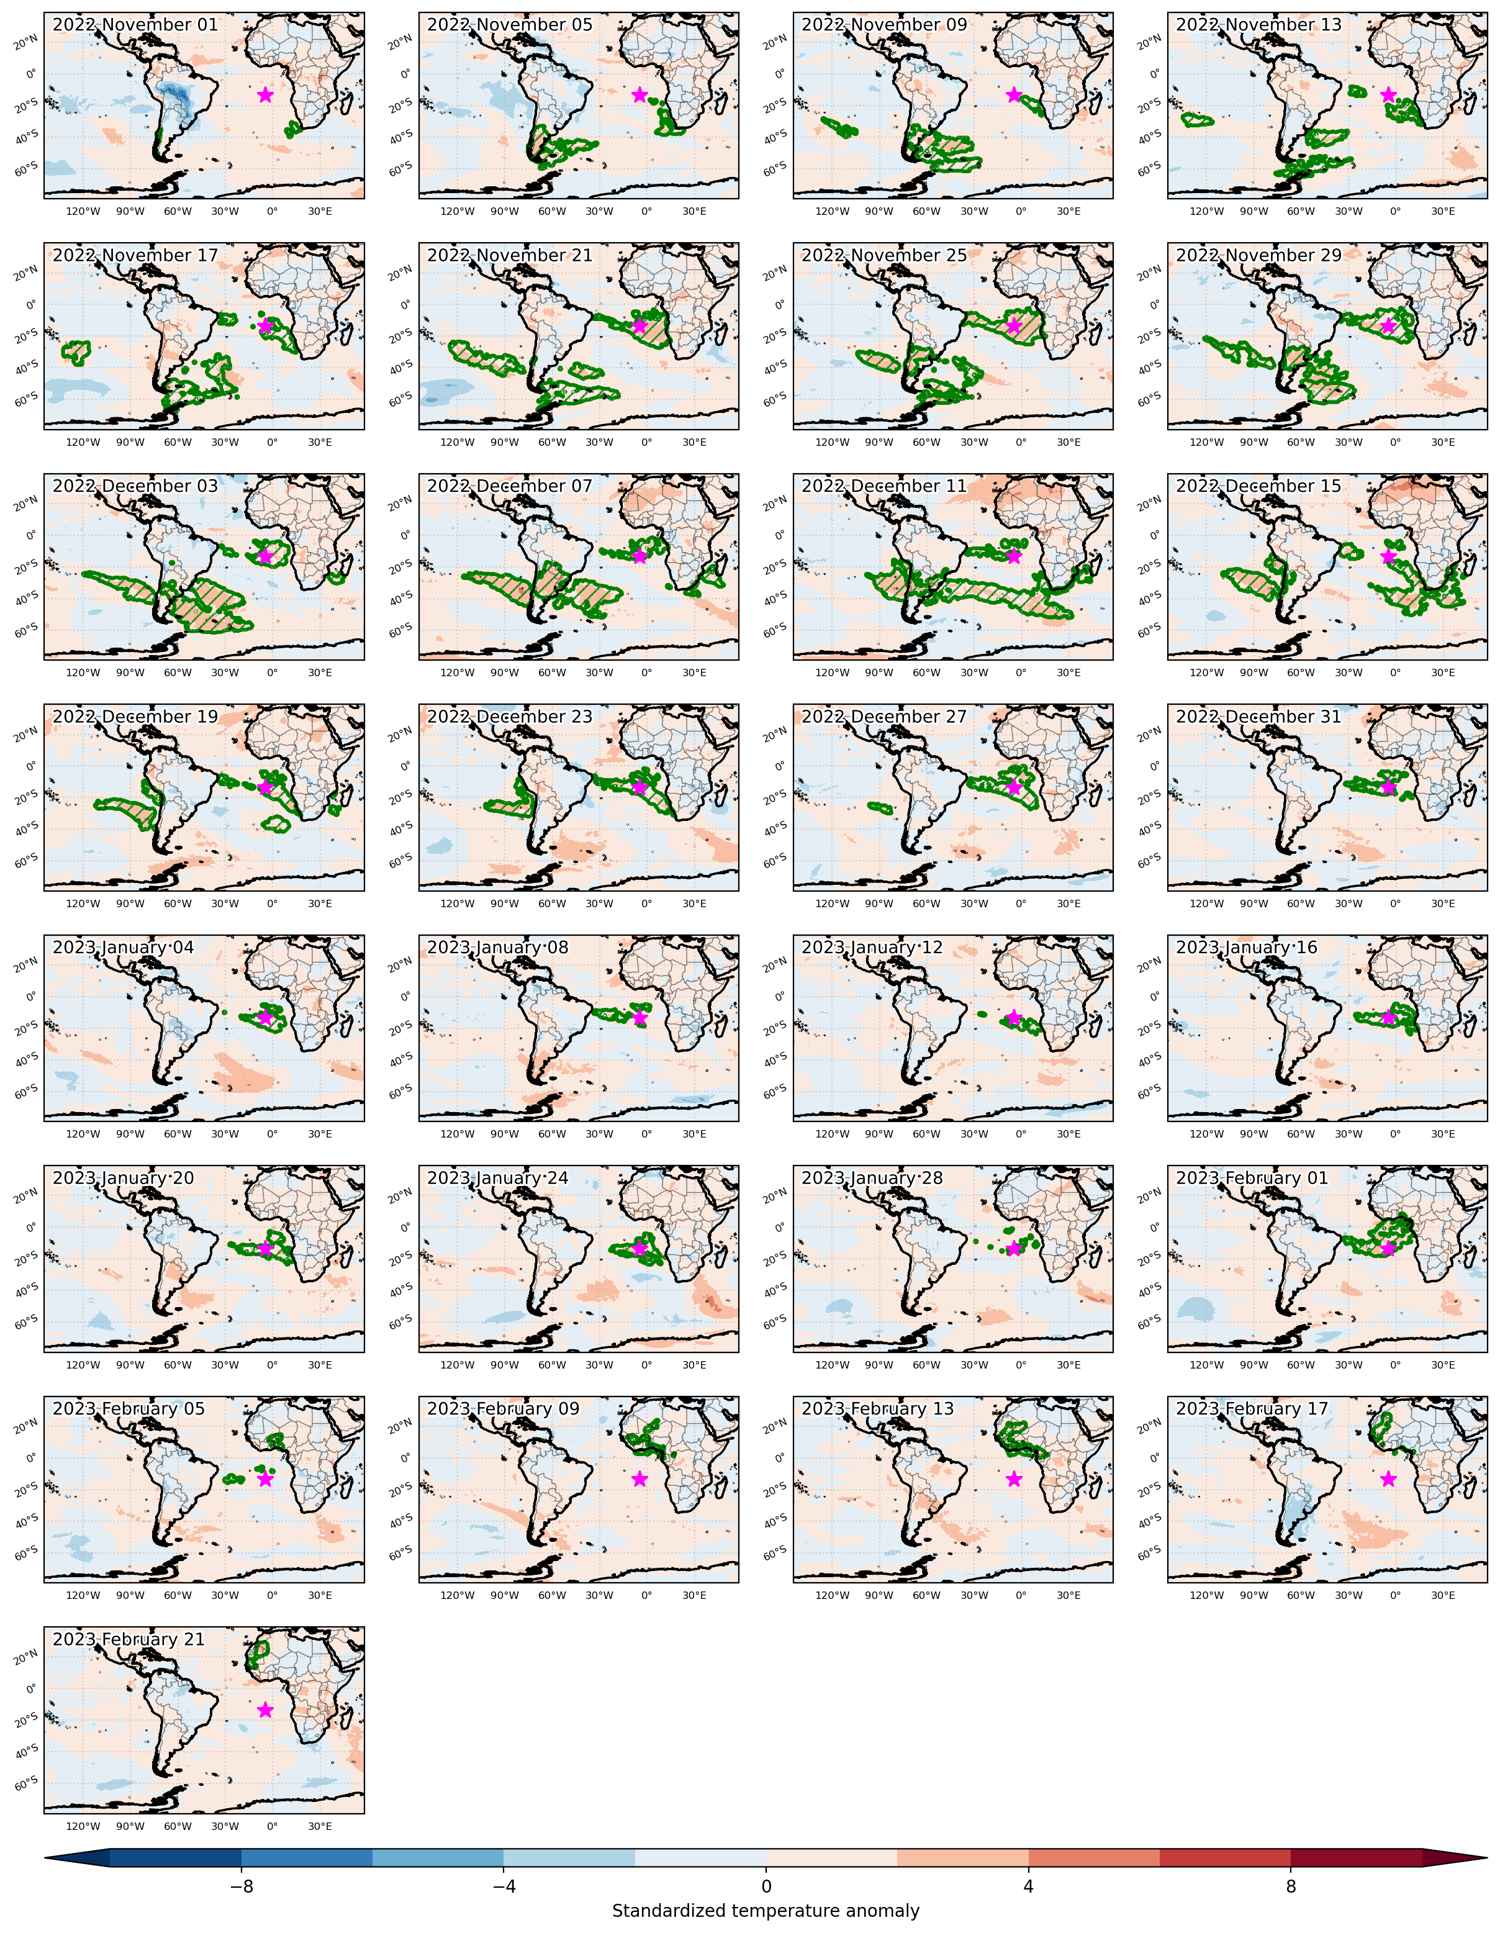
Fig. 3: Maps illustrating the evolution of standardized temperature anomalies during the event.

Event ID: Heat_wave_2022-Nov-01_to_2023-Feb-23_355.0_-13.5

Heat wave occuring from October 22 2022 to October 28 2022 at 9.0°N 356.5°E

Download data: JSON

Event type: Heat wave

Countries affected (identified with ArcGIS Online; provided only for geographical reference):

  • Burkina Faso
  • Côte d’Ivoire
  • Ghana

Duration: 7 days

Time span: October 22 2022 to October 28 2022

Statistics over entire affected area:

  • Mean temperature anomaly: 1.5 °C
  • Mean temperature: 28.3 °C
  • Maximum temperature anomaly: 2.2 °C
  • Maximum temperature: 30.5 °C

Event center: 9.0°N 356.5°E

Area affected: 122100 km$^2$


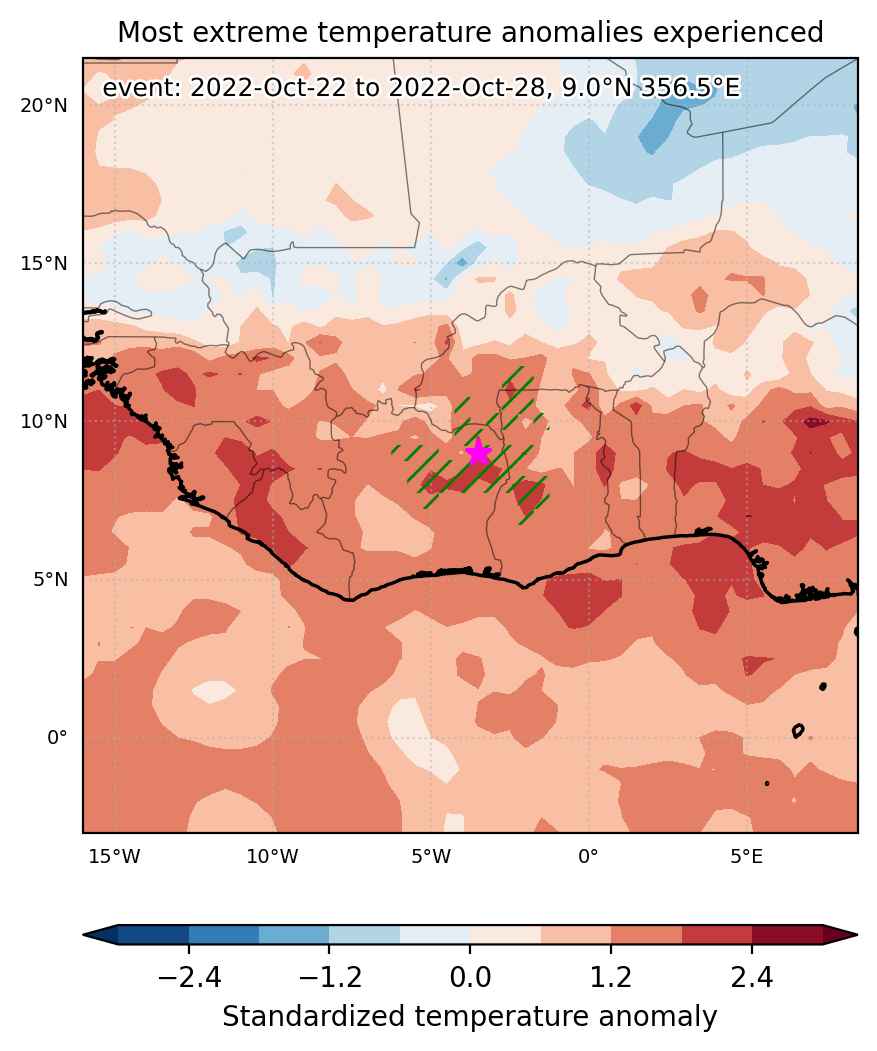
Fig. 1: Map of most extreme temperature anomalies (standardized) experienced during the event. The purple star indicates the center of the extreme event. Green hatching illustrates all areas under the effect of extremes at some time during the event.


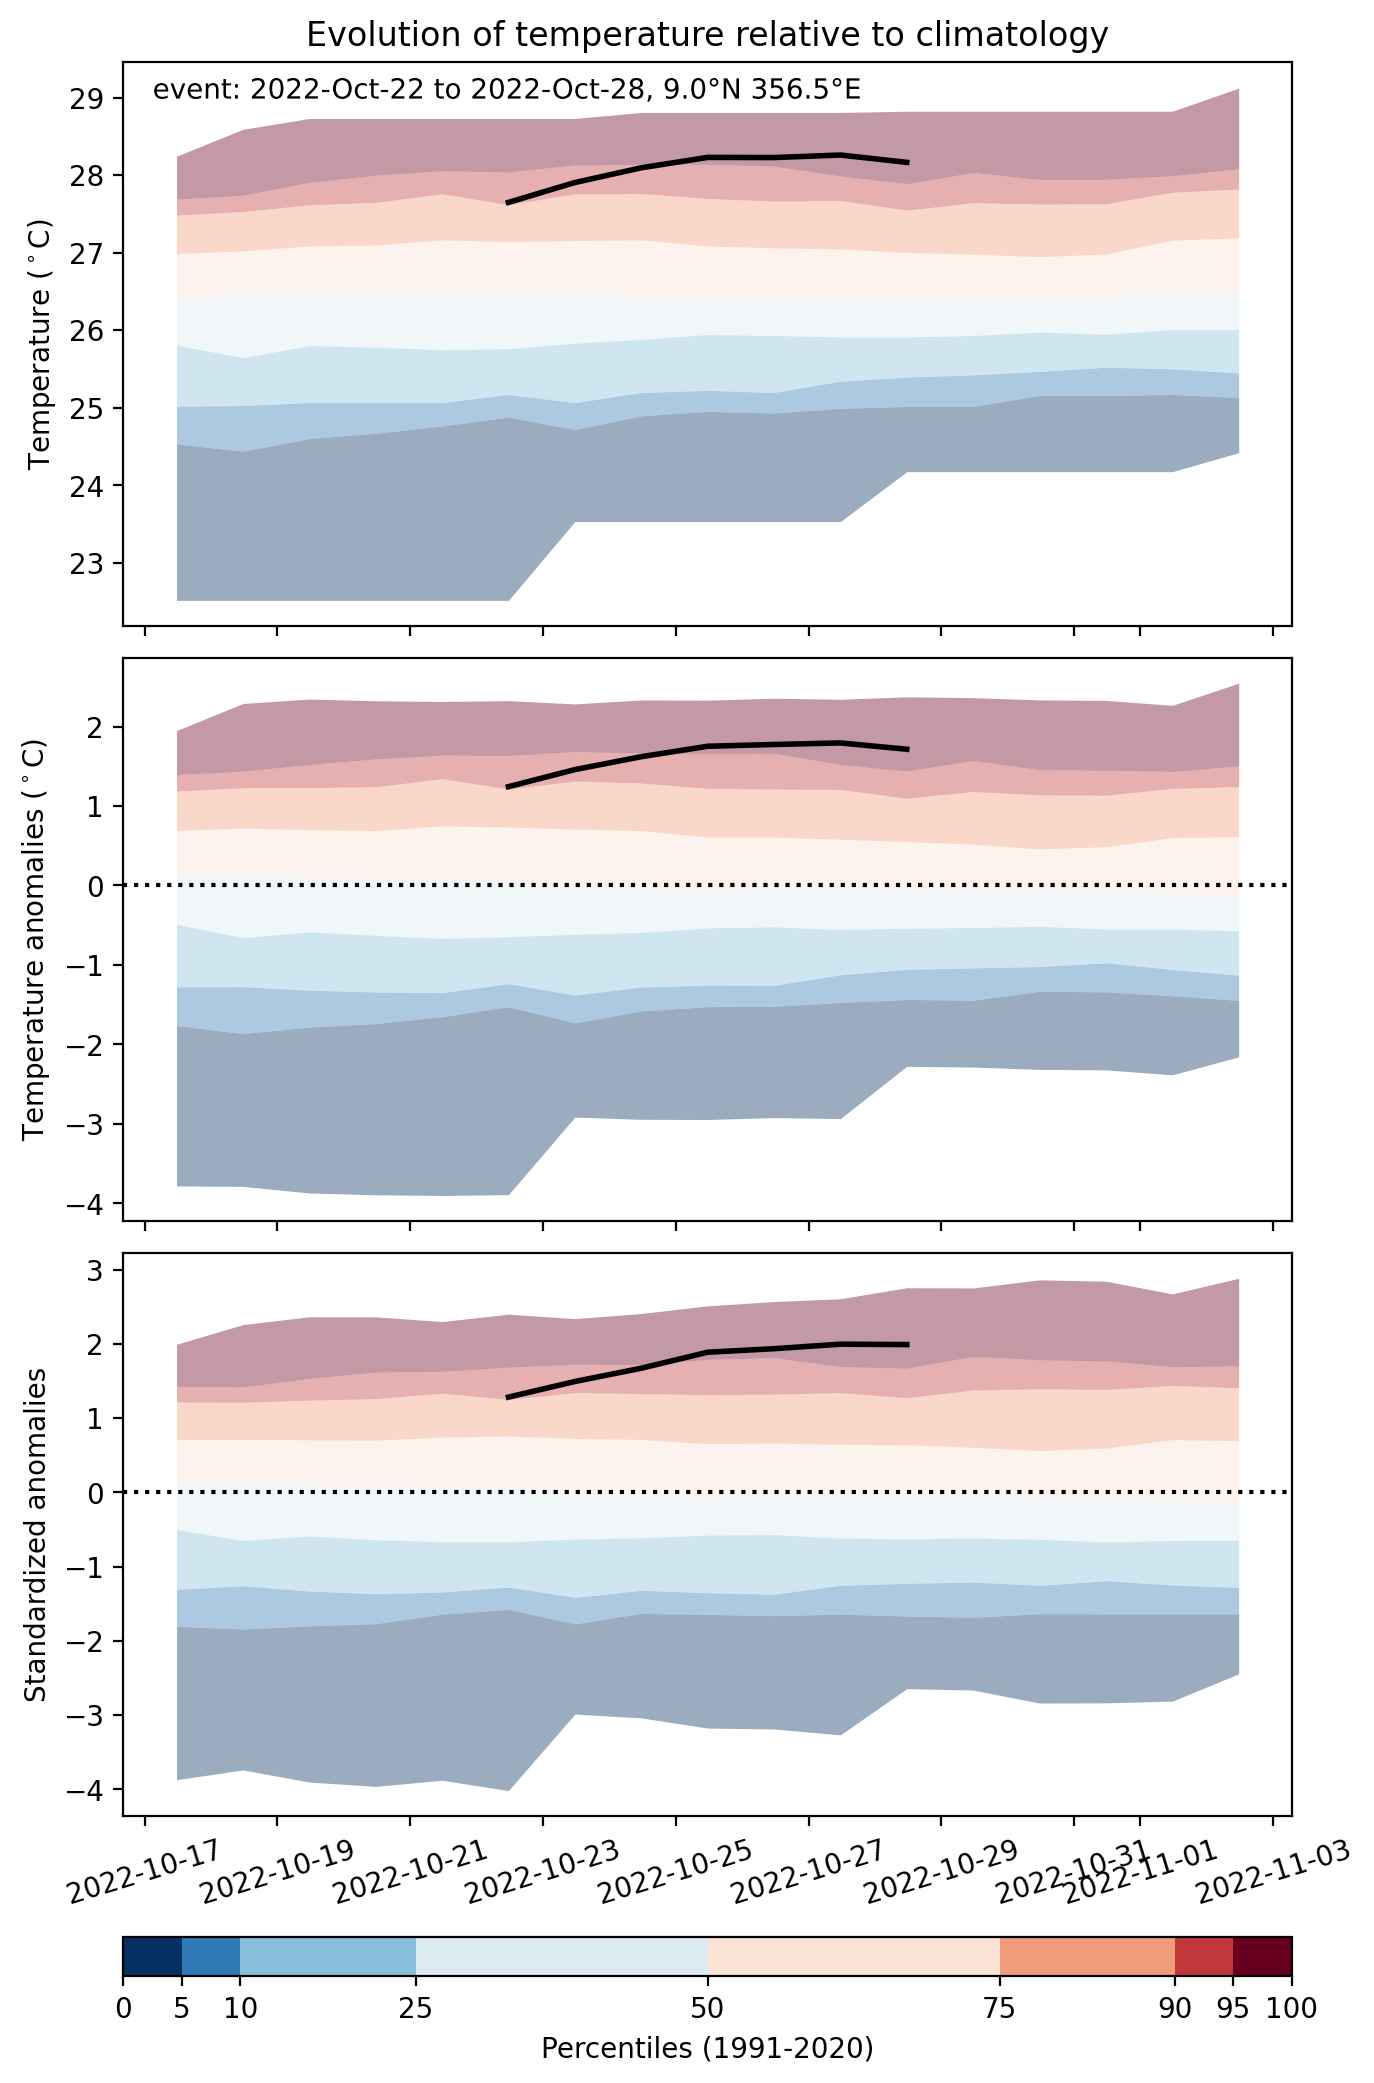
Fig. 2: Evolution of temperature at the center of the event. The climatological percentile distribution is illustrated with color shadings.


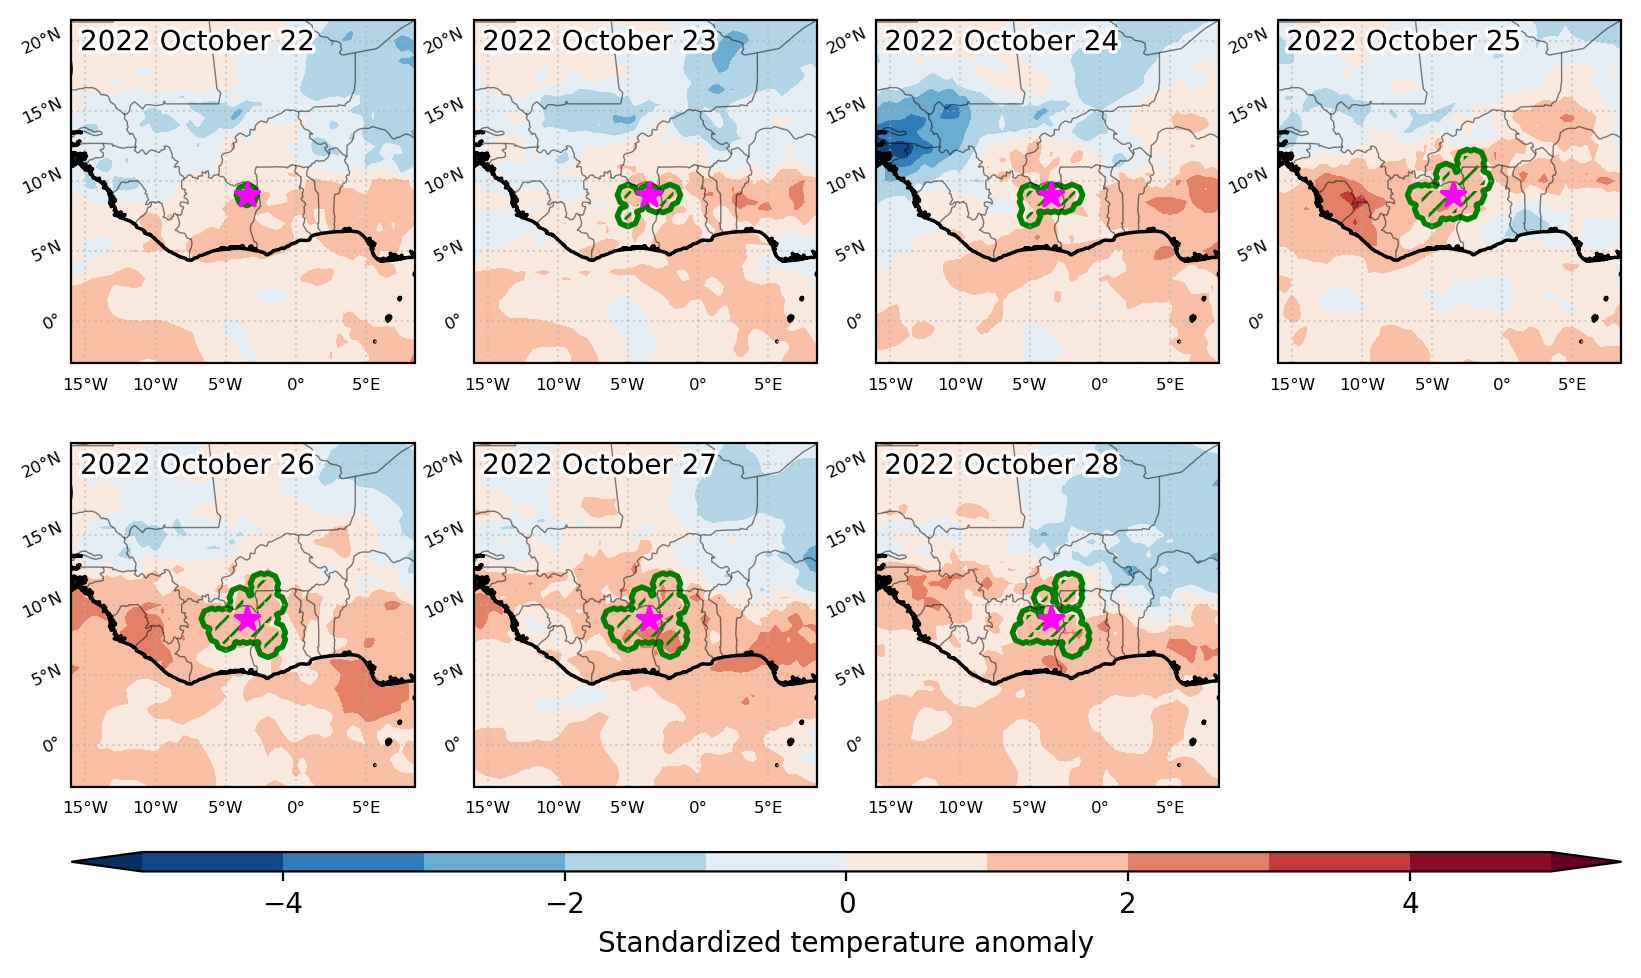
Fig. 3: Maps illustrating the evolution of standardized temperature anomalies during the event.

Event ID: Heat_wave_2022-Oct-22_to_2022-Oct-28_356.5_9.0

Heat wave occuring from August 30 2022 to September 07 2022 at 7.5°N 346.0°E

Download data: JSON

Event type: Heat wave

Countries affected (identified with ArcGIS Online; provided only for geographical reference):

  • Côte d’Ivoire
  • Guinea
  • Liberia
  • Sierra Leone

Duration: 9 days

Time span: August 30 2022 to September 07 2022

Statistics over entire affected area:

  • Mean temperature anomaly: 1.0 °C
  • Mean temperature: 26.1 °C
  • Maximum temperature anomaly: 2.2 °C
  • Maximum temperature: 27.3 °C

Event center: 7.5°N 346.0°E

Area affected: 367509 km$^2$


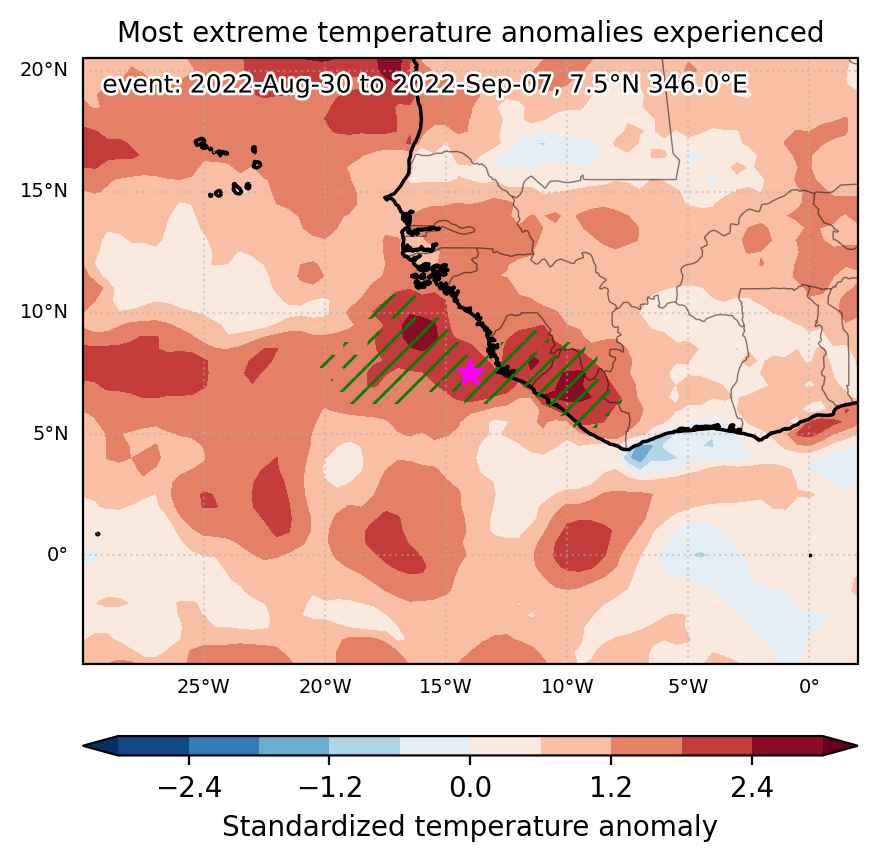
Fig. 1: Map of most extreme temperature anomalies (standardized) experienced during the event. The purple star indicates the center of the extreme event. Green hatching illustrates all areas under the effect of extremes at some time during the event.


Fig. 2: Evolution of temperature at the center of the event. The climatological percentile distribution is illustrated with color shadings.


Fig. 3: Maps illustrating the evolution of standardized temperature anomalies during the event.

Event ID: Heat_wave_2022-Aug-30_to_2022-Sep-07_346.0_7.5