Heat wave occuring from February 06 2021 to February 12 2021 at -53.5°S 194.0°E

Download data: JSON

Event type: Heat wave

Countries affected (identified with ArcGIS Online; provided only for geographical reference):

  • New Zealand

Duration: 7 days

Time span: February 06 2021 to February 12 2021

Statistics over entire affected area:

  • Mean temperature anomaly: 2.2 °C
  • Mean temperature: 11.6 °C
  • Maximum temperature anomaly: 4.1 °C
  • Maximum temperature: 16.9 °C

Event center: -53.5°S 194.0°E

Area affected: 1006669 km$^2$
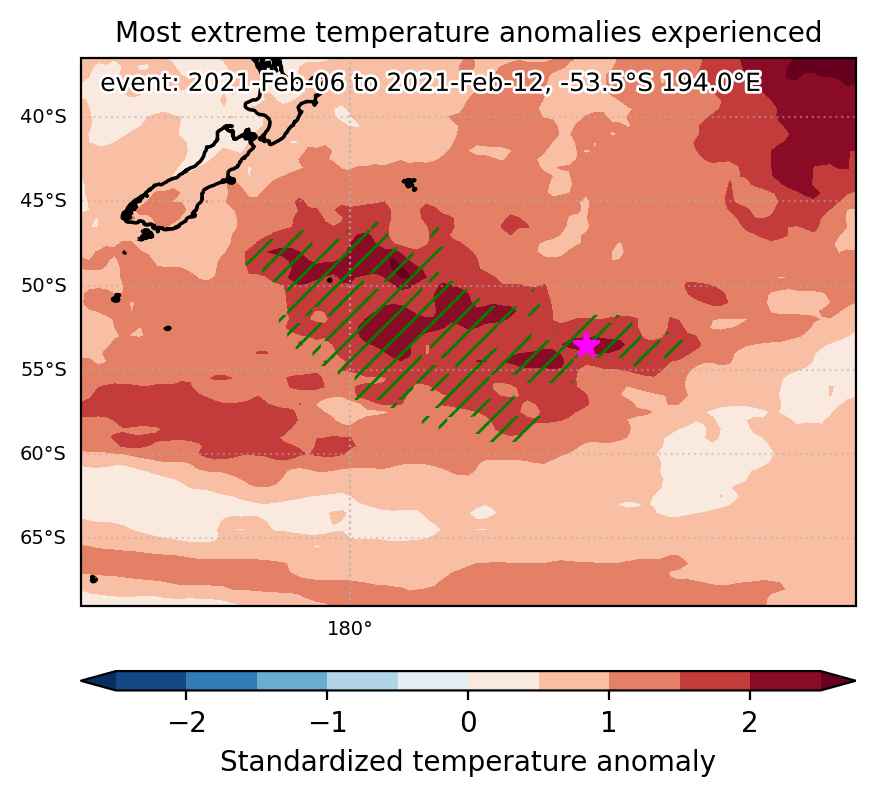

Fig. 1: Map of most extreme temperature anomalies (standardized) experienced during the event. The purple star indicates the center of the extreme event. Green hatching illustrates all areas under the effect of extremes at some time during the event.
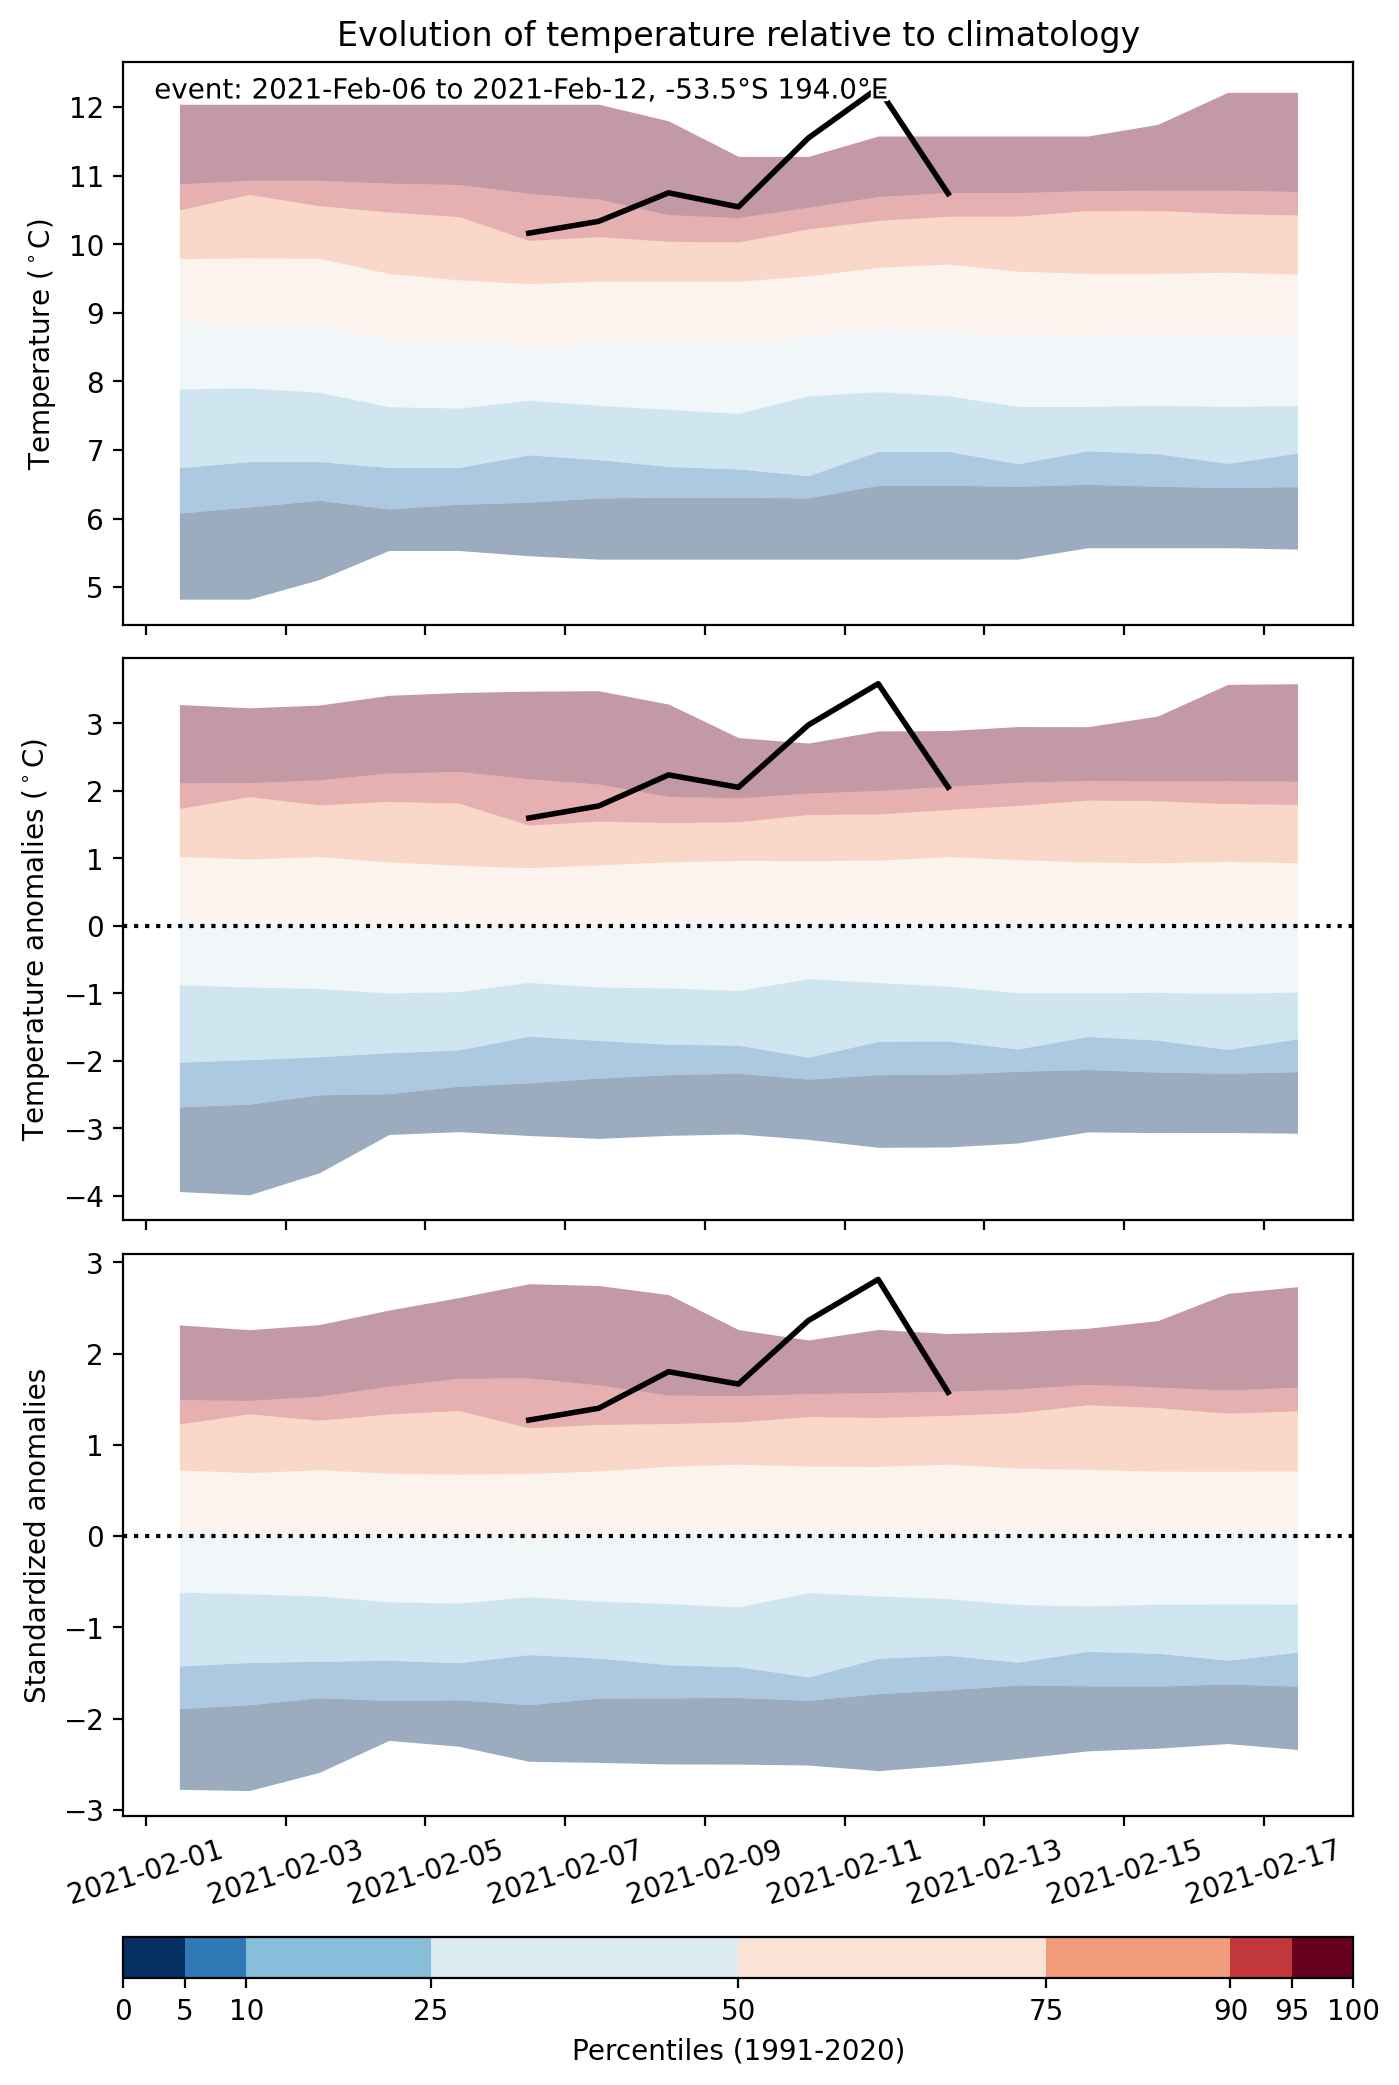


Fig. 2: Evolution of temperature at the center of the event. The climatological percentile distribution is illustrated with color shadings.
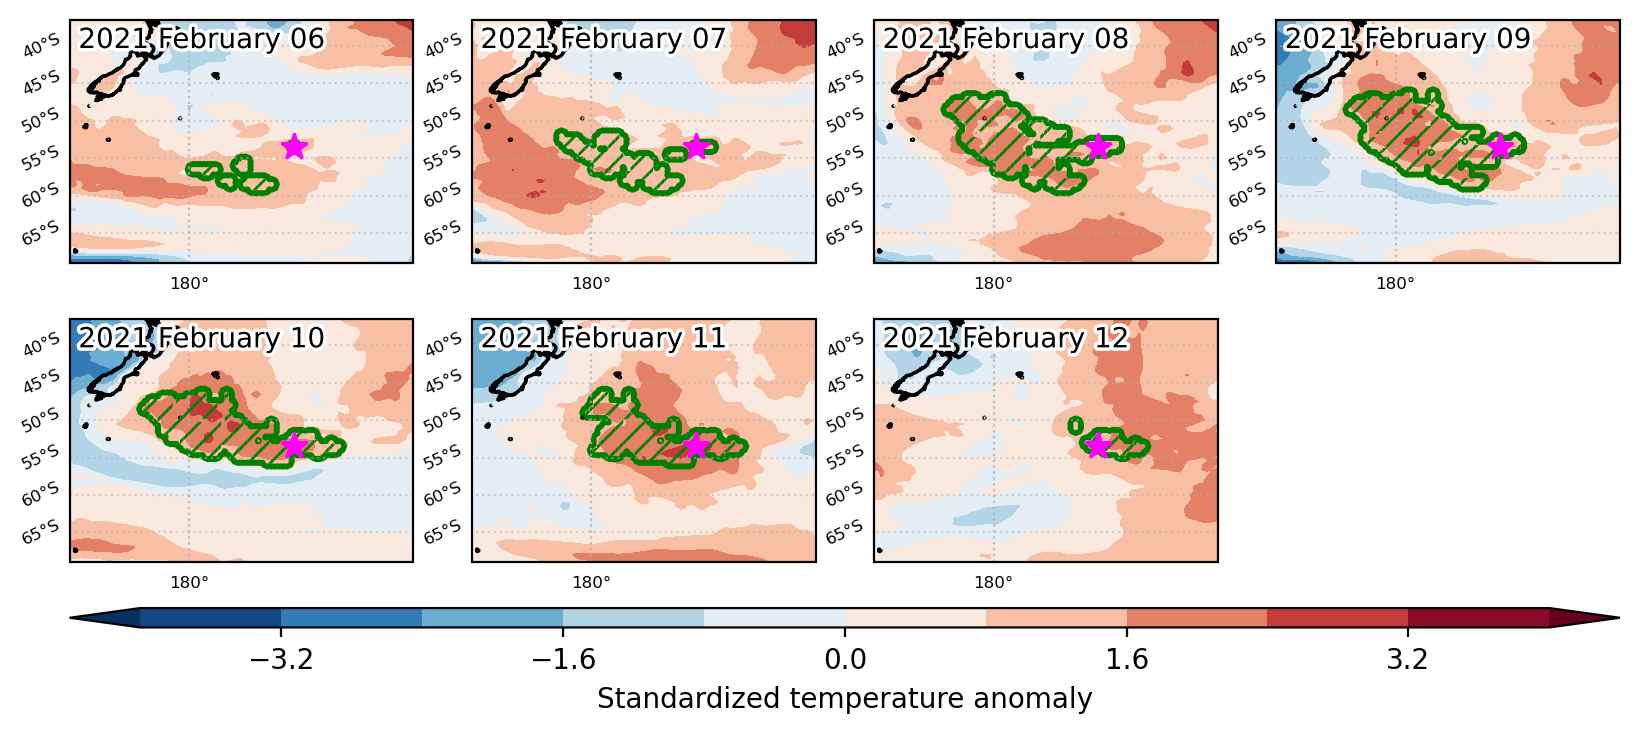


Fig. 3: Maps illustrating the evolution of standardized temperature anomalies during the event.

Event ID: Heat_wave_2021-Feb-06_to_2021-Feb-12_194.0_-53.5
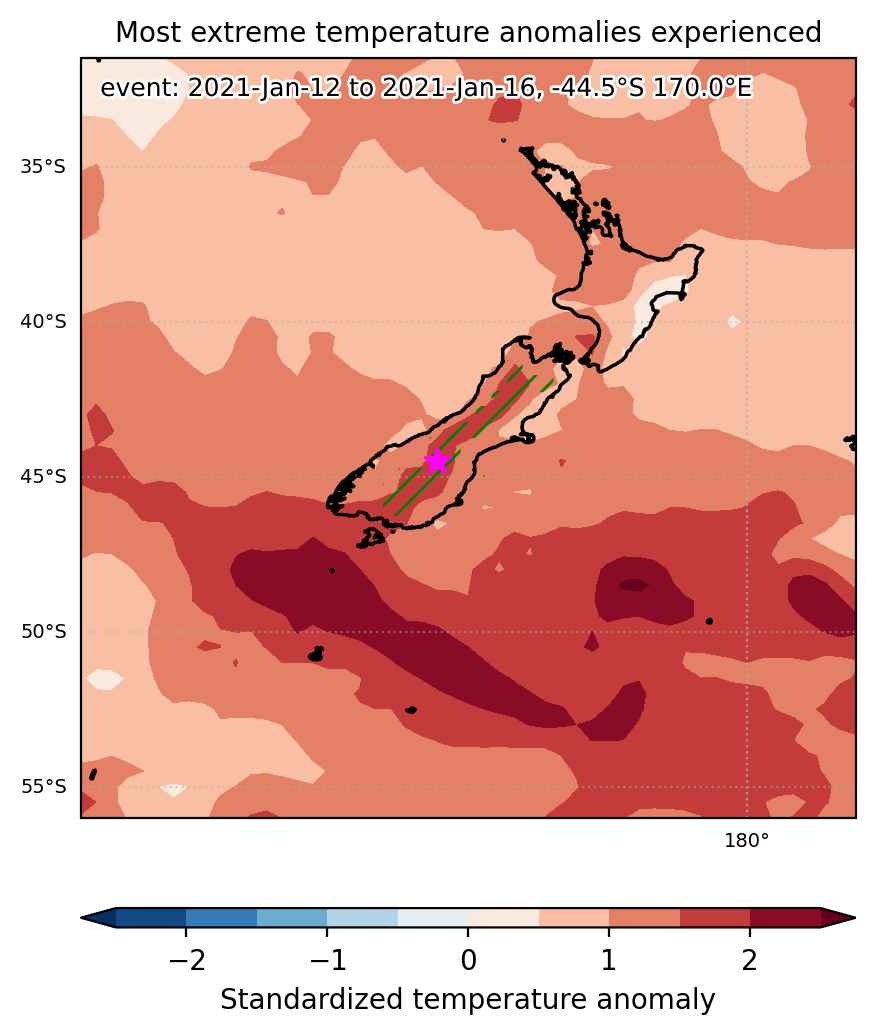
Heat wave occuring from January 12 2021 to January 16 2021 at -44.5°S 170.0°E

Download data: JSON

Event type: Heat wave

Countries affected (identified with ArcGIS Online; provided only for geographical reference):

  • New Zealand

Duration: 5 days

Time span: January 12 2021 to January 16 2021

Statistics over entire affected area:

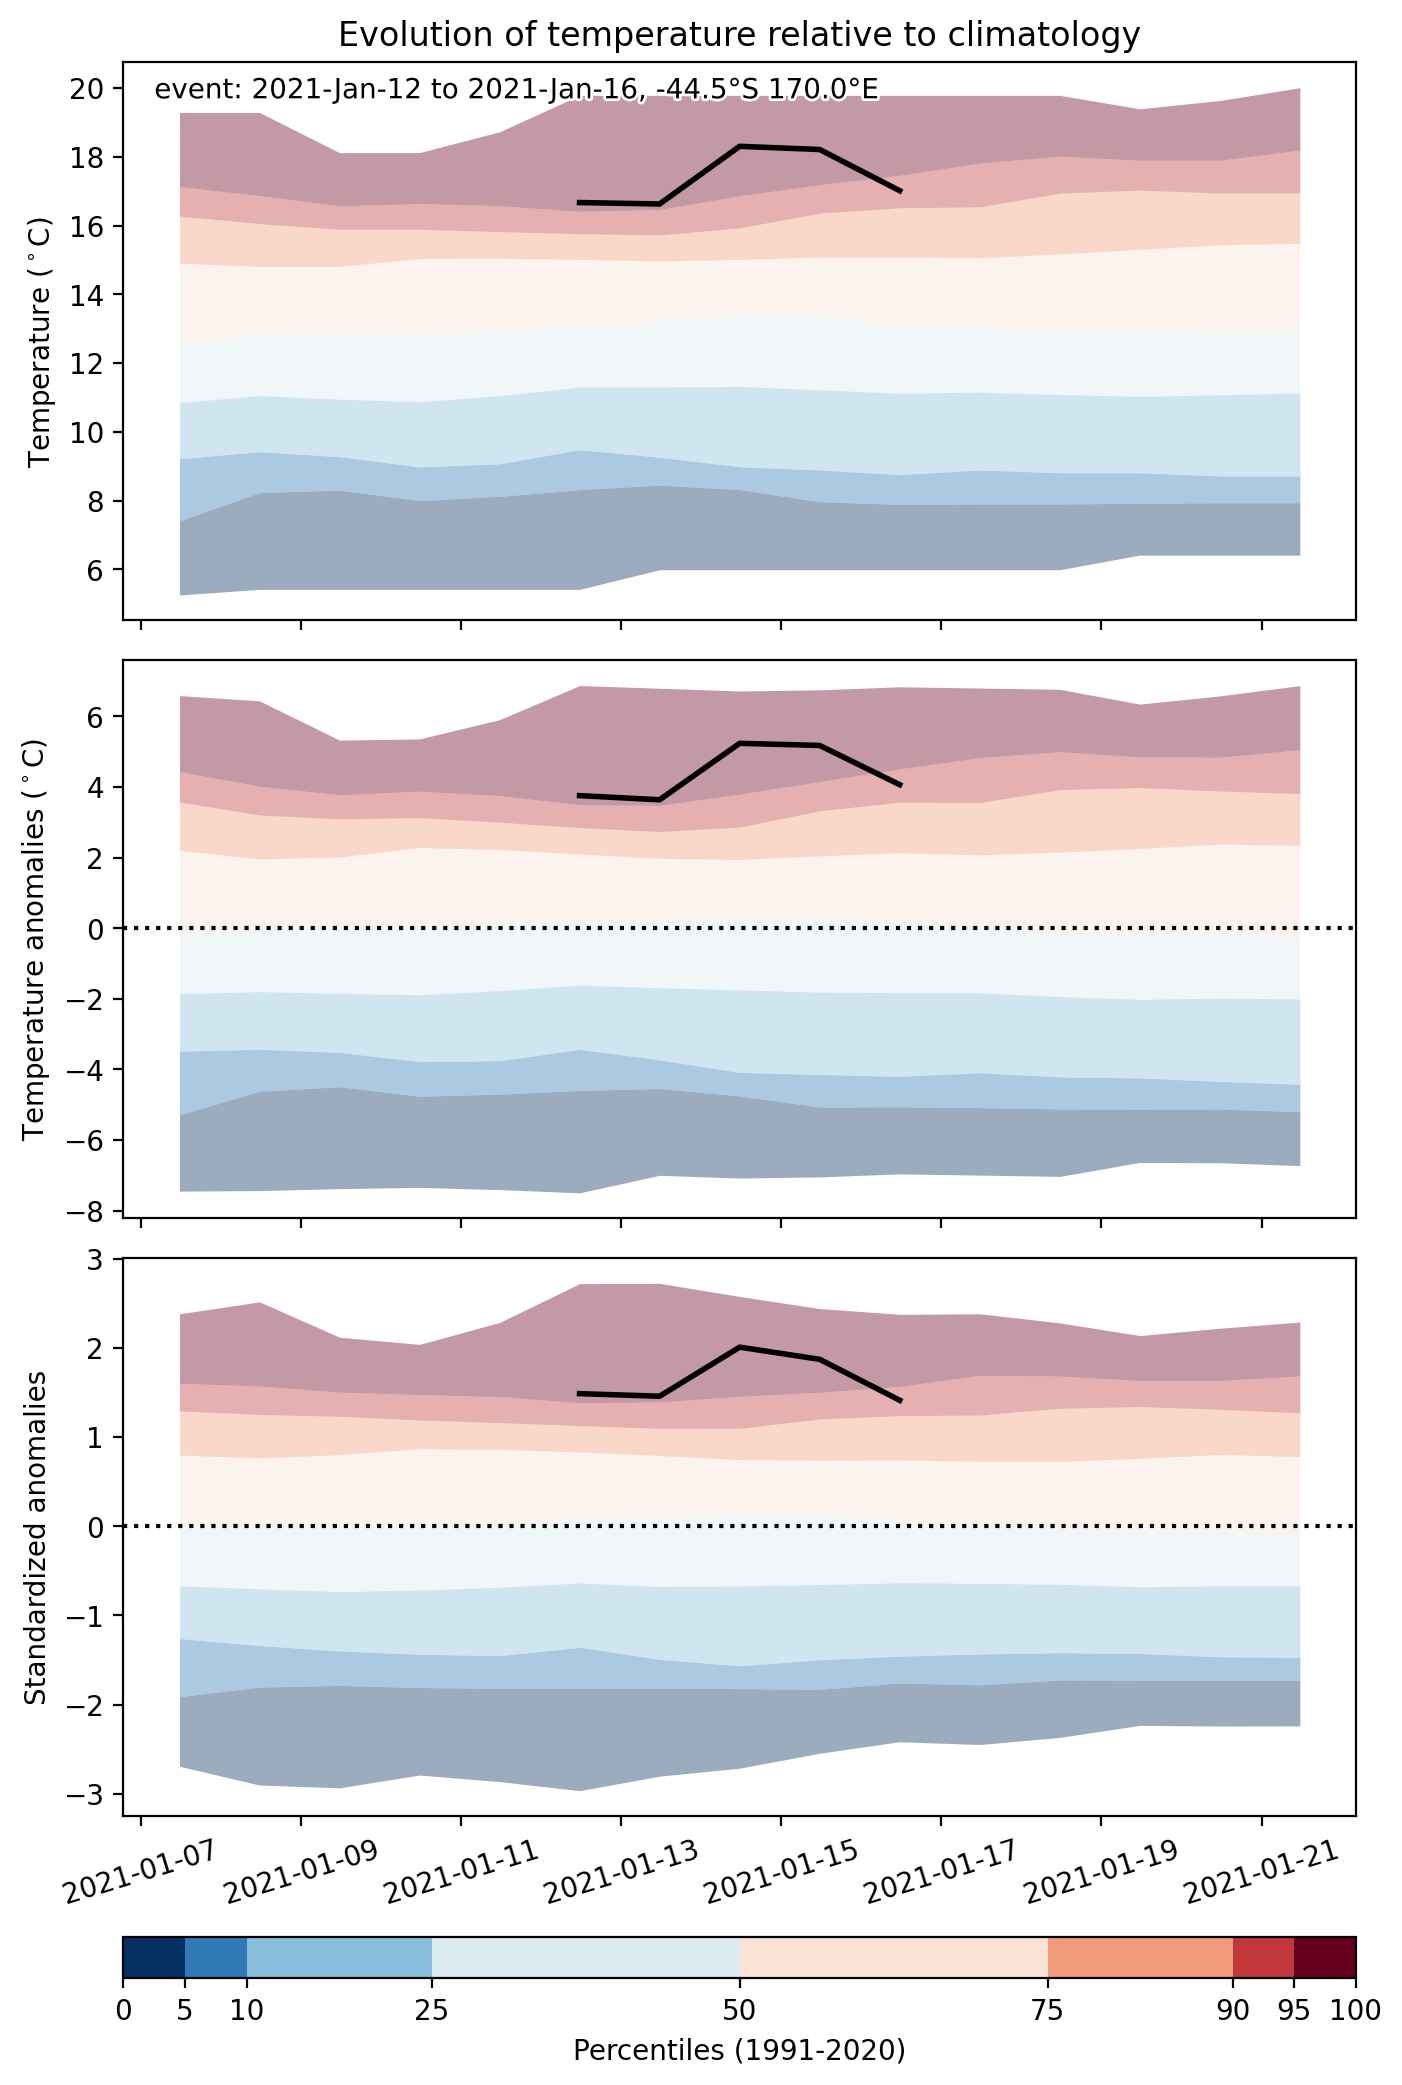
  • Mean temperature anomaly: 4.3 °C
  • Mean temperature: 16.4 °C
  • Maximum temperature anomaly: 6.3 °C
  • Maximum temperature: 20.1 °C

Event center: -44.5°S 170.0°E

Area affected: 51220 km$^2$


Fig. 1: Map of most extreme temperature anomalies (standardized) experienced during the event. The purple star indicates the center of the extreme event. Green hatching illustrates all areas under the effect of extremes at some time during the event.


Fig. 2: Evolution of temperature at the center of the event. The climatological percentile distribution is illustrated with color shadings.


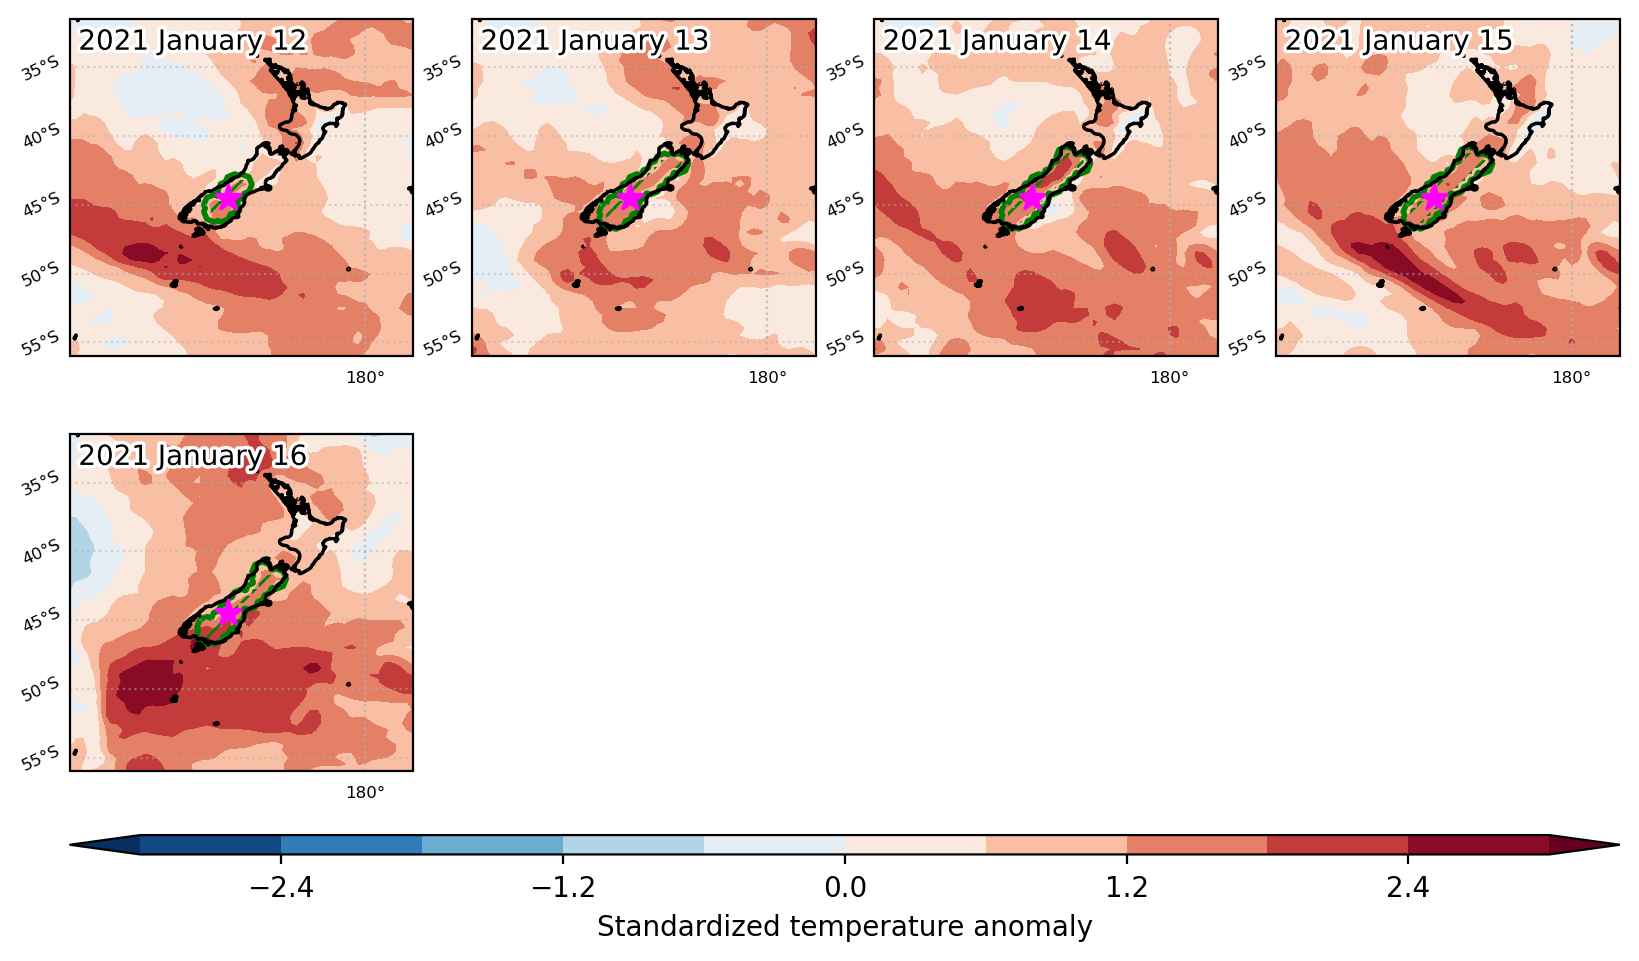
Fig. 3: Maps illustrating the evolution of standardized temperature anomalies during the event.

Event ID: Heat_wave_2021-Jan-12_to_2021-Jan-16_170.0_-44.5

Heat wave occuring from January 02 2021 to January 07 2021 at -50.5°S 178.0°E

Download data: JSON

Event type: Heat wave

Countries affected (identified with ArcGIS Online; provided only for geographical reference):

  • New Zealand

Duration: 6 days

Time span: January 02 2021 to January 07 2021

Statistics over entire affected area:

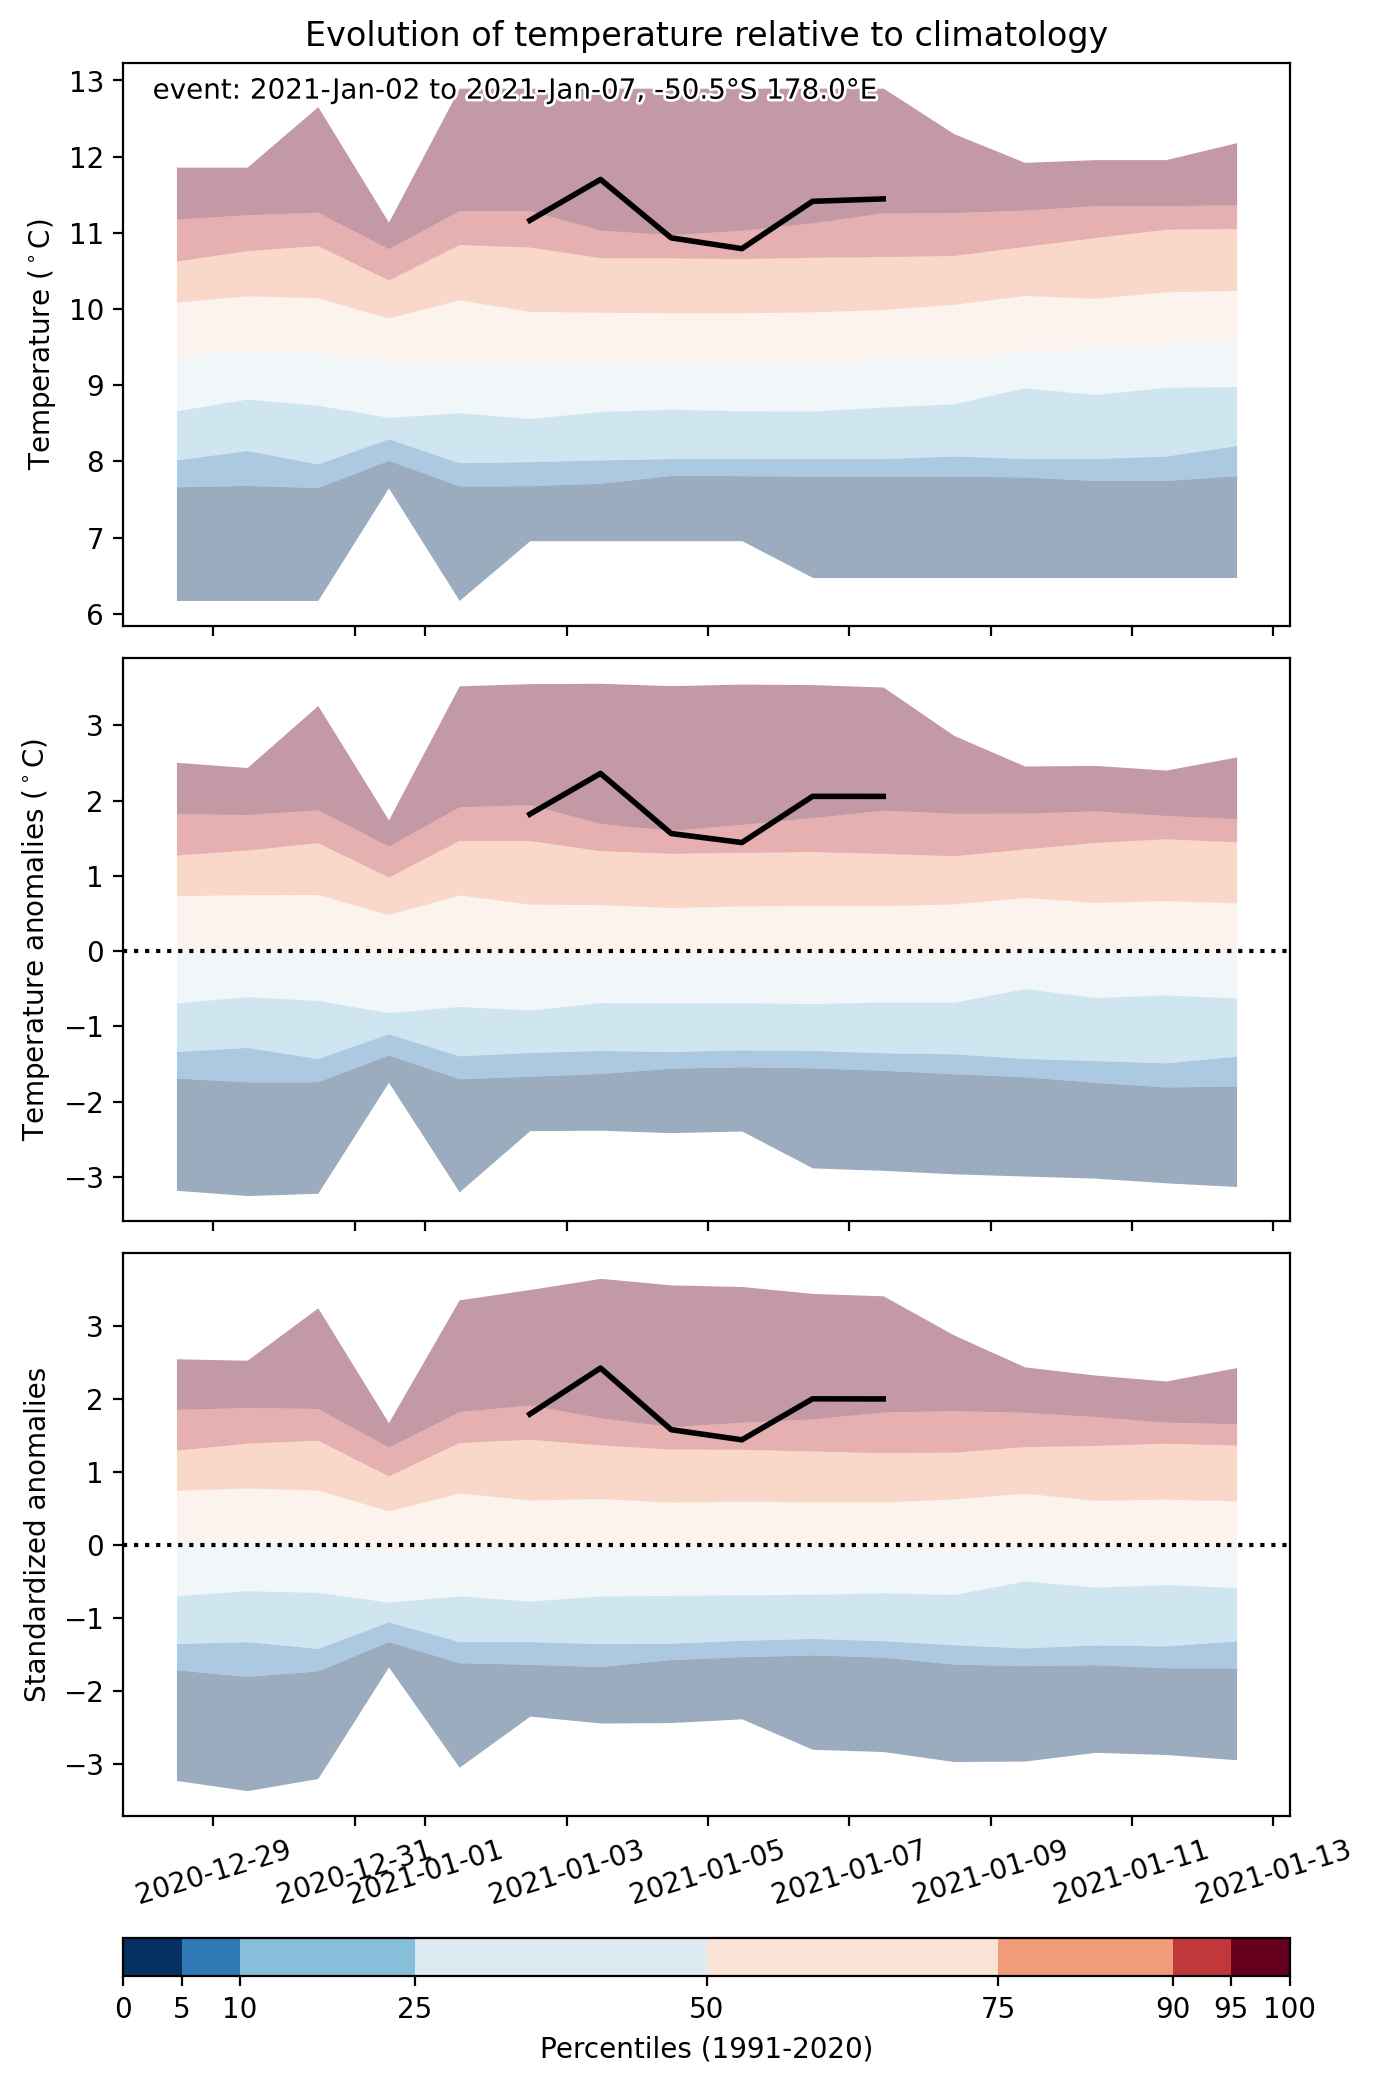
  • Mean temperature anomaly: 1.8 °C
  • Mean temperature: 10.3 °C
  • Maximum temperature anomaly: 2.9 °C
  • Maximum temperature: 12.9 °C

Event center: -50.5°S 178.0°E

Area affected: 872096 km$^2$


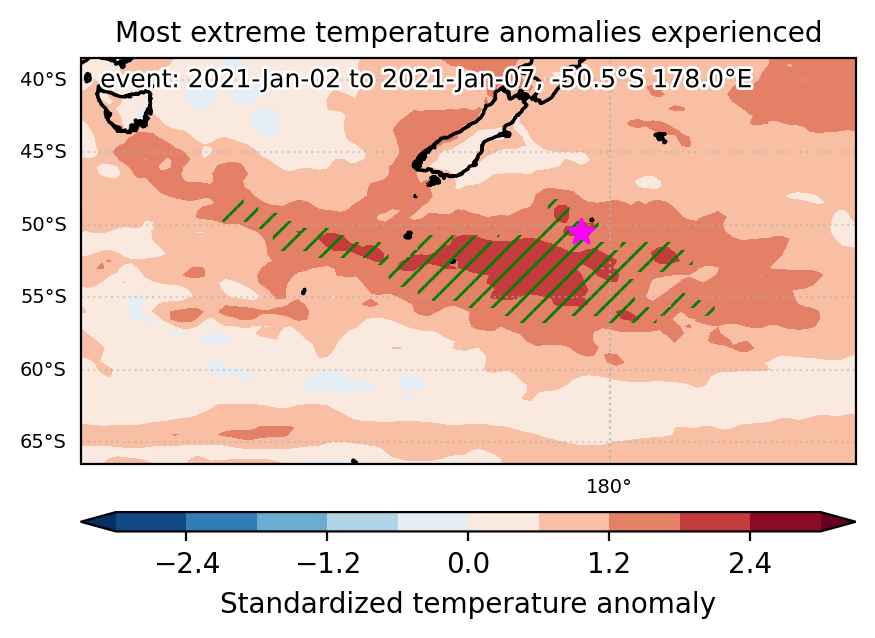
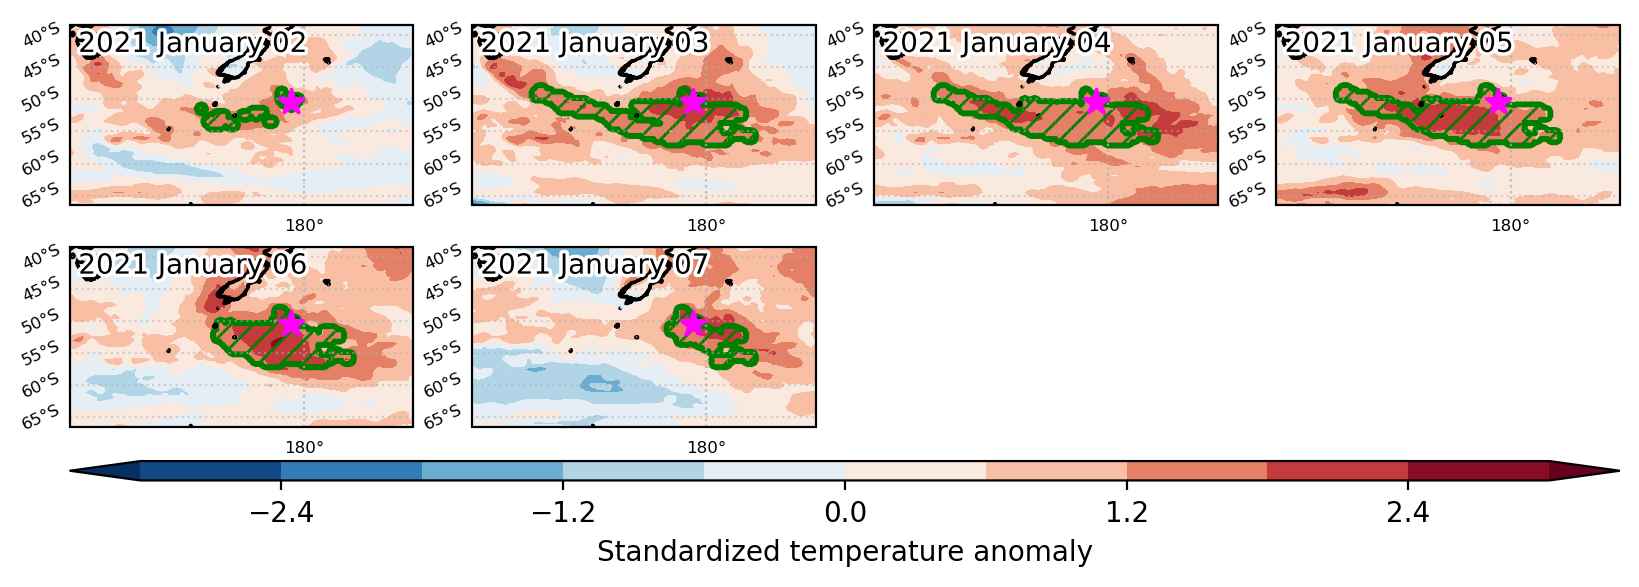
Fig. 1: Map of most extreme temperature anomalies (standardized) experienced during the event. The purple star indicates the center of the extreme event. Green hatching illustrates all areas under the effect of extremes at some time during the event.


Fig. 2: Evolution of temperature at the center of the event. The climatological percentile distribution is illustrated with color shadings.


Fig. 3: Maps illustrating the evolution of standardized temperature anomalies during the event.

Event ID: Heat_wave_2021-Jan-02_to_2021-Jan-07_178.0_-50.5

Heat wave occuring from January 02 2021 to January 09 2021 at -33.5°S 171.5°E

Download data: JSON

Event type: Heat wave

Countries affected (identified with ArcGIS Online; provided only for geographical reference):

  • New Zealand

Duration: 8 days

Time span: January 02 2021 to January 09 2021

Statistics over entire affected area:

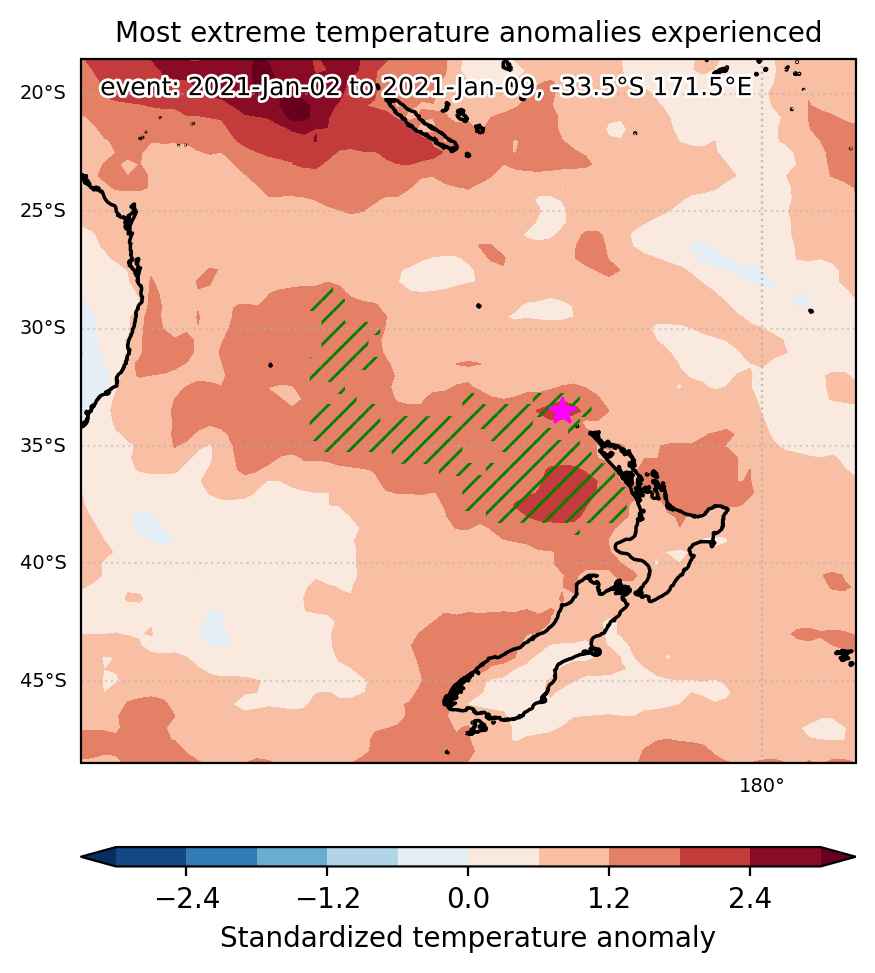
  • Mean temperature anomaly: 1.8 °C
  • Mean temperature: 21.2 °C
  • Maximum temperature anomaly: 2.6 °C
  • Maximum temperature: 24.3 °C

Event center: -33.5°S 171.5°E

Area affected: 484819 km$^2$


Fig. 1: Map of most extreme temperature anomalies (standardized) experienced during the event. The purple star indicates the center of the extreme event. Green hatching illustrates all areas under the effect of extremes at some time during the event.


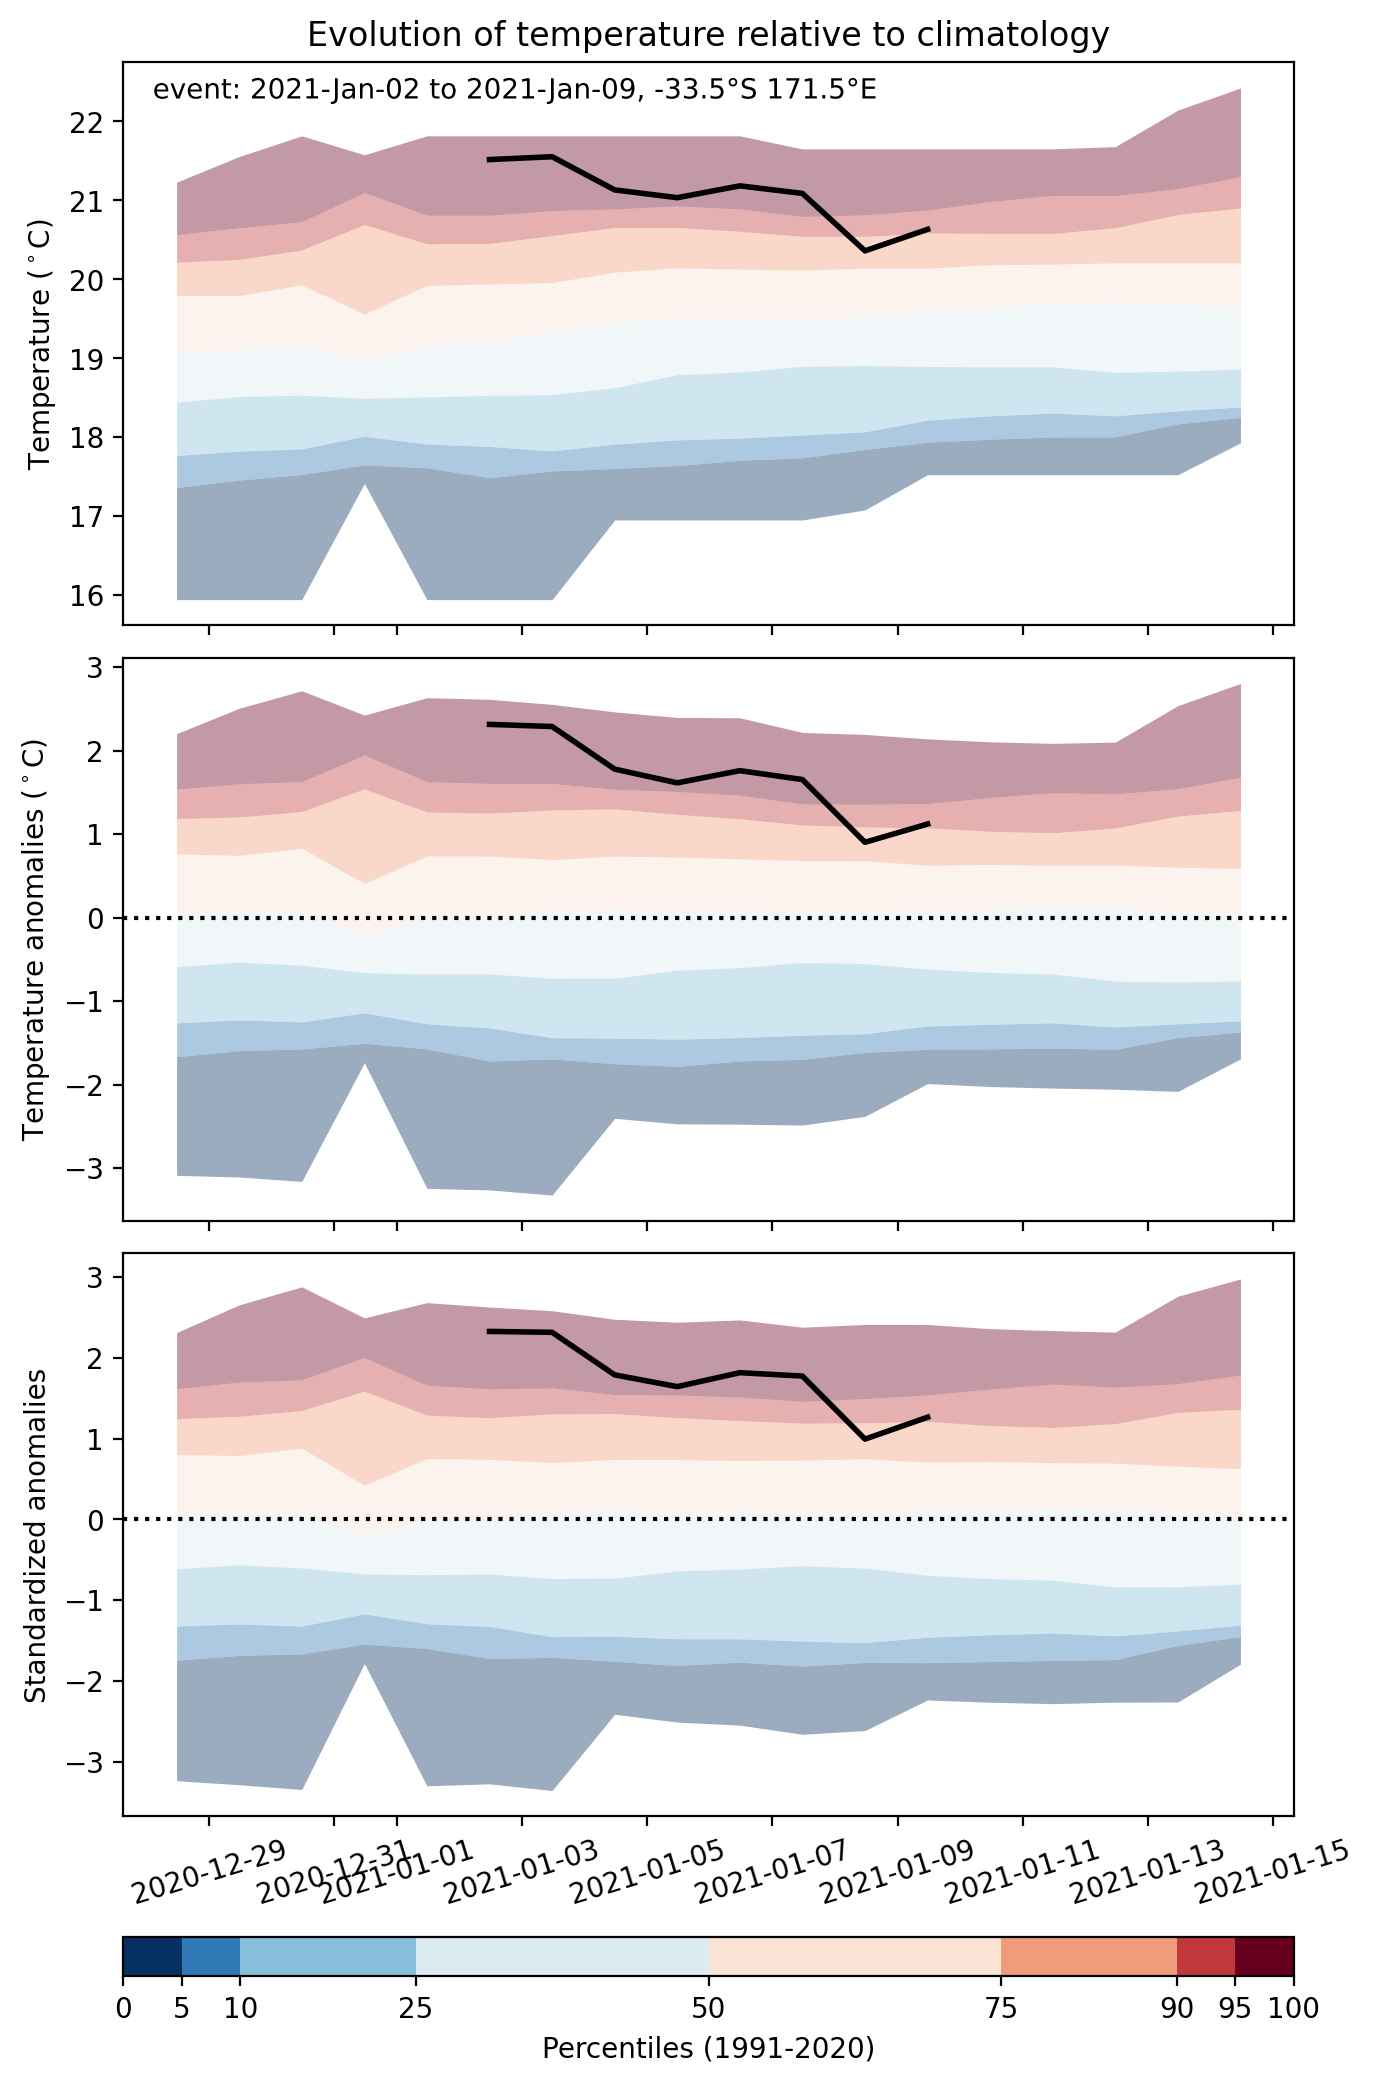
Fig. 2: Evolution of temperature at the center of the event. The climatological percentile distribution is illustrated with color shadings.


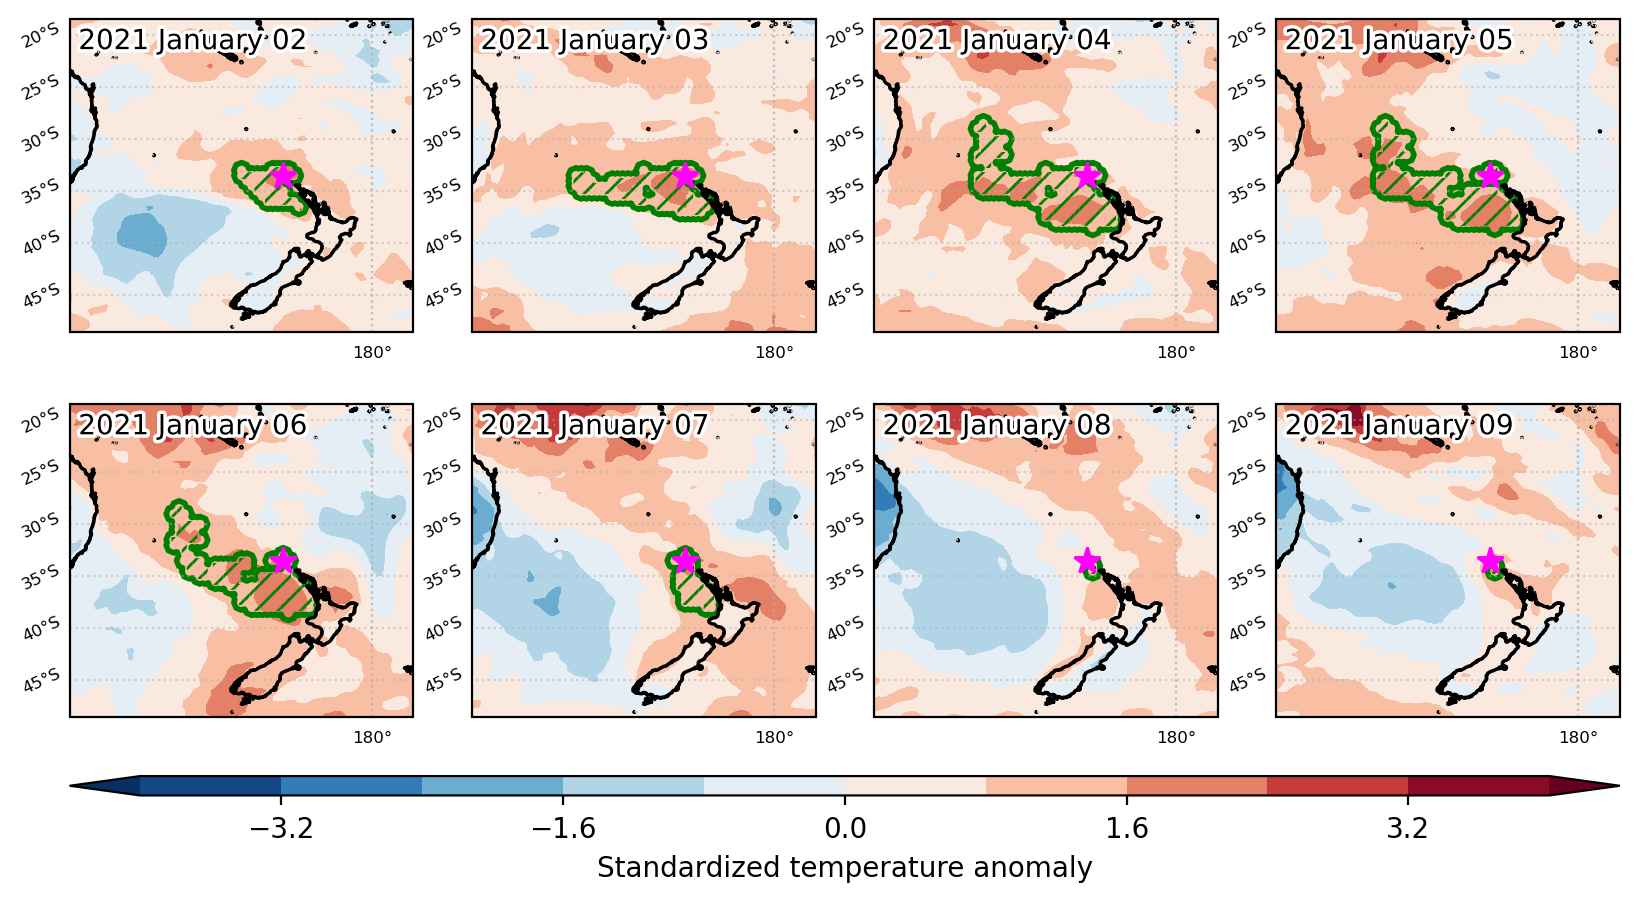
Fig. 3: Maps illustrating the evolution of standardized temperature anomalies during the event.

Event ID: Heat_wave_2021-Jan-02_to_2021-Jan-09_171.5_-33.5

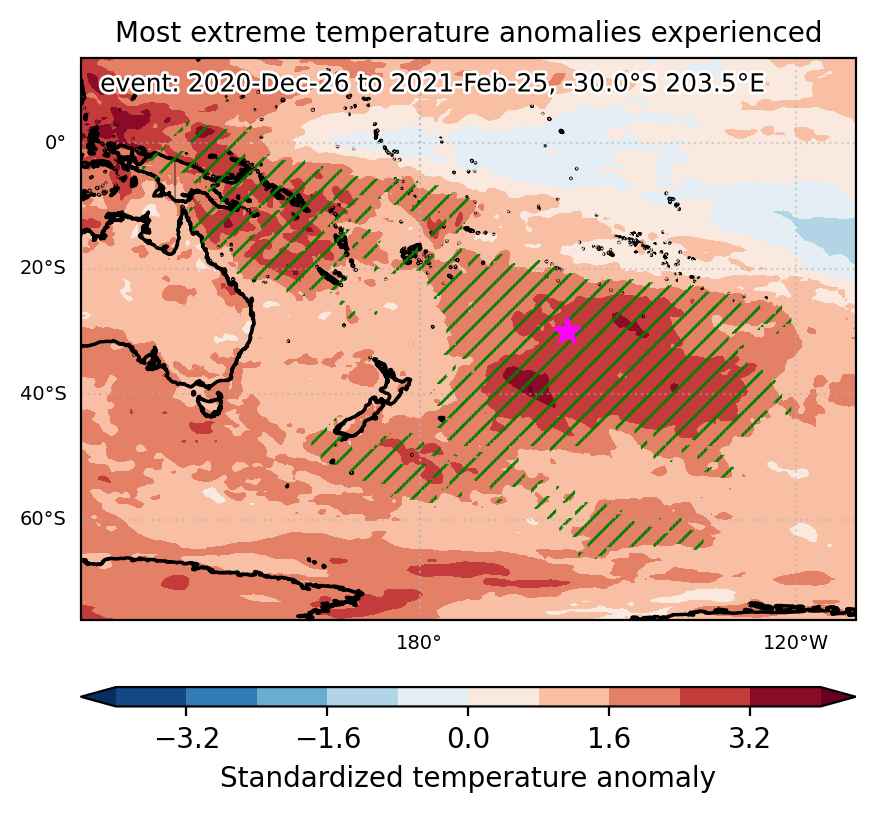
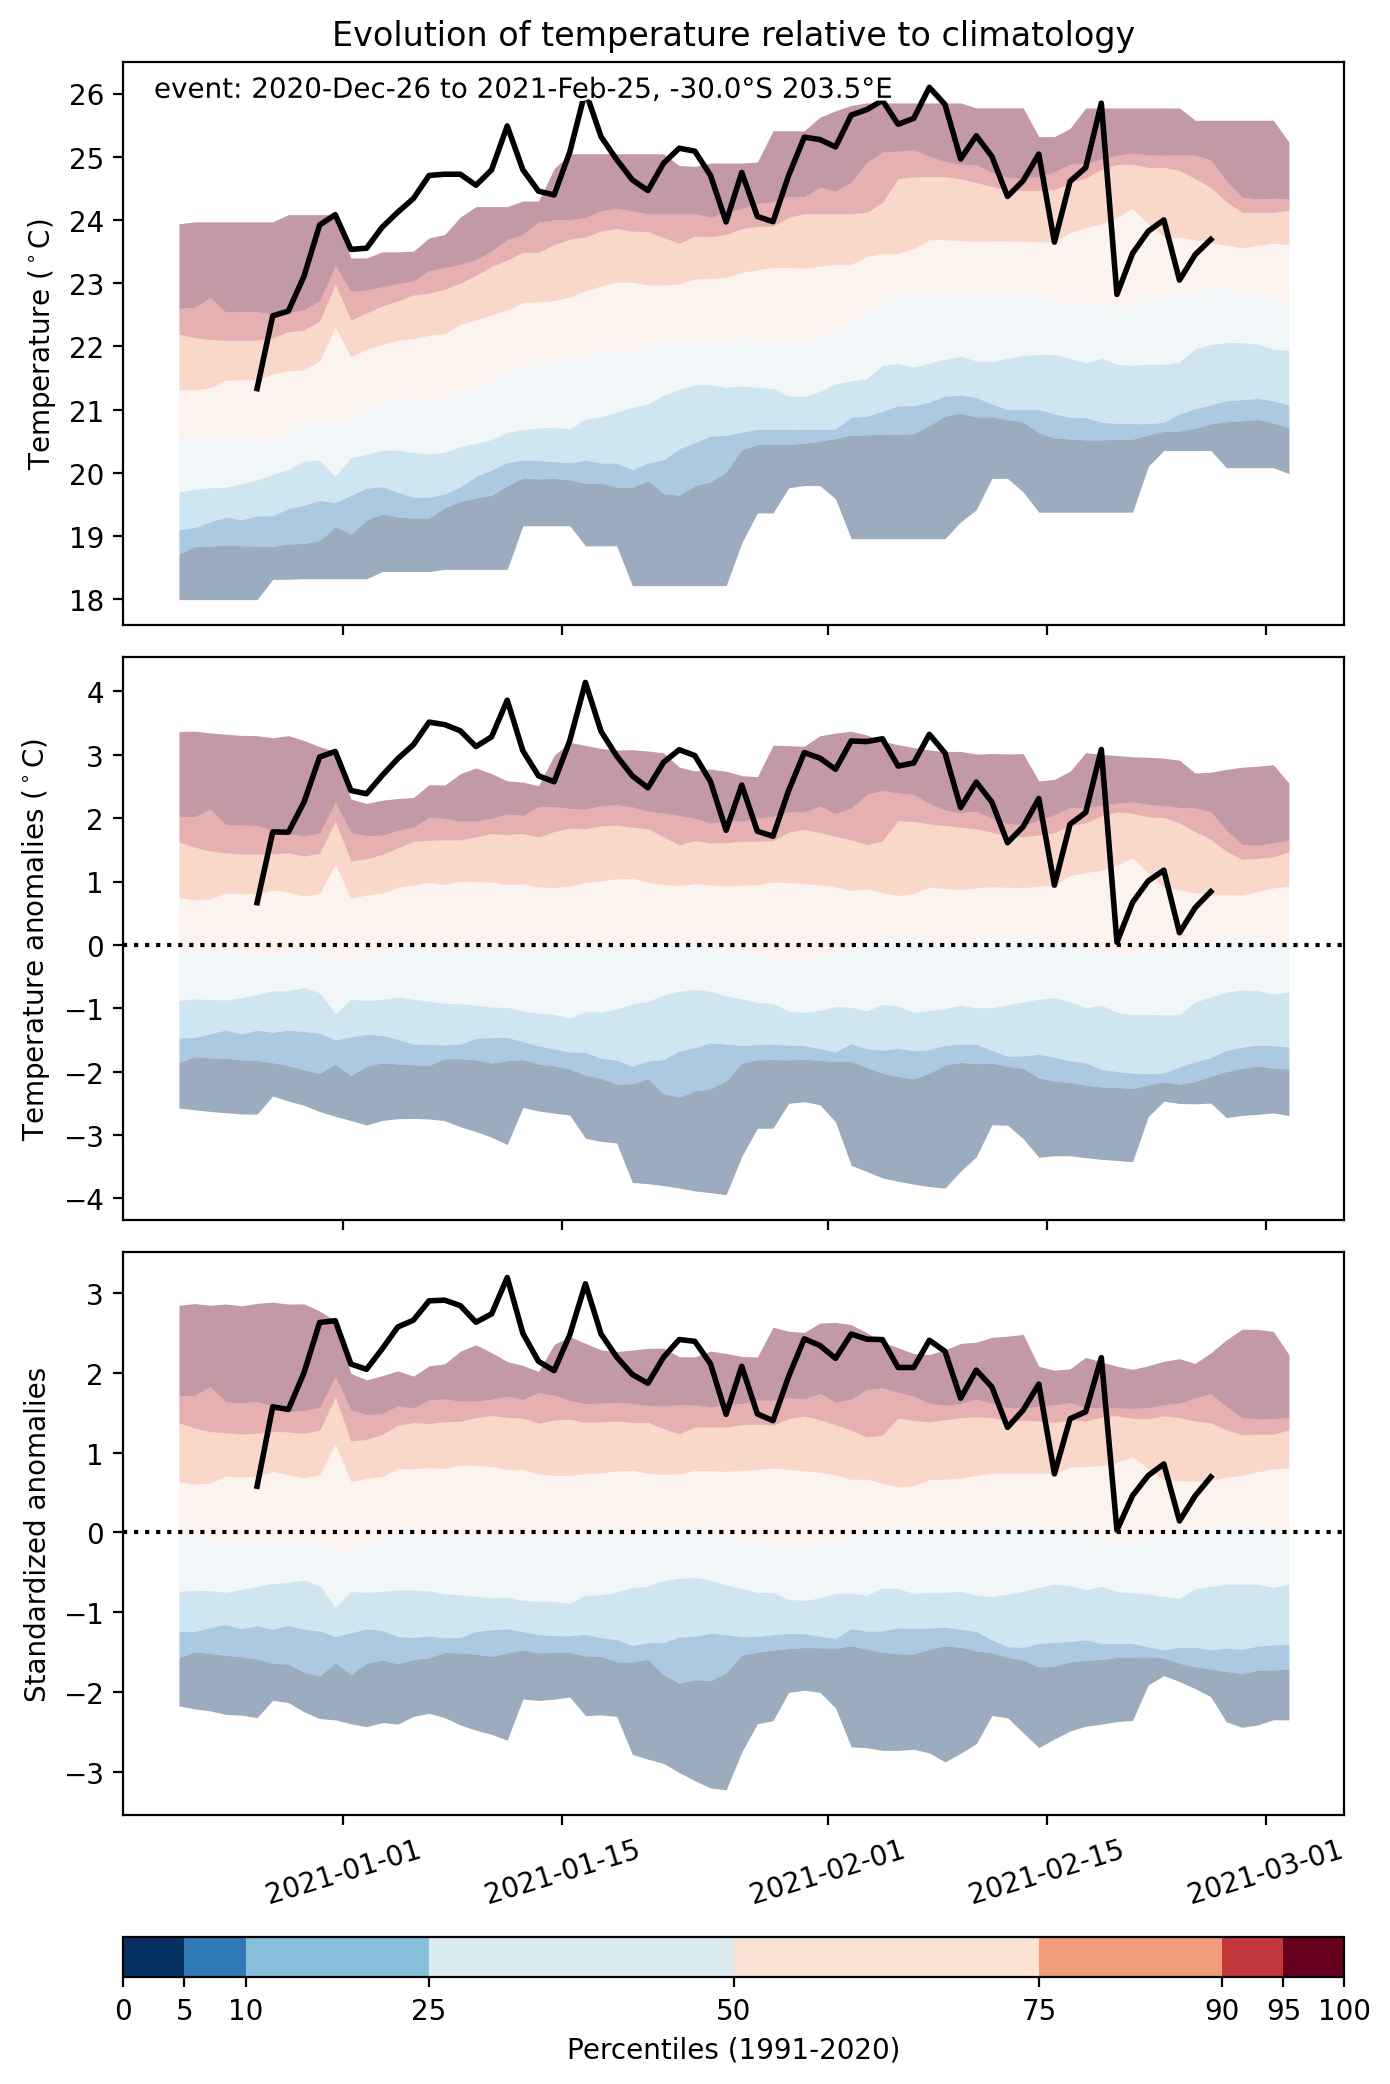
Heat wave occuring from December 26 2020 to February 25 2021 at -30.0°S 203.5°E

Download data: JSON

Event type: Heat wave

Countries affected (identified with ArcGIS Online; provided only for geographical reference):

  • Australia
  • Cook Islands
  • Fiji
  • French Polynesia
  • Indonesia
  • New Caledonia
  • New Zealand
  • Papua New Guinea
  • Solomon Islands
  • Tonga
  • Vanuatu

Duration: 62 days

Time span: December 26 2020 to February 25 2021

Statistics over entire affected area:

  • Mean temperature anomaly: 2.2 °C
  • Mean temperature: 23.0 °C
  • Maximum temperature anomaly: 5.6 °C
  • Maximum temperature: 30.2 °C

Event center: -30.0°S 203.5°E

Area affected: 23654697 km$^2$


Fig. 1: Map of most extreme temperature anomalies (standardized) experienced during the event. The purple star indicates the center of the extreme event. Green hatching illustrates all areas under the effect of extremes at some time during the event.


Fig. 2: Evolution of temperature at the center of the event. The climatological percentile distribution is illustrated with color shadings.


Fig. 3: Maps illustrating the evolution of standardized temperature anomalies during the event.

Event ID: Heat_wave_2020-Dec-26_to_2021-Feb-25_203.5_-30.0

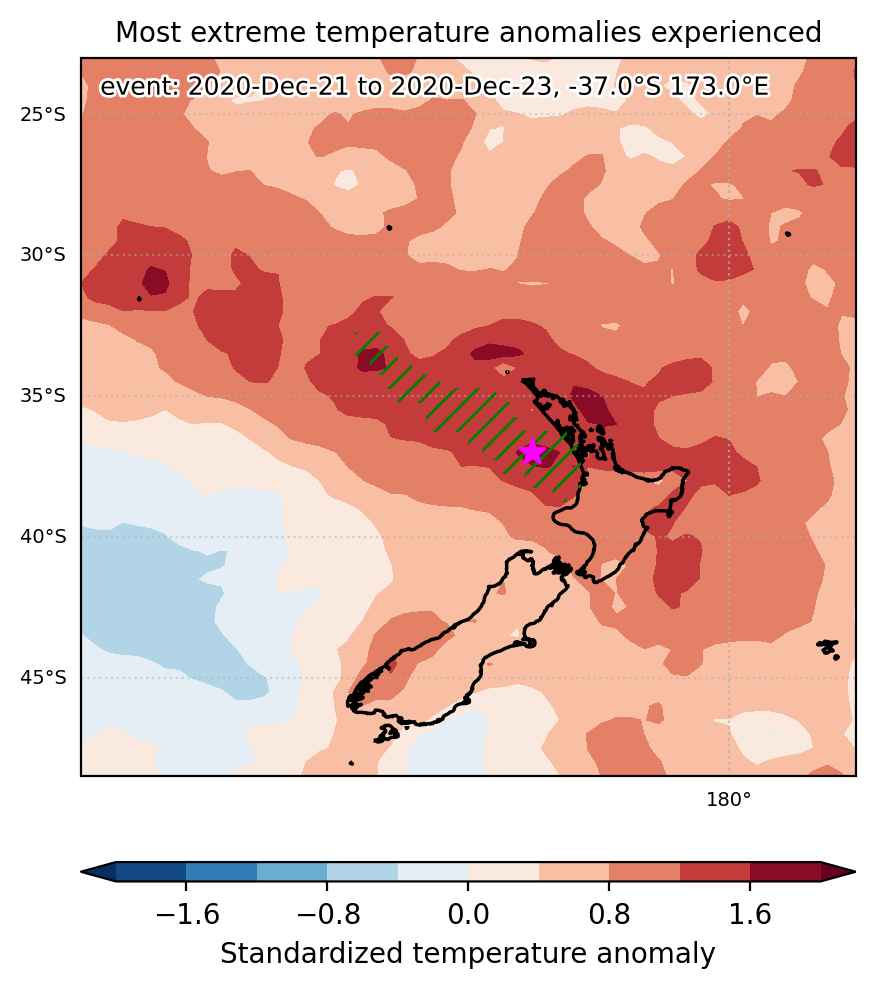
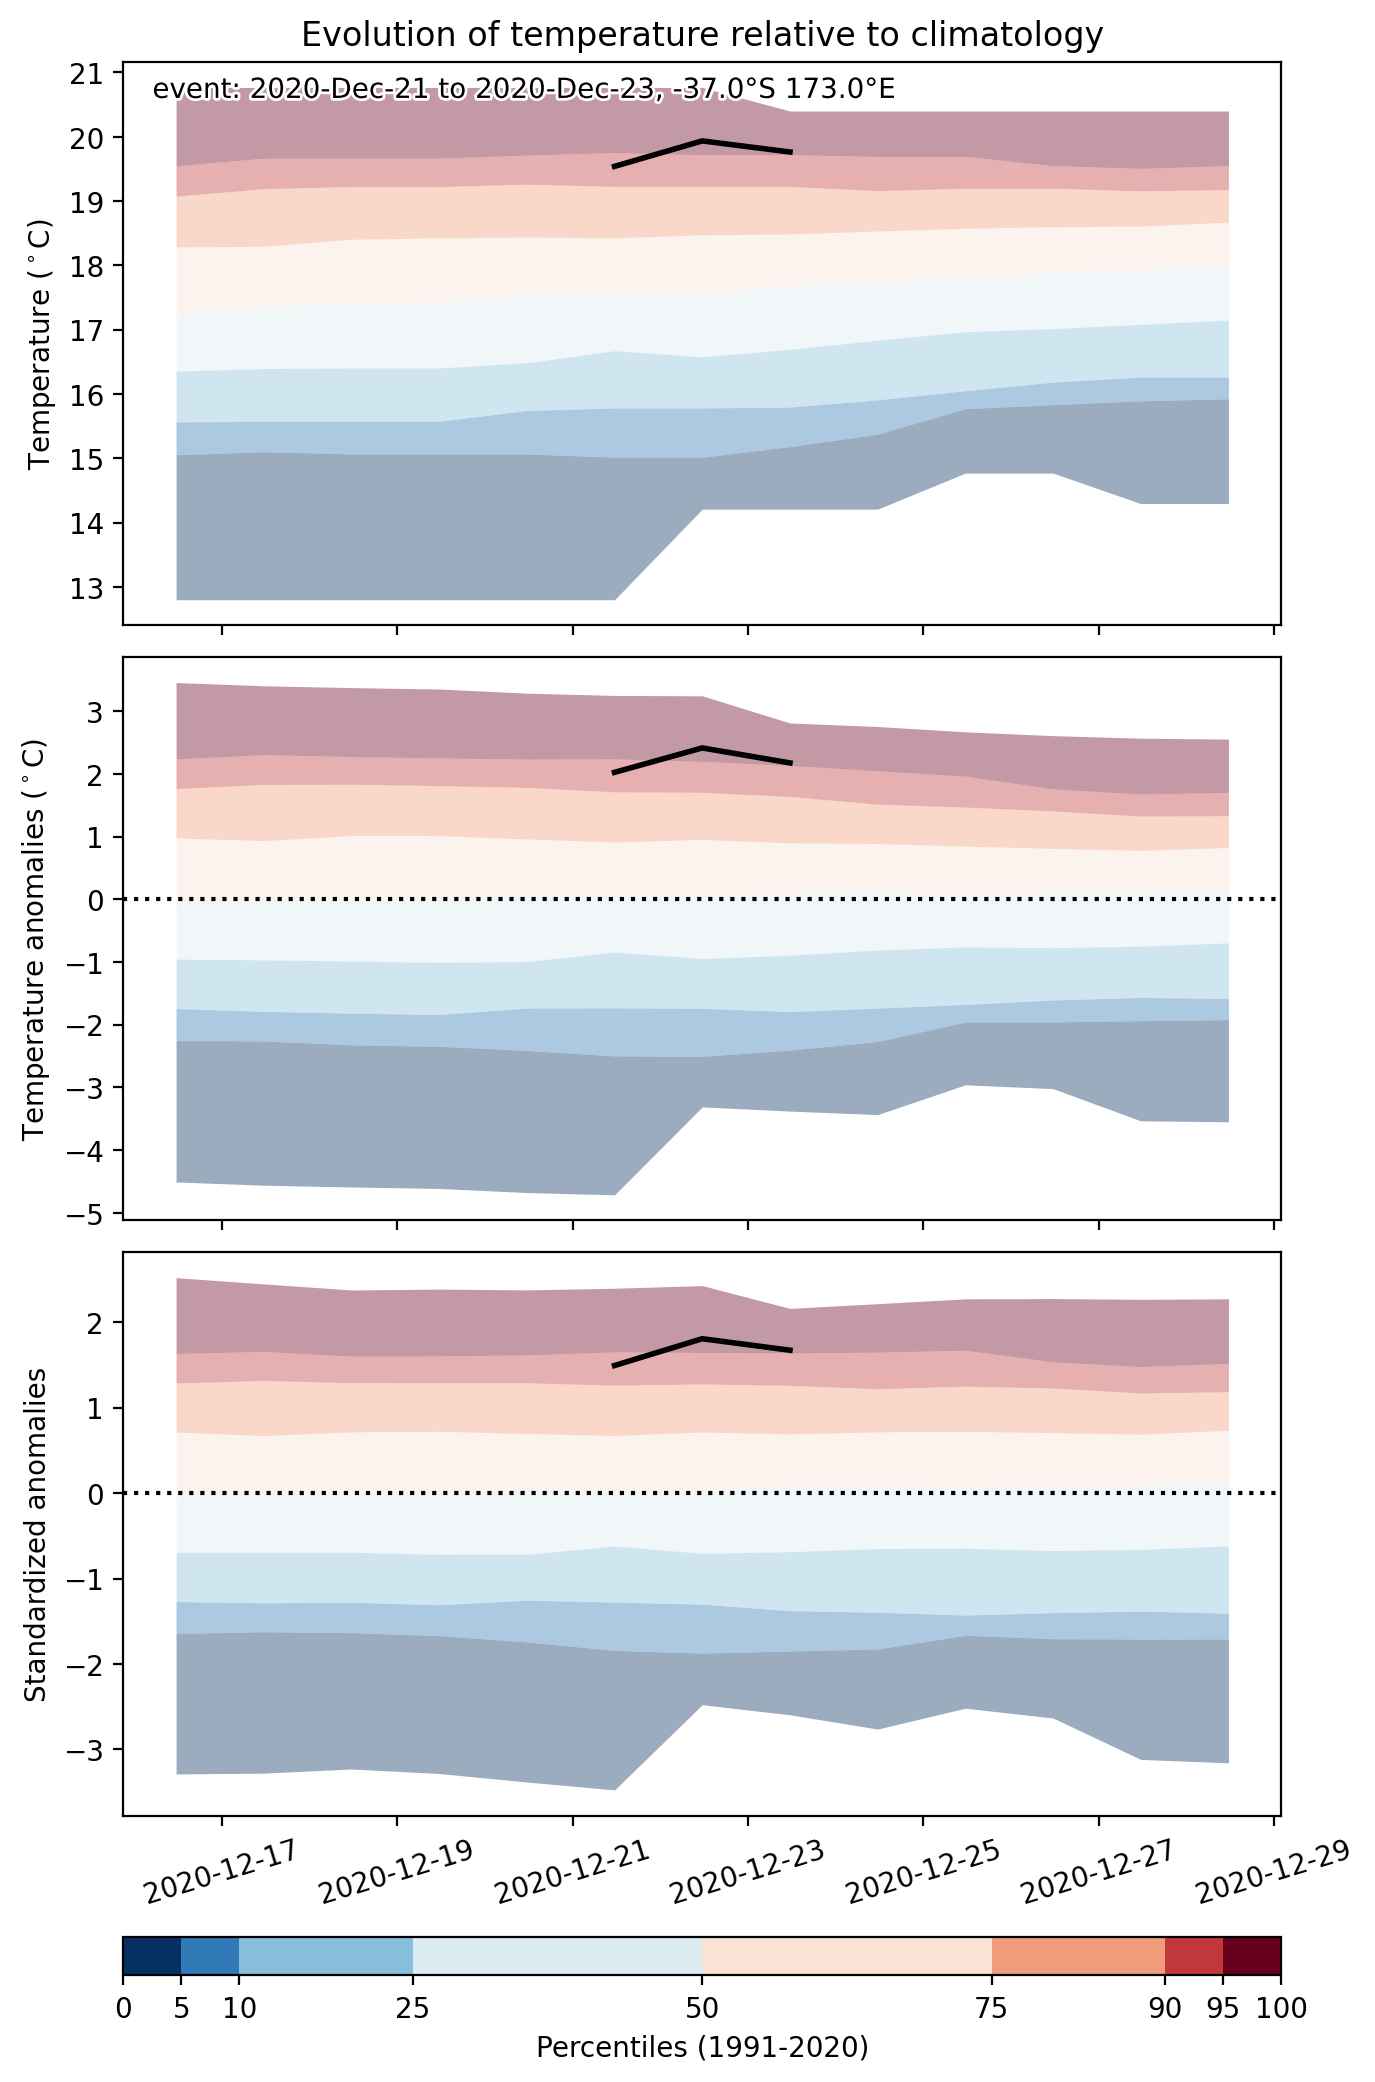
Heat wave occuring from December 21 2020 to December 23 2020 at -37.0°S 173.0°E

Download data: JSON

Event type: Heat wave

Countries affected (identified with ArcGIS Online; provided only for geographical reference):

  • New Zealand

Duration: 3 days

Time span: December 21 2020 to December 23 2020

Statistics over entire affected area:

  • Mean temperature anomaly: 1.9 °C
  • Mean temperature: 19.9 °C
  • Maximum temperature anomaly: 2.5 °C
  • Maximum temperature: 21.6 °C

Event center: -37.0°S 173.0°E

Area affected: 142673 km$^2$


Fig. 1: Map of most extreme temperature anomalies (standardized) experienced during the event. The purple star indicates the center of the extreme event. Green hatching illustrates all areas under the effect of extremes at some time during the event.


Fig. 2: Evolution of temperature at the center of the event. The climatological percentile distribution is illustrated with color shadings.


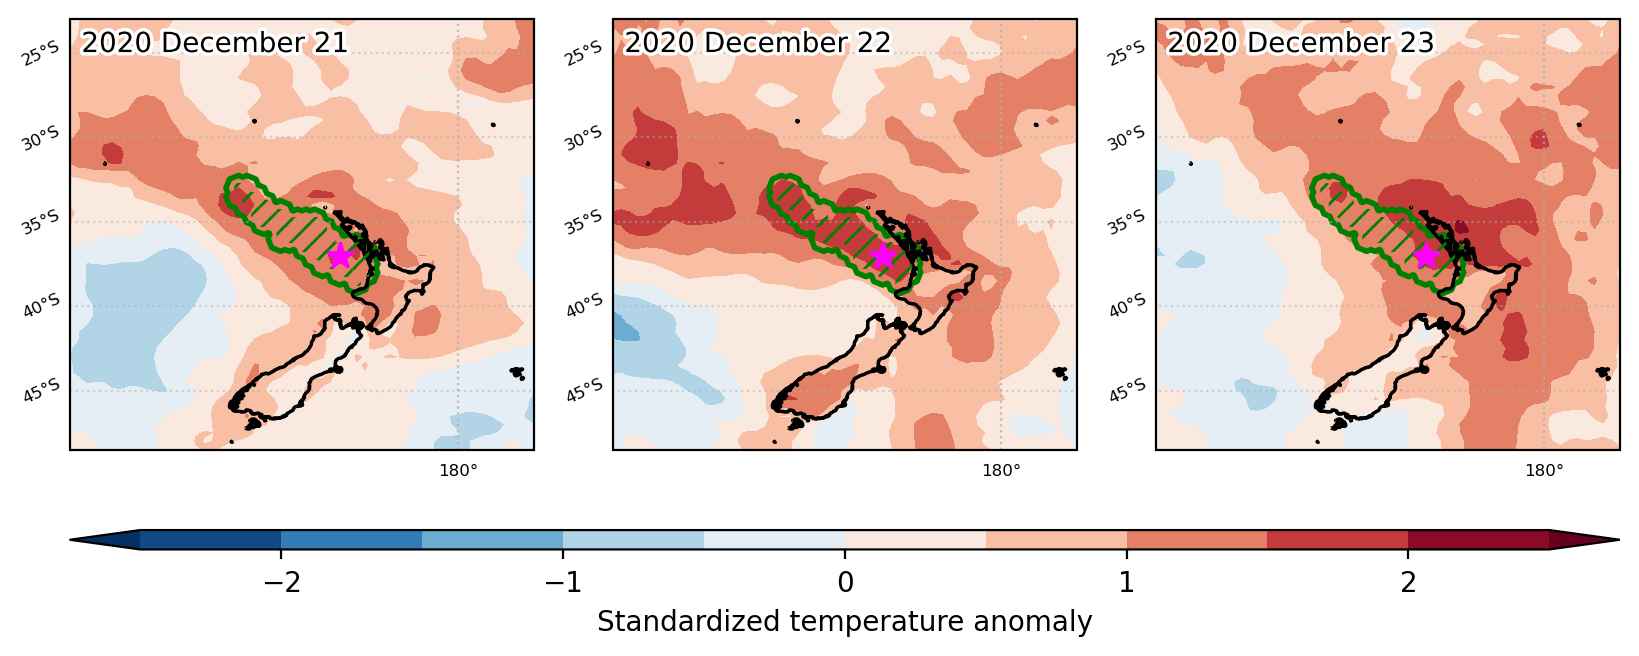
Fig. 3: Maps illustrating the evolution of standardized temperature anomalies during the event.

Event ID: Heat_wave_2020-Dec-21_to_2020-Dec-23_173.0_-37.0

Heat wave occuring from November 24 2020 to November 28 2020 at -30.5°S 179.0°E

Download data: JSON

Event type: Heat wave

Countries affected (identified with ArcGIS Online; provided only for geographical reference):

  • New Zealand

Duration: 5 days

Time span: November 24 2020 to November 28 2020

Statistics over entire affected area:

  • Mean temperature anomaly: 2.0 °C
  • Mean temperature: 21.2 °C
  • Maximum temperature anomaly: 3.2 °C
  • Maximum temperature: 24.7 °C

Event center: -30.5°S 179.0°E

Area affected: 933992 km$^2$


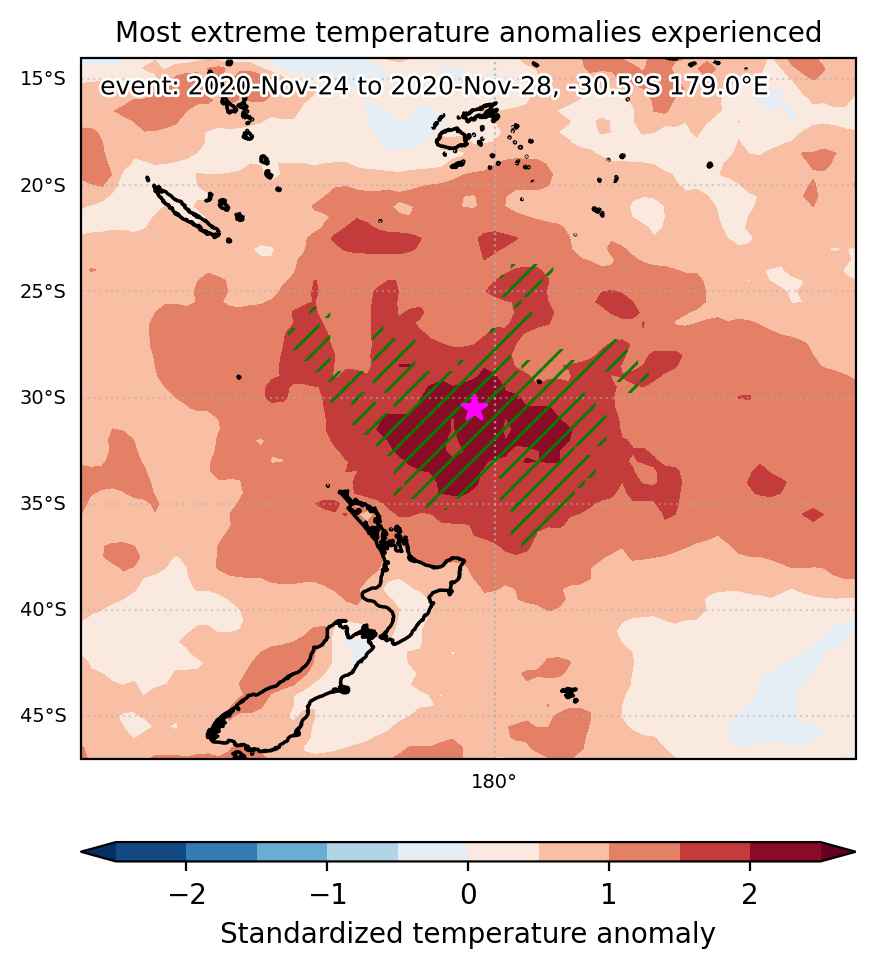
Fig. 1: Map of most extreme temperature anomalies (standardized) experienced during the event. The purple star indicates the center of the extreme event. Green hatching illustrates all areas under the effect of extremes at some time during the event.


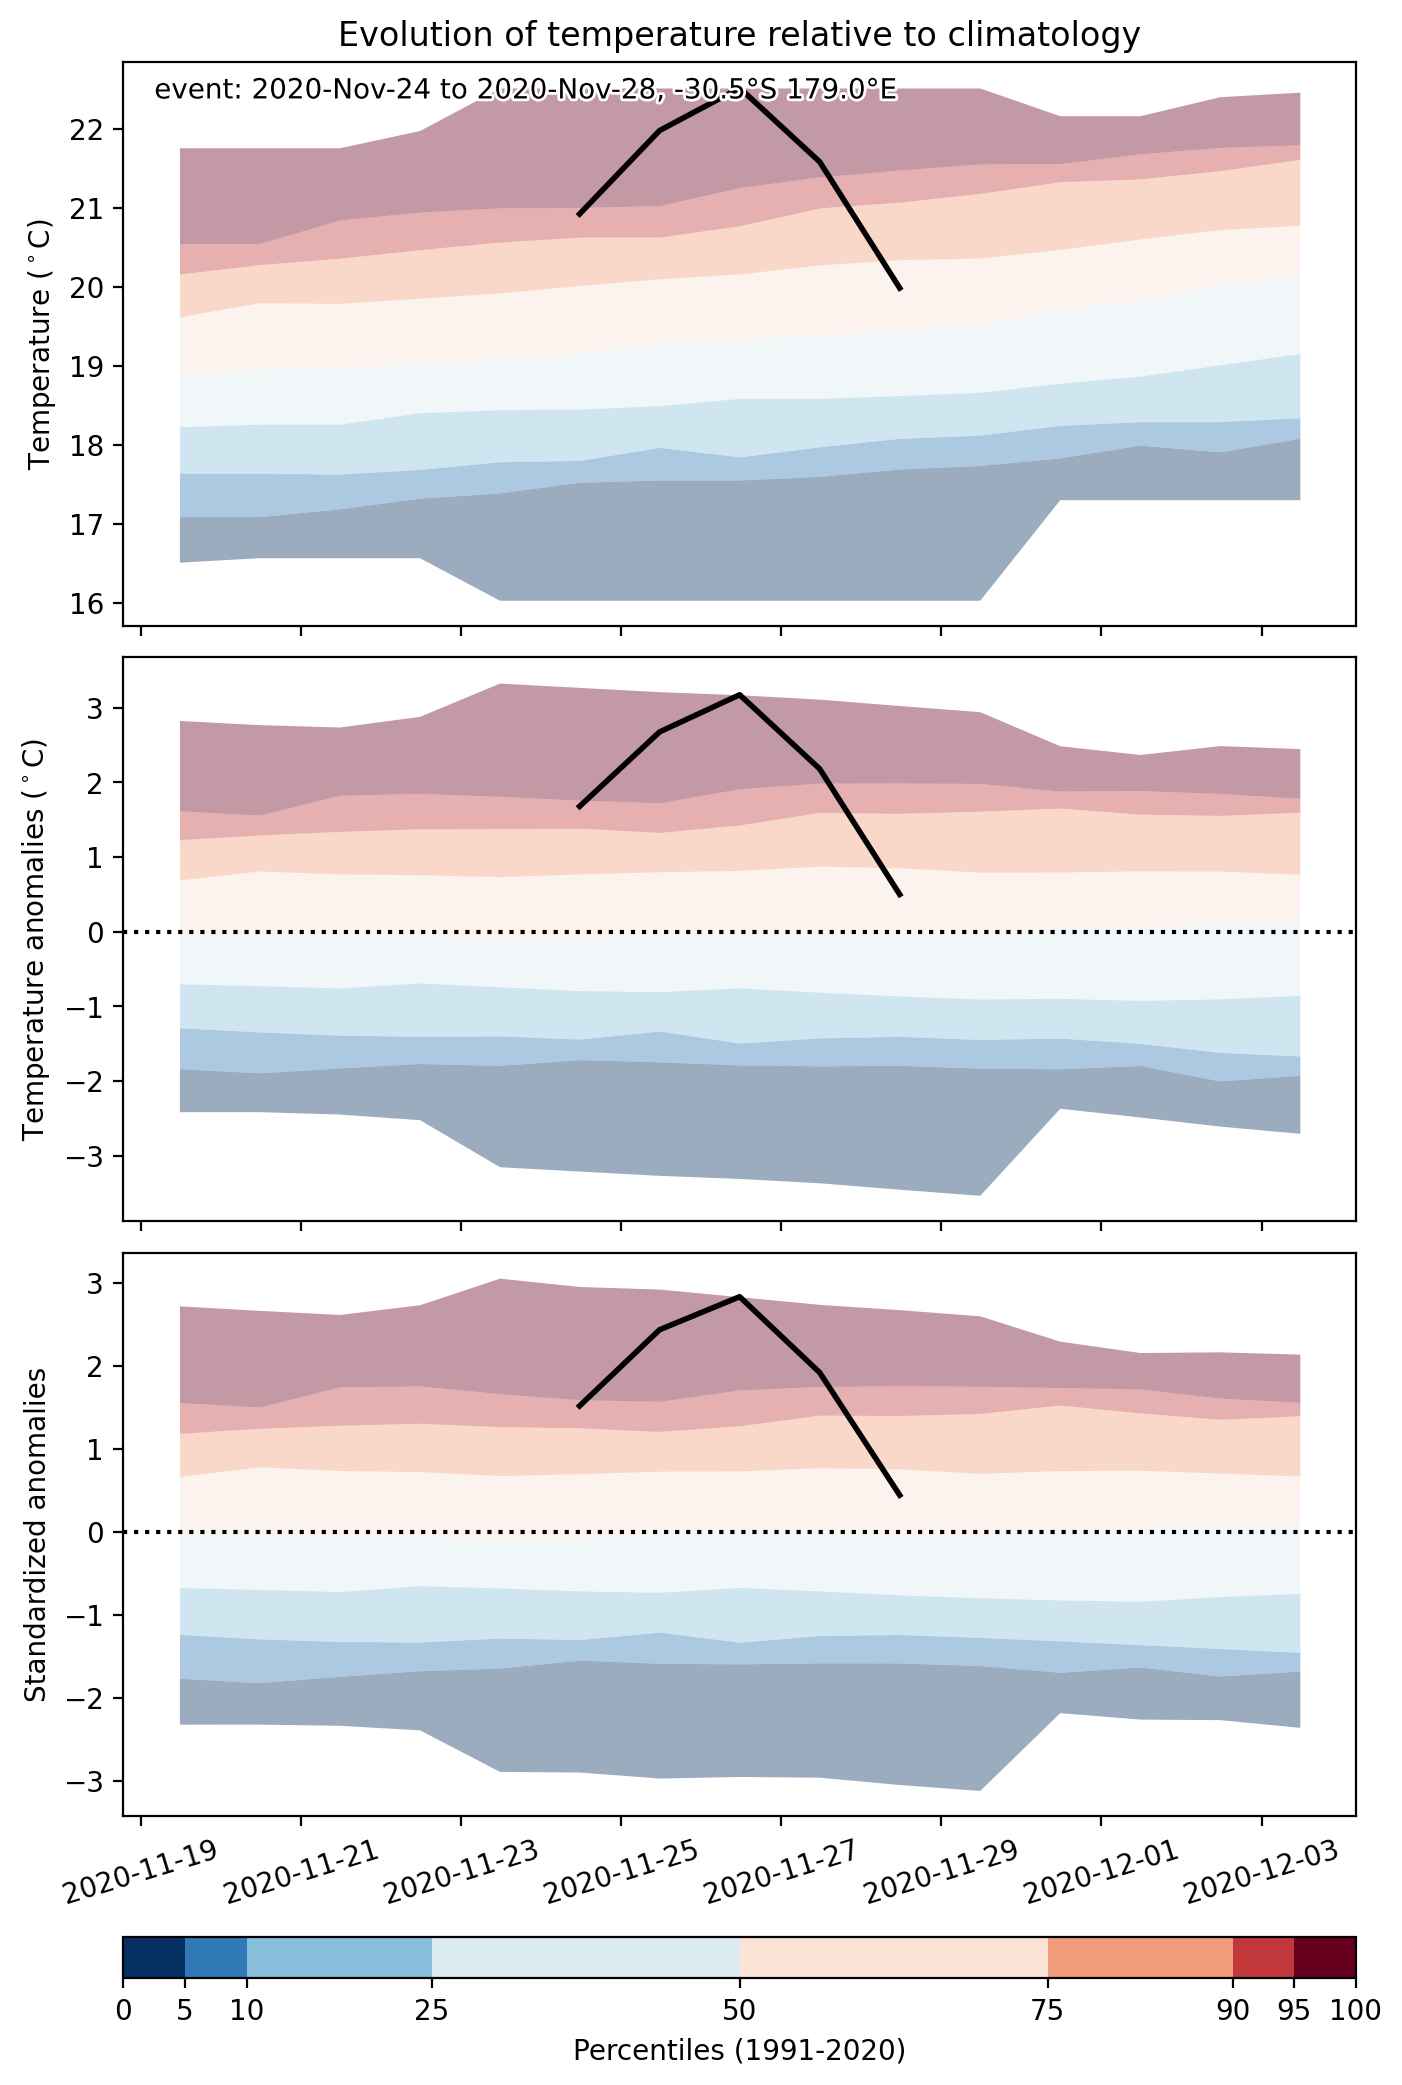
Fig. 2: Evolution of temperature at the center of the event. The climatological percentile distribution is illustrated with color shadings.


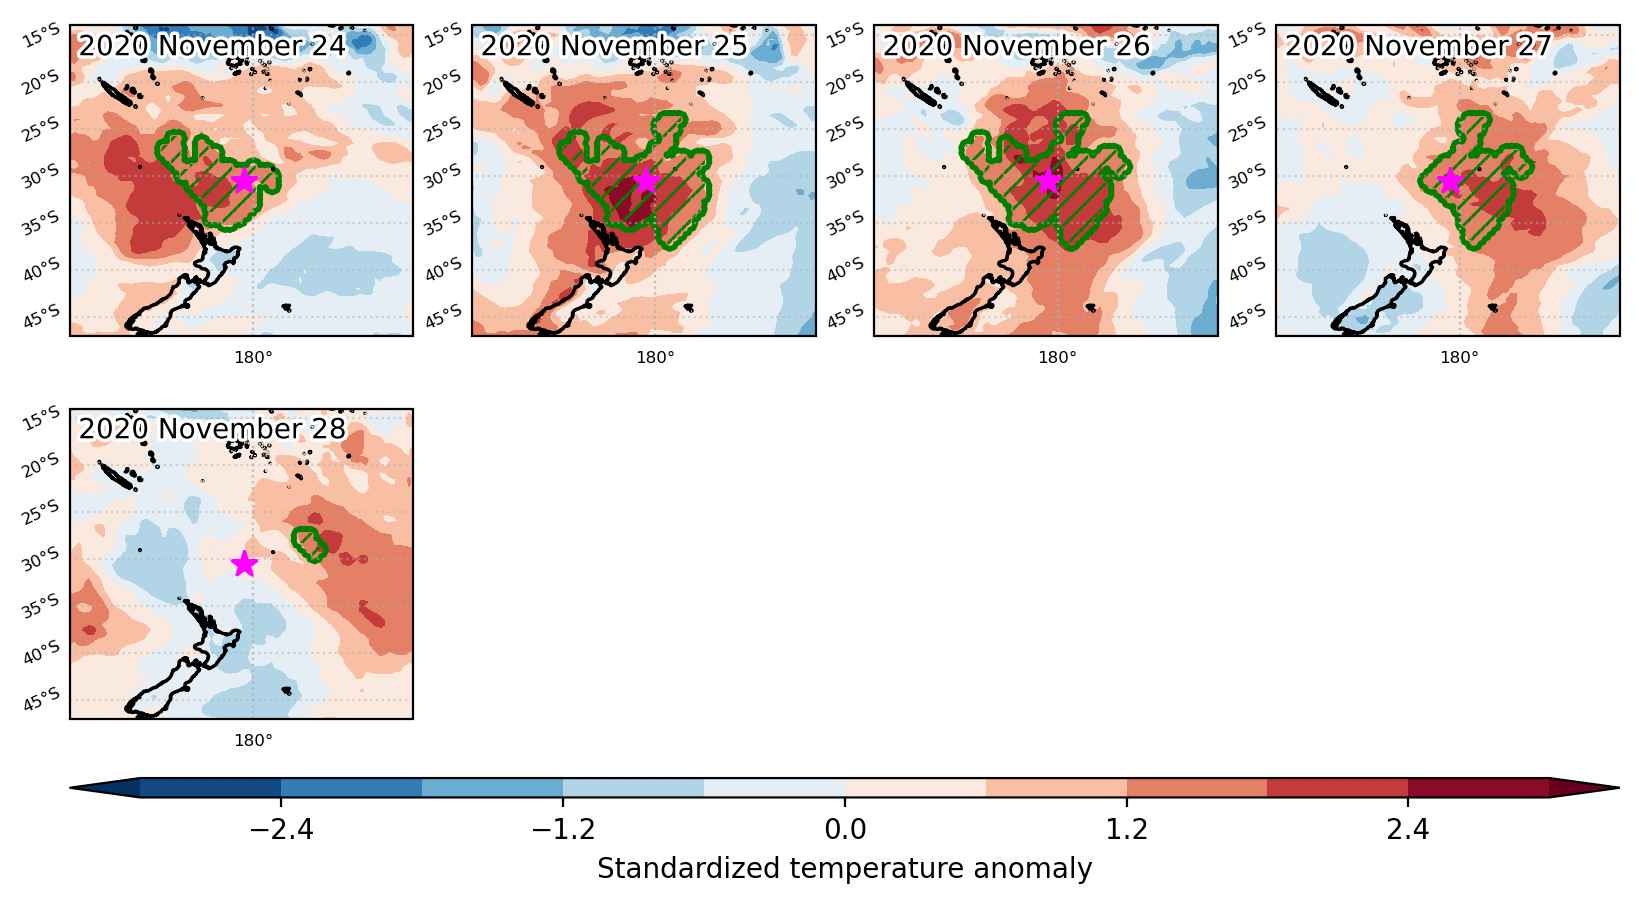
Fig. 3: Maps illustrating the evolution of standardized temperature anomalies during the event.

Event ID: Heat_wave_2020-Nov-24_to_2020-Nov-28_179.0_-30.5

Heat wave occuring from October 22 2020 to October 24 2020 at -48.0°S 169.0°E

Download data: JSON

Event type: Heat wave

Countries affected (identified with ArcGIS Online; provided only for geographical reference):

  • New Zealand

Duration: 3 days

Time span: October 22 2020 to October 24 2020

Statistics over entire affected area:

  • Mean temperature anomaly: 2.5 °C
  • Mean temperature: 12.1 °C
  • Maximum temperature anomaly: 4.3 °C
  • Maximum temperature: 14.0 °C

Event center: -48.0°S 169.0°E

Area affected: 85959 km$^2$


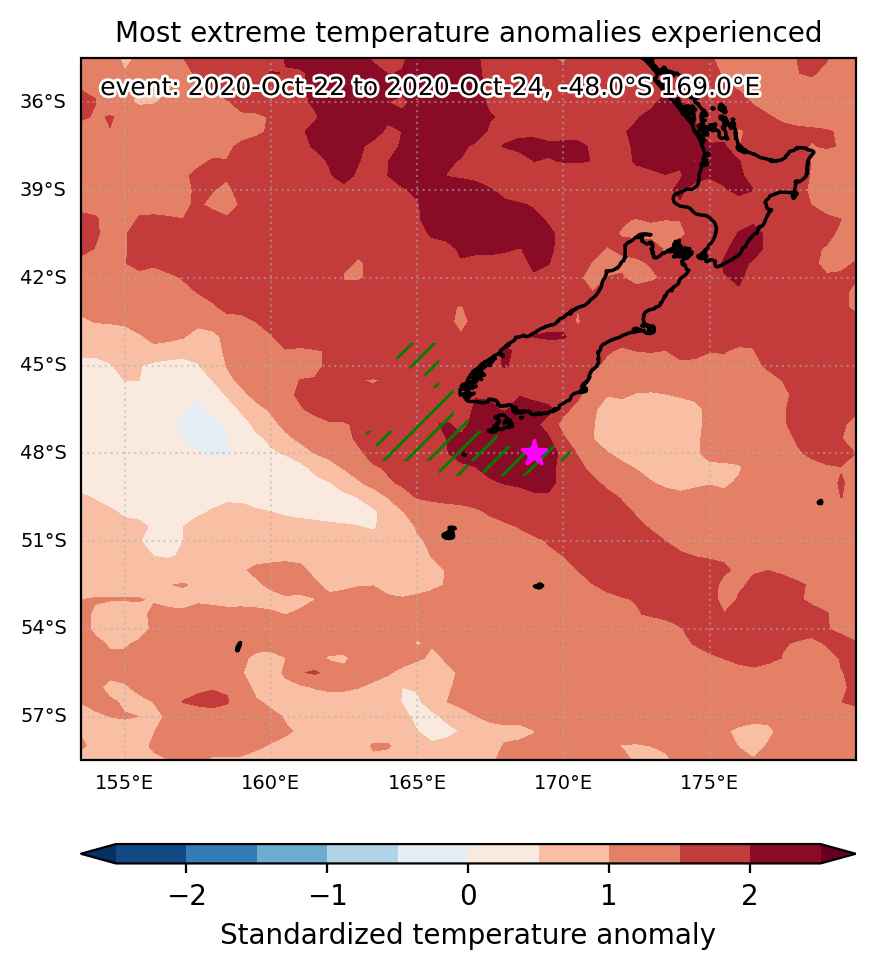
Fig. 1: Map of most extreme temperature anomalies (standardized) experienced during the event. The purple star indicates the center of the extreme event. Green hatching illustrates all areas under the effect of extremes at some time during the event.


Fig. 2: Evolution of temperature at the center of the event. The climatological percentile distribution is illustrated with color shadings.


Fig. 3: Maps illustrating the evolution of standardized temperature anomalies during the event.

Event ID: Heat_wave_2020-Oct-22_to_2020-Oct-24_169.0_-48.0

Heat wave occuring from October 17 2020 to November 20 2020 at -36.5°S 173.5°E

Download data: JSON

Event type: Heat wave

Countries affected (identified with ArcGIS Online; provided only for geographical reference):

  • Australia
  • Fiji
  • New Caledonia
  • New Zealand
  • Norfolk Island
  • Papua New Guinea
  • Solomon Islands
  • Vanuatu

Duration: 35 days

Time span: October 17 2020 to November 20 2020

Statistics over entire affected area:

  • Mean temperature anomaly: 2.0 °C
  • Mean temperature: 20.4 °C
  • Maximum temperature anomaly: 10.4 °C
  • Maximum temperature: 28.9 °C

Event center: -36.5°S 173.5°E

Area affected: 14341989 km$^2$


Fig. 1: Map of most extreme temperature anomalies (standardized) experienced during the event. The purple star indicates the center of the extreme event. Green hatching illustrates all areas under the effect of extremes at some time during the event.


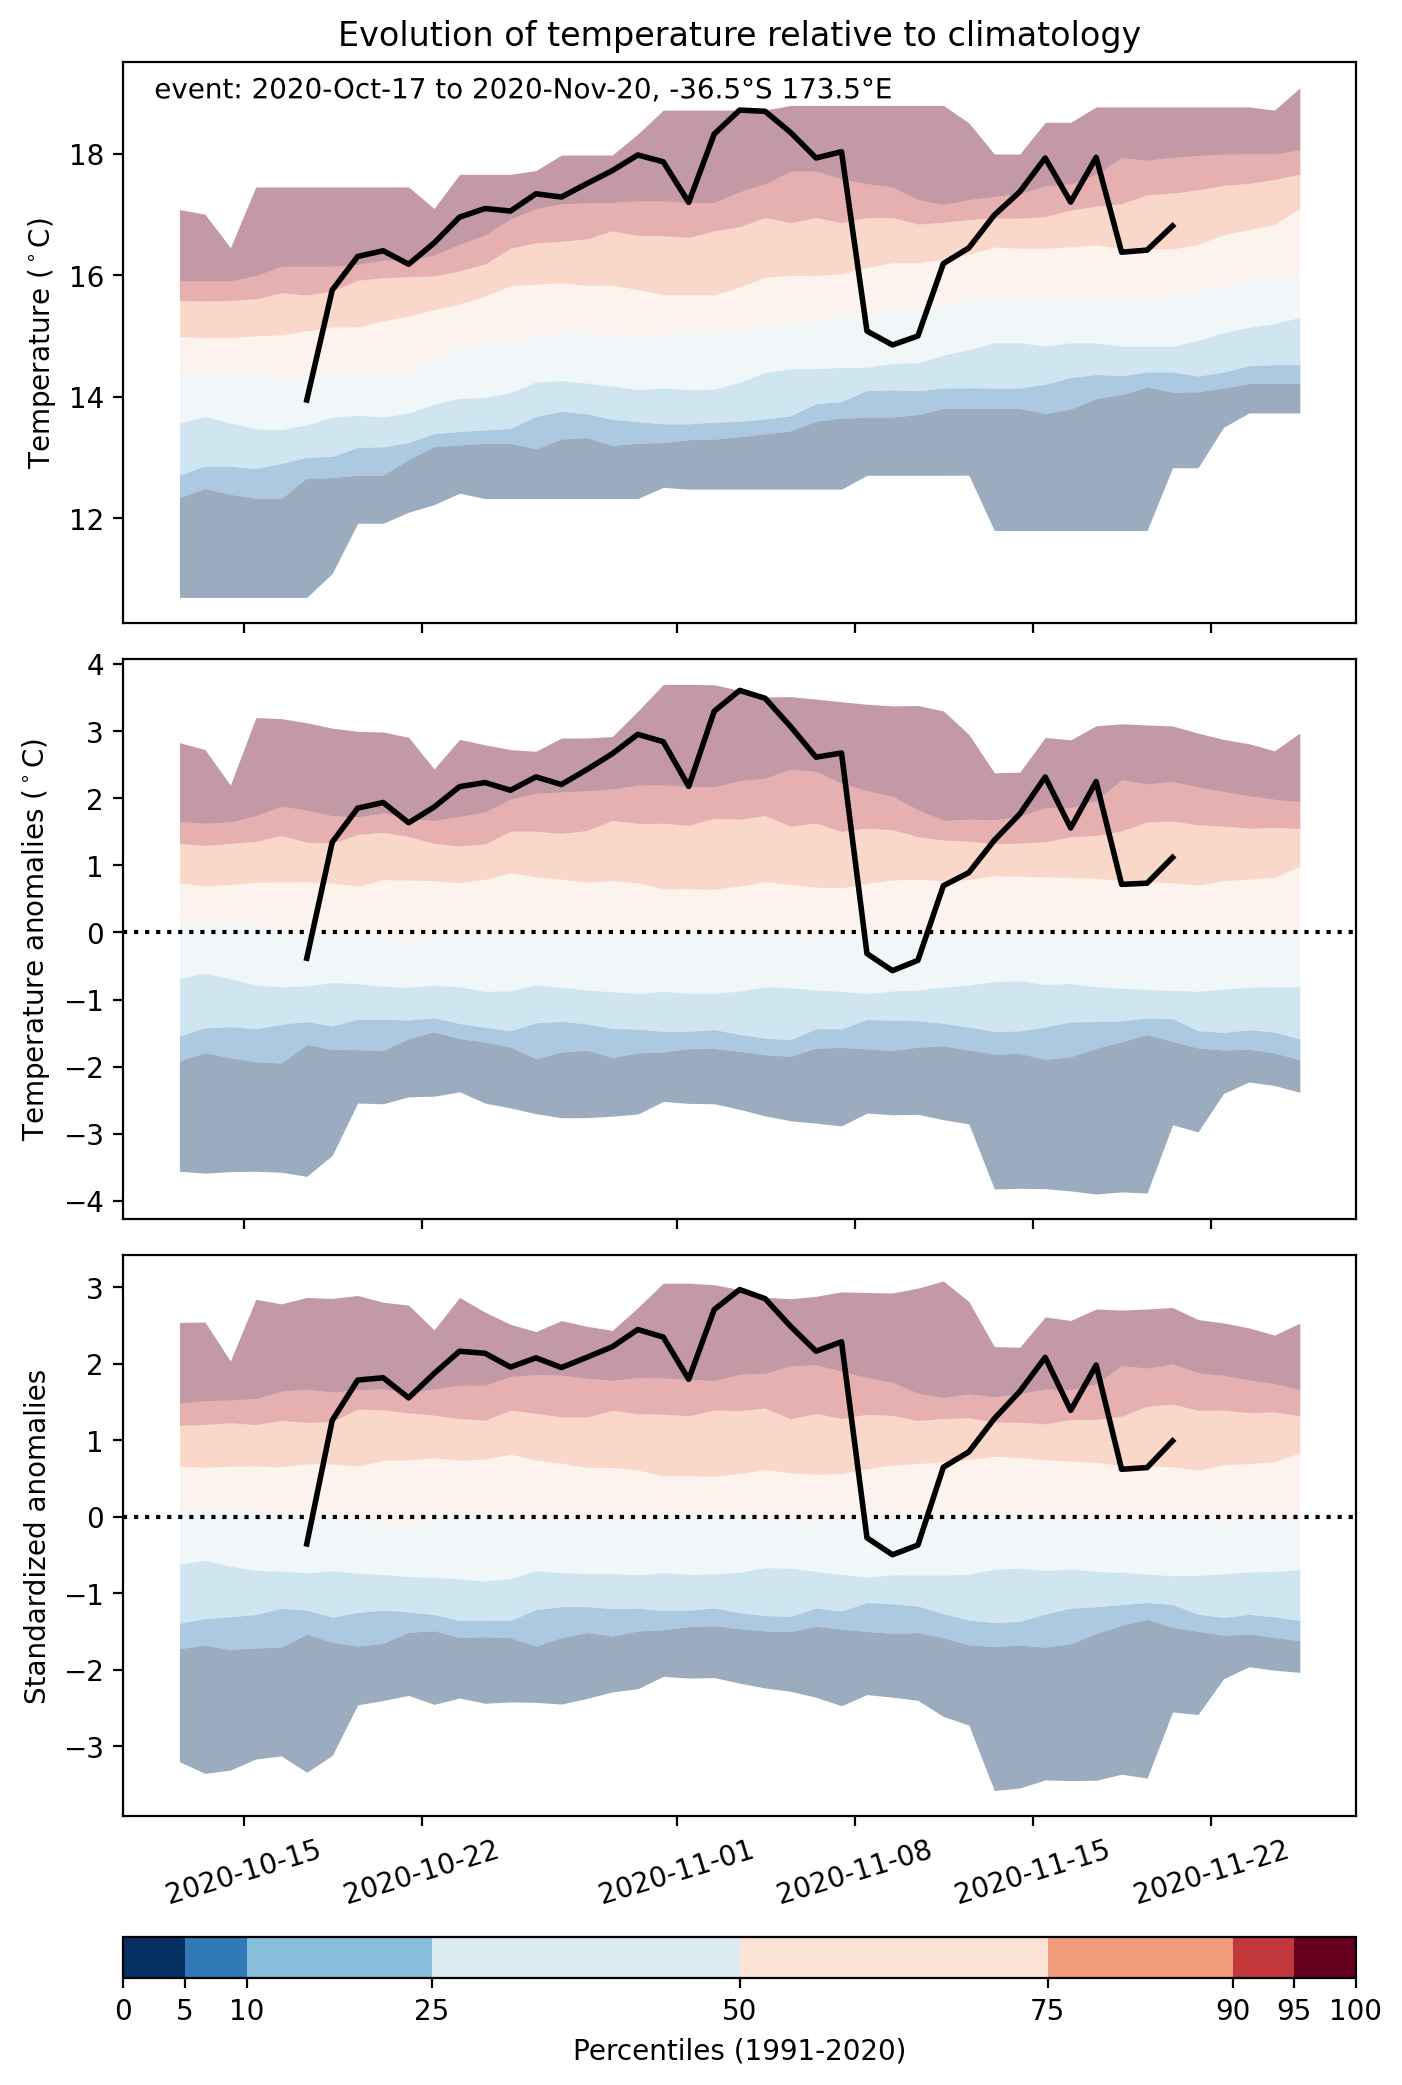
Fig. 2: Evolution of temperature at the center of the event. The climatological percentile distribution is illustrated with color shadings.


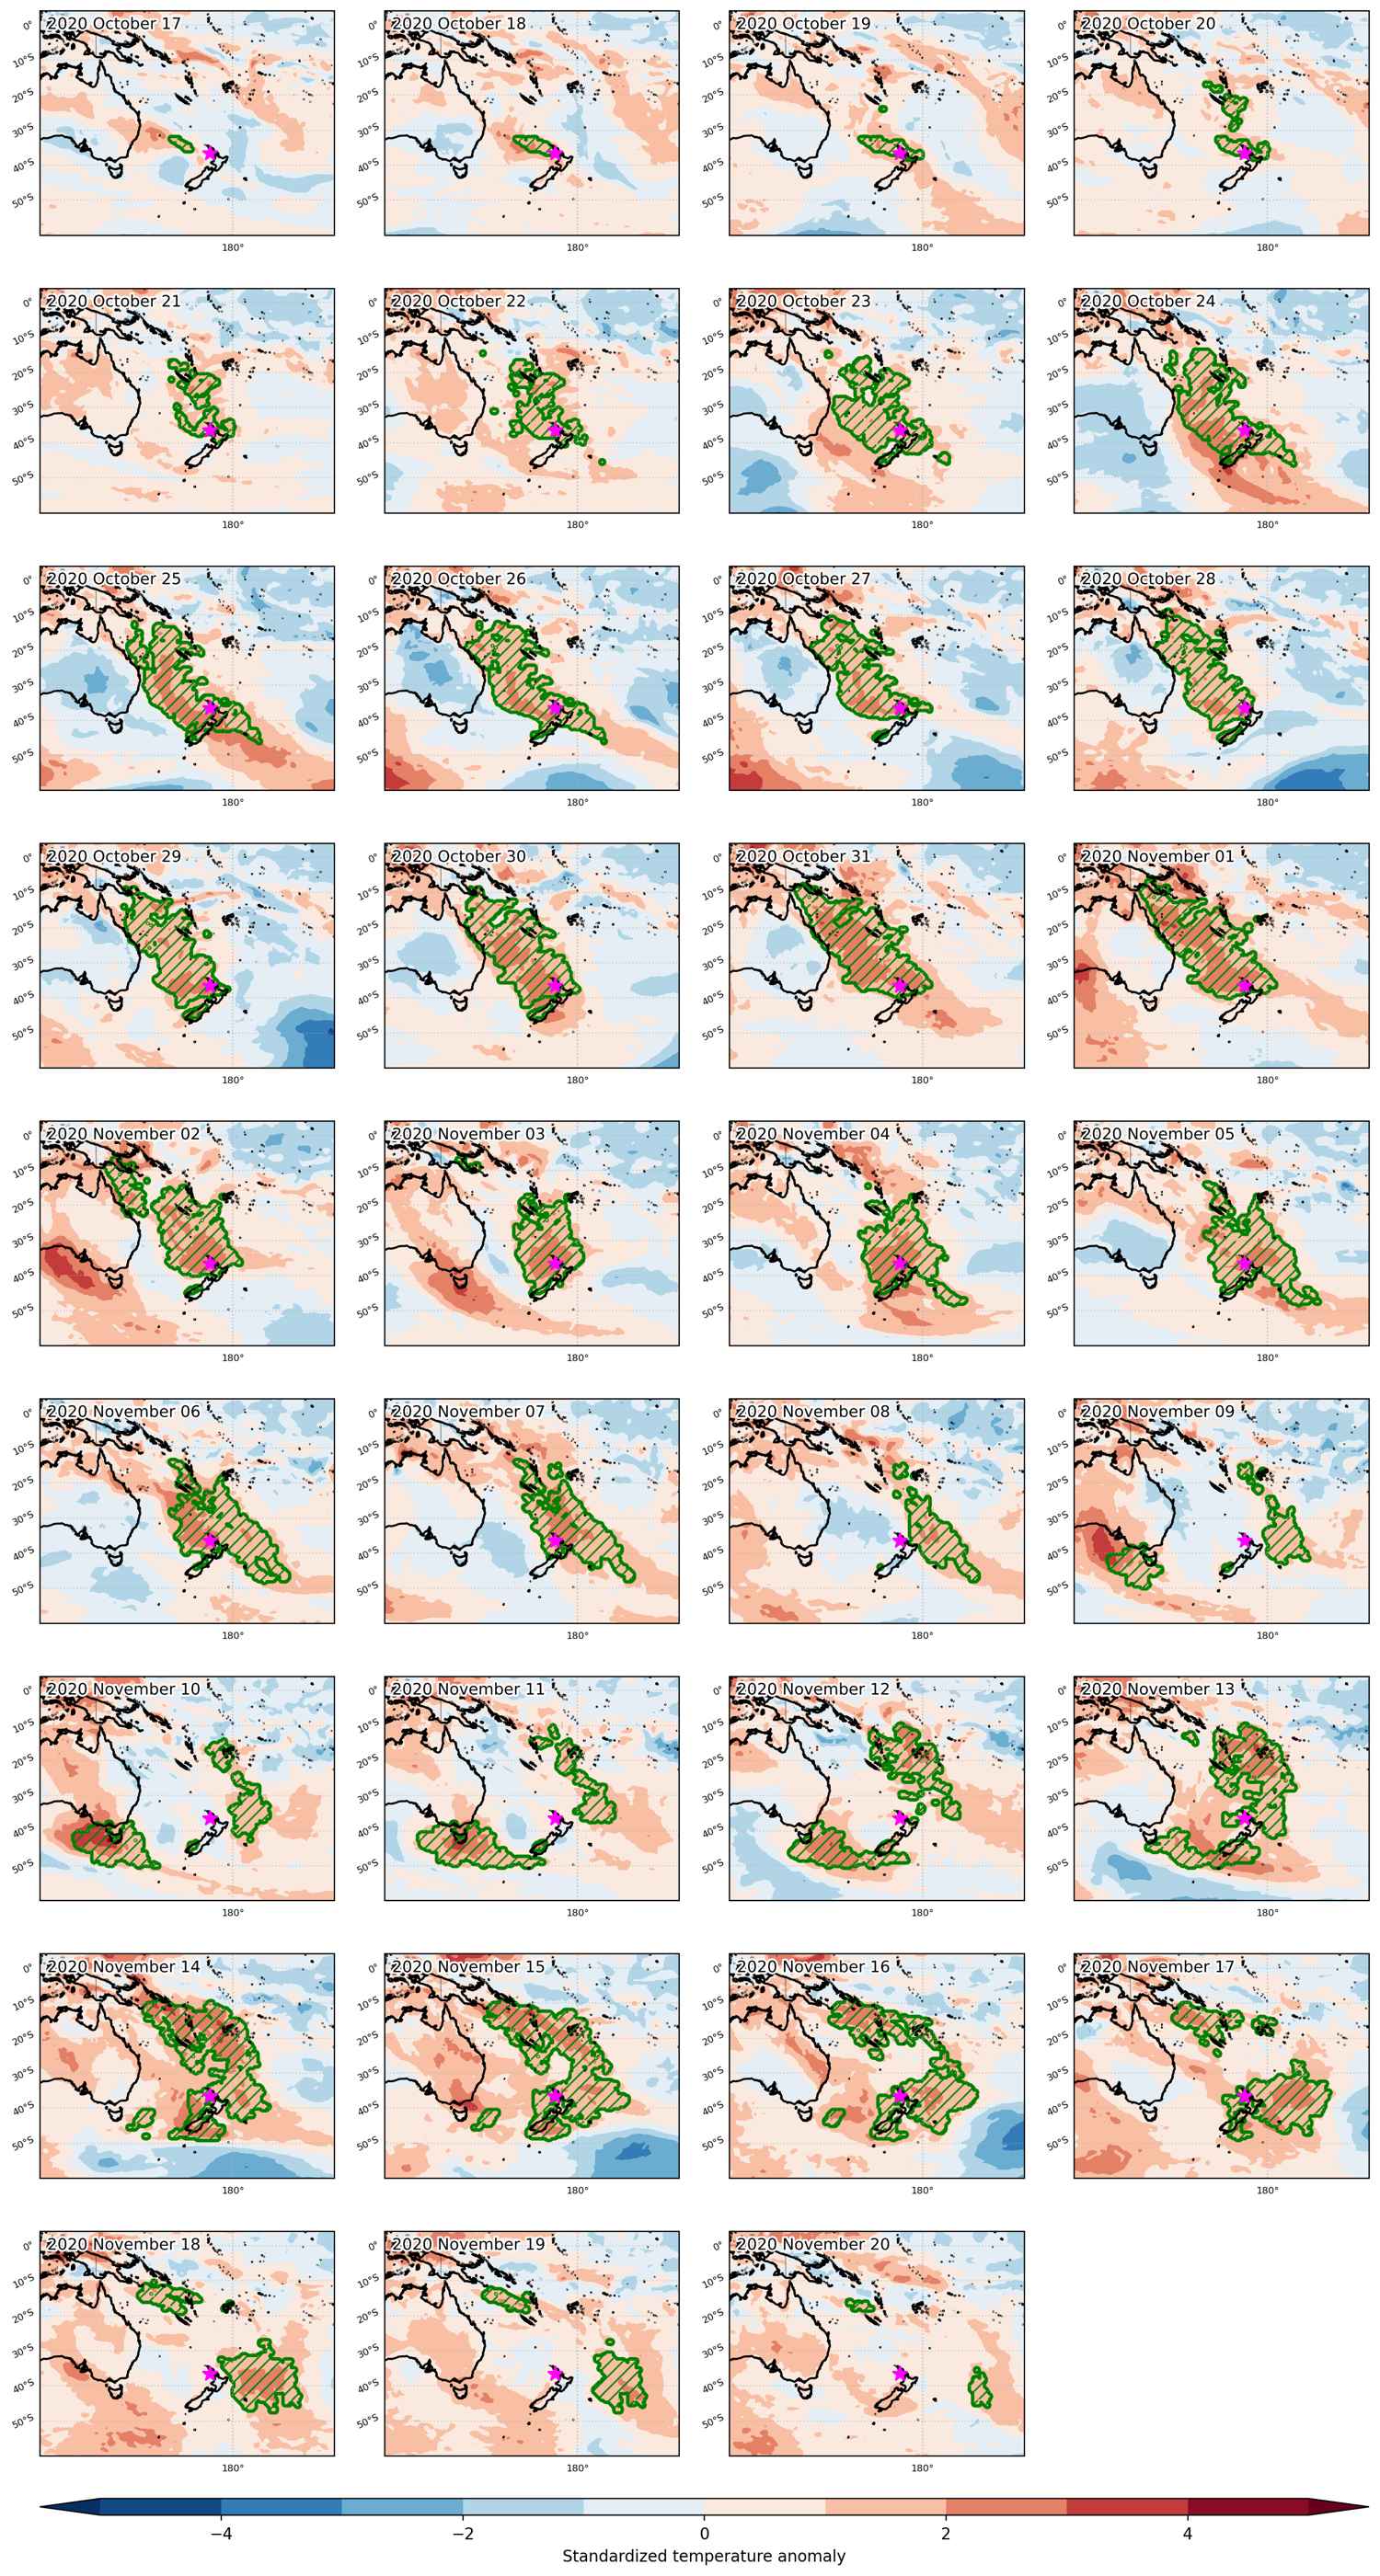
Fig. 3: Maps illustrating the evolution of standardized temperature anomalies during the event.

Event ID: Heat_wave_2020-Oct-17_to_2020-Nov-20_173.5_-36.5

Heat wave occuring from October 01 2020 to October 06 2020 at -38.0°S 147.5°E

Download data: JSON

Event type: Heat wave

Countries affected (identified with ArcGIS Online; provided only for geographical reference):

  • Australia
  • New Zealand

Duration: 6 days

Time span: October 01 2020 to October 06 2020

Statistics over entire affected area:

  • Mean temperature anomaly: 3.4 °C
  • Mean temperature: 14.9 °C
  • Maximum temperature anomaly: 10.9 °C
  • Maximum temperature: 28.7 °C

Event center: -38.0°S 147.5°E

Area affected: 1333329 km$^2$


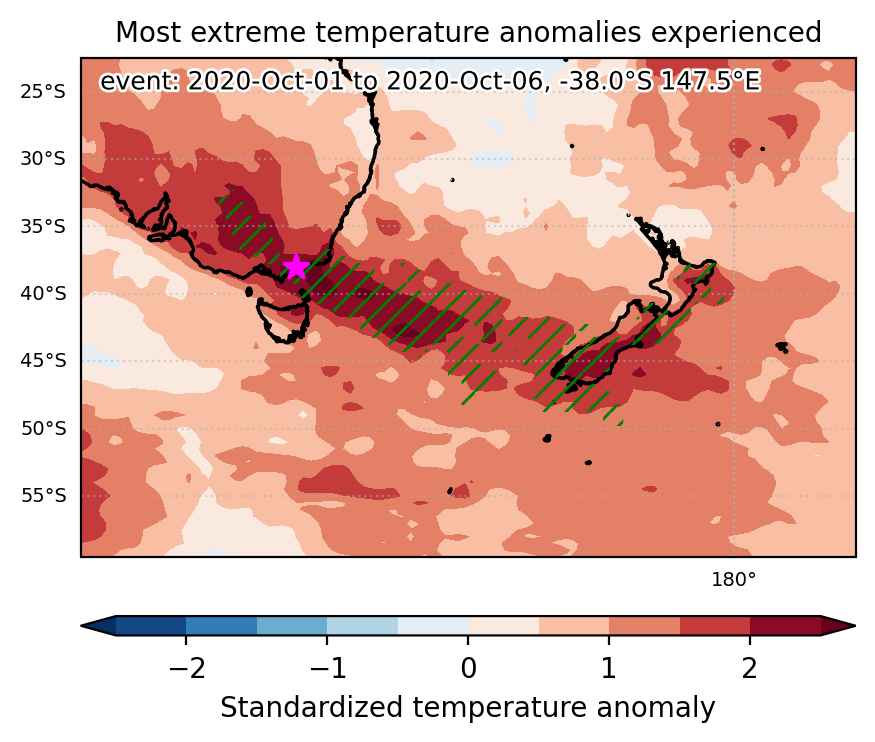
Fig. 1: Map of most extreme temperature anomalies (standardized) experienced during the event. The purple star indicates the center of the extreme event. Green hatching illustrates all areas under the effect of extremes at some time during the event.


Fig. 2: Evolution of temperature at the center of the event. The climatological percentile distribution is illustrated with color shadings.


Fig. 3: Maps illustrating the evolution of standardized temperature anomalies during the event.

Event ID: Heat_wave_2020-Oct-01_to_2020-Oct-06_147.5_-38.0