Heat wave occuring from June 04 2020 to June 08 2020 at -5.5°S 38.0°E

Download data: JSON

Event type: Heat wave

Countries affected (identified with ArcGIS Online; provided only for geographical reference):

  • Kenya
  • Mozambique
  • Tanzania, United Republic of

Duration: 5 days

Time span: June 04 2020 to June 08 2020

Statistics over entire affected area:

  • Mean temperature anomaly: 1.4 °C
  • Mean temperature: 24.7 °C
  • Maximum temperature anomaly: 2.7 °C
  • Maximum temperature: 27.5 °C

Event center: -5.5°S 38.0°E

Area affected: 168513 km$^2$


Fig. 1: Map of most extreme temperature anomalies (standardized) experienced during the event. The purple star indicates the center of the extreme event. Green hatching illustrates all areas under the effect of extremes at some time during the event.


Fig. 2: Evolution of temperature at the center of the event. The climatological percentile distribution is illustrated with color shadings.


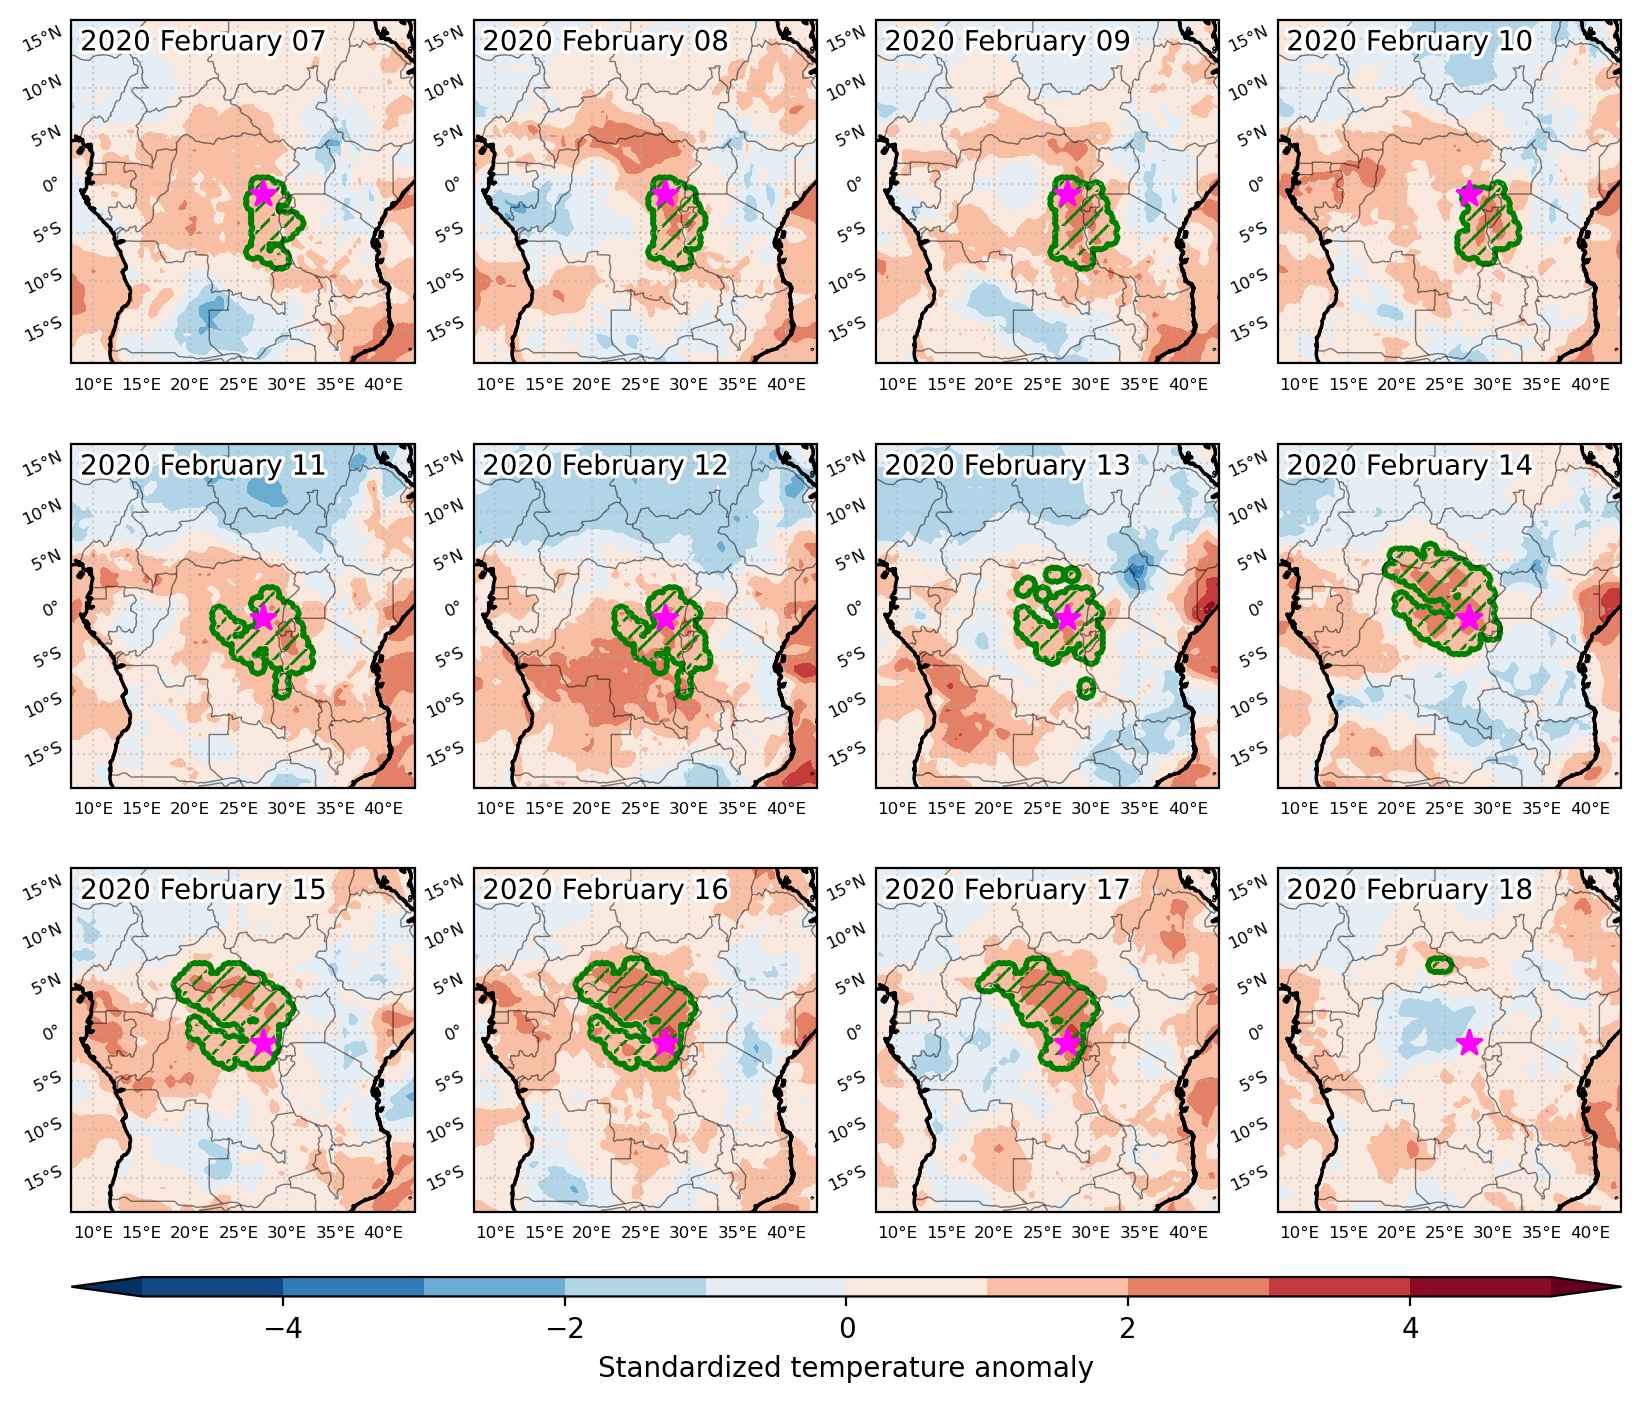
Fig. 3: Maps illustrating the evolution of standardized temperature anomalies during the event.

Event ID: Heat_wave_2020-Jun-04_to_2020-Jun-08_38.0_-5.5
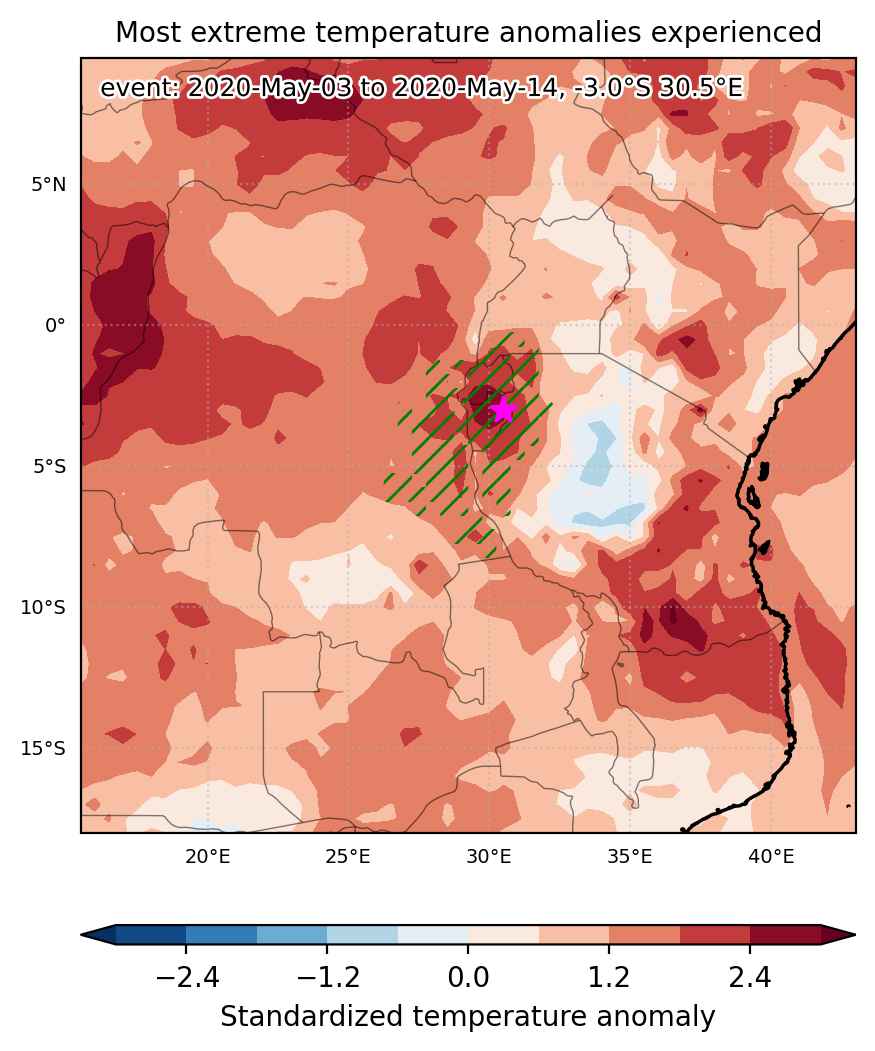
Heat wave occuring from May 03 2020 to May 14 2020 at -3.0°S 30.5°E

Download data: JSON

Event type: Heat wave

Countries affected (identified with ArcGIS Online; provided only for geographical reference):

  • Burundi
  • Congo, The Democratic Republic of the
  • Rwanda
  • Tanzania, United Republic of
  • Uganda

Duration: 12 days

Time span: May 03 2020 to May 14 2020

Statistics over entire affected area:

  • Mean temperature anomaly: 1.5 °C
  • Mean temperature: 22.7 °C
  • Maximum temperature anomaly: 2.3 °C
  • Maximum temperature: 28.1 °C

Event center: -3.0°S 30.5°E

Area affected: 280501 km$^2$


Fig. 1: Map of most extreme temperature anomalies (standardized) experienced during the event. The purple star indicates the center of the extreme event. Green hatching illustrates all areas under the effect of extremes at some time during the event.


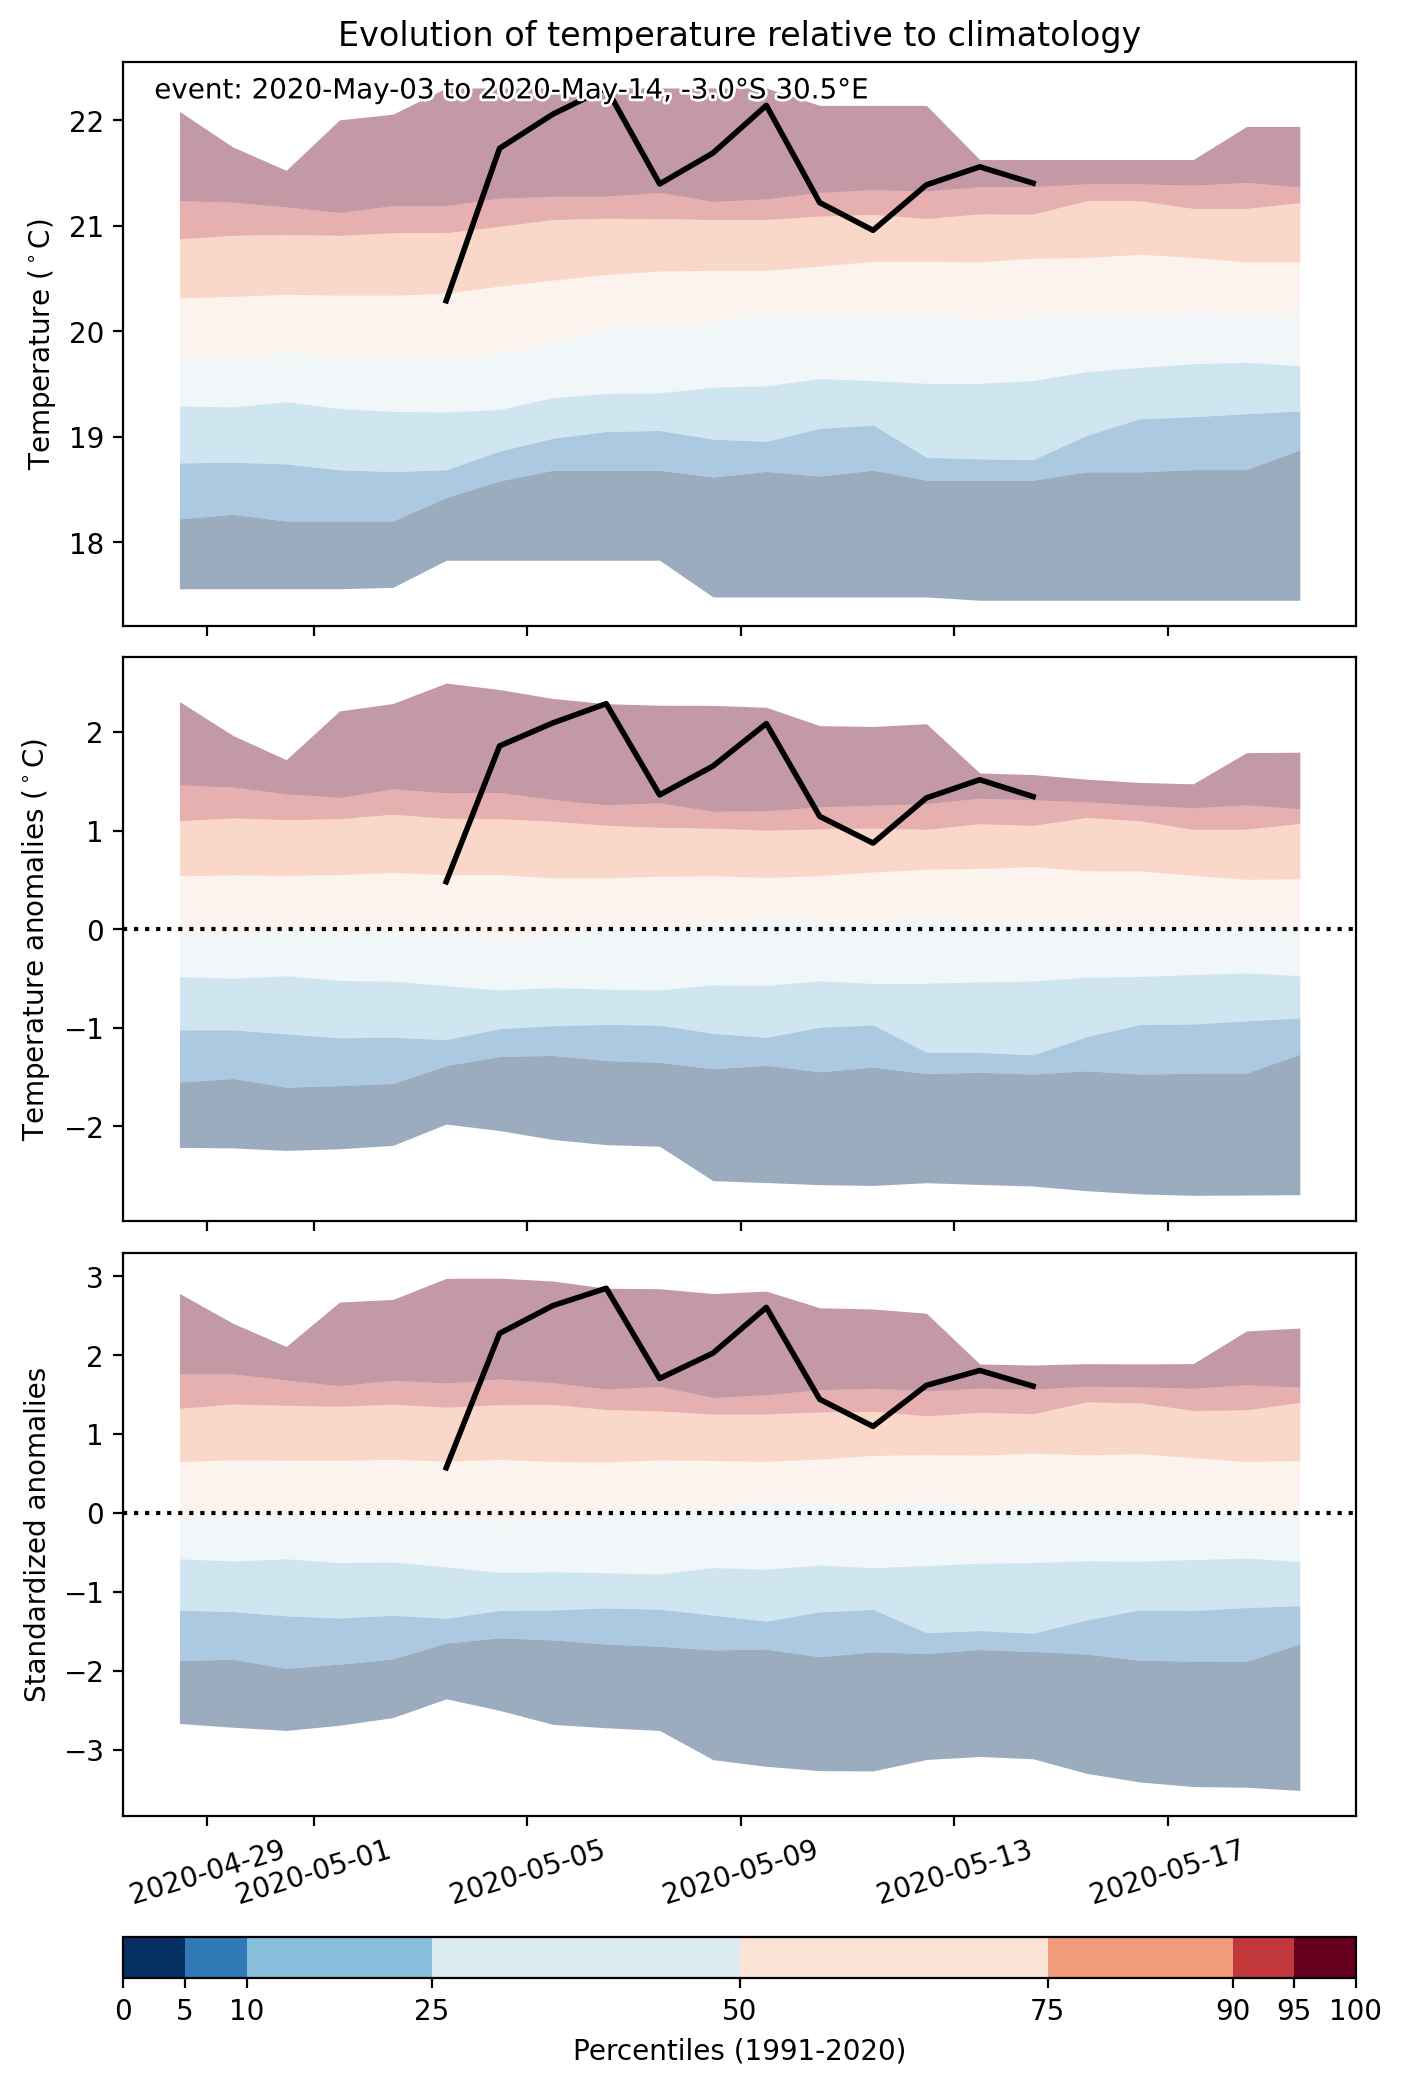
Fig. 2: Evolution of temperature at the center of the event. The climatological percentile distribution is illustrated with color shadings.


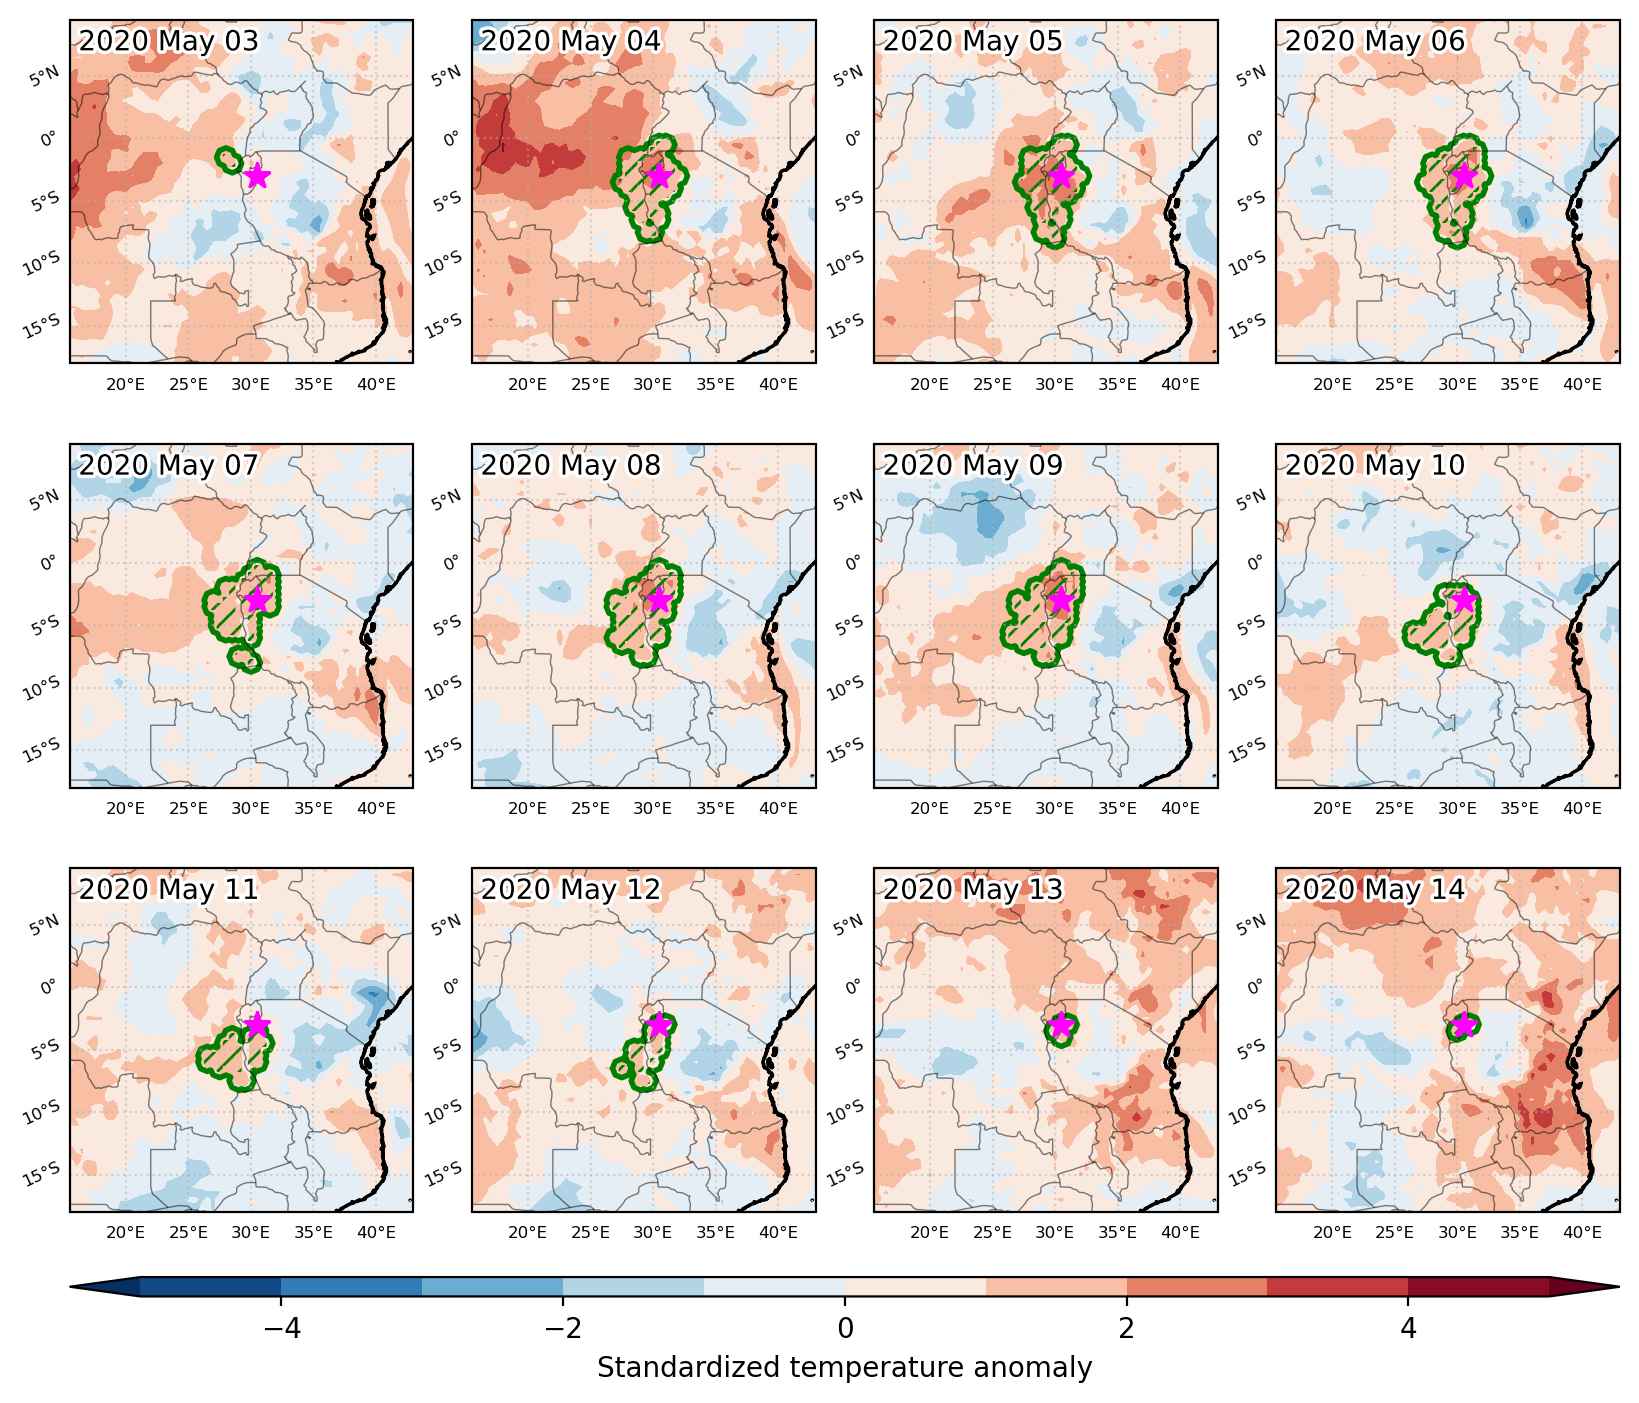
Fig. 3: Maps illustrating the evolution of standardized temperature anomalies during the event.

Event ID: Heat_wave_2020-May-03_to_2020-May-14_30.5_-3.0

Heat wave occuring from April 15 2020 to April 17 2020 at -3.5°S 29.5°E

Download data: JSON

Event type: Heat wave

Countries affected (identified with ArcGIS Online; provided only for geographical reference):

  • Burundi
  • Congo, The Democratic Republic of the
  • Rwanda
  • Tanzania, United Republic of
  • Uganda

Duration: 3 days

Time span: April 15 2020 to April 17 2020

Statistics over entire affected area:

  • Mean temperature anomaly: 1.7 °C
  • Mean temperature: 21.6 °C
  • Maximum temperature anomaly: 3.1 °C
  • Maximum temperature: 26.0 °C

Event center: -3.5°S 29.5°E

Area affected: 83251 km$^2$


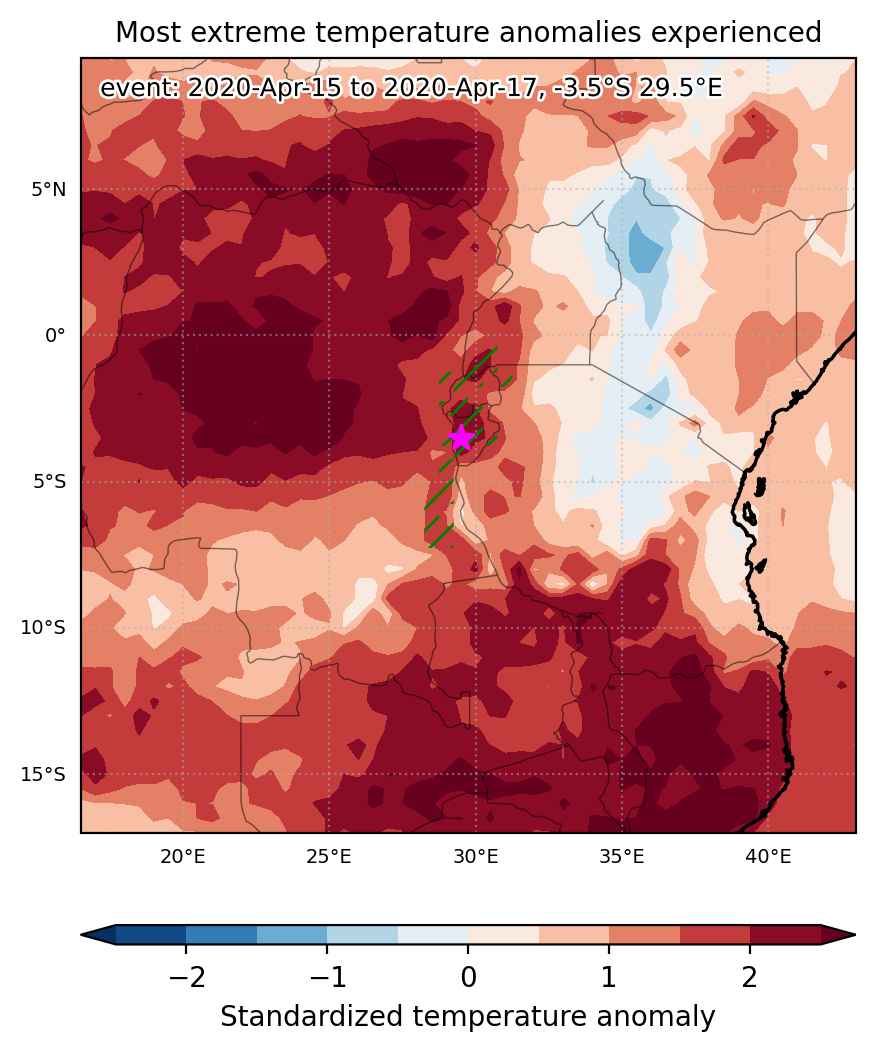
Fig. 1: Map of most extreme temperature anomalies (standardized) experienced during the event. The purple star indicates the center of the extreme event. Green hatching illustrates all areas under the effect of extremes at some time during the event.


Fig. 2: Evolution of temperature at the center of the event. The climatological percentile distribution is illustrated with color shadings.


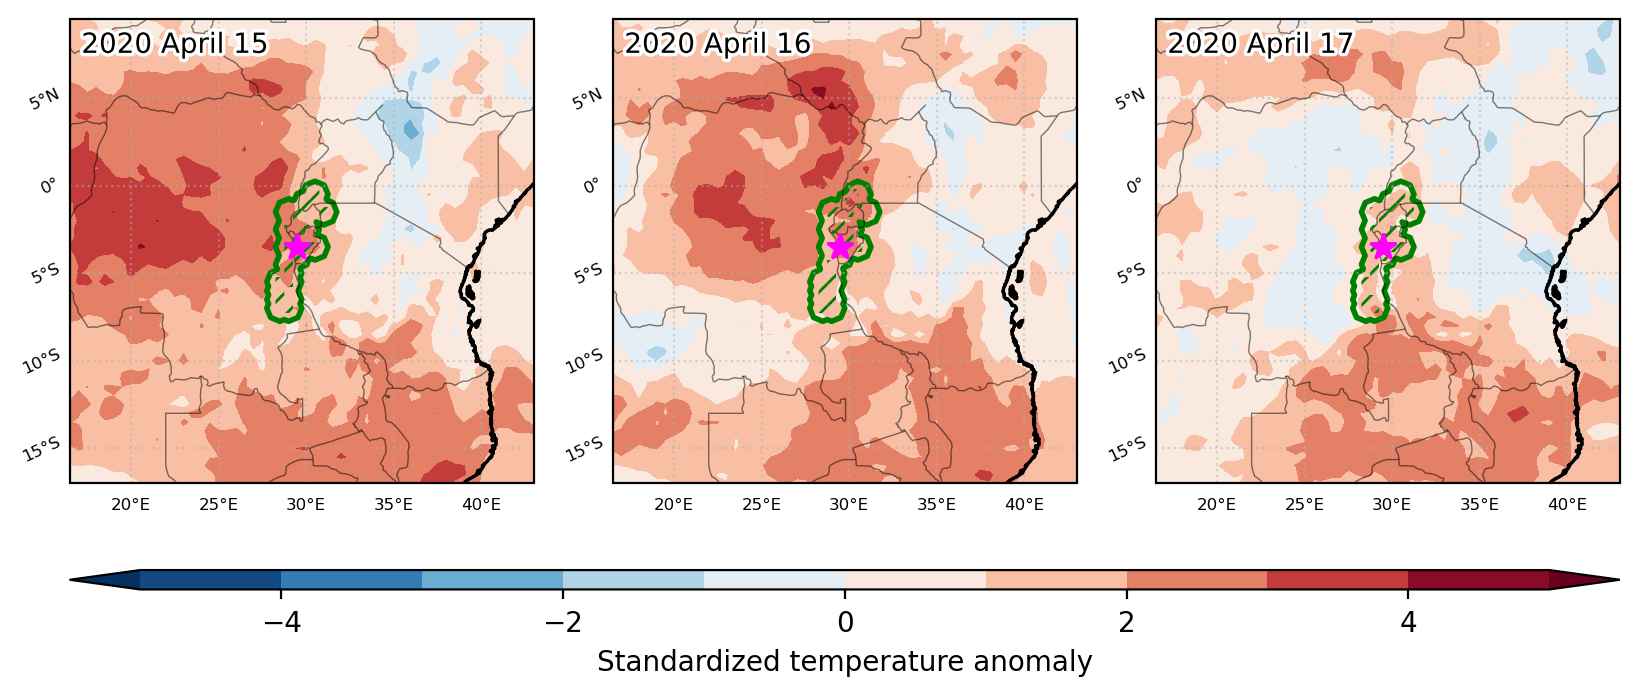
Fig. 3: Maps illustrating the evolution of standardized temperature anomalies during the event.

Event ID: Heat_wave_2020-Apr-15_to_2020-Apr-17_29.5_-3.5

Heat wave occuring from March 30 2020 to April 02 2020 at -10.0°S 36.5°E

Download data: JSON

Event type: Heat wave

Countries affected (identified with ArcGIS Online; provided only for geographical reference):

  • Mozambique
  • Tanzania, United Republic of

Duration: 4 days

Time span: March 30 2020 to April 02 2020

Statistics over entire affected area:

  • Mean temperature anomaly: 1.4 °C
  • Mean temperature: 23.6 °C
  • Maximum temperature anomaly: 2.4 °C
  • Maximum temperature: 26.2 °C

Event center: -10.0°S 36.5°E

Area affected: 79132 km$^2$


Fig. 1: Map of most extreme temperature anomalies (standardized) experienced during the event. The purple star indicates the center of the extreme event. Green hatching illustrates all areas under the effect of extremes at some time during the event.


Fig. 2: Evolution of temperature at the center of the event. The climatological percentile distribution is illustrated with color shadings.


Fig. 3: Maps illustrating the evolution of standardized temperature anomalies during the event.

Event ID: Heat_wave_2020-Mar-30_to_2020-Apr-02_36.5_-10.0

Heat wave occuring from March 16 2020 to March 28 2020 at -12.5°S 43.5°E

Download data: JSON

Event type: Heat wave

Countries affected (identified with ArcGIS Online; provided only for geographical reference):

  • Tanzania, United Republic of

Duration: 13 days

Time span: March 16 2020 to March 28 2020

Statistics over entire affected area:

  • Mean temperature anomaly: 1.2 °C
  • Mean temperature: 28.4 °C
  • Maximum temperature anomaly: 1.7 °C
  • Maximum temperature: 29.1 °C

Event center: -12.5°S 43.5°E

Area affected: 173106 km$^2$


Fig. 1: Map of most extreme temperature anomalies (standardized) experienced during the event. The purple star indicates the center of the extreme event. Green hatching illustrates all areas under the effect of extremes at some time during the event.


Fig. 2: Evolution of temperature at the center of the event. The climatological percentile distribution is illustrated with color shadings.


Fig. 3: Maps illustrating the evolution of standardized temperature anomalies during the event.

Event ID: Heat_wave_2020-Mar-16_to_2020-Mar-28_43.5_-12.5

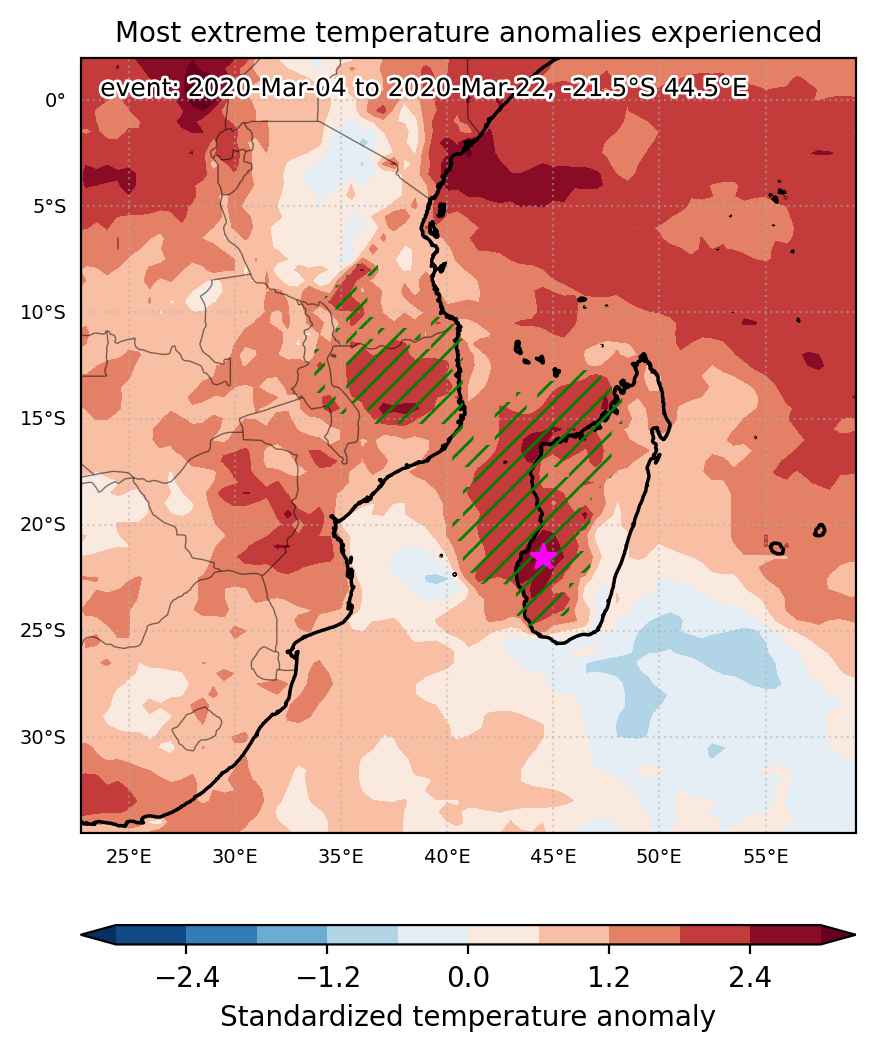
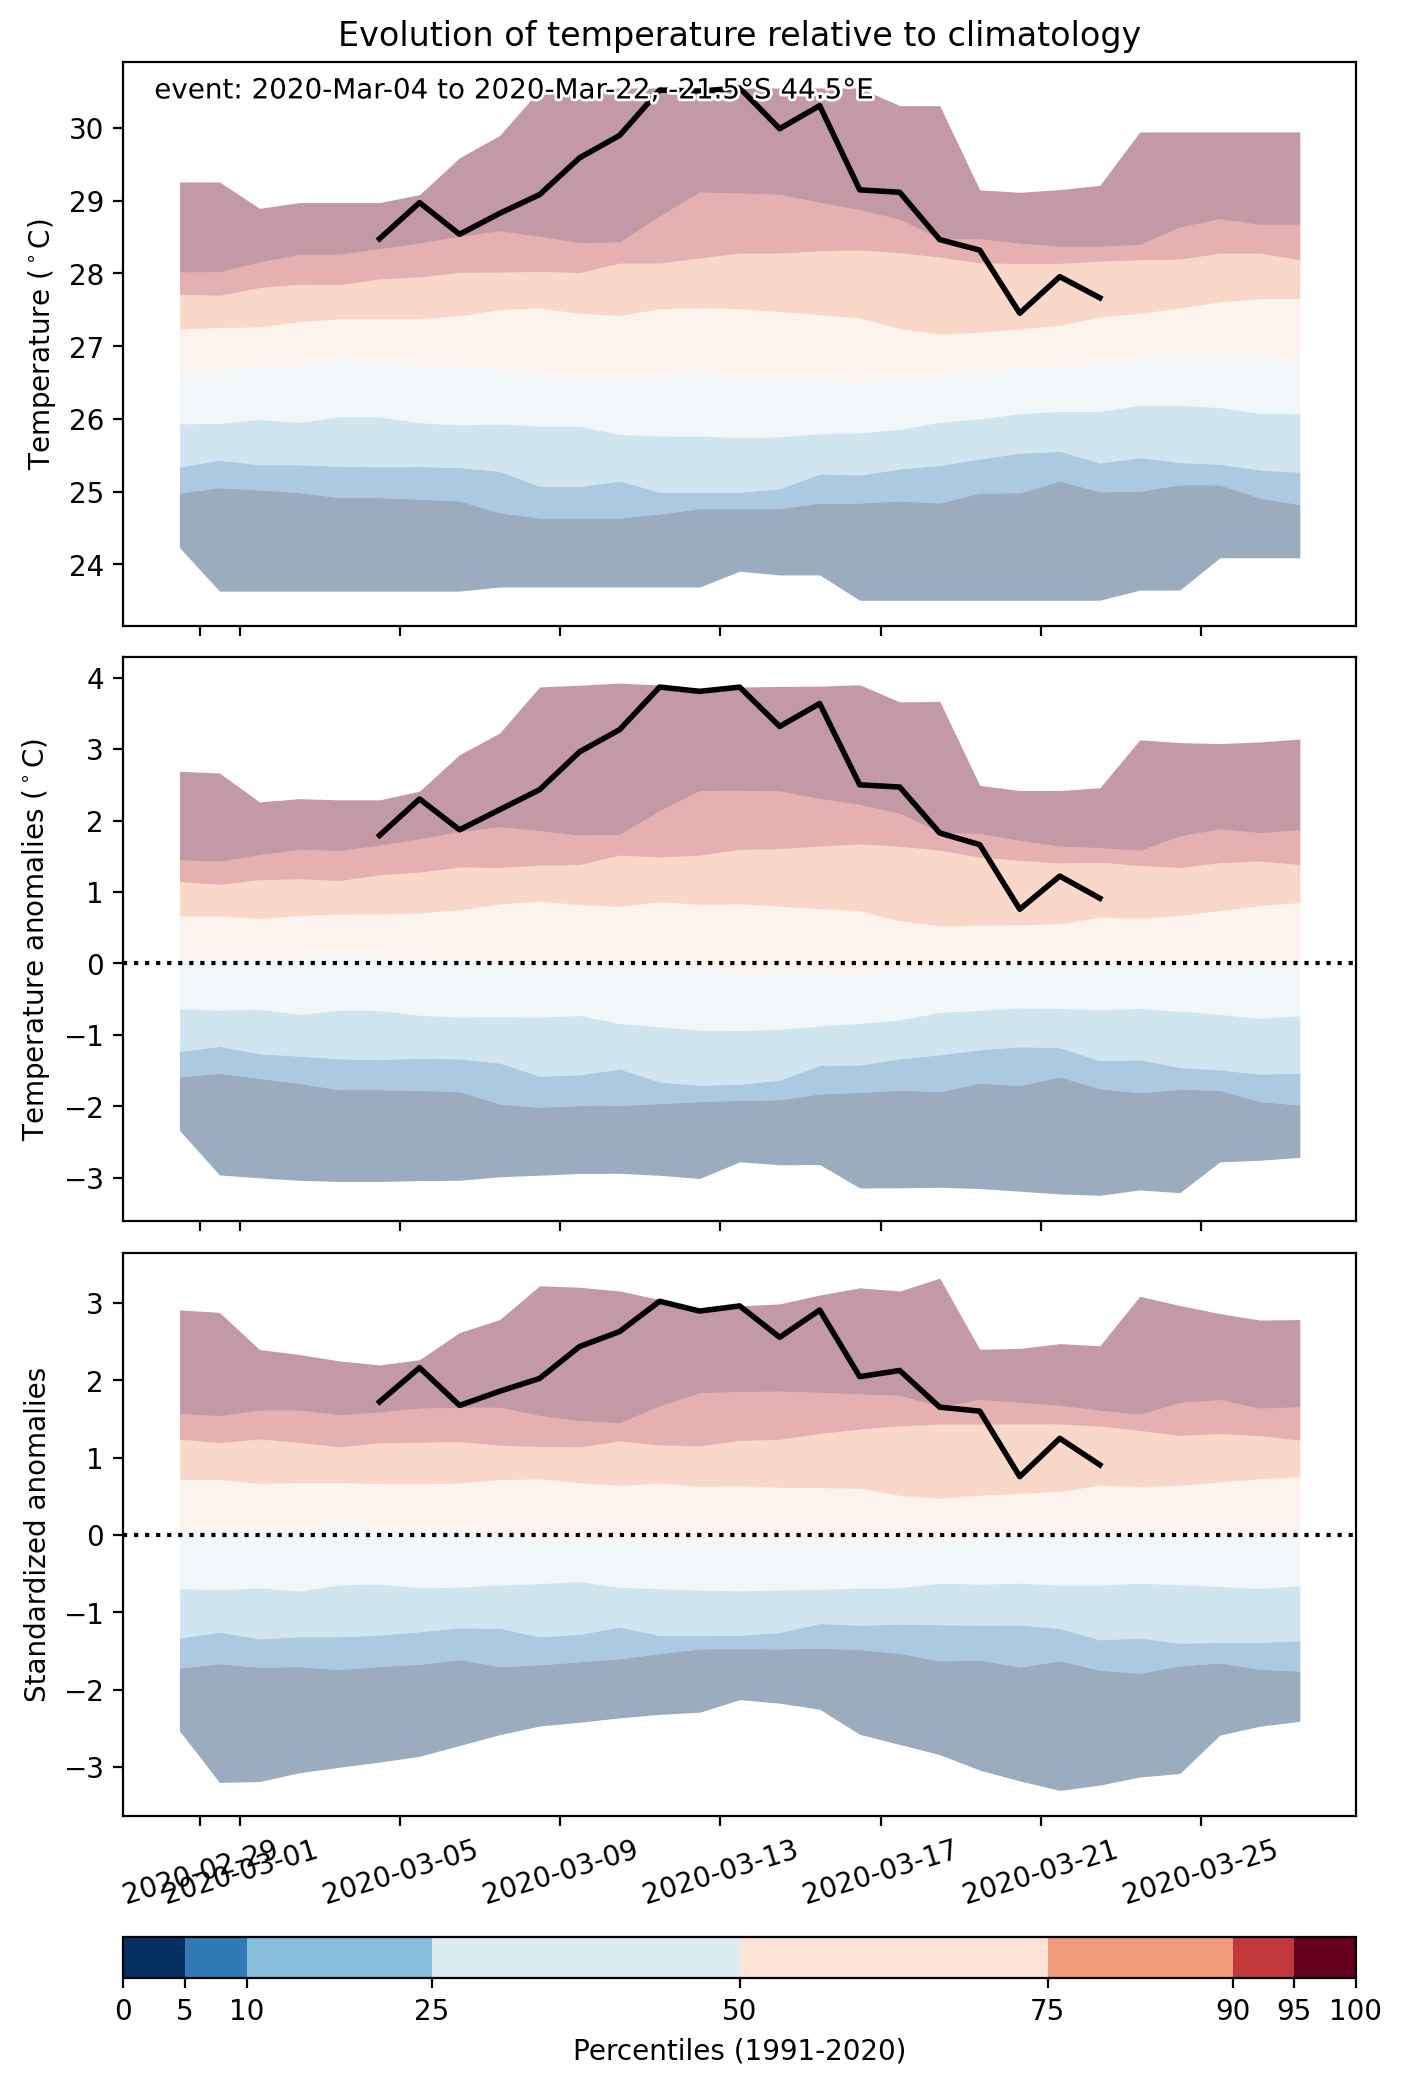
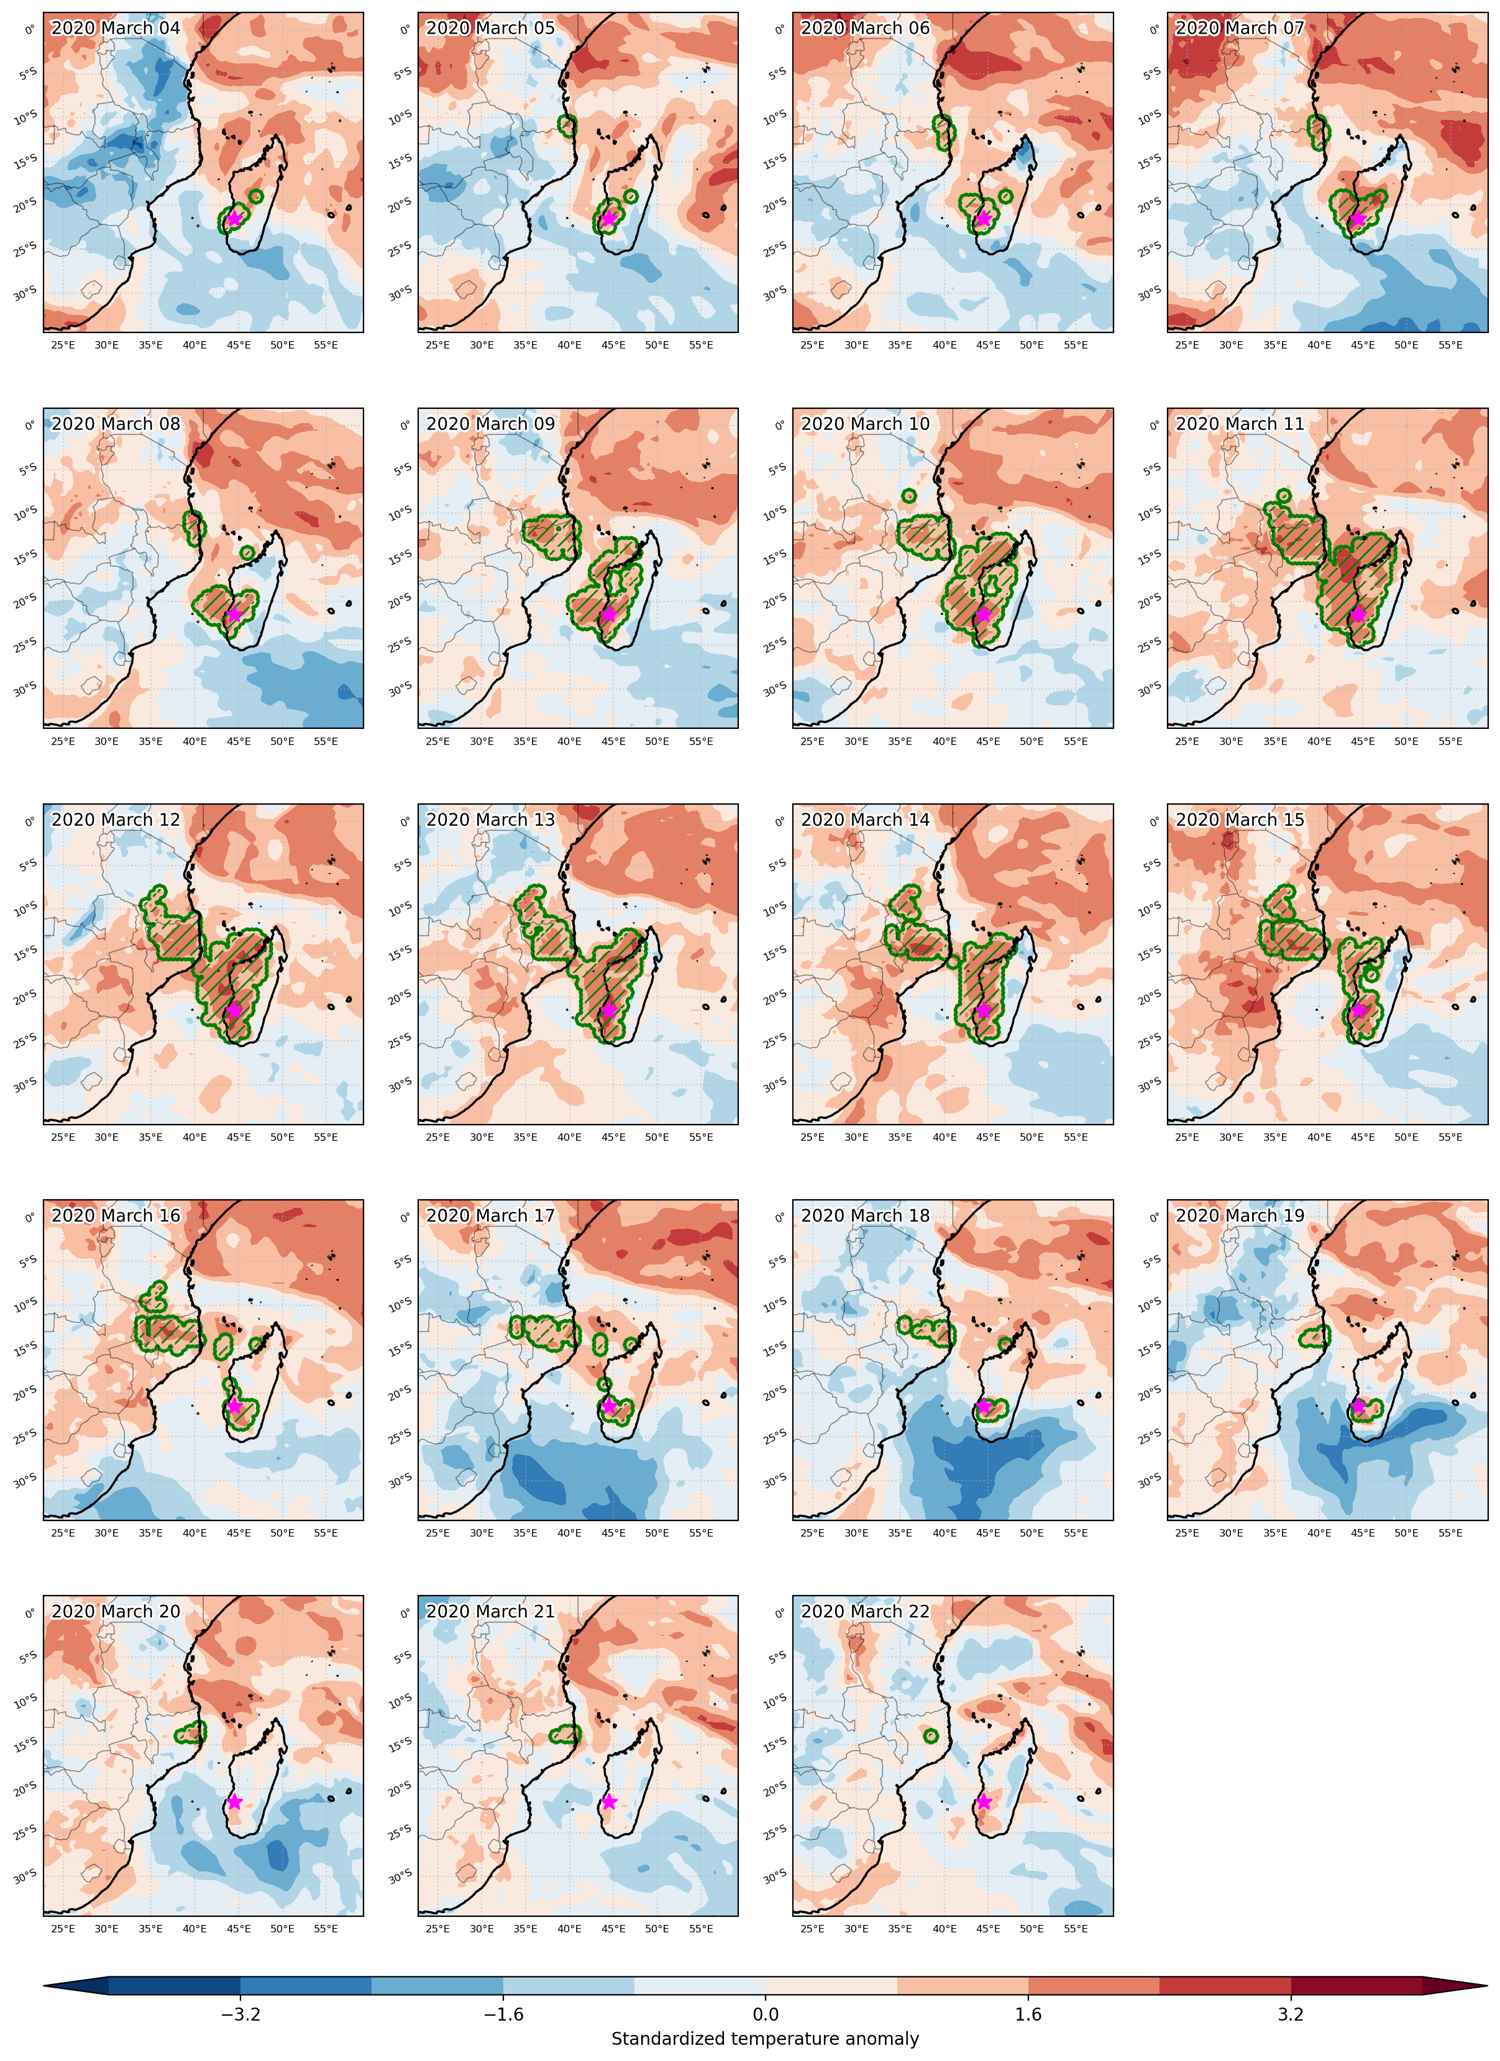
Heat wave occuring from March 04 2020 to March 22 2020 at -21.5°S 44.5°E

Download data: JSON

Event type: Heat wave

Countries affected (identified with ArcGIS Online; provided only for geographical reference):

  • Madagascar
  • Malawi
  • Mozambique
  • Tanzania, United Republic of

Duration: 19 days

Time span: March 04 2020 to March 22 2020

Statistics over entire affected area:

  • Mean temperature anomaly: 1.6 °C
  • Mean temperature: 27.7 °C
  • Maximum temperature anomaly: 4.7 °C
  • Maximum temperature: 32.2 °C

Event center: -21.5°S 44.5°E

Area affected: 1049631 km$^2$


Fig. 1: Map of most extreme temperature anomalies (standardized) experienced during the event. The purple star indicates the center of the extreme event. Green hatching illustrates all areas under the effect of extremes at some time during the event.


Fig. 2: Evolution of temperature at the center of the event. The climatological percentile distribution is illustrated with color shadings.


Fig. 3: Maps illustrating the evolution of standardized temperature anomalies during the event.

Event ID: Heat_wave_2020-Mar-04_to_2020-Mar-22_44.5_-21.5

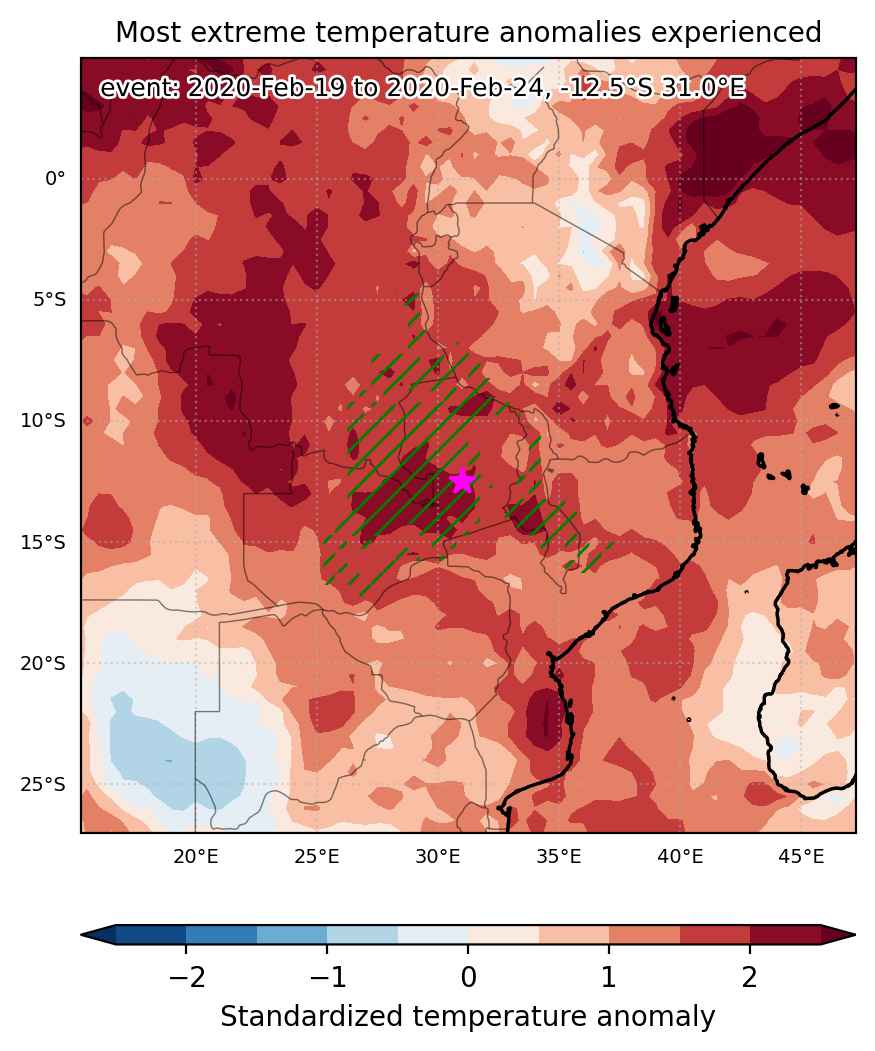
Heat wave occuring from February 19 2020 to February 24 2020 at -12.5°S 31.0°E

Download data: JSON

Event type: Heat wave

Countries affected (identified with ArcGIS Online; provided only for geographical reference):

  • Congo, The Democratic Republic of the
  • Malawi
  • Mozambique
  • Tanzania, United Republic of
  • Zambia

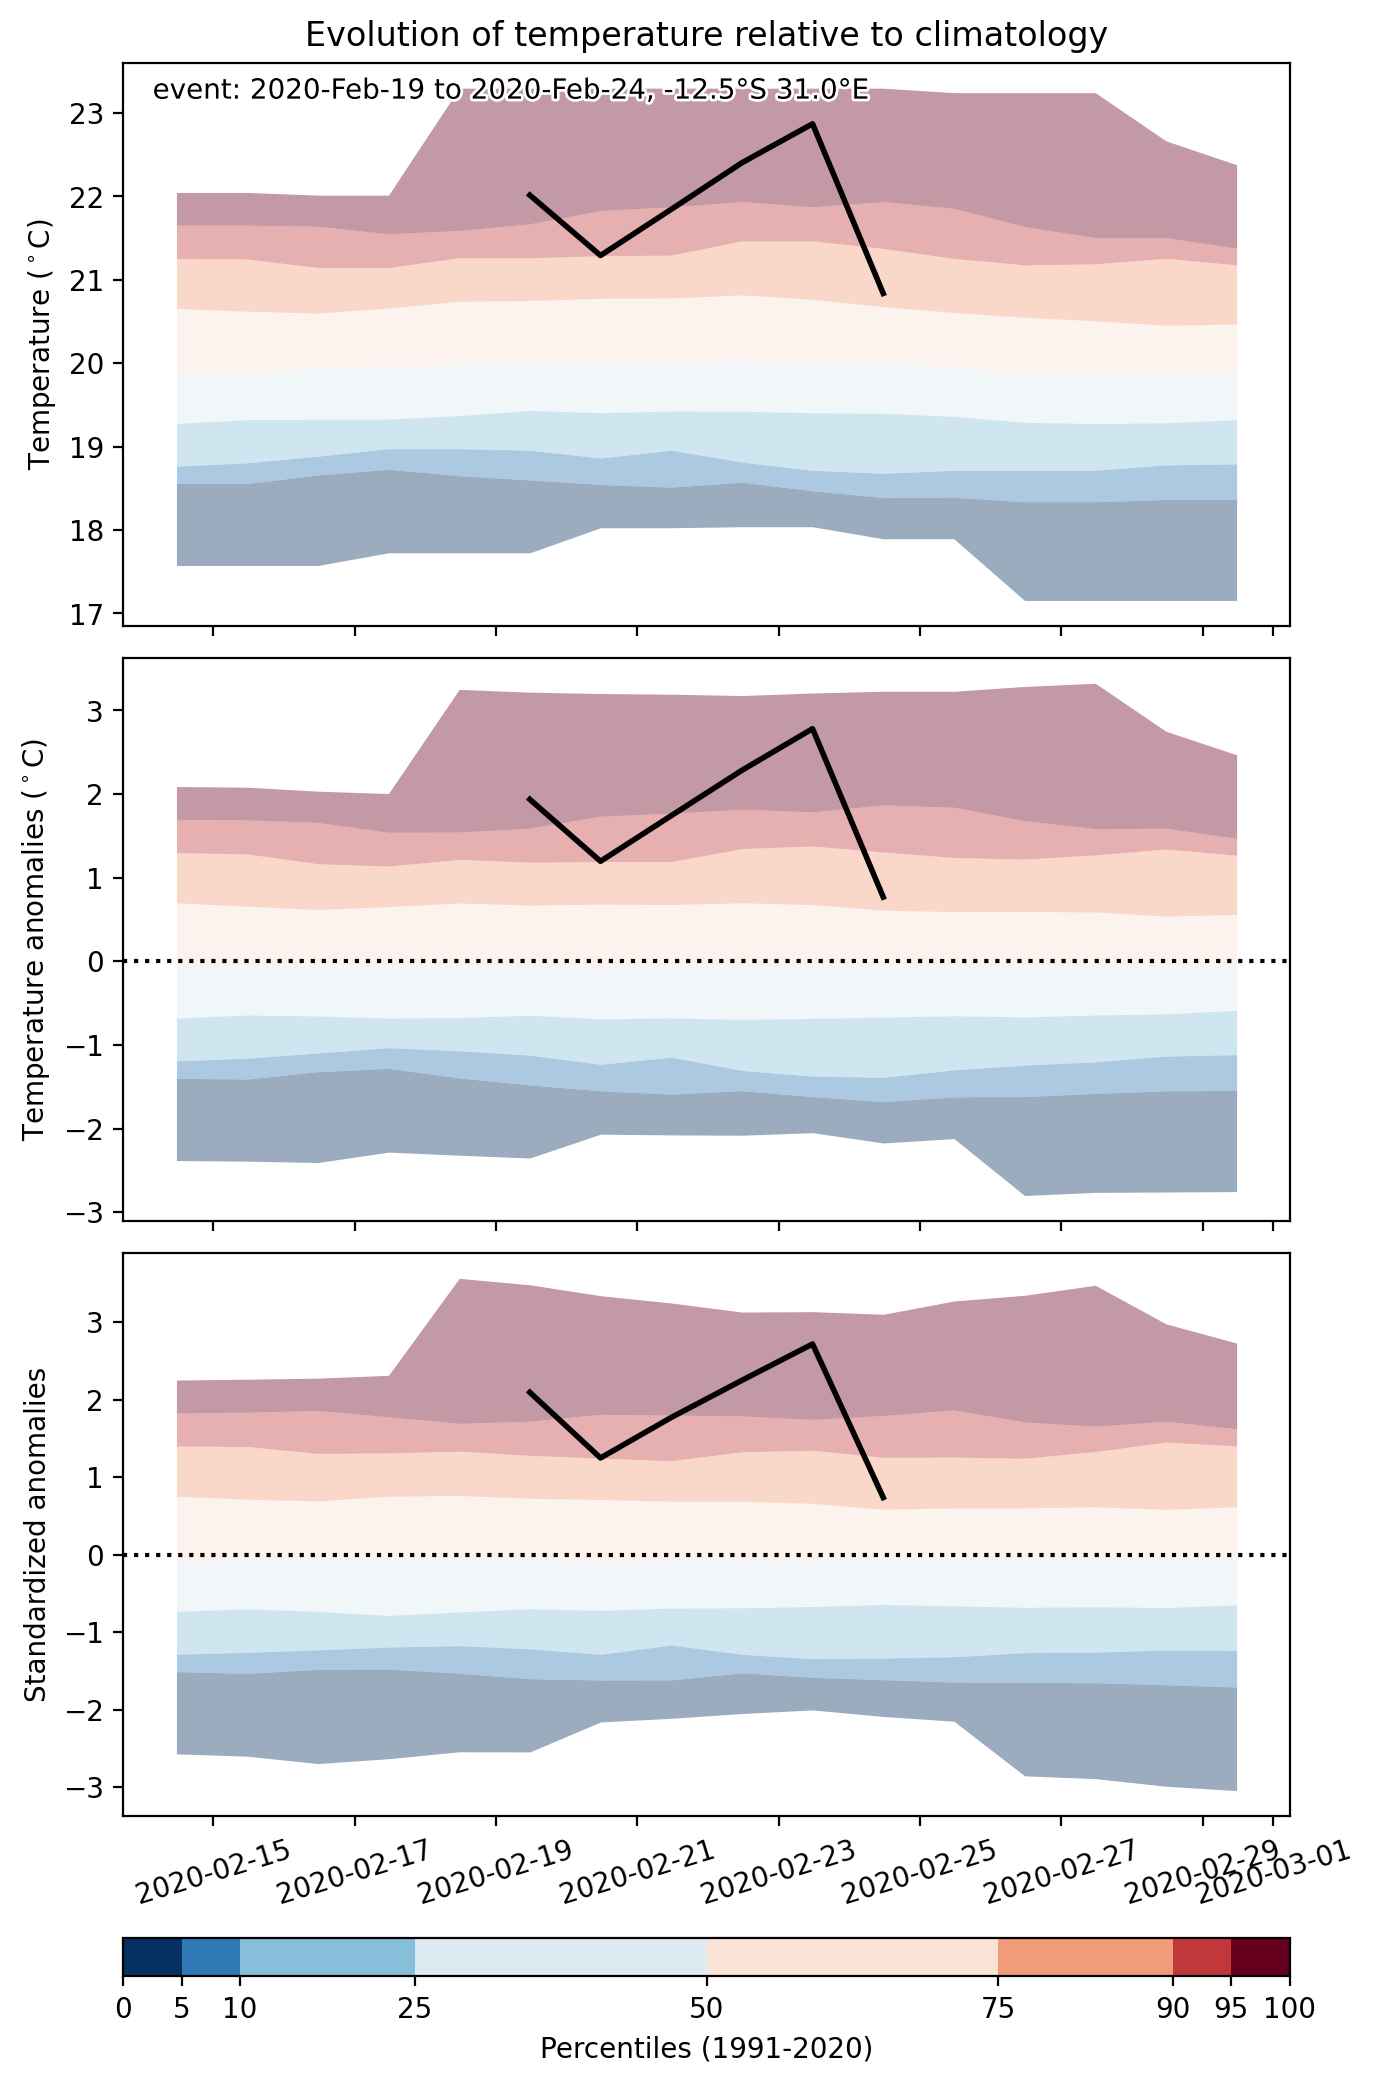
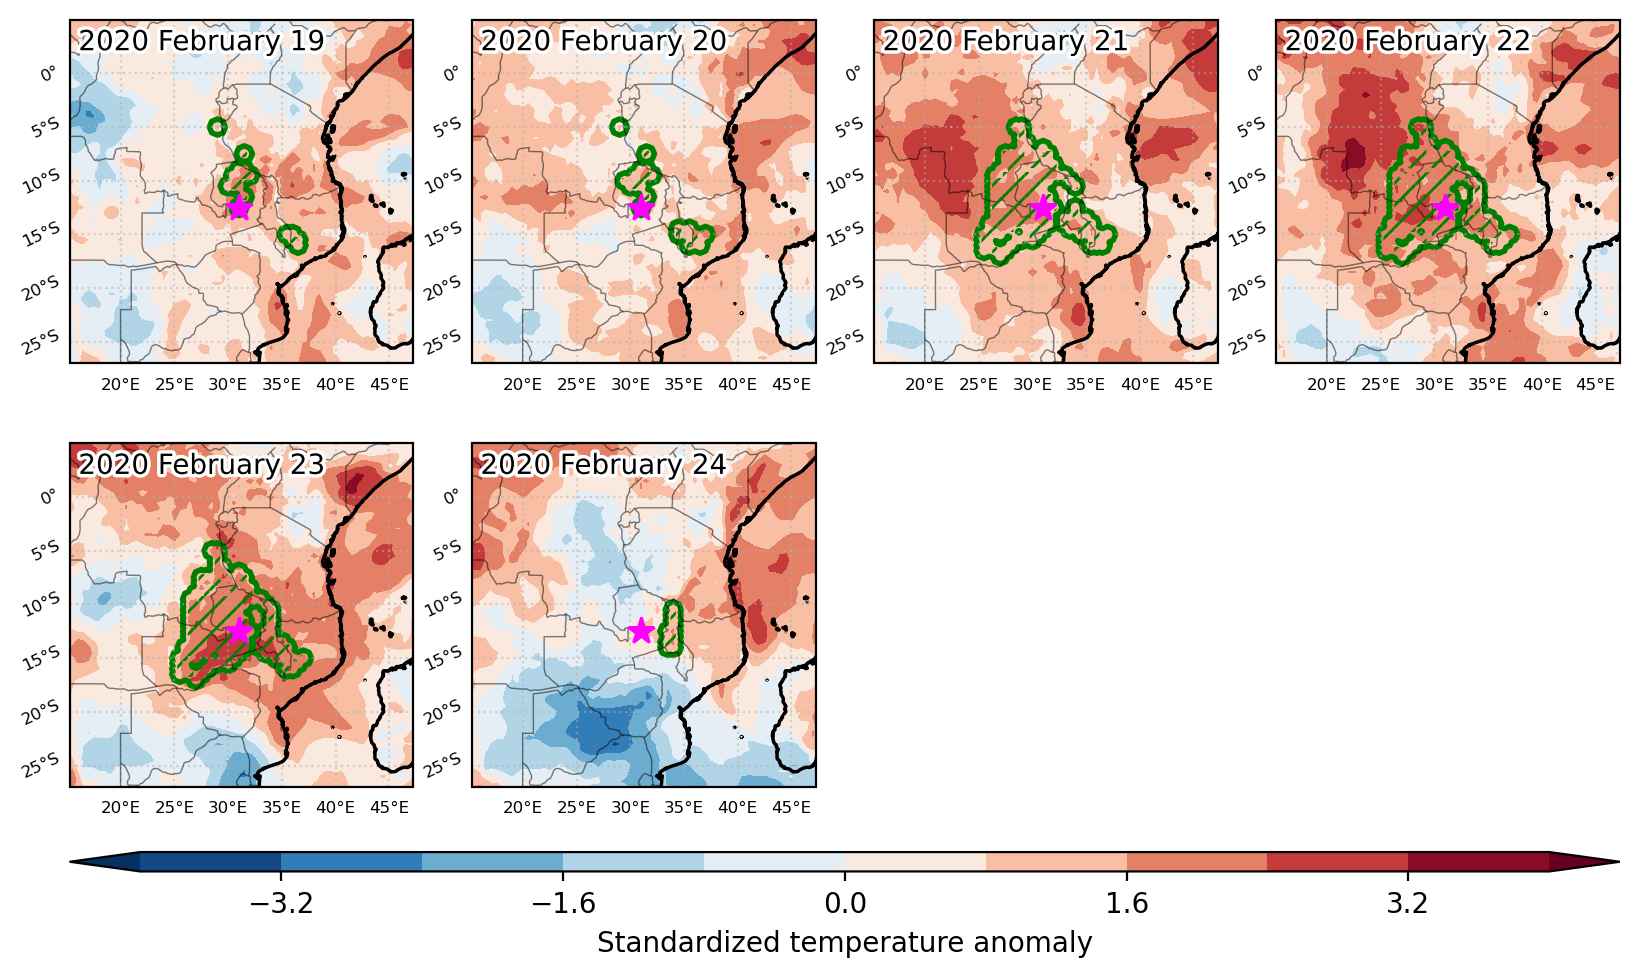
Duration: 6 days

Time span: February 19 2020 to February 24 2020

Statistics over entire affected area:

  • Mean temperature anomaly: 2.0 °C
  • Mean temperature: 23.9 °C
  • Maximum temperature anomaly: 3.6 °C
  • Maximum temperature: 29.4 °C

Event center: -12.5°S 31.0°E

Area affected: 622675 km$^2$


Fig. 1: Map of most extreme temperature anomalies (standardized) experienced during the event. The purple star indicates the center of the extreme event. Green hatching illustrates all areas under the effect of extremes at some time during the event.


Fig. 2: Evolution of temperature at the center of the event. The climatological percentile distribution is illustrated with color shadings.


Fig. 3: Maps illustrating the evolution of standardized temperature anomalies during the event.

Event ID: Heat_wave_2020-Feb-19_to_2020-Feb-24_31.0_-12.5

Heat wave occuring from February 07 2020 to February 18 2020 at -1.0°S 27.5°E

Download data: JSON

Event type: Heat wave

Countries affected (identified with ArcGIS Online; provided only for geographical reference):

  • Burundi
  • Central African Republic
  • Congo, The Democratic Republic of the
  • Rwanda
  • Tanzania, United Republic of
  • Uganda
  • Zambia

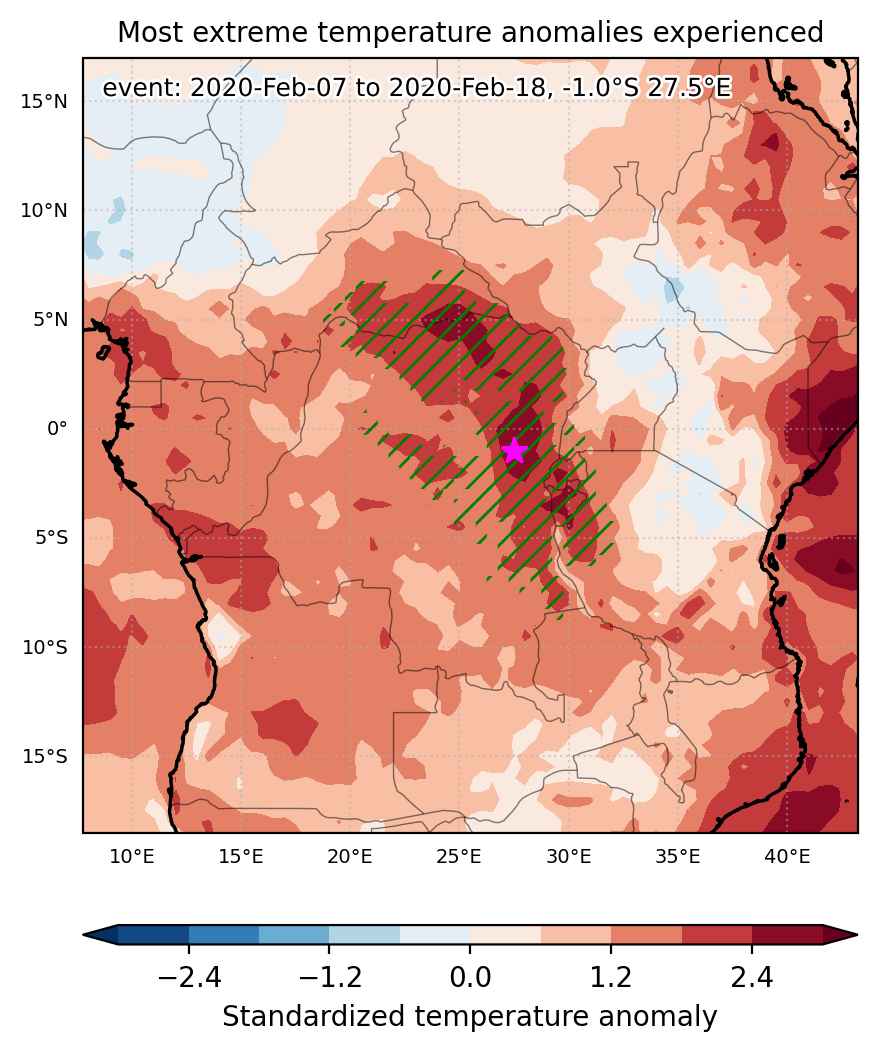
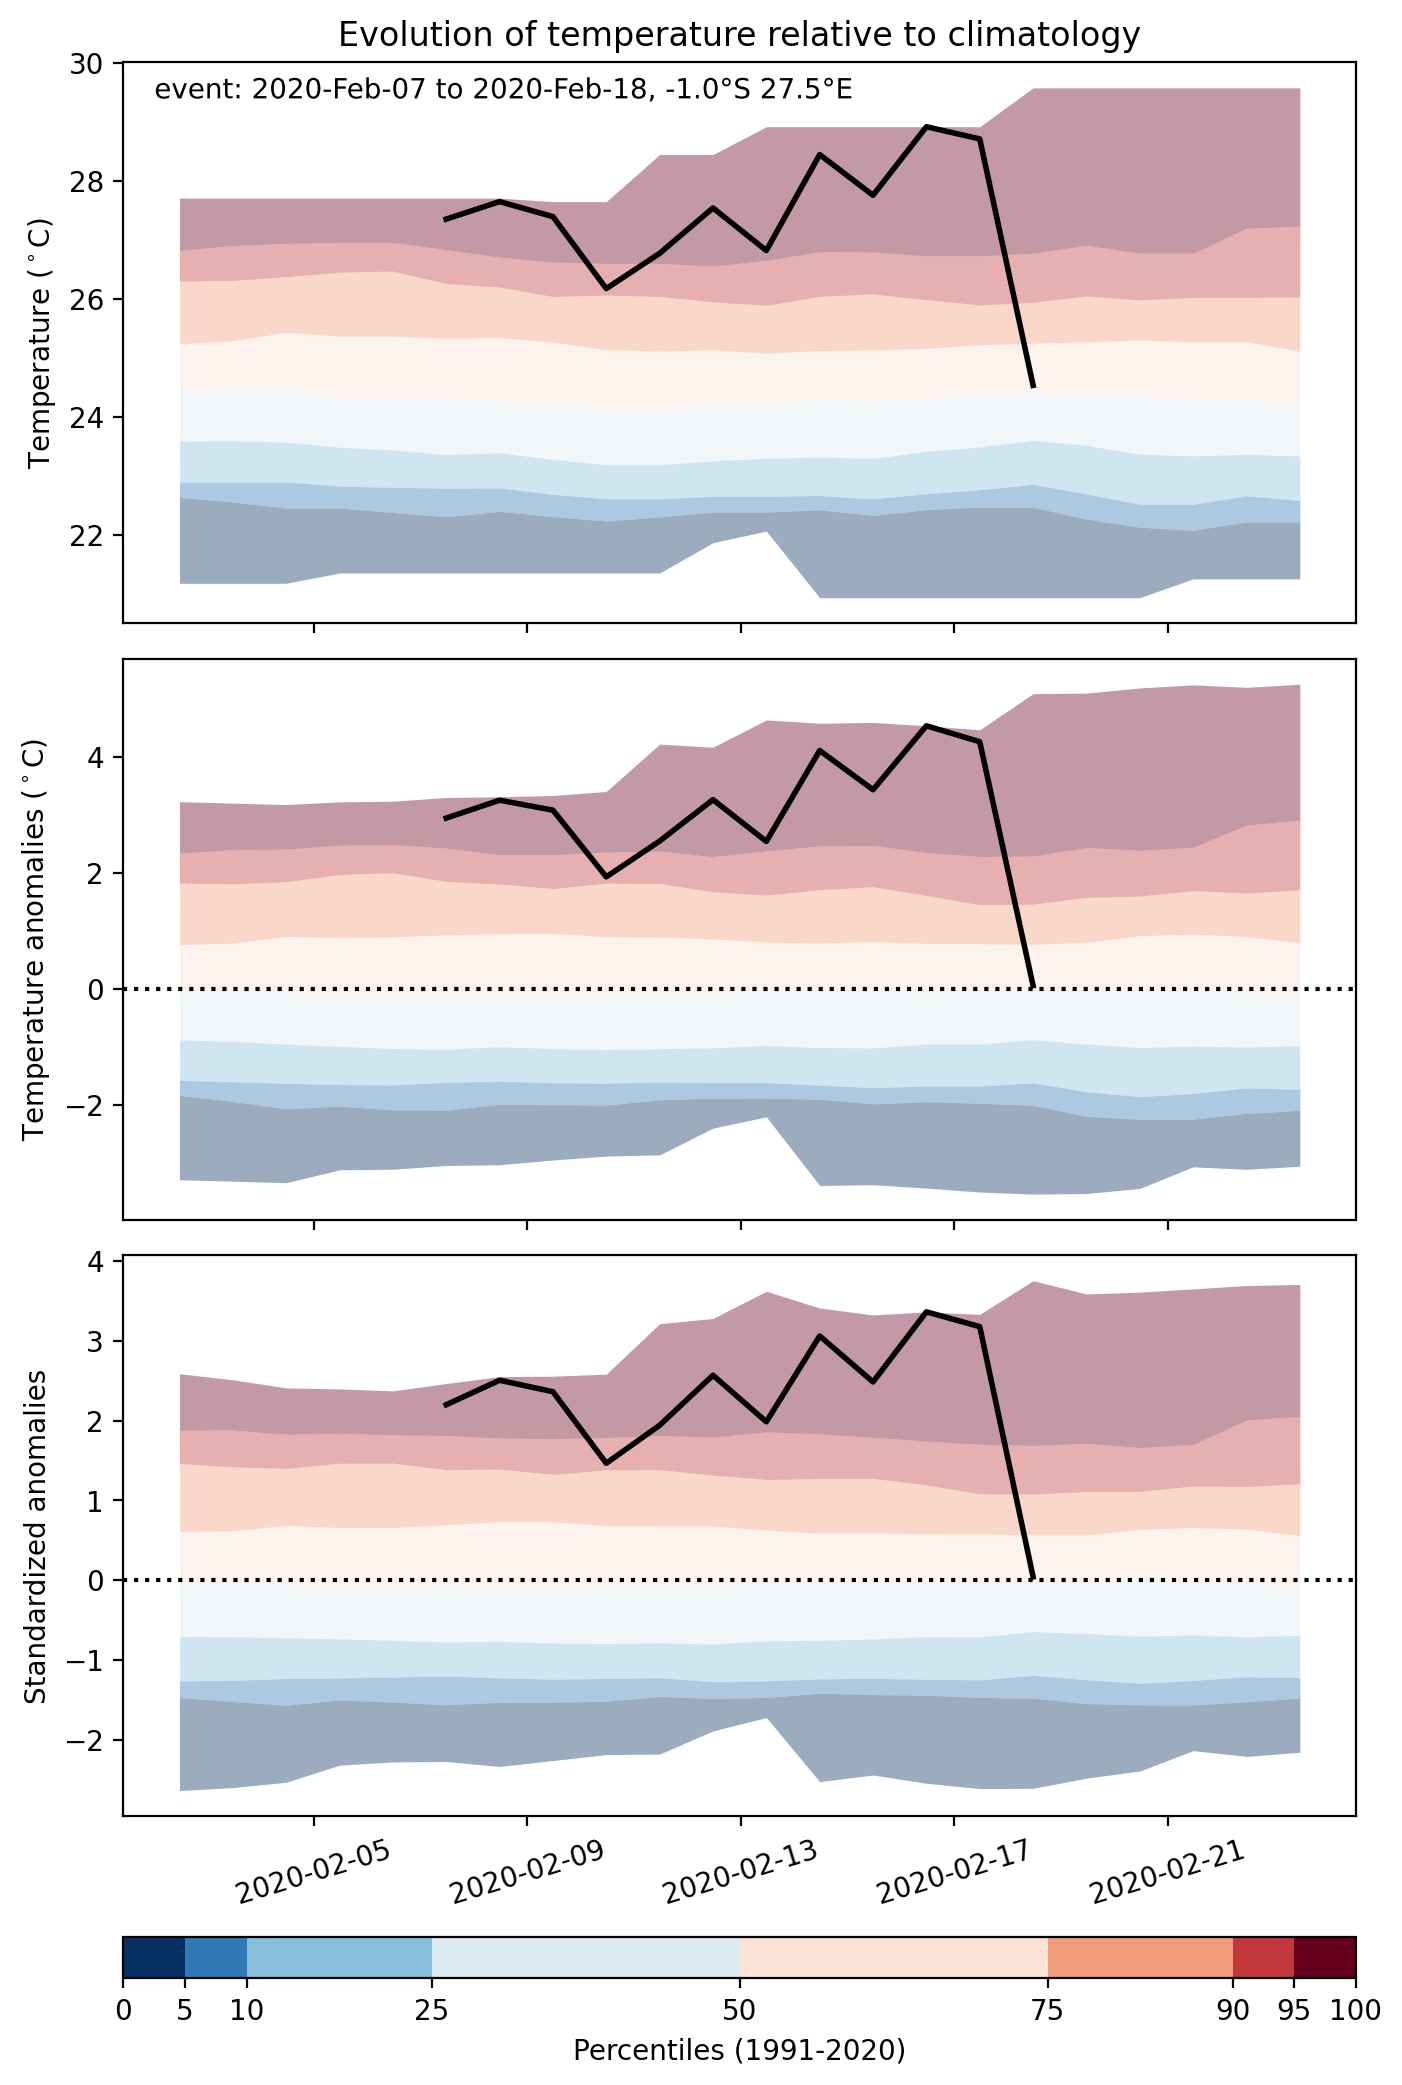
Duration: 12 days

Time span: February 07 2020 to February 18 2020

Statistics over entire affected area:

  • Mean temperature anomaly: 2.6 °C
  • Mean temperature: 26.9 °C
  • Maximum temperature anomaly: 5.2 °C
  • Maximum temperature: 33.0 °C

Event center: -1.0°S 27.5°E

Area affected: 1082435 km$^2$


Fig. 1: Map of most extreme temperature anomalies (standardized) experienced during the event. The purple star indicates the center of the extreme event. Green hatching illustrates all areas under the effect of extremes at some time during the event.


Fig. 2: Evolution of temperature at the center of the event. The climatological percentile distribution is illustrated with color shadings.


Fig. 3: Maps illustrating the evolution of standardized temperature anomalies during the event.

Event ID: Heat_wave_2020-Feb-07_to_2020-Feb-18_27.5_-1.0

Heat wave occuring from January 16 2020 to January 22 2020 at -8.0°S 36.0°E

Download data: JSON

Event type: Heat wave

Countries affected (identified with ArcGIS Online; provided only for geographical reference):

  • Malawi
  • Tanzania, United Republic of

Duration: 7 days

Time span: January 16 2020 to January 22 2020

Statistics over entire affected area:

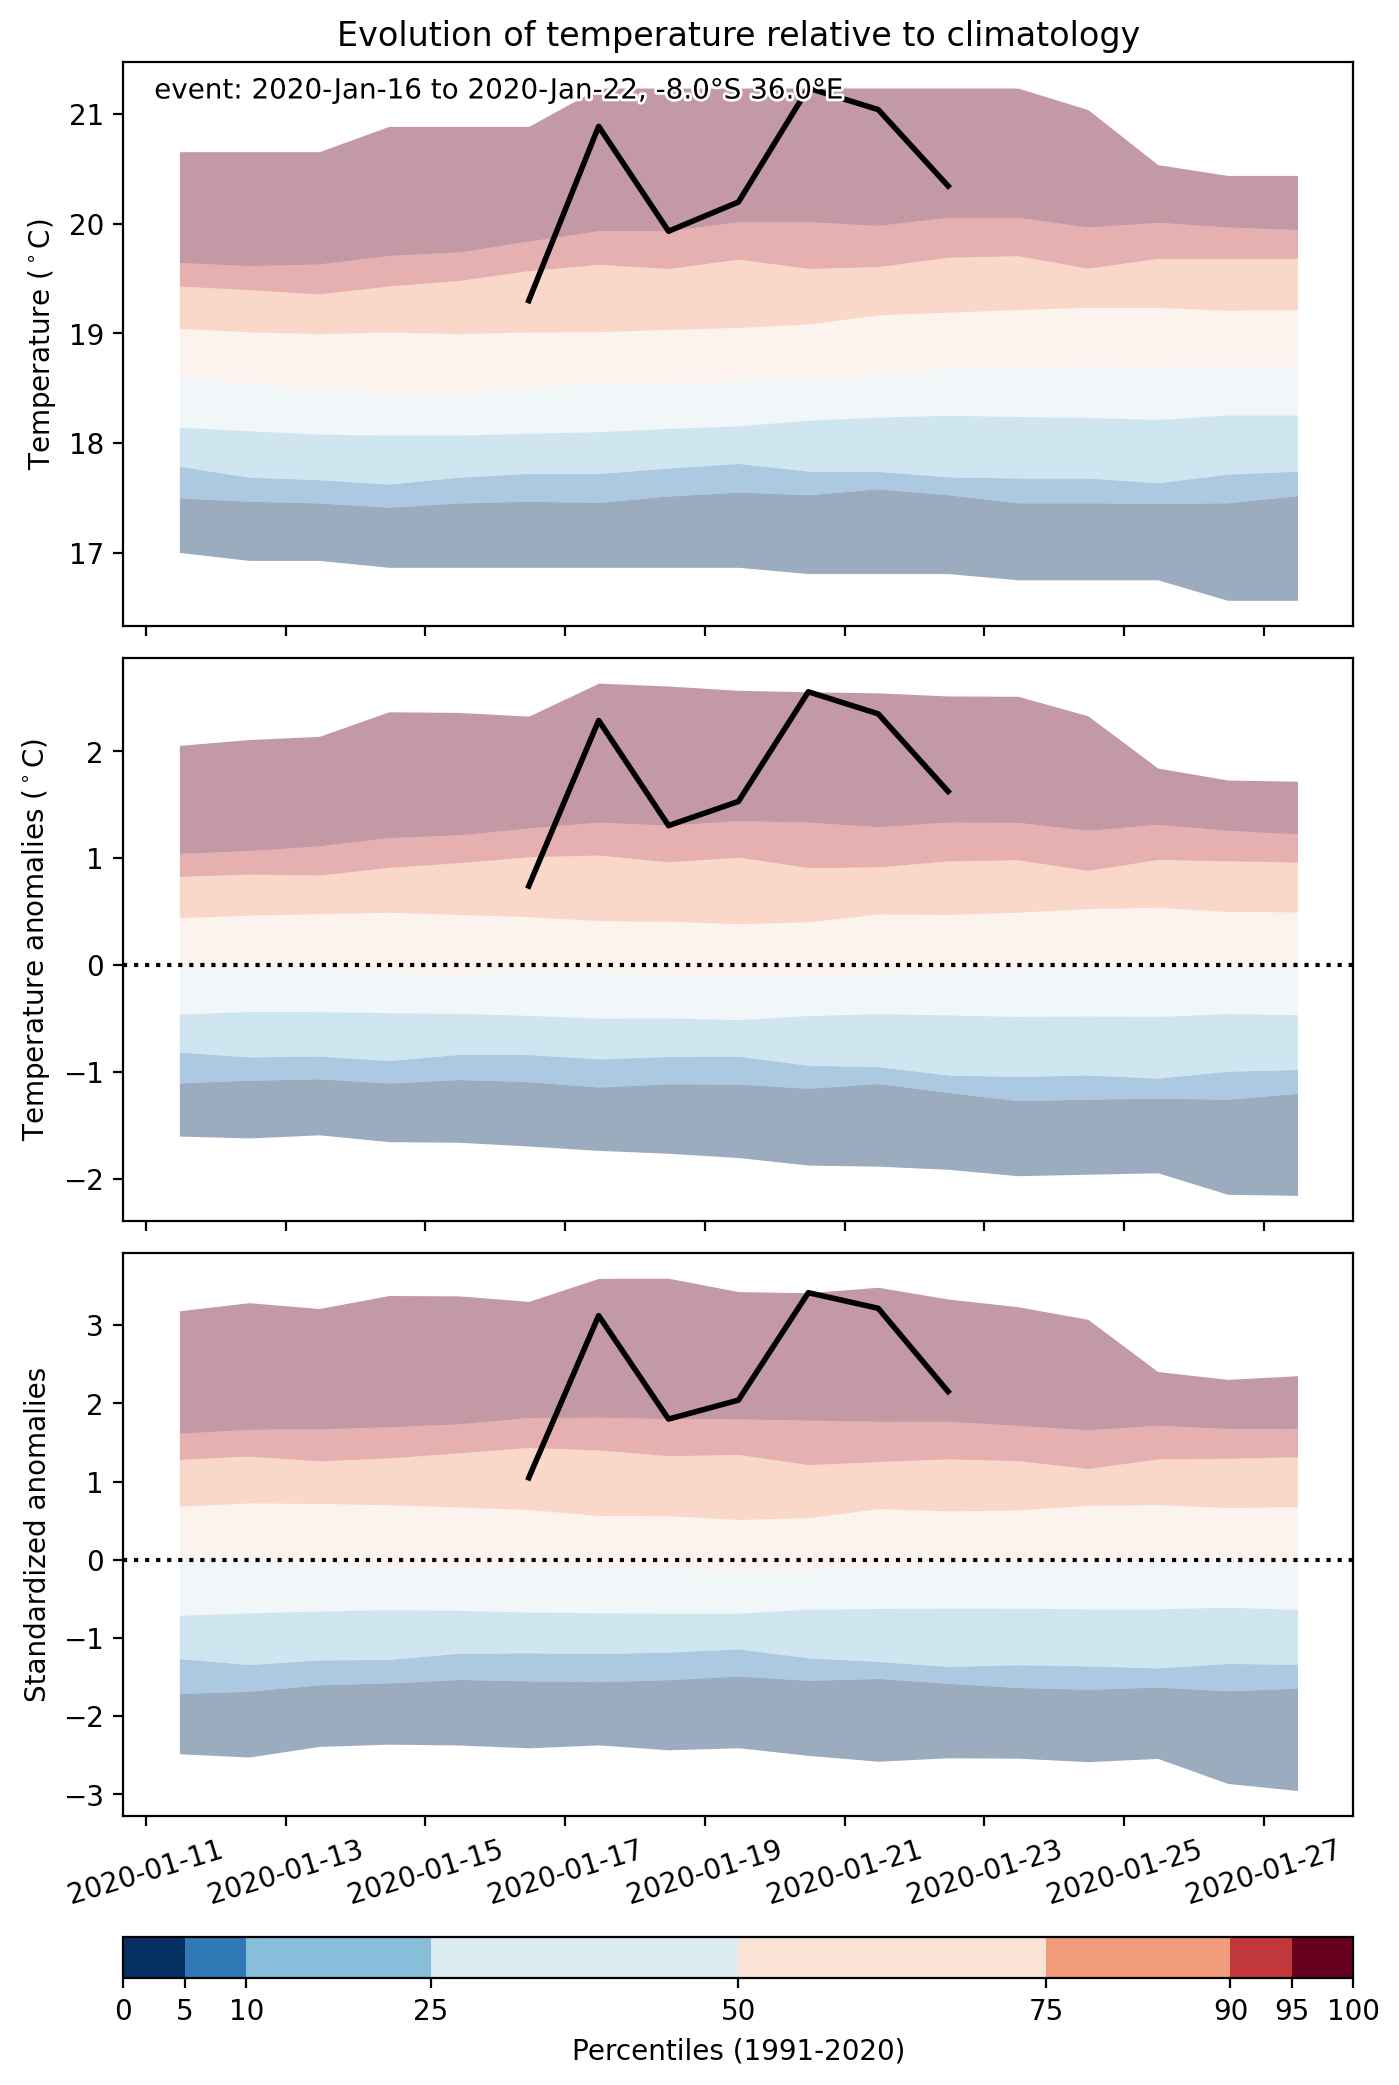
  • Mean temperature anomaly: 2.0 °C
  • Mean temperature: 23.5 °C
  • Maximum temperature anomaly: 3.7 °C
  • Maximum temperature: 29.4 °C

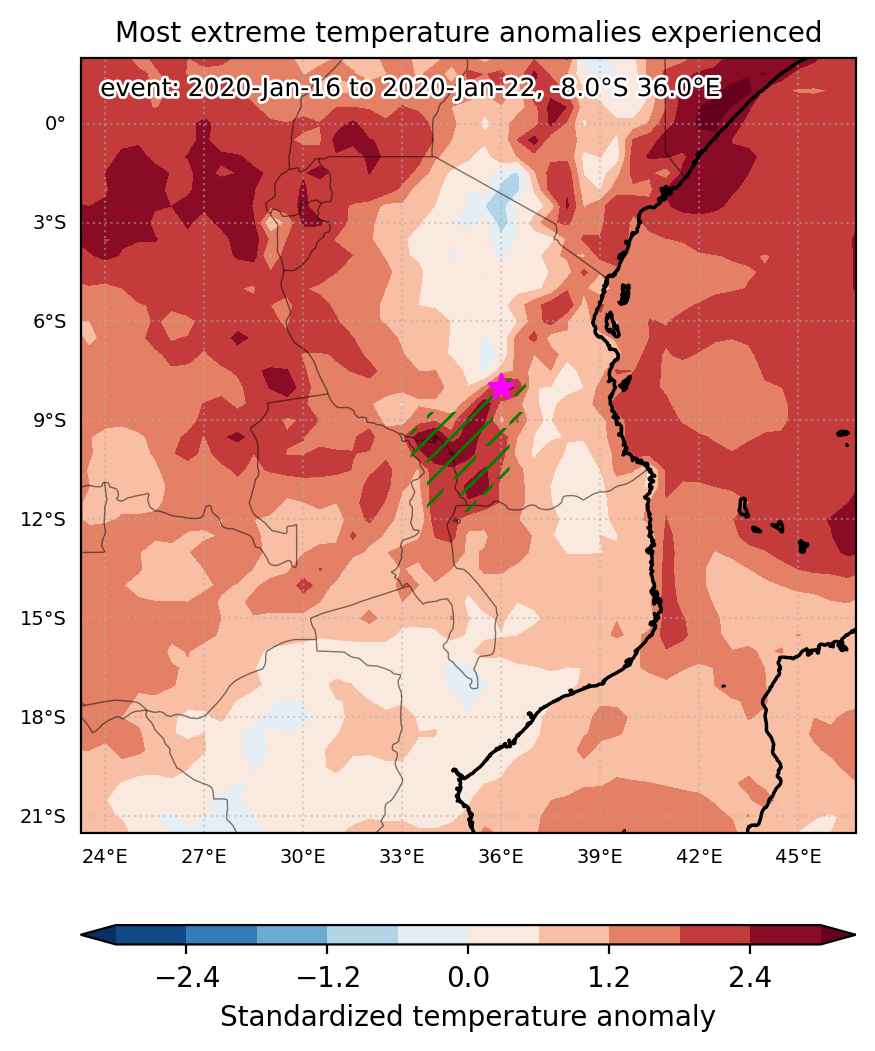
Event center: -8.0°S 36.0°E

Area affected: 88314 km$^2$


Fig. 1: Map of most extreme temperature anomalies (standardized) experienced during the event. The purple star indicates the center of the extreme event. Green hatching illustrates all areas under the effect of extremes at some time during the event.


Fig. 2: Evolution of temperature at the center of the event. The climatological percentile distribution is illustrated with color shadings.


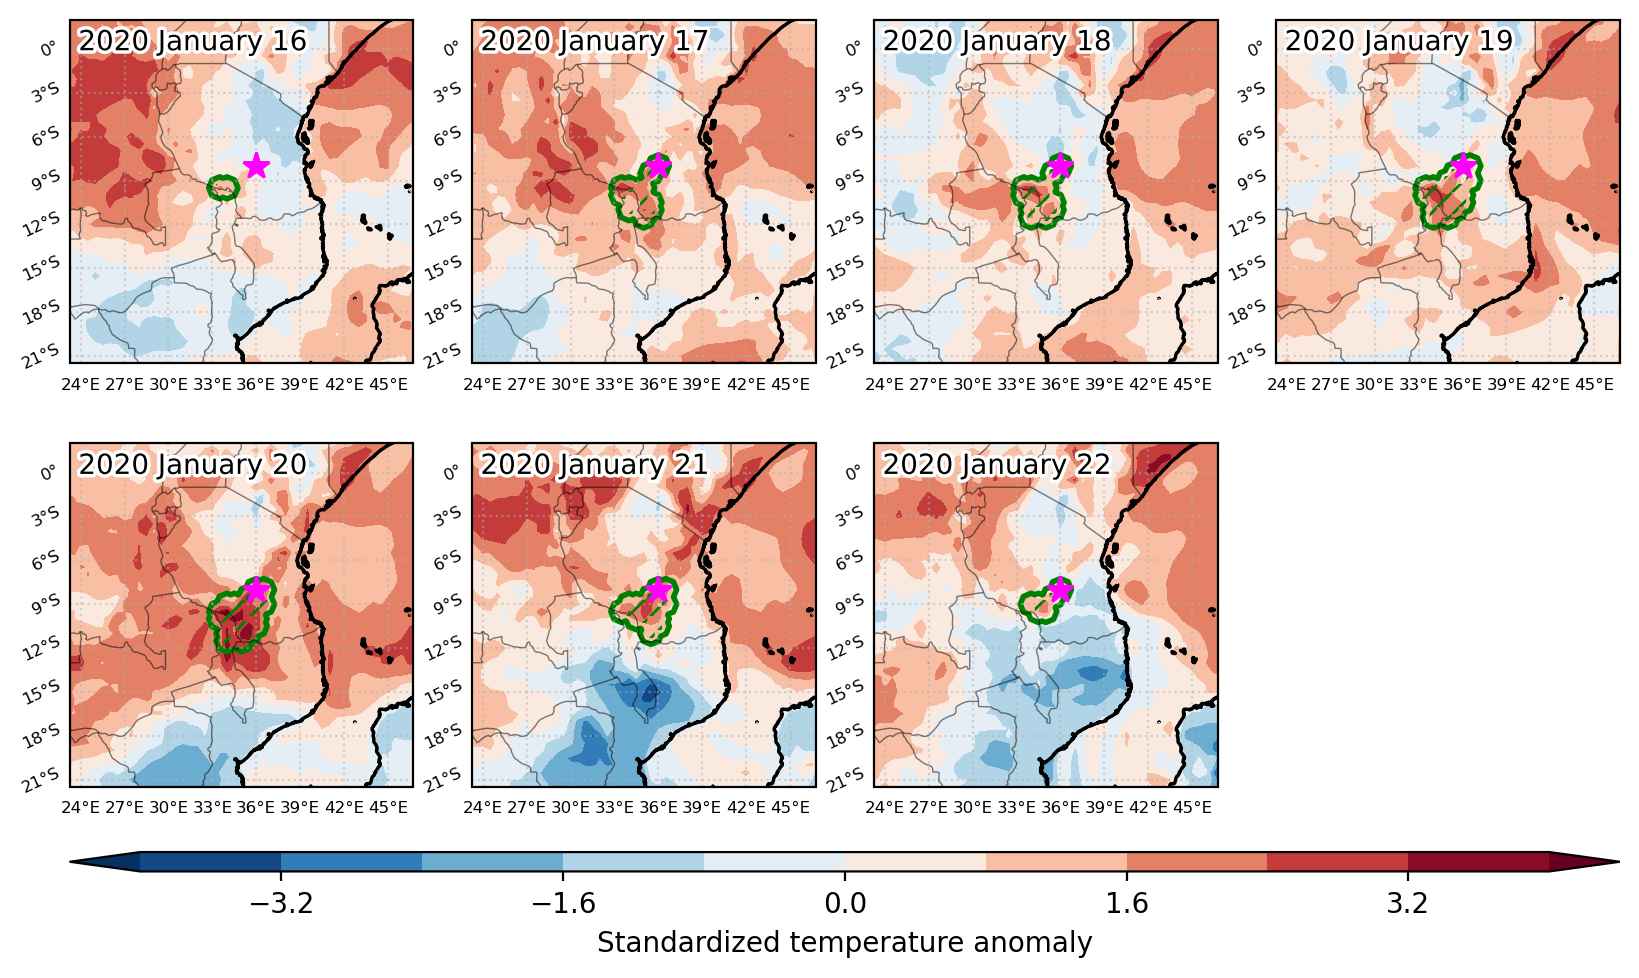
Fig. 3: Maps illustrating the evolution of standardized temperature anomalies during the event.

Event ID: Heat_wave_2020-Jan-16_to_2020-Jan-22_36.0_-8.0

Heat wave occuring from January 14 2020 to January 24 2020 at -0.5°S 37.0°E

Download data: JSON

Event type: Heat wave

Countries affected (identified with ArcGIS Online; provided only for geographical reference):

  • Kenya
  • Tanzania, United Republic of
  • Uganda

Duration: 11 days

Time span: January 14 2020 to January 24 2020

Statistics over entire affected area:

  • Mean temperature anomaly: 1.5 °C
  • Mean temperature: 25.5 °C
  • Maximum temperature anomaly: 2.9 °C
  • Maximum temperature: 32.5 °C

Event center: -0.5°S 37.0°E

Area affected: 138986 km$^2$


Fig. 1: Map of most extreme temperature anomalies (standardized) experienced during the event. The purple star indicates the center of the extreme event. Green hatching illustrates all areas under the effect of extremes at some time during the event.


Fig. 2: Evolution of temperature at the center of the event. The climatological percentile distribution is illustrated with color shadings.


Fig. 3: Maps illustrating the evolution of standardized temperature anomalies during the event.

Event ID: Heat_wave_2020-Jan-14_to_2020-Jan-24_37.0_-0.5