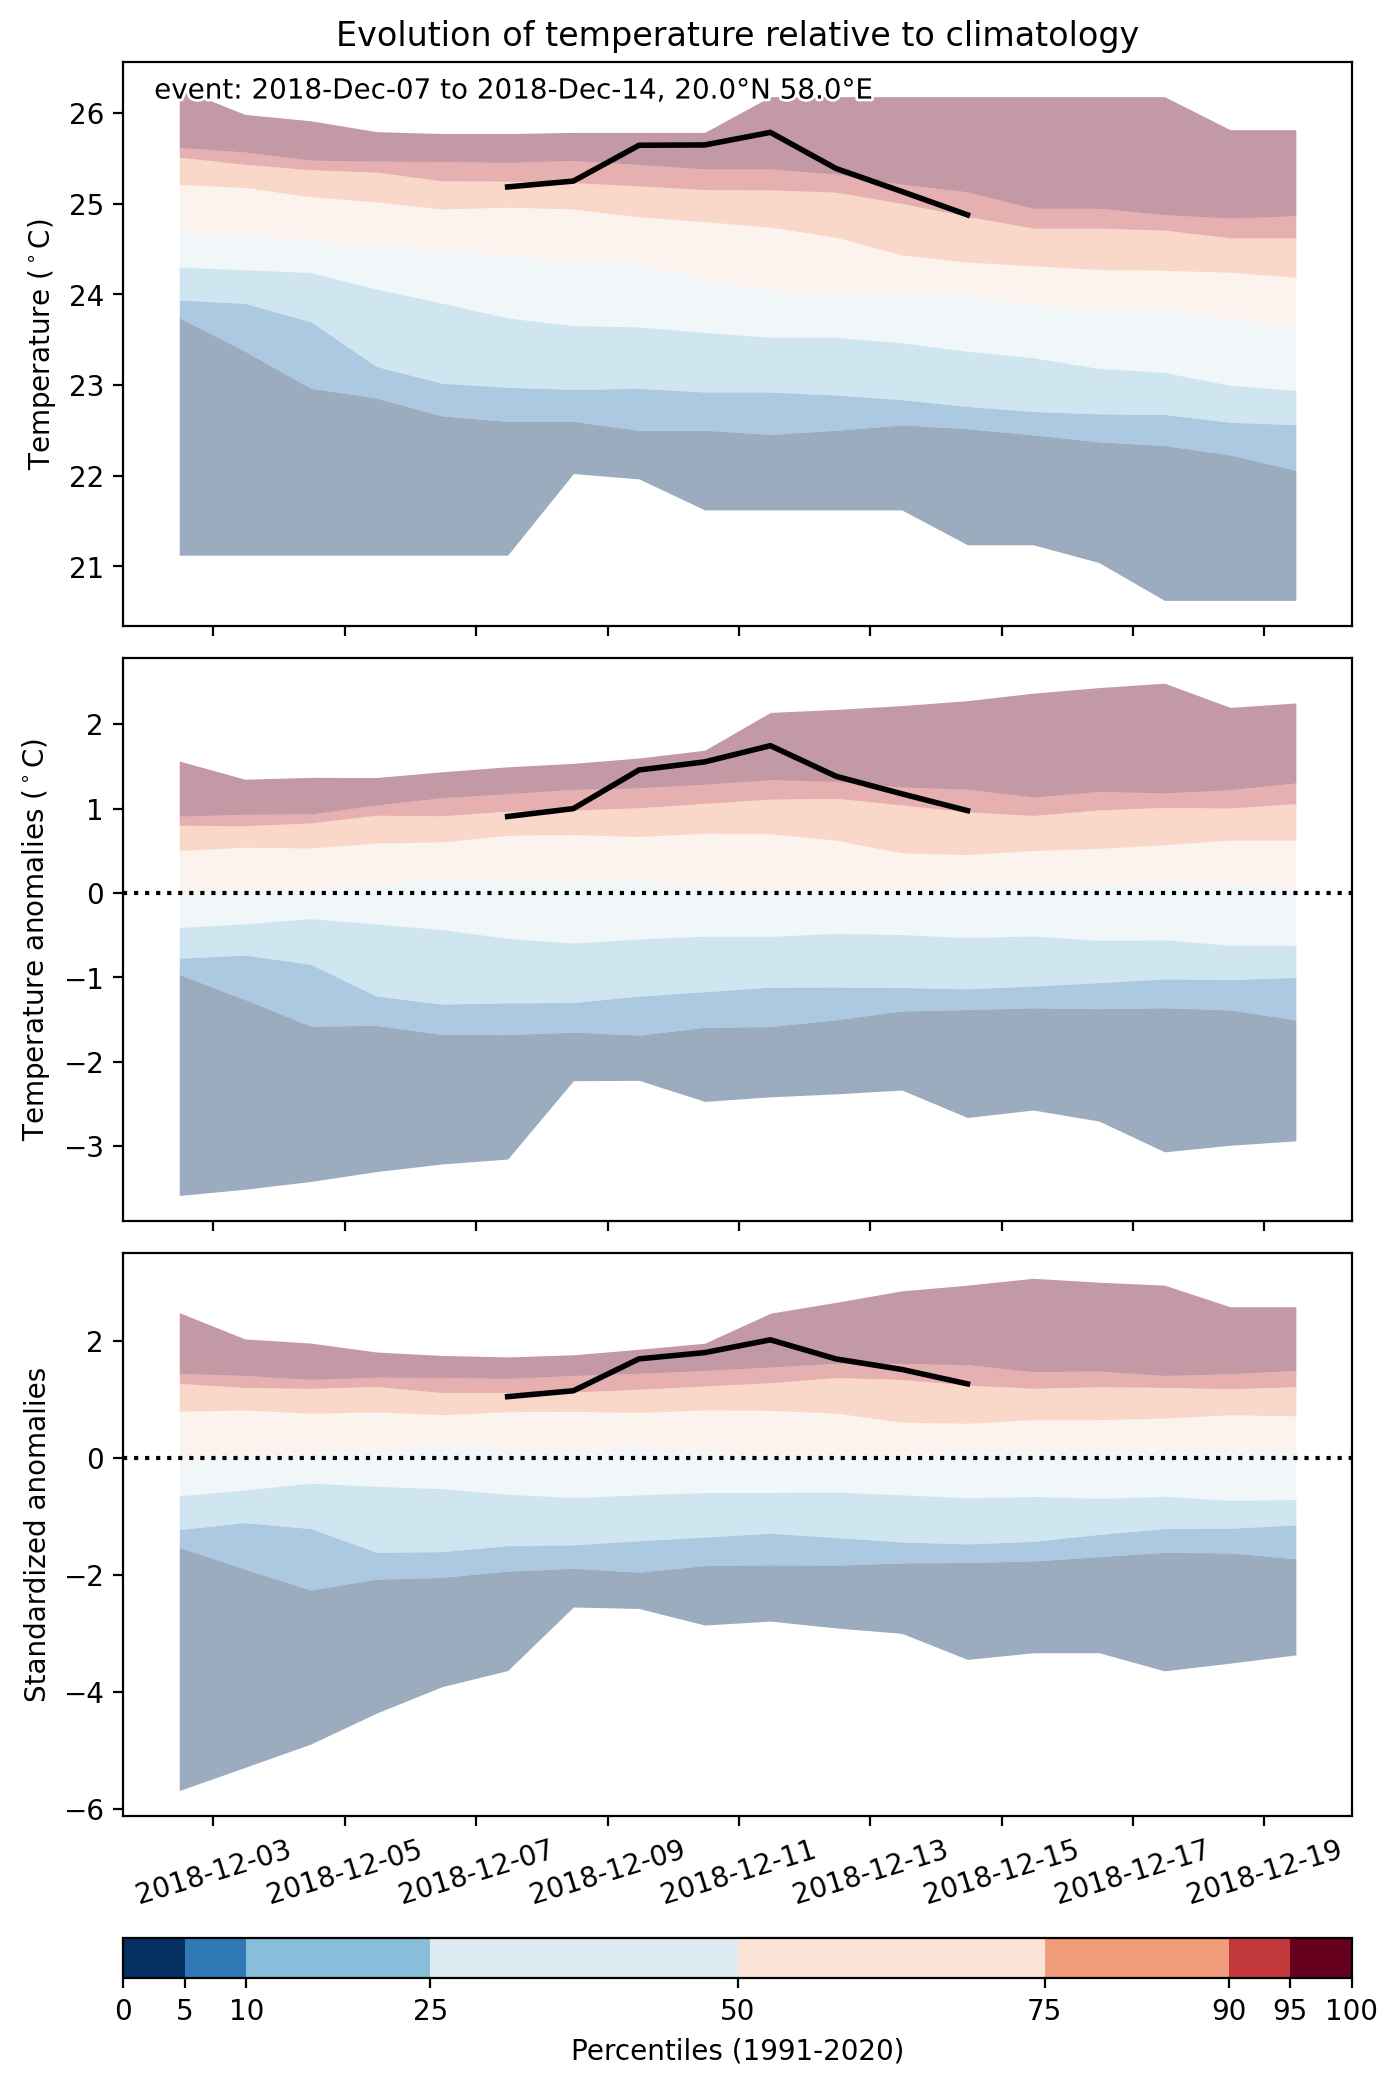
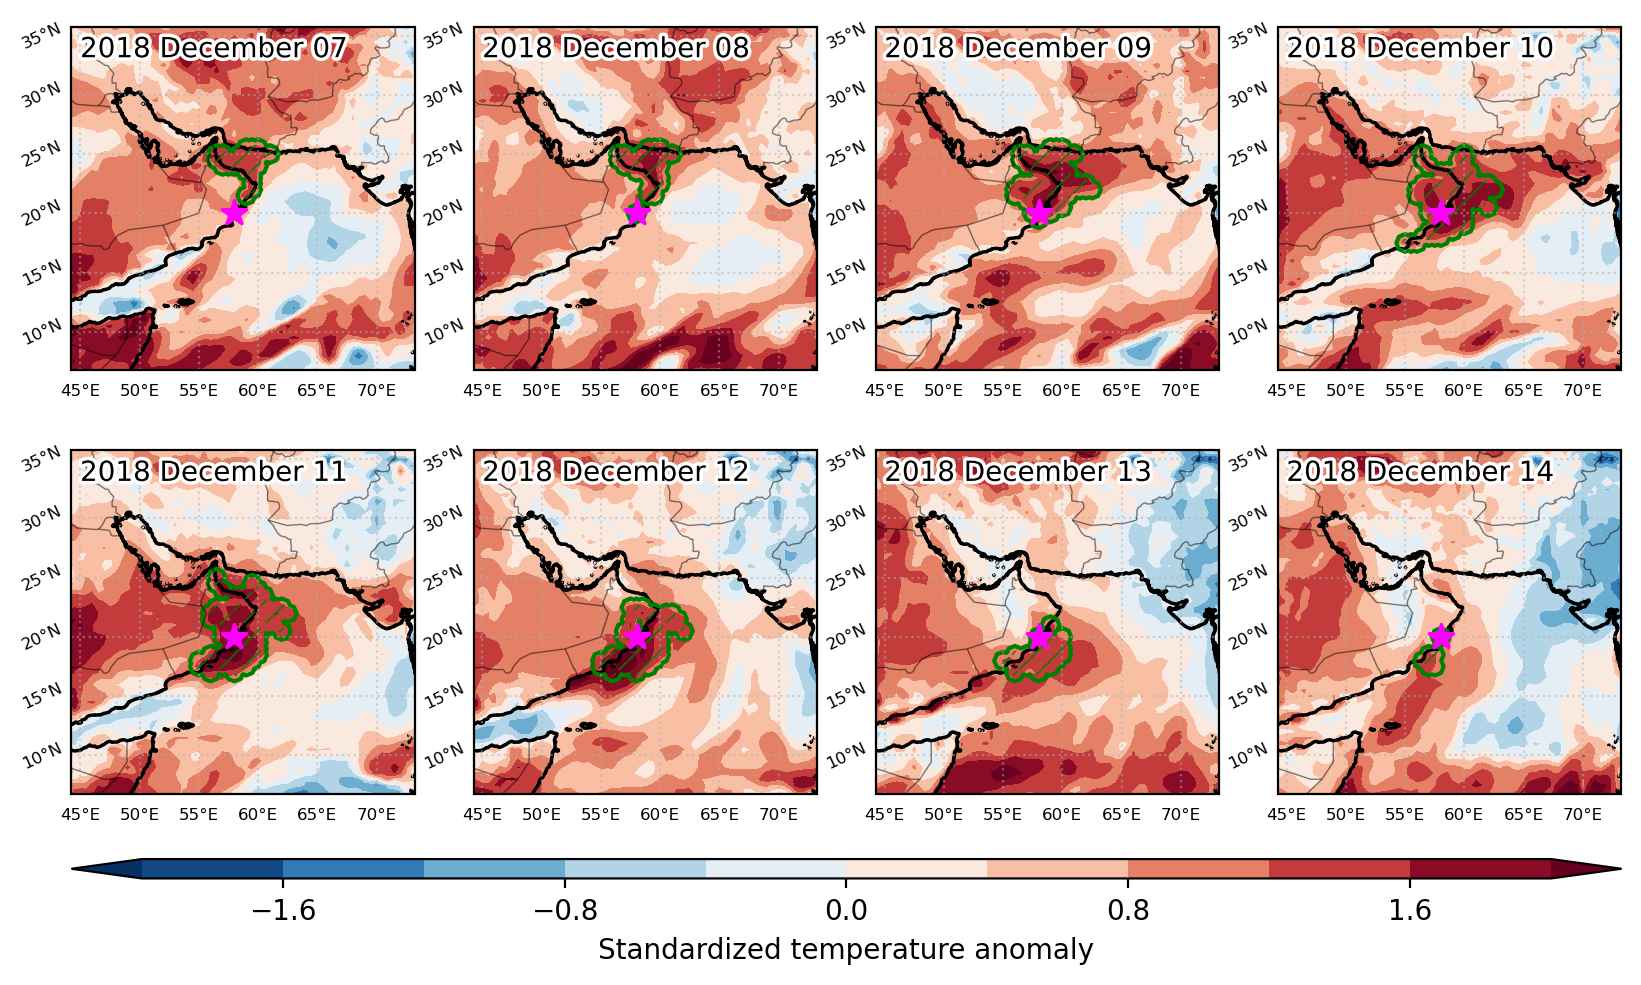
Cold spell occuring from December 09 2018 to December 16 2018 at 0.0°N 288.5°E

Download data: JSON

Event type: Cold spell

Countries affected (identified with ArcGIS Online; provided only for geographical reference):

  • Colombia
  • Ecuador
  • Peru

Duration: 8 days

Time span: December 09 2018 to December 16 2018

Statistics over entire affected area:

  • Mean temperature anomaly: -1.4 °C
  • Mean temperature: 23.5 °C
  • Minimum temperature anomaly: -2.4 °C
  • Minimum temperature: 13.2 °C

Event center: 0.0°N 288.5°E

Area affected: 135989 km$^2$
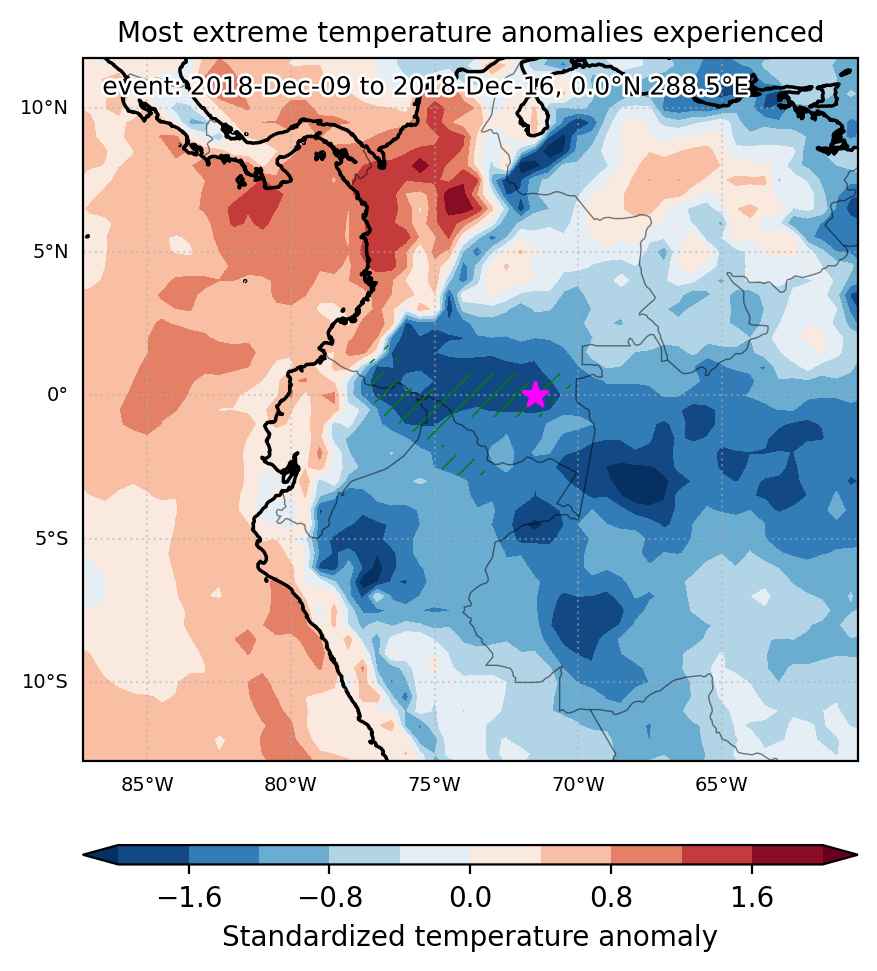

Fig. 1: Map of most extreme temperature anomalies (standardized) experienced during the event. The purple star indicates the center of the extreme event. Green hatching illustrates all areas under the effect of extremes at some time during the event.
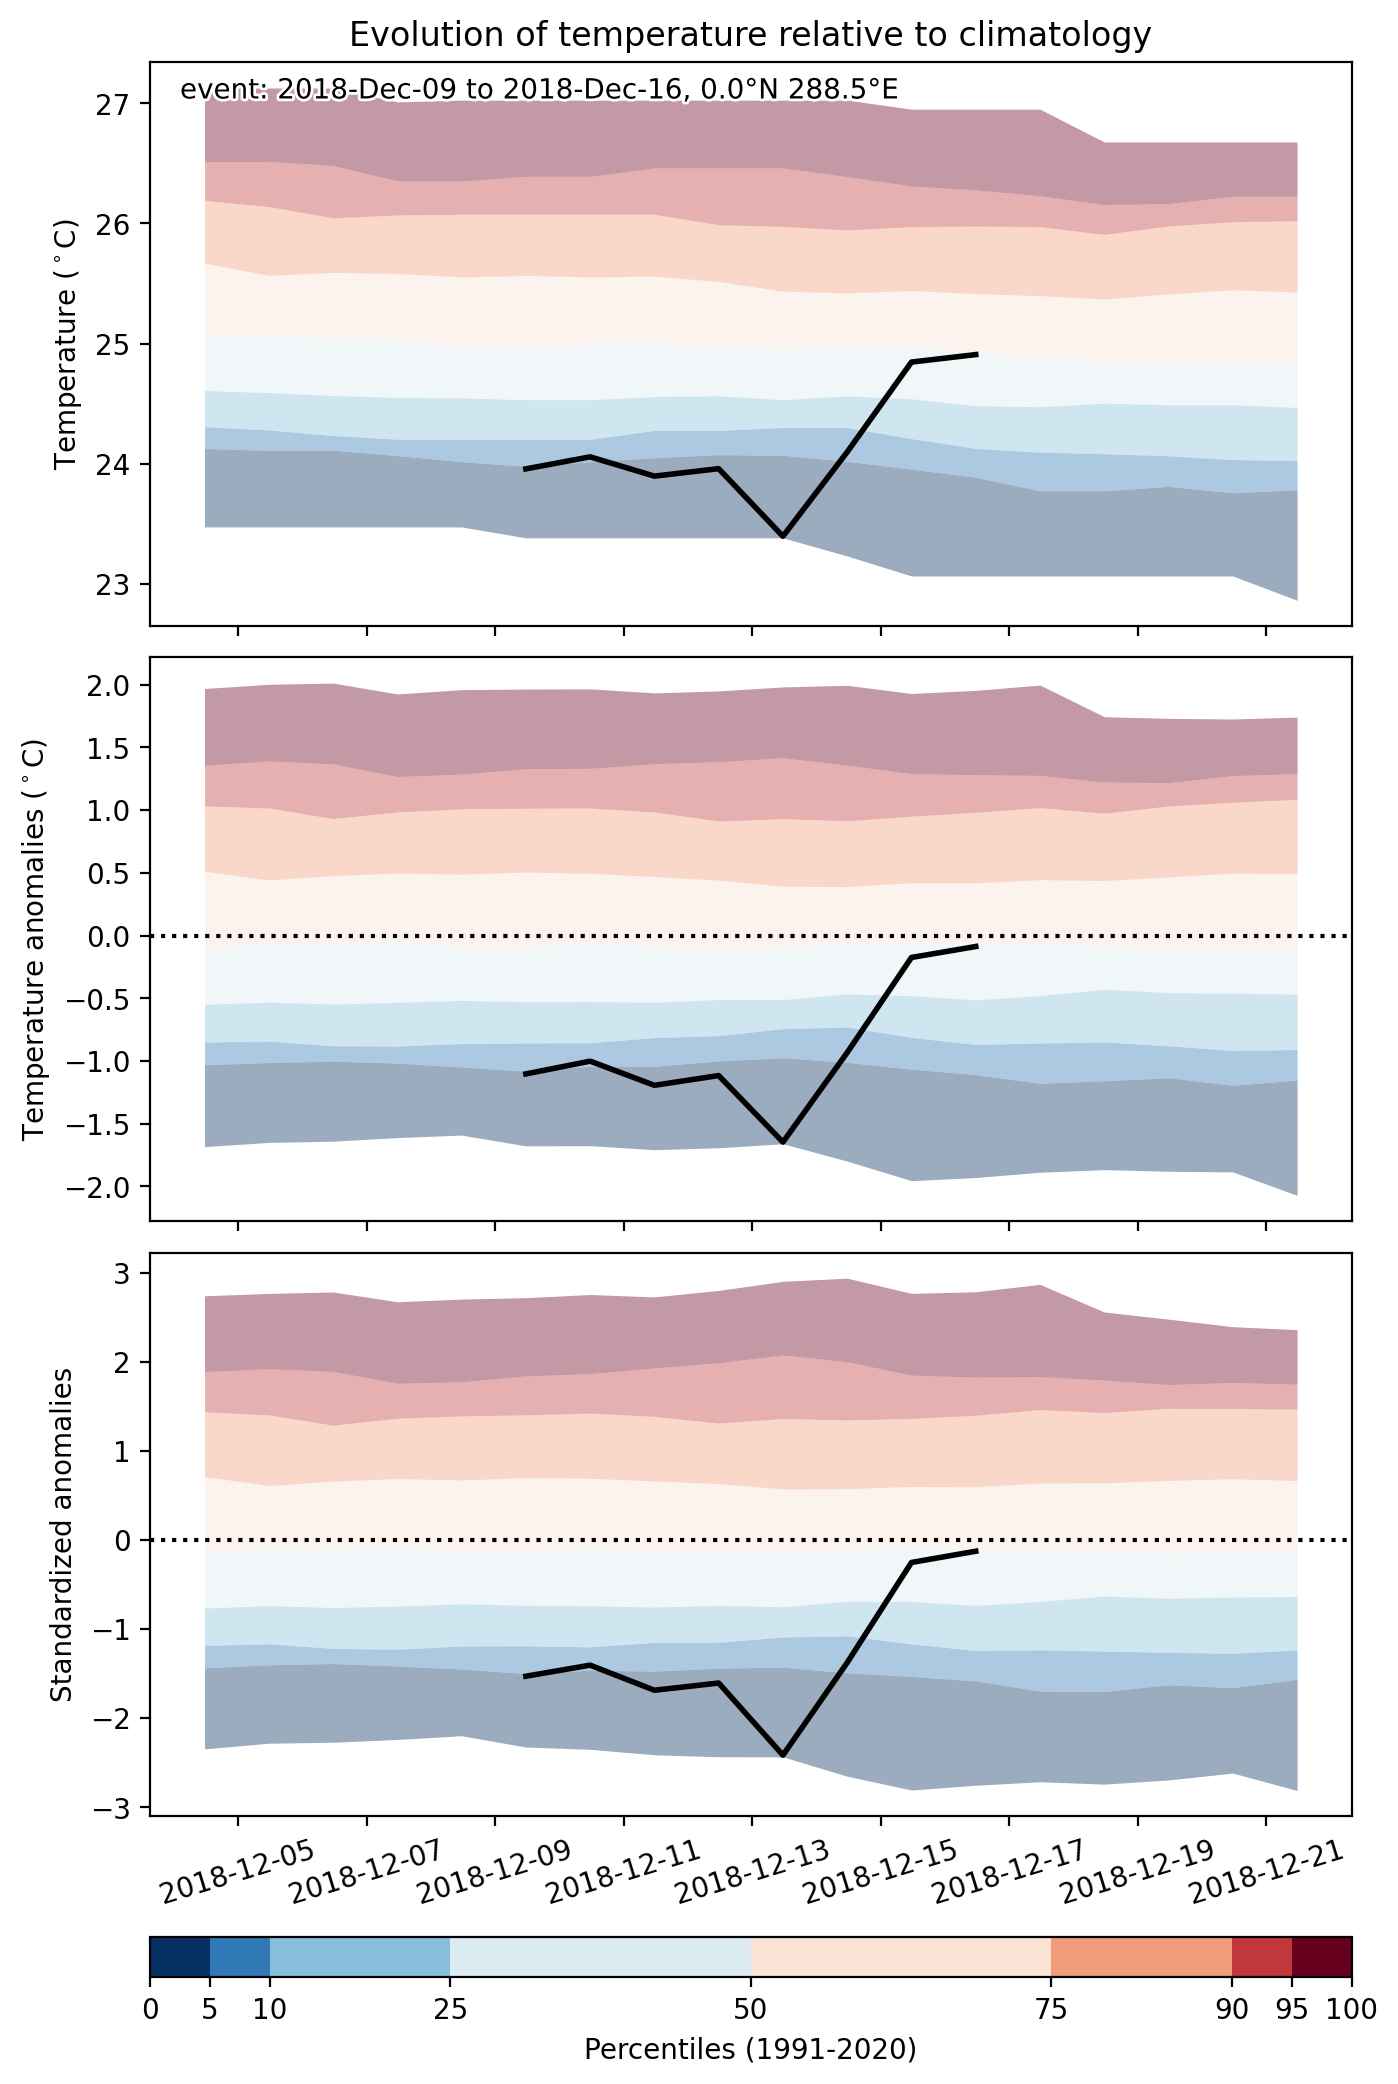


Fig. 2: Evolution of temperature at the center of the event. The climatological percentile distribution is illustrated with color shadings.
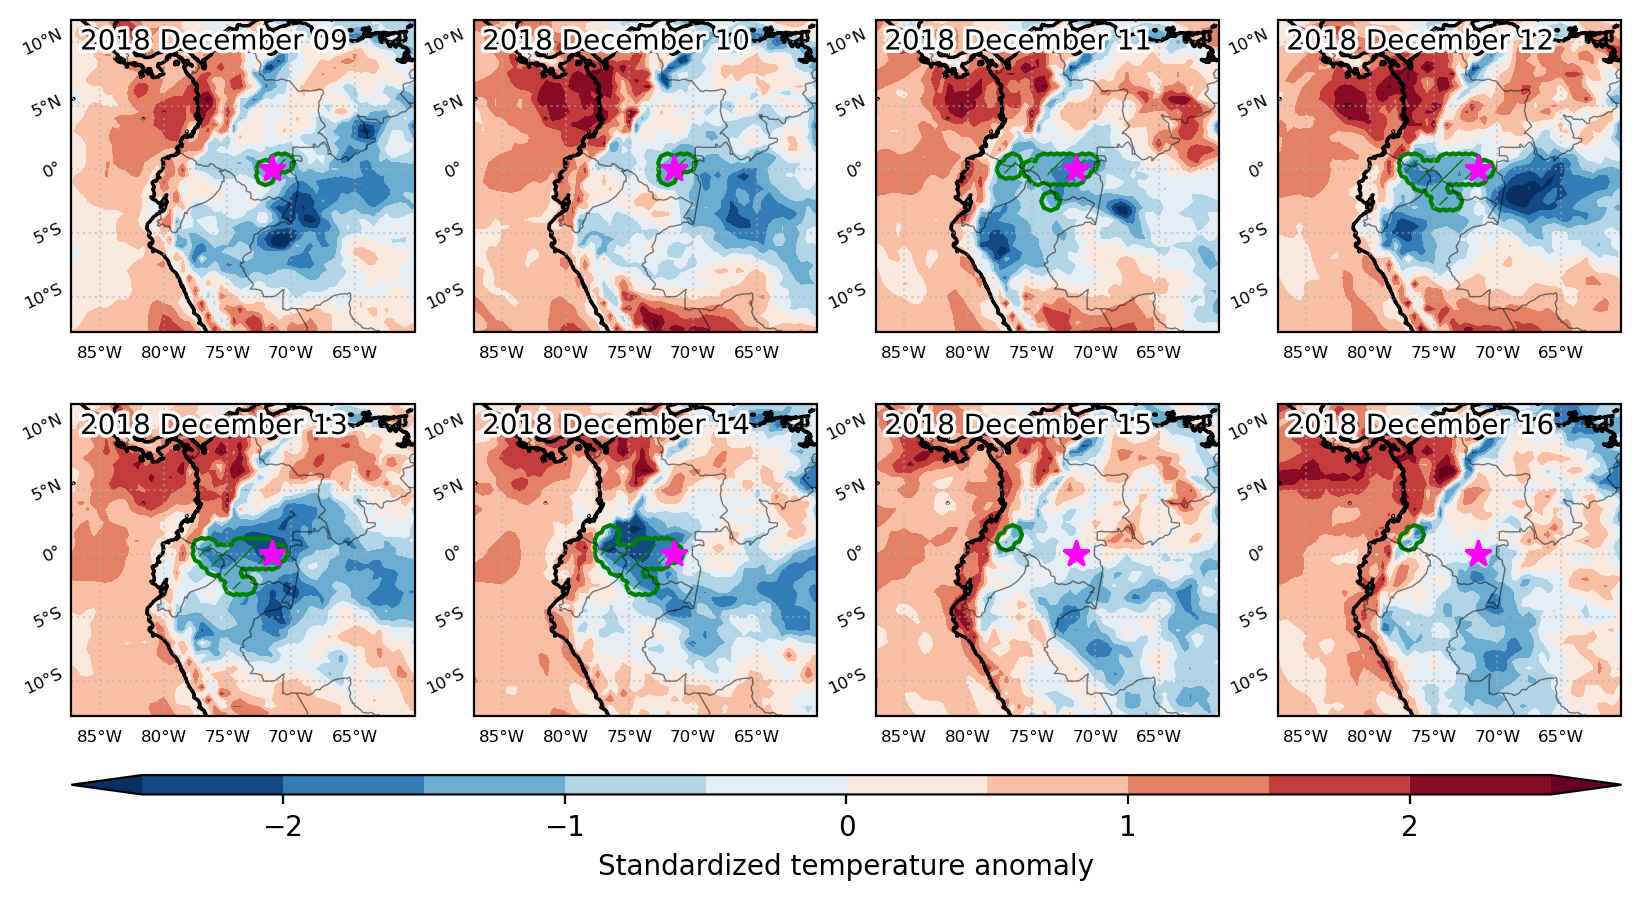


Fig. 3: Maps illustrating the evolution of standardized temperature anomalies during the event.

Event ID: Cold_spell_2018-Dec-09_to_2018-Dec-16_288.5_0.0
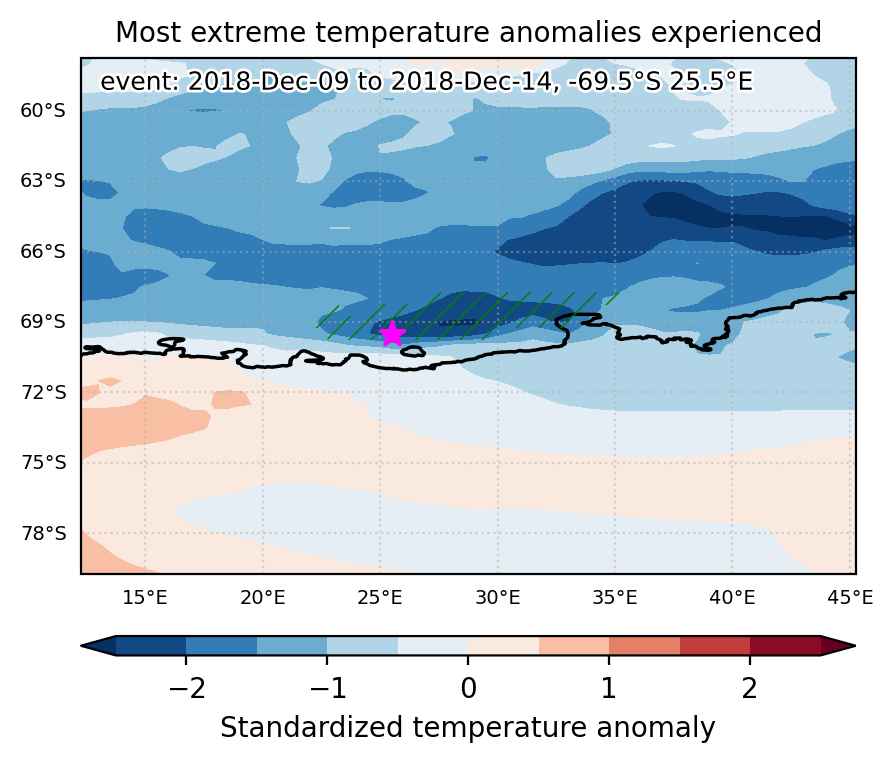
Cold spell occuring from December 09 2018 to December 14 2018 at -69.5°S 25.5°E

Download data: JSON

Event type: Cold spell

Countries affected (identified with ArcGIS Online; provided only for geographical reference):

  • Antarctica

Duration: 6 days

Time span: December 09 2018 to December 14 2018

Statistics over entire affected area:

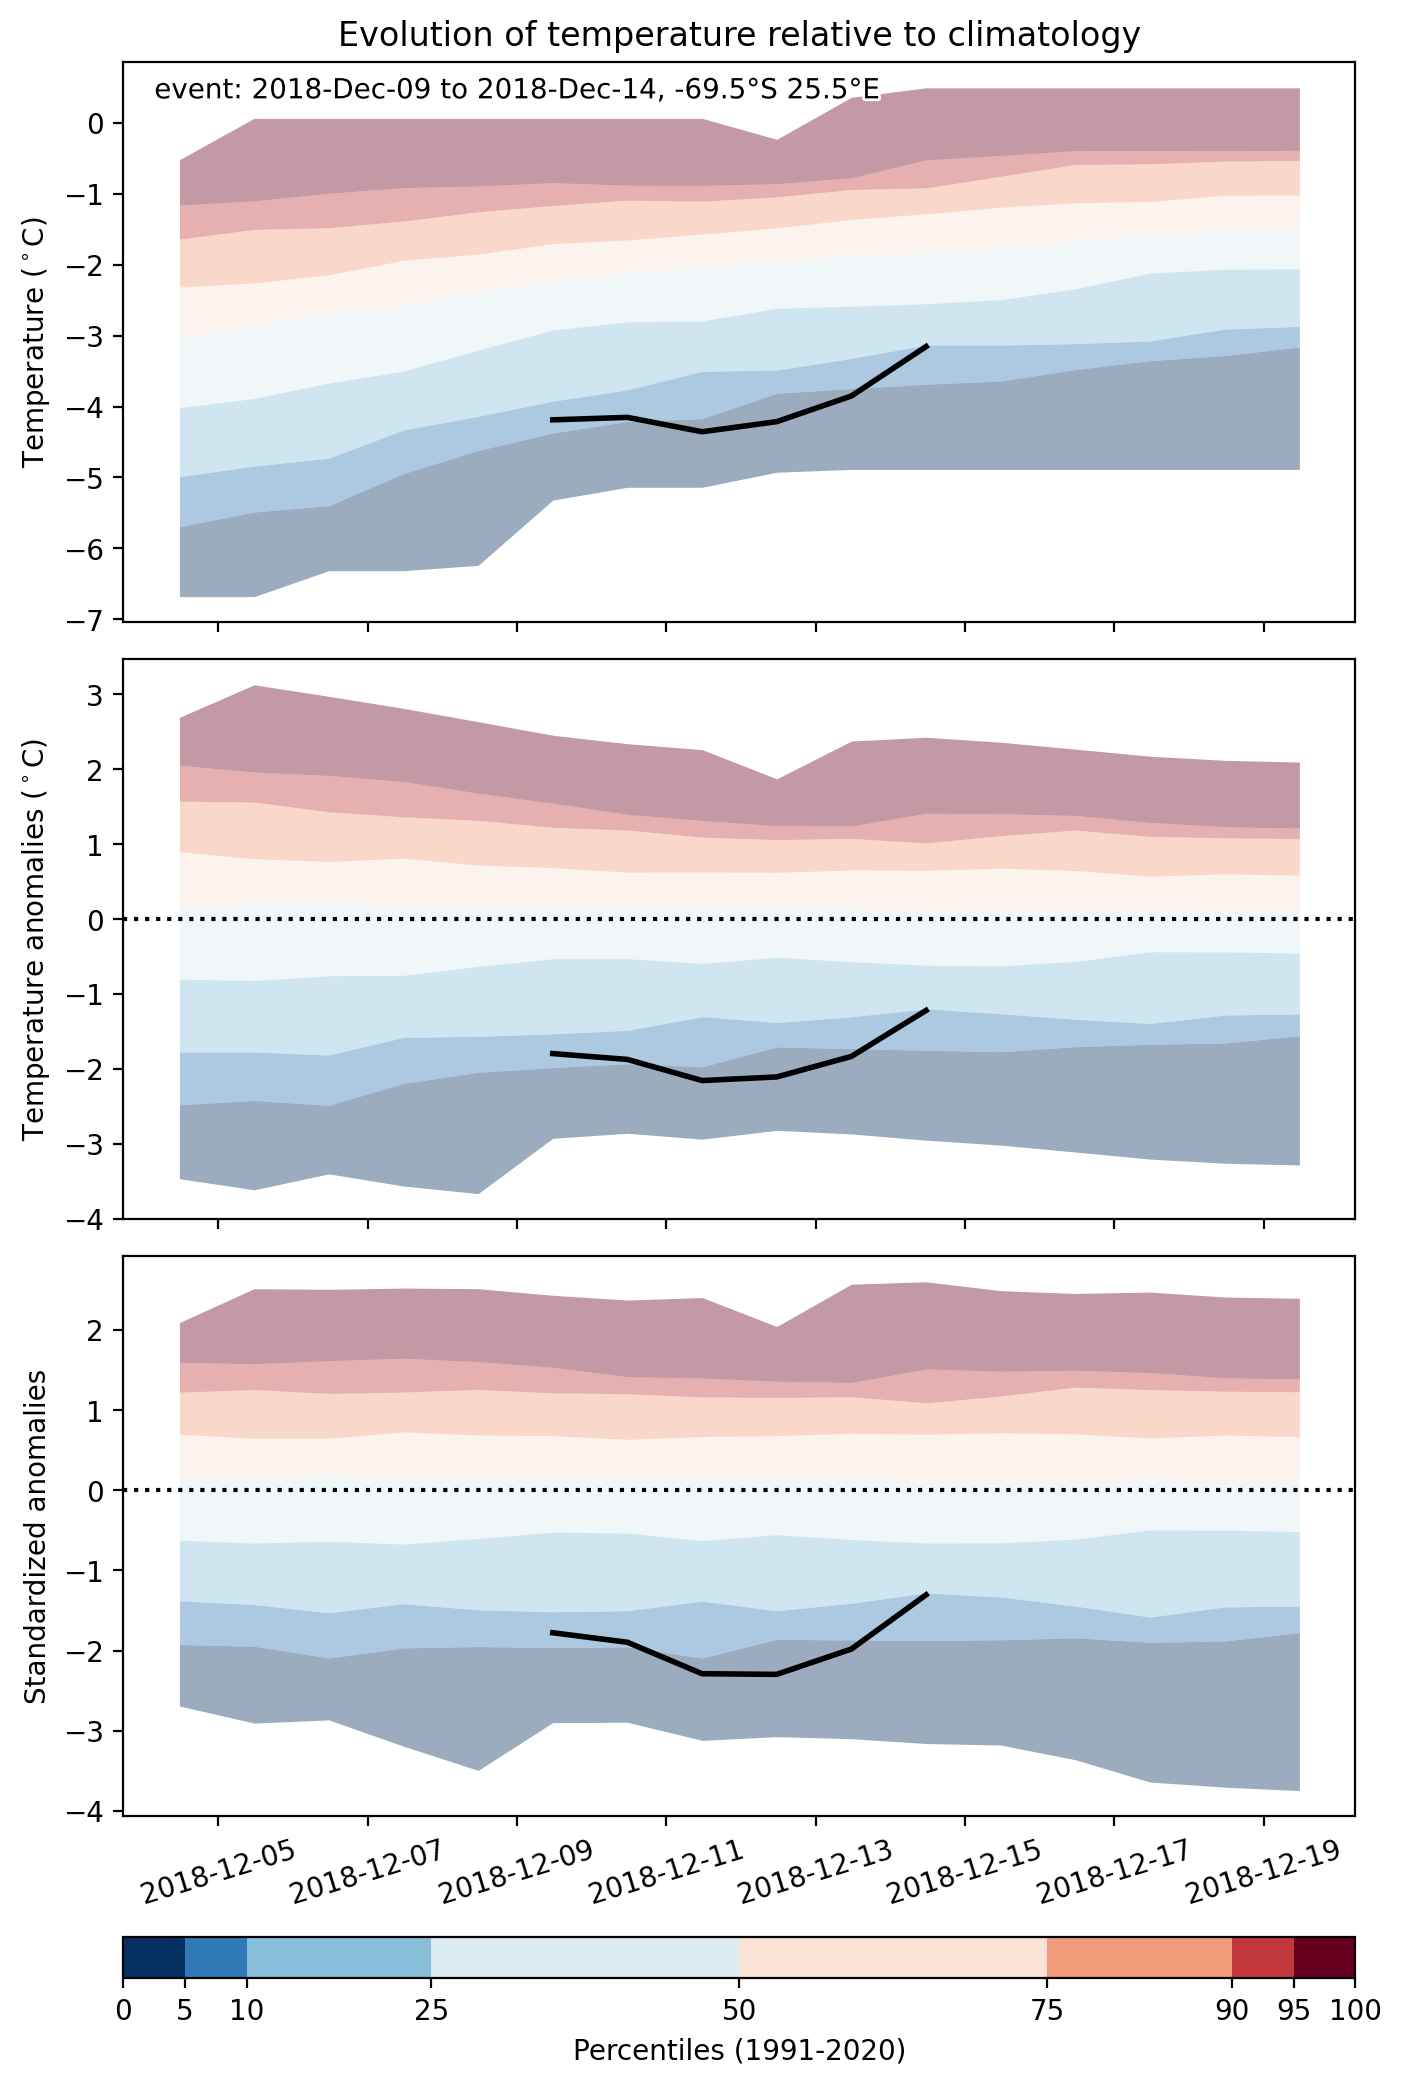
  • Mean temperature anomaly: -1.8 °C
  • Mean temperature: -3.8 °C
  • Minimum temperature anomaly: -4.0 °C
  • Minimum temperature: -9.4 °C

Event center: -69.5°S 25.5°E

Area affected: 81868 km$^2$


Fig. 1: Map of most extreme temperature anomalies (standardized) experienced during the event. The purple star indicates the center of the extreme event. Green hatching illustrates all areas under the effect of extremes at some time during the event.


Fig. 2: Evolution of temperature at the center of the event. The climatological percentile distribution is illustrated with color shadings.


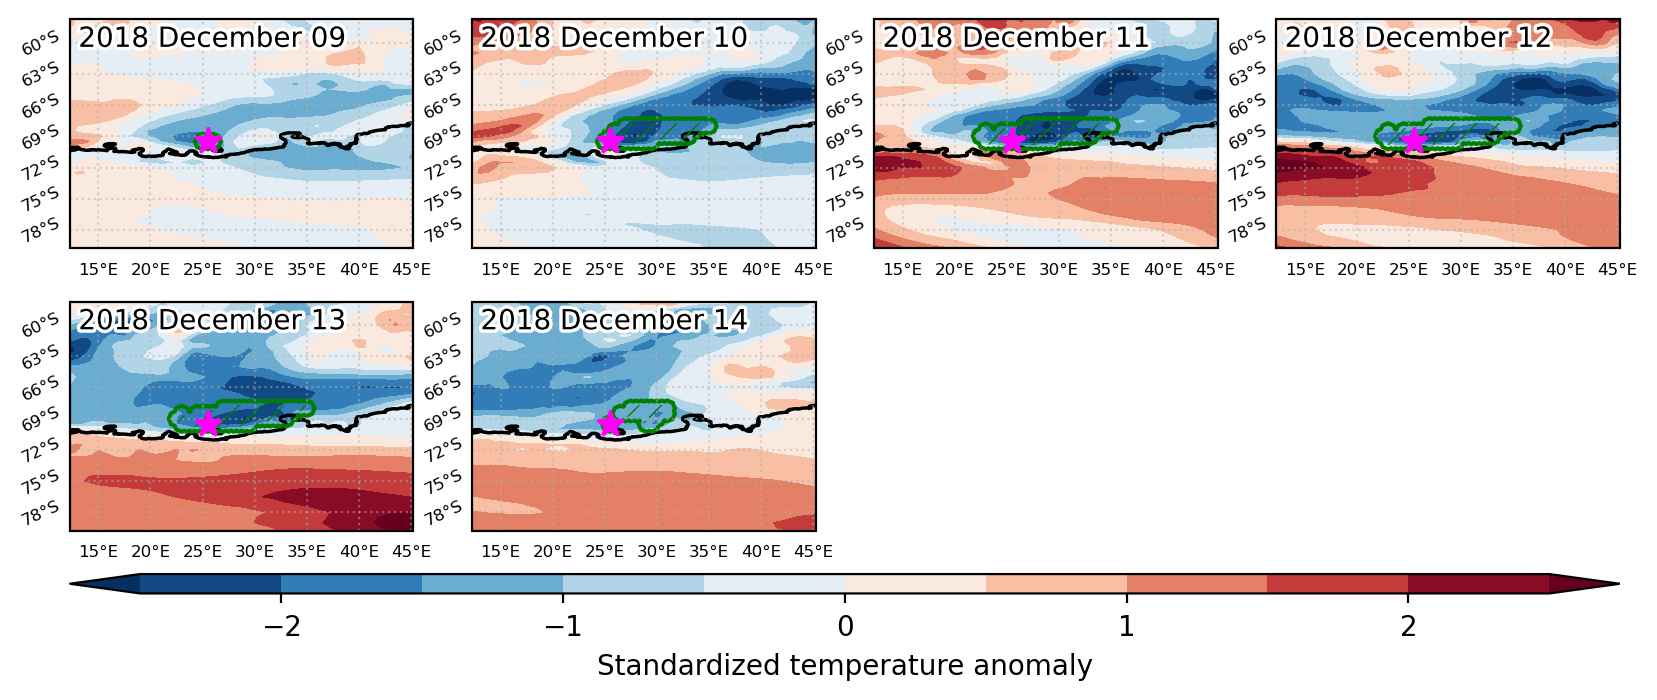
Fig. 3: Maps illustrating the evolution of standardized temperature anomalies during the event.

Event ID: Cold_spell_2018-Dec-09_to_2018-Dec-14_25.5_-69.5

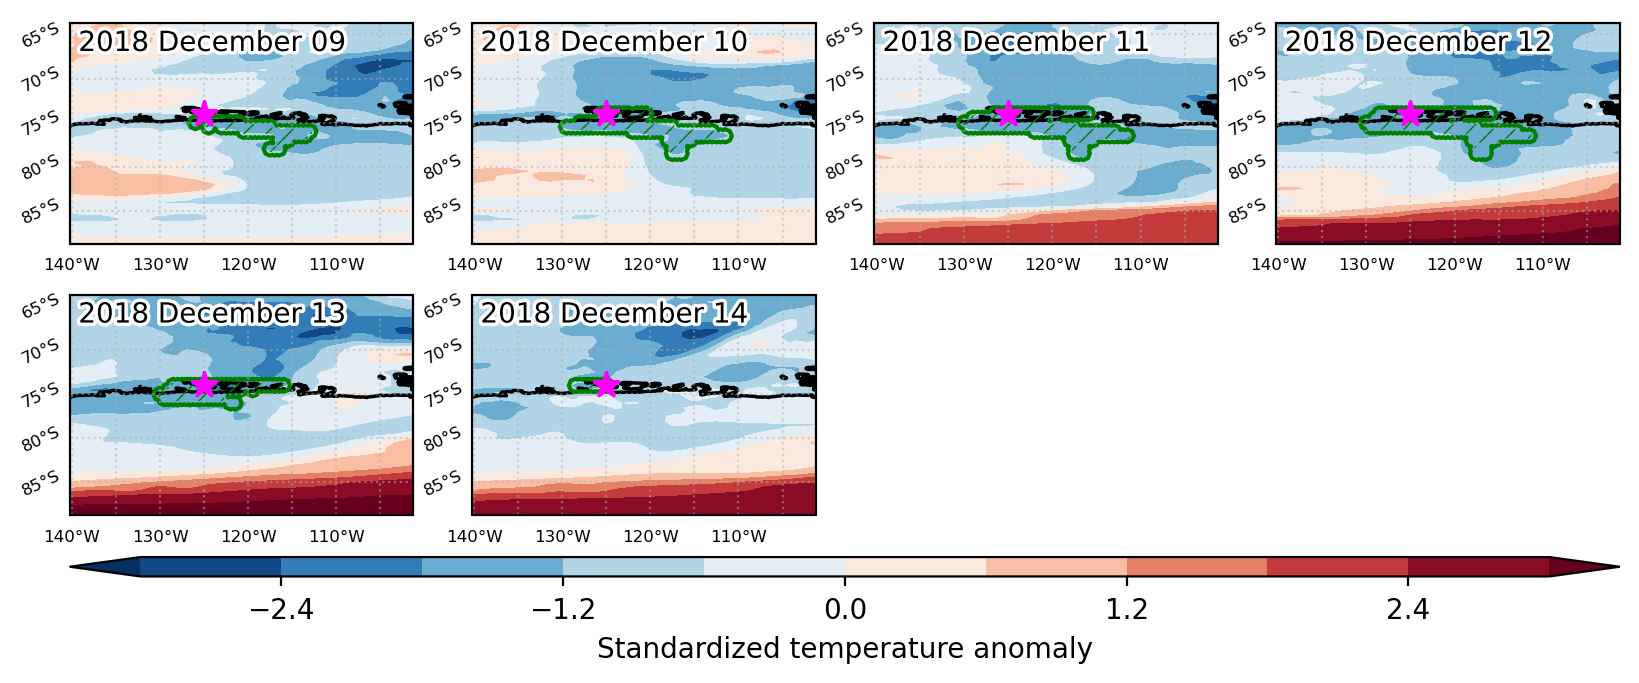
Cold spell occuring from December 09 2018 to December 14 2018 at -74.0°S 235.0°E

Download data: JSON

Event type: Cold spell

Countries affected (identified with ArcGIS Online; provided only for geographical reference):

  • Antarctica

Duration: 6 days

Time span: December 09 2018 to December 14 2018

Statistics over entire affected area:

  • Mean temperature anomaly: -4.1 °C
  • Mean temperature: -15.8 °C
  • Minimum temperature anomaly: -5.7 °C
  • Minimum temperature: -23.0 °C

Event center: -74.0°S 235.0°E

Area affected: 103082 km$^2$


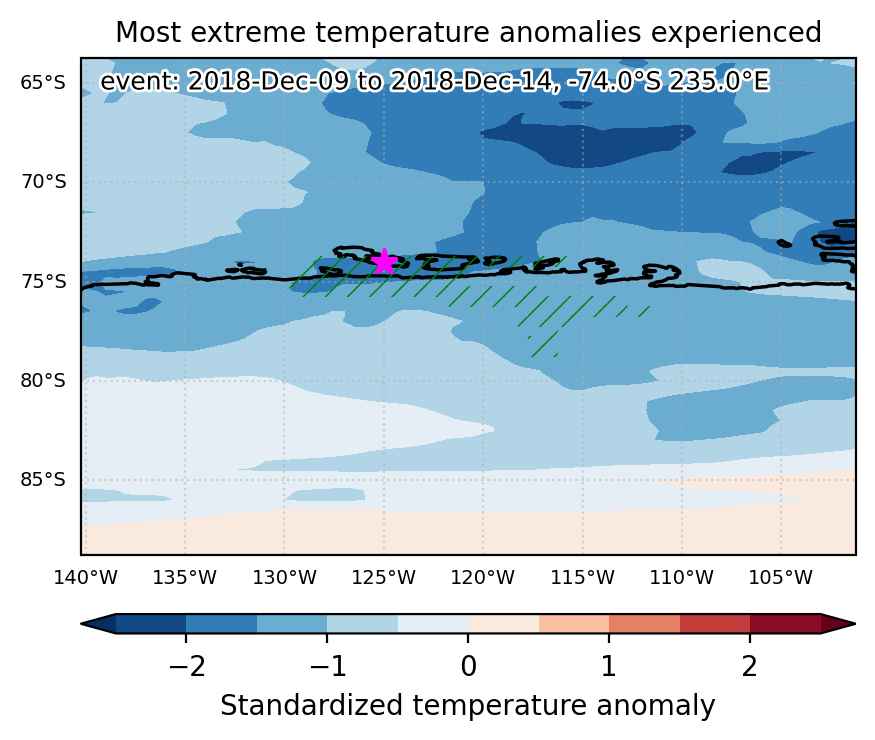
Fig. 1: Map of most extreme temperature anomalies (standardized) experienced during the event. The purple star indicates the center of the extreme event. Green hatching illustrates all areas under the effect of extremes at some time during the event.


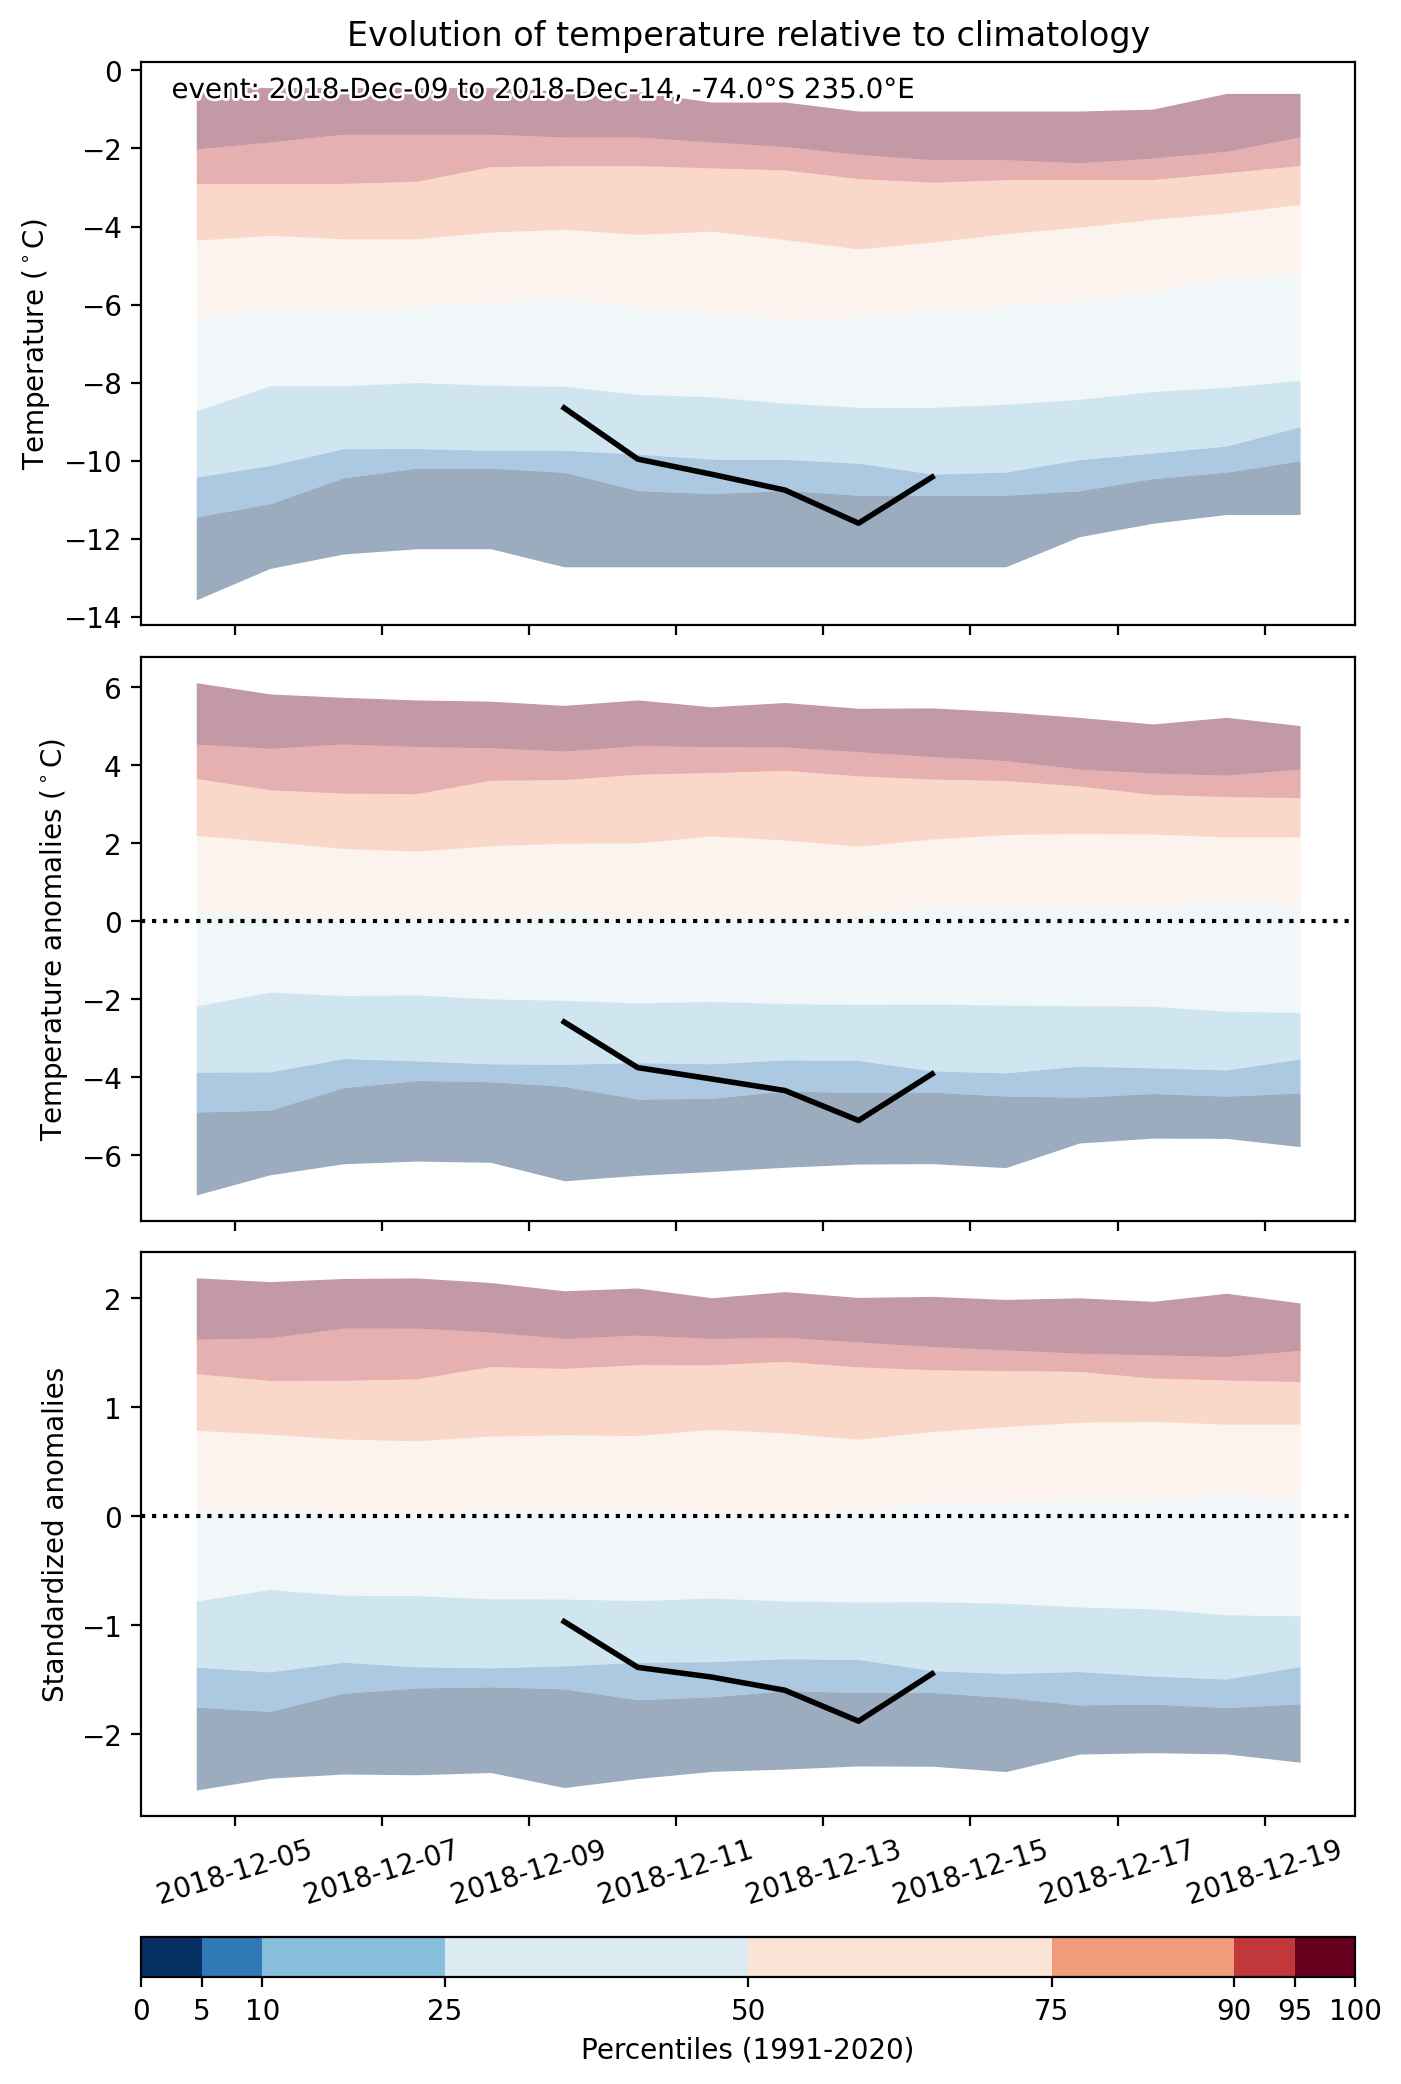
Fig. 2: Evolution of temperature at the center of the event. The climatological percentile distribution is illustrated with color shadings.


Fig. 3: Maps illustrating the evolution of standardized temperature anomalies during the event.

Event ID: Cold_spell_2018-Dec-09_to_2018-Dec-14_235.0_-74.0

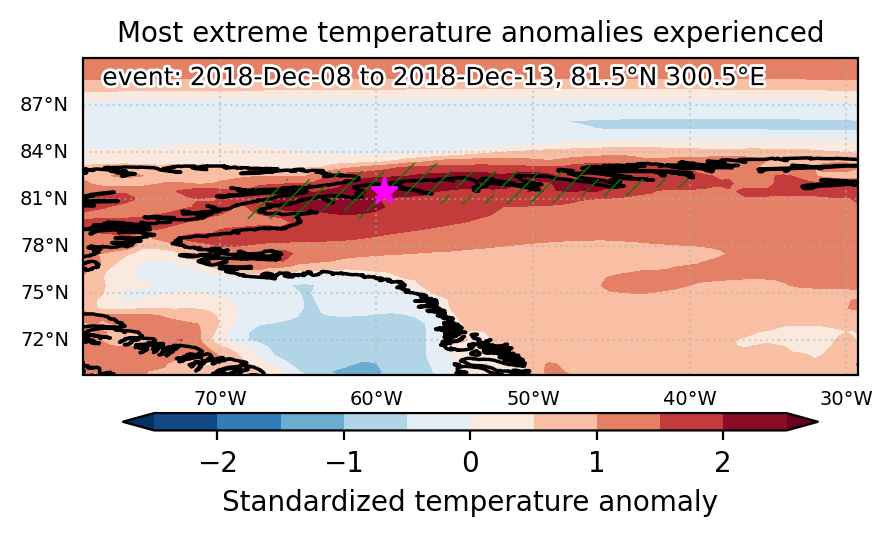
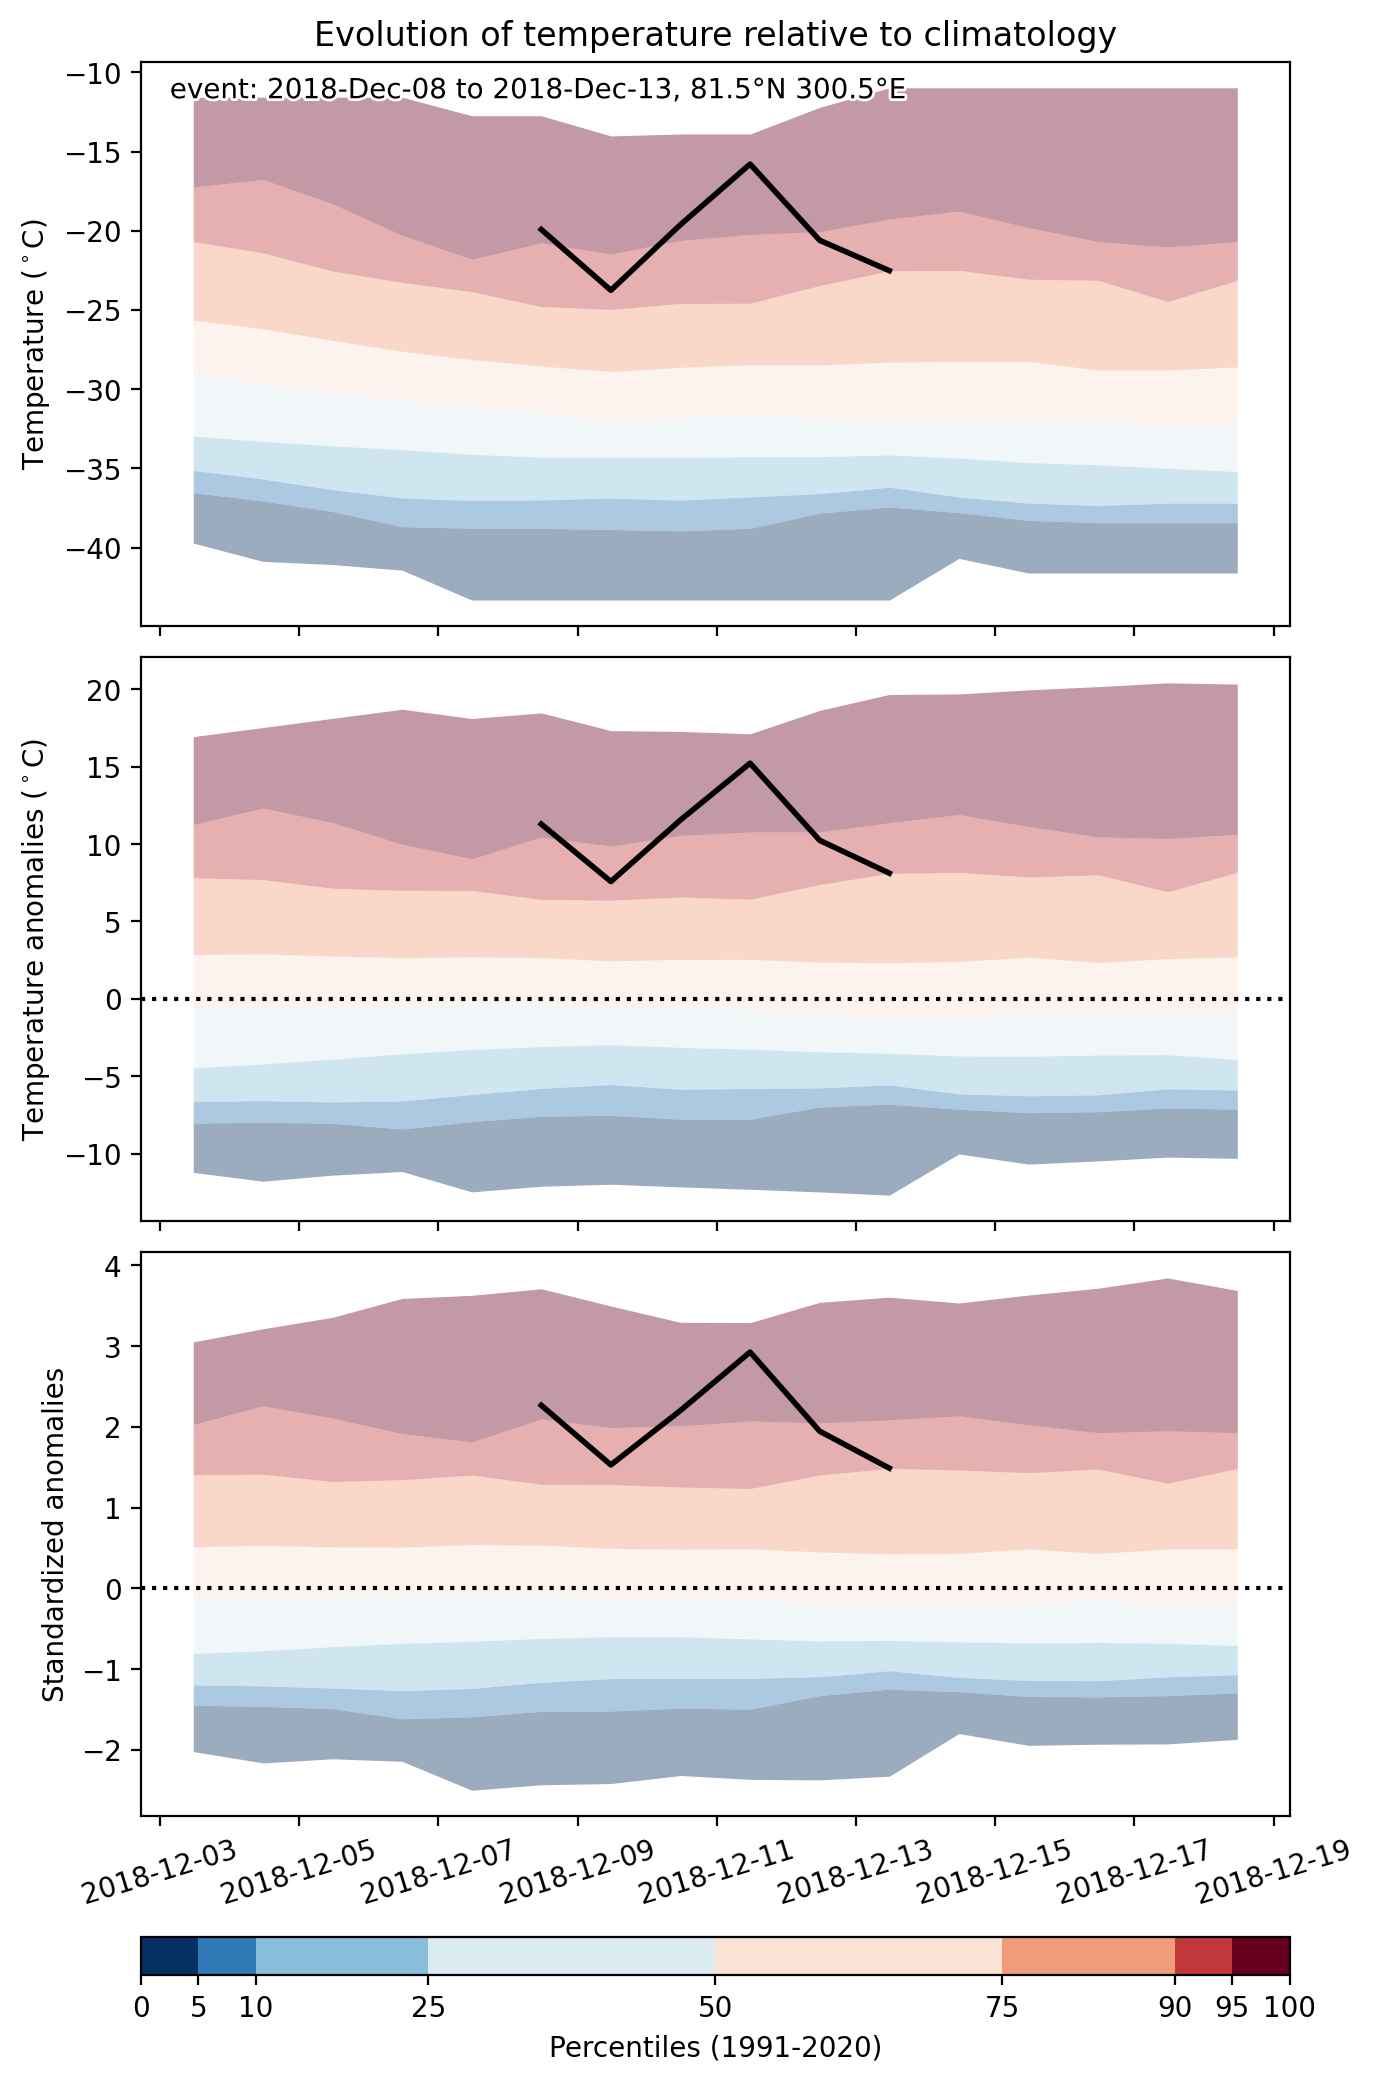
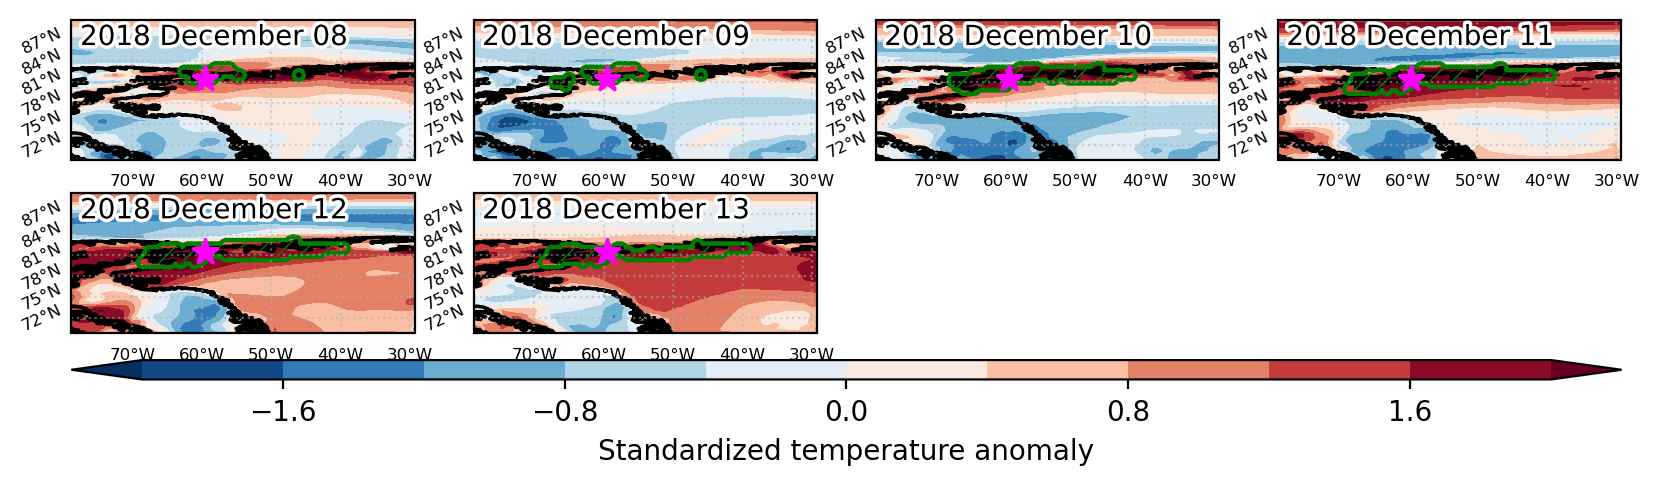
Heat wave occuring from December 08 2018 to December 13 2018 at 81.5°N 300.5°E

Download data: JSON

Event type: Heat wave

Countries affected (identified with ArcGIS Online; provided only for geographical reference):

  • Canada
  • Greenland

Duration: 6 days

Time span: December 08 2018 to December 13 2018

Statistics over entire affected area:

  • Mean temperature anomaly: 9.4 °C
  • Mean temperature: -19.9 °C
  • Maximum temperature anomaly: 16.8 °C
  • Maximum temperature: -14.0 °C

Event center: 81.5°N 300.5°E

Area affected: 87184 km$^2$


Fig. 1: Map of most extreme temperature anomalies (standardized) experienced during the event. The purple star indicates the center of the extreme event. Green hatching illustrates all areas under the effect of extremes at some time during the event.


Fig. 2: Evolution of temperature at the center of the event. The climatological percentile distribution is illustrated with color shadings.


Fig. 3: Maps illustrating the evolution of standardized temperature anomalies during the event.

Event ID: Heat_wave_2018-Dec-08_to_2018-Dec-13_300.5_81.5

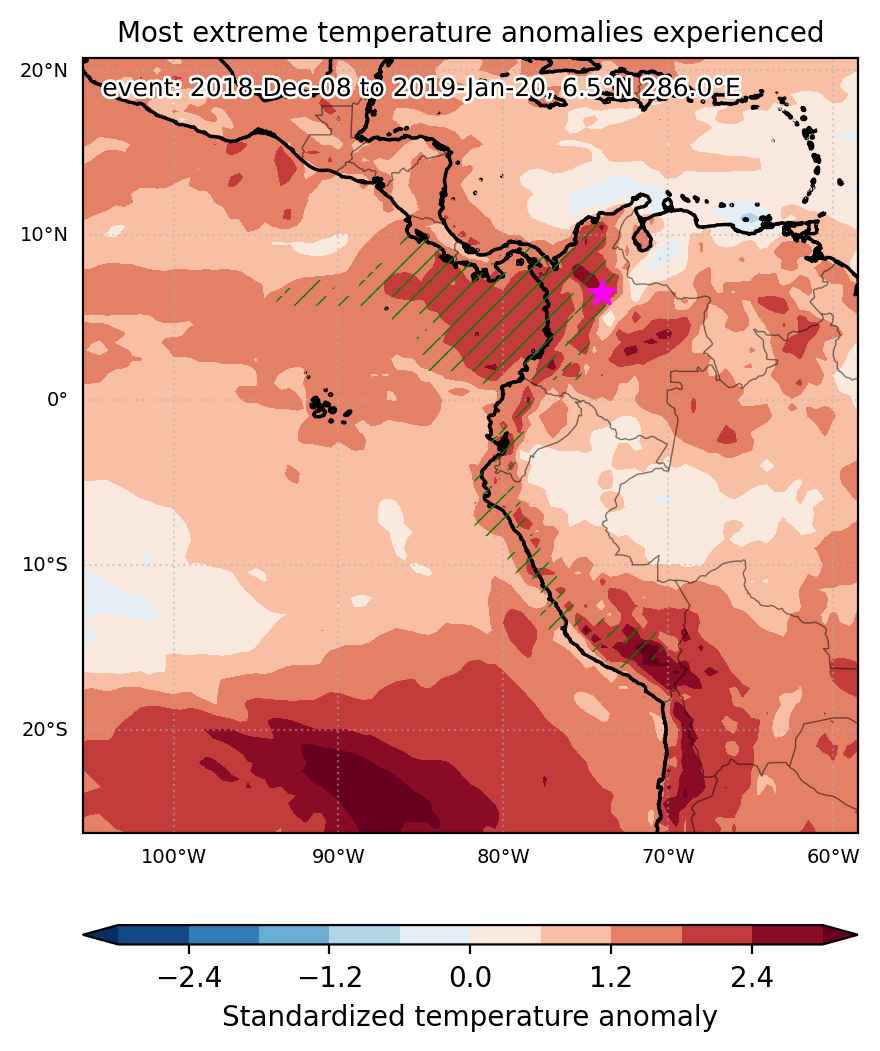
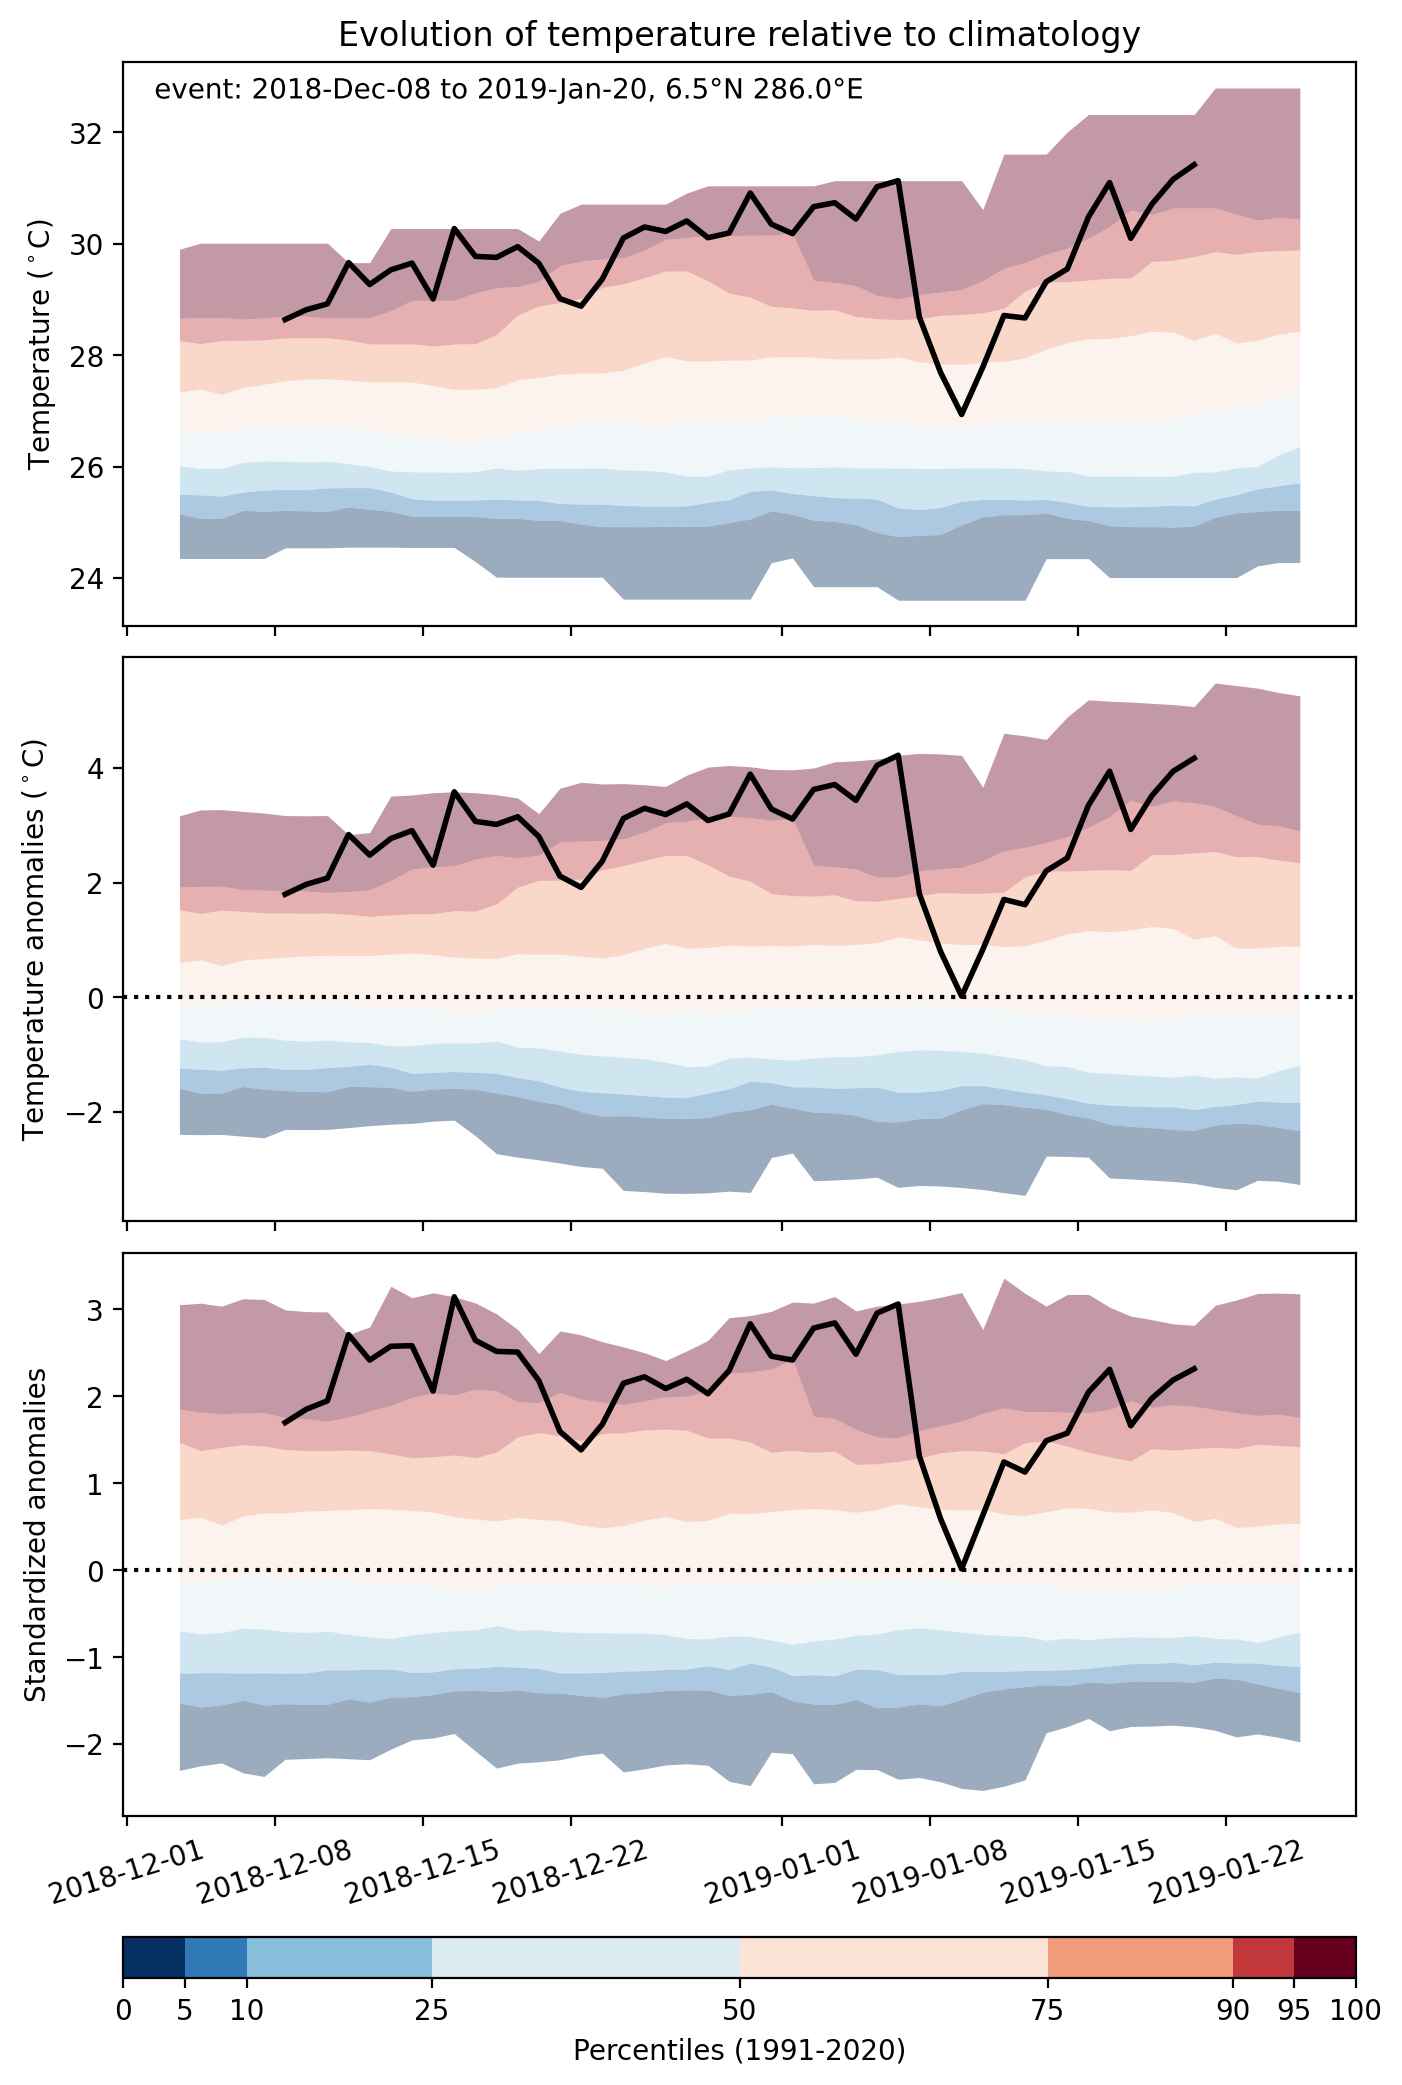
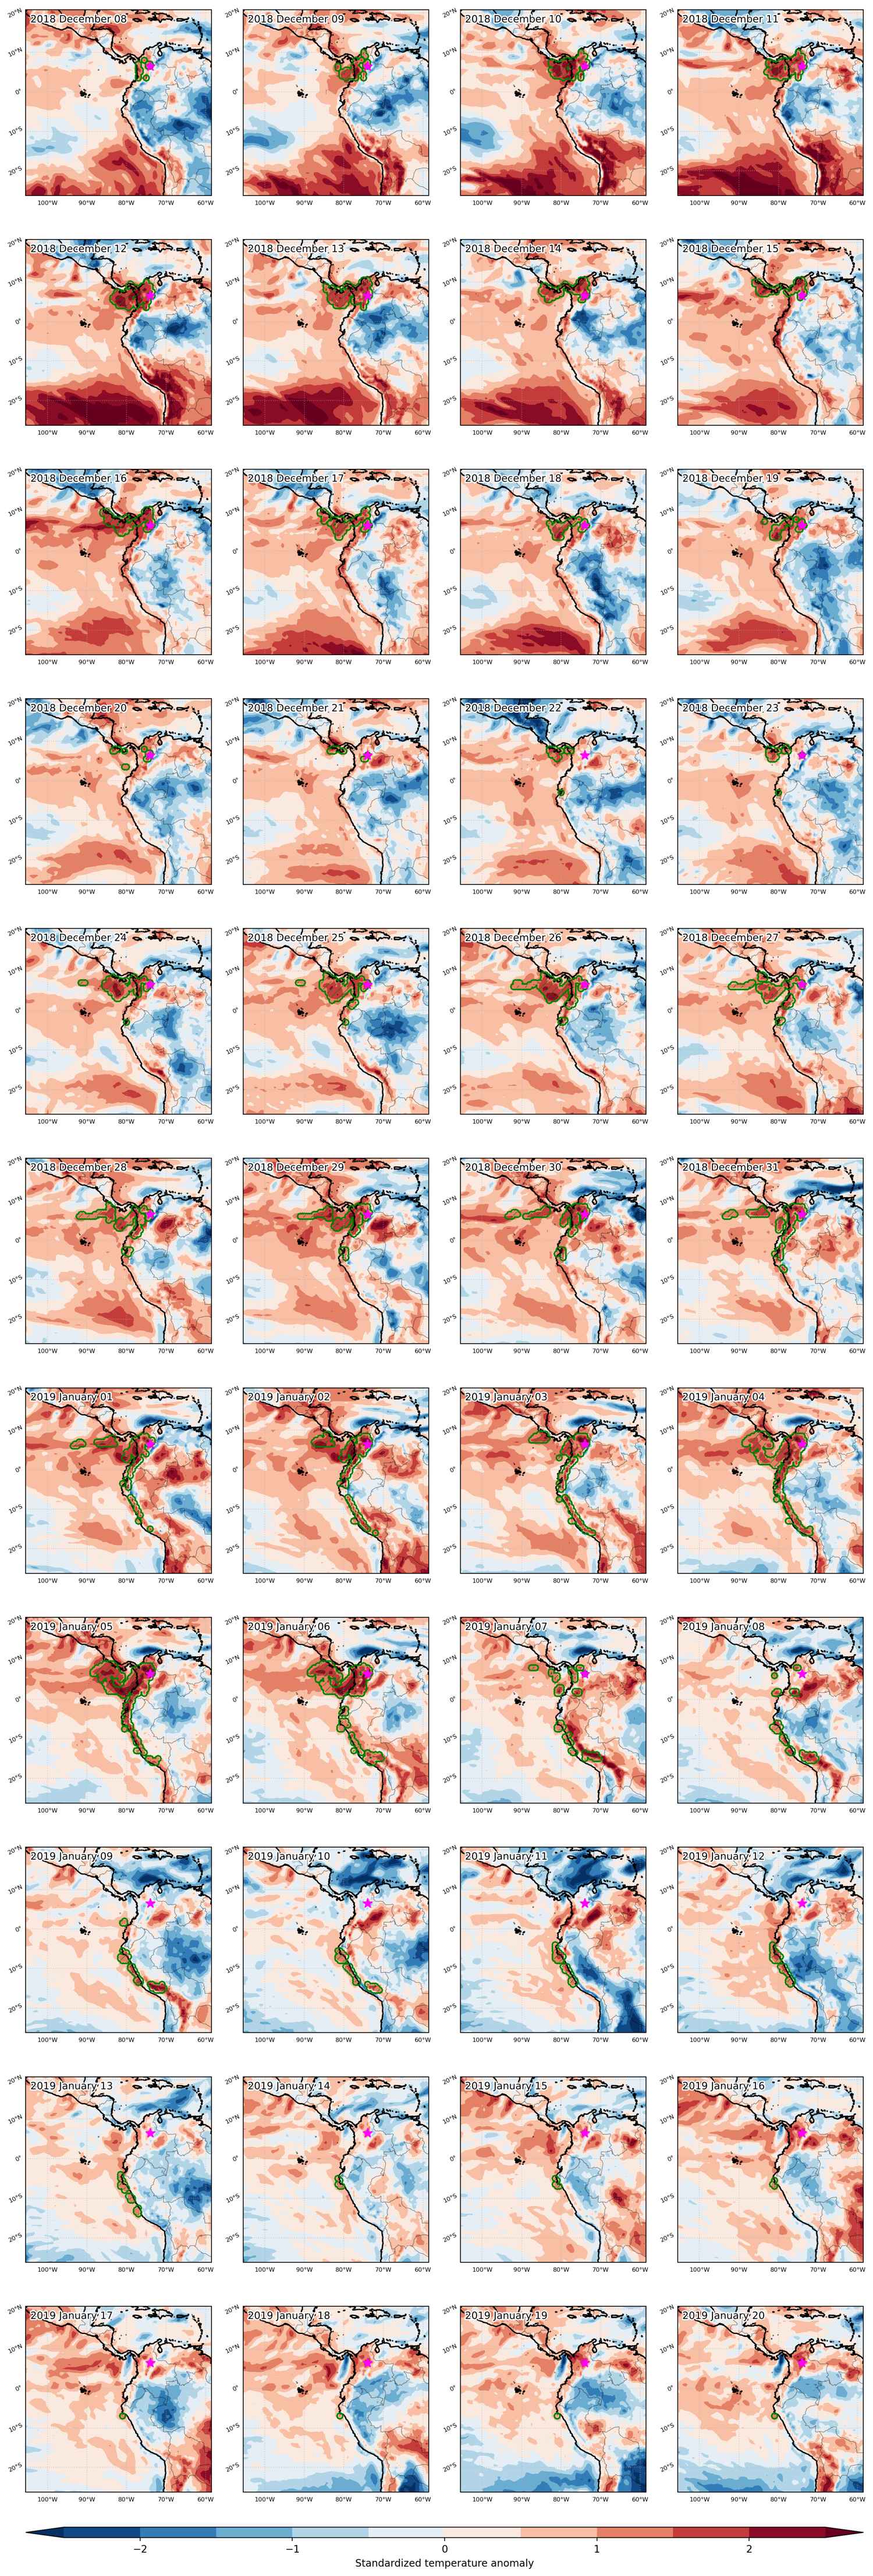
Heat wave occuring from December 08 2018 to January 20 2019 at 6.5°N 286.0°E

Download data: JSON

Event type: Heat wave

Countries affected (identified with ArcGIS Online; provided only for geographical reference):

  • Colombia
  • Costa Rica
  • Ecuador
  • Panama
  • Peru

Duration: 44 days

Time span: December 08 2018 to January 20 2019

Statistics over entire affected area:

  • Mean temperature anomaly: 1.6 °C
  • Mean temperature: 25.6 °C
  • Maximum temperature anomaly: 4.2 °C
  • Maximum temperature: 31.9 °C

Event center: 6.5°N 286.0°E

Area affected: 1517181 km$^2$


Fig. 1: Map of most extreme temperature anomalies (standardized) experienced during the event. The purple star indicates the center of the extreme event. Green hatching illustrates all areas under the effect of extremes at some time during the event.


Fig. 2: Evolution of temperature at the center of the event. The climatological percentile distribution is illustrated with color shadings.


Fig. 3: Maps illustrating the evolution of standardized temperature anomalies during the event.

Event ID: Heat_wave_2018-Dec-08_to_2019-Jan-20_286.0_6.5

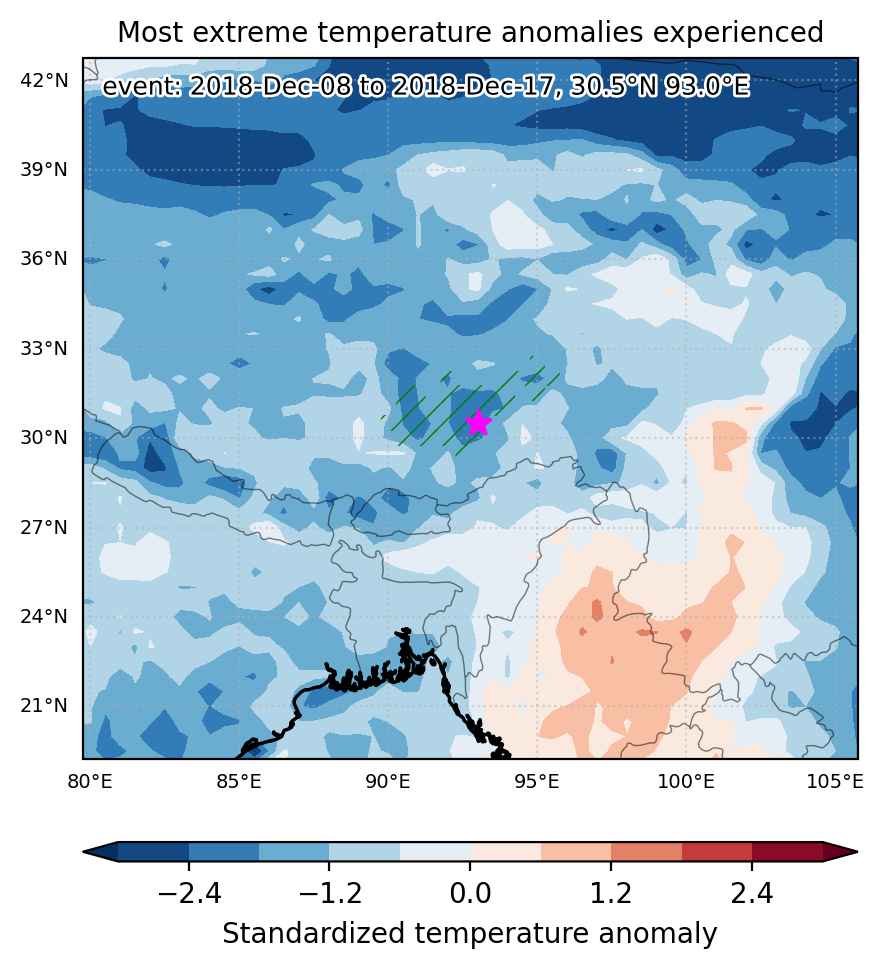
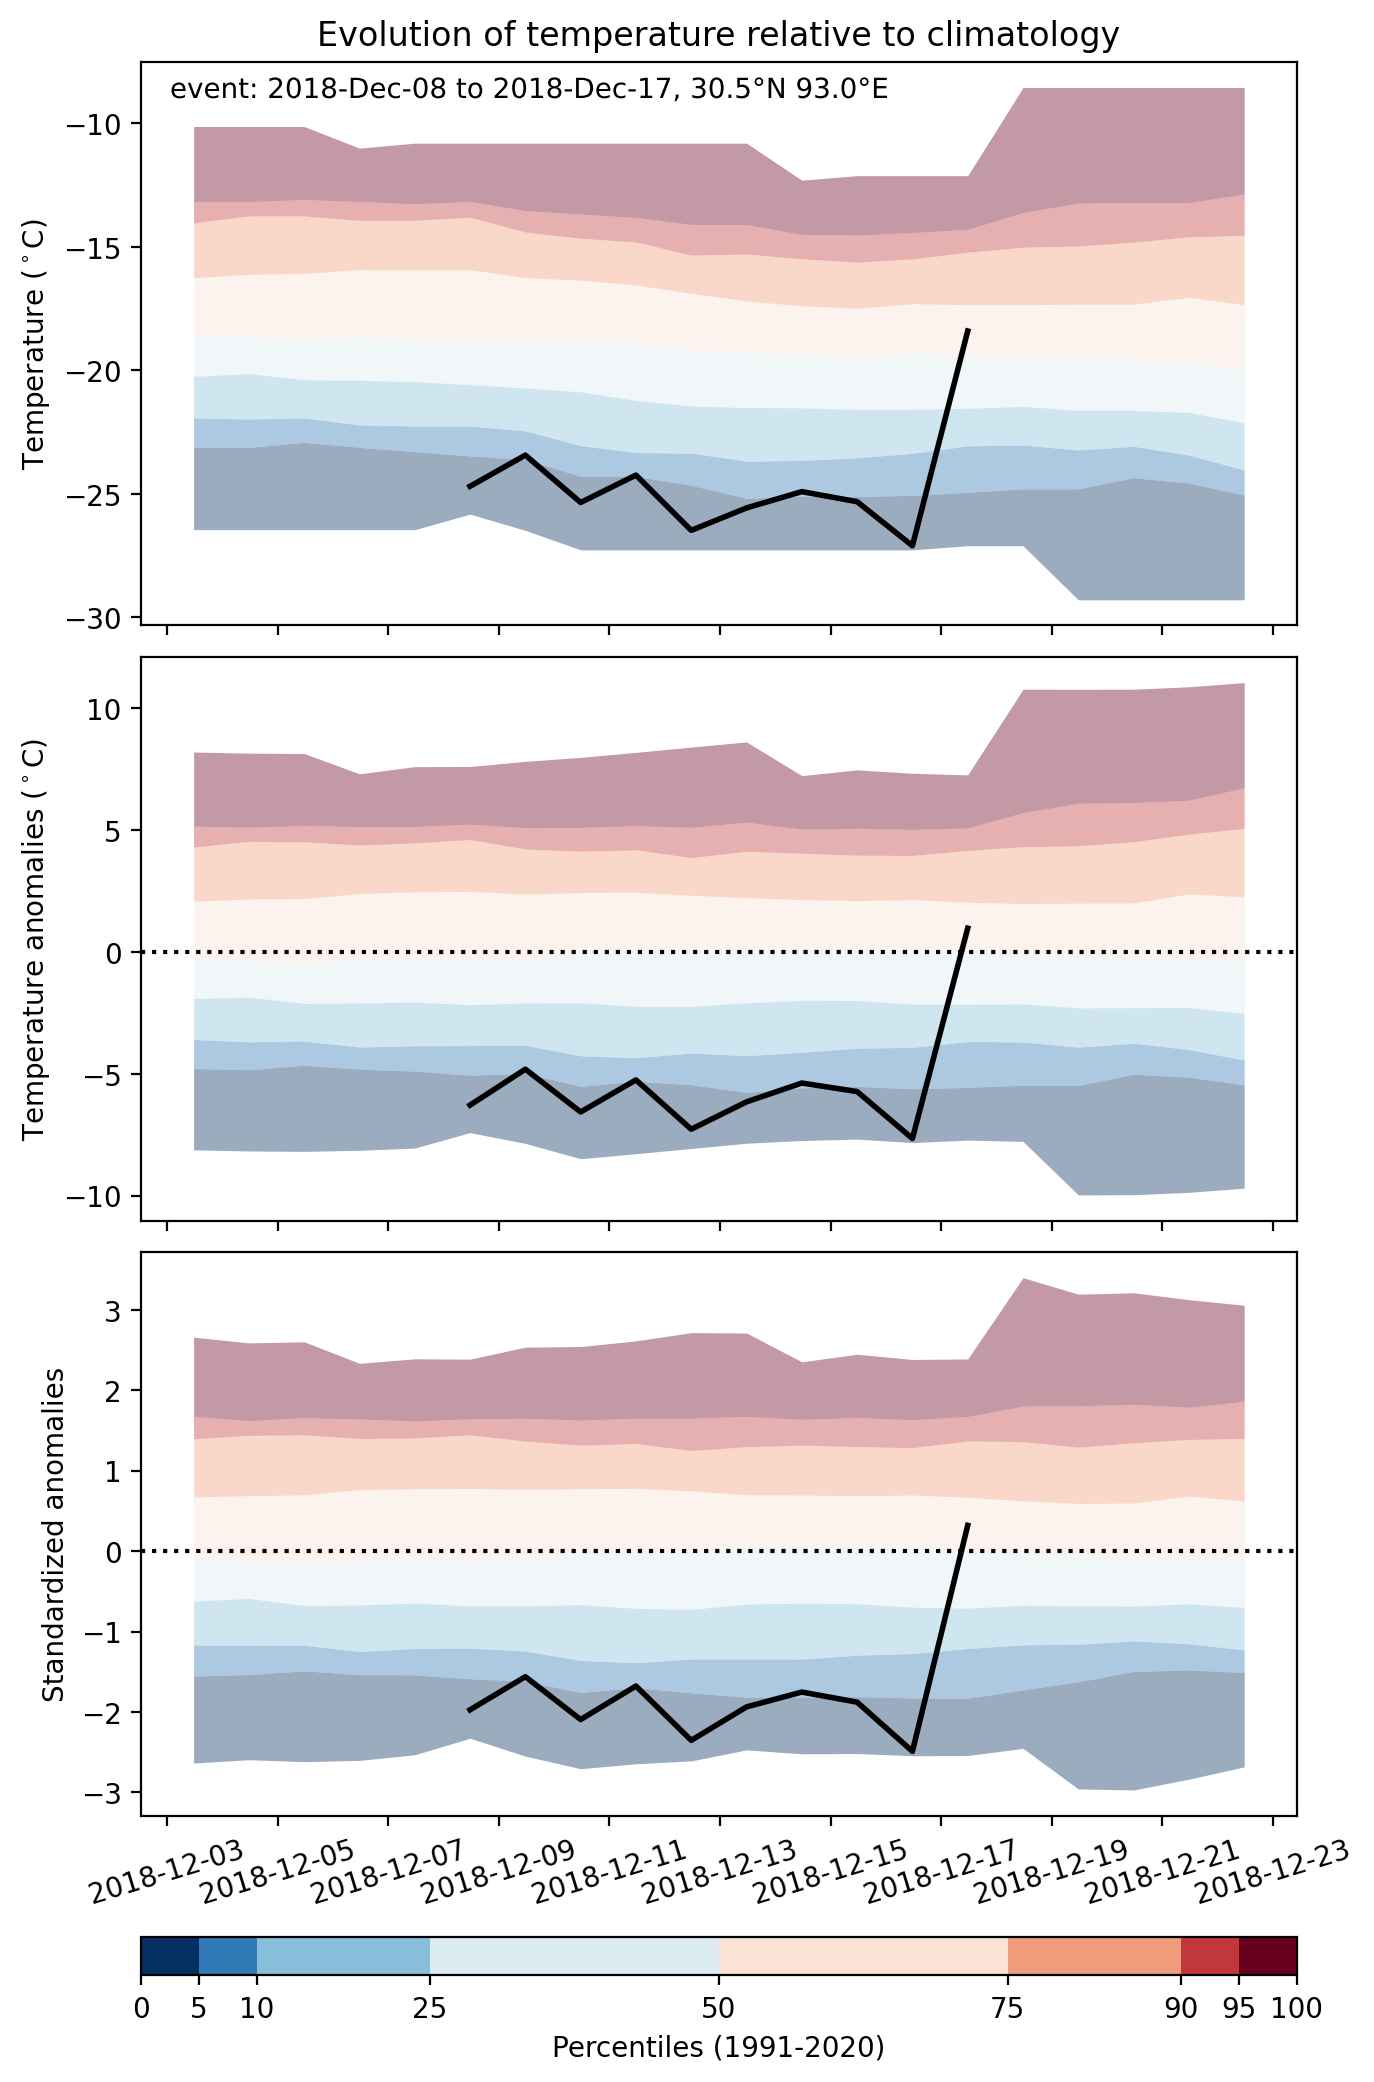
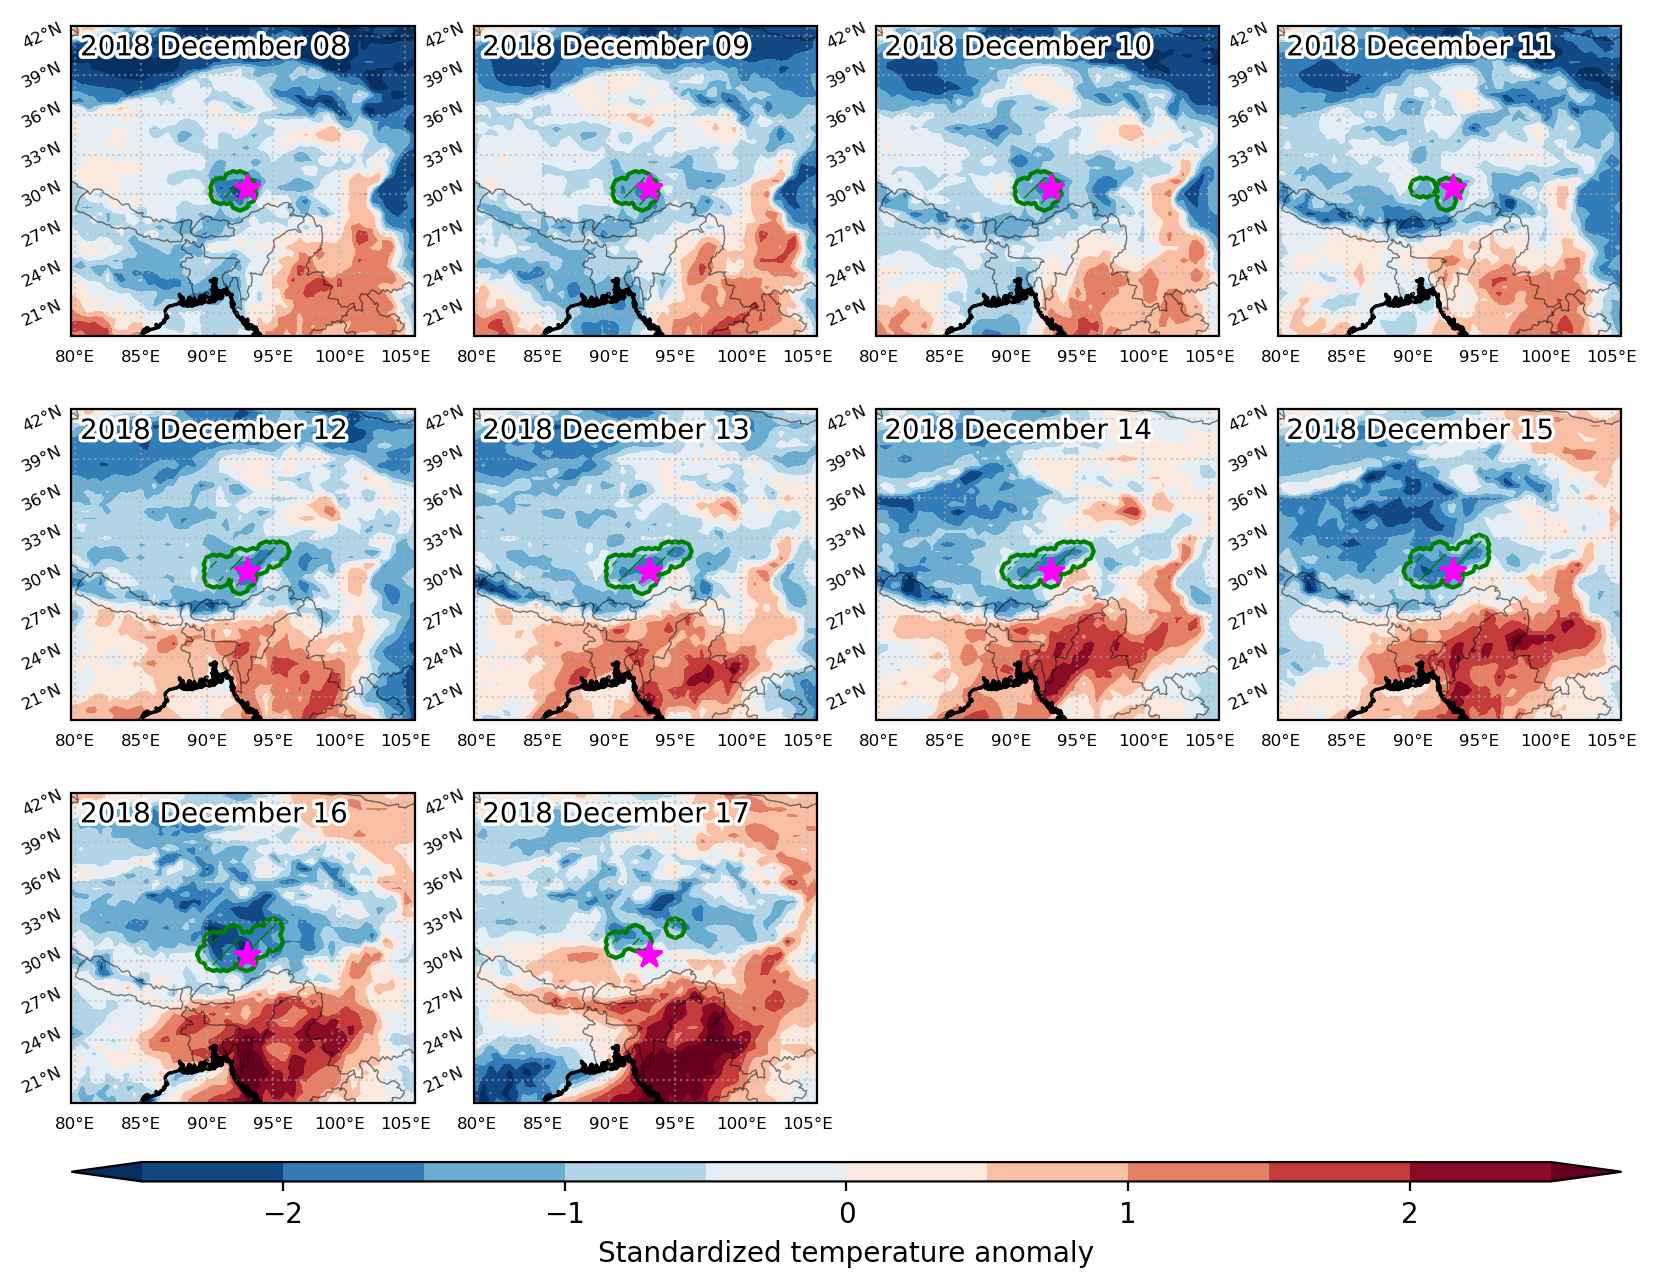
Cold spell occuring from December 08 2018 to December 17 2018 at 30.5°N 93.0°E

Download data: JSON

Event type: Cold spell

Countries affected (identified with ArcGIS Online; provided only for geographical reference):

  • China

Duration: 10 days

Time span: December 08 2018 to December 17 2018

Statistics over entire affected area:

  • Mean temperature anomaly: -6.4 °C
  • Mean temperature: -21.9 °C
  • Minimum temperature anomaly: -11.9 °C
  • Minimum temperature: -28.4 °C

Event center: 30.5°N 93.0°E

Area affected: 95390 km$^2$


Fig. 1: Map of most extreme temperature anomalies (standardized) experienced during the event. The purple star indicates the center of the extreme event. Green hatching illustrates all areas under the effect of extremes at some time during the event.


Fig. 2: Evolution of temperature at the center of the event. The climatological percentile distribution is illustrated with color shadings.


Fig. 3: Maps illustrating the evolution of standardized temperature anomalies during the event.

Event ID: Cold_spell_2018-Dec-08_to_2018-Dec-17_93.0_30.5

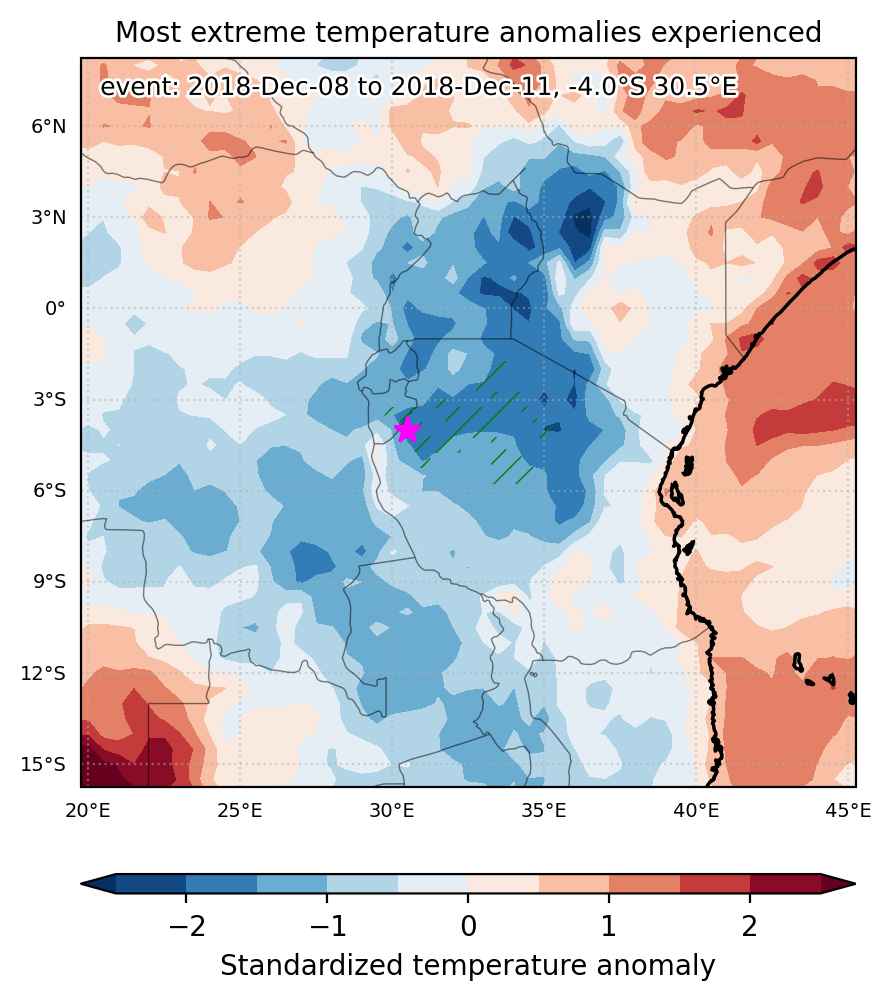
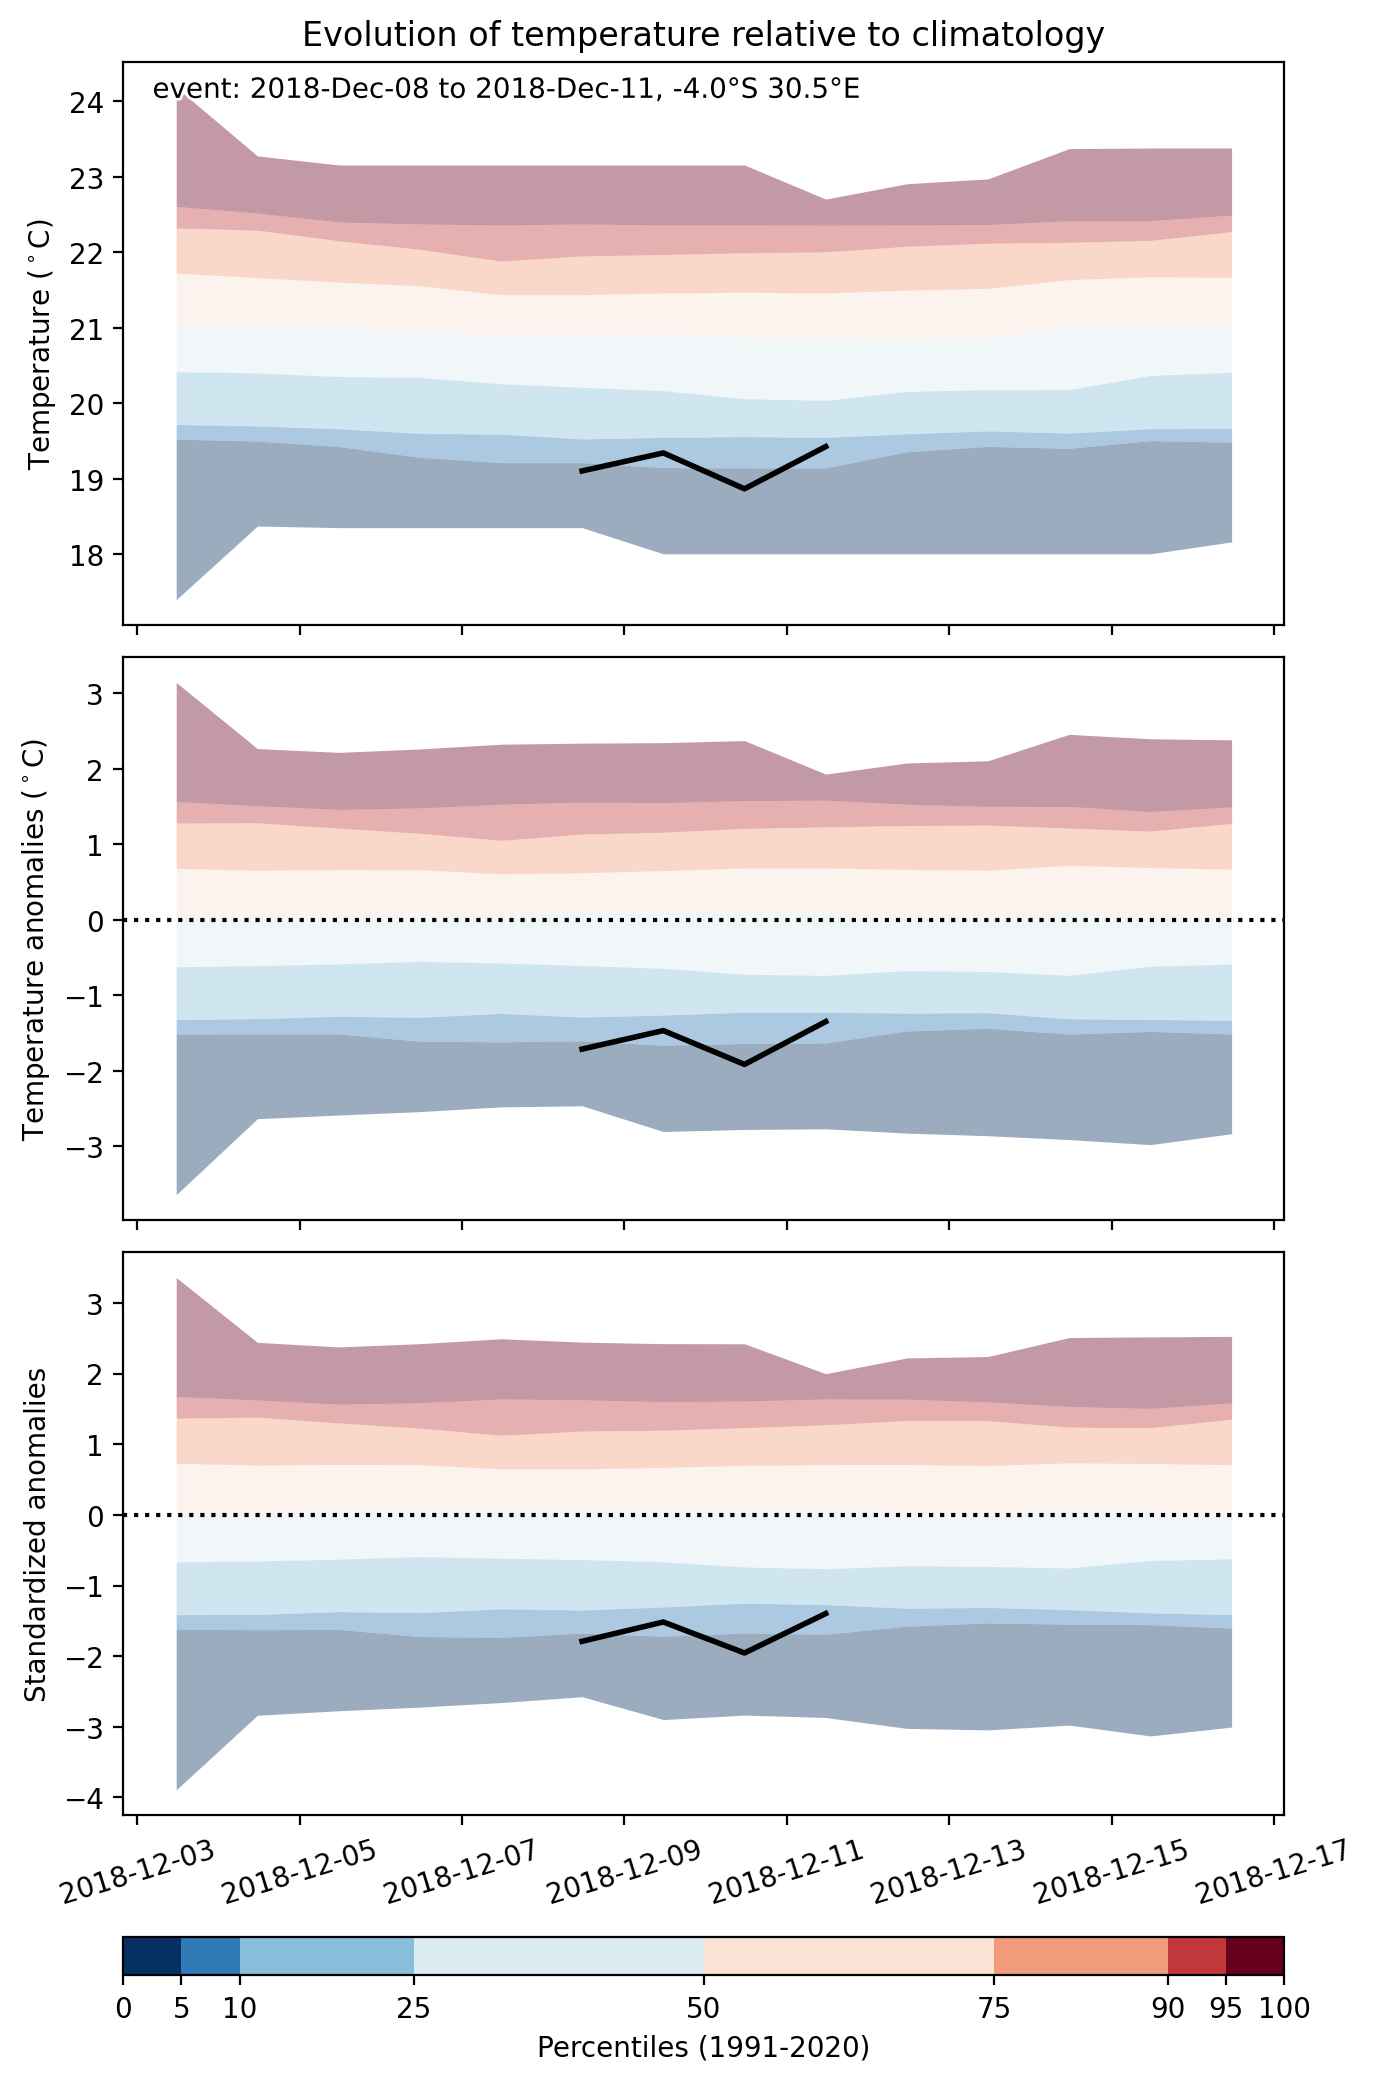
Cold spell occuring from December 08 2018 to December 11 2018 at -4.0°S 30.5°E

Download data: JSON

Event type: Cold spell

Countries affected (identified with ArcGIS Online; provided only for geographical reference):

  • Burundi
  • Tanzania

Duration: 4 days

Time span: December 08 2018 to December 11 2018

Statistics over entire affected area:

  • Mean temperature anomaly: -2.1 °C
  • Mean temperature: 20.2 °C
  • Minimum temperature anomaly: -3.5 °C
  • Minimum temperature: 17.6 °C

Event center: -4.0°S 30.5°E

Area affected: 86331 km$^2$


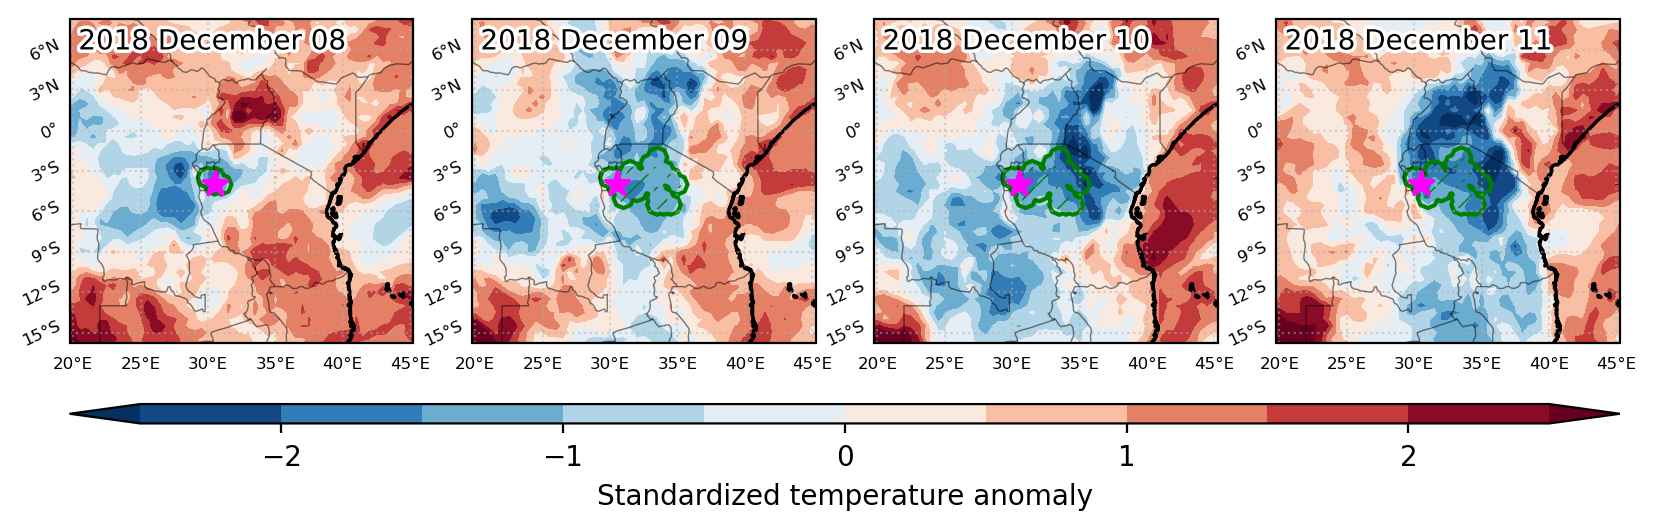
Fig. 1: Map of most extreme temperature anomalies (standardized) experienced during the event. The purple star indicates the center of the extreme event. Green hatching illustrates all areas under the effect of extremes at some time during the event.


Fig. 2: Evolution of temperature at the center of the event. The climatological percentile distribution is illustrated with color shadings.


Fig. 3: Maps illustrating the evolution of standardized temperature anomalies during the event.

Event ID: Cold_spell_2018-Dec-08_to_2018-Dec-11_30.5_-4.0

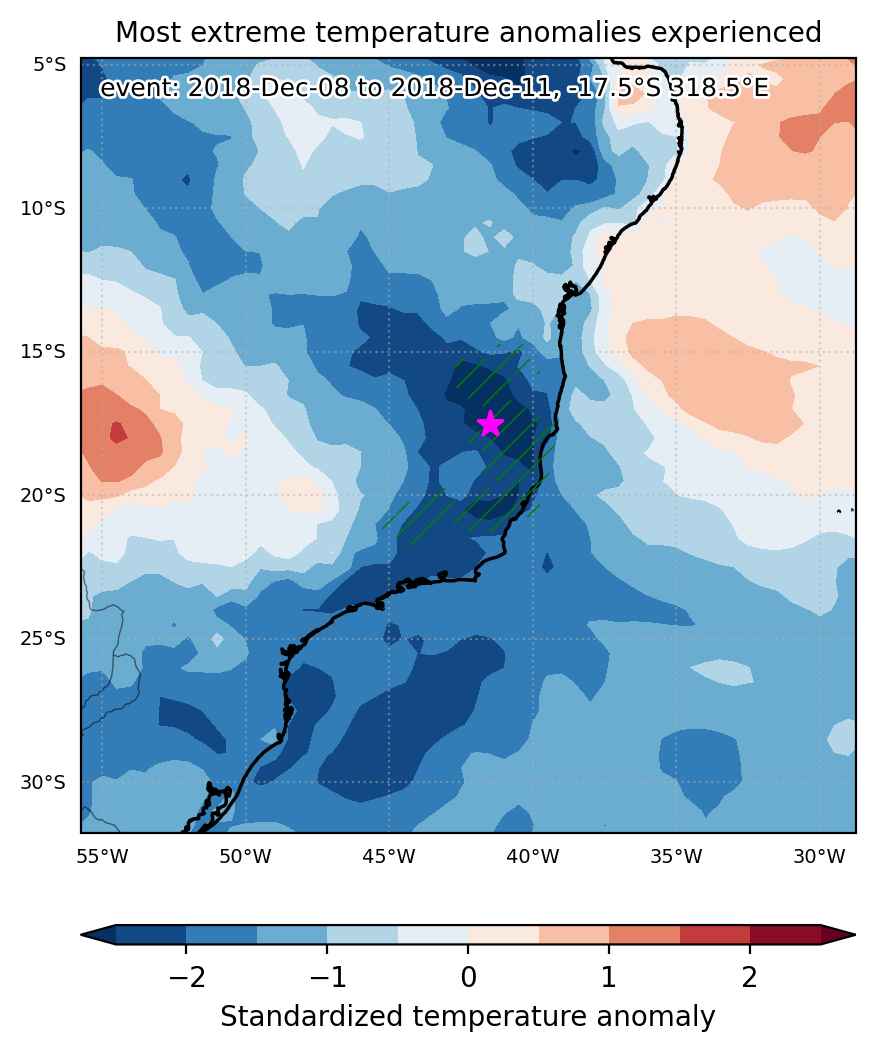
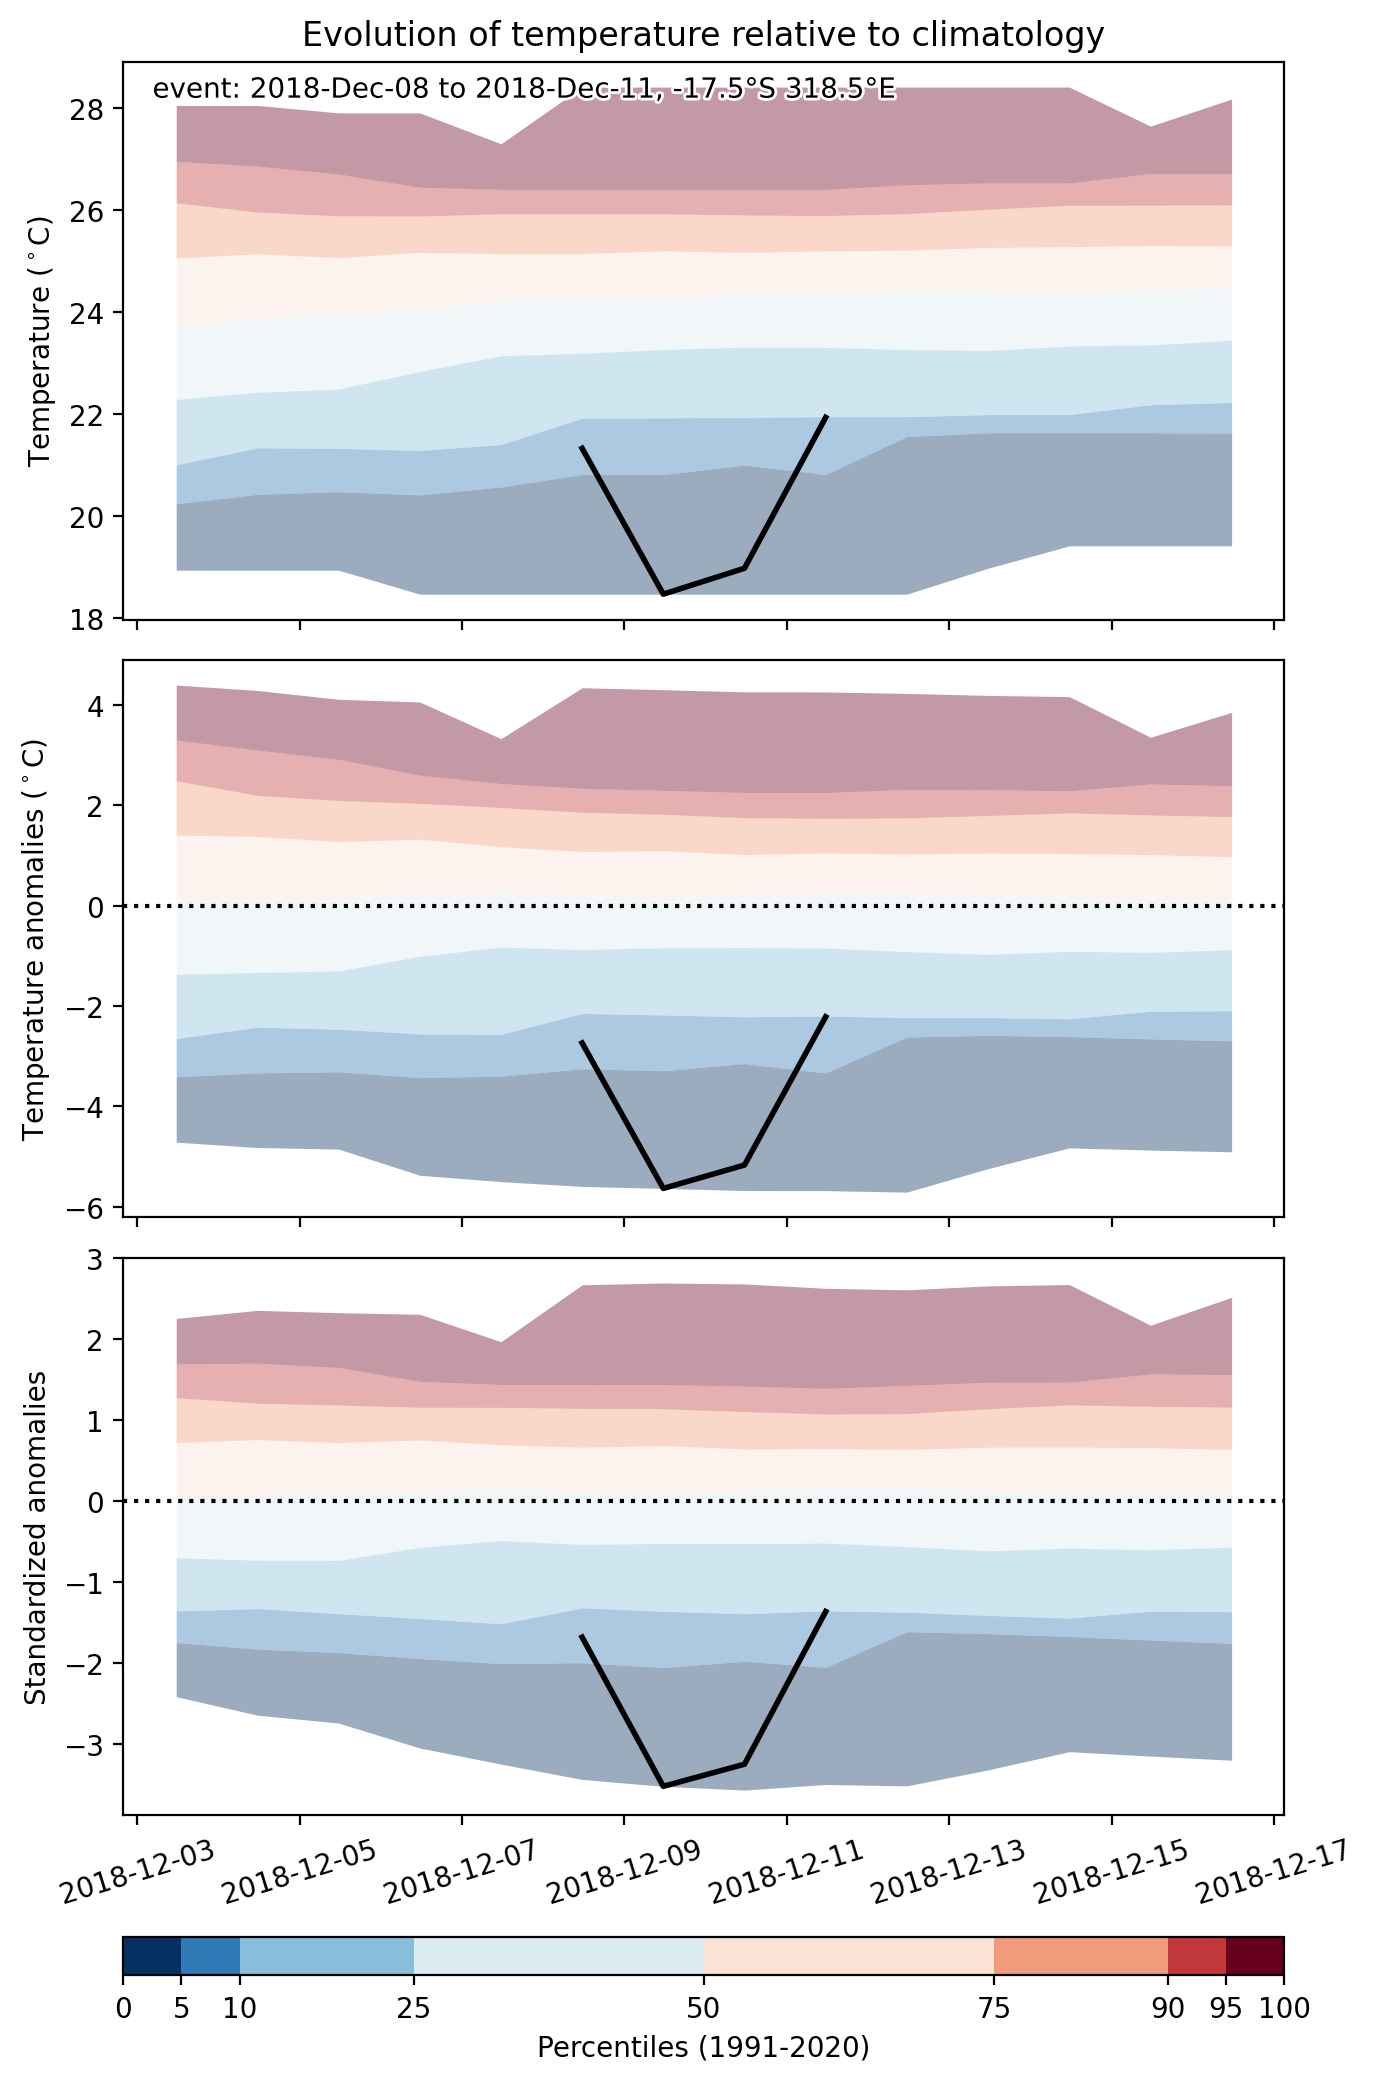
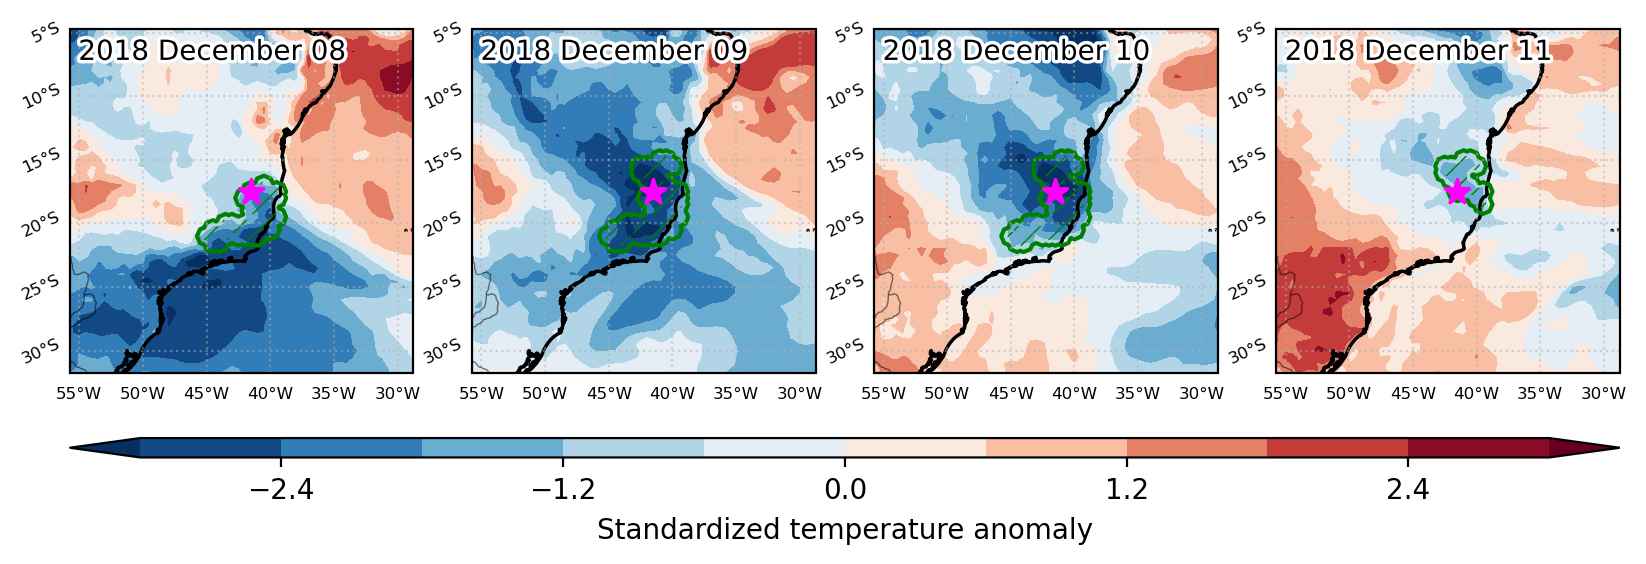
Cold spell occuring from December 08 2018 to December 11 2018 at -17.5°S 318.5°E

Download data: JSON

Event type: Cold spell

Countries affected (identified with ArcGIS Online; provided only for geographical reference):

  • Brazil

Duration: 4 days

Time span: December 08 2018 to December 11 2018

Statistics over entire affected area:

  • Mean temperature anomaly: -3.4 °C
  • Mean temperature: 20.6 °C
  • Minimum temperature anomaly: -6.1 °C
  • Minimum temperature: 16.0 °C

Event center: -17.5°S 318.5°E

Area affected: 201993 km$^2$


Fig. 1: Map of most extreme temperature anomalies (standardized) experienced during the event. The purple star indicates the center of the extreme event. Green hatching illustrates all areas under the effect of extremes at some time during the event.


Fig. 2: Evolution of temperature at the center of the event. The climatological percentile distribution is illustrated with color shadings.


Fig. 3: Maps illustrating the evolution of standardized temperature anomalies during the event.

Event ID: Cold_spell_2018-Dec-08_to_2018-Dec-11_318.5_-17.5

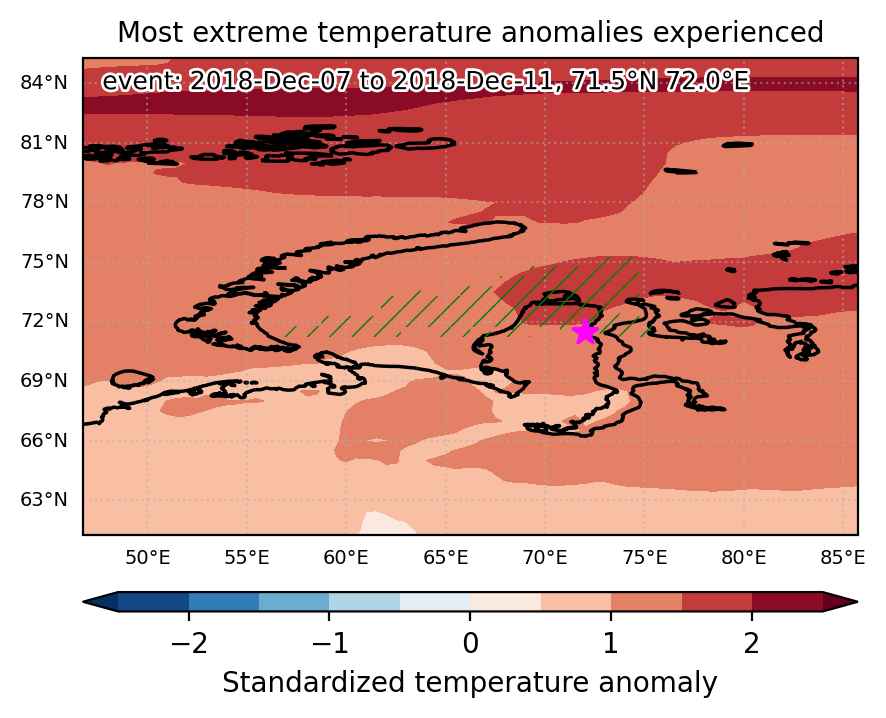
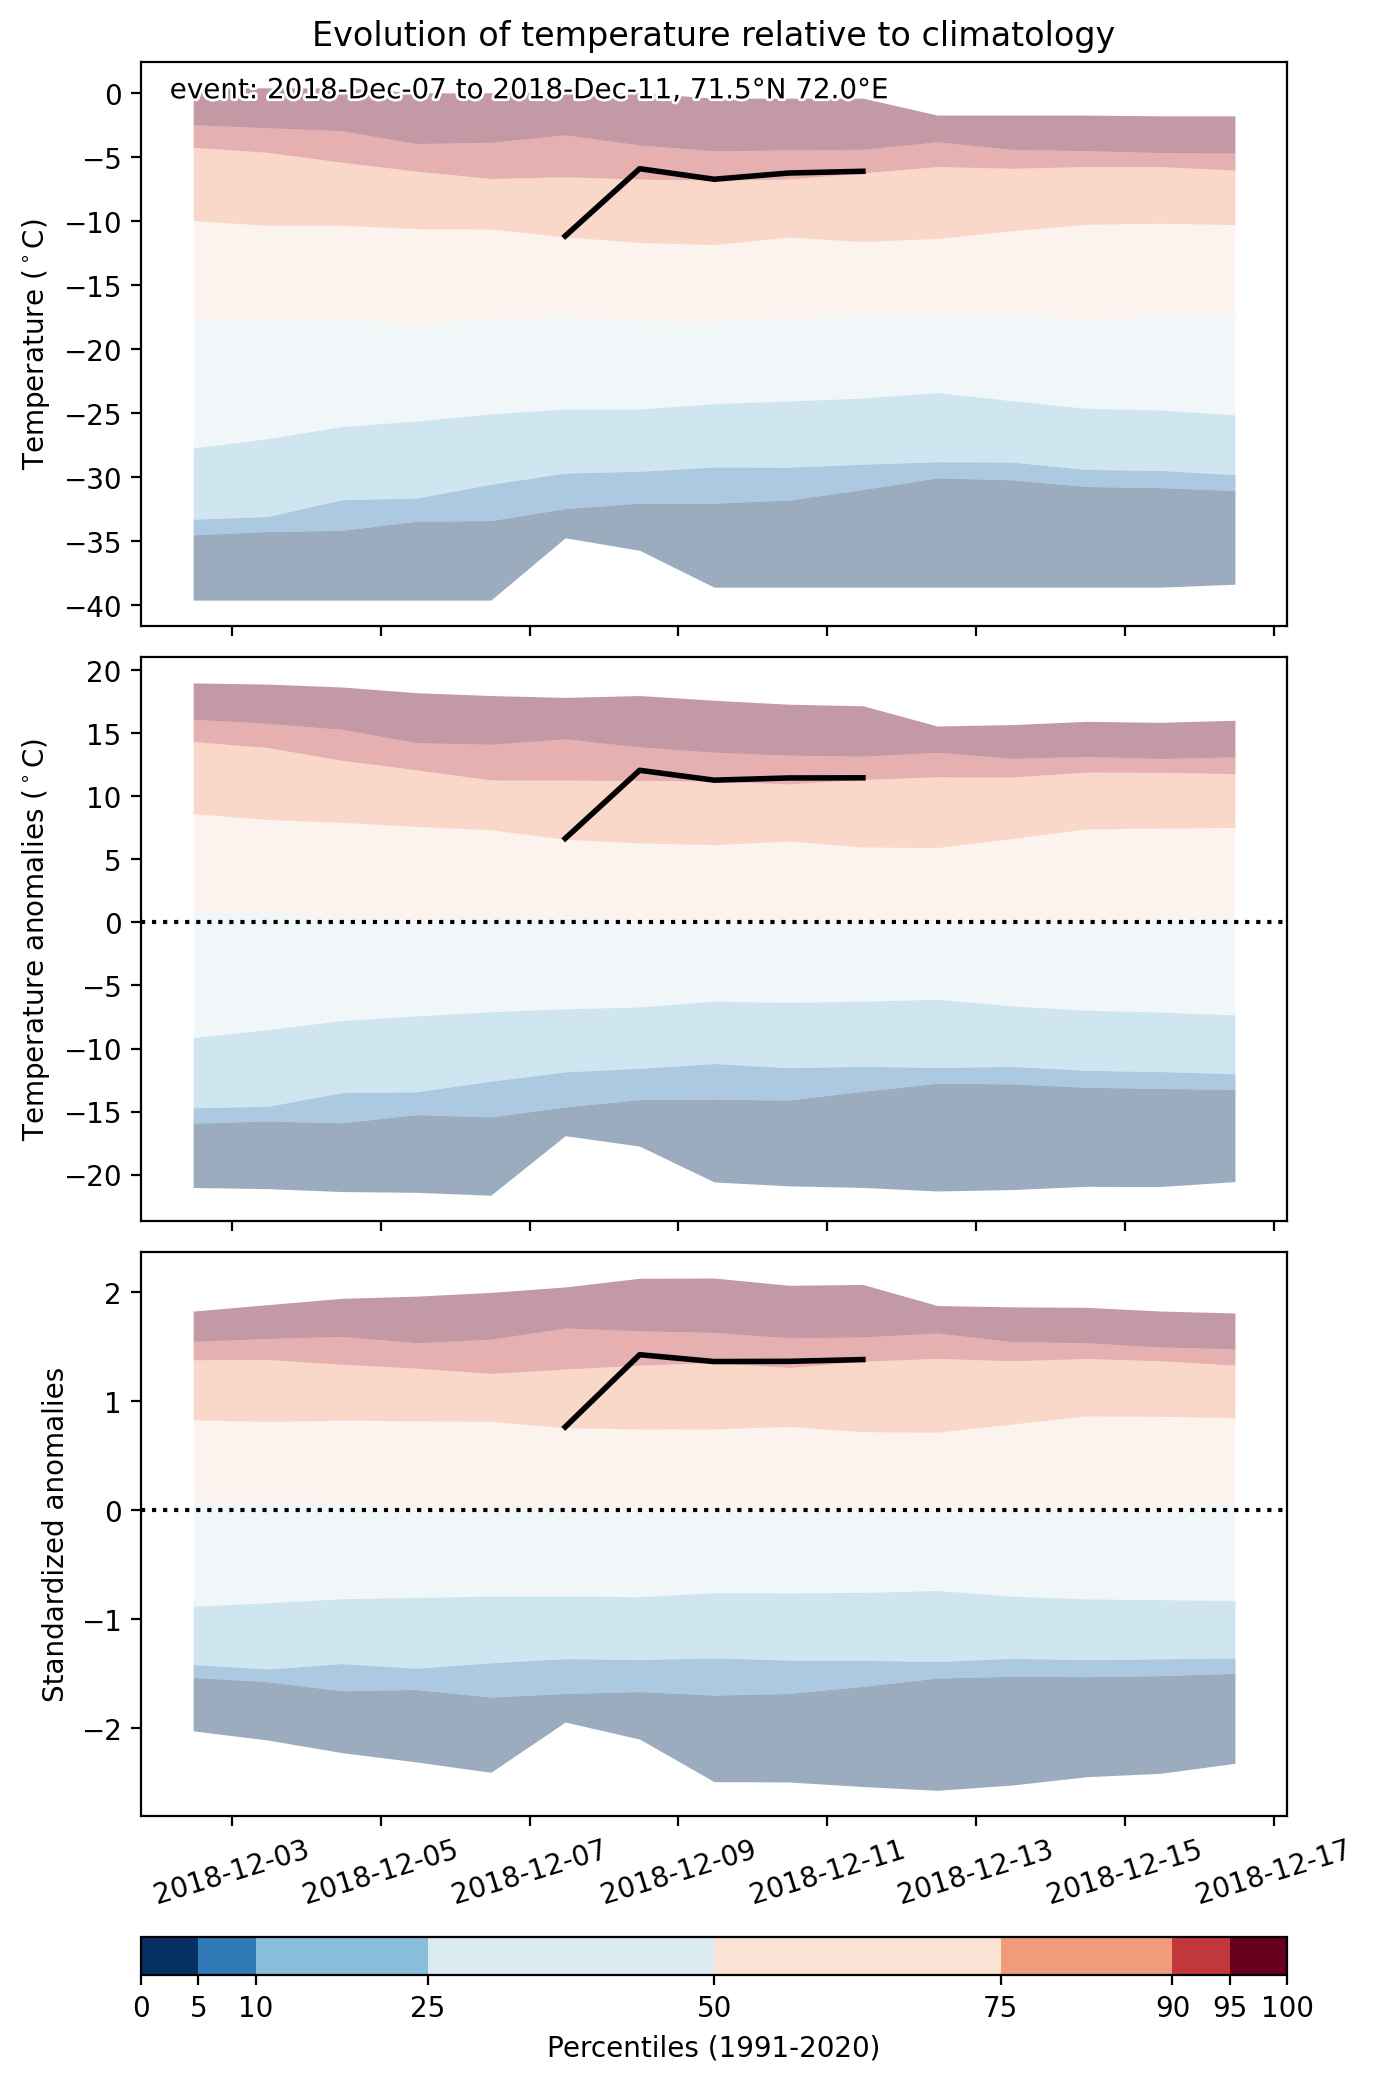
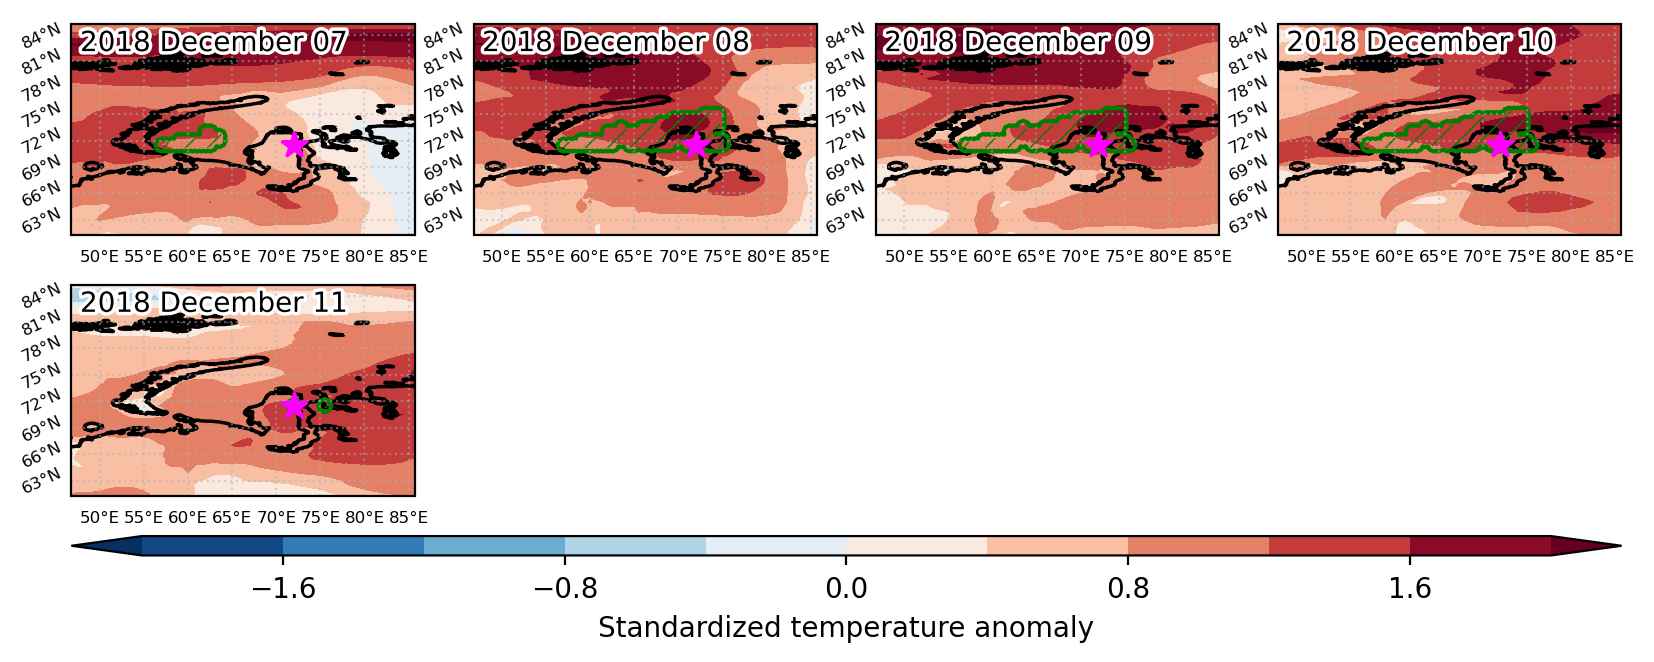
Heat wave occuring from December 07 2018 to December 11 2018 at 71.5°N 72.0°E

Download data: JSON

Event type: Heat wave

Countries affected (identified with ArcGIS Online; provided only for geographical reference):

  • Russian Federation

Duration: 5 days

Time span: December 07 2018 to December 11 2018

Statistics over entire affected area:

  • Mean temperature anomaly: 10.1 °C
  • Mean temperature: -3.3 °C
  • Maximum temperature anomaly: 15.2 °C
  • Maximum temperature: -0.1 °C

Event center: 71.5°N 72.0°E

Area affected: 142896 km$^2$


Fig. 1: Map of most extreme temperature anomalies (standardized) experienced during the event. The purple star indicates the center of the extreme event. Green hatching illustrates all areas under the effect of extremes at some time during the event.


Fig. 2: Evolution of temperature at the center of the event. The climatological percentile distribution is illustrated with color shadings.


Fig. 3: Maps illustrating the evolution of standardized temperature anomalies during the event.

Event ID: Heat_wave_2018-Dec-07_to_2018-Dec-11_72.0_71.5

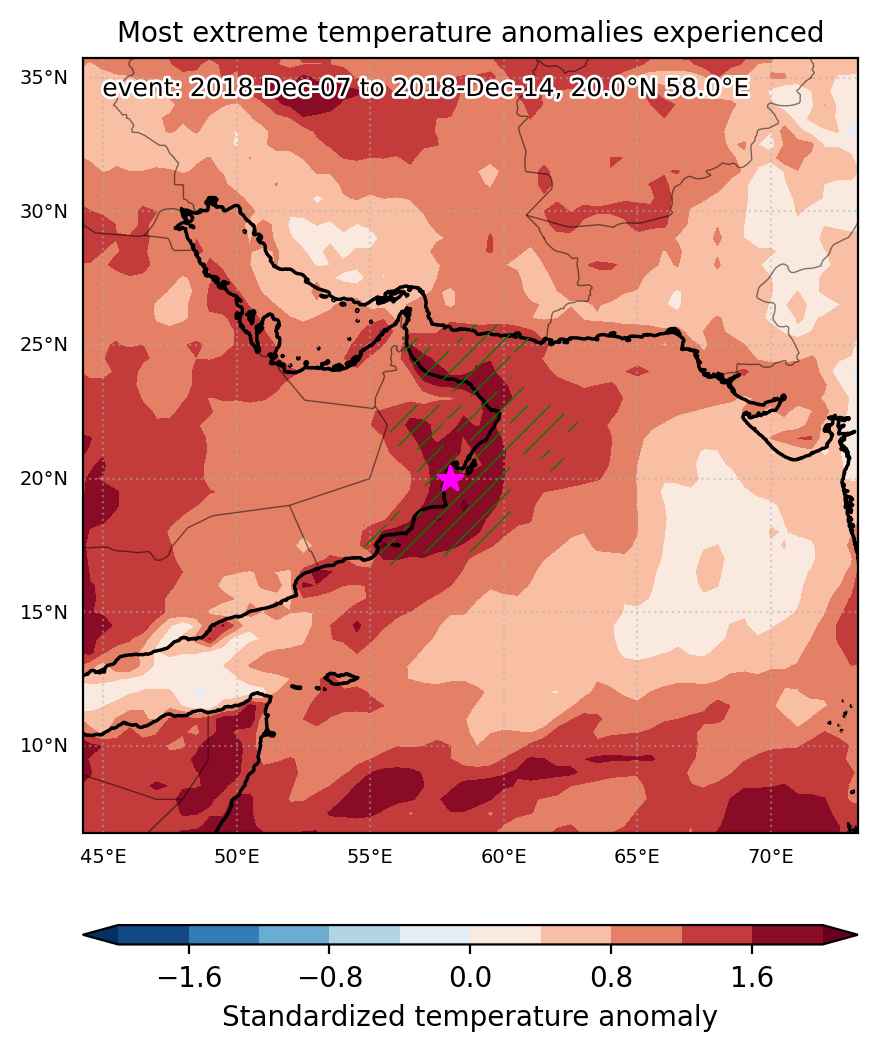
Heat wave occuring from December 07 2018 to December 14 2018 at 20.0°N 58.0°E

Download data: JSON

Event type: Heat wave

Countries affected (identified with ArcGIS Online; provided only for geographical reference):

  • Iran
  • Oman

Duration: 8 days

Time span: December 07 2018 to December 14 2018

Statistics over entire affected area:

  • Mean temperature anomaly: 1.7 °C
  • Mean temperature: 25.4 °C
  • Maximum temperature anomaly: 3.6 °C
  • Maximum temperature: 26.7 °C

Event center: 20.0°N 58.0°E

Area affected: 374189 km$^2$


Fig. 1: Map of most extreme temperature anomalies (standardized) experienced during the event. The purple star indicates the center of the extreme event. Green hatching illustrates all areas under the effect of extremes at some time during the event.


Fig. 2: Evolution of temperature at the center of the event. The climatological percentile distribution is illustrated with color shadings.


Fig. 3: Maps illustrating the evolution of standardized temperature anomalies during the event.

Event ID: Heat_wave_2018-Dec-07_to_2018-Dec-14_58.0_20.0