Cold spell occuring from January 09 2019 to January 12 2019 at -29.5°S 303.0°E

Download data: JSON

Event type: Cold spell

Countries affected (identified with ArcGIS Online; provided only for geographical reference):

  • Argentina
  • Brazil
  • Uruguay

Duration: 4 days

Time span: January 09 2019 to January 12 2019

Statistics over entire affected area:

  • Mean temperature anomaly: -3.9 °C
  • Mean temperature: 21.9 °C
  • Minimum temperature anomaly: -5.9 °C
  • Minimum temperature: 20.4 °C

Event center: -29.5°S 303.0°E

Area affected: 64010 km$^2$
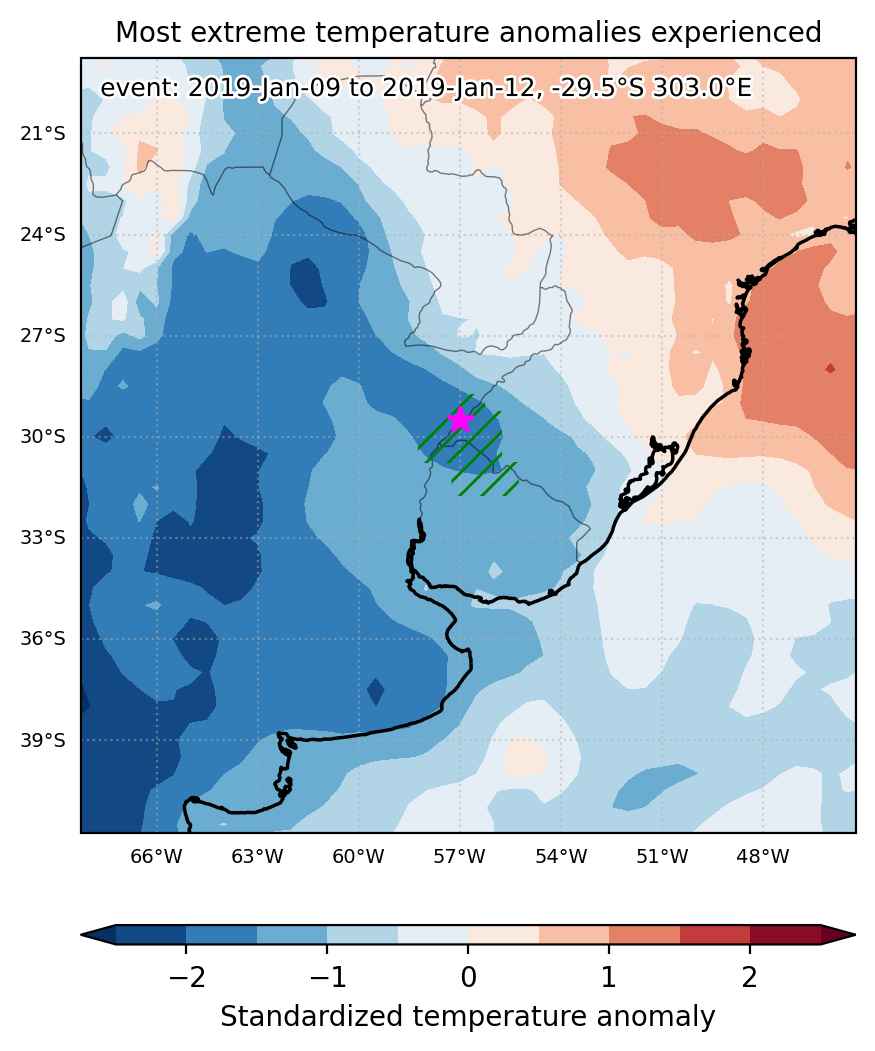

Fig. 1: Map of most extreme temperature anomalies (standardized) experienced during the event. The purple star indicates the center of the extreme event. Green hatching illustrates all areas under the effect of extremes at some time during the event.
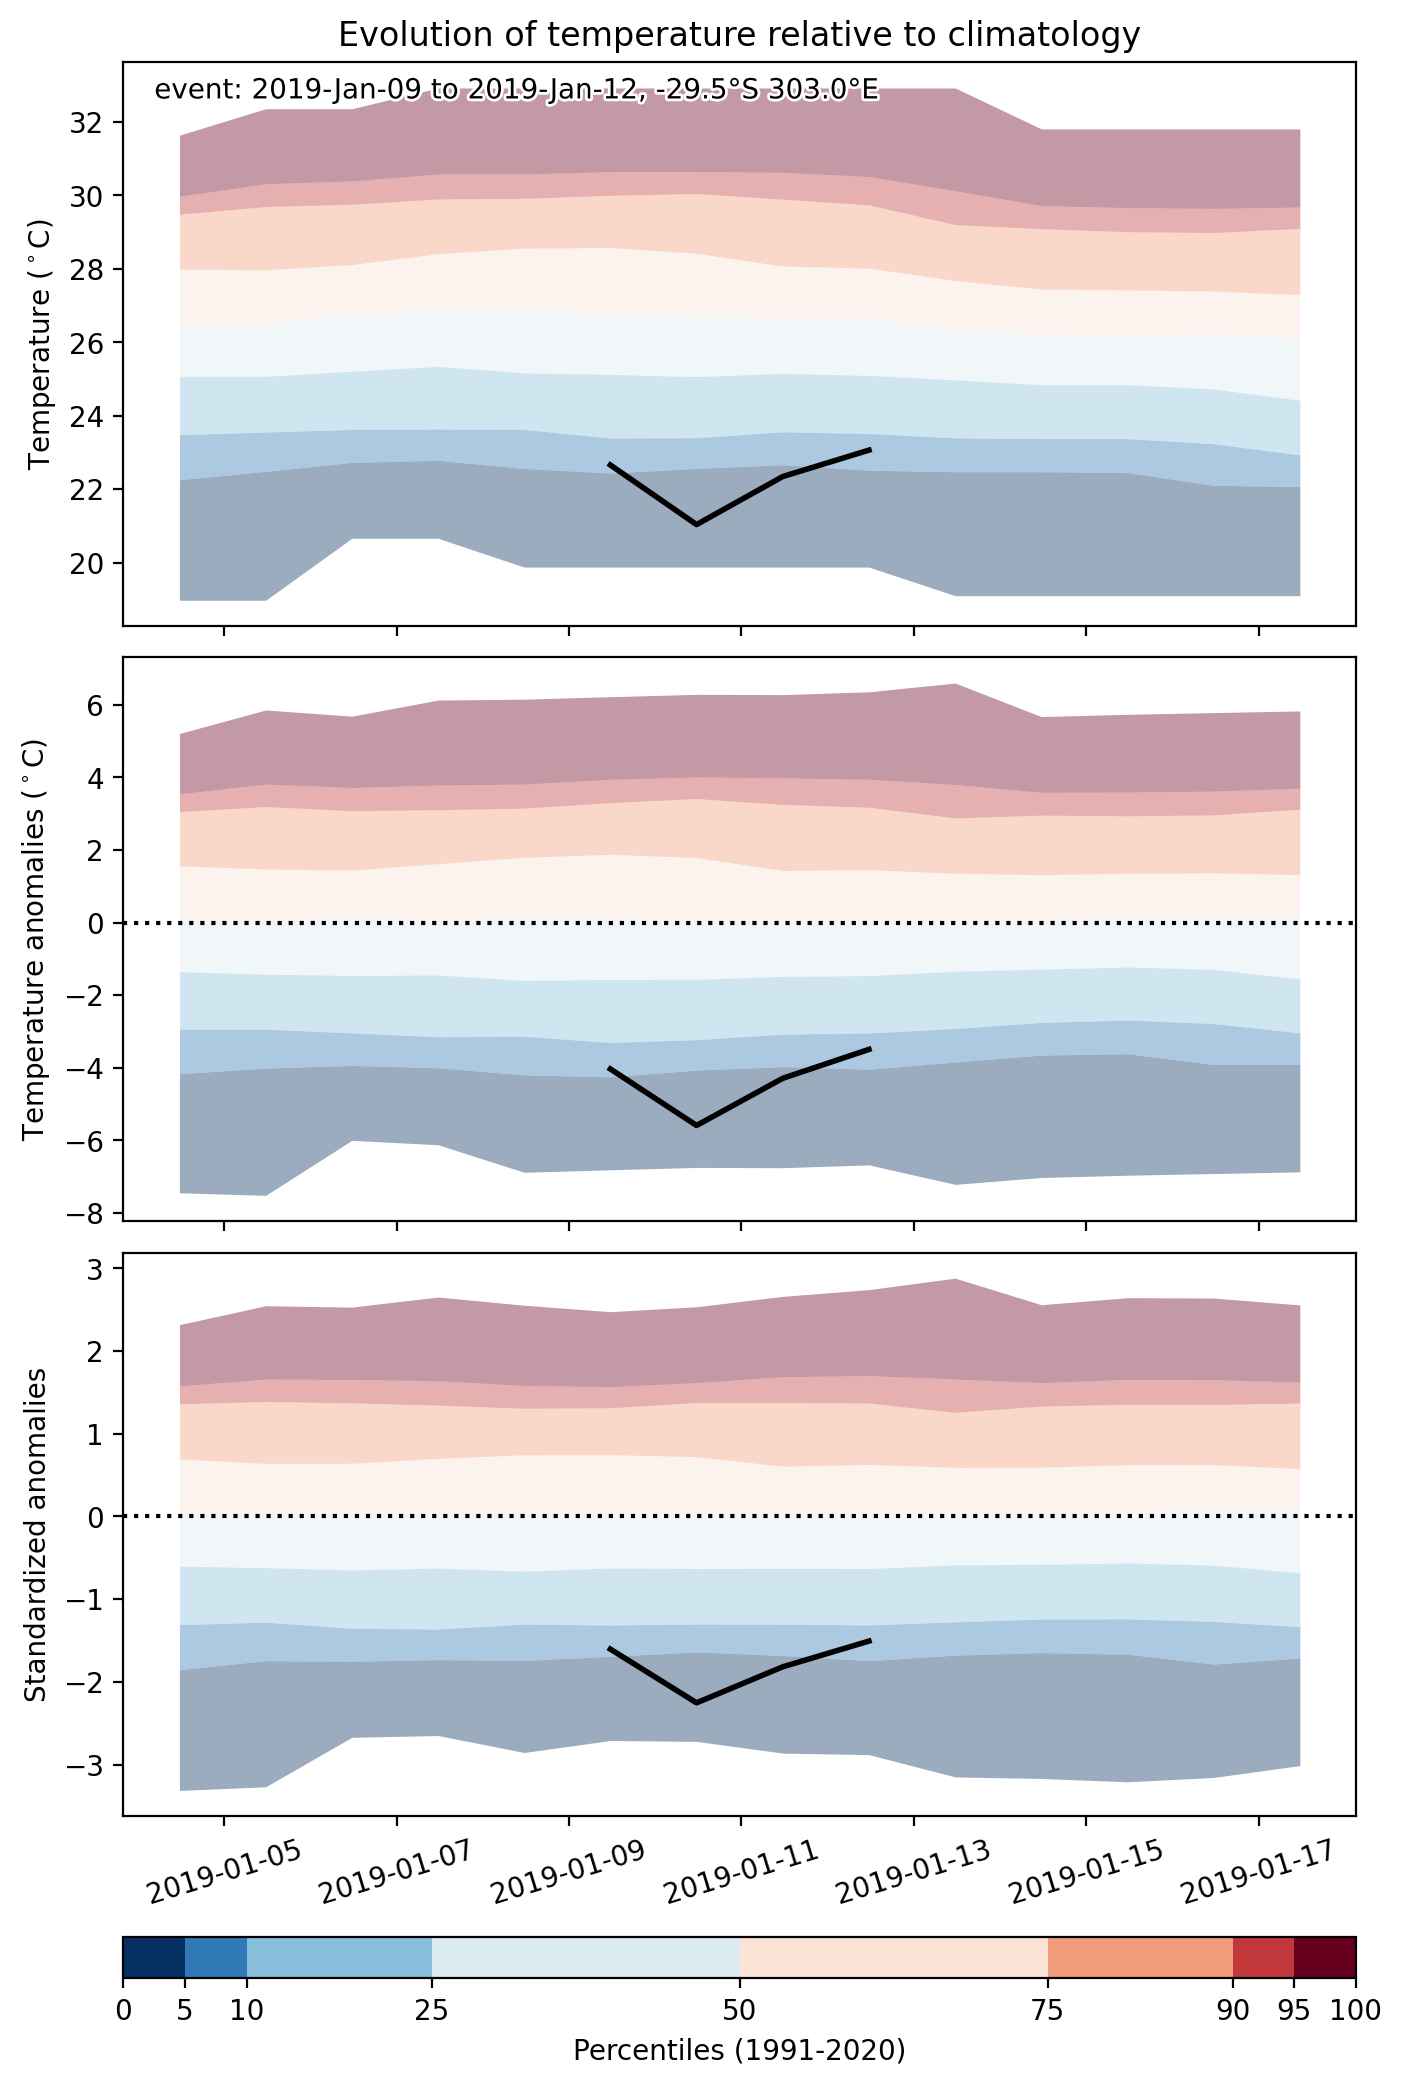


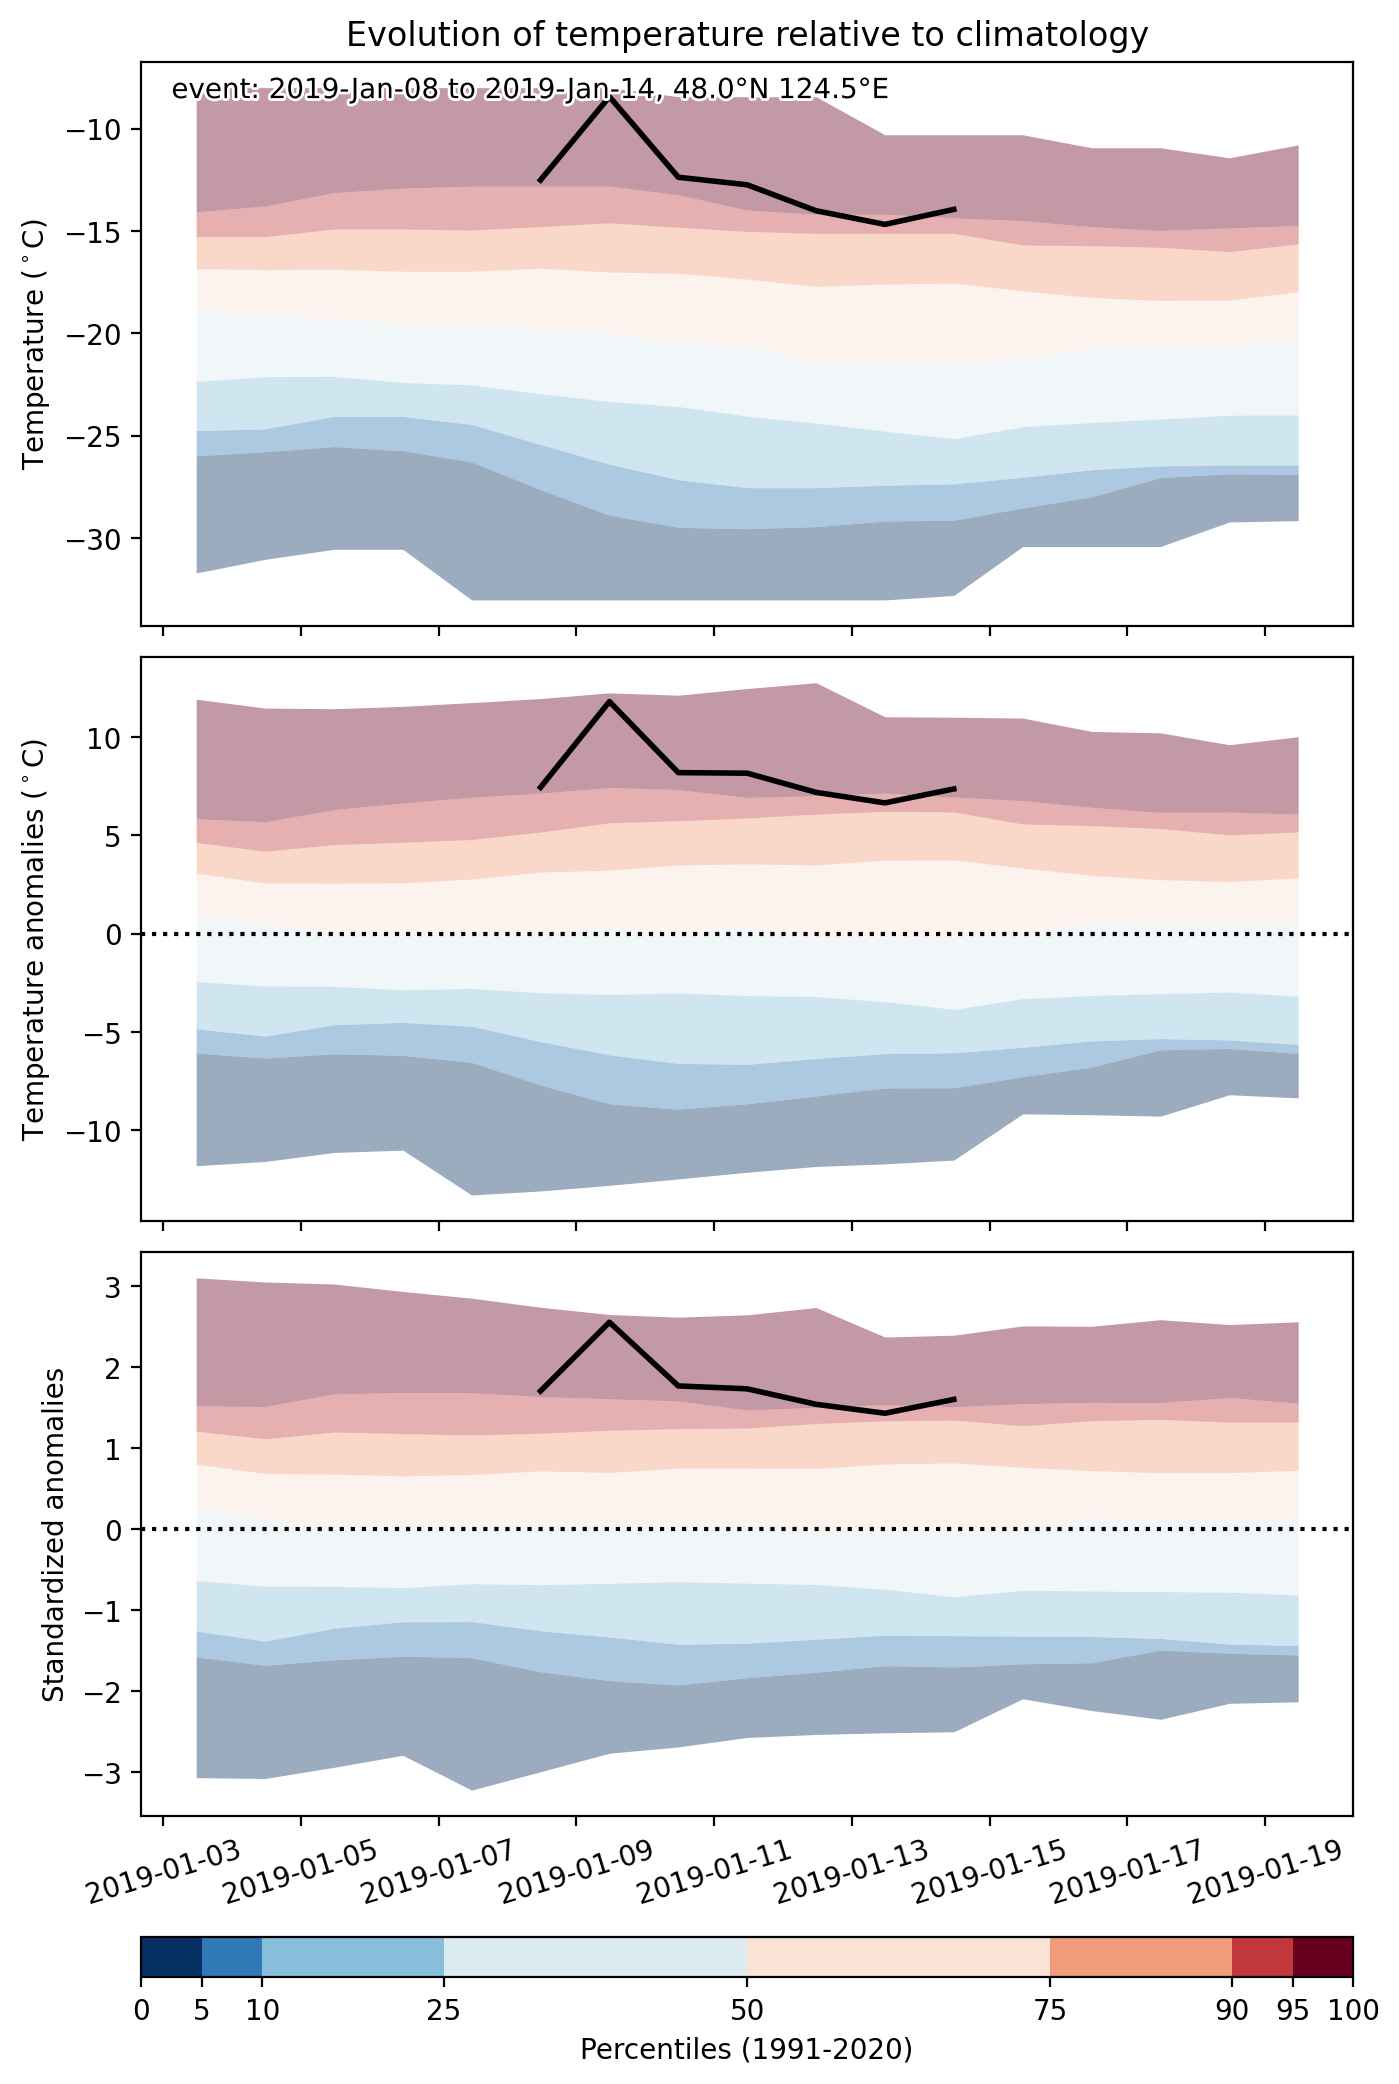
Fig. 2: Evolution of temperature at the center of the event. The climatological percentile distribution is illustrated with color shadings.
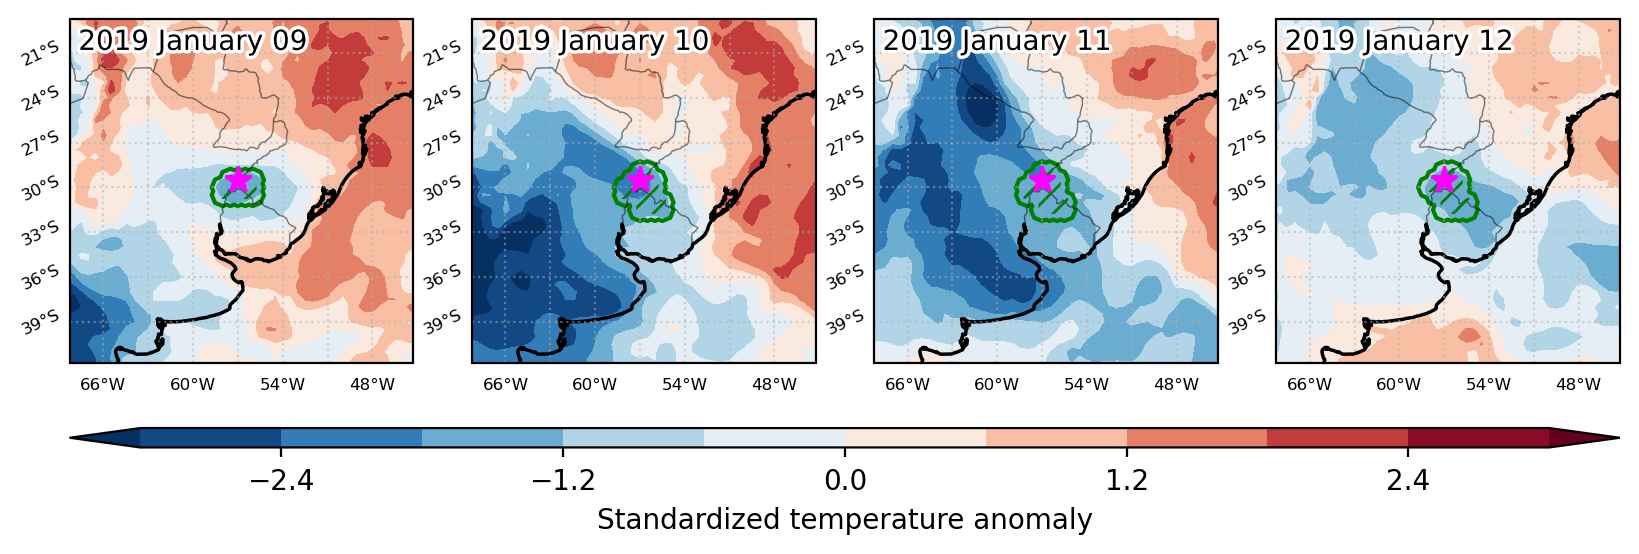


Fig. 3: Maps illustrating the evolution of standardized temperature anomalies during the event.

Event ID: Cold_spell_2019-Jan-09_to_2019-Jan-12_303.0_-29.5
Heat wave occuring from January 08 2019 to January 14 2019 at 48.0°N 124.5°E

Download data: JSON

Event type: Heat wave

Countries affected (identified with ArcGIS Online; provided only for geographical reference):

  • China
  • North Korea
  • Russian Federation

Duration: 7 days

Time span: January 08 2019 to January 14 2019

Statistics over entire affected area:

  • Mean temperature anomaly: 7.6 °C
  • Mean temperature: -9.6 °C
  • Maximum temperature anomaly: 11.8 °C
  • Maximum temperature: 5.0 °C

Event center: 48.0°N 124.5°E

Area affected: 568172 km$^2$


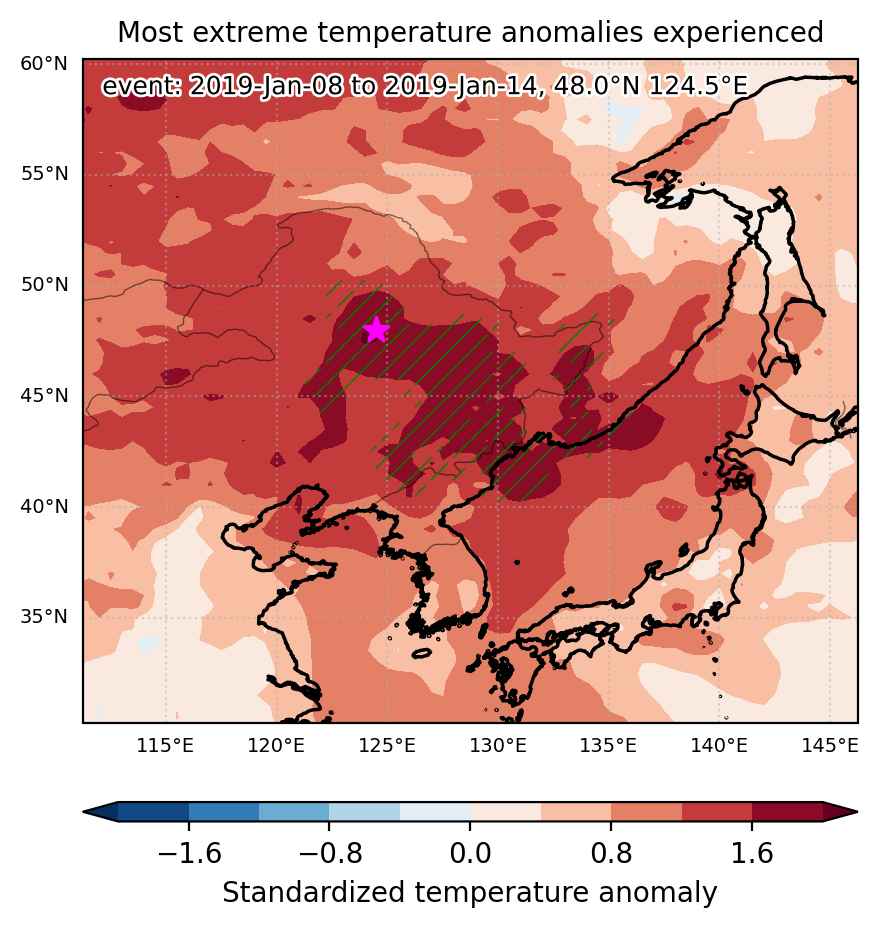
Fig. 1: Map of most extreme temperature anomalies (standardized) experienced during the event. The purple star indicates the center of the extreme event. Green hatching illustrates all areas under the effect of extremes at some time during the event.


Fig. 2: Evolution of temperature at the center of the event. The climatological percentile distribution is illustrated with color shadings.


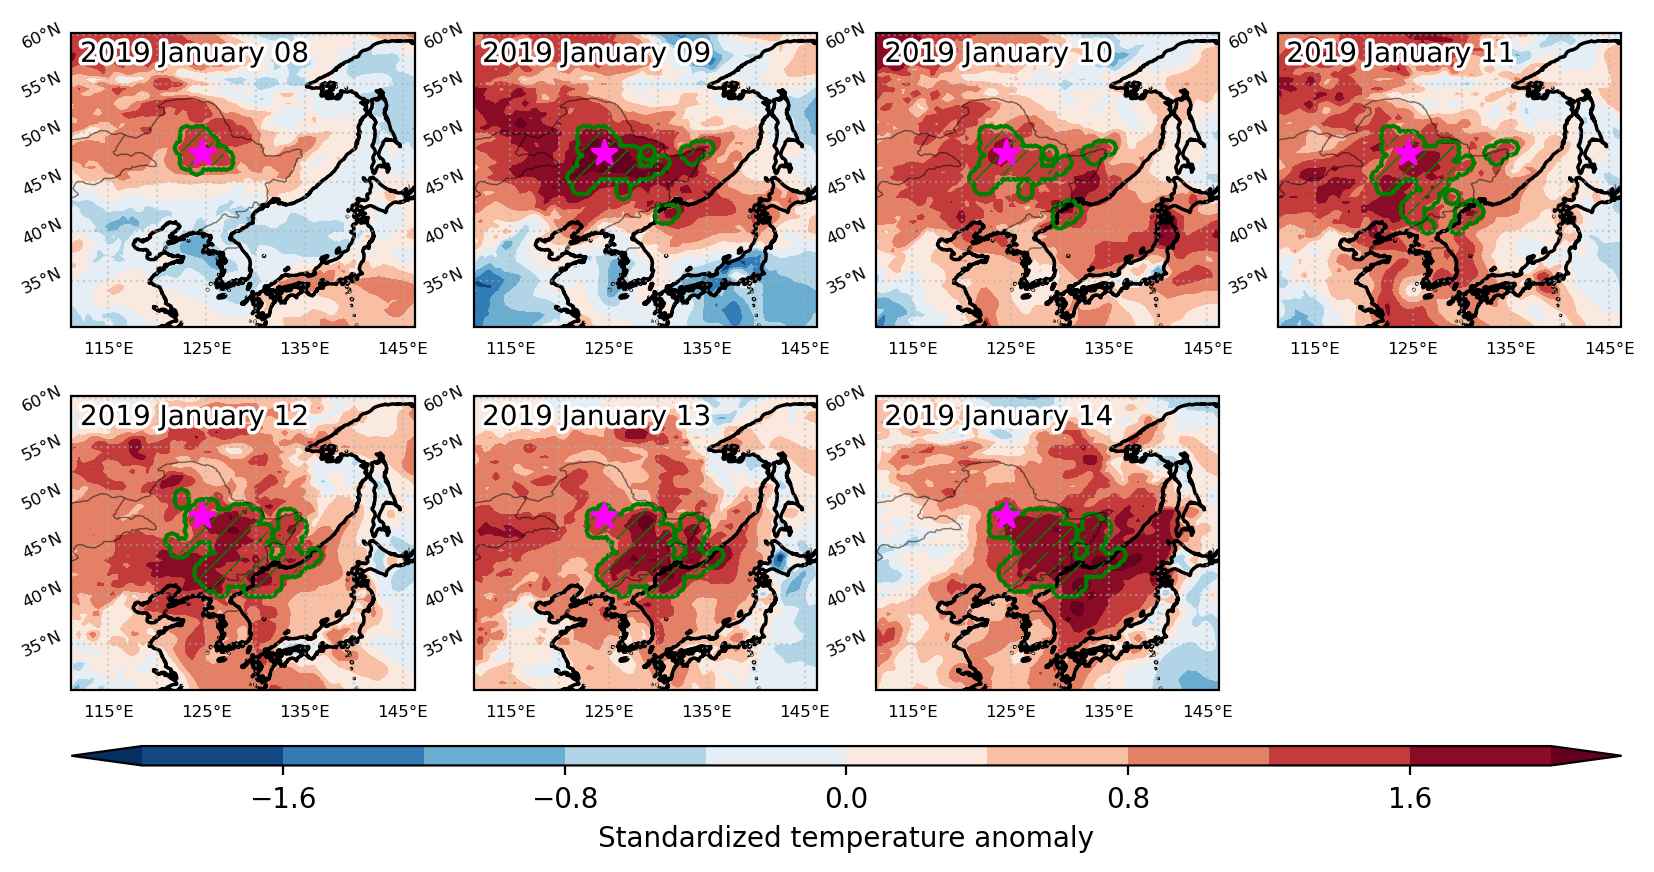
Fig. 3: Maps illustrating the evolution of standardized temperature anomalies during the event.

Event ID: Heat_wave_2019-Jan-08_to_2019-Jan-14_124.5_48.0

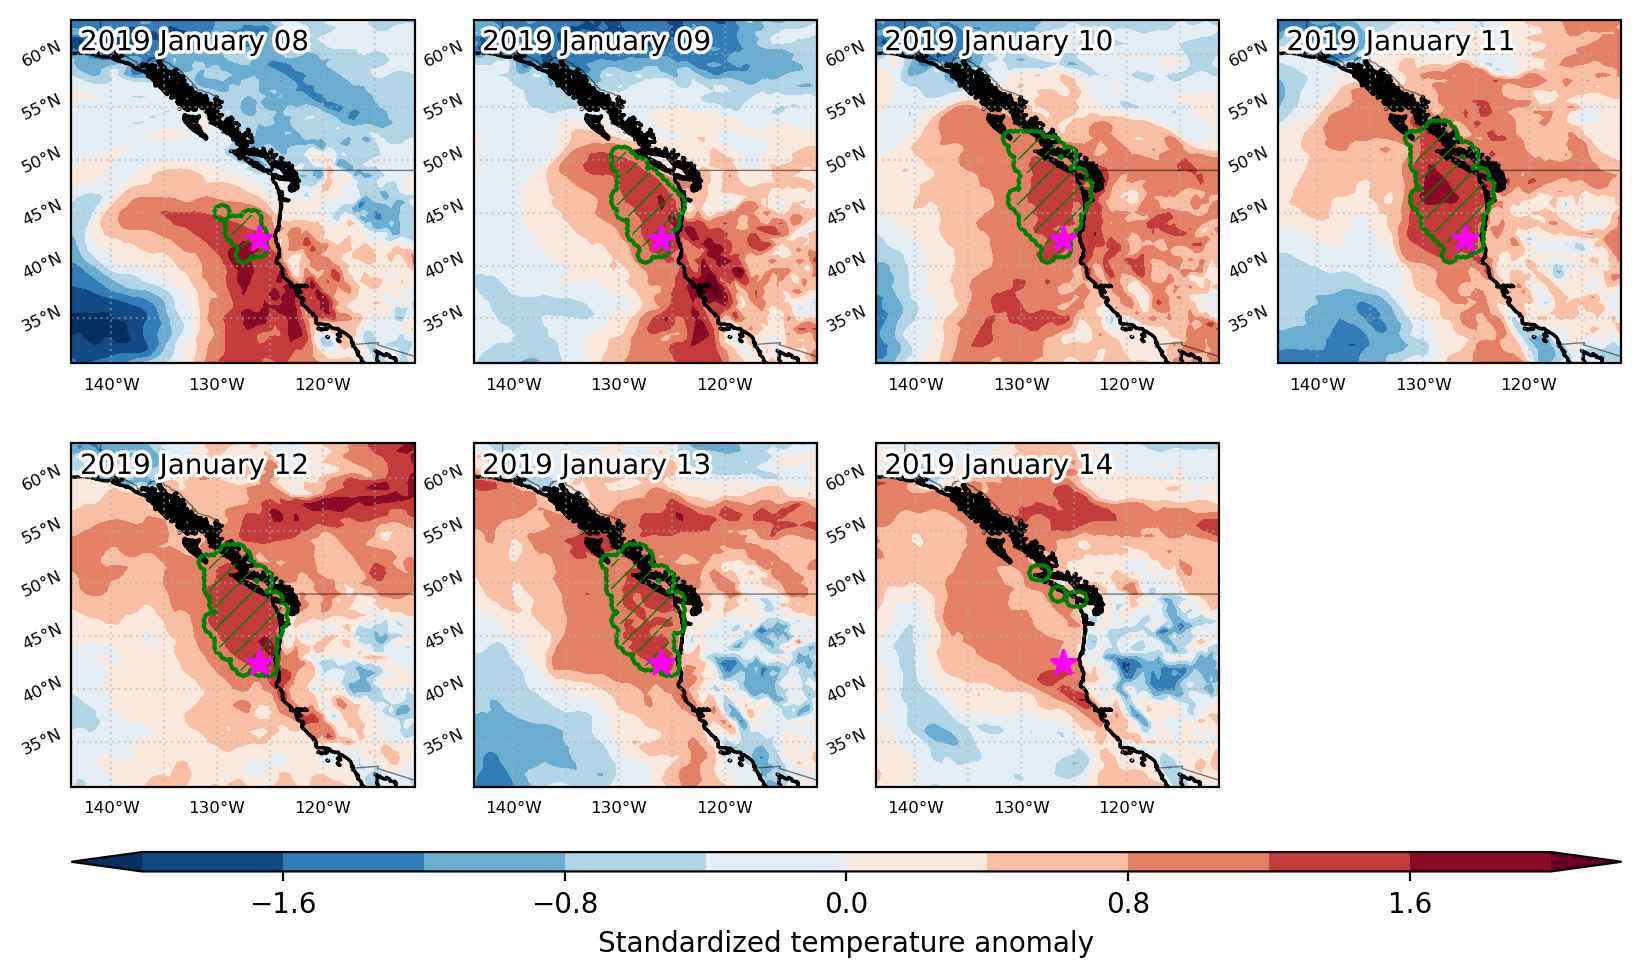
Heat wave occuring from January 08 2019 to January 14 2019 at 42.5°N 234.0°E

Download data: JSON

Event type: Heat wave

Countries affected (identified with ArcGIS Online; provided only for geographical reference):

  • Canada
  • United States

Duration: 7 days

Time span: January 08 2019 to January 14 2019

Statistics over entire affected area:

  • Mean temperature anomaly: 2.7 °C
  • Mean temperature: 10.8 °C
  • Maximum temperature anomaly: 7.2 °C
  • Maximum temperature: 13.7 °C

Event center: 42.5°N 234.0°E

Area affected: 453649 km$^2$


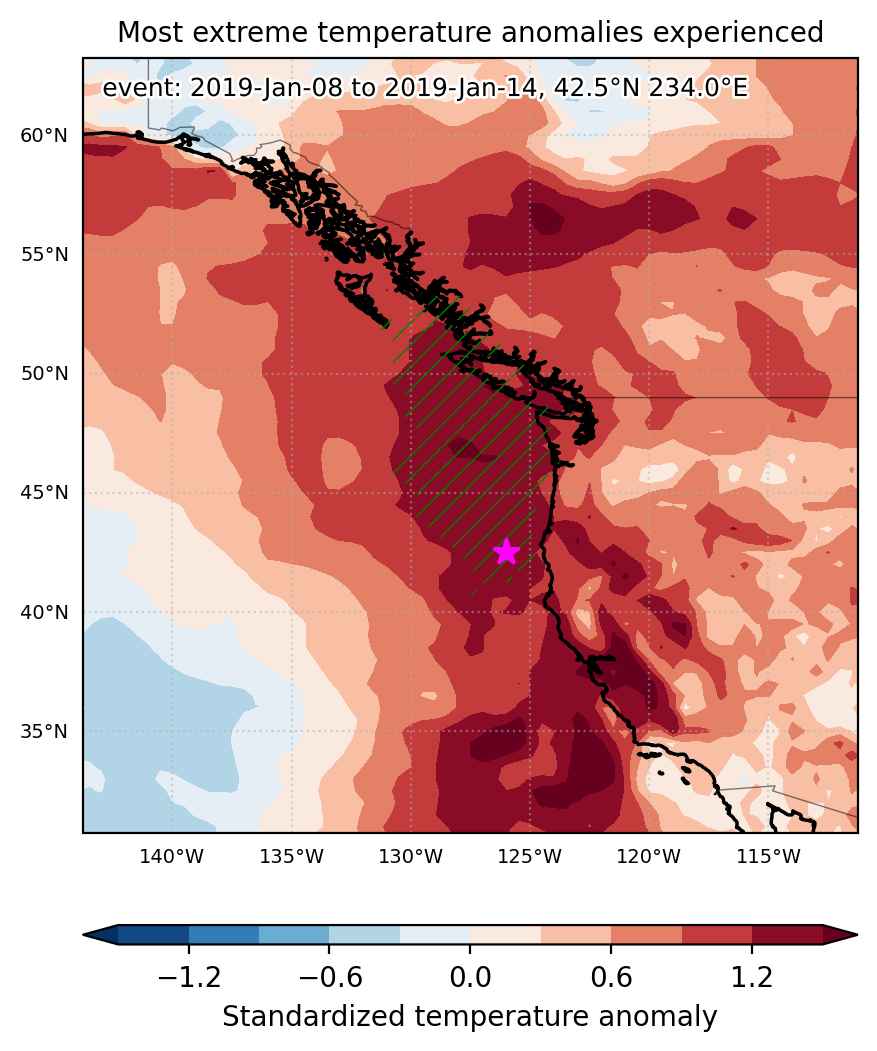
Fig. 1: Map of most extreme temperature anomalies (standardized) experienced during the event. The purple star indicates the center of the extreme event. Green hatching illustrates all areas under the effect of extremes at some time during the event.


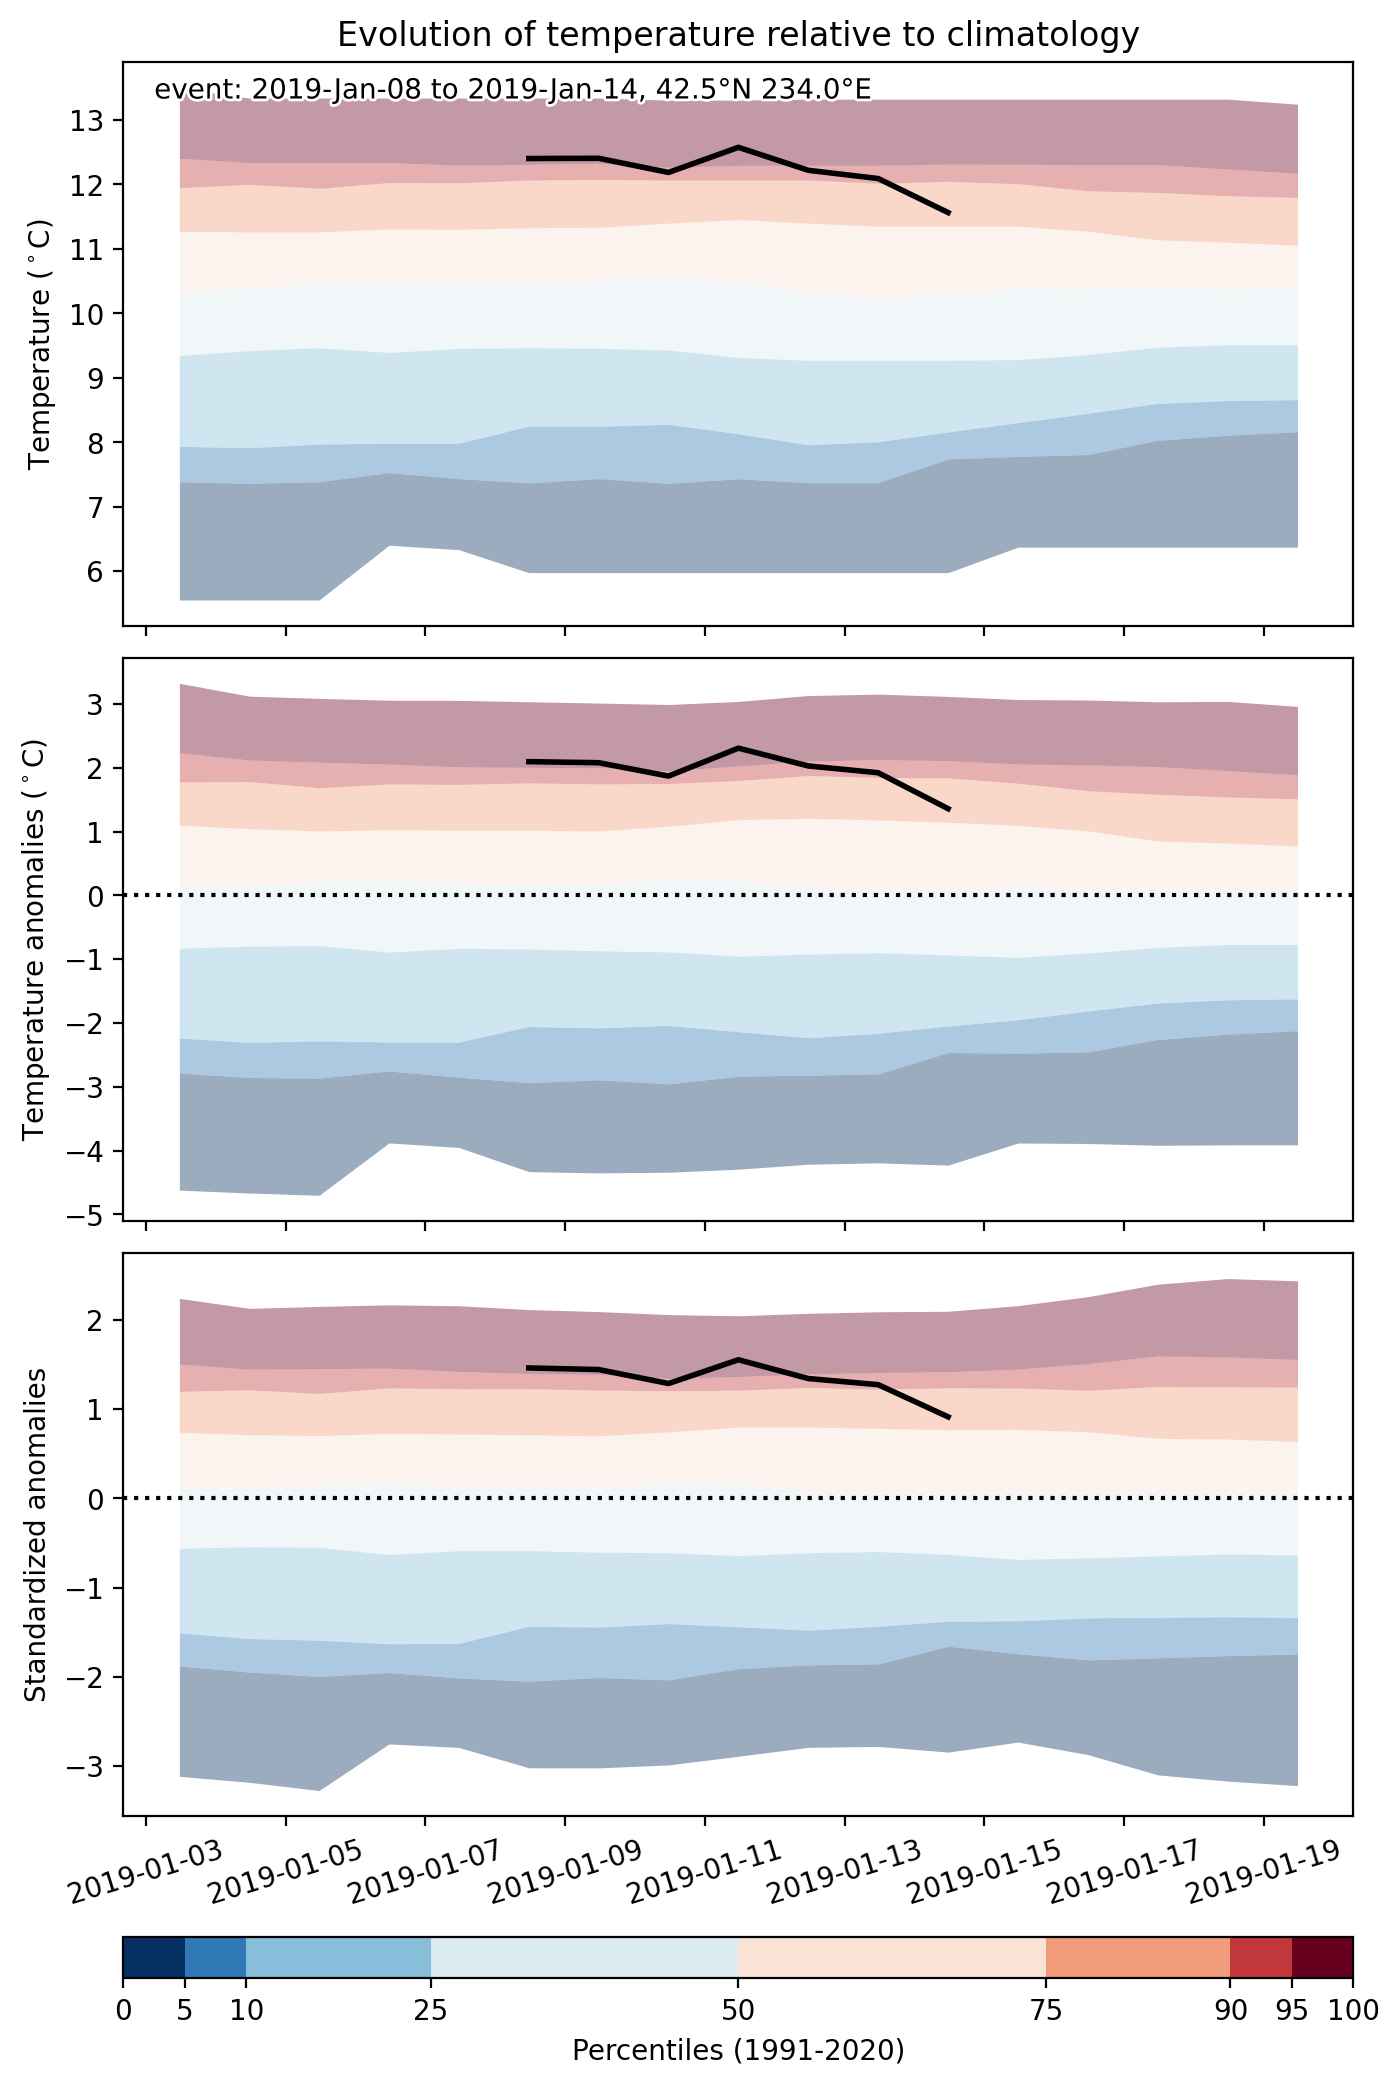
Fig. 2: Evolution of temperature at the center of the event. The climatological percentile distribution is illustrated with color shadings.


Fig. 3: Maps illustrating the evolution of standardized temperature anomalies during the event.

Event ID: Heat_wave_2019-Jan-08_to_2019-Jan-14_234.0_42.5

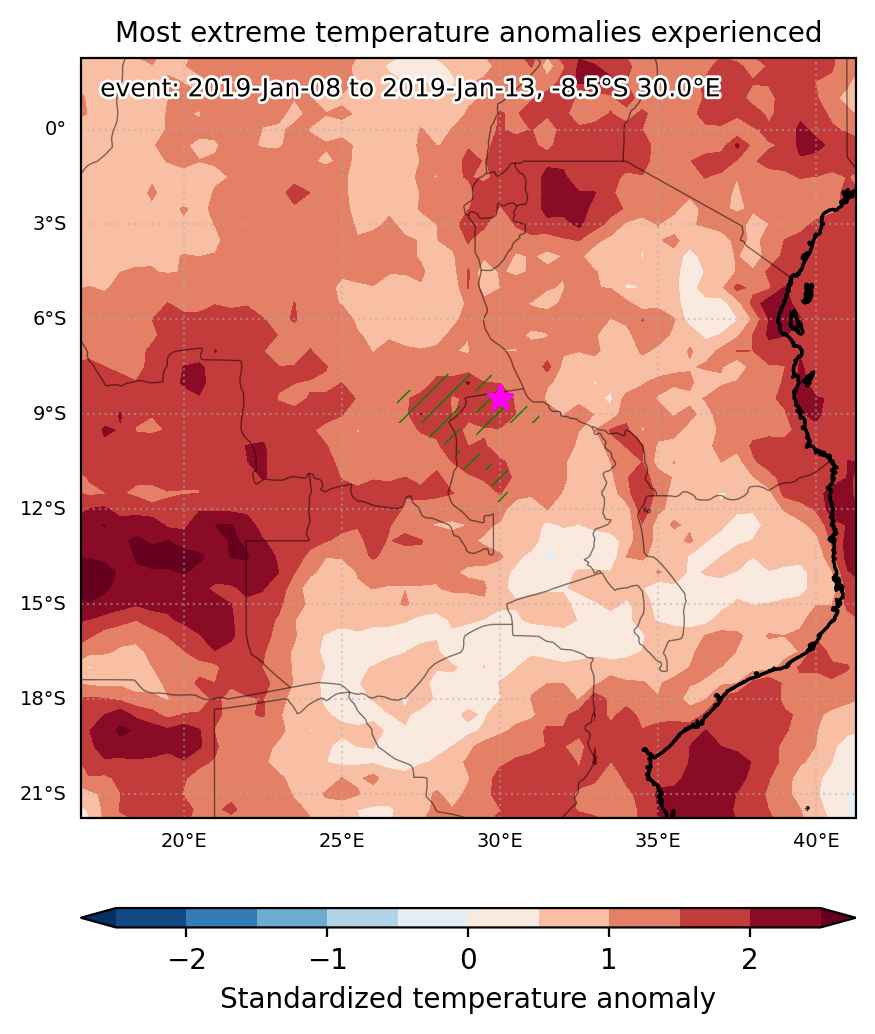
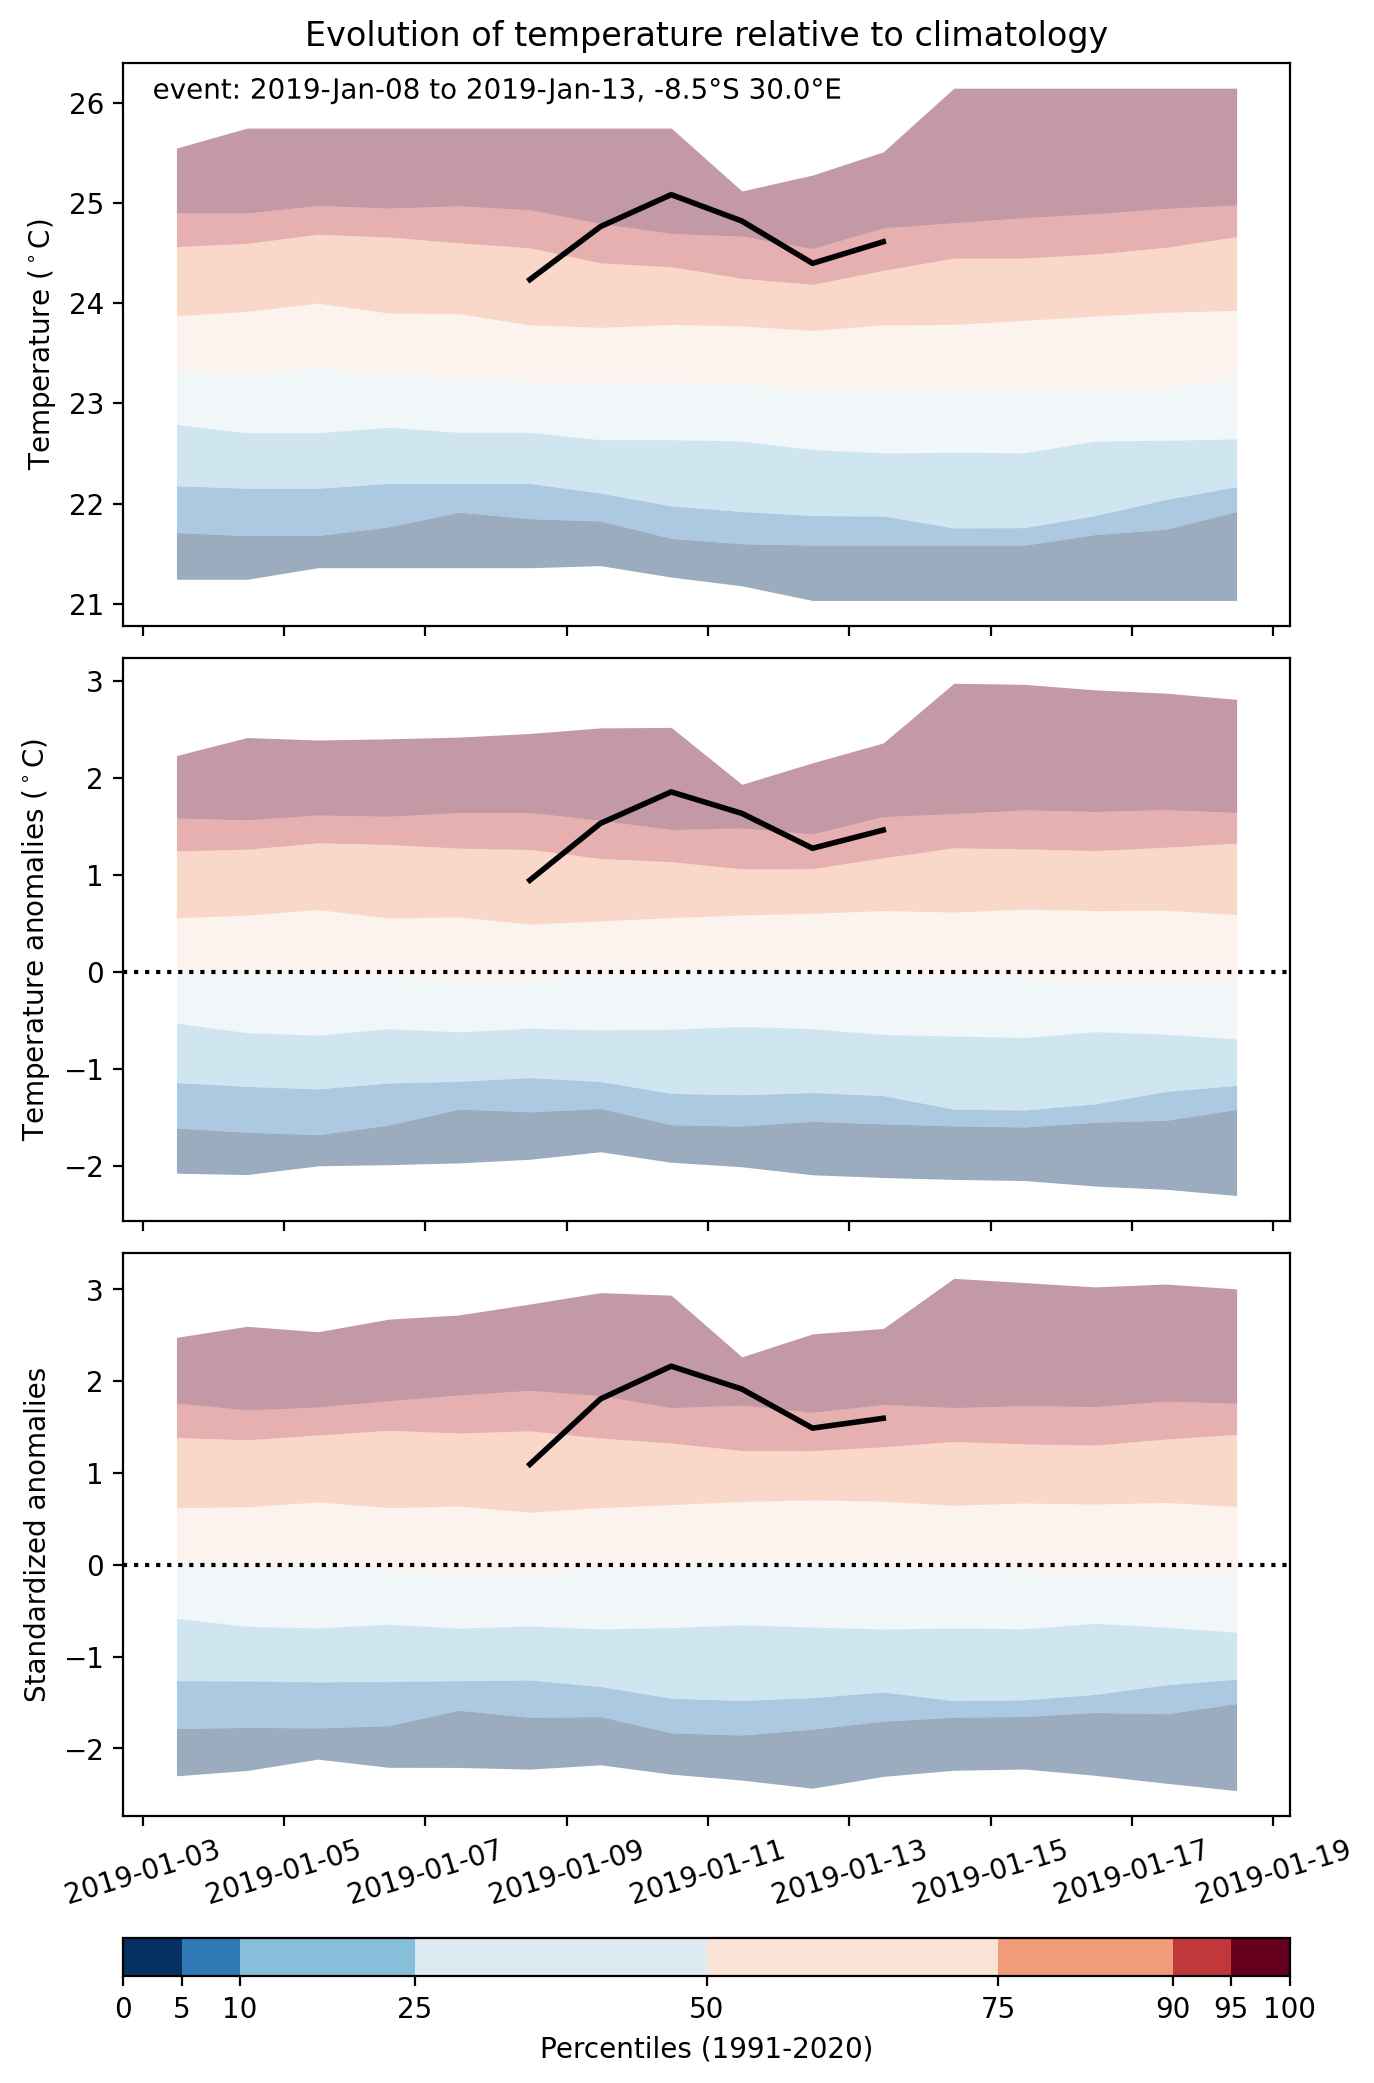
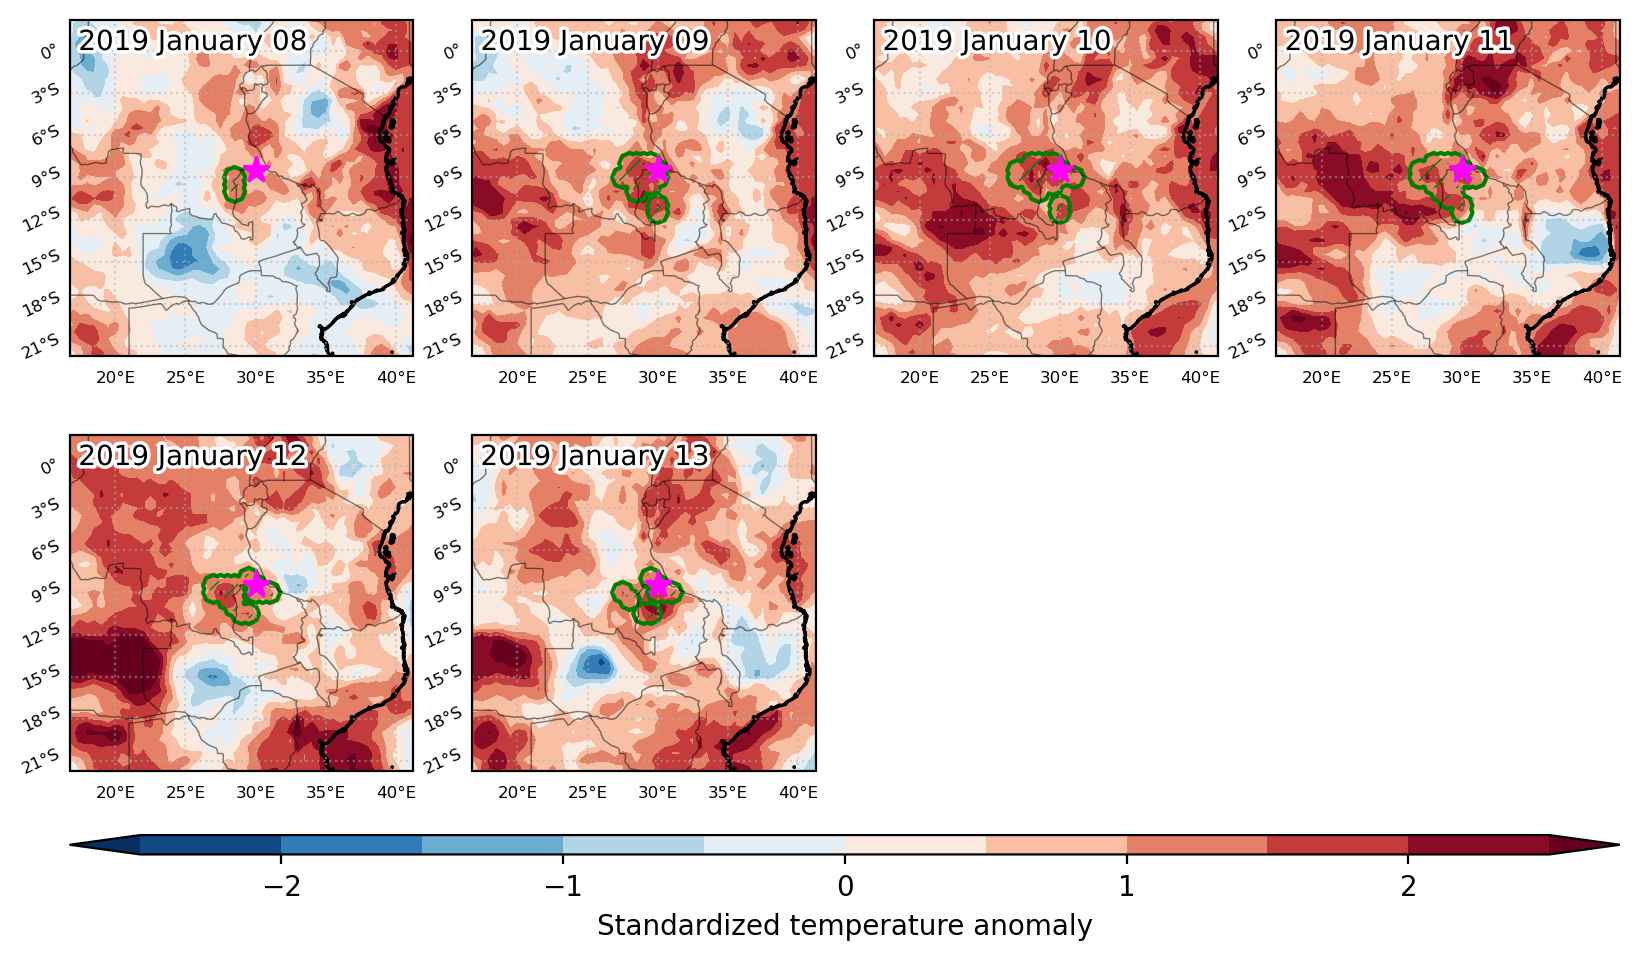
Heat wave occuring from January 08 2019 to January 13 2019 at -8.5°S 30.0°E

Download data: JSON

Event type: Heat wave

Countries affected (identified with ArcGIS Online; provided only for geographical reference):

  • Congo DRC
  • Zambia

Duration: 6 days

Time span: January 08 2019 to January 13 2019

Statistics over entire affected area:

  • Mean temperature anomaly: 1.4 °C
  • Mean temperature: 22.8 °C
  • Maximum temperature anomaly: 2.2 °C
  • Maximum temperature: 25.4 °C

Event center: -8.5°S 30.0°E

Area affected: 79343 km$^2$


Fig. 1: Map of most extreme temperature anomalies (standardized) experienced during the event. The purple star indicates the center of the extreme event. Green hatching illustrates all areas under the effect of extremes at some time during the event.


Fig. 2: Evolution of temperature at the center of the event. The climatological percentile distribution is illustrated with color shadings.


Fig. 3: Maps illustrating the evolution of standardized temperature anomalies during the event.

Event ID: Heat_wave_2019-Jan-08_to_2019-Jan-13_30.0_-8.5

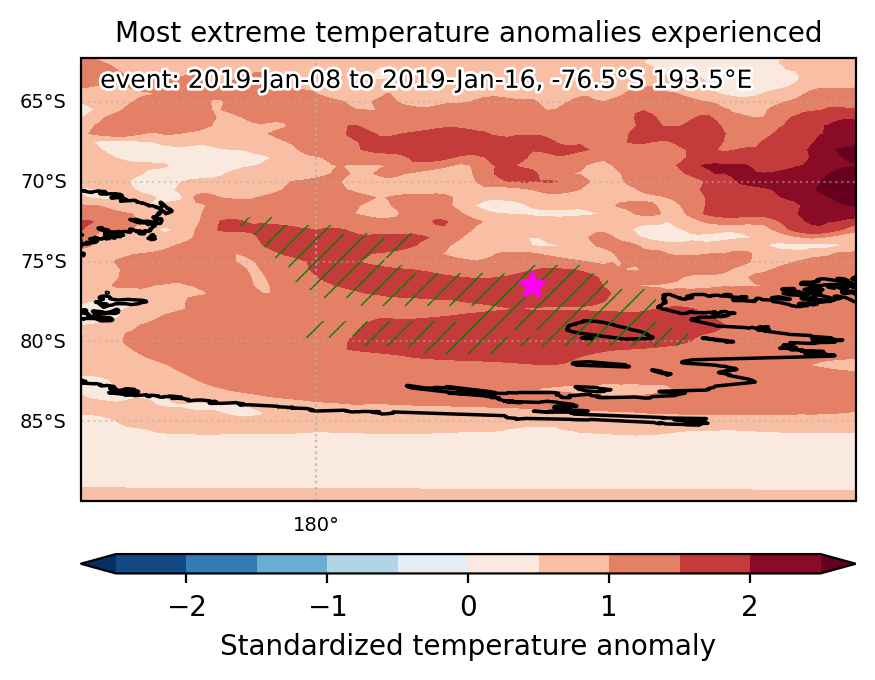
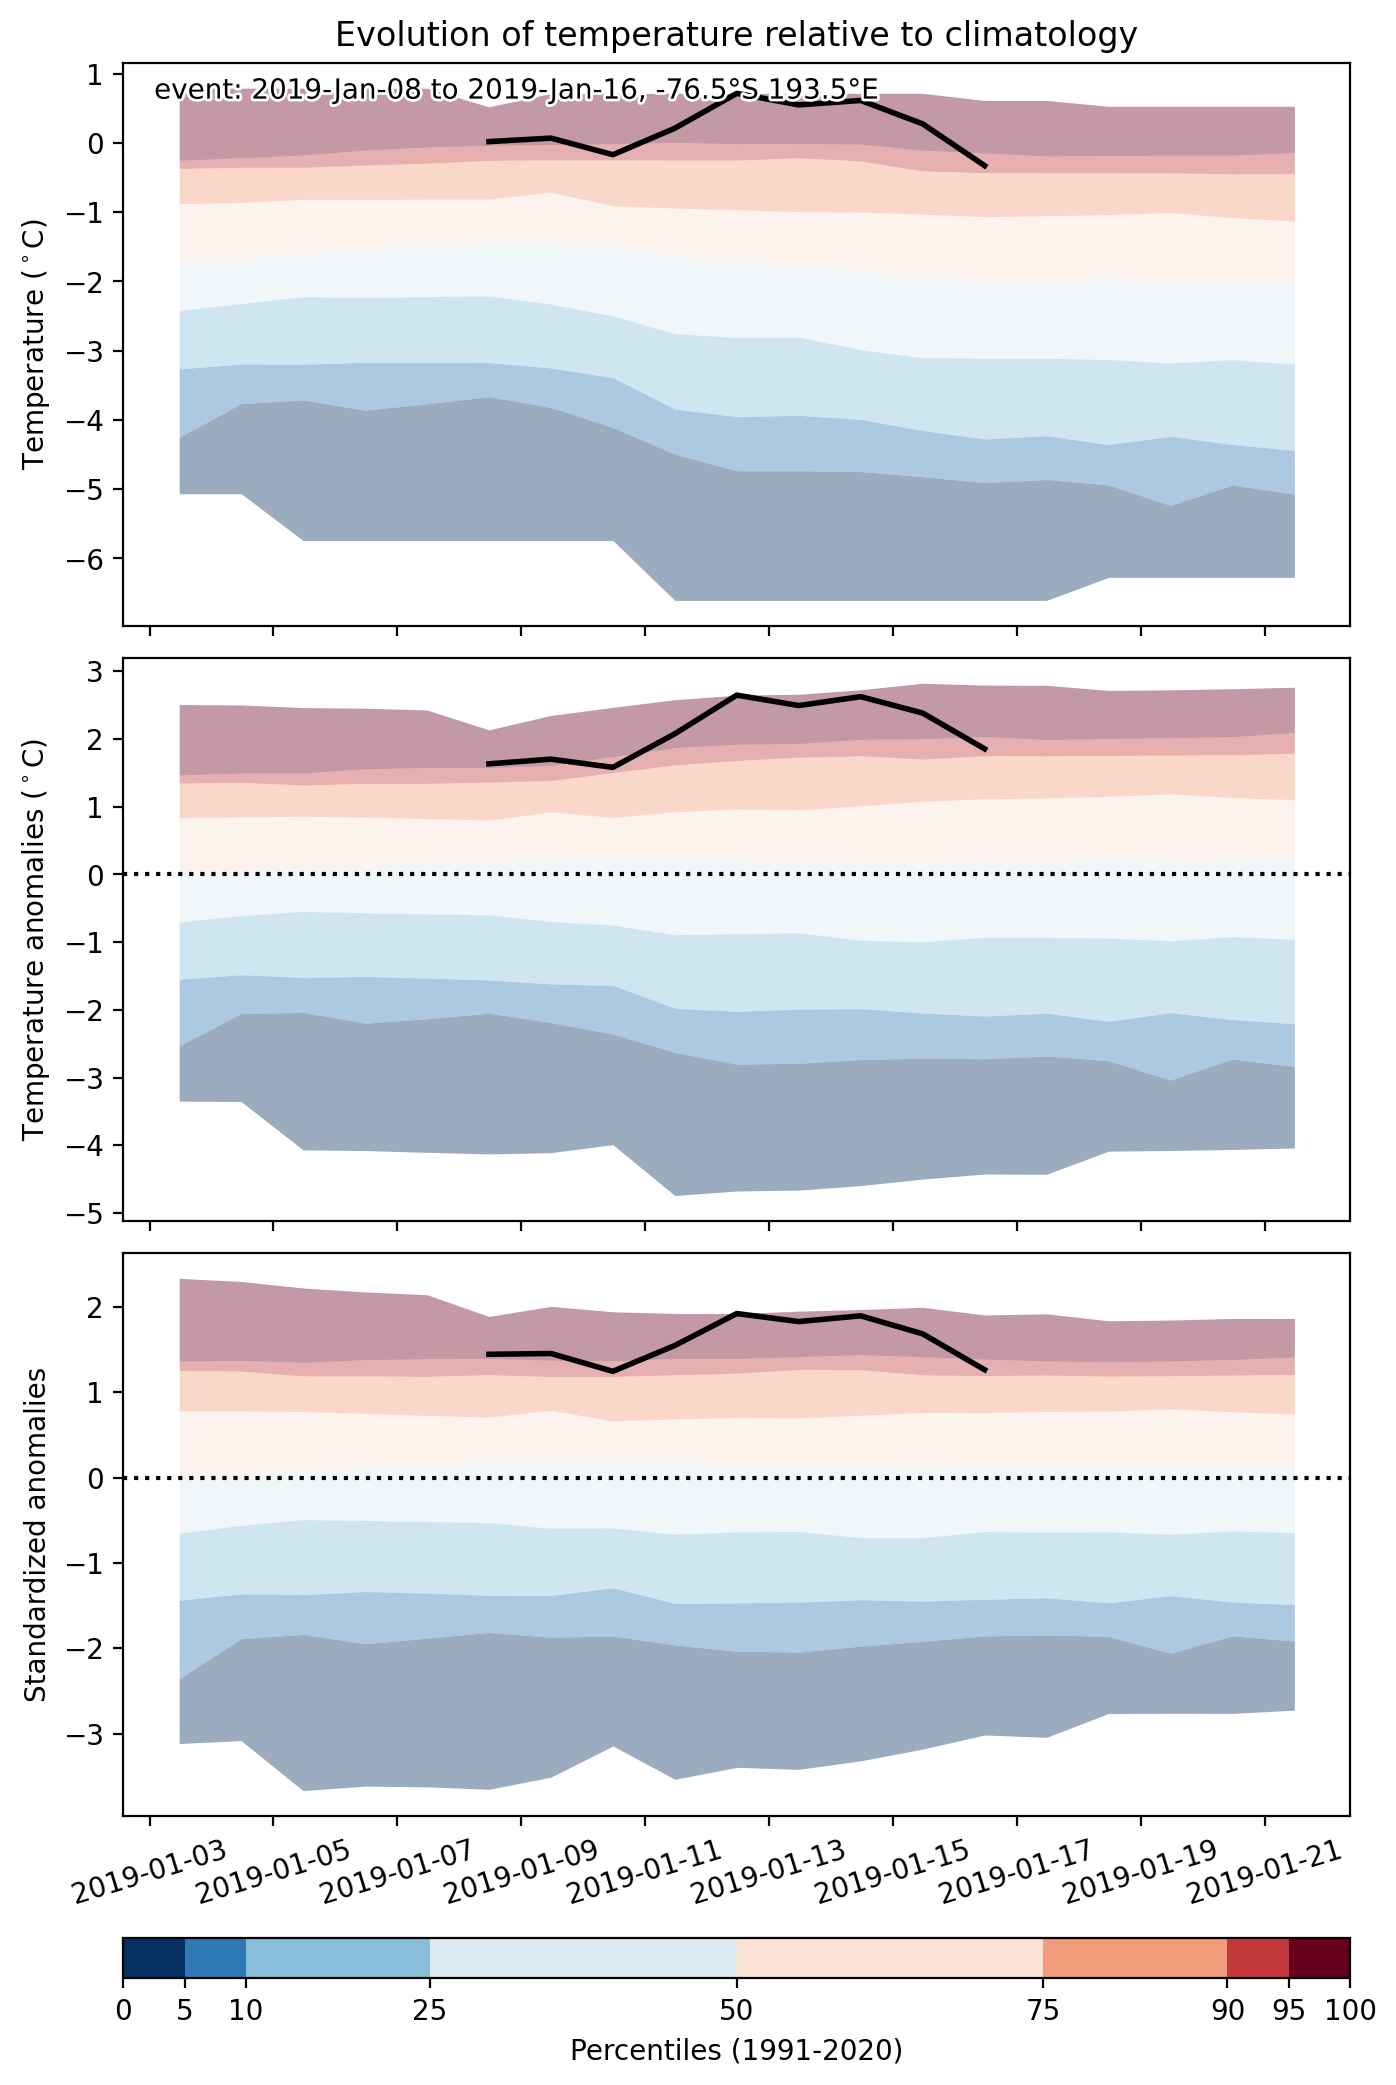
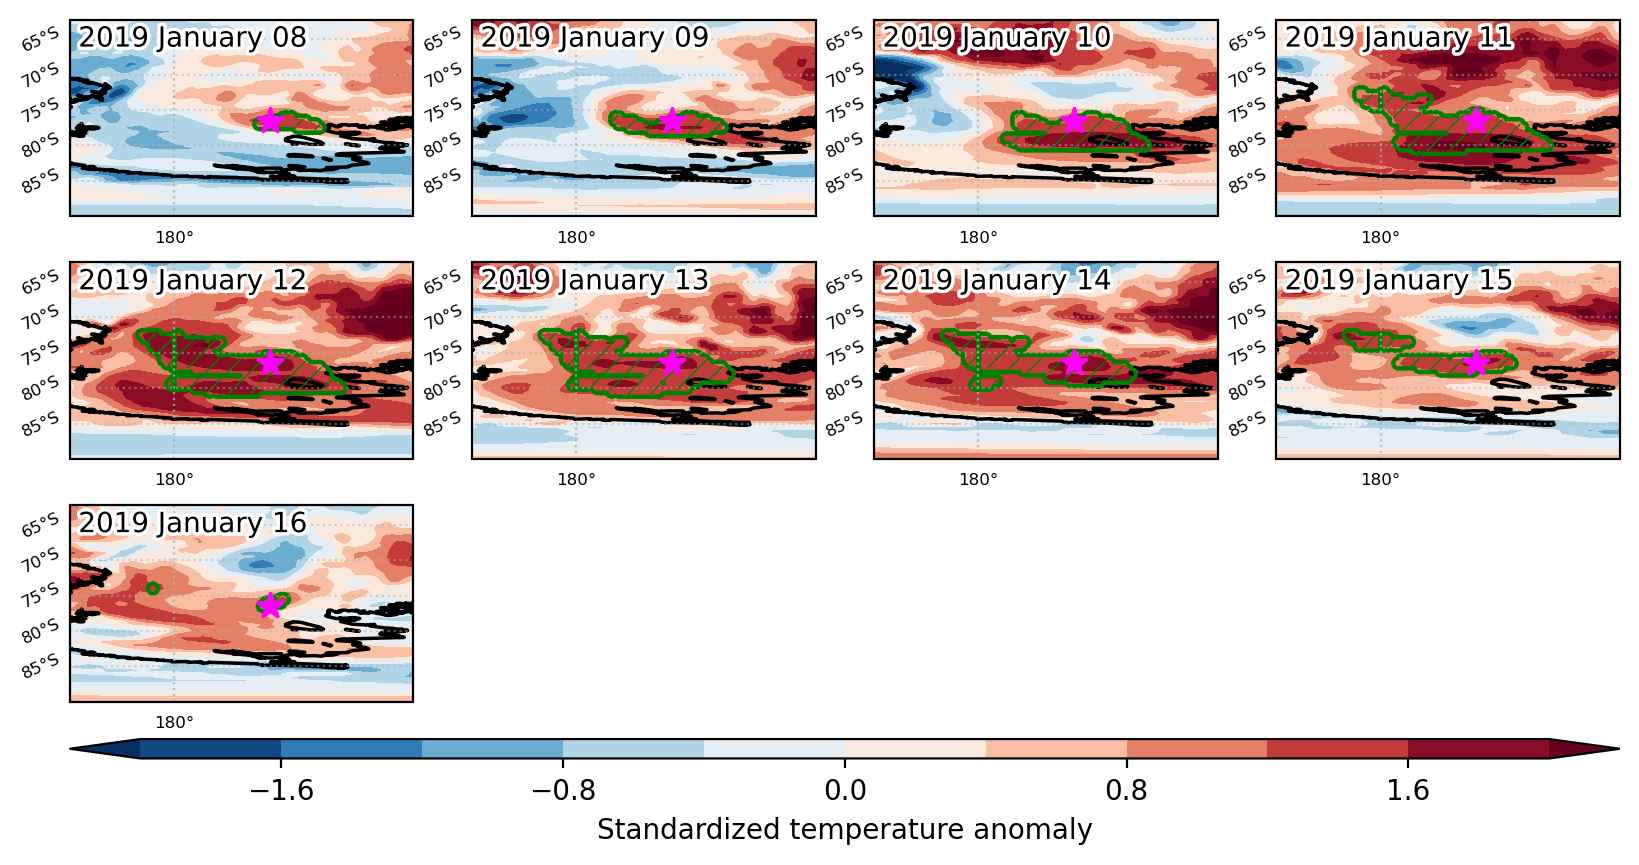
Heat wave occuring from January 08 2019 to January 16 2019 at -76.5°S 193.5°E

Download data: JSON

Event type: Heat wave

Countries affected (identified with ArcGIS Online; provided only for geographical reference):

  • Antarctica

Duration: 9 days

Time span: January 08 2019 to January 16 2019

Statistics over entire affected area:

  • Mean temperature anomaly: 3.0 °C
  • Mean temperature: -0.6 °C
  • Maximum temperature anomaly: 7.1 °C
  • Maximum temperature: 0.9 °C

Event center: -76.5°S 193.5°E

Area affected: 310609 km$^2$


Fig. 1: Map of most extreme temperature anomalies (standardized) experienced during the event. The purple star indicates the center of the extreme event. Green hatching illustrates all areas under the effect of extremes at some time during the event.


Fig. 2: Evolution of temperature at the center of the event. The climatological percentile distribution is illustrated with color shadings.


Fig. 3: Maps illustrating the evolution of standardized temperature anomalies during the event.

Event ID: Heat_wave_2019-Jan-08_to_2019-Jan-16_193.5_-76.5

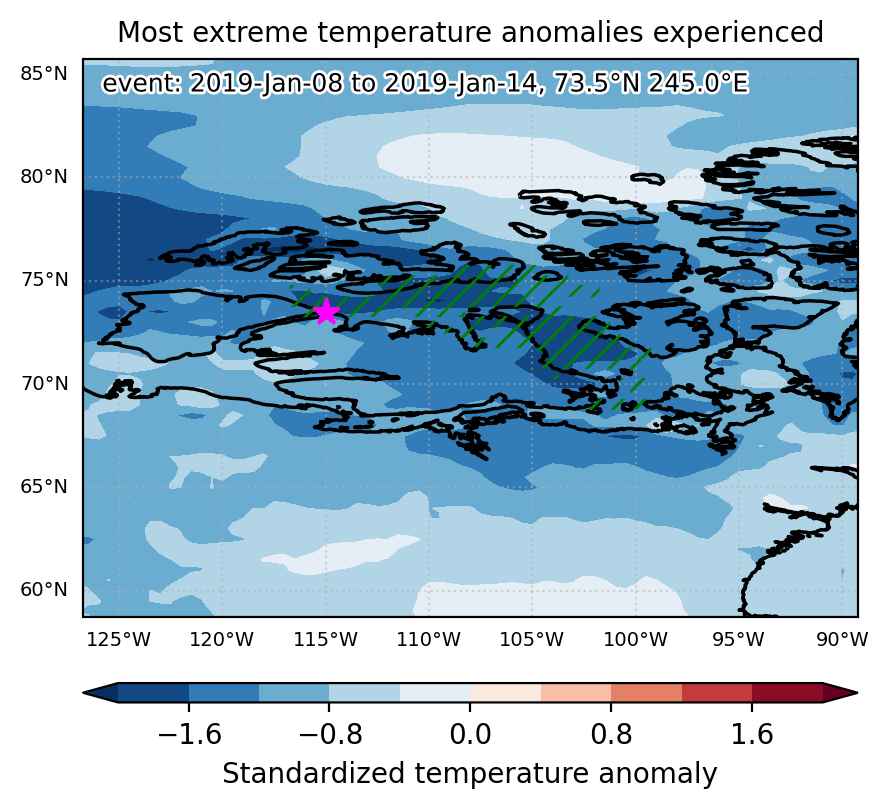
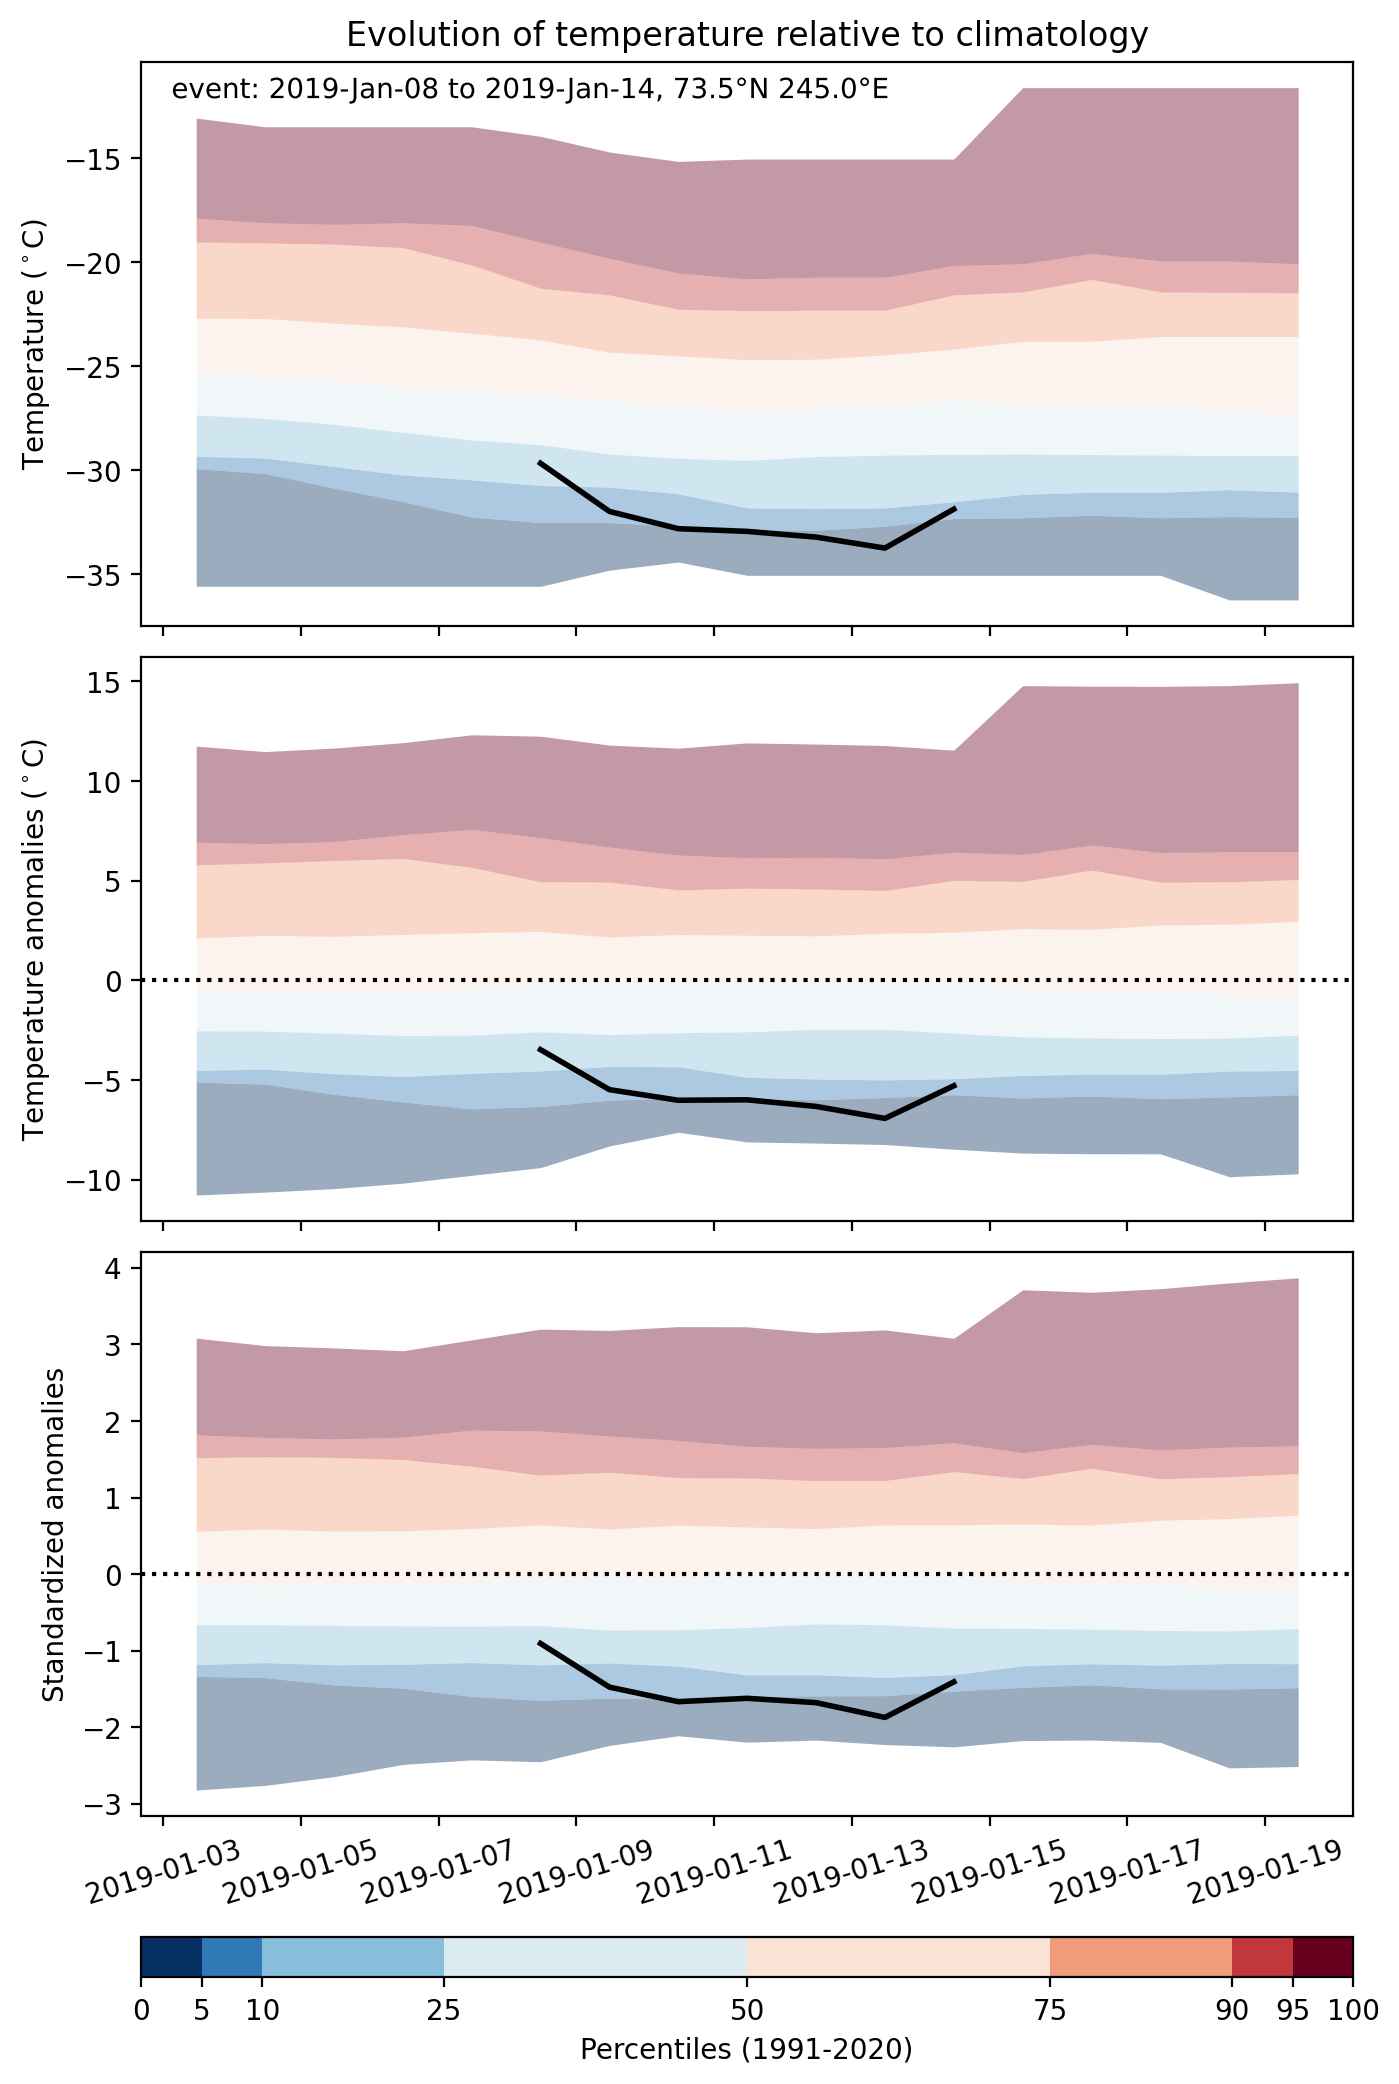
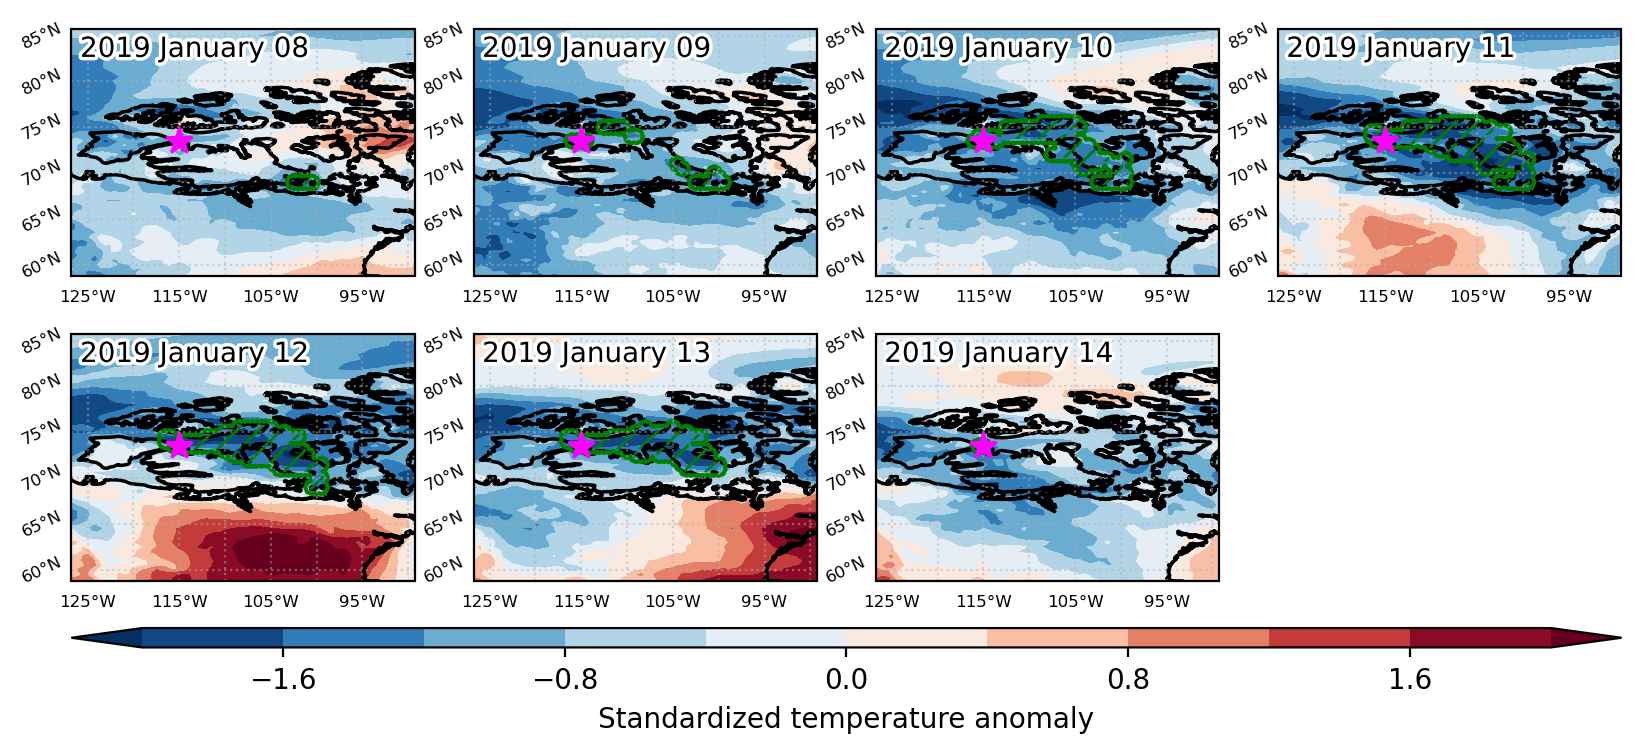
Cold spell occuring from January 08 2019 to January 14 2019 at 73.5°N 245.0°E

Download data: JSON

Event type: Cold spell

Countries affected (identified with ArcGIS Online; provided only for geographical reference):

  • Canada

Duration: 7 days

Time span: January 08 2019 to January 14 2019

Statistics over entire affected area:

  • Mean temperature anomaly: -6.8 °C
  • Mean temperature: -35.0 °C
  • Minimum temperature anomaly: -12.7 °C
  • Minimum temperature: -46.0 °C

Event center: 73.5°N 245.0°E

Area affected: 152464 km$^2$


Fig. 1: Map of most extreme temperature anomalies (standardized) experienced during the event. The purple star indicates the center of the extreme event. Green hatching illustrates all areas under the effect of extremes at some time during the event.


Fig. 2: Evolution of temperature at the center of the event. The climatological percentile distribution is illustrated with color shadings.


Fig. 3: Maps illustrating the evolution of standardized temperature anomalies during the event.

Event ID: Cold_spell_2019-Jan-08_to_2019-Jan-14_245.0_73.5

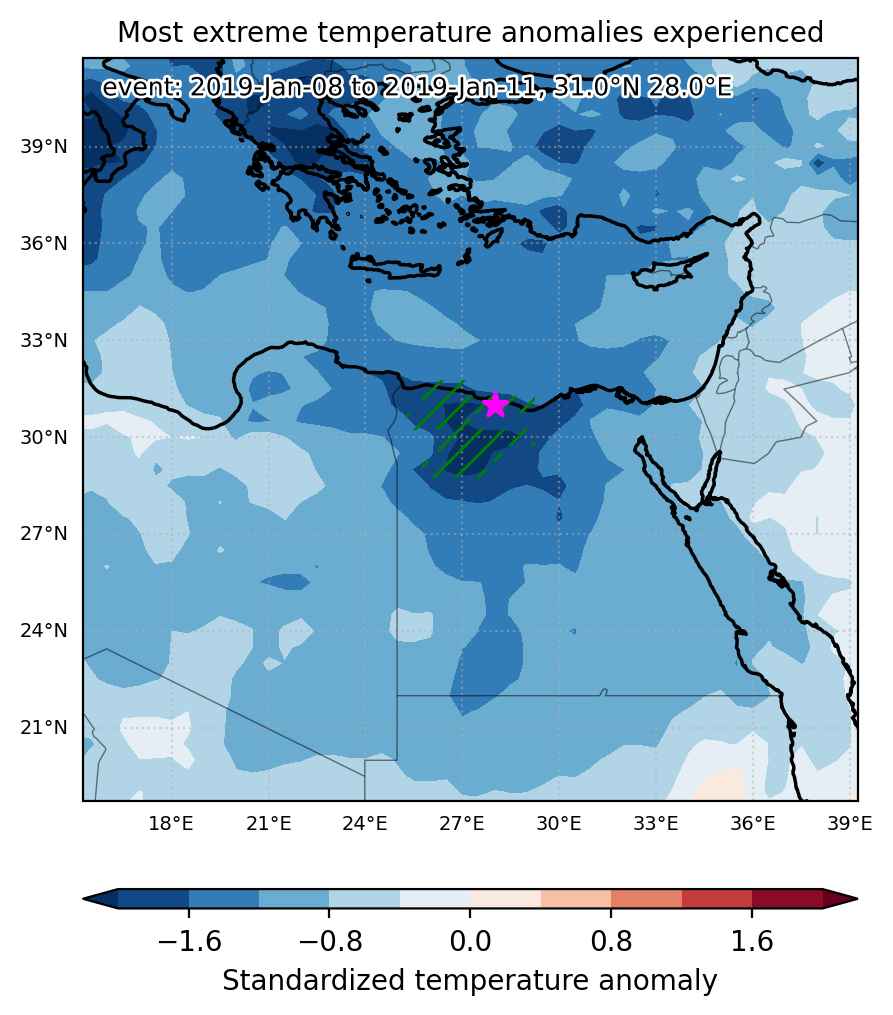
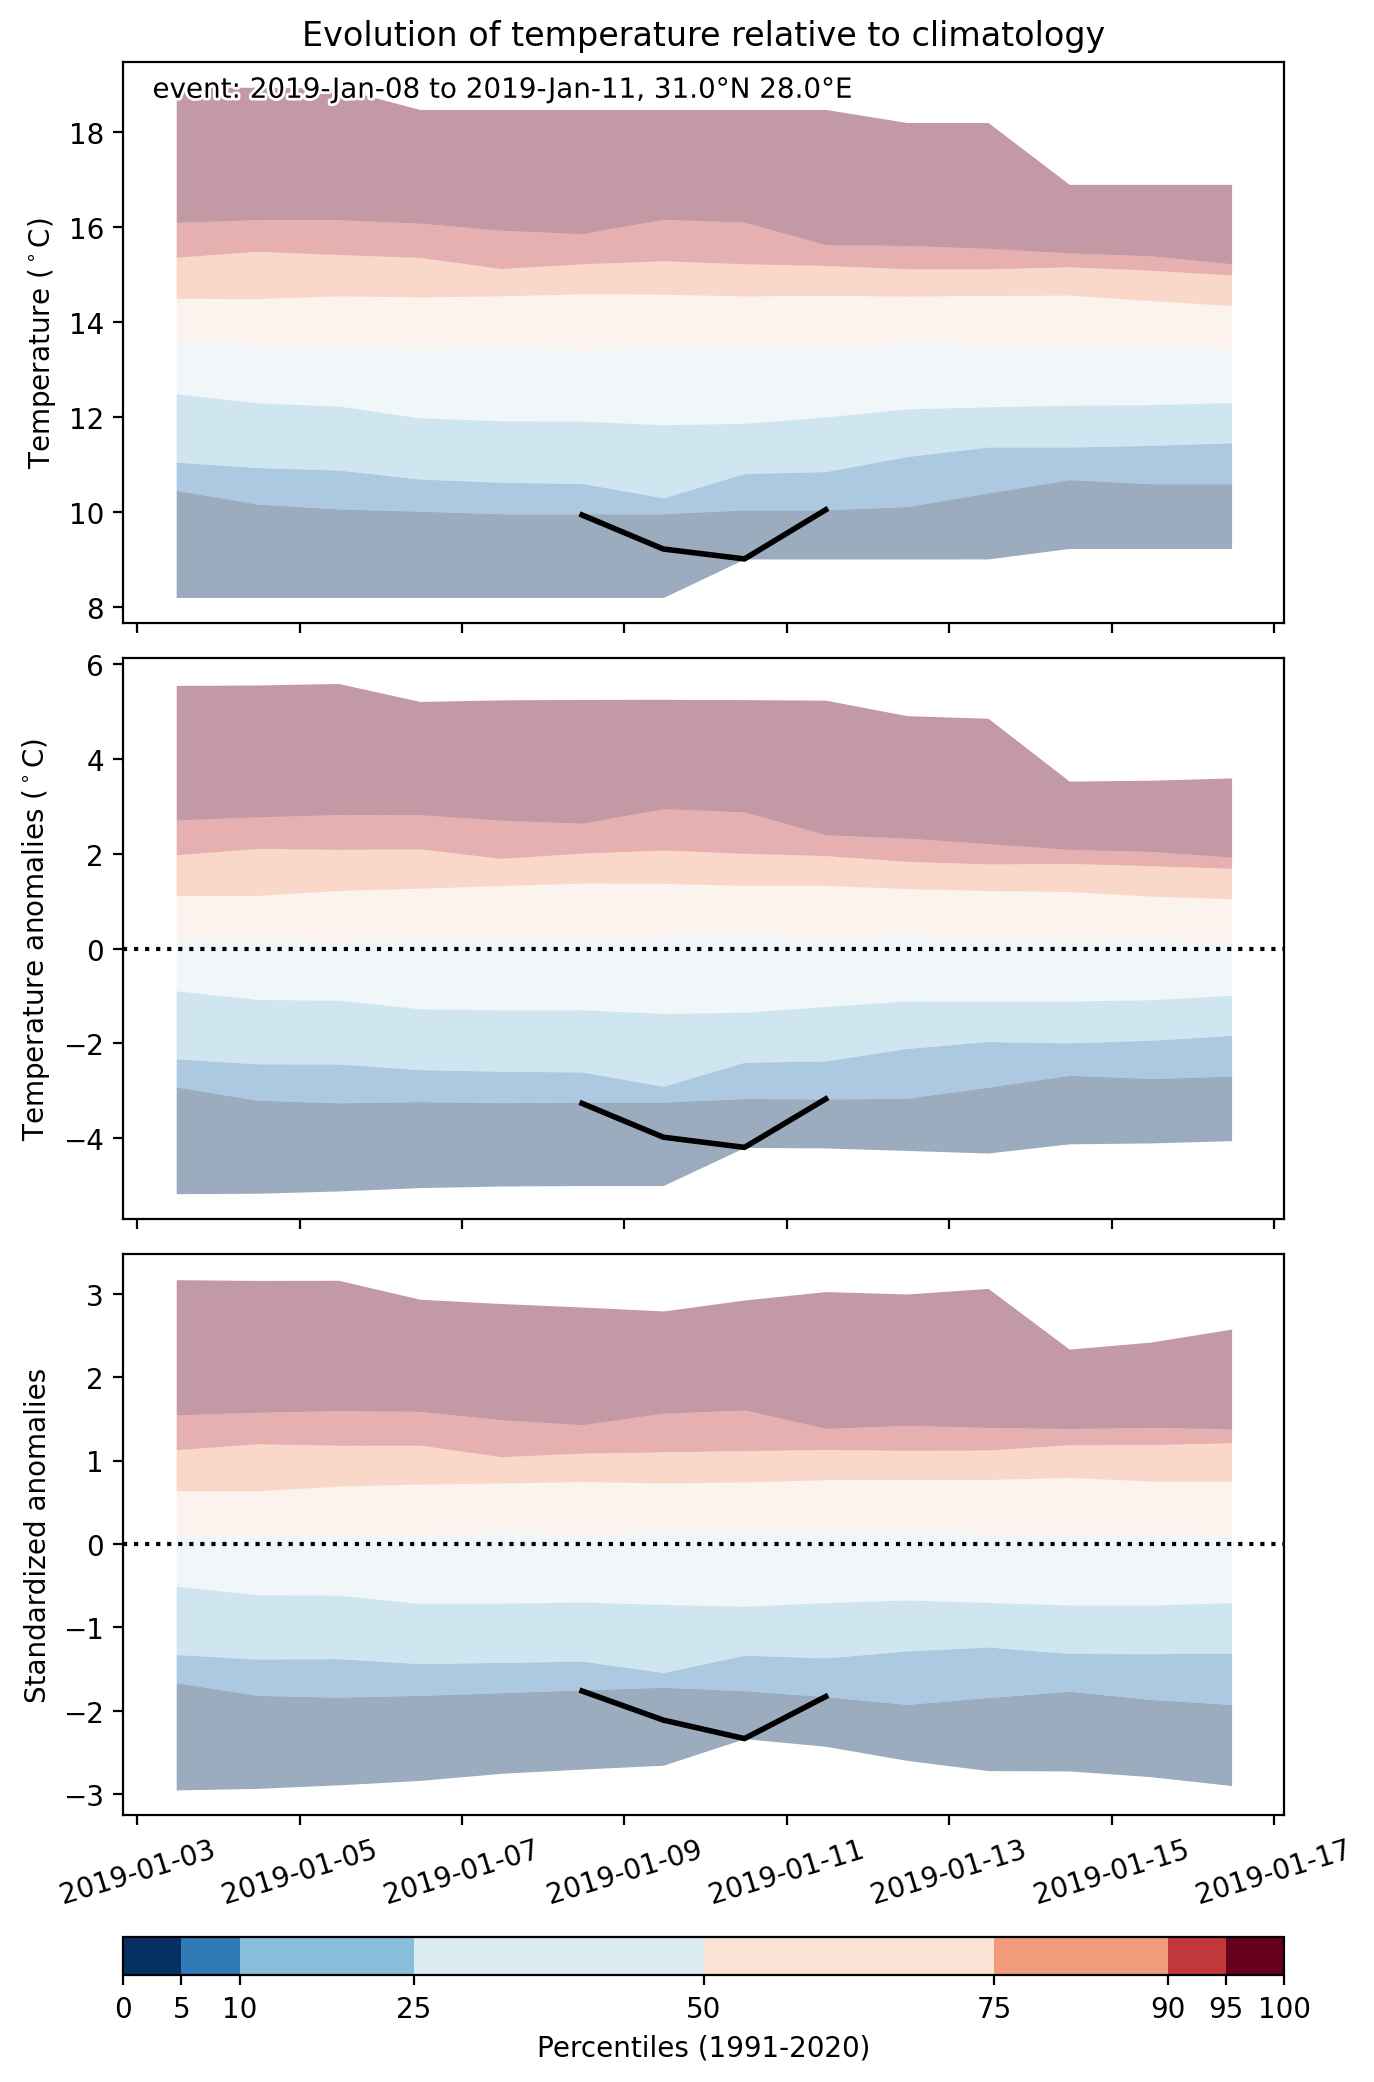
Cold spell occuring from January 08 2019 to January 11 2019 at 31.0°N 28.0°E

Download data: JSON

Event type: Cold spell

Countries affected (identified with ArcGIS Online; provided only for geographical reference):

  • Egypt

Duration: 4 days

Time span: January 08 2019 to January 11 2019

Statistics over entire affected area:

  • Mean temperature anomaly: -3.7 °C
  • Mean temperature: 9.2 °C
  • Minimum temperature anomaly: -5.2 °C
  • Minimum temperature: 6.6 °C

Event center: 31.0°N 28.0°E

Area affected: 74744 km$^2$


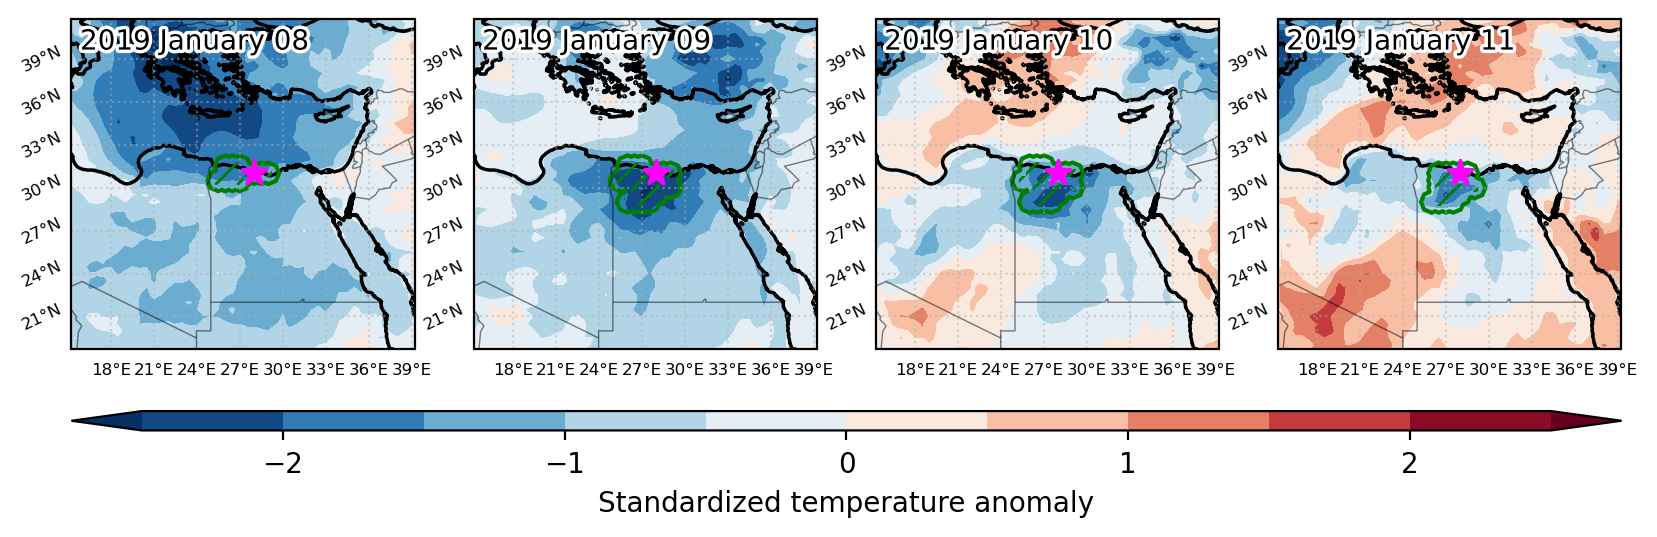
Fig. 1: Map of most extreme temperature anomalies (standardized) experienced during the event. The purple star indicates the center of the extreme event. Green hatching illustrates all areas under the effect of extremes at some time during the event.


Fig. 2: Evolution of temperature at the center of the event. The climatological percentile distribution is illustrated with color shadings.


Fig. 3: Maps illustrating the evolution of standardized temperature anomalies during the event.

Event ID: Cold_spell_2019-Jan-08_to_2019-Jan-11_28.0_31.0

Cold spell occuring from January 07 2019 to January 17 2019 at 42.0°N 19.5°E

Download data: JSON

Event type: Cold spell

Countries affected (identified with ArcGIS Online; provided only for geographical reference):

  • Albania
  • Bosnia and Herzegovina
  • Italy
  • Montenegro
  • Tunisia

Duration: 11 days

Time span: January 07 2019 to January 17 2019

Statistics over entire affected area:

  • Mean temperature anomaly: -3.5 °C
  • Mean temperature: 8.1 °C
  • Minimum temperature anomaly: -7.7 °C
  • Minimum temperature: -6.8 °C

Event center: 42.0°N 19.5°E

Area affected: 381831 km$^2$


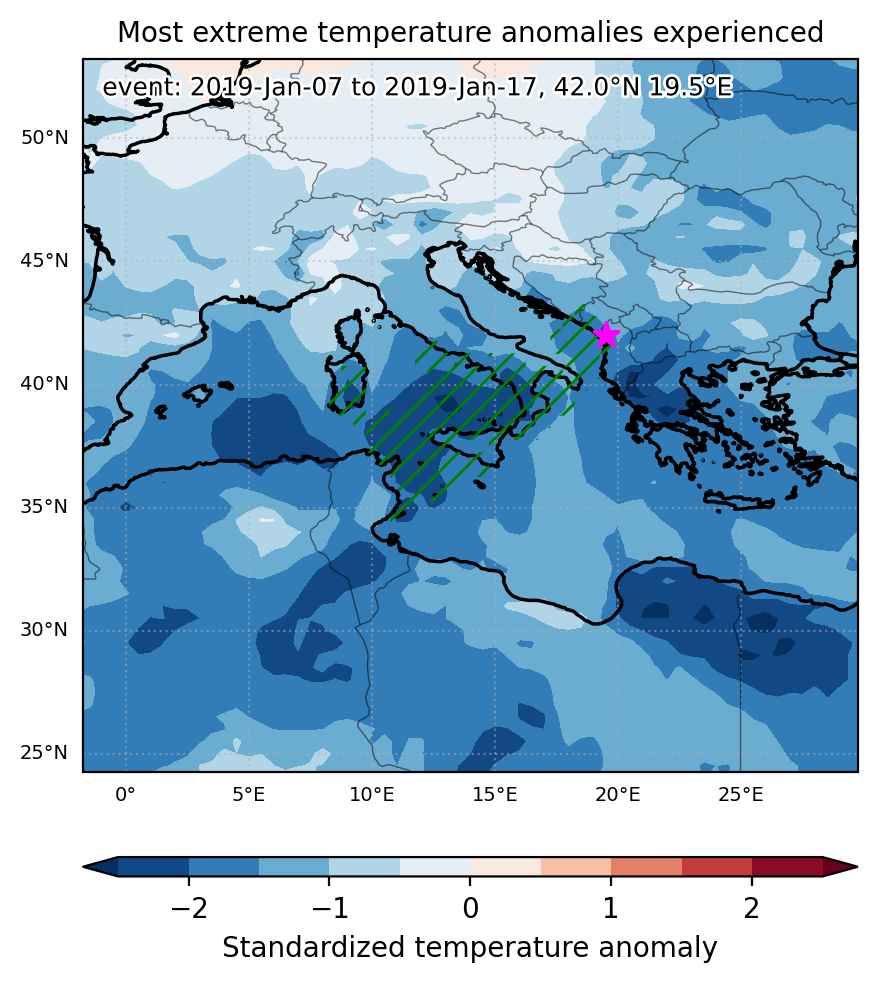
Fig. 1: Map of most extreme temperature anomalies (standardized) experienced during the event. The purple star indicates the center of the extreme event. Green hatching illustrates all areas under the effect of extremes at some time during the event.


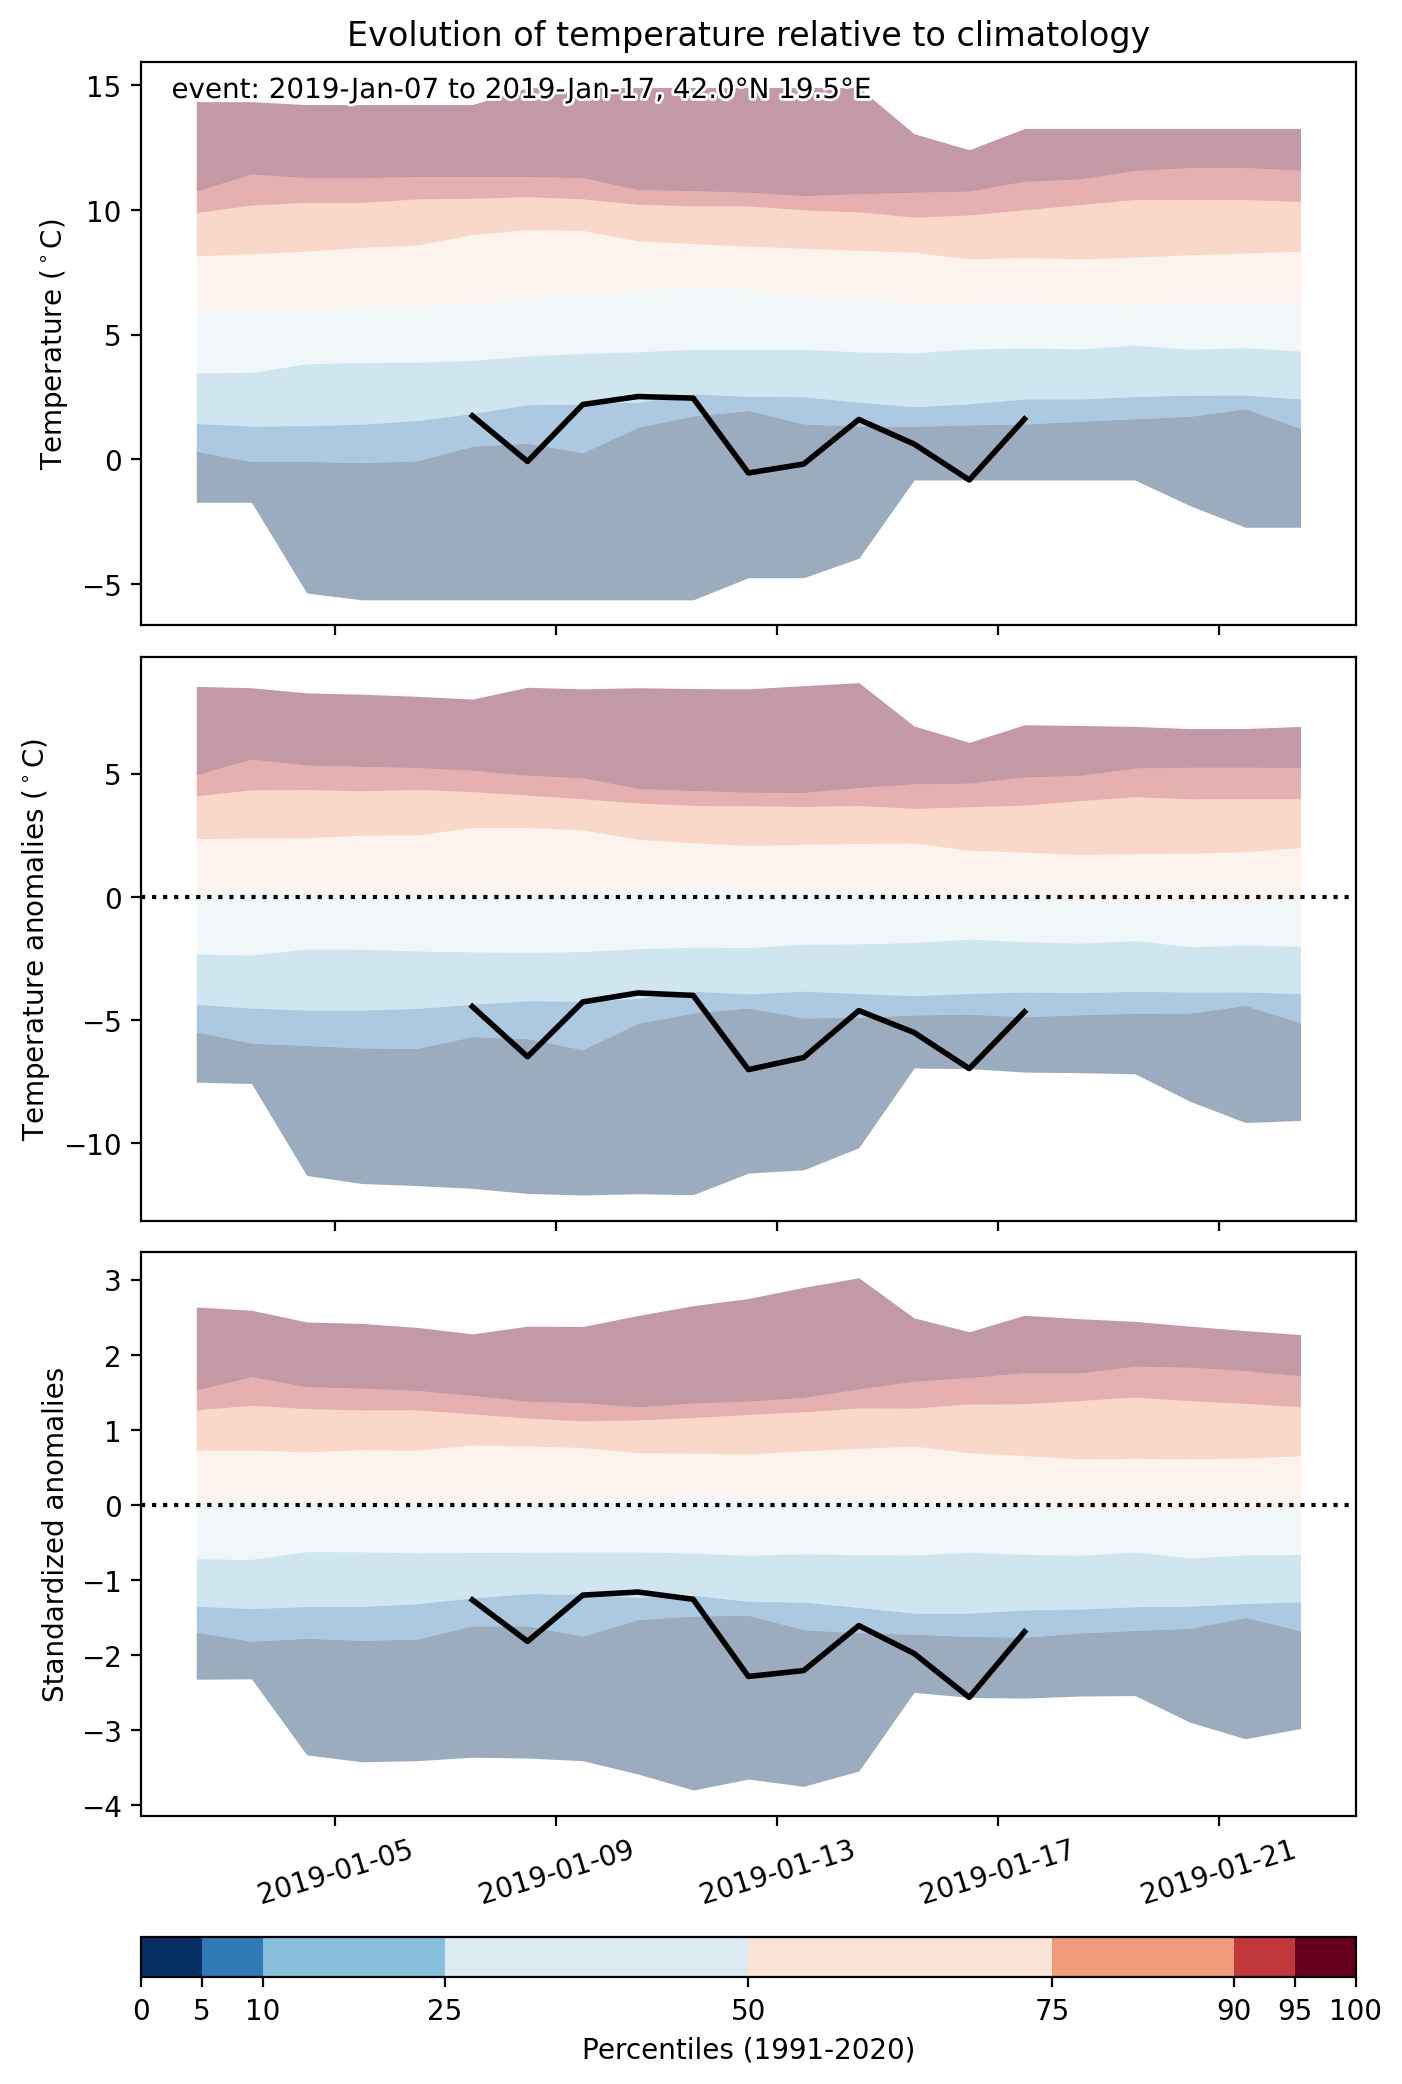
Fig. 2: Evolution of temperature at the center of the event. The climatological percentile distribution is illustrated with color shadings.


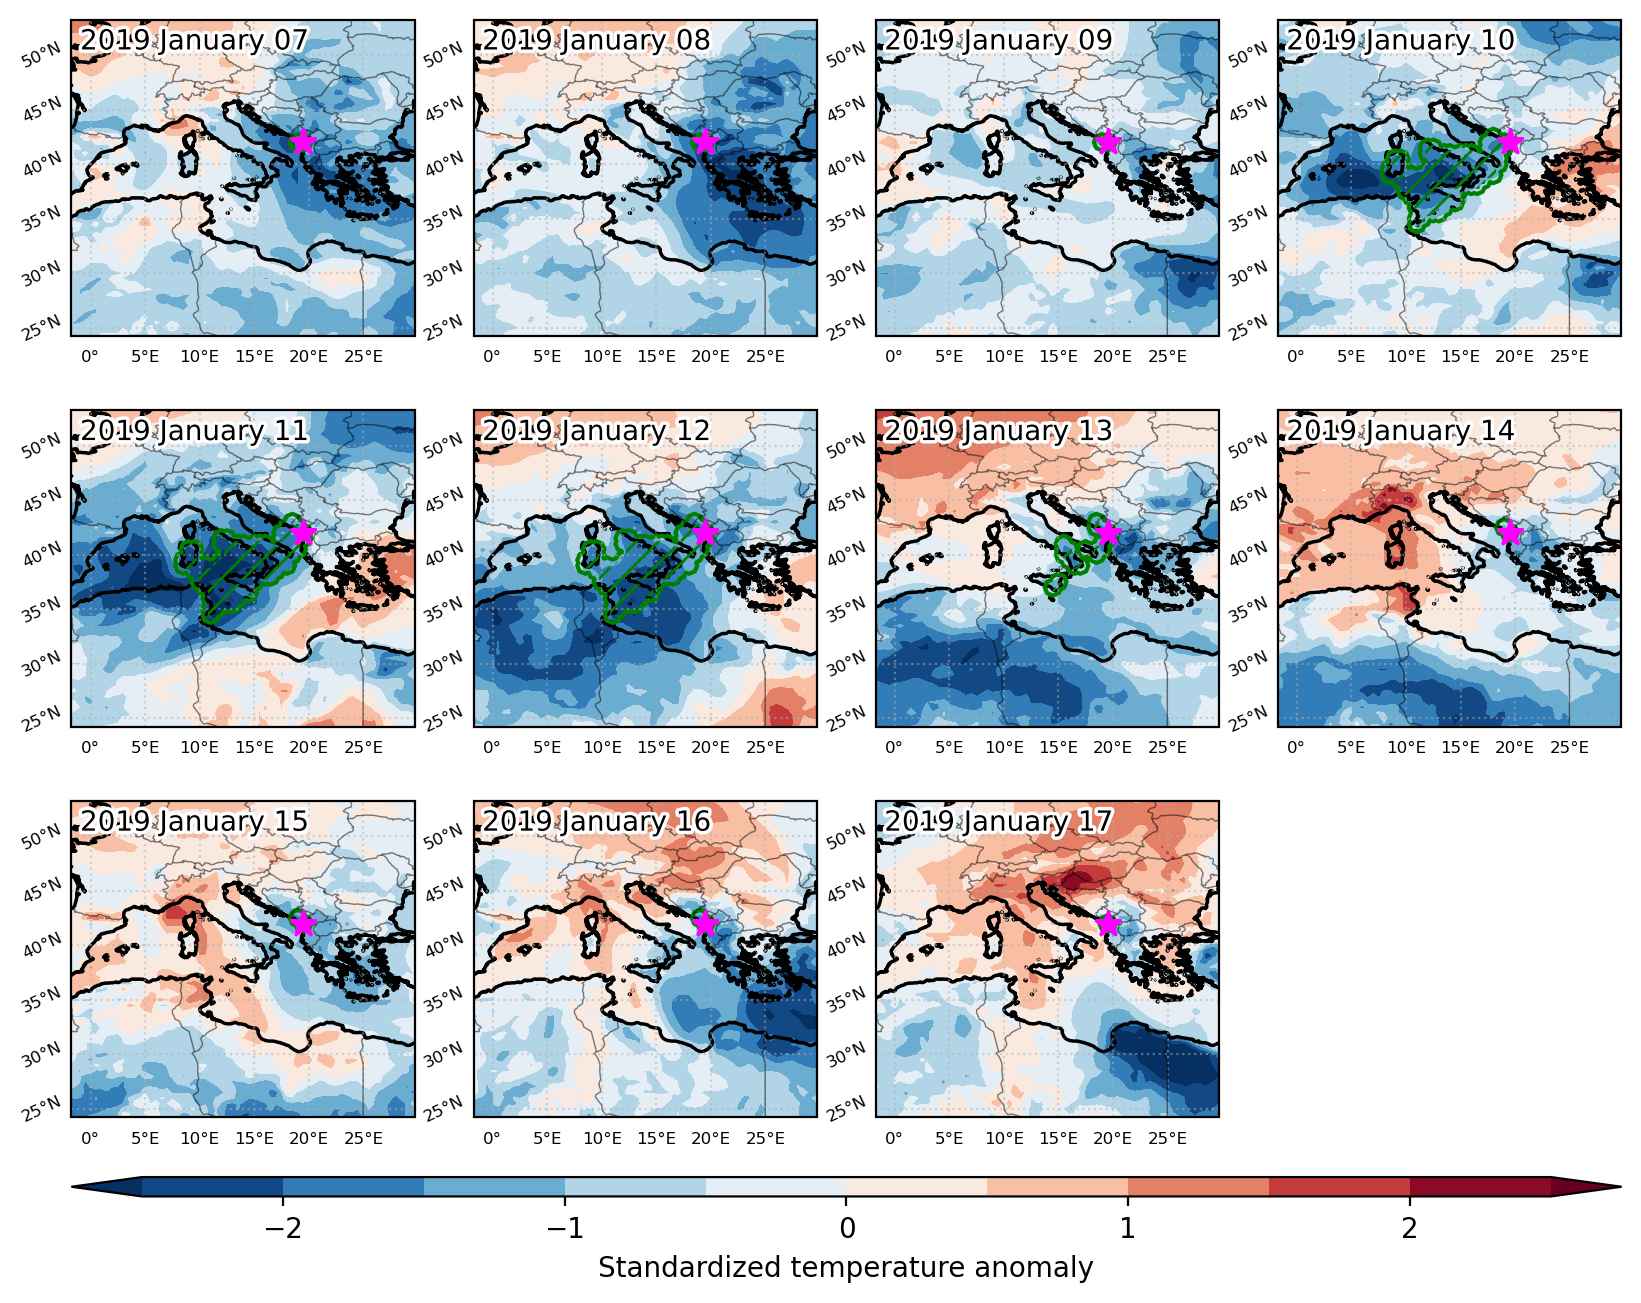
Fig. 3: Maps illustrating the evolution of standardized temperature anomalies during the event.

Event ID: Cold_spell_2019-Jan-07_to_2019-Jan-17_19.5_42.0

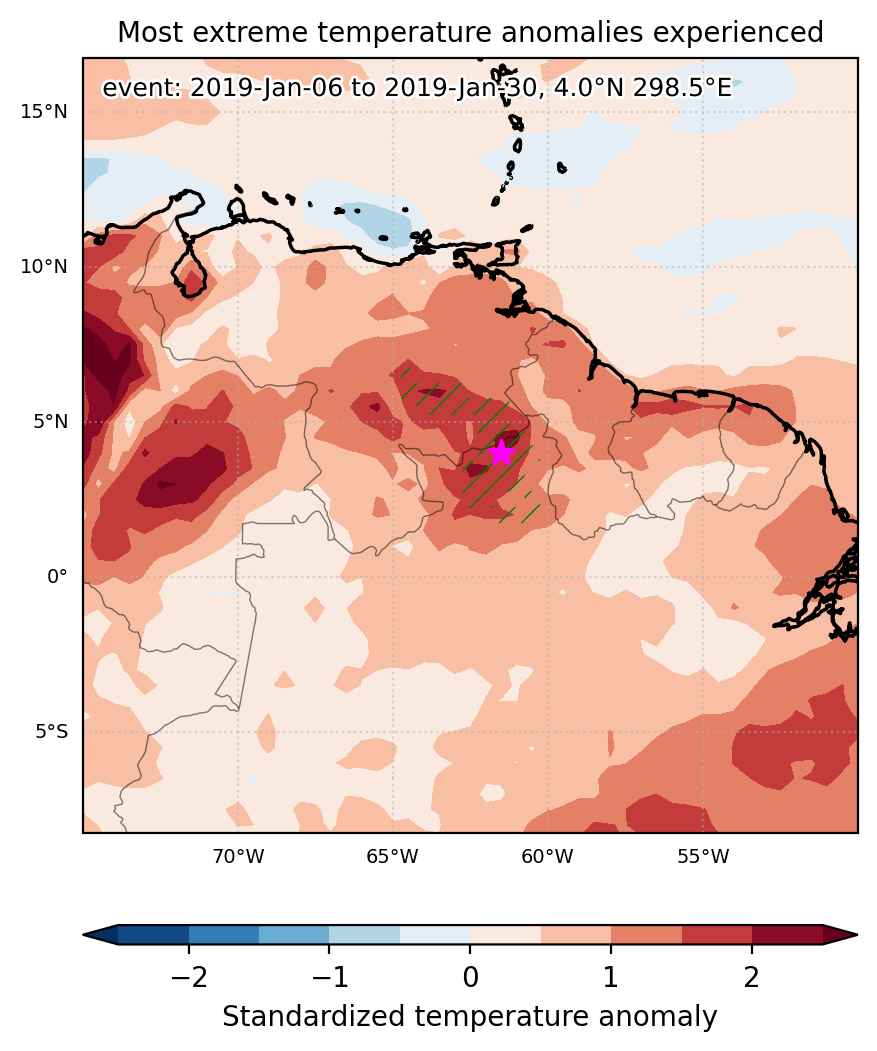
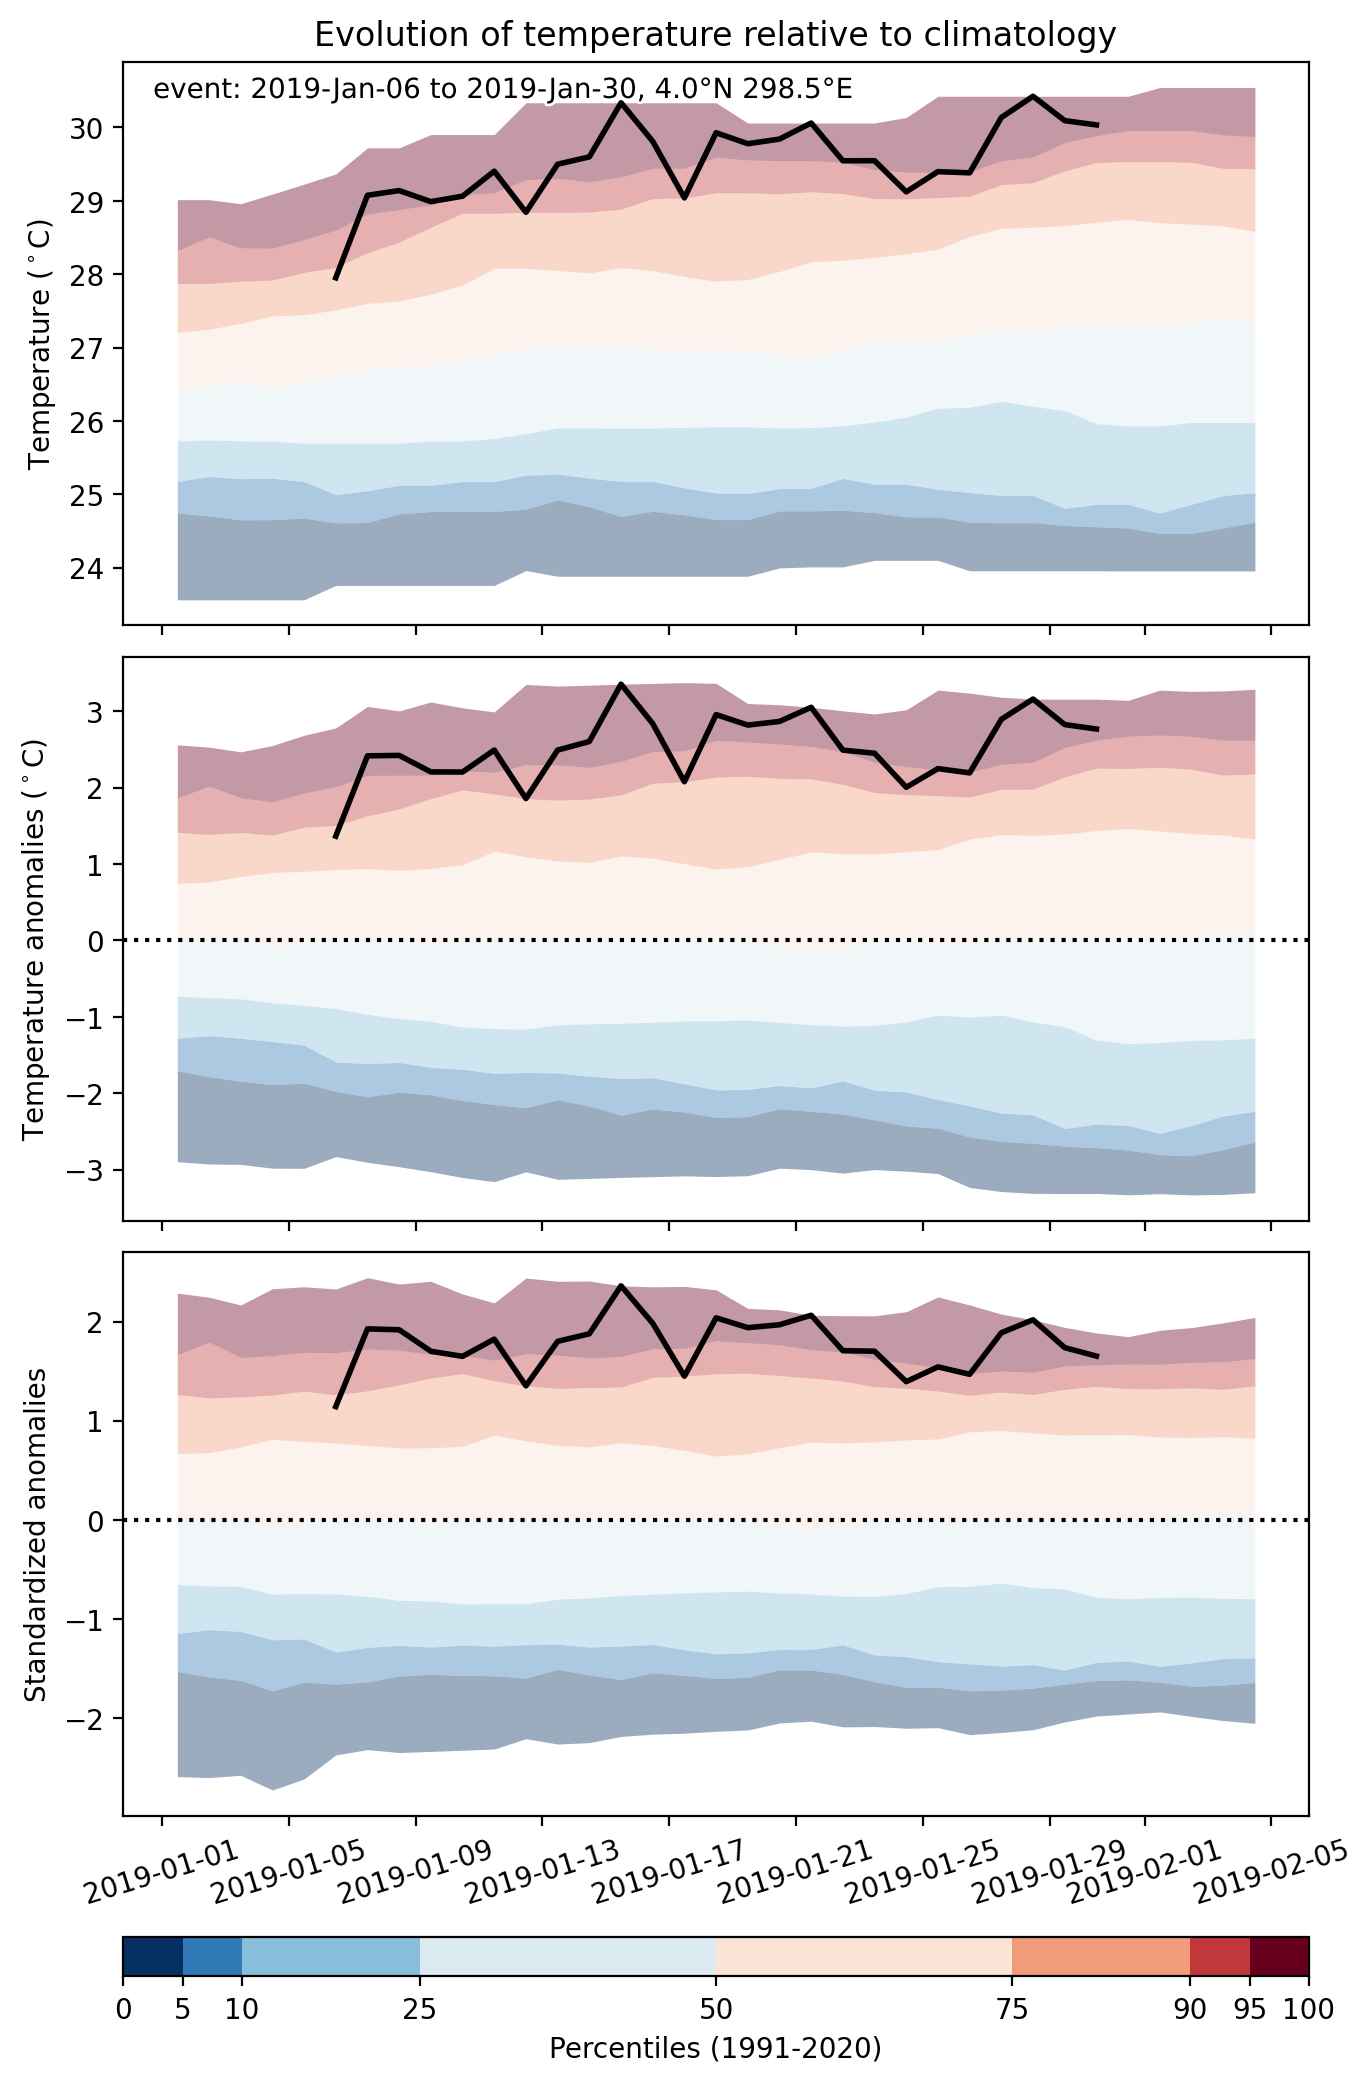
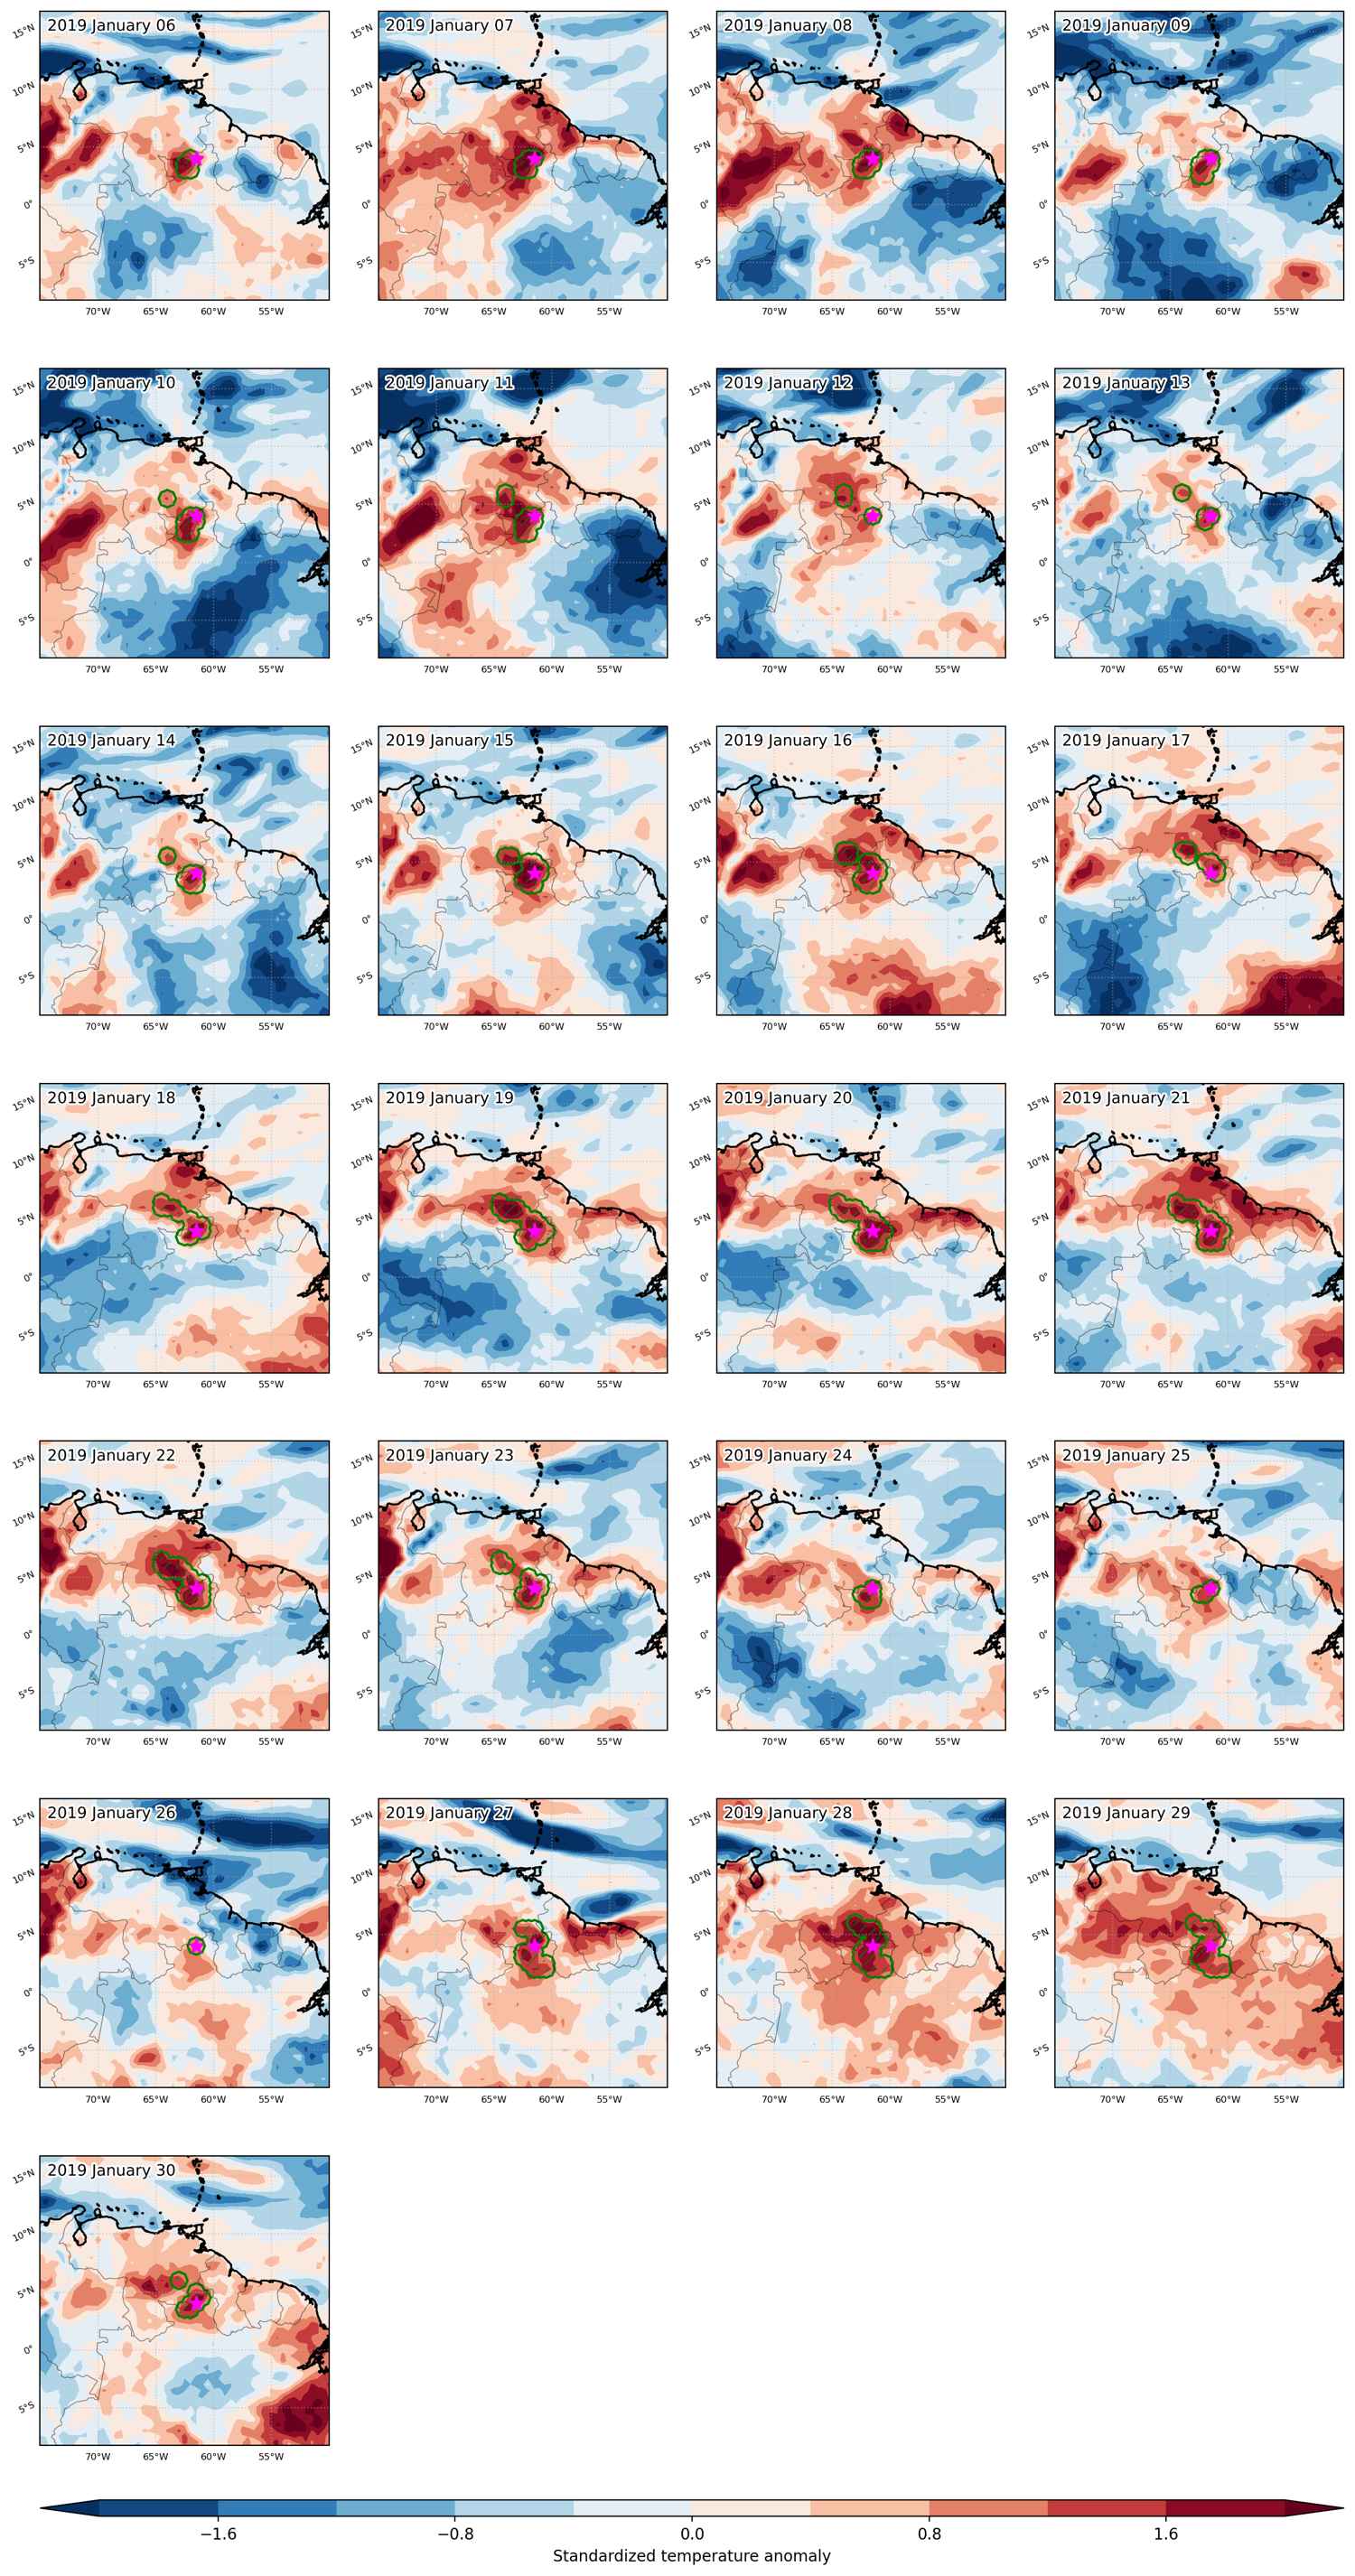
Heat wave occuring from January 06 2019 to January 30 2019 at 4.0°N 298.5°E

Download data: JSON

Event type: Heat wave

Countries affected (identified with ArcGIS Online; provided only for geographical reference):

  • Brazil
  • Venezuela

Duration: 25 days

Time span: January 06 2019 to January 30 2019

Statistics over entire affected area:

  • Mean temperature anomaly: 2.0 °C
  • Mean temperature: 27.3 °C
  • Maximum temperature anomaly: 3.4 °C
  • Maximum temperature: 31.5 °C

Event center: 4.0°N 298.5°E

Area affected: 104786 km$^2$


Fig. 1: Map of most extreme temperature anomalies (standardized) experienced during the event. The purple star indicates the center of the extreme event. Green hatching illustrates all areas under the effect of extremes at some time during the event.


Fig. 2: Evolution of temperature at the center of the event. The climatological percentile distribution is illustrated with color shadings.


Fig. 3: Maps illustrating the evolution of standardized temperature anomalies during the event.

Event ID: Heat_wave_2019-Jan-06_to_2019-Jan-30_298.5_4.0

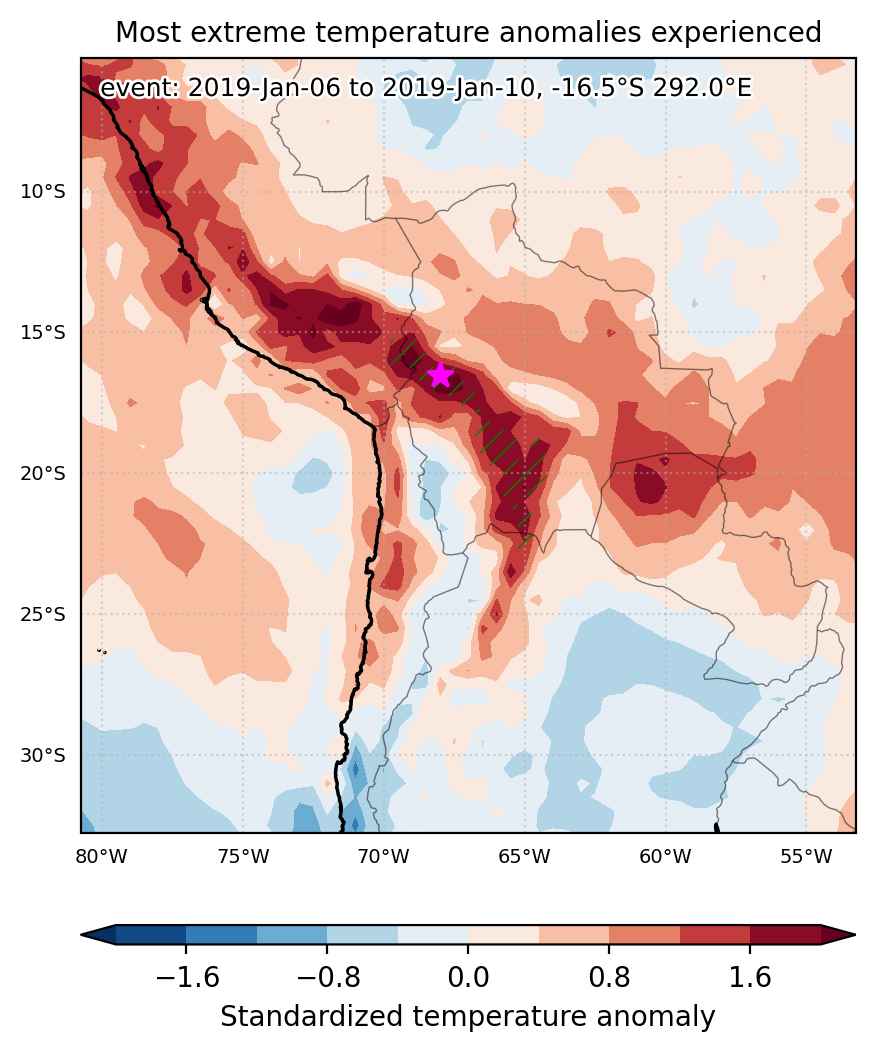
Heat wave occuring from January 06 2019 to January 10 2019 at -16.5°S 292.0°E

Download data: JSON

Event type: Heat wave

Countries affected (identified with ArcGIS Online; provided only for geographical reference):

  • Argentina
  • Bolivia
  • Peru

Duration: 5 days

Time span: January 06 2019 to January 10 2019

Statistics over entire affected area:

  • Mean temperature anomaly: 2.4 °C
  • Mean temperature: 14.2 °C
  • Maximum temperature anomaly: 3.8 °C
  • Maximum temperature: 20.7 °C

Event center: -16.5°S 292.0°E

Area affected: 93696 km$^2$


Fig. 1: Map of most extreme temperature anomalies (standardized) experienced during the event. The purple star indicates the center of the extreme event. Green hatching illustrates all areas under the effect of extremes at some time during the event.


Fig. 2: Evolution of temperature at the center of the event. The climatological percentile distribution is illustrated with color shadings.


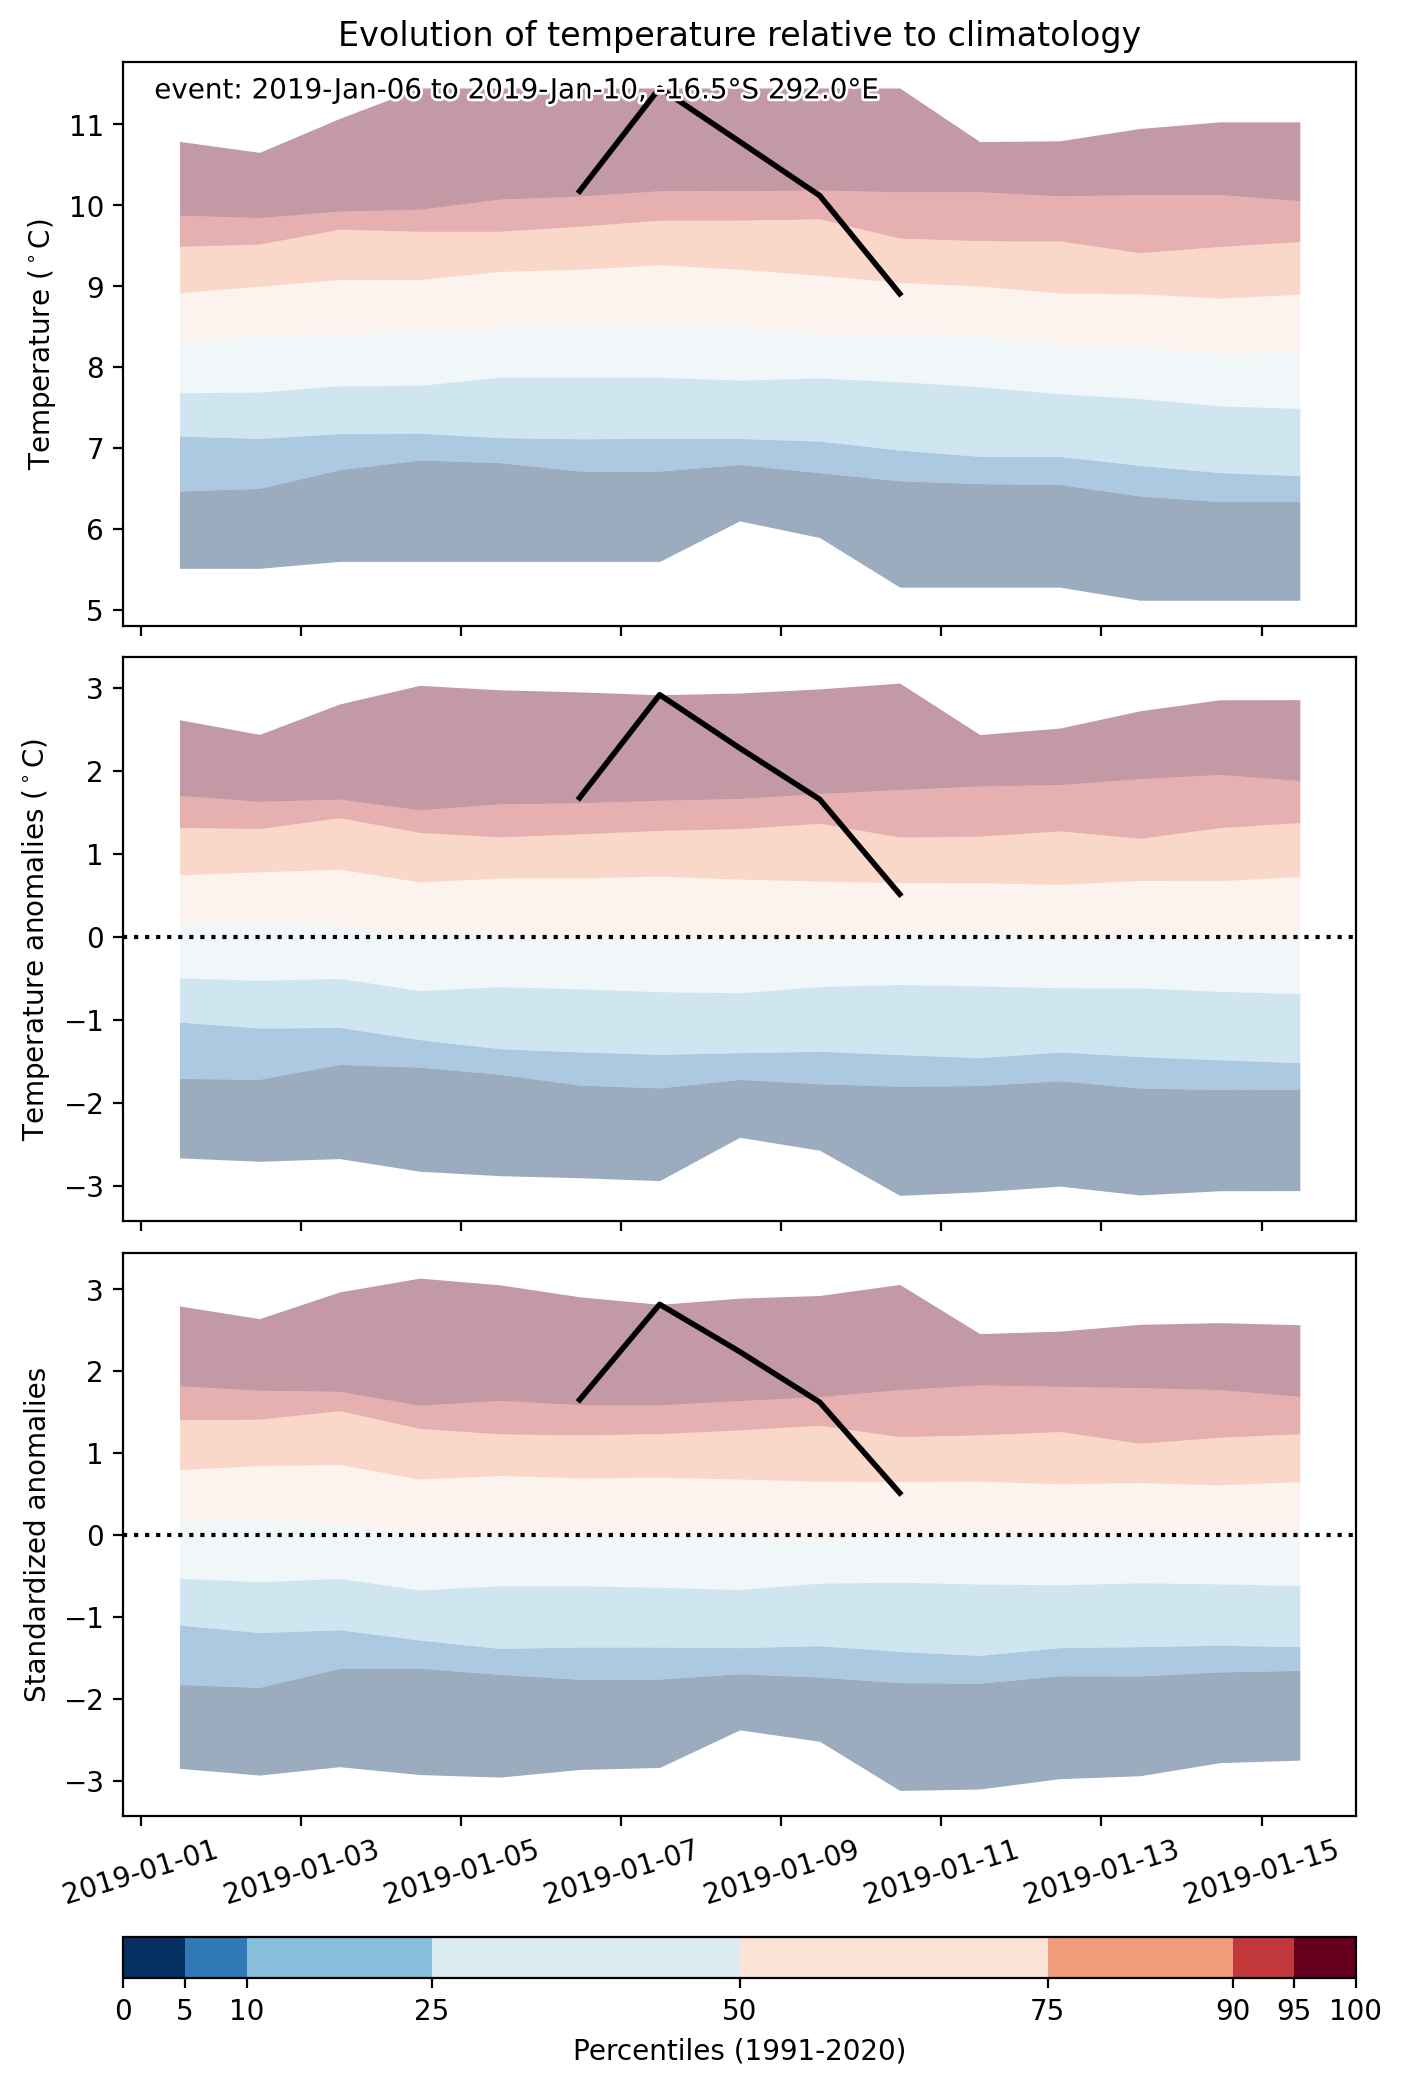
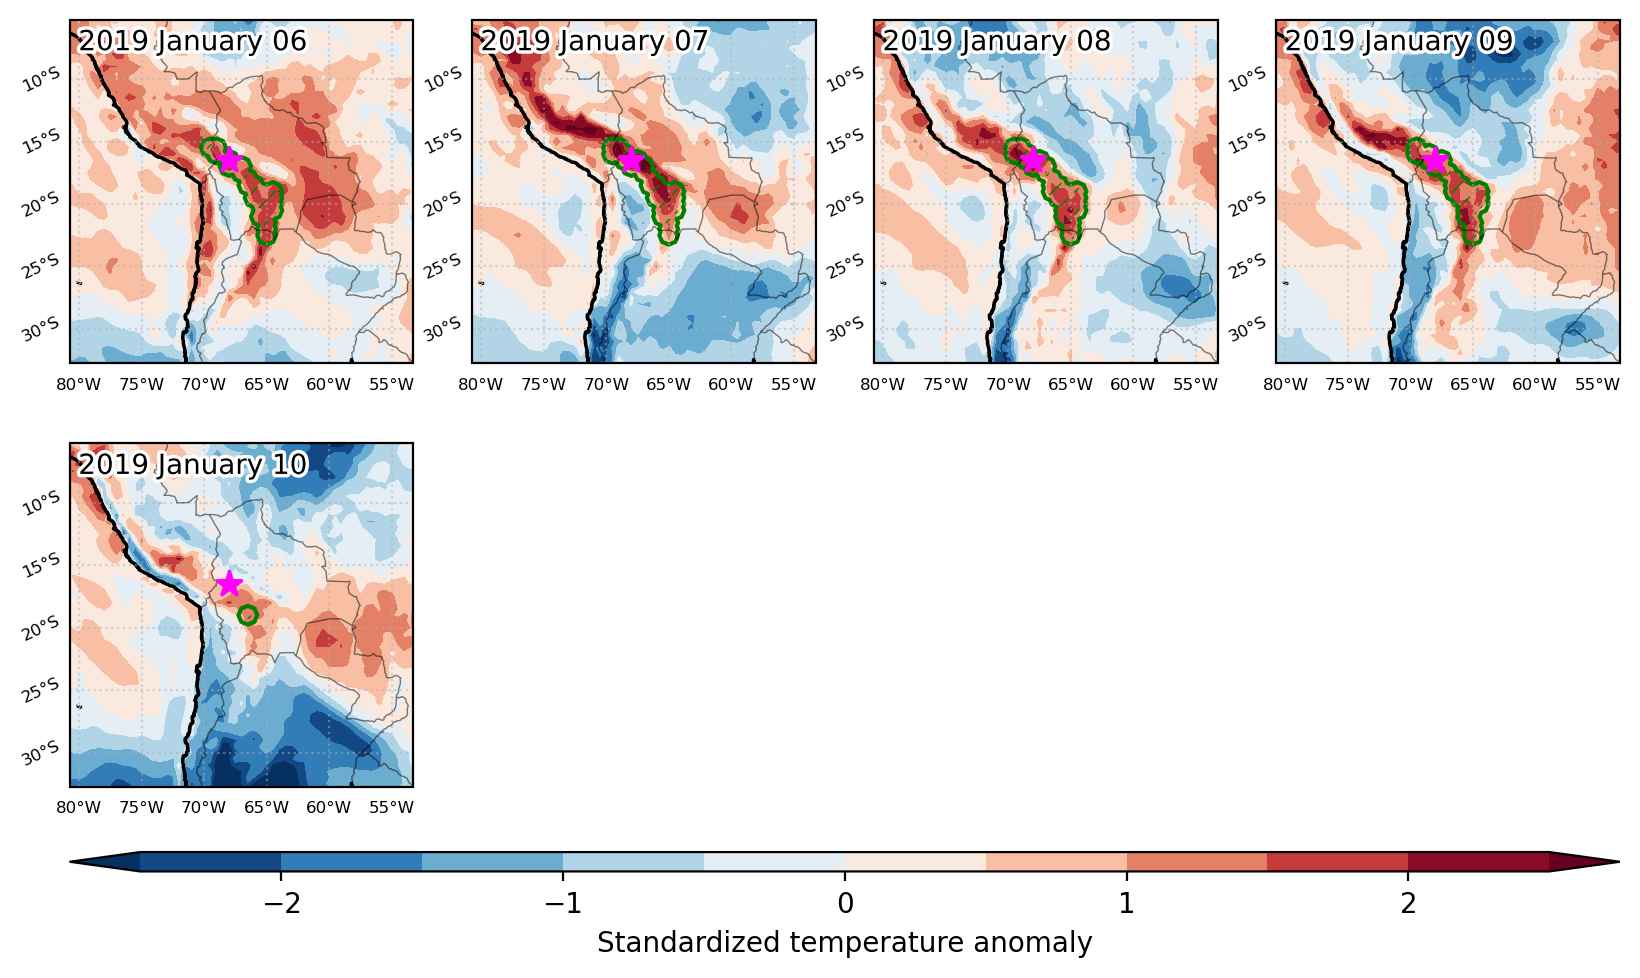
Fig. 3: Maps illustrating the evolution of standardized temperature anomalies during the event.

Event ID: Heat_wave_2019-Jan-06_to_2019-Jan-10_292.0_-16.5