Cold spell occuring from September 28 2014 to October 12 2014 at 12.5°N 41.0°E

Download data: JSON

Event type: Cold spell

Countries affected (identified with ArcGIS Online; provided only for geographical reference):

  • Algeria
  • Chad
  • Djibouti
  • Egypt
  • Eritrea
  • Ethiopia
  • Libya
  • Mali
  • Niger
  • Saudi Arabia
  • Somalia
  • Sudan
  • Yemen

Duration: 15 days

Time span: September 28 2014 to October 12 2014

Statistics over entire affected area:

  • Mean temperature anomaly: -3.5 °C
  • Mean temperature: 25.0 °C
  • Minimum temperature anomaly: -6.5 °C
  • Minimum temperature: 14.8 °C

Event center: 12.5°N 41.0°E

Area affected: 5540473 km$^2$
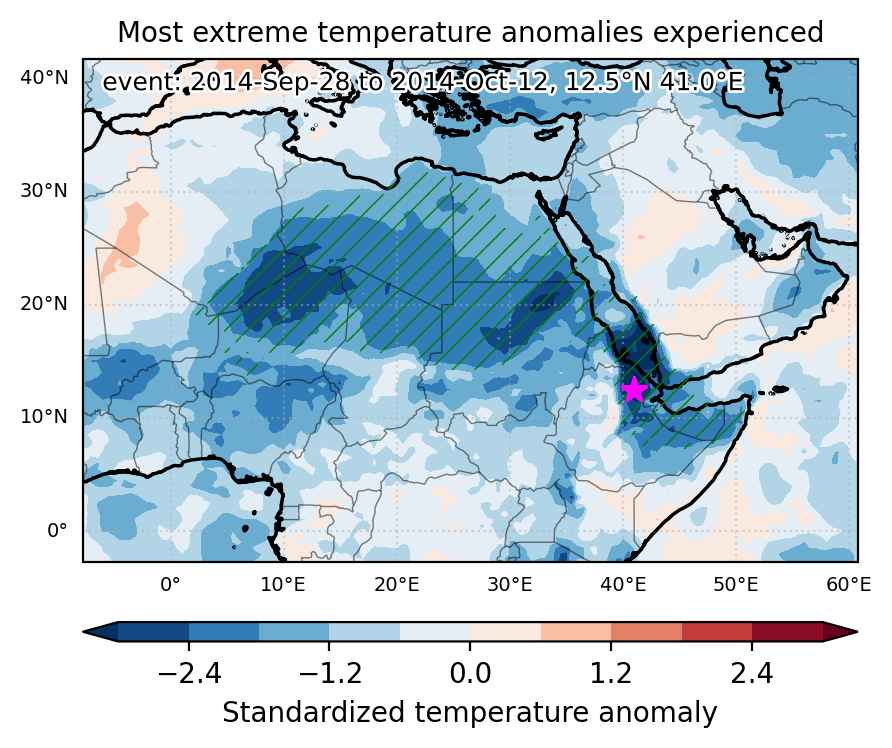

Fig. 1: Map of most extreme temperature anomalies (standardized) experienced during the event. The purple star indicates the center of the extreme event. Green hatching illustrates all areas under the effect of extremes at some time during the event.
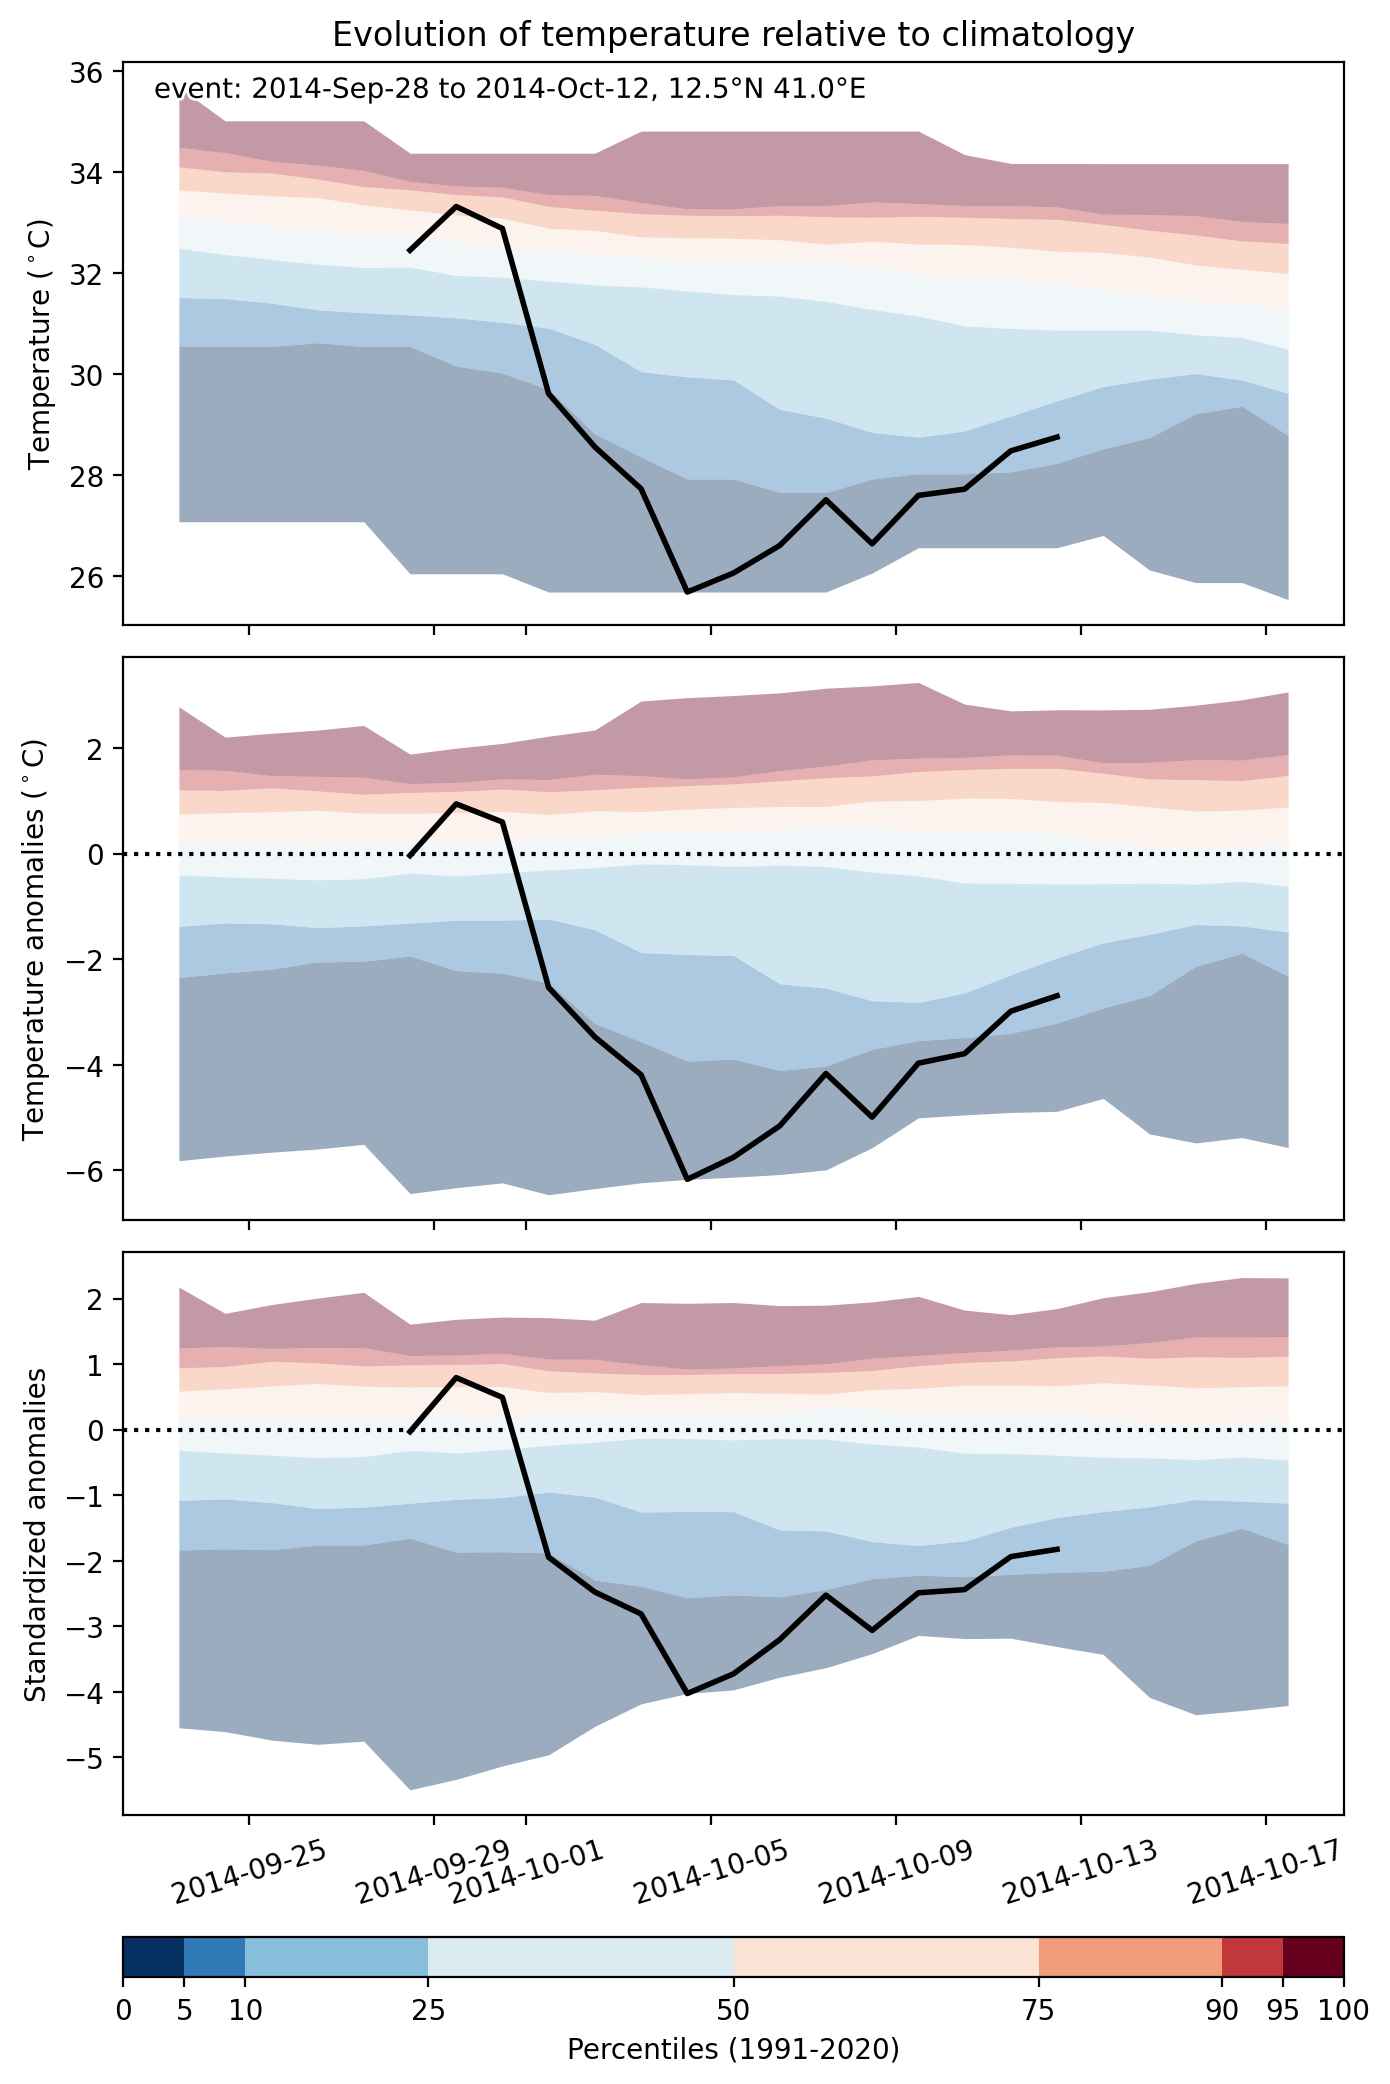


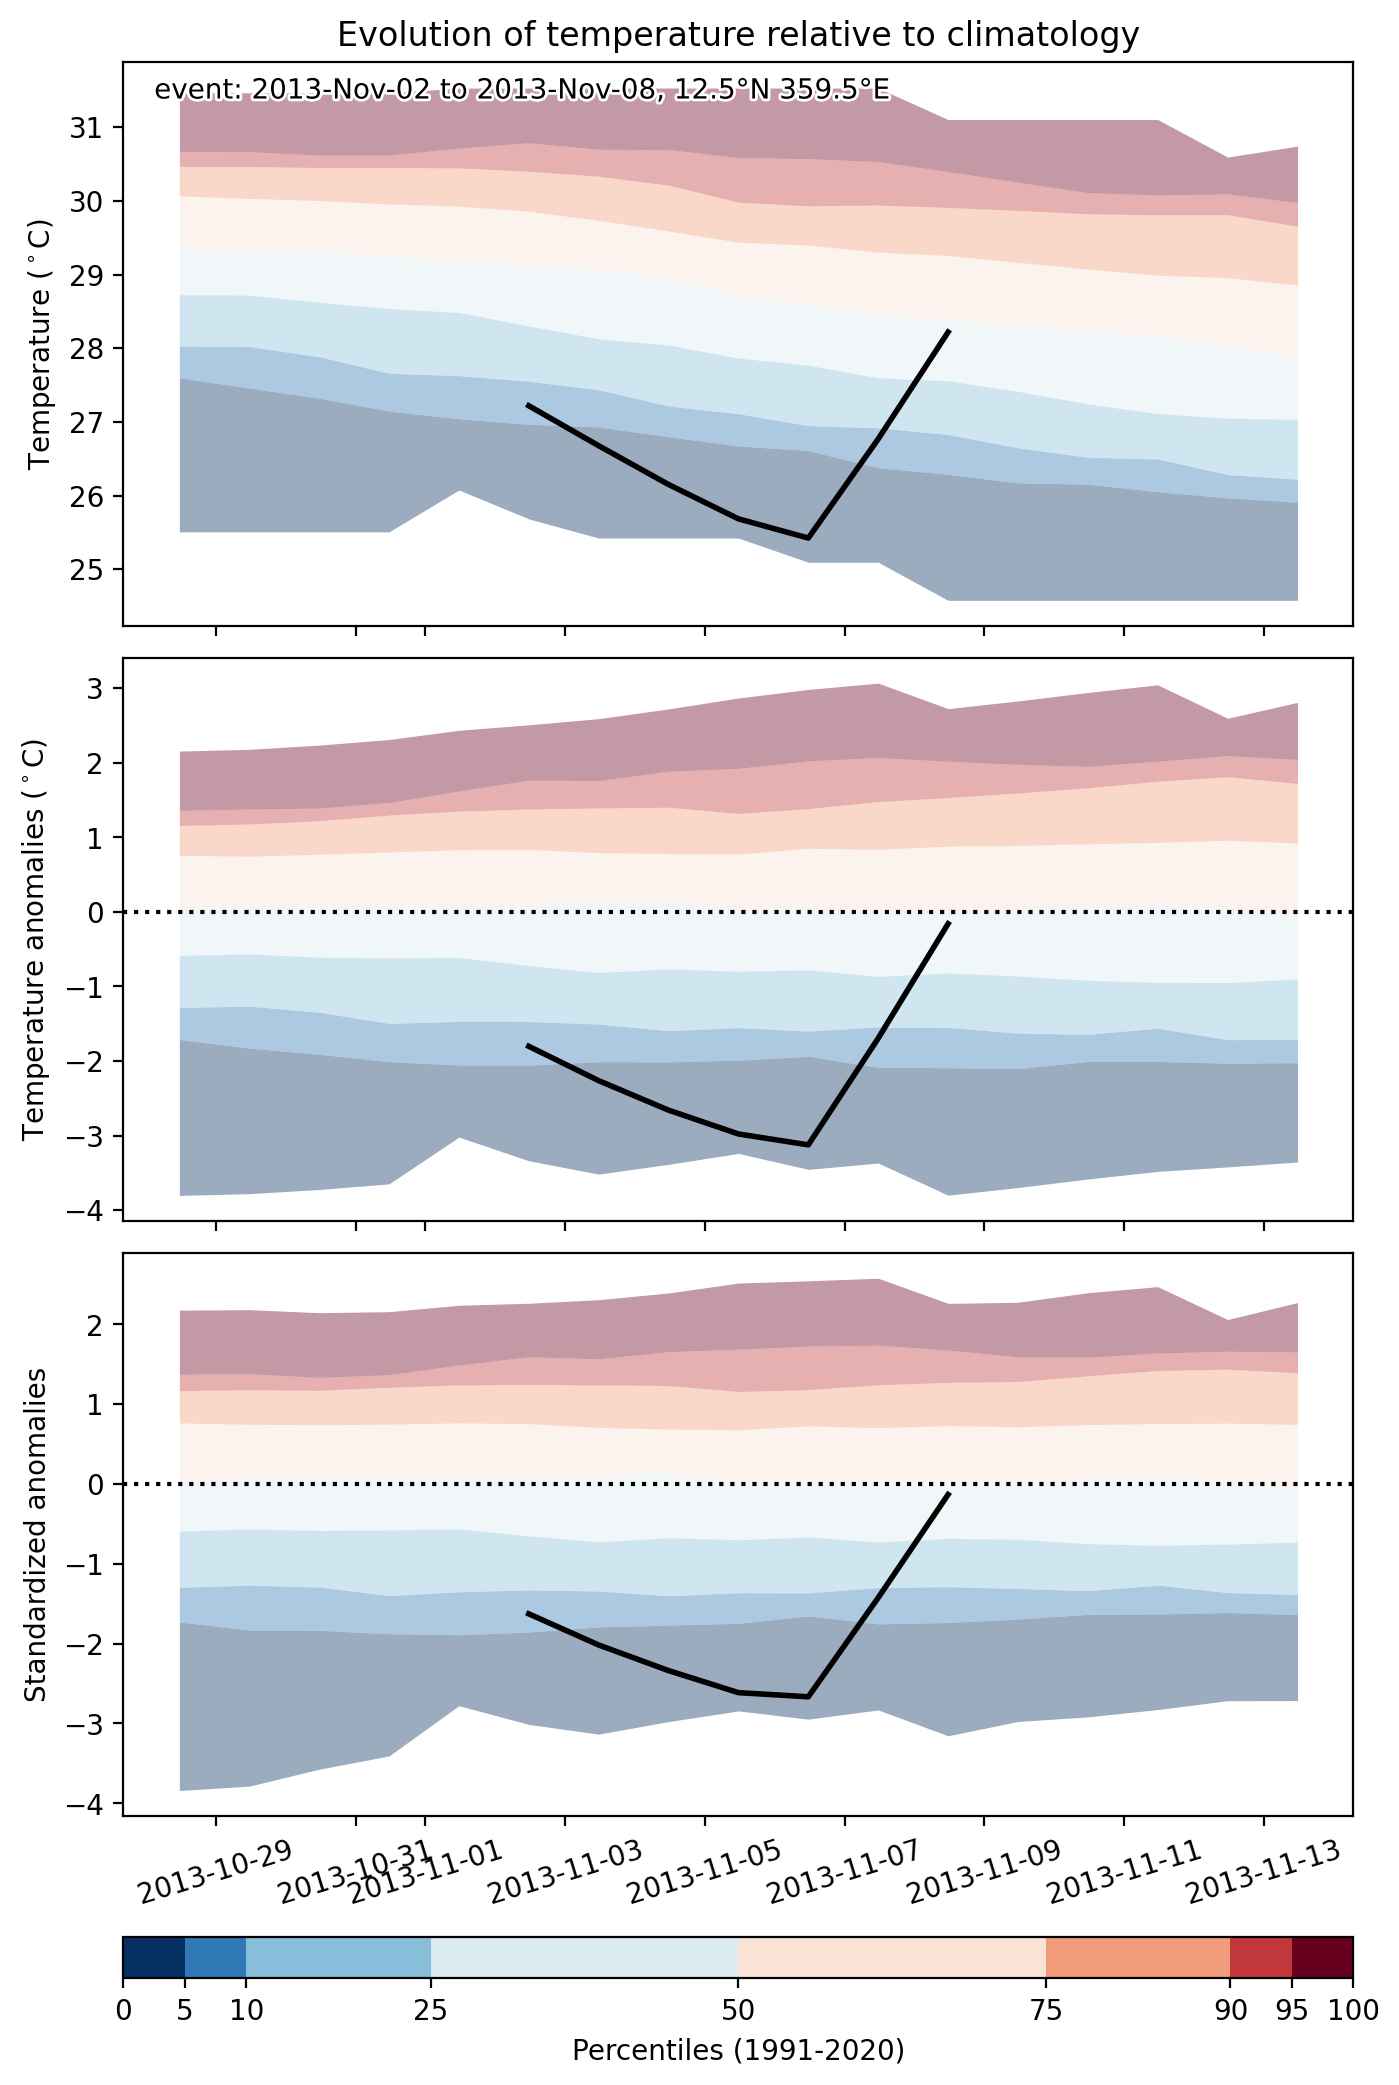
Fig. 2: Evolution of temperature at the center of the event. The climatological percentile distribution is illustrated with color shadings.
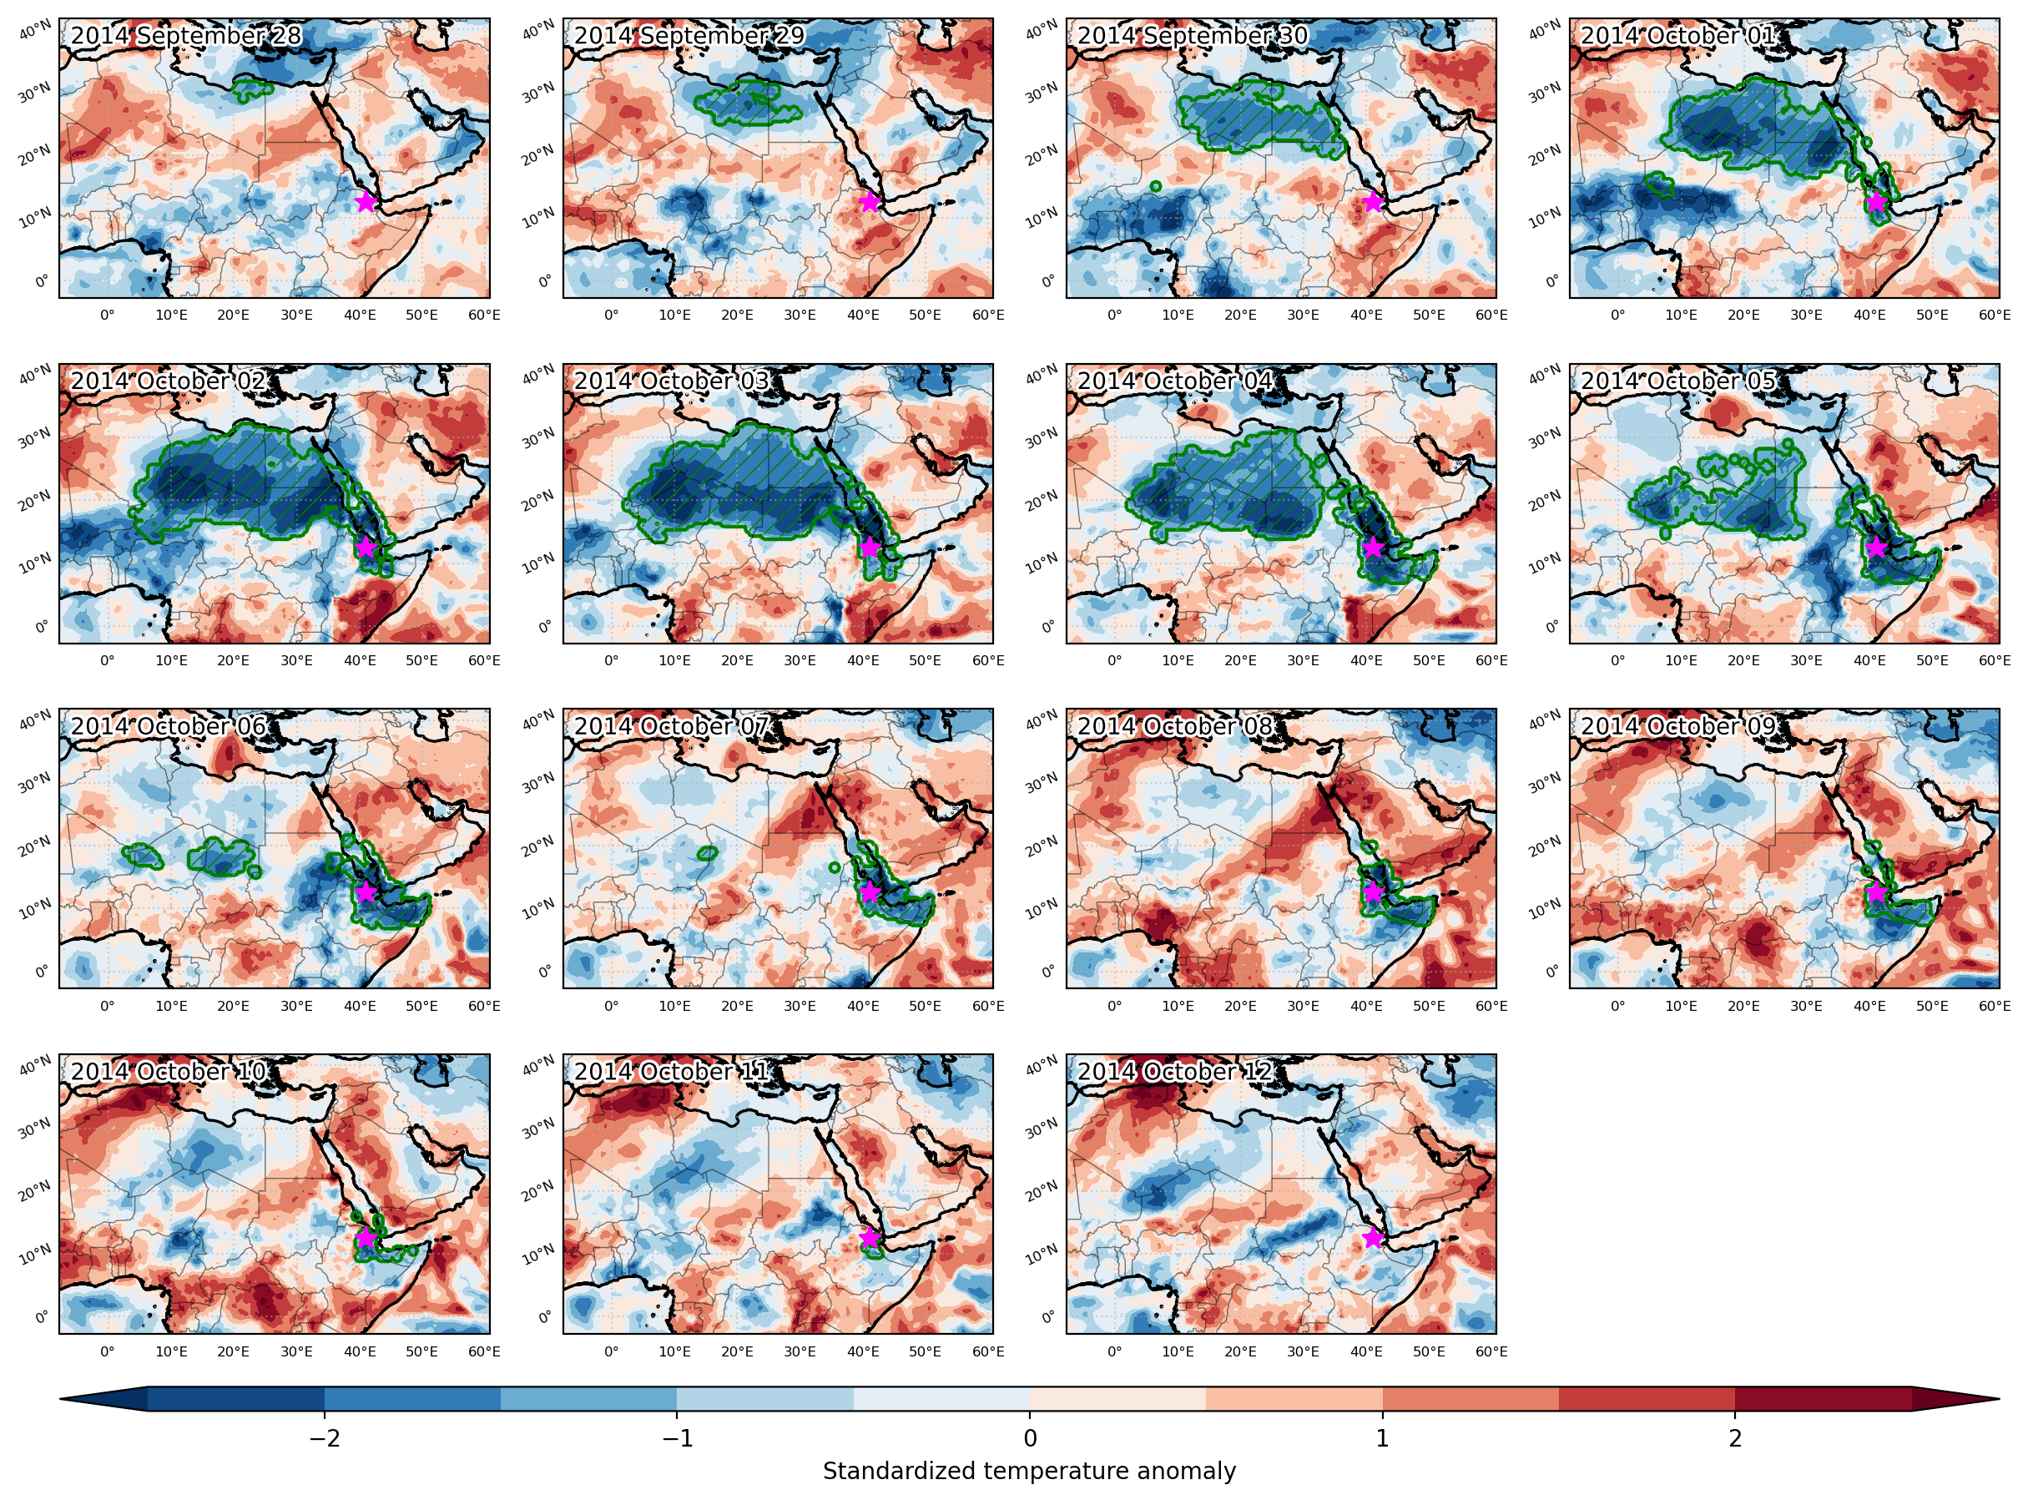


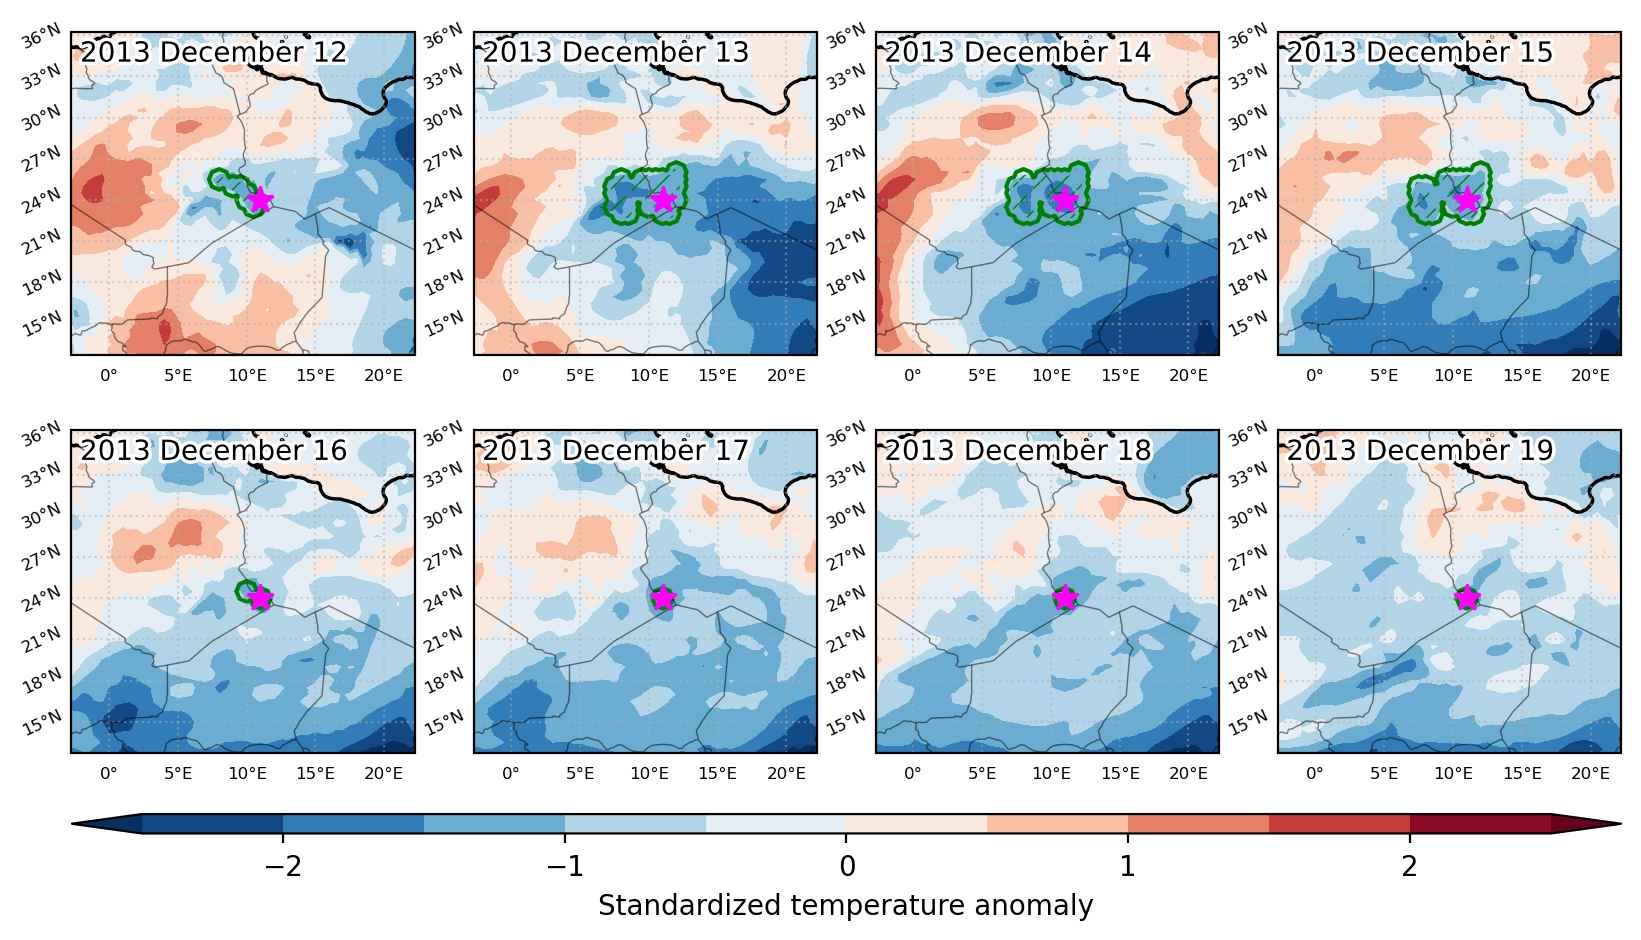
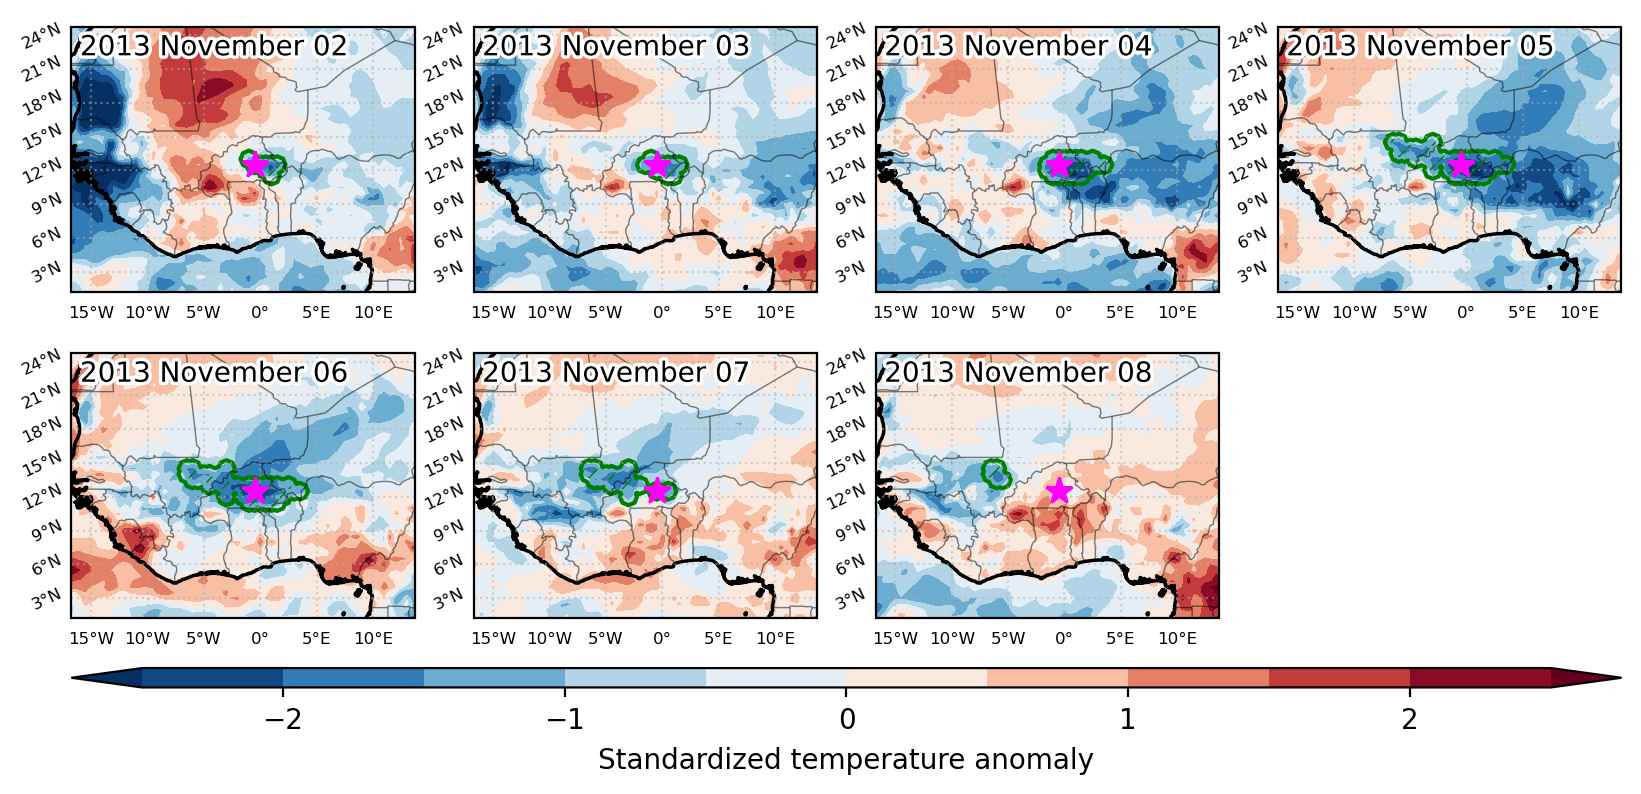
Fig. 3: Maps illustrating the evolution of standardized temperature anomalies during the event.

Event ID: Cold_spell_2014-Sep-28_to_2014-Oct-12_41.0_12.5
Cold spell occuring from September 28 2014 to October 03 2014 at 13.0°N 15.0°E

Download data: JSON

Event type: Cold spell

Countries affected (identified with ArcGIS Online; provided only for geographical reference):

  • Benin
  • Cameroon
  • Chad
  • Niger
  • Nigeria

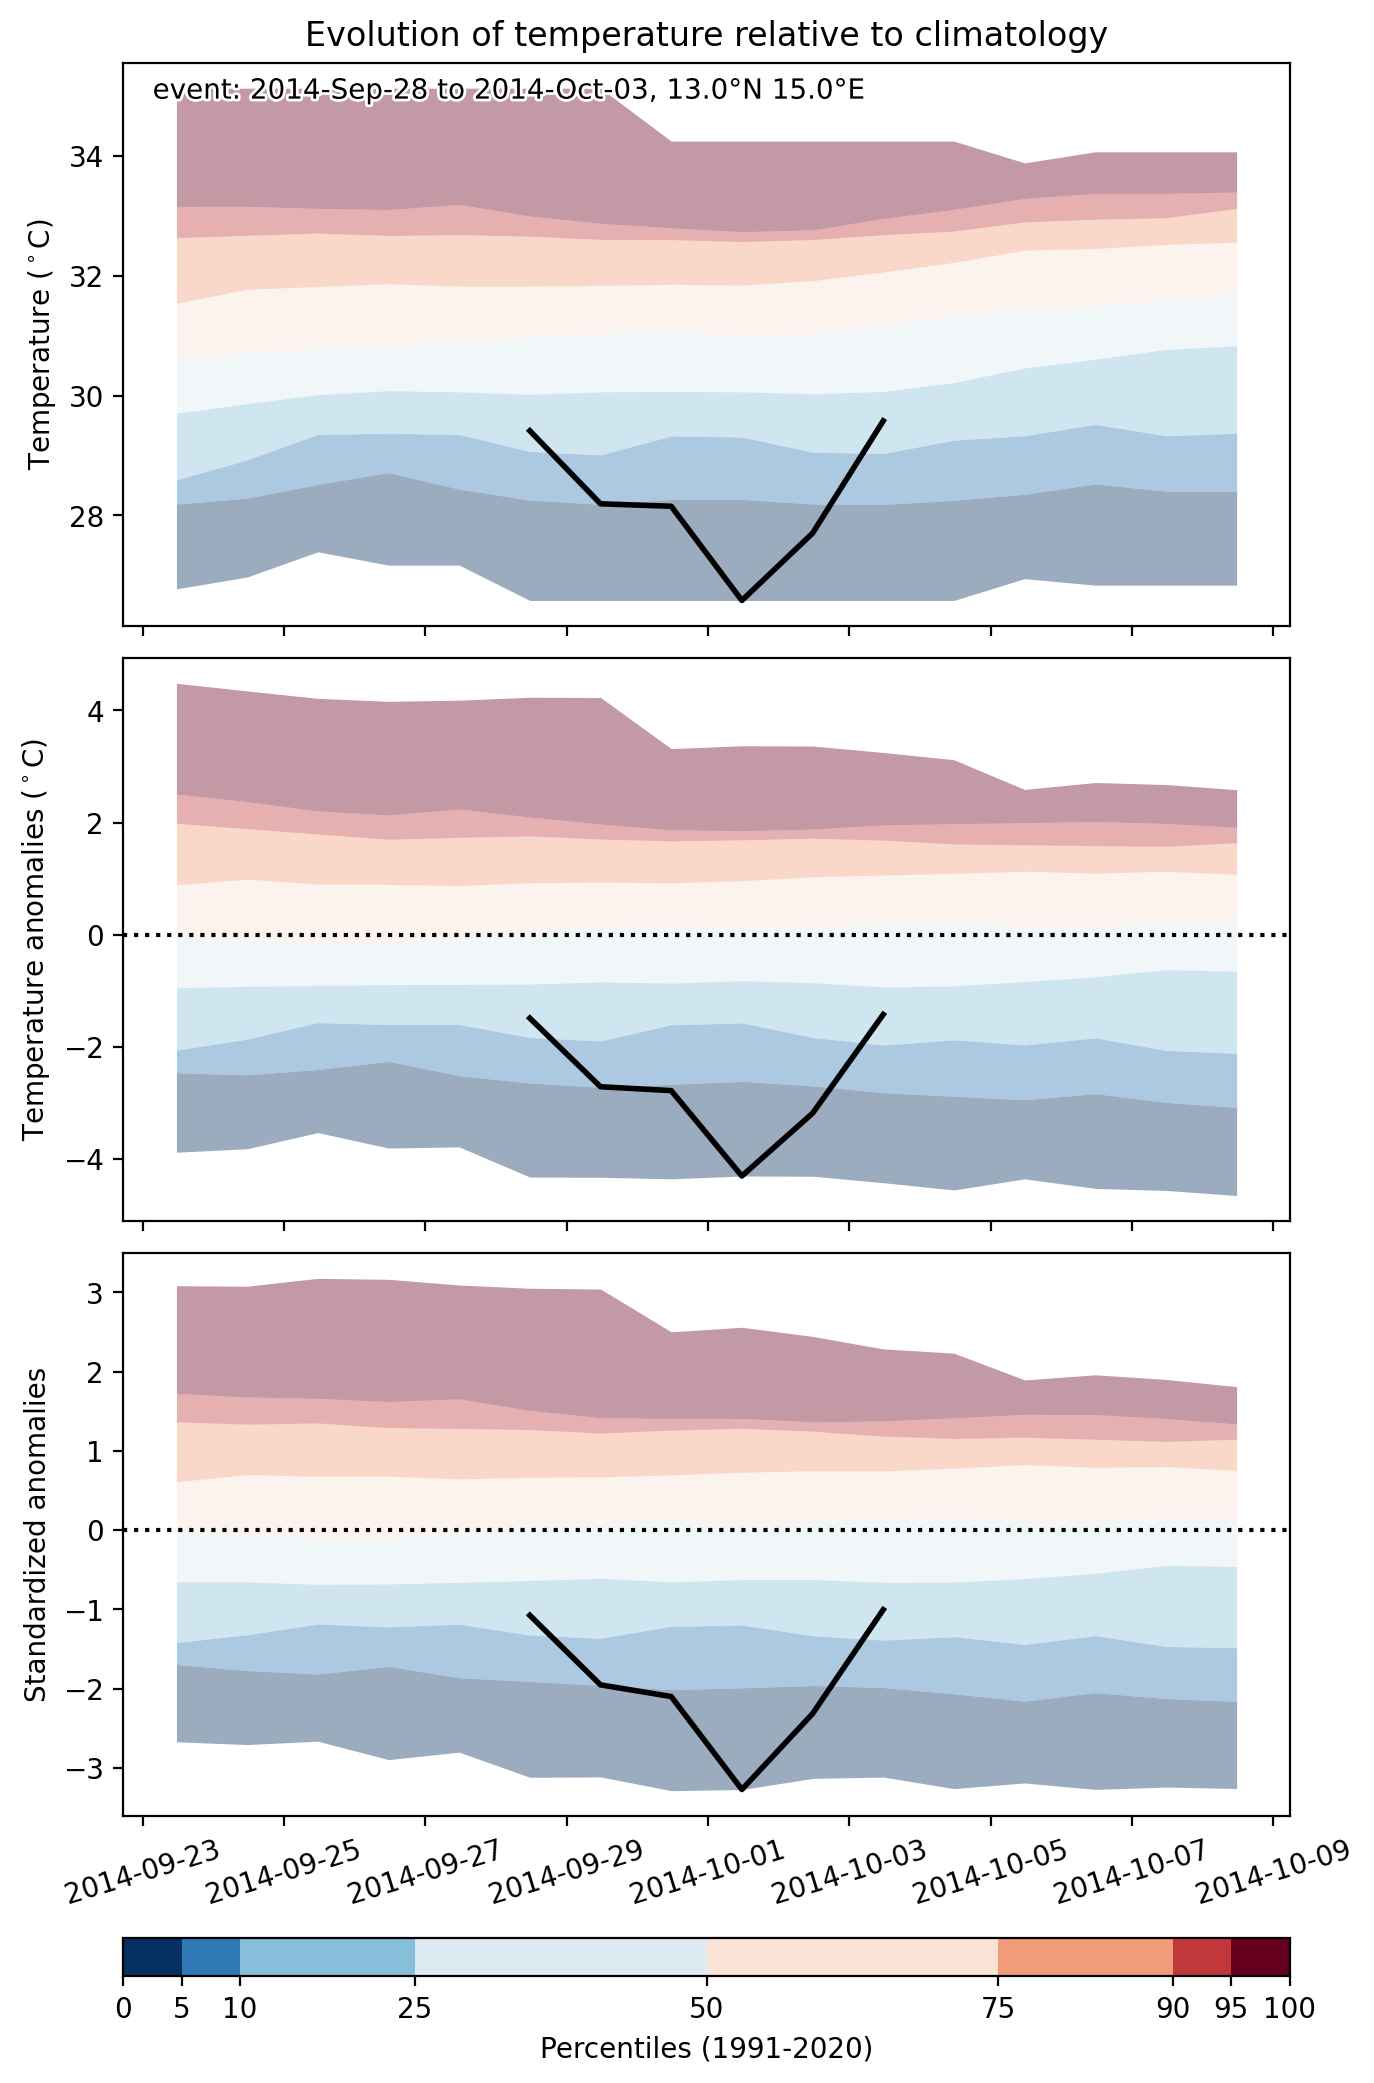
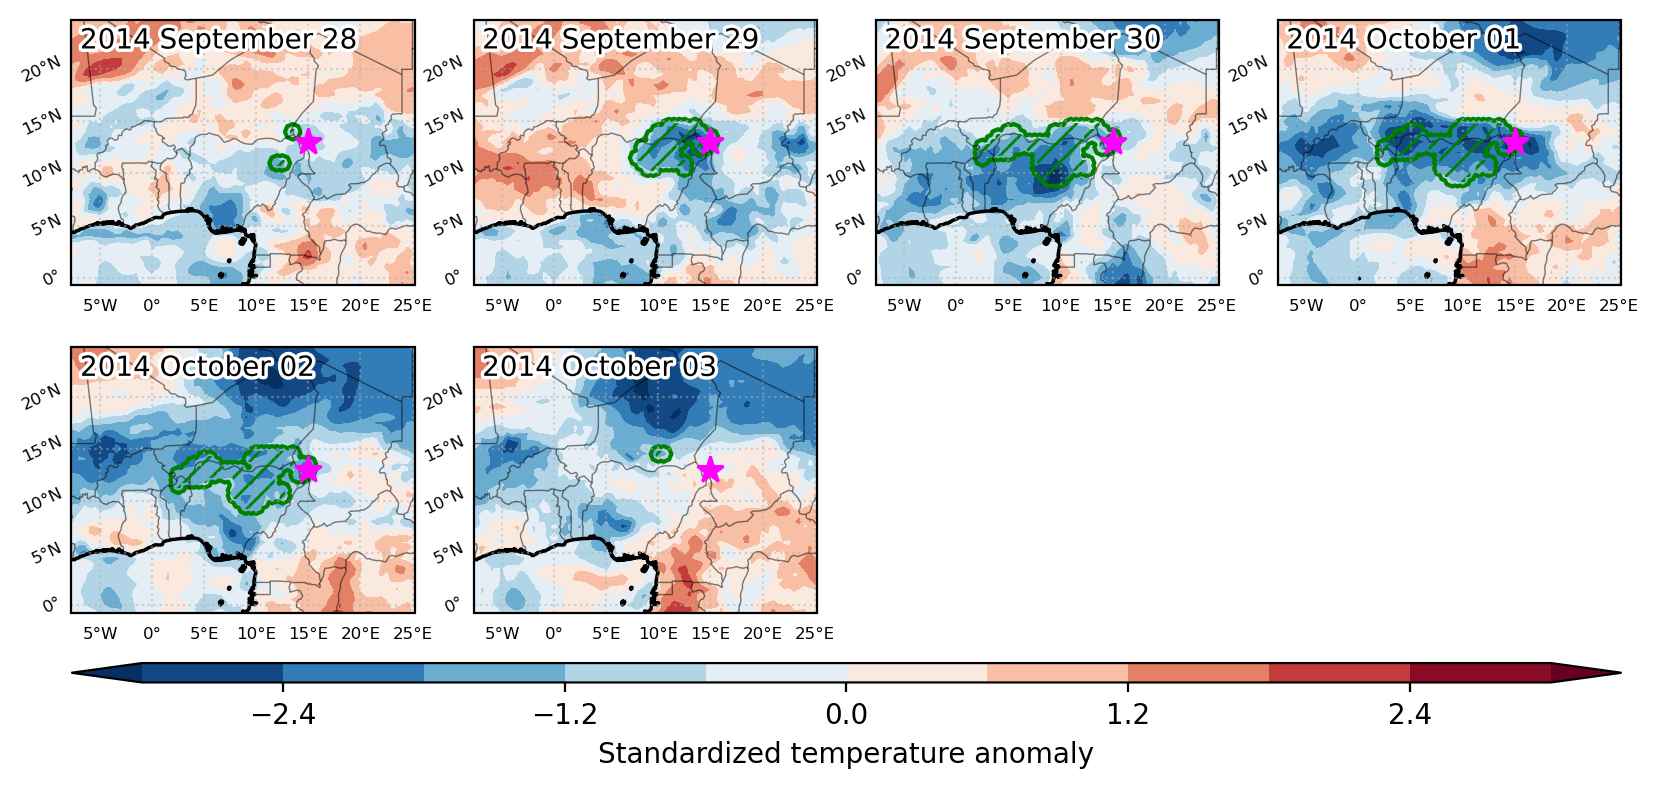
Duration: 6 days

Time span: September 28 2014 to October 03 2014

Statistics over entire affected area:

  • Mean temperature anomaly: -2.3 °C
  • Mean temperature: 26.2 °C
  • Minimum temperature anomaly: -4.5 °C
  • Minimum temperature: 18.0 °C

Event center: 13.0°N 15.0°E

Area affected: 368226 km$^2$


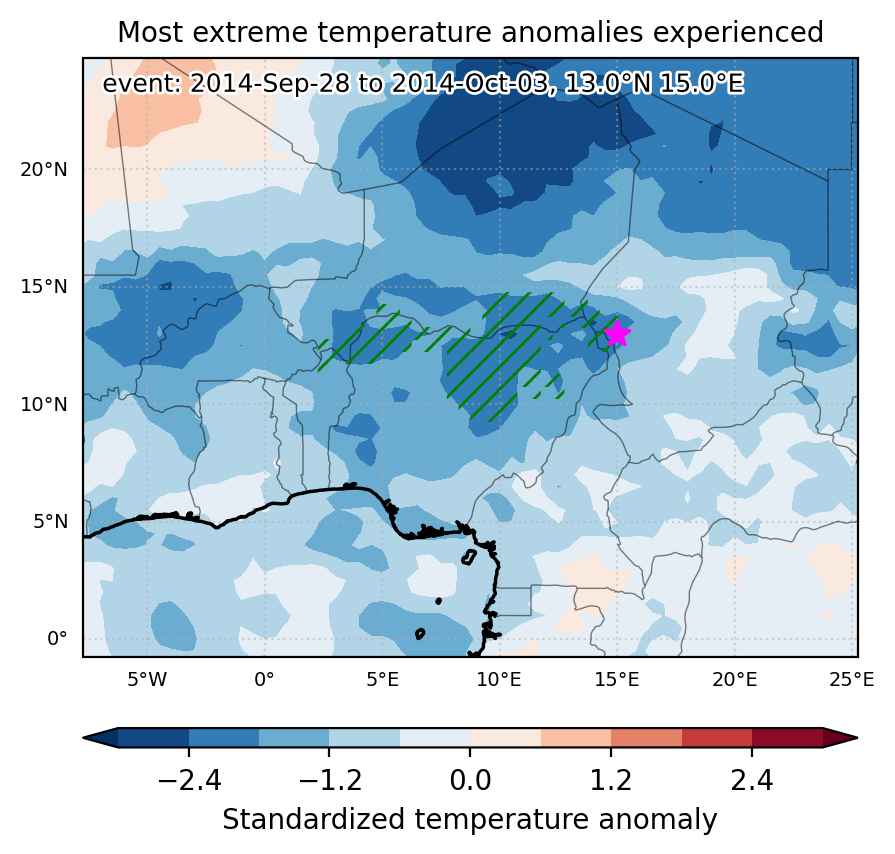
Fig. 1: Map of most extreme temperature anomalies (standardized) experienced during the event. The purple star indicates the center of the extreme event. Green hatching illustrates all areas under the effect of extremes at some time during the event.


Fig. 2: Evolution of temperature at the center of the event. The climatological percentile distribution is illustrated with color shadings.


Fig. 3: Maps illustrating the evolution of standardized temperature anomalies during the event.

Event ID: Cold_spell_2014-Sep-28_to_2014-Oct-03_15.0_13.0

Cold spell occuring from May 14 2014 to May 22 2014 at 16.0°N 354.5°E

Download data: JSON

Event type: Cold spell

Countries affected (identified with ArcGIS Online; provided only for geographical reference):

  • Algeria
  • Burkina Faso
  • Gambia
  • Guinea
  • Guinea-Bissau
  • Mali
  • Mauritania
  • Niger
  • Senegal

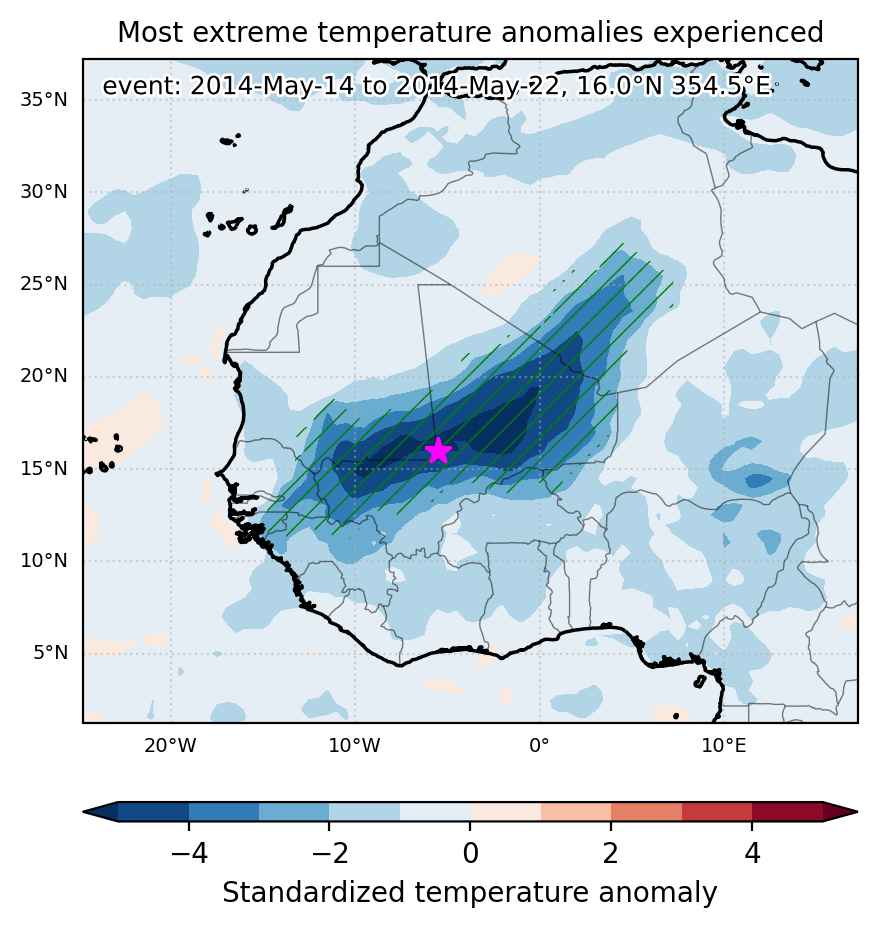
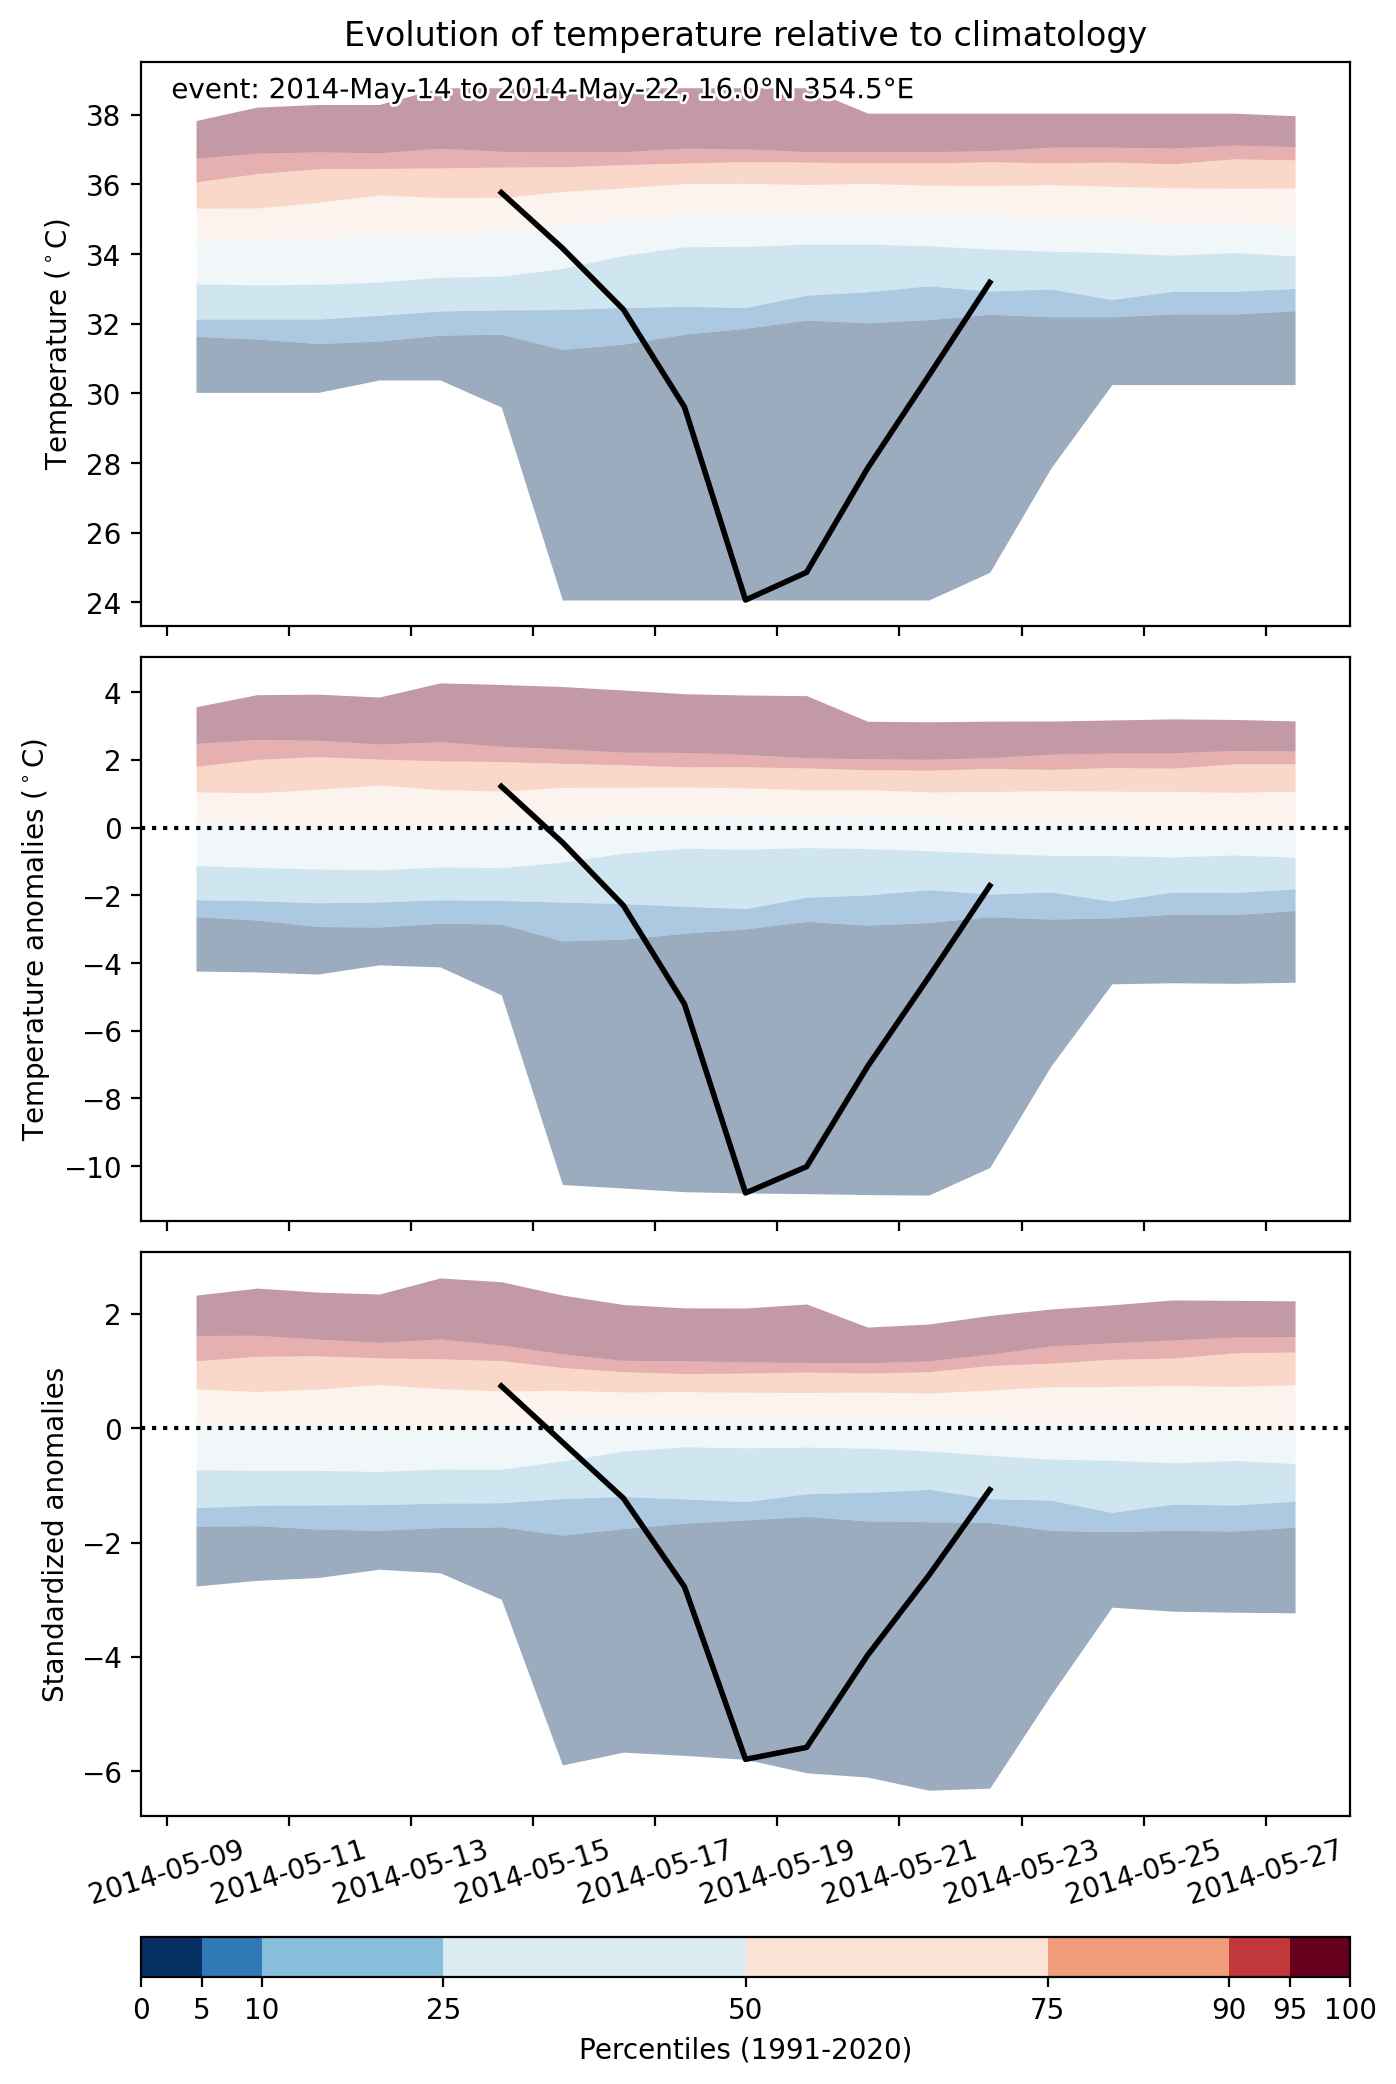
Duration: 9 days

Time span: May 14 2014 to May 22 2014

Statistics over entire affected area:

  • Mean temperature anomaly: -6.0 °C
  • Mean temperature: 28.2 °C
  • Minimum temperature anomaly: -12.6 °C
  • Minimum temperature: 19.4 °C

Event center: 16.0°N 354.5°E

Area affected: 1694674 km$^2$


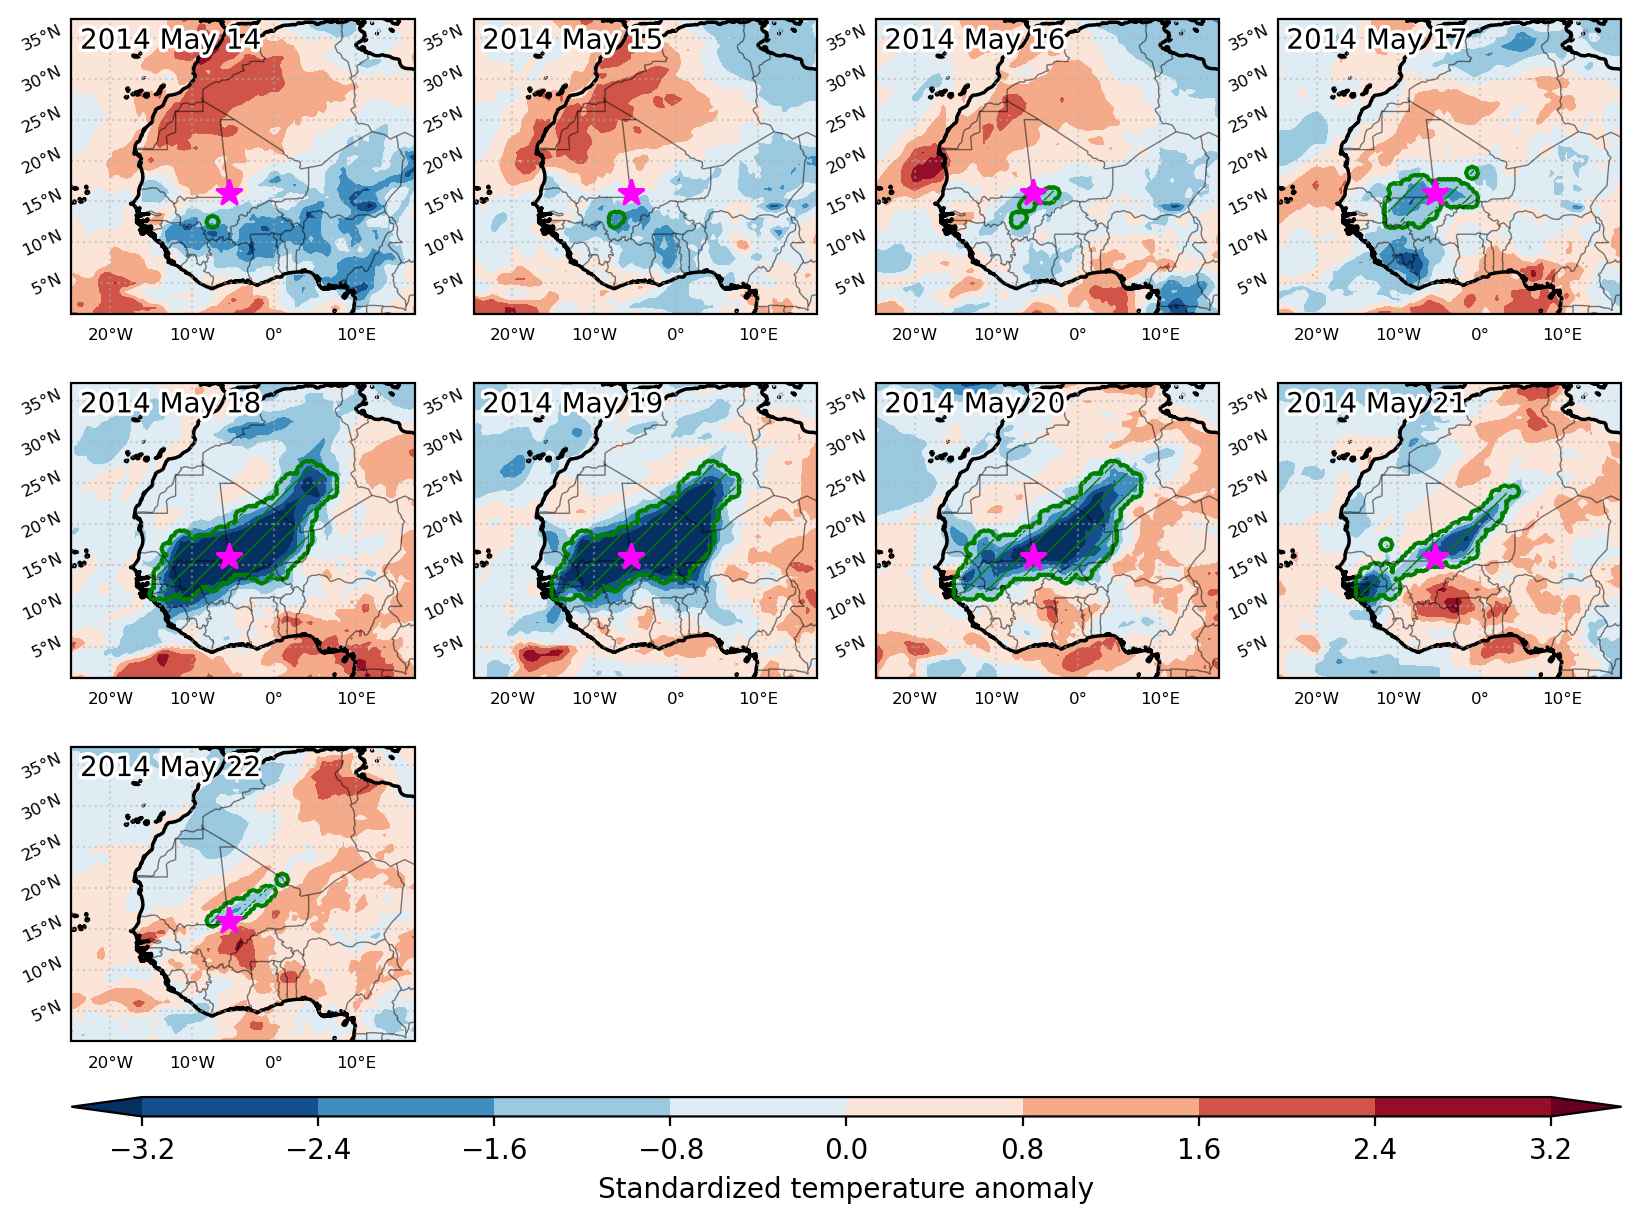
Fig. 1: Map of most extreme temperature anomalies (standardized) experienced during the event. The purple star indicates the center of the extreme event. Green hatching illustrates all areas under the effect of extremes at some time during the event.


Fig. 2: Evolution of temperature at the center of the event. The climatological percentile distribution is illustrated with color shadings.


Fig. 3: Maps illustrating the evolution of standardized temperature anomalies during the event.

Event ID: Cold_spell_2014-May-14_to_2014-May-22_354.5_16.0

Cold spell occuring from May 04 2014 to May 15 2014 at 17.0°N 2.5°E

Download data: JSON

Event type: Cold spell

Countries affected (identified with ArcGIS Online; provided only for geographical reference):

  • Benin
  • Burkina Faso
  • Cameroon
  • Ghana
  • Mali
  • Niger
  • Nigeria
  • Togo

Duration: 12 days

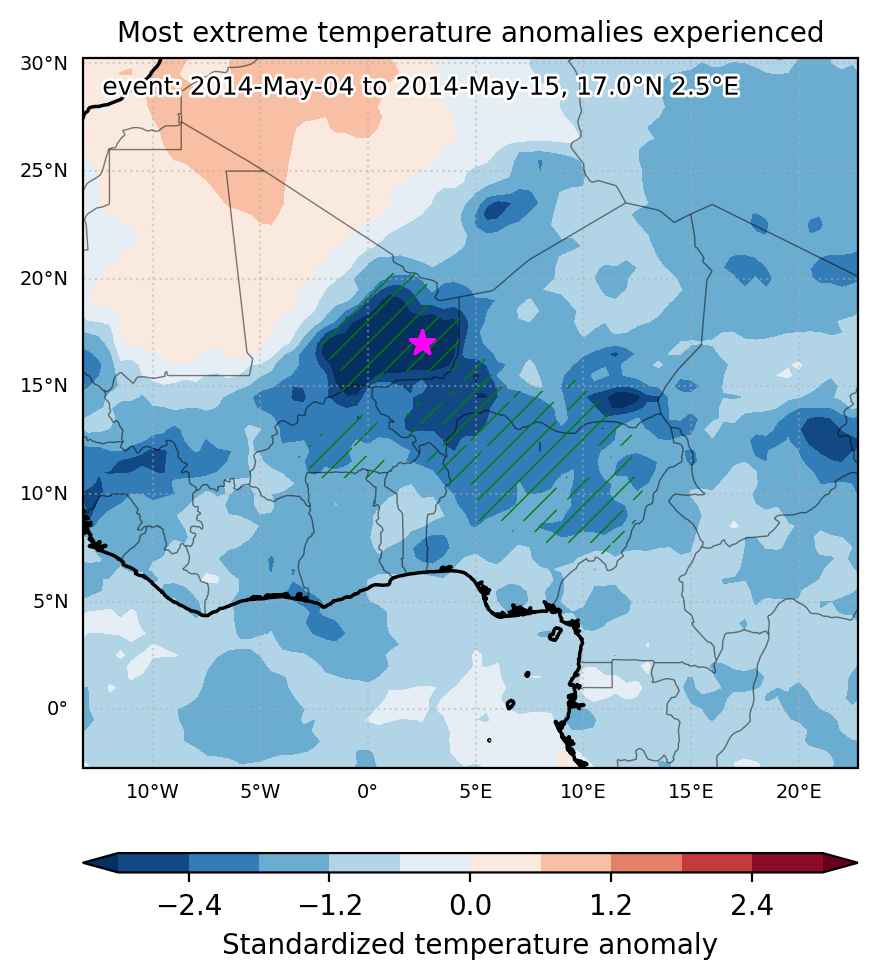
Time span: May 04 2014 to May 15 2014

Statistics over entire affected area:

  • Mean temperature anomaly: -3.9 °C
  • Mean temperature: 28.9 °C
  • Minimum temperature anomaly: -10.4 °C
  • Minimum temperature: 22.6 °C

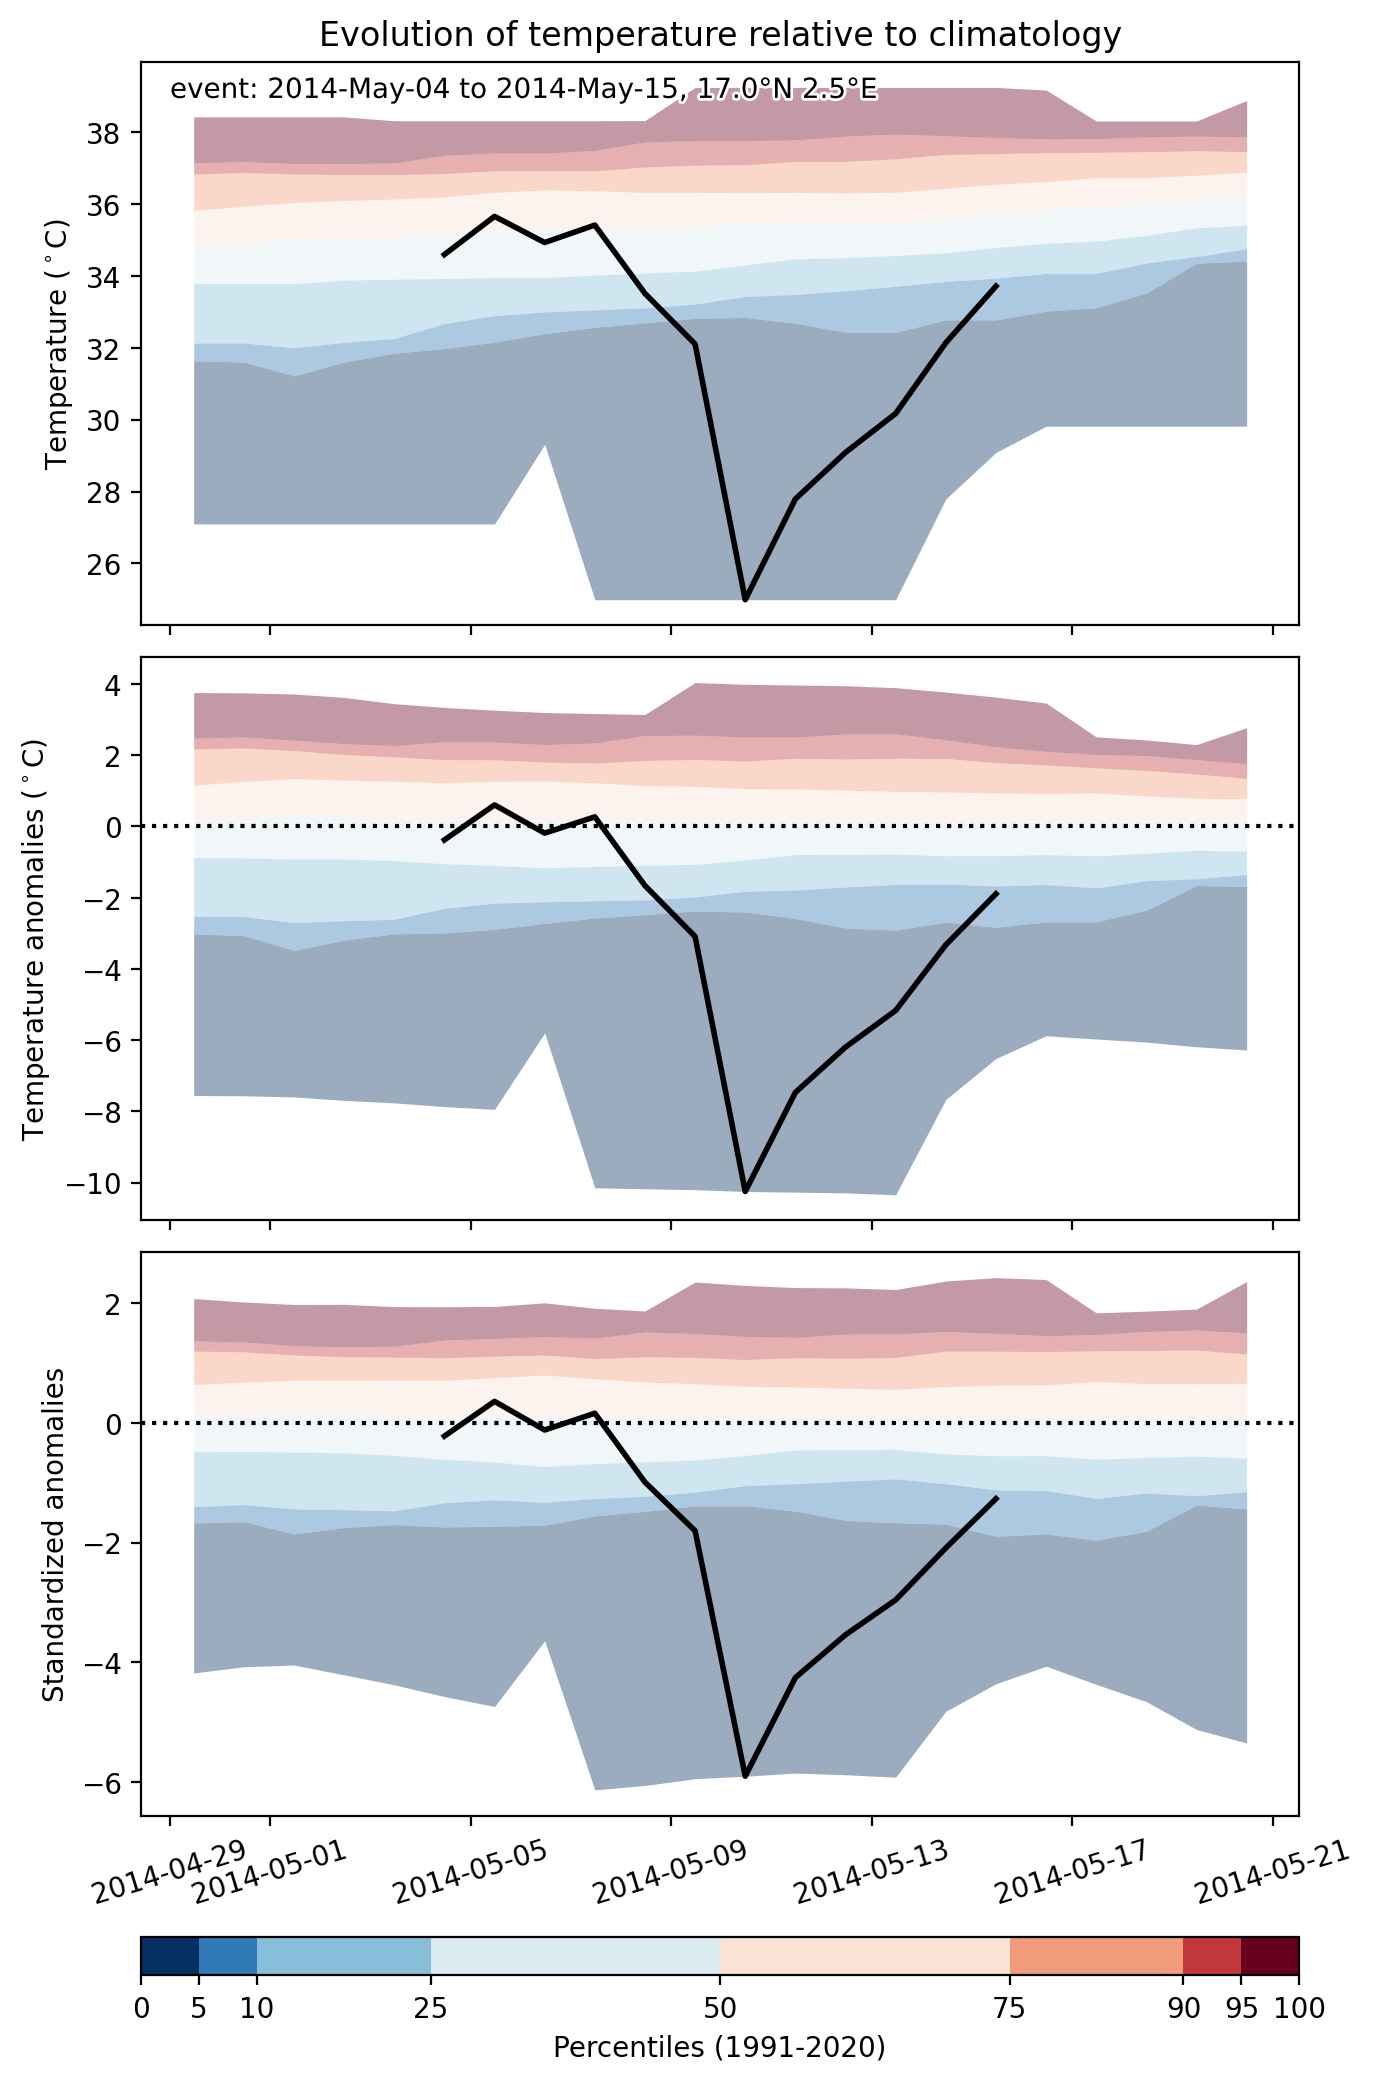
Event center: 17.0°N 2.5°E

Area affected: 985616 km$^2$


Fig. 1: Map of most extreme temperature anomalies (standardized) experienced during the event. The purple star indicates the center of the extreme event. Green hatching illustrates all areas under the effect of extremes at some time during the event.


Fig. 2: Evolution of temperature at the center of the event. The climatological percentile distribution is illustrated with color shadings.


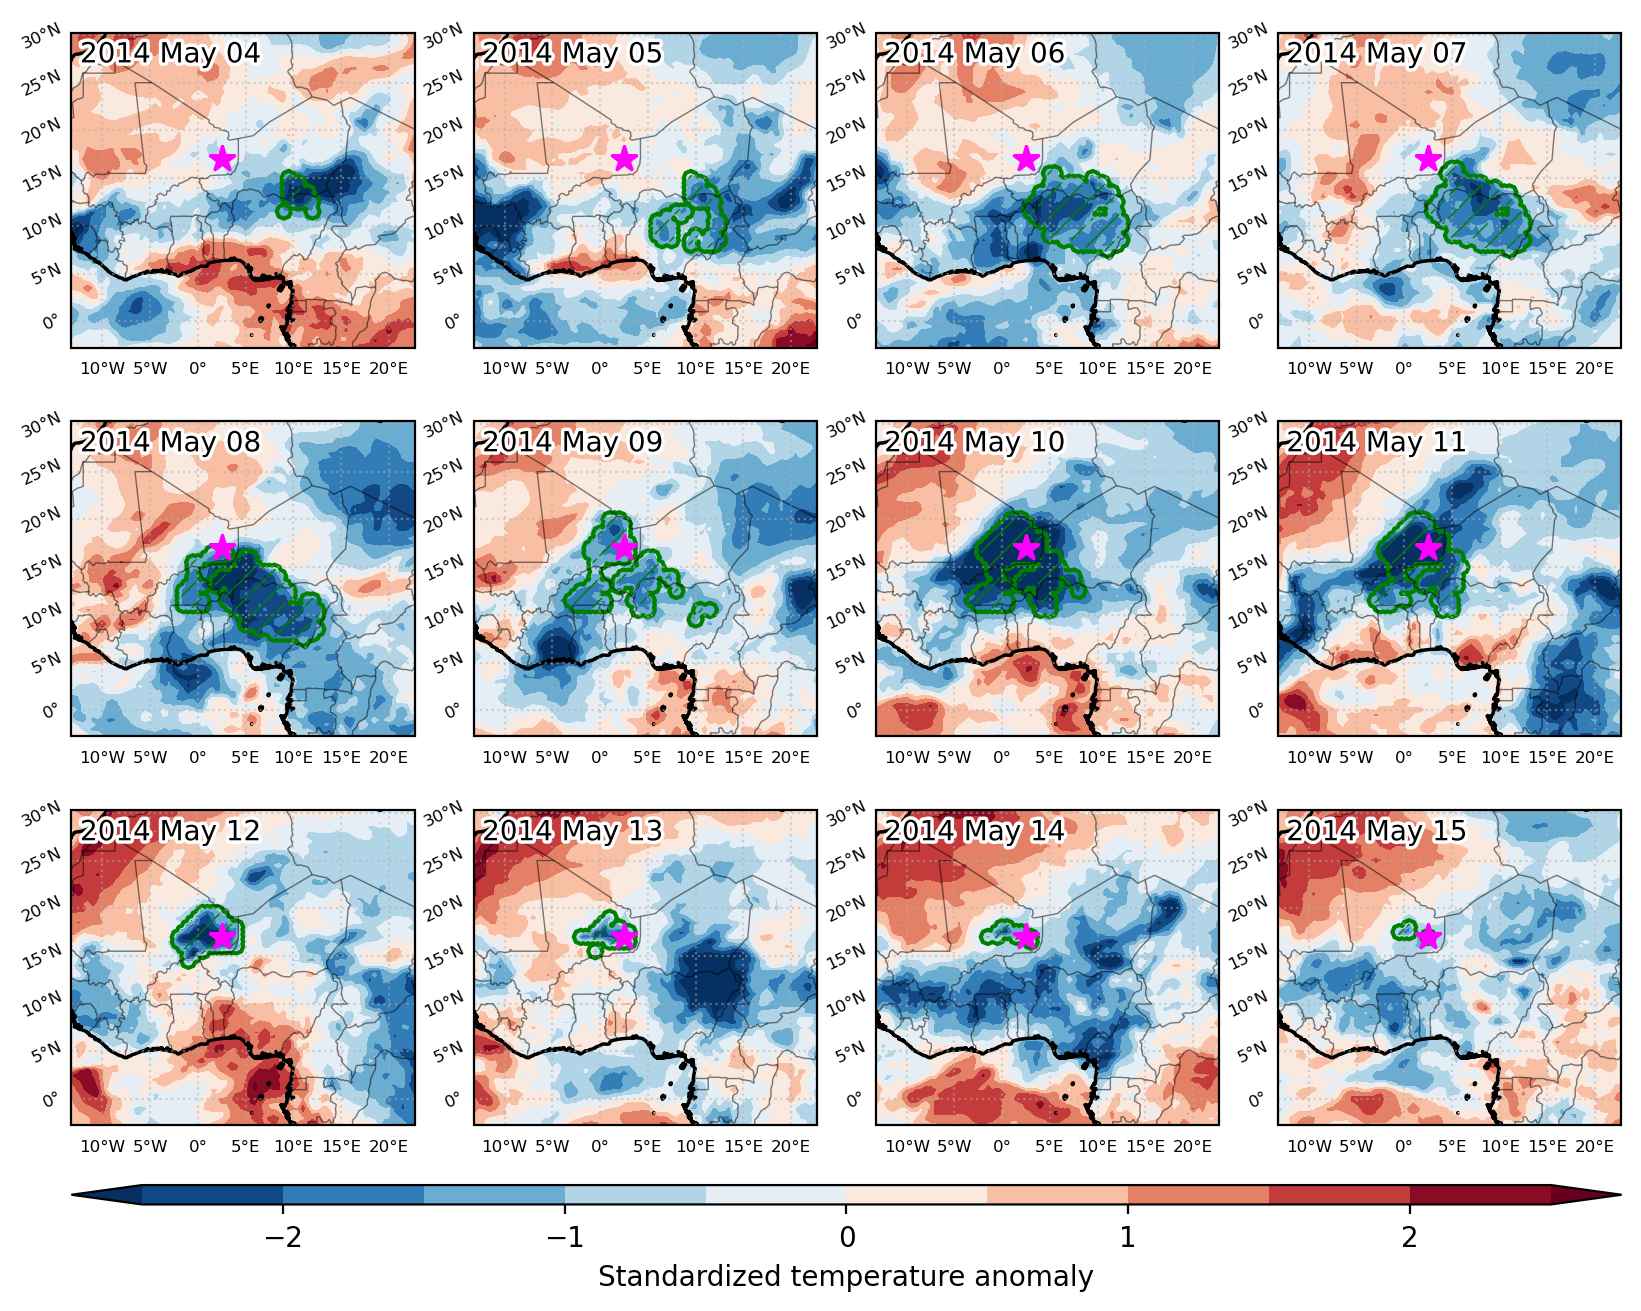
Fig. 3: Maps illustrating the evolution of standardized temperature anomalies during the event.

Event ID: Cold_spell_2014-May-04_to_2014-May-15_2.5_17.0

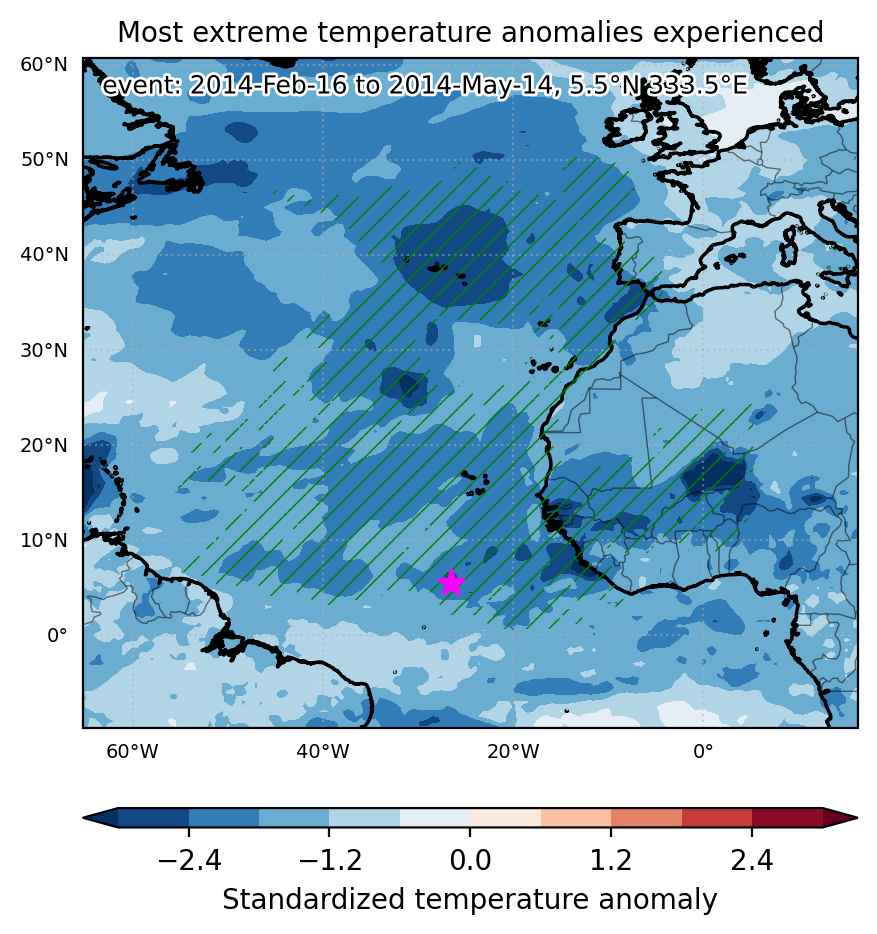
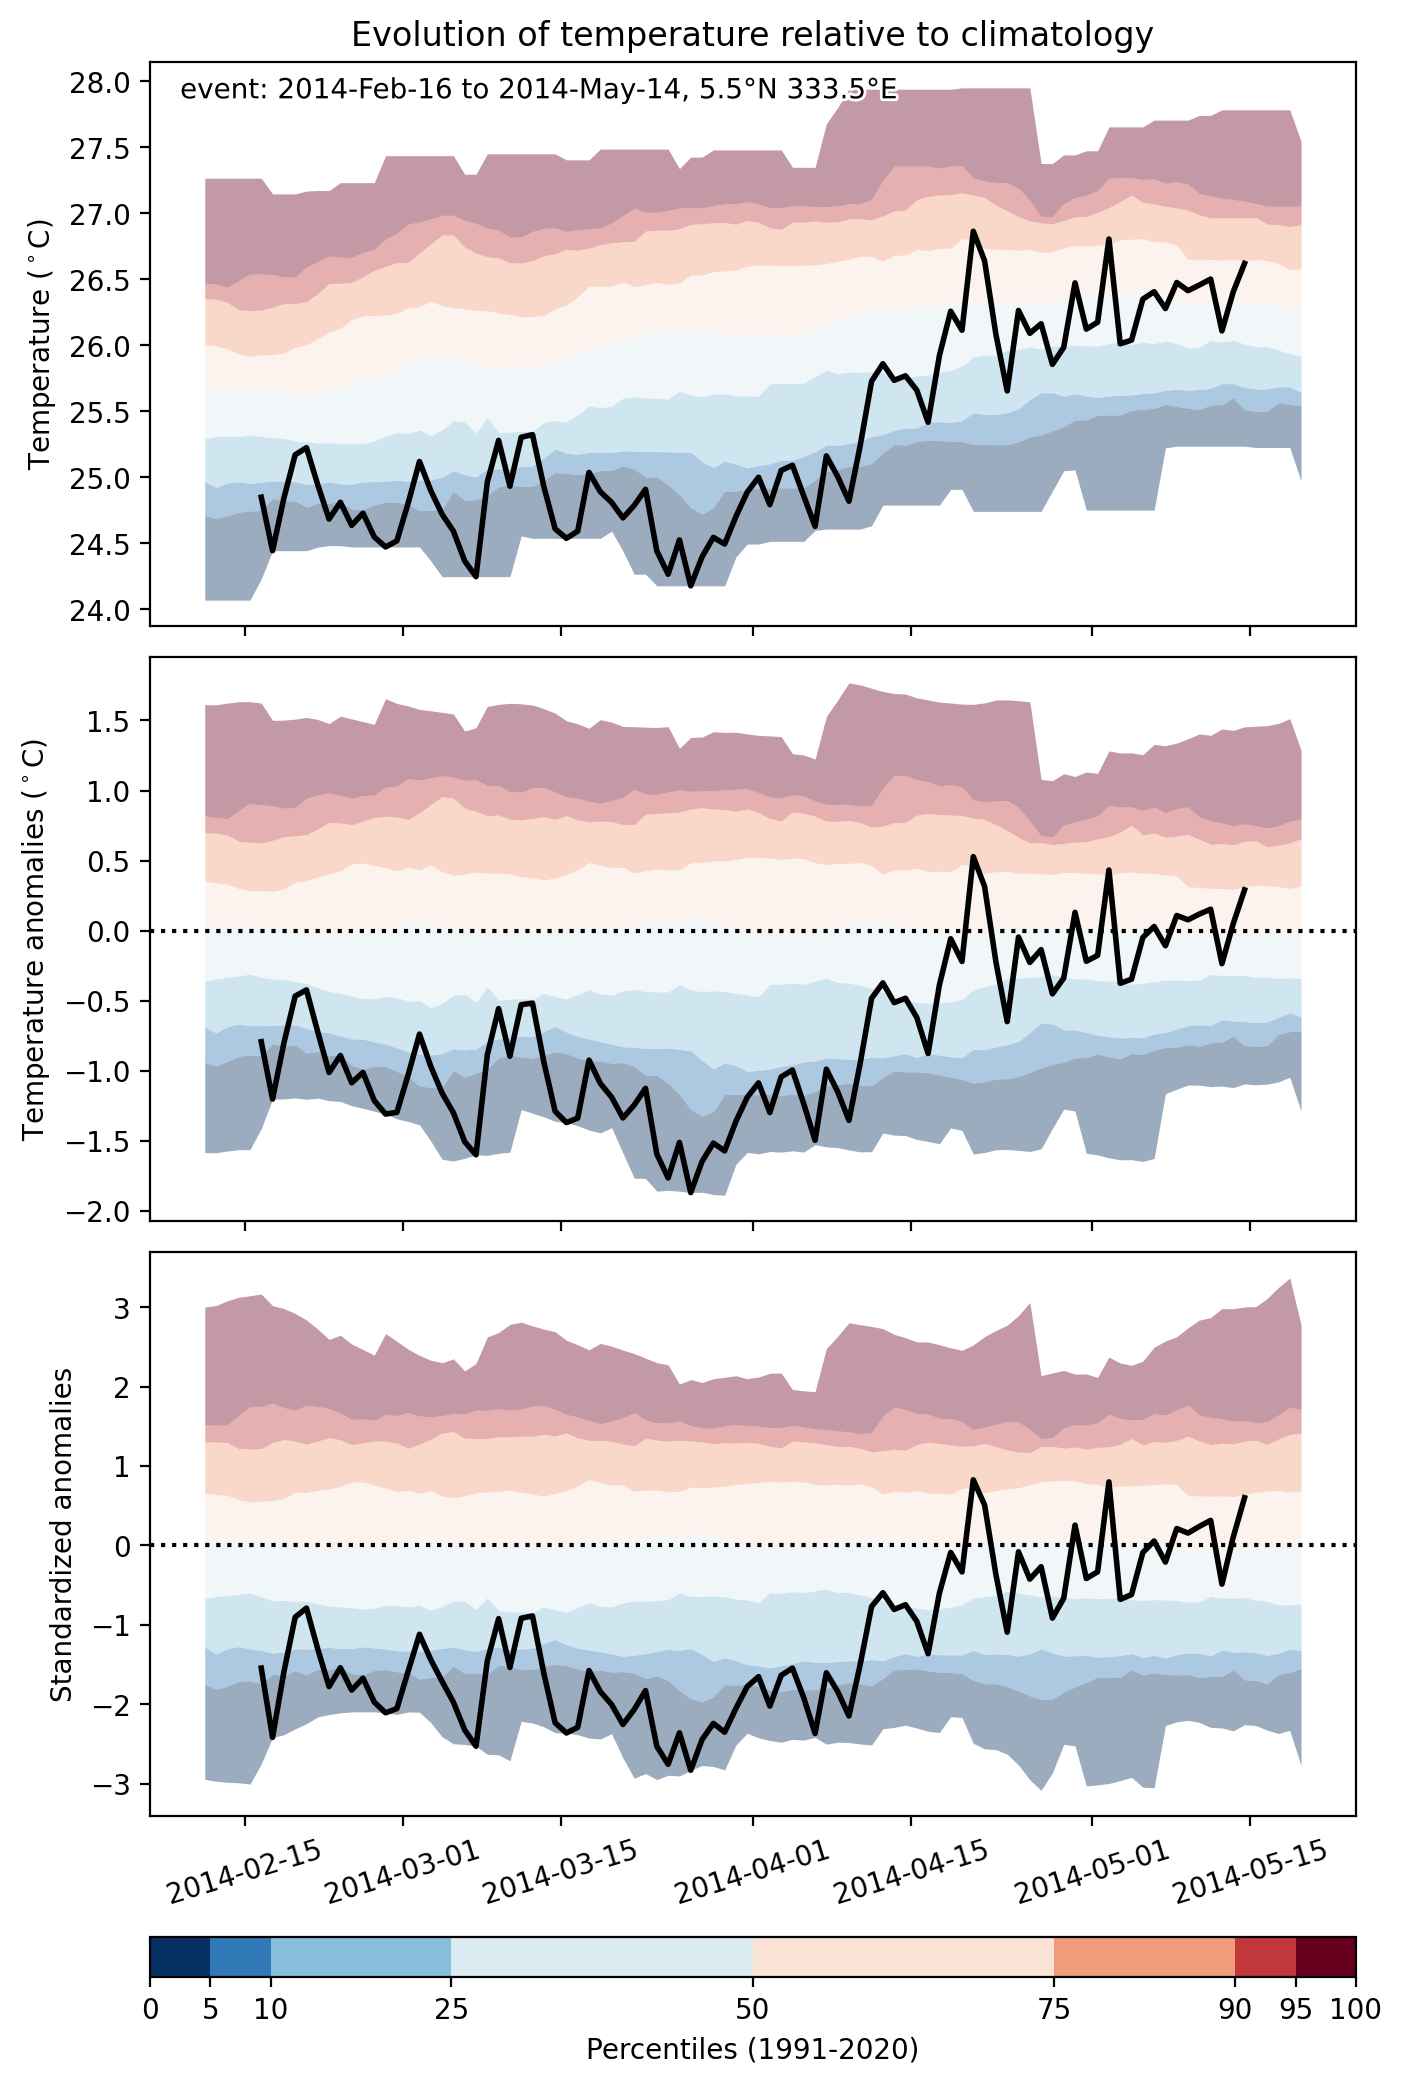
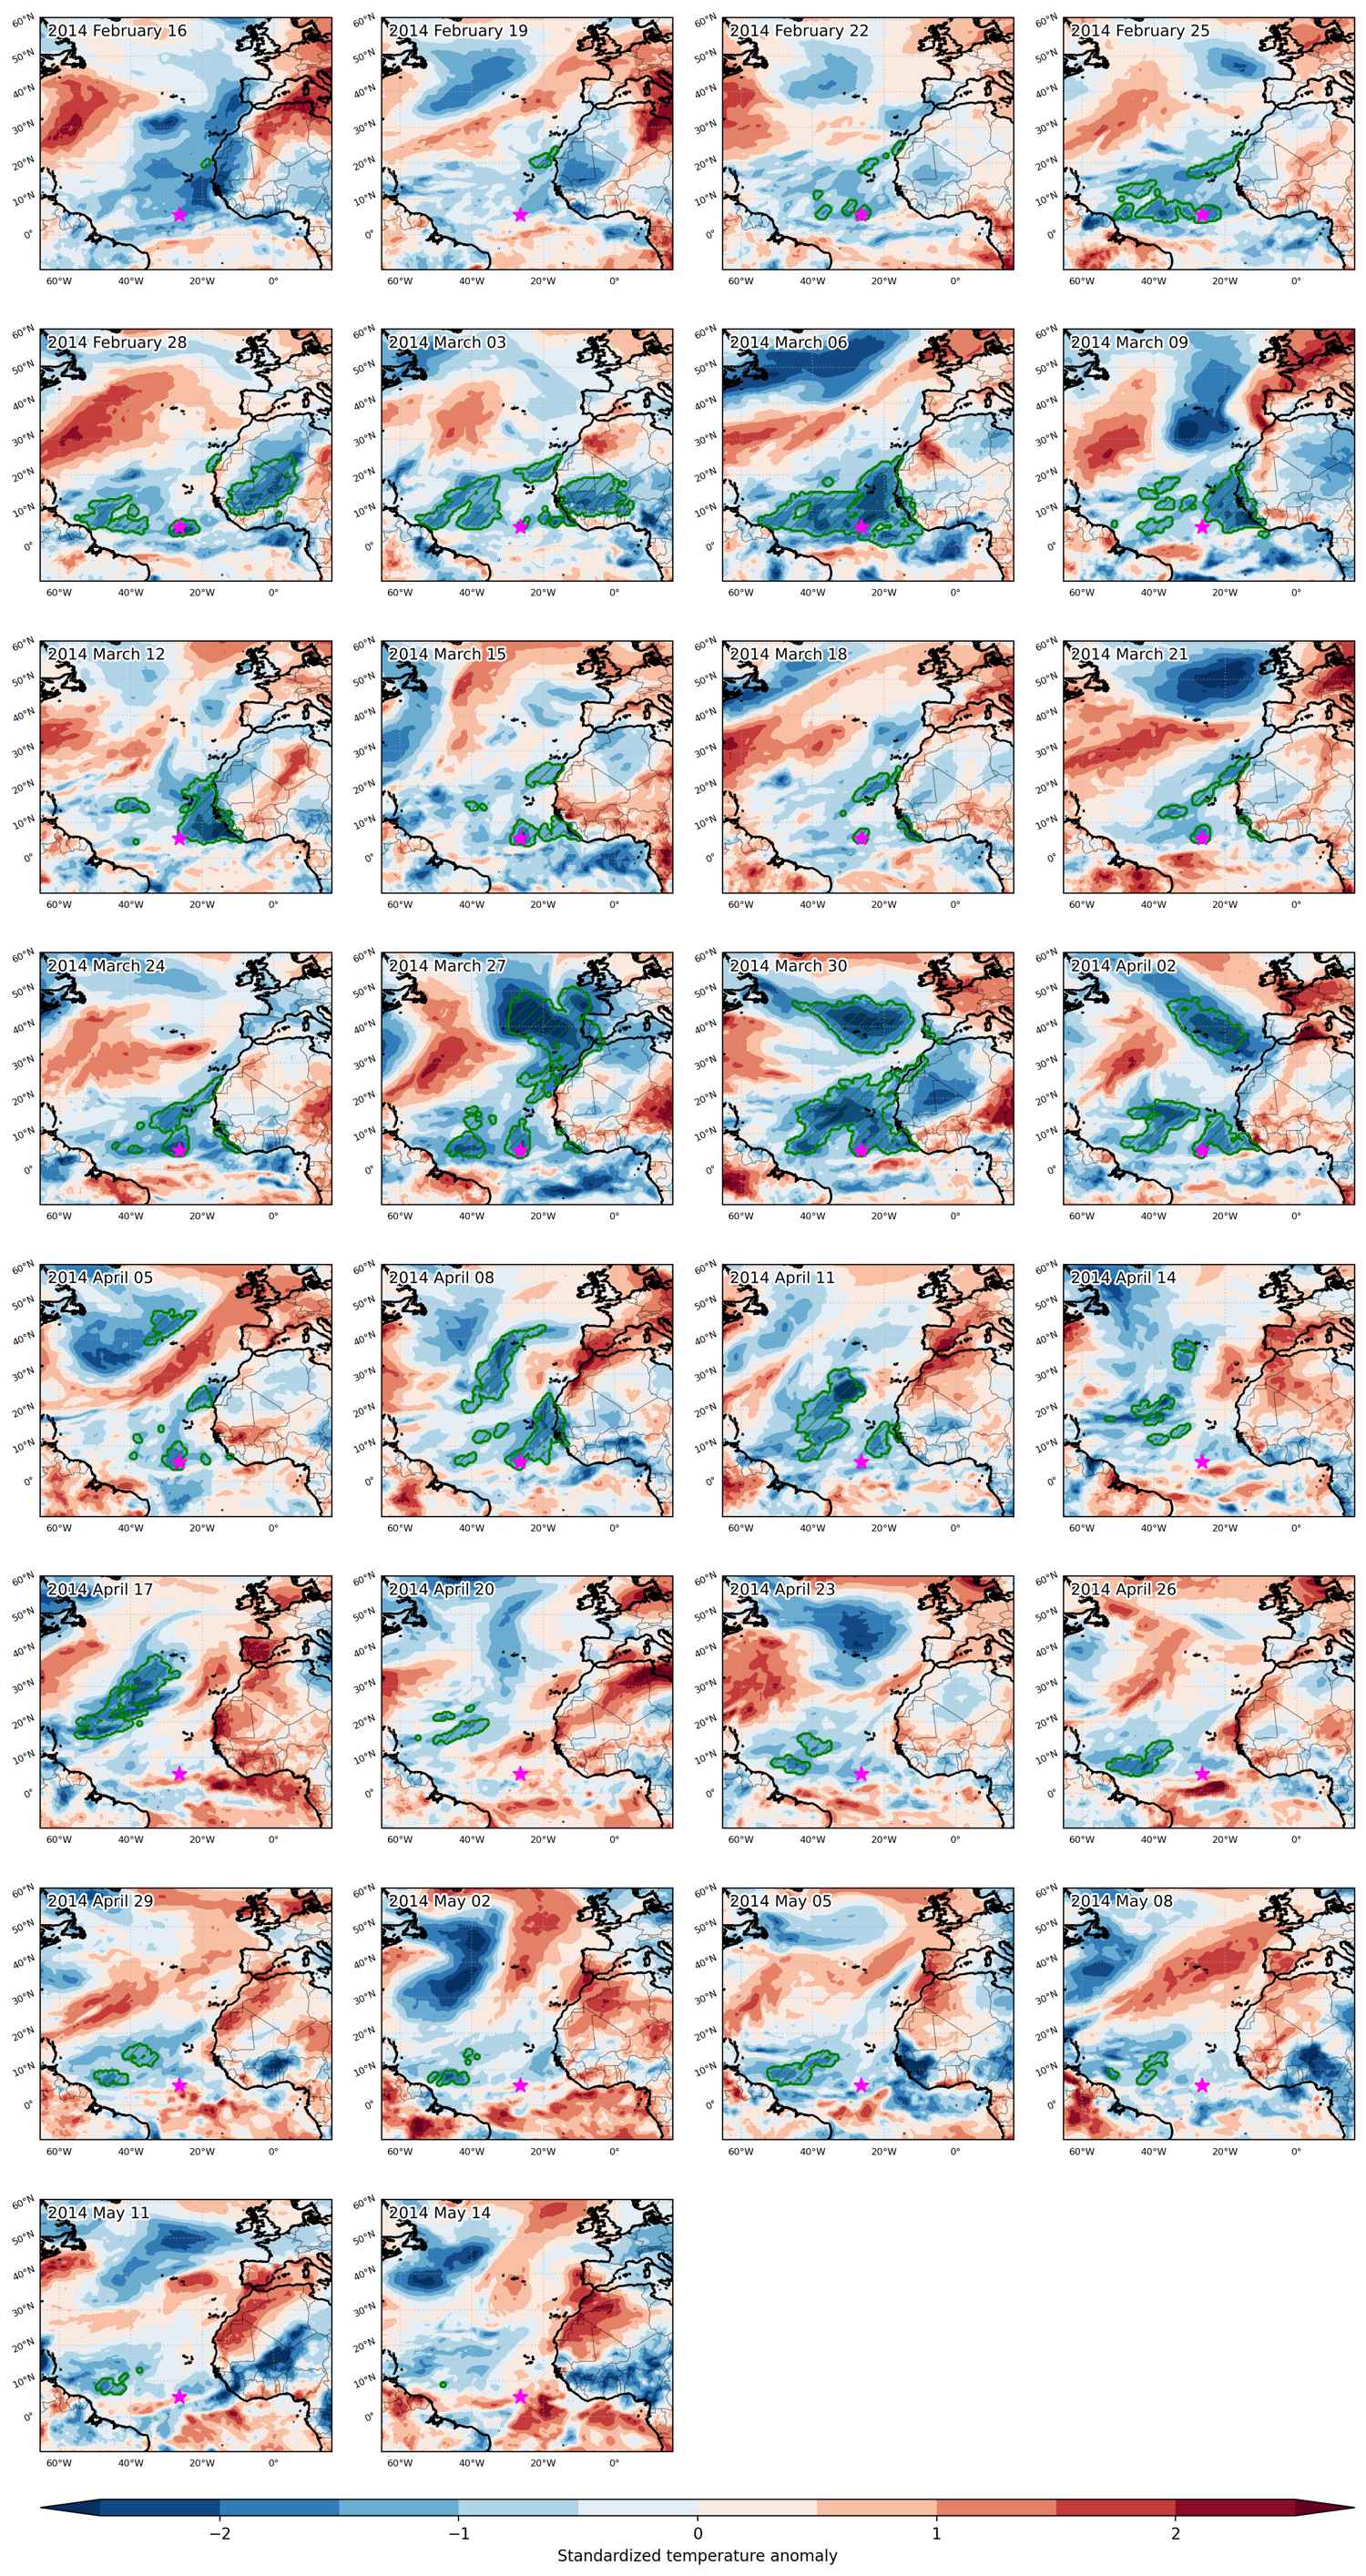
Cold spell occuring from February 16 2014 to May 14 2014 at 5.5°N 333.5°E

Download data: JSON

Event type: Cold spell

Countries affected (identified with ArcGIS Online; provided only for geographical reference):

  • Algeria
  • Azores
  • Benin
  • Burkina Faso
  • Cabo Verde
  • Canarias
  • Côte d’Ivoire
  • Gambia
  • Ghana
  • Guinea
  • Guinea-Bissau
  • Liberia
  • Madeira
  • Mali
  • Mauritania
  • Morocco
  • Niger
  • Nigeria
  • Portugal
  • Senegal
  • Sierra Leone
  • Spain
  • Togo

Duration: 88 days

Time span: February 16 2014 to May 14 2014

Statistics over entire affected area:

  • Mean temperature anomaly: -1.7 °C
  • Mean temperature: 20.3 °C
  • Minimum temperature anomaly: -7.1 °C
  • Minimum temperature: 0.1 °C

Event center: 5.5°N 333.5°E

Area affected: 17355124 km$^2$


Fig. 1: Map of most extreme temperature anomalies (standardized) experienced during the event. The purple star indicates the center of the extreme event. Green hatching illustrates all areas under the effect of extremes at some time during the event.


Fig. 2: Evolution of temperature at the center of the event. The climatological percentile distribution is illustrated with color shadings.


Fig. 3: Maps illustrating the evolution of standardized temperature anomalies during the event.

Event ID: Cold_spell_2014-Feb-16_to_2014-May-14_333.5_5.5

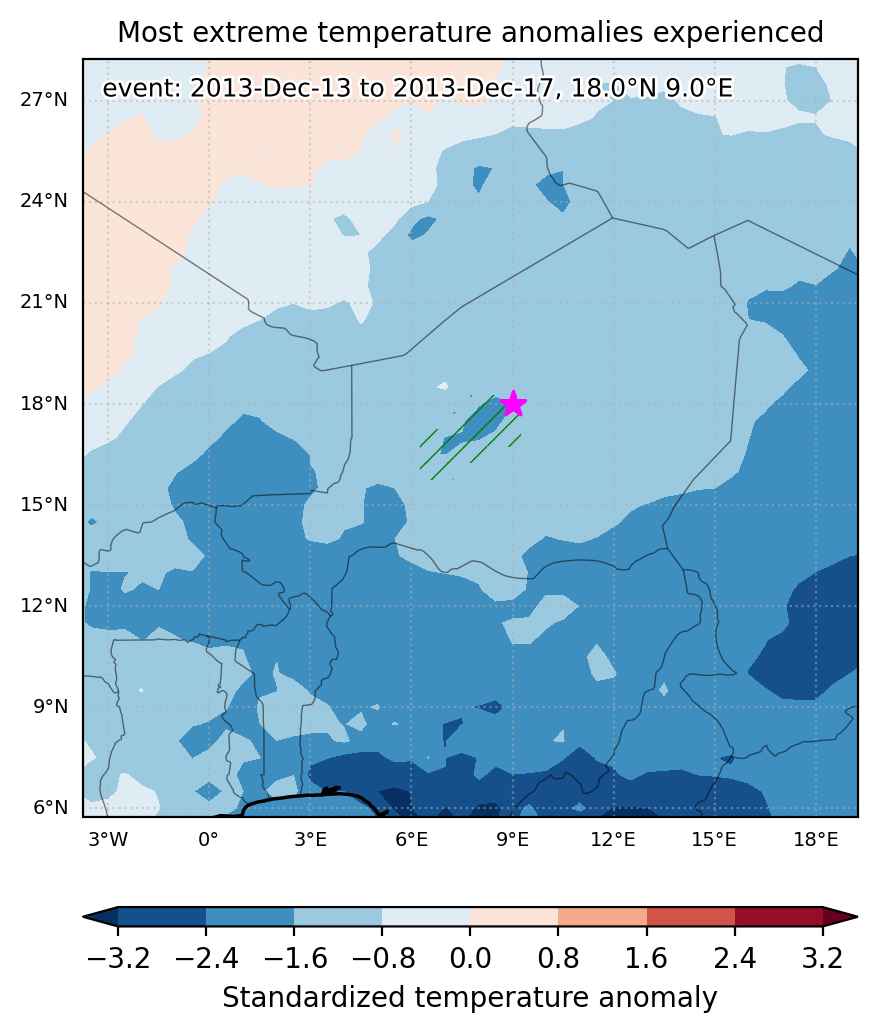
Cold spell occuring from December 13 2013 to December 17 2013 at 18.0°N 9.0°E

Download data: JSON

Event type: Cold spell

Countries affected (identified with ArcGIS Online; provided only for geographical reference):

  • Niger

Duration: 5 days

Time span: December 13 2013 to December 17 2013

Statistics over entire affected area:

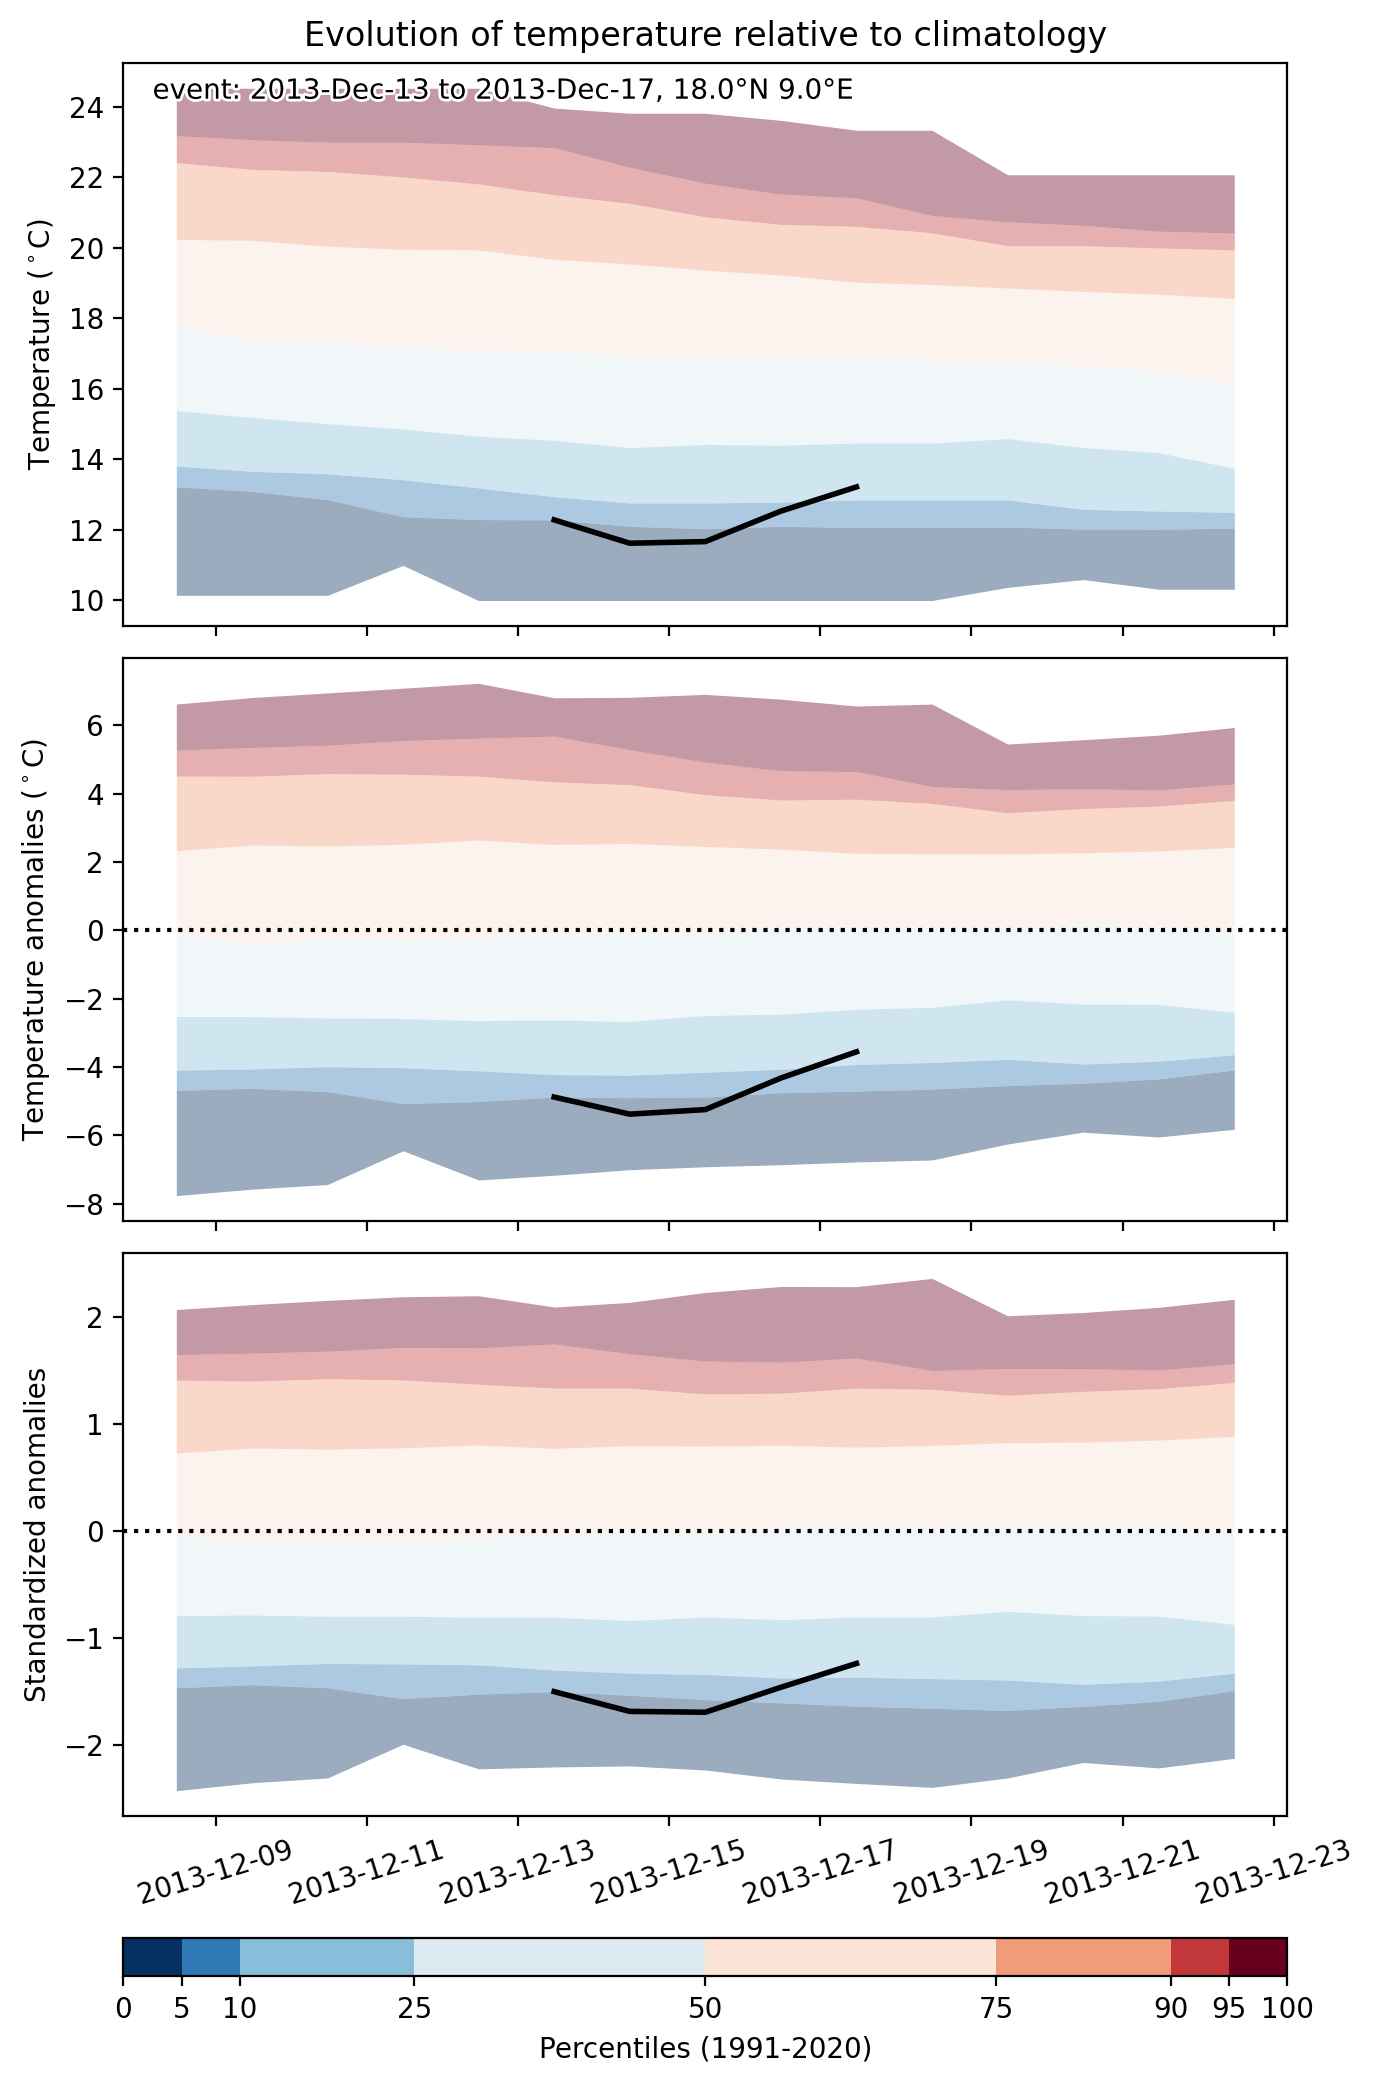
  • Mean temperature anomaly: -4.1 °C
  • Mean temperature: 16.8 °C
  • Minimum temperature anomaly: -5.6 °C
  • Minimum temperature: 11.6 °C

Event center: 18.0°N 9.0°E

Area affected: 56145 km$^2$


Fig. 1: Map of most extreme temperature anomalies (standardized) experienced during the event. The purple star indicates the center of the extreme event. Green hatching illustrates all areas under the effect of extremes at some time during the event.


Fig. 2: Evolution of temperature at the center of the event. The climatological percentile distribution is illustrated with color shadings.


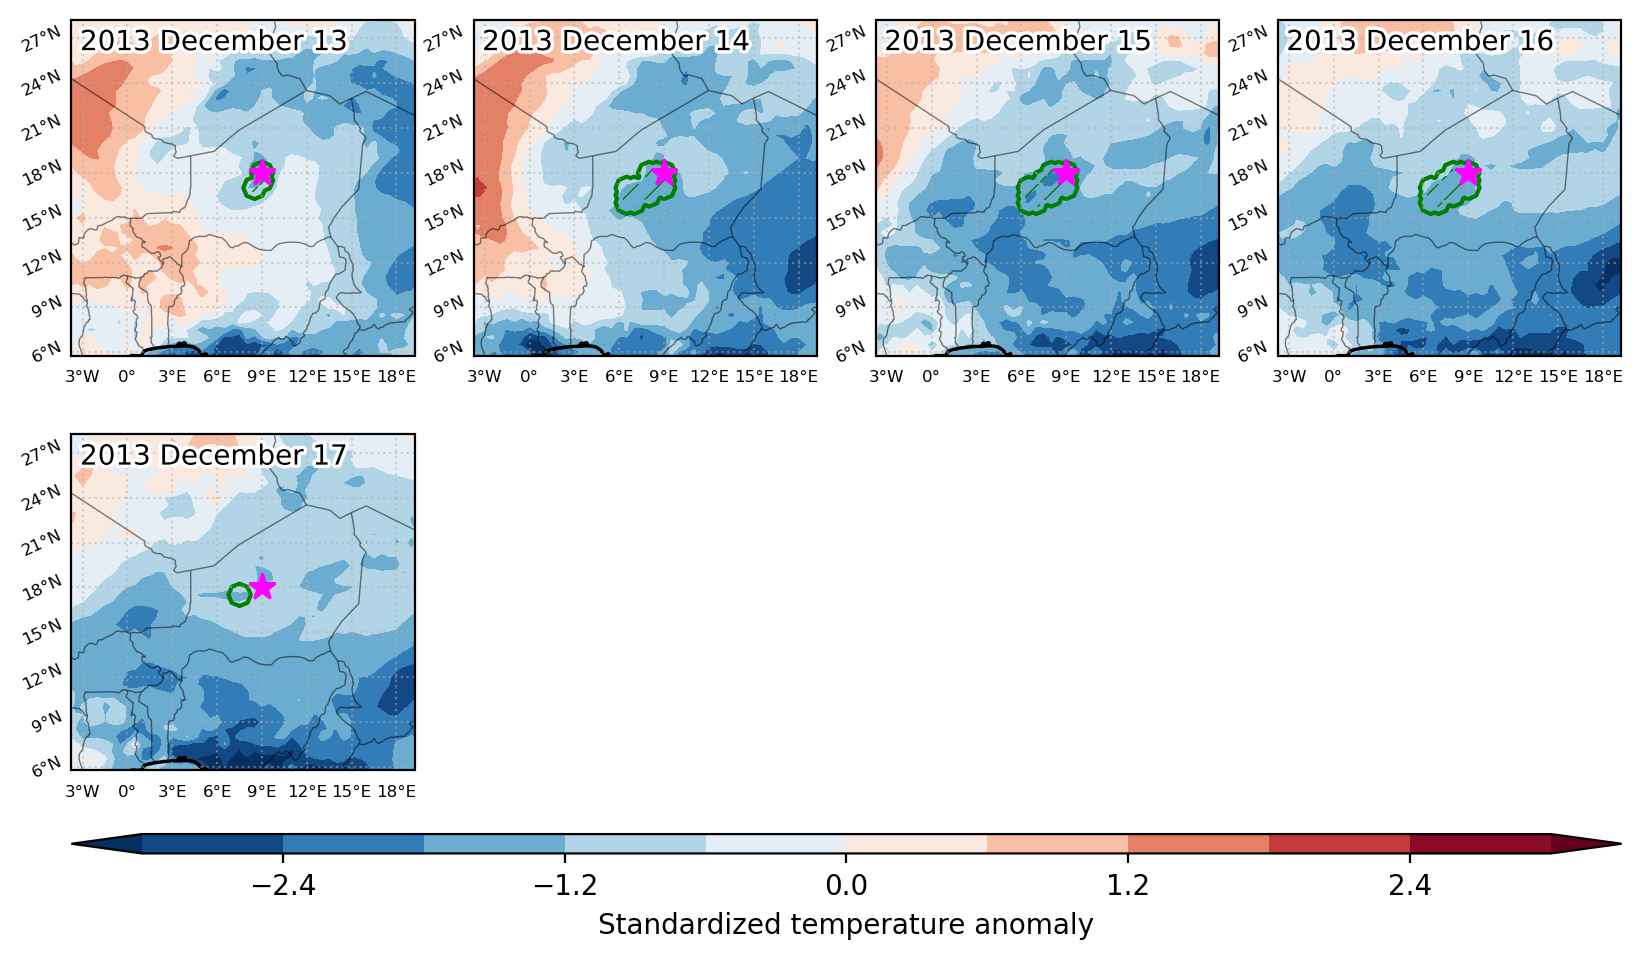
Fig. 3: Maps illustrating the evolution of standardized temperature anomalies during the event.

Event ID: Cold_spell_2013-Dec-13_to_2013-Dec-17_9.0_18.0

Cold spell occuring from December 12 2013 to December 19 2013 at 24.0°N 11.0°E

Download data: JSON

Event type: Cold spell

Countries affected (identified with ArcGIS Online; provided only for geographical reference):

  • Algeria
  • Libya
  • Niger

Duration: 8 days

Time span: December 12 2013 to December 19 2013

Statistics over entire affected area:

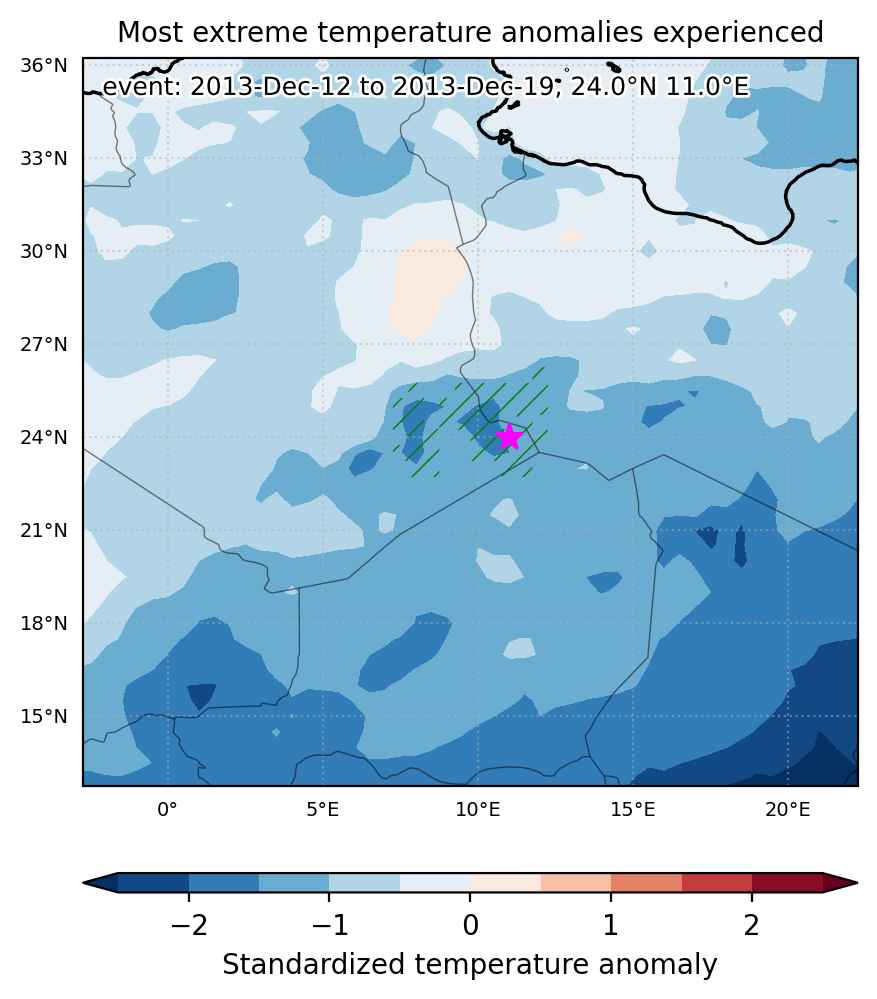
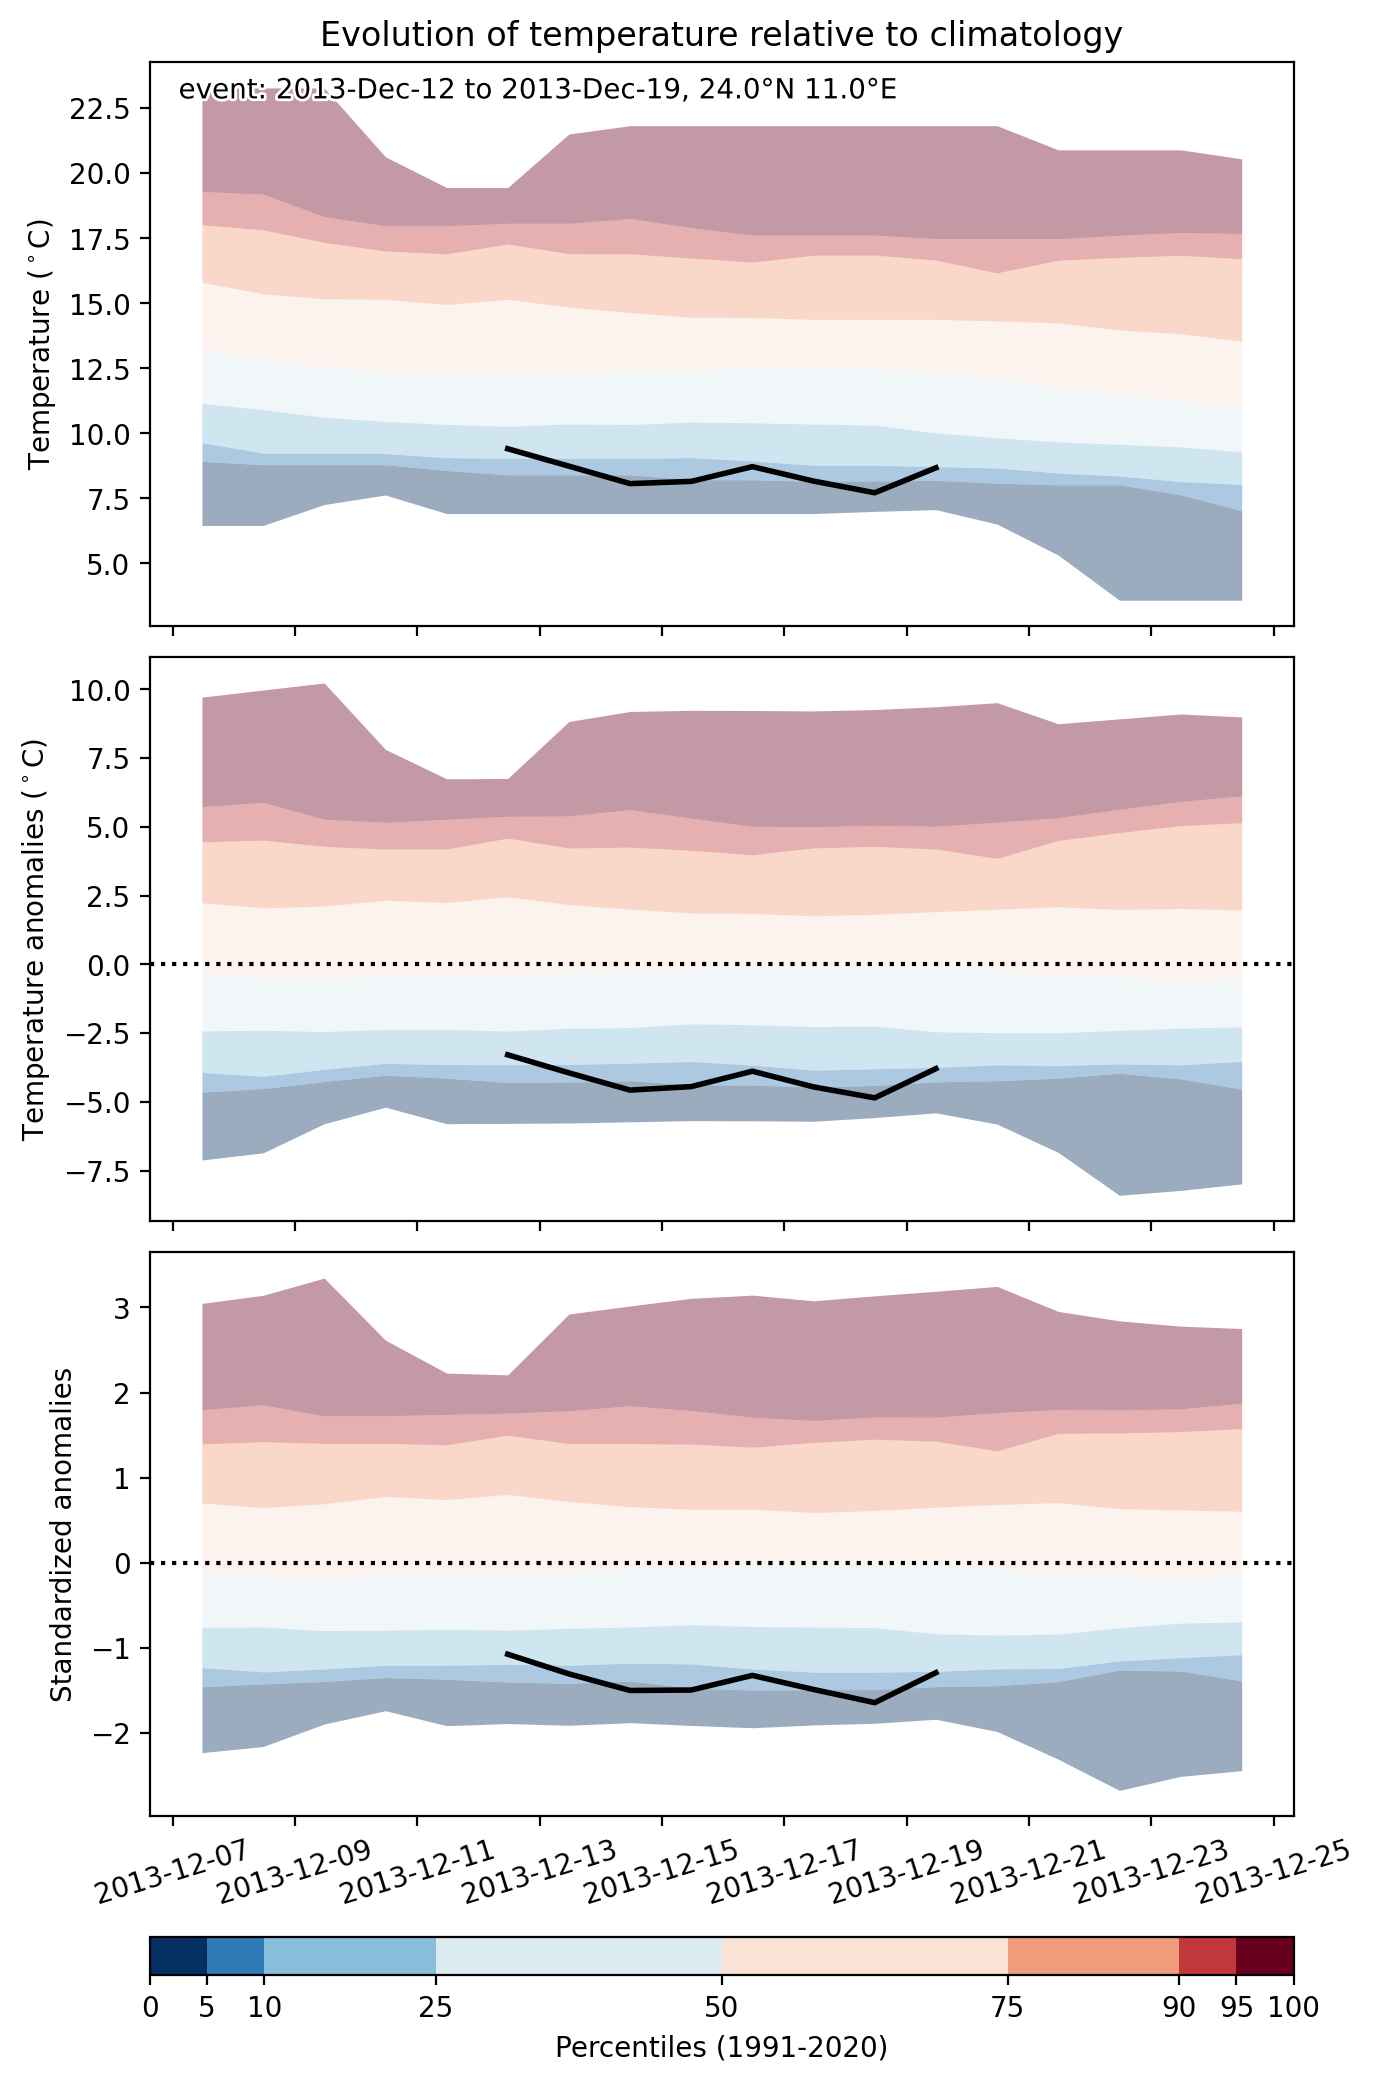
  • Mean temperature anomaly: -4.1 °C
  • Mean temperature: 8.8 °C
  • Minimum temperature anomaly: -5.7 °C
  • Minimum temperature: 5.7 °C

Event center: 24.0°N 11.0°E

Area affected: 118201 km$^2$


Fig. 1: Map of most extreme temperature anomalies (standardized) experienced during the event. The purple star indicates the center of the extreme event. Green hatching illustrates all areas under the effect of extremes at some time during the event.


Fig. 2: Evolution of temperature at the center of the event. The climatological percentile distribution is illustrated with color shadings.


Fig. 3: Maps illustrating the evolution of standardized temperature anomalies during the event.

Event ID: Cold_spell_2013-Dec-12_to_2013-Dec-19_11.0_24.0

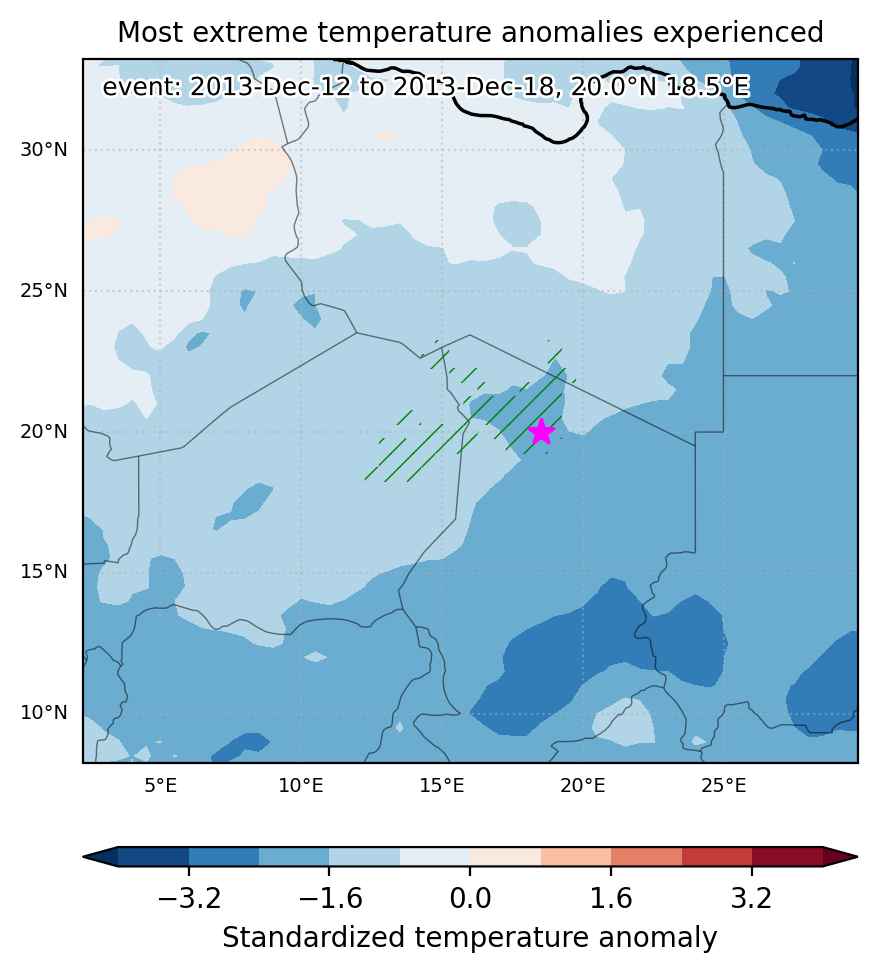
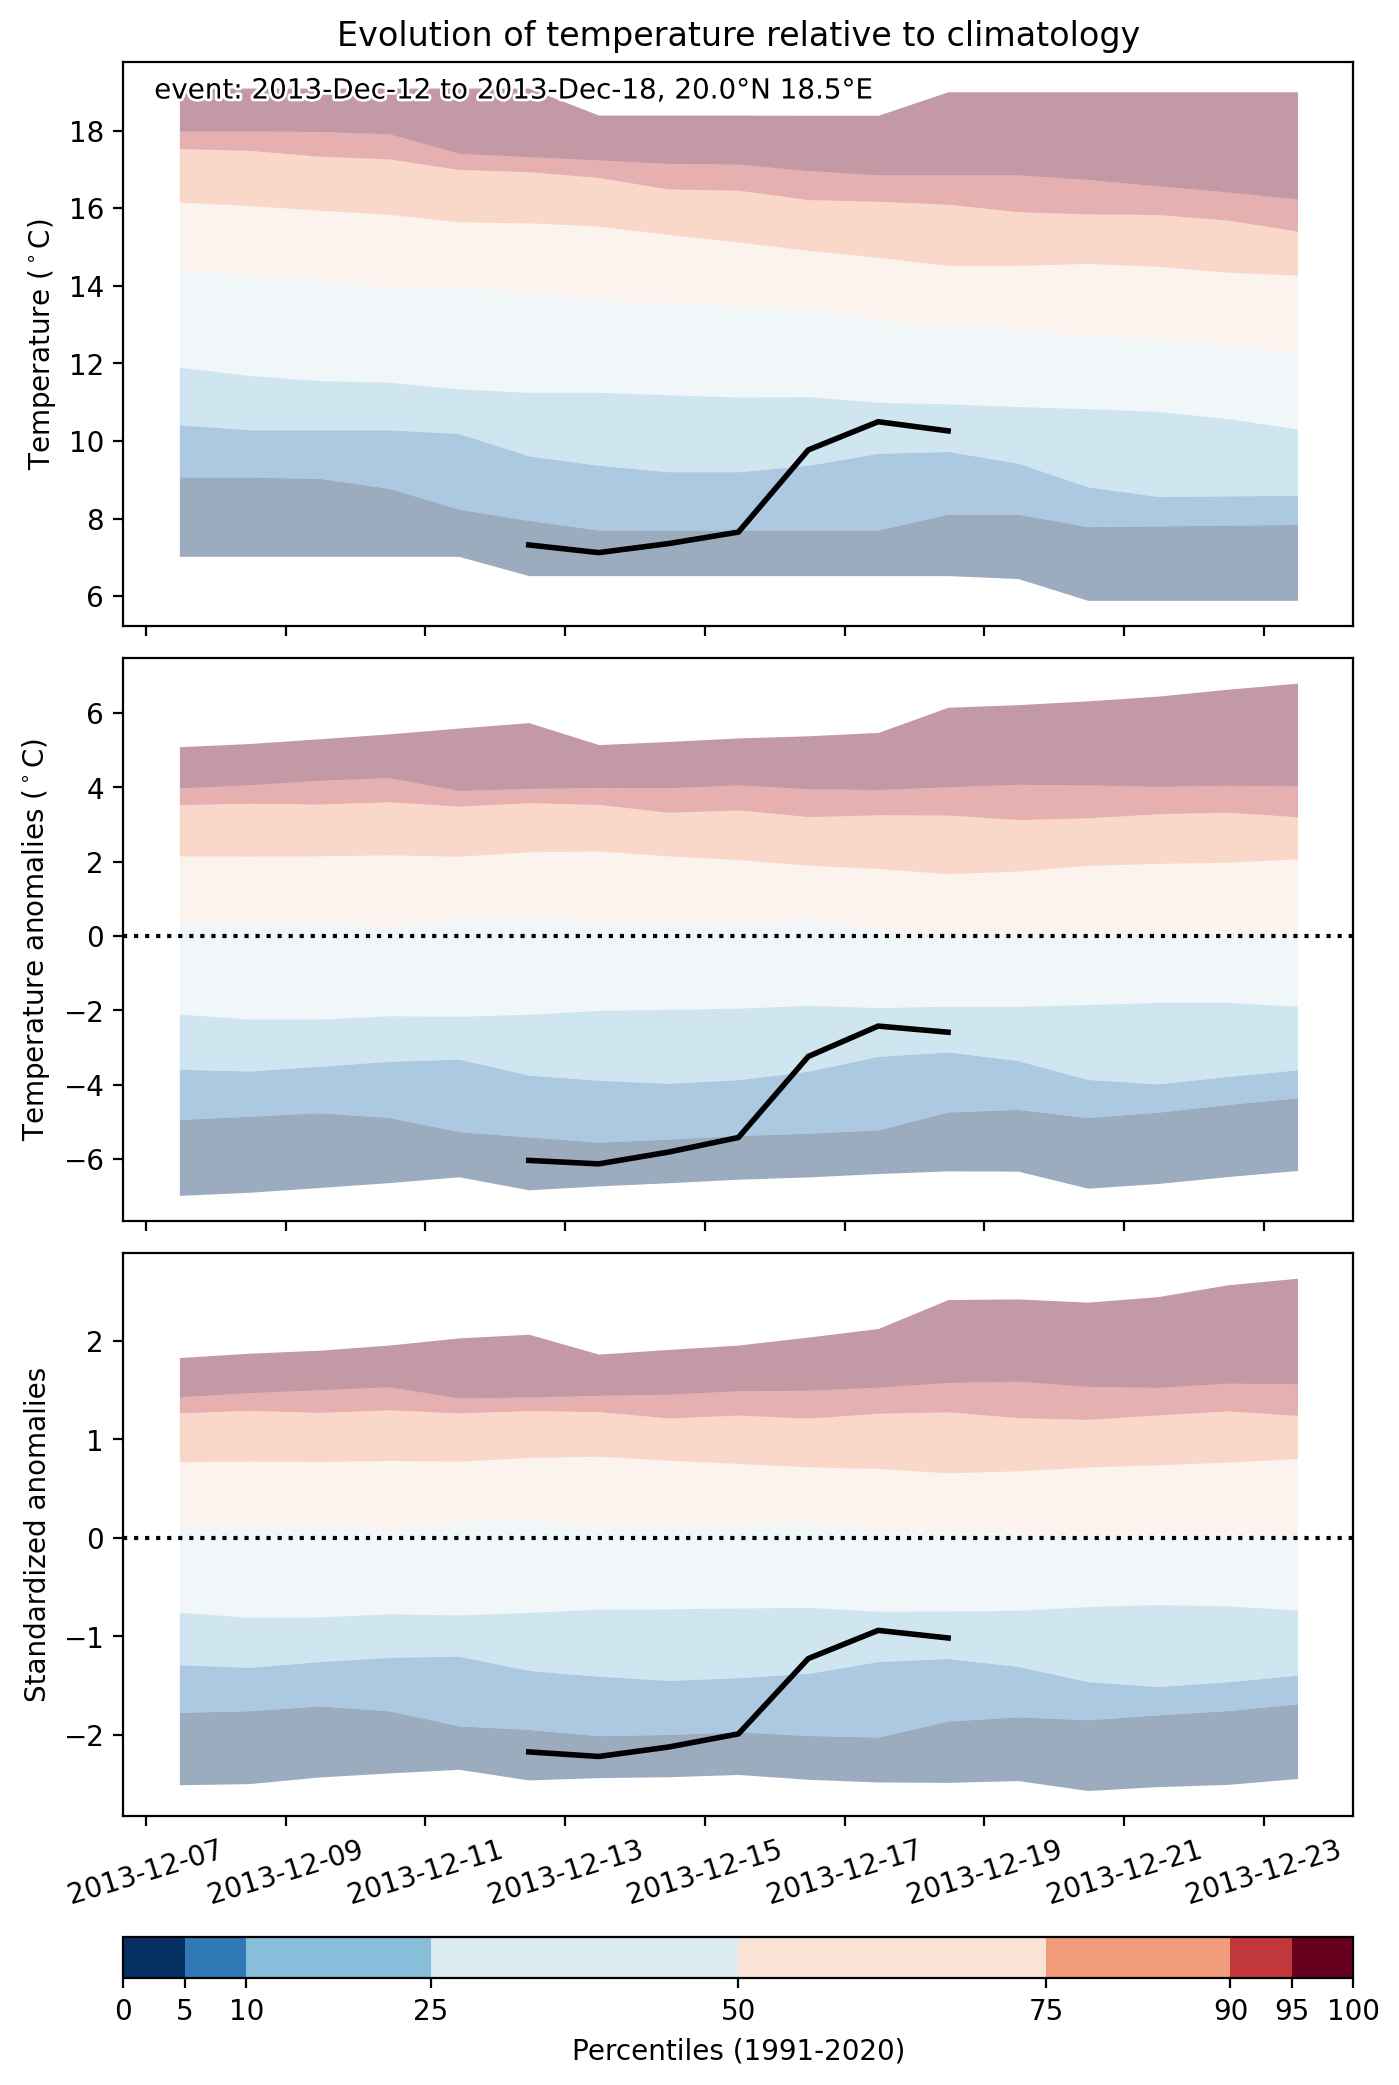
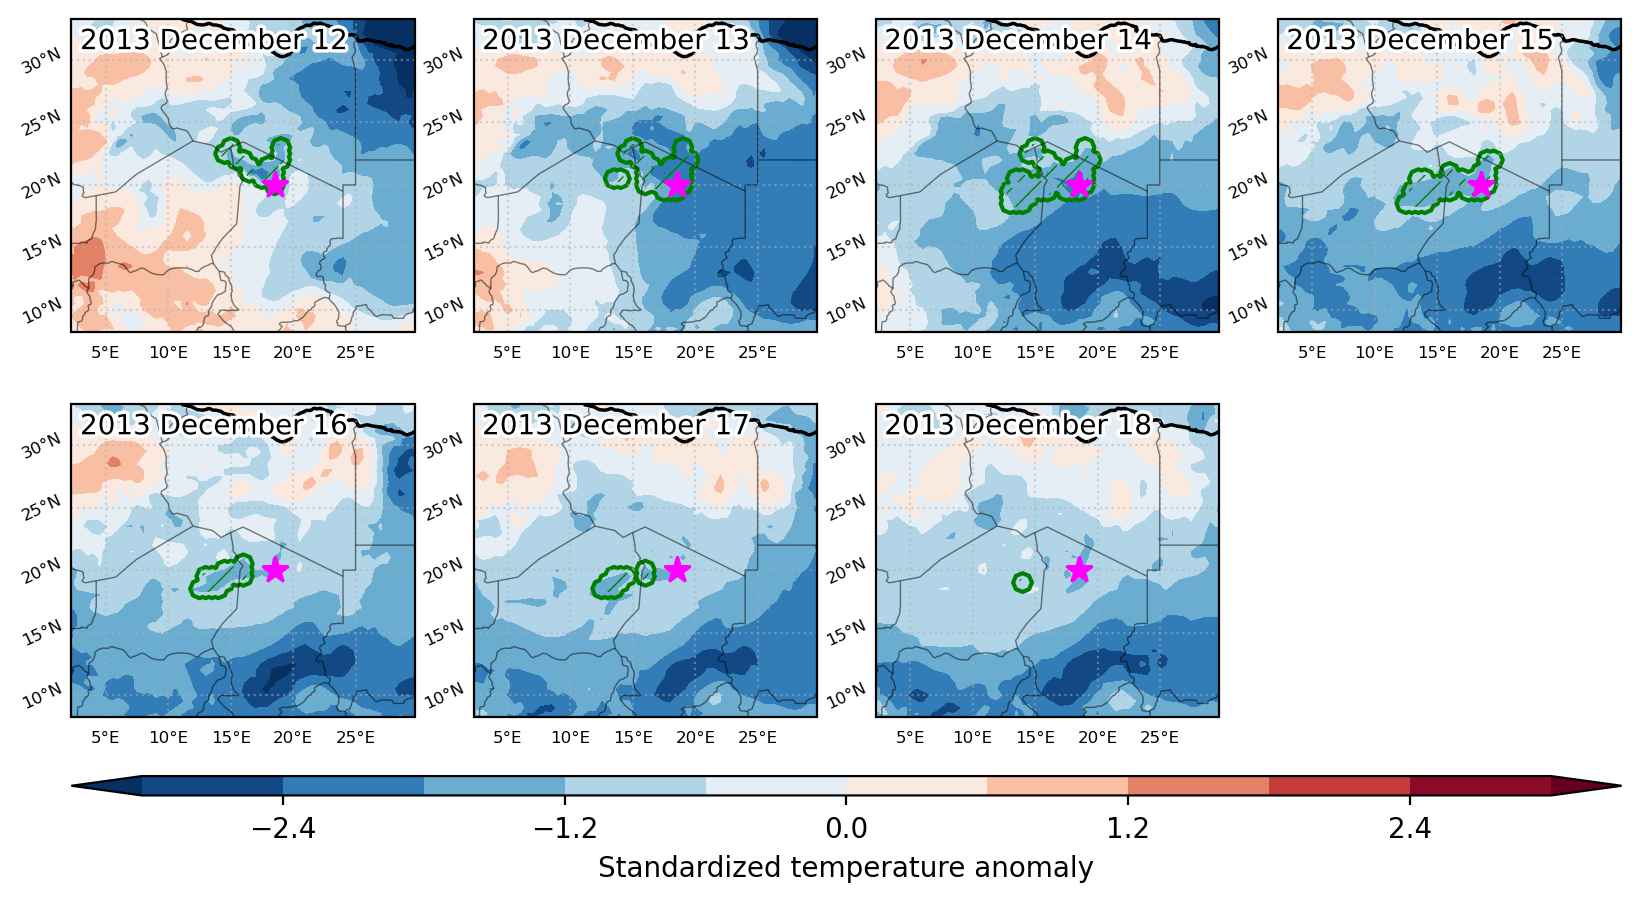
Cold spell occuring from December 12 2013 to December 18 2013 at 20.0°N 18.5°E

Download data: JSON

Event type: Cold spell

Countries affected (identified with ArcGIS Online; provided only for geographical reference):

  • Chad
  • Libya
  • Niger

Duration: 7 days

Time span: December 12 2013 to December 18 2013

Statistics over entire affected area:

  • Mean temperature anomaly: -4.4 °C
  • Mean temperature: 11.2 °C
  • Minimum temperature anomaly: -7.3 °C
  • Minimum temperature: 5.0 °C

Event center: 20.0°N 18.5°E

Area affected: 162180 km$^2$


Fig. 1: Map of most extreme temperature anomalies (standardized) experienced during the event. The purple star indicates the center of the extreme event. Green hatching illustrates all areas under the effect of extremes at some time during the event.


Fig. 2: Evolution of temperature at the center of the event. The climatological percentile distribution is illustrated with color shadings.


Fig. 3: Maps illustrating the evolution of standardized temperature anomalies during the event.

Event ID: Cold_spell_2013-Dec-12_to_2013-Dec-18_18.5_20.0

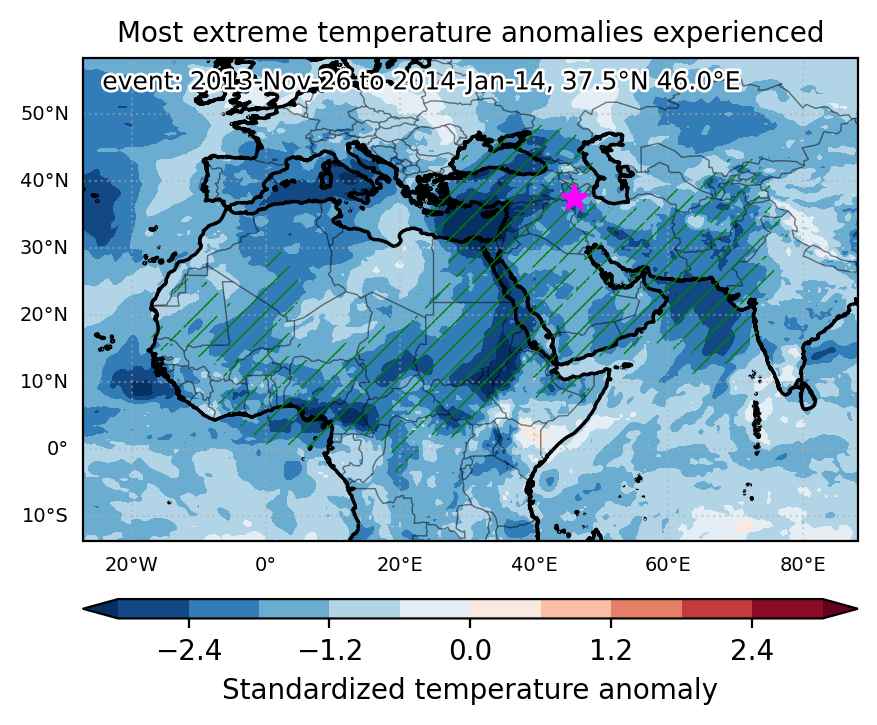
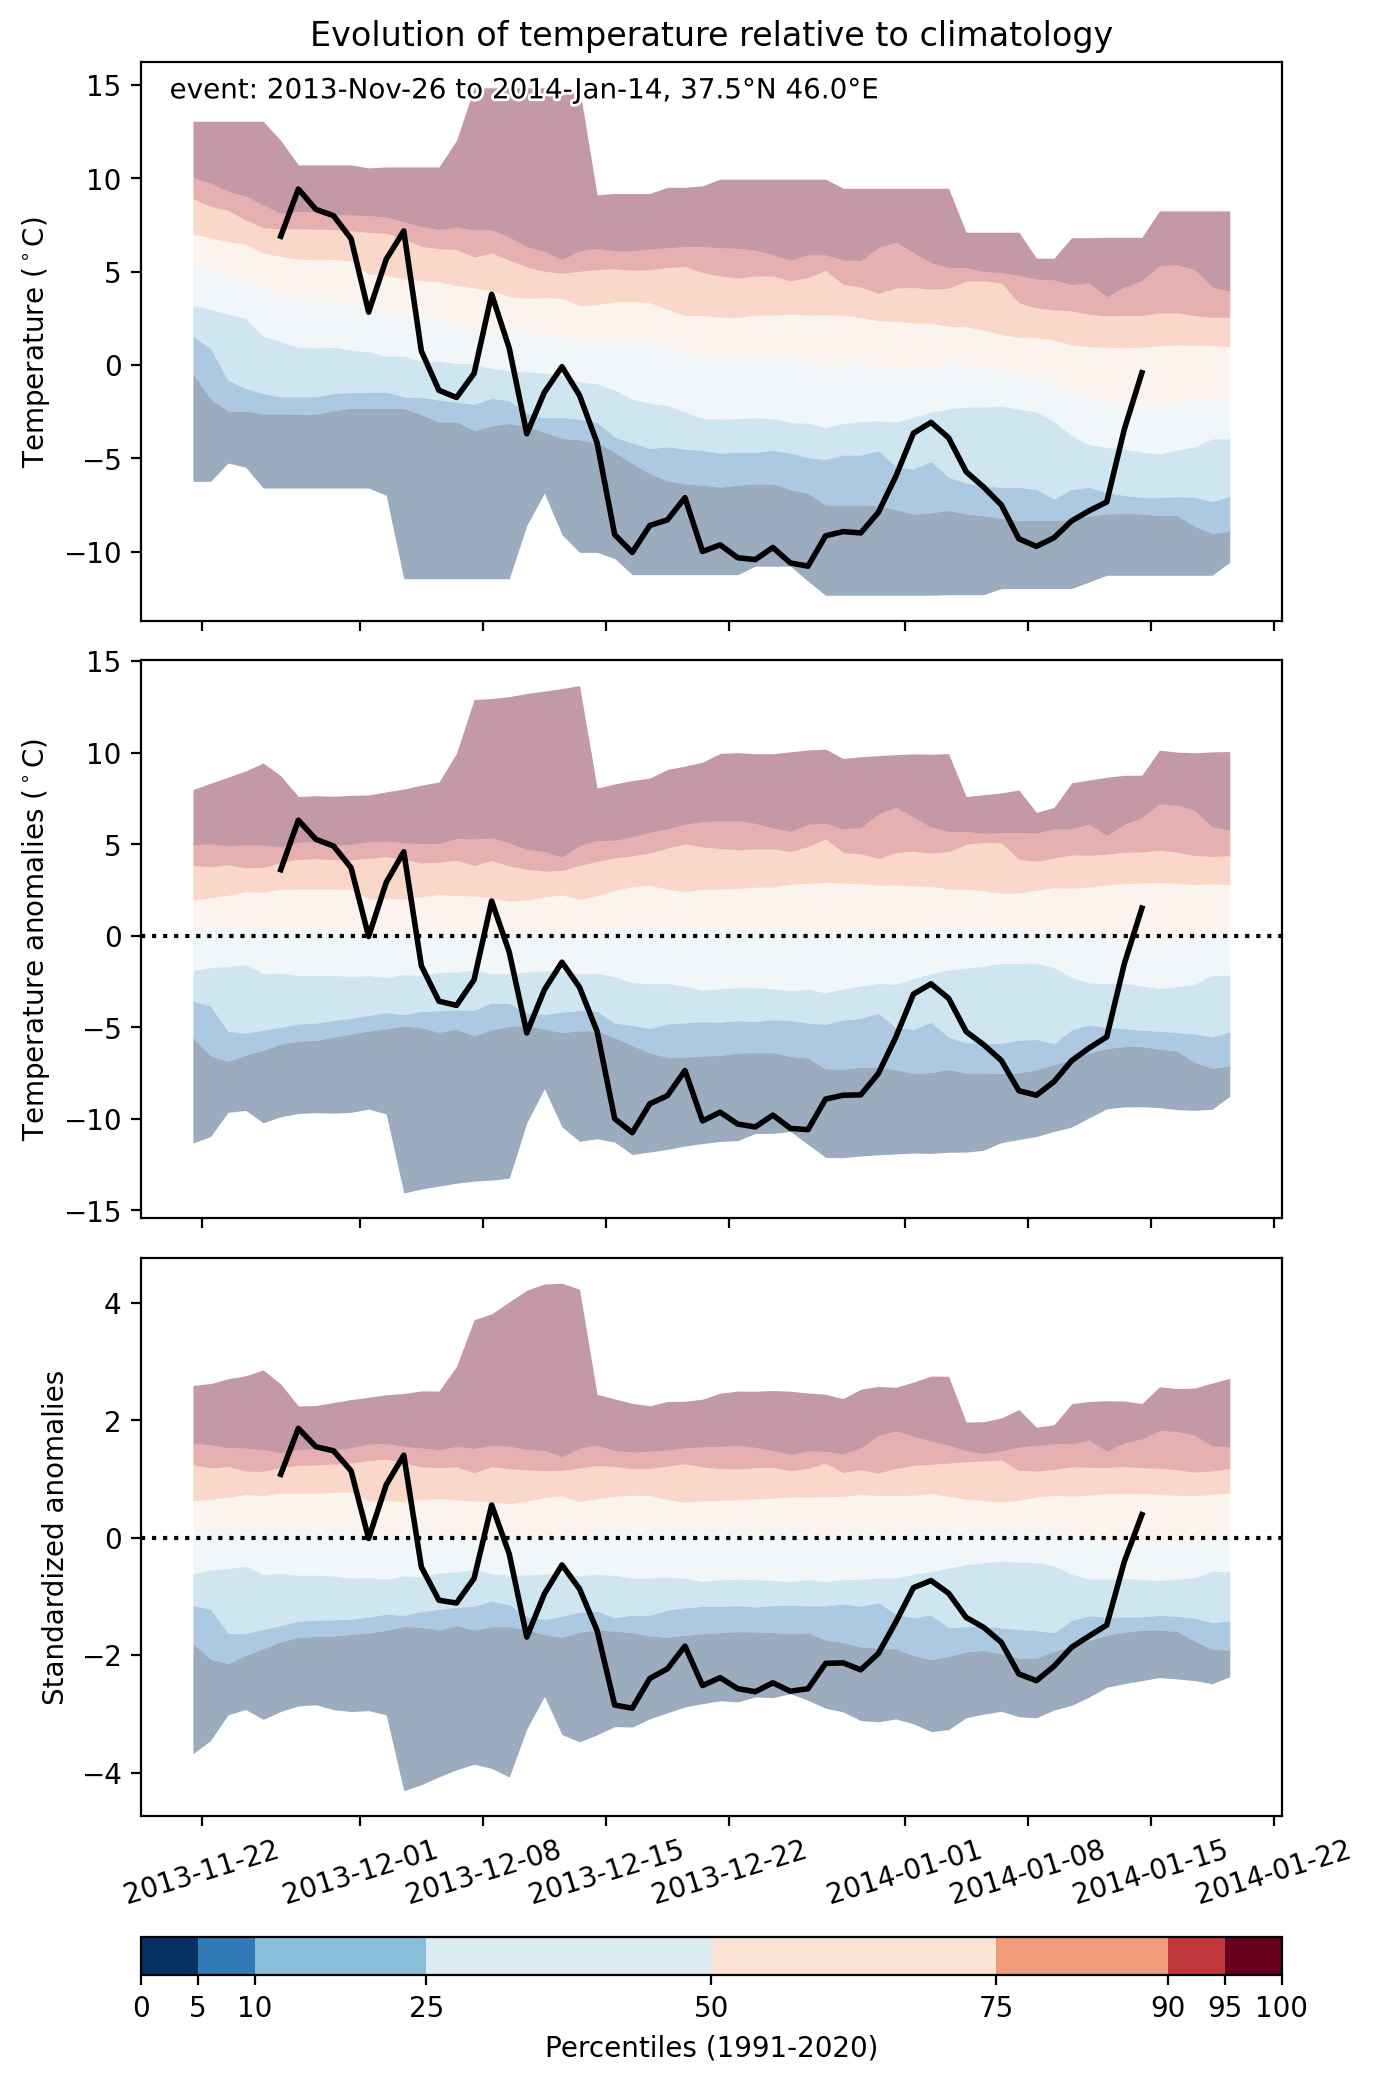
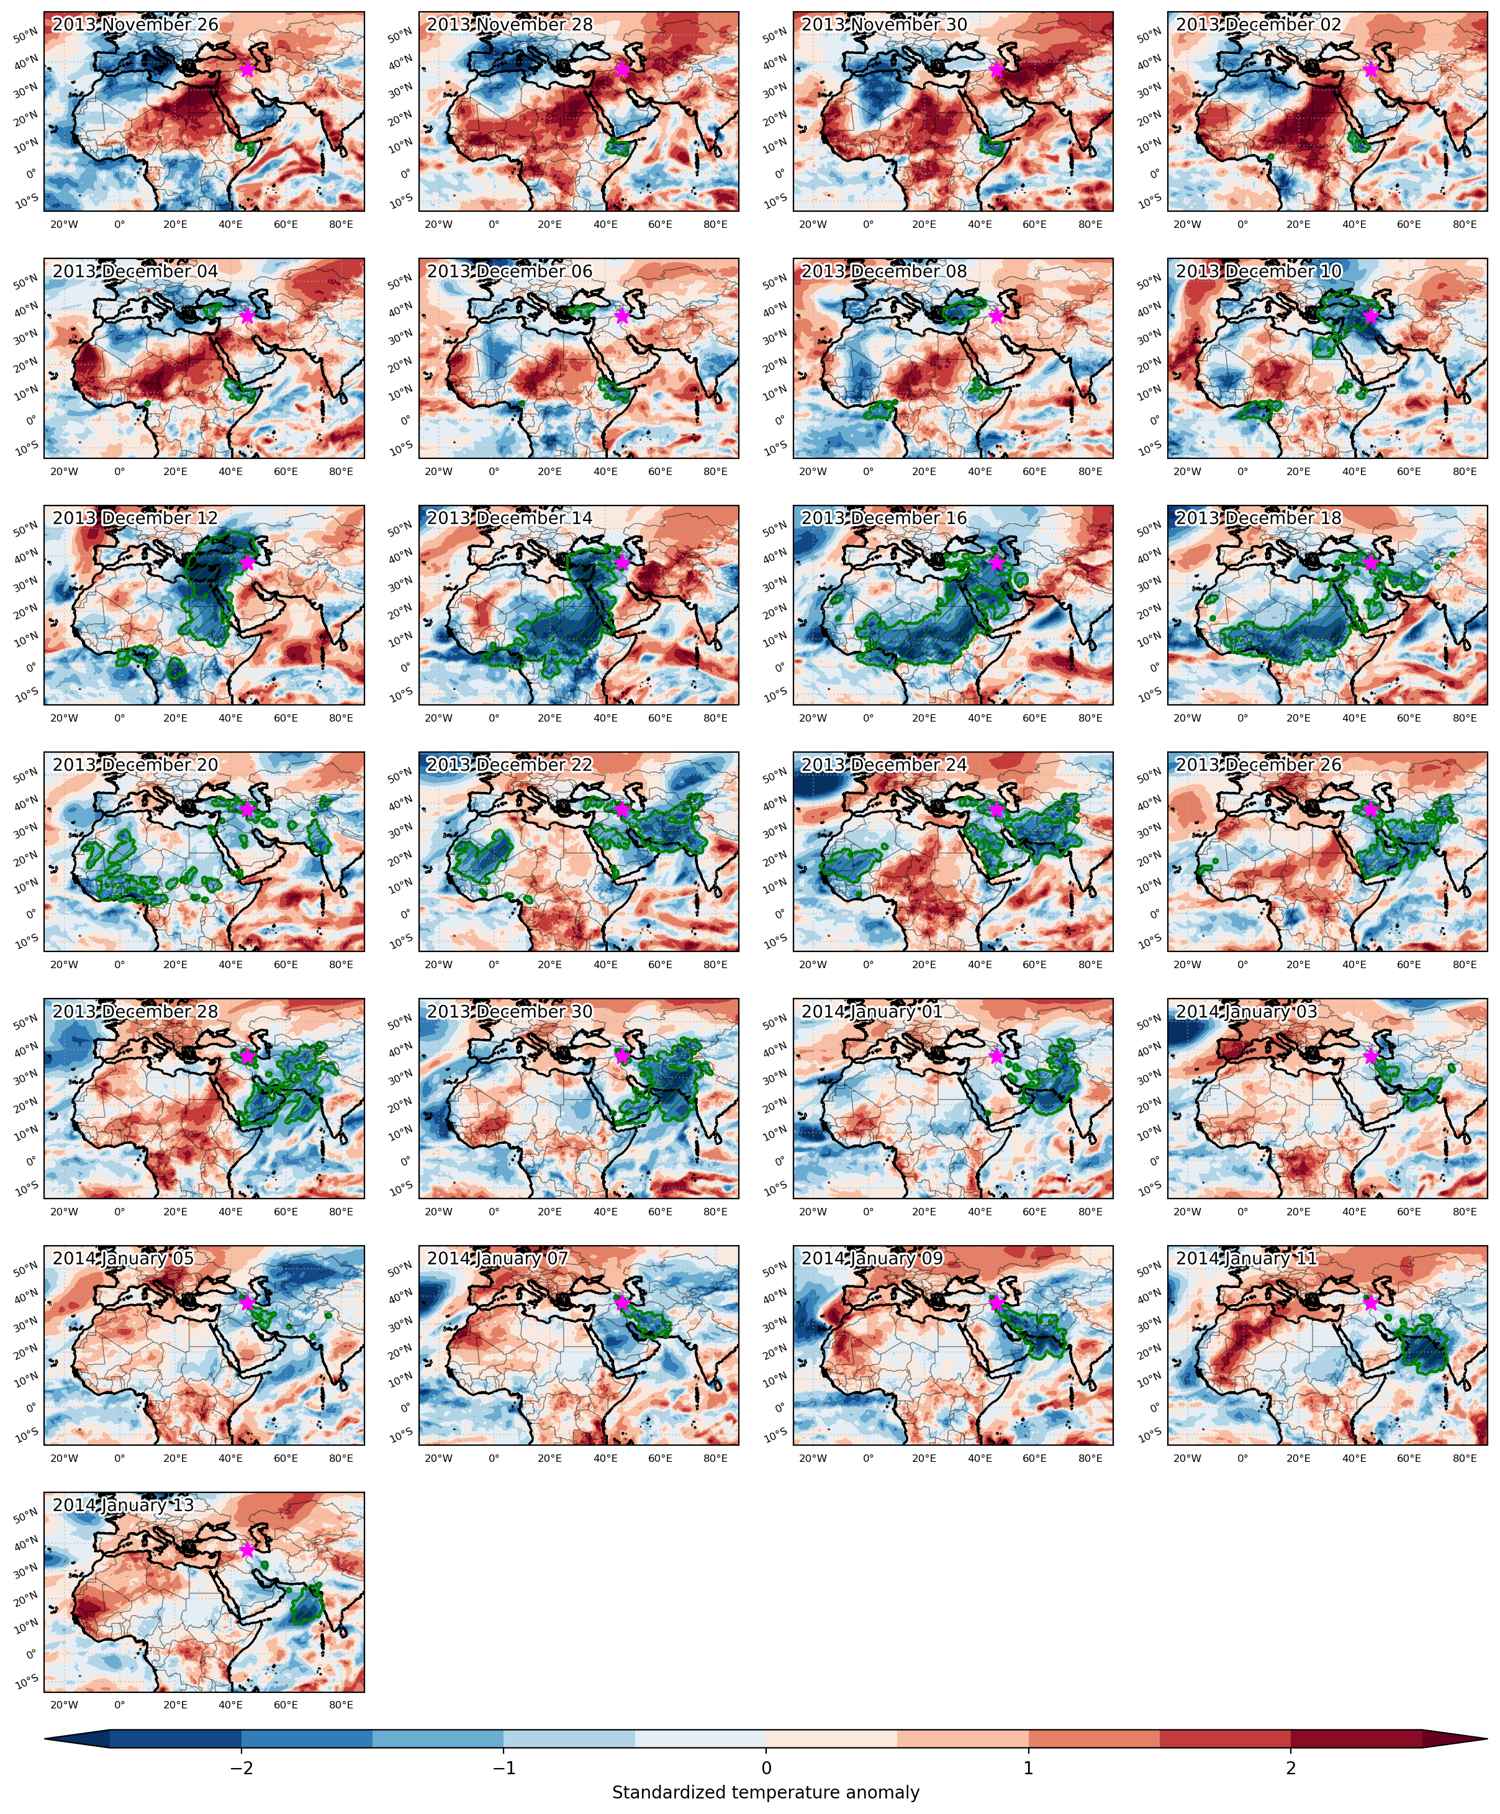
Cold spell occuring from November 26 2013 to January 14 2014 at 37.5°N 46.0°E

Download data: JSON

Event type: Cold spell

Countries affected (identified with ArcGIS Online; provided only for geographical reference):

  • Afghanistan
  • Algeria
  • Armenia
  • Azerbaijan
  • Benin
  • Burkina Faso
  • Cameroon
  • Central African Republic
  • Chad
  • China
  • Congo
  • Congo DRC
  • Cyprus
  • Côte d’Ivoire
  • Djibouti
  • Egypt
  • Eritrea
  • Ethiopia
  • Gabon
  • Georgia
  • Ghana
  • Greece
  • India
  • Iran
  • Iraq
  • Israel
  • Jordan
  • Kazakhstan
  • Kuwait
  • Kyrgyzstan
  • Lebanon
  • Libya
  • Mali
  • Mauritania
  • Morocco
  • Niger
  • Nigeria
  • Oman
  • Pakistan
  • Palestinian Territory
  • Qatar
  • Russian Federation
  • Saudi Arabia
  • Senegal
  • Somalia
  • South Sudan
  • Sudan
  • Syria
  • Tajikistan
  • Togo
  • Turkiye
  • Turkmenistan
  • Uganda
  • Ukraine
  • United Arab Emirates
  • Uzbekistan
  • Yemen

Duration: 50 days

Time span: November 26 2013 to January 14 2014

Statistics over entire affected area:

  • Mean temperature anomaly: -4.4 °C
  • Mean temperature: 12.2 °C
  • Minimum temperature anomaly: -17.9 °C
  • Minimum temperature: -32.5 °C

Event center: 37.5°N 46.0°E

Area affected: 22470255 km$^2$


Fig. 1: Map of most extreme temperature anomalies (standardized) experienced during the event. The purple star indicates the center of the extreme event. Green hatching illustrates all areas under the effect of extremes at some time during the event.


Fig. 2: Evolution of temperature at the center of the event. The climatological percentile distribution is illustrated with color shadings.


Fig. 3: Maps illustrating the evolution of standardized temperature anomalies during the event.

Event ID: Cold_spell_2013-Nov-26_to_2014-Jan-14_46.0_37.5

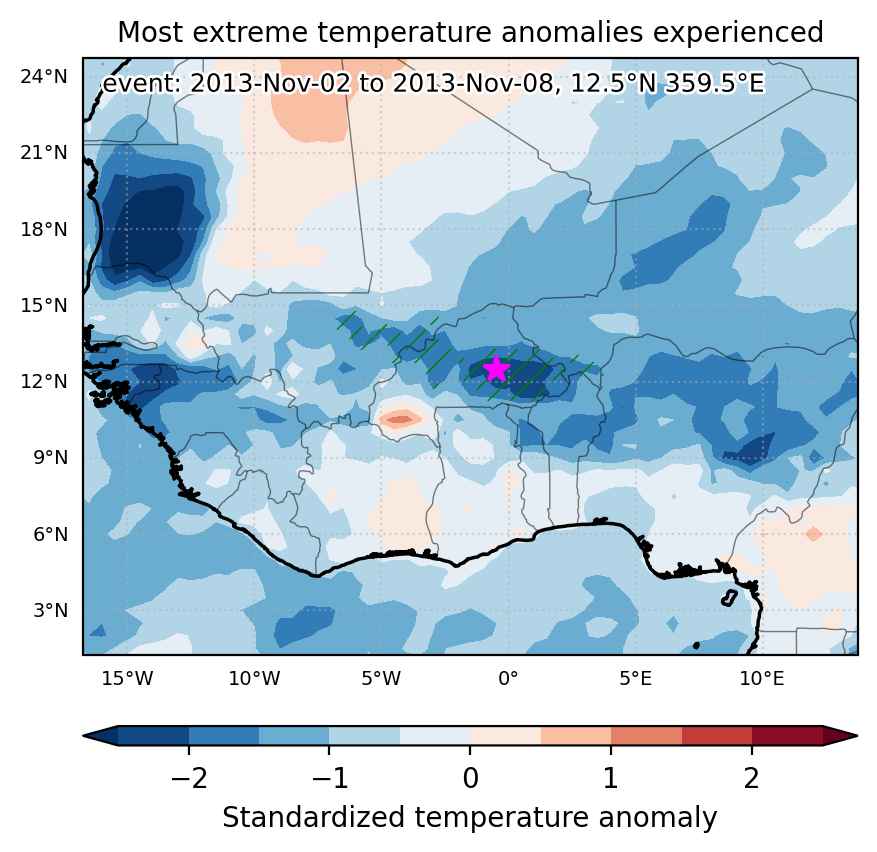
Cold spell occuring from November 02 2013 to November 08 2013 at 12.5°N 359.5°E

Download data: JSON

Event type: Cold spell

Countries affected (identified with ArcGIS Online; provided only for geographical reference):

  • Burkina Faso
  • Mali
  • Niger

Duration: 7 days

Time span: November 02 2013 to November 08 2013

Statistics over entire affected area:

  • Mean temperature anomaly: -2.1 °C
  • Mean temperature: 27.0 °C
  • Minimum temperature anomaly: -3.1 °C
  • Minimum temperature: 25.4 °C

Event center: 12.5°N 359.5°E

Area affected: 153708 km$^2$


Fig. 1: Map of most extreme temperature anomalies (standardized) experienced during the event. The purple star indicates the center of the extreme event. Green hatching illustrates all areas under the effect of extremes at some time during the event.


Fig. 2: Evolution of temperature at the center of the event. The climatological percentile distribution is illustrated with color shadings.


Fig. 3: Maps illustrating the evolution of standardized temperature anomalies during the event.

Event ID: Cold_spell_2013-Nov-02_to_2013-Nov-08_359.5_12.5