Heat wave occuring from December 14 2020 to December 18 2020 at -36.5°S 151.5°E

Download data: JSON

Event type: Heat wave

Countries affected (identified with ArcGIS Online; provided only for geographical reference):

  • Australia

Duration: 5 days

Time span: December 14 2020 to December 18 2020

Statistics over entire affected area:

  • Mean temperature anomaly: 2.9 °C
  • Mean temperature: 22.9 °C
  • Maximum temperature anomaly: 4.3 °C
  • Maximum temperature: 24.0 °C

Event center: -36.5°S 151.5°E

Area affected: 100743 km$^2$
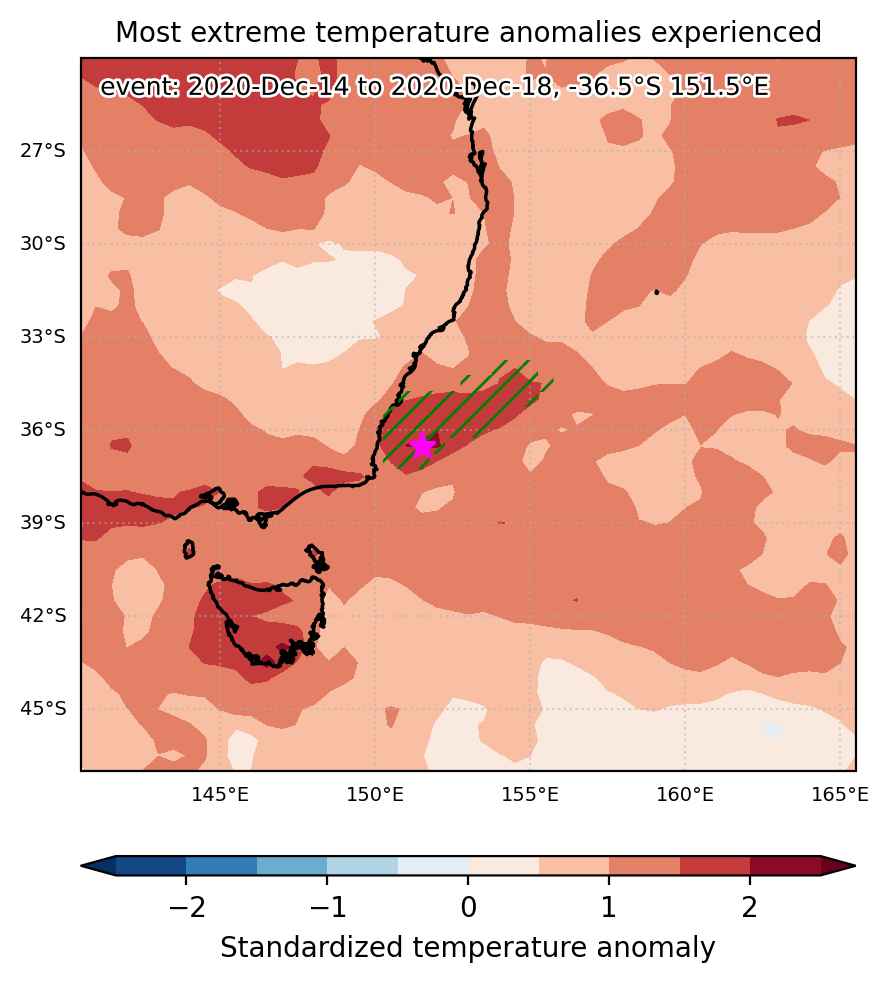

Fig. 1: Map of most extreme temperature anomalies (standardized) experienced during the event. The purple star indicates the center of the extreme event. Green hatching illustrates all areas under the effect of extremes at some time during the event.
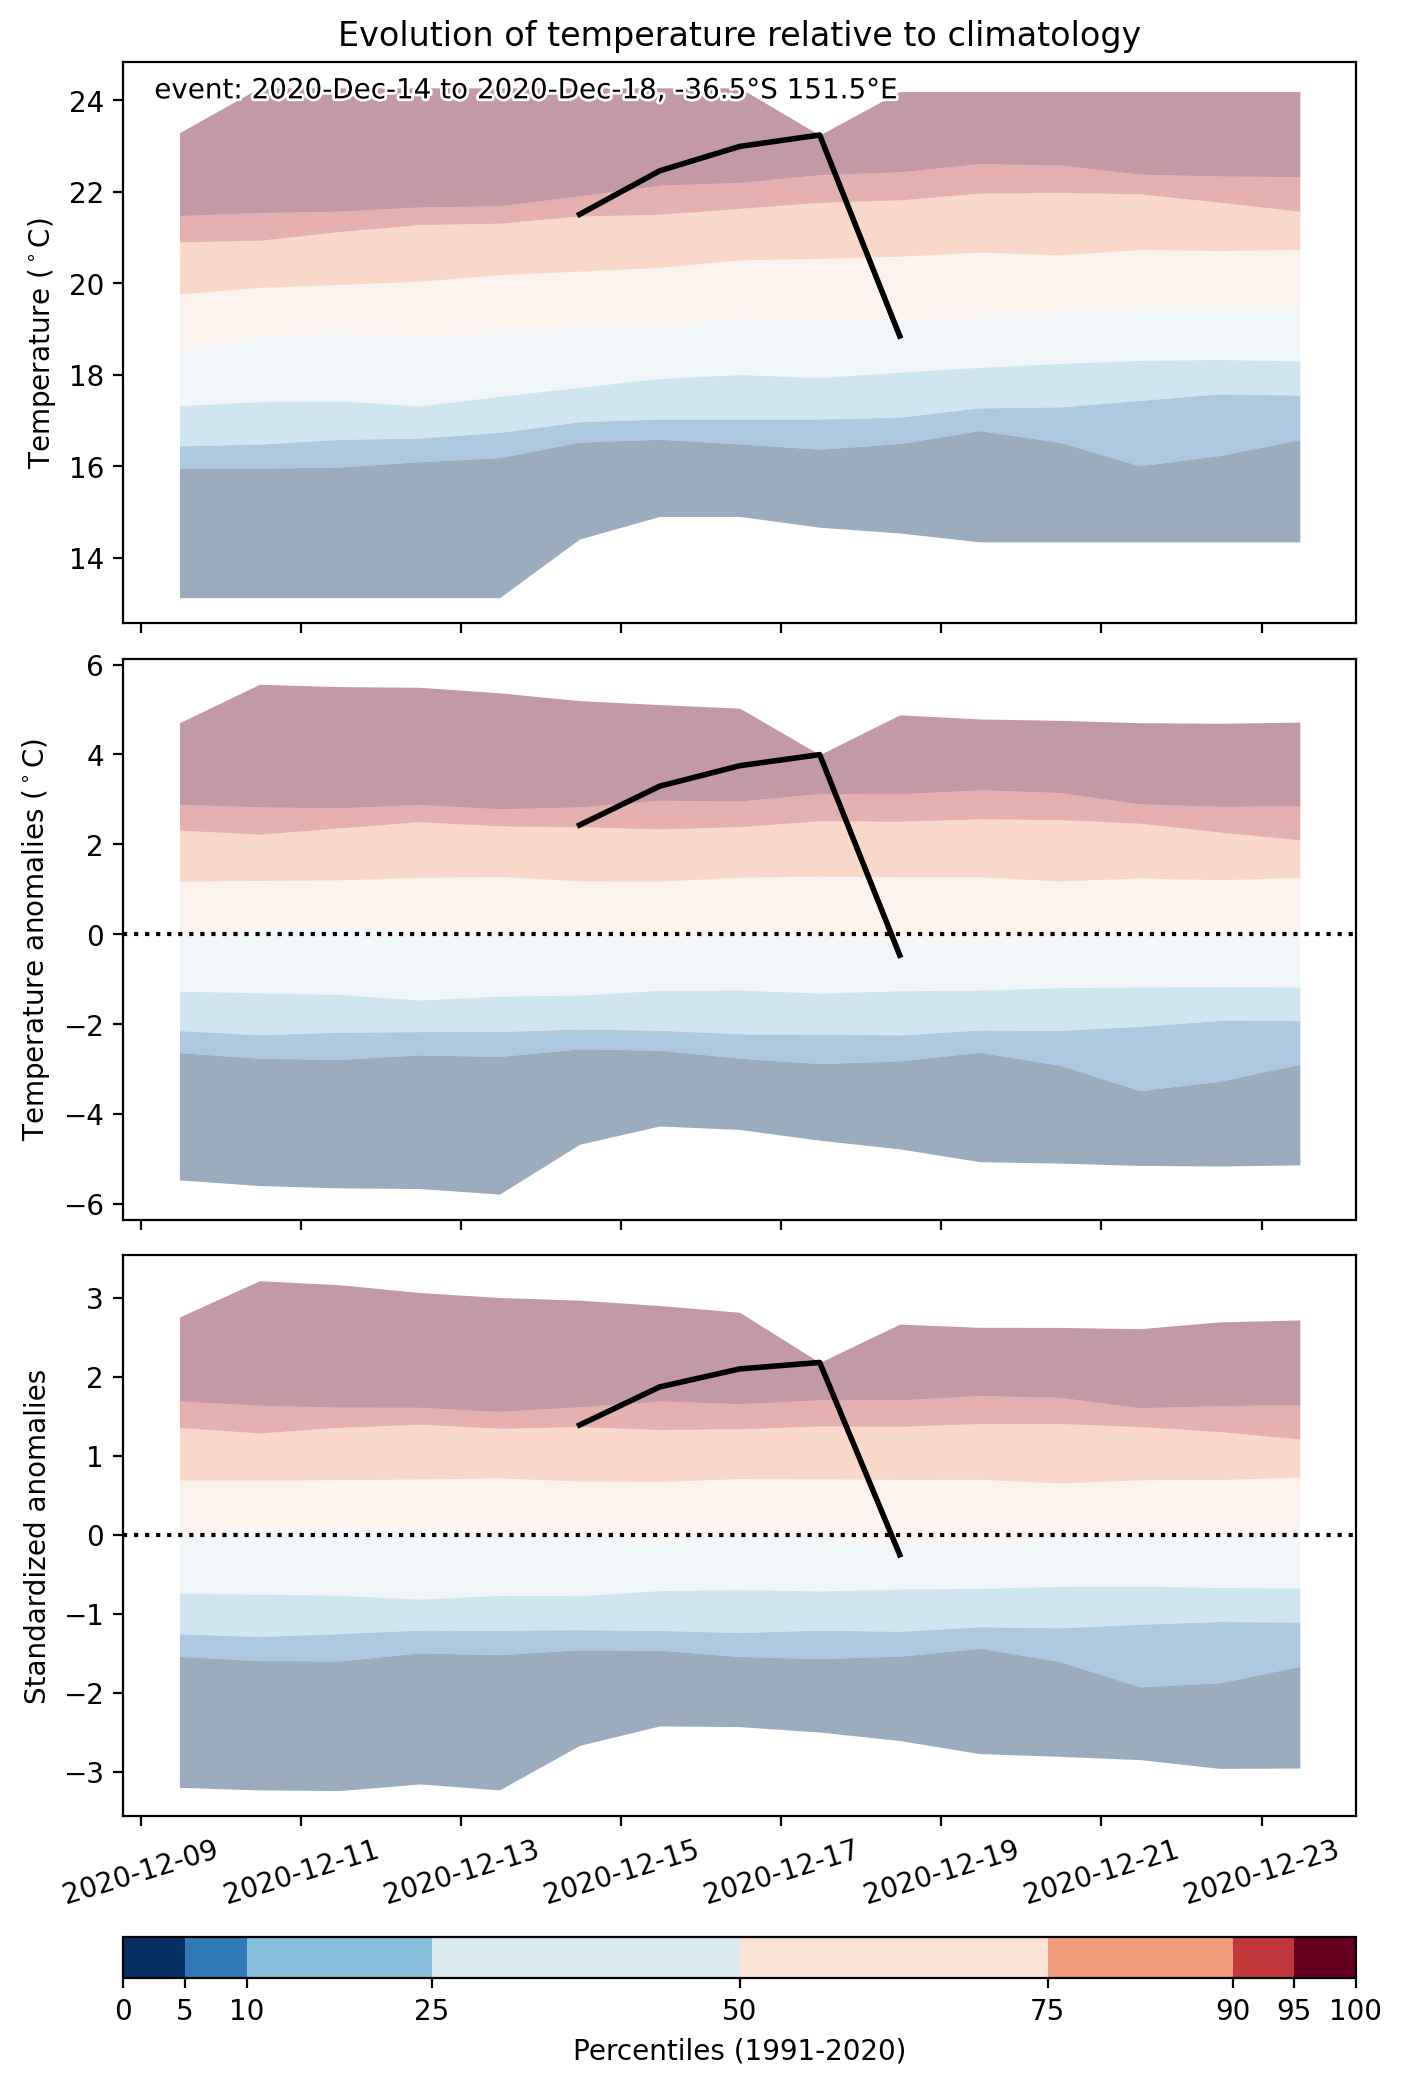


Fig. 2: Evolution of temperature at the center of the event. The climatological percentile distribution is illustrated with color shadings.
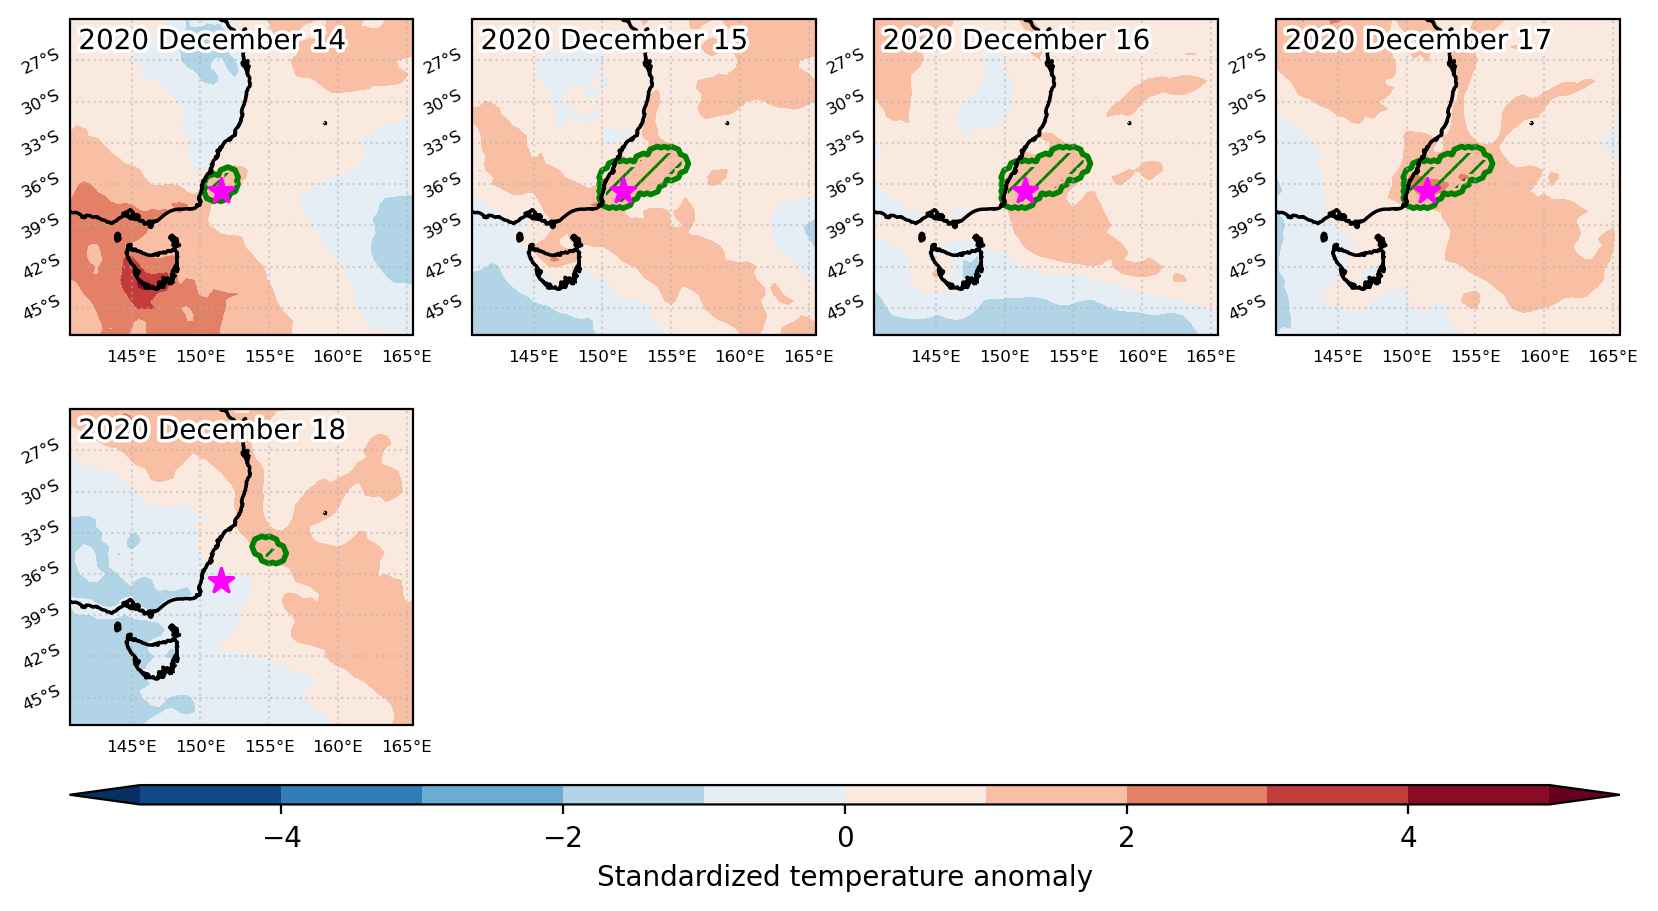


Fig. 3: Maps illustrating the evolution of standardized temperature anomalies during the event.

Event ID: Heat_wave_2020-Dec-14_to_2020-Dec-18_151.5_-36.5
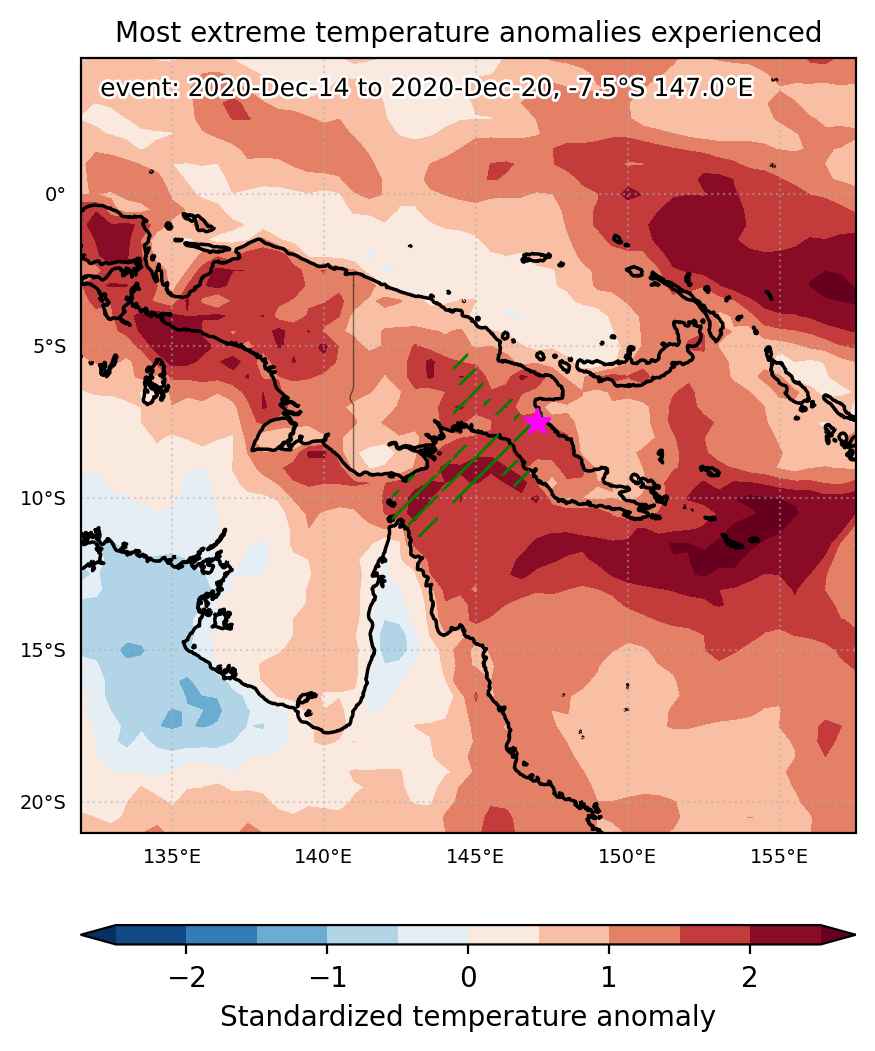
Heat wave occuring from December 14 2020 to December 20 2020 at -7.5°S 147.0°E

Download data: JSON

Event type: Heat wave

Countries affected (identified with ArcGIS Online; provided only for geographical reference):

  • Australia
  • Papua New Guinea

Duration: 7 days

Time span: December 14 2020 to December 20 2020

Statistics over entire affected area:

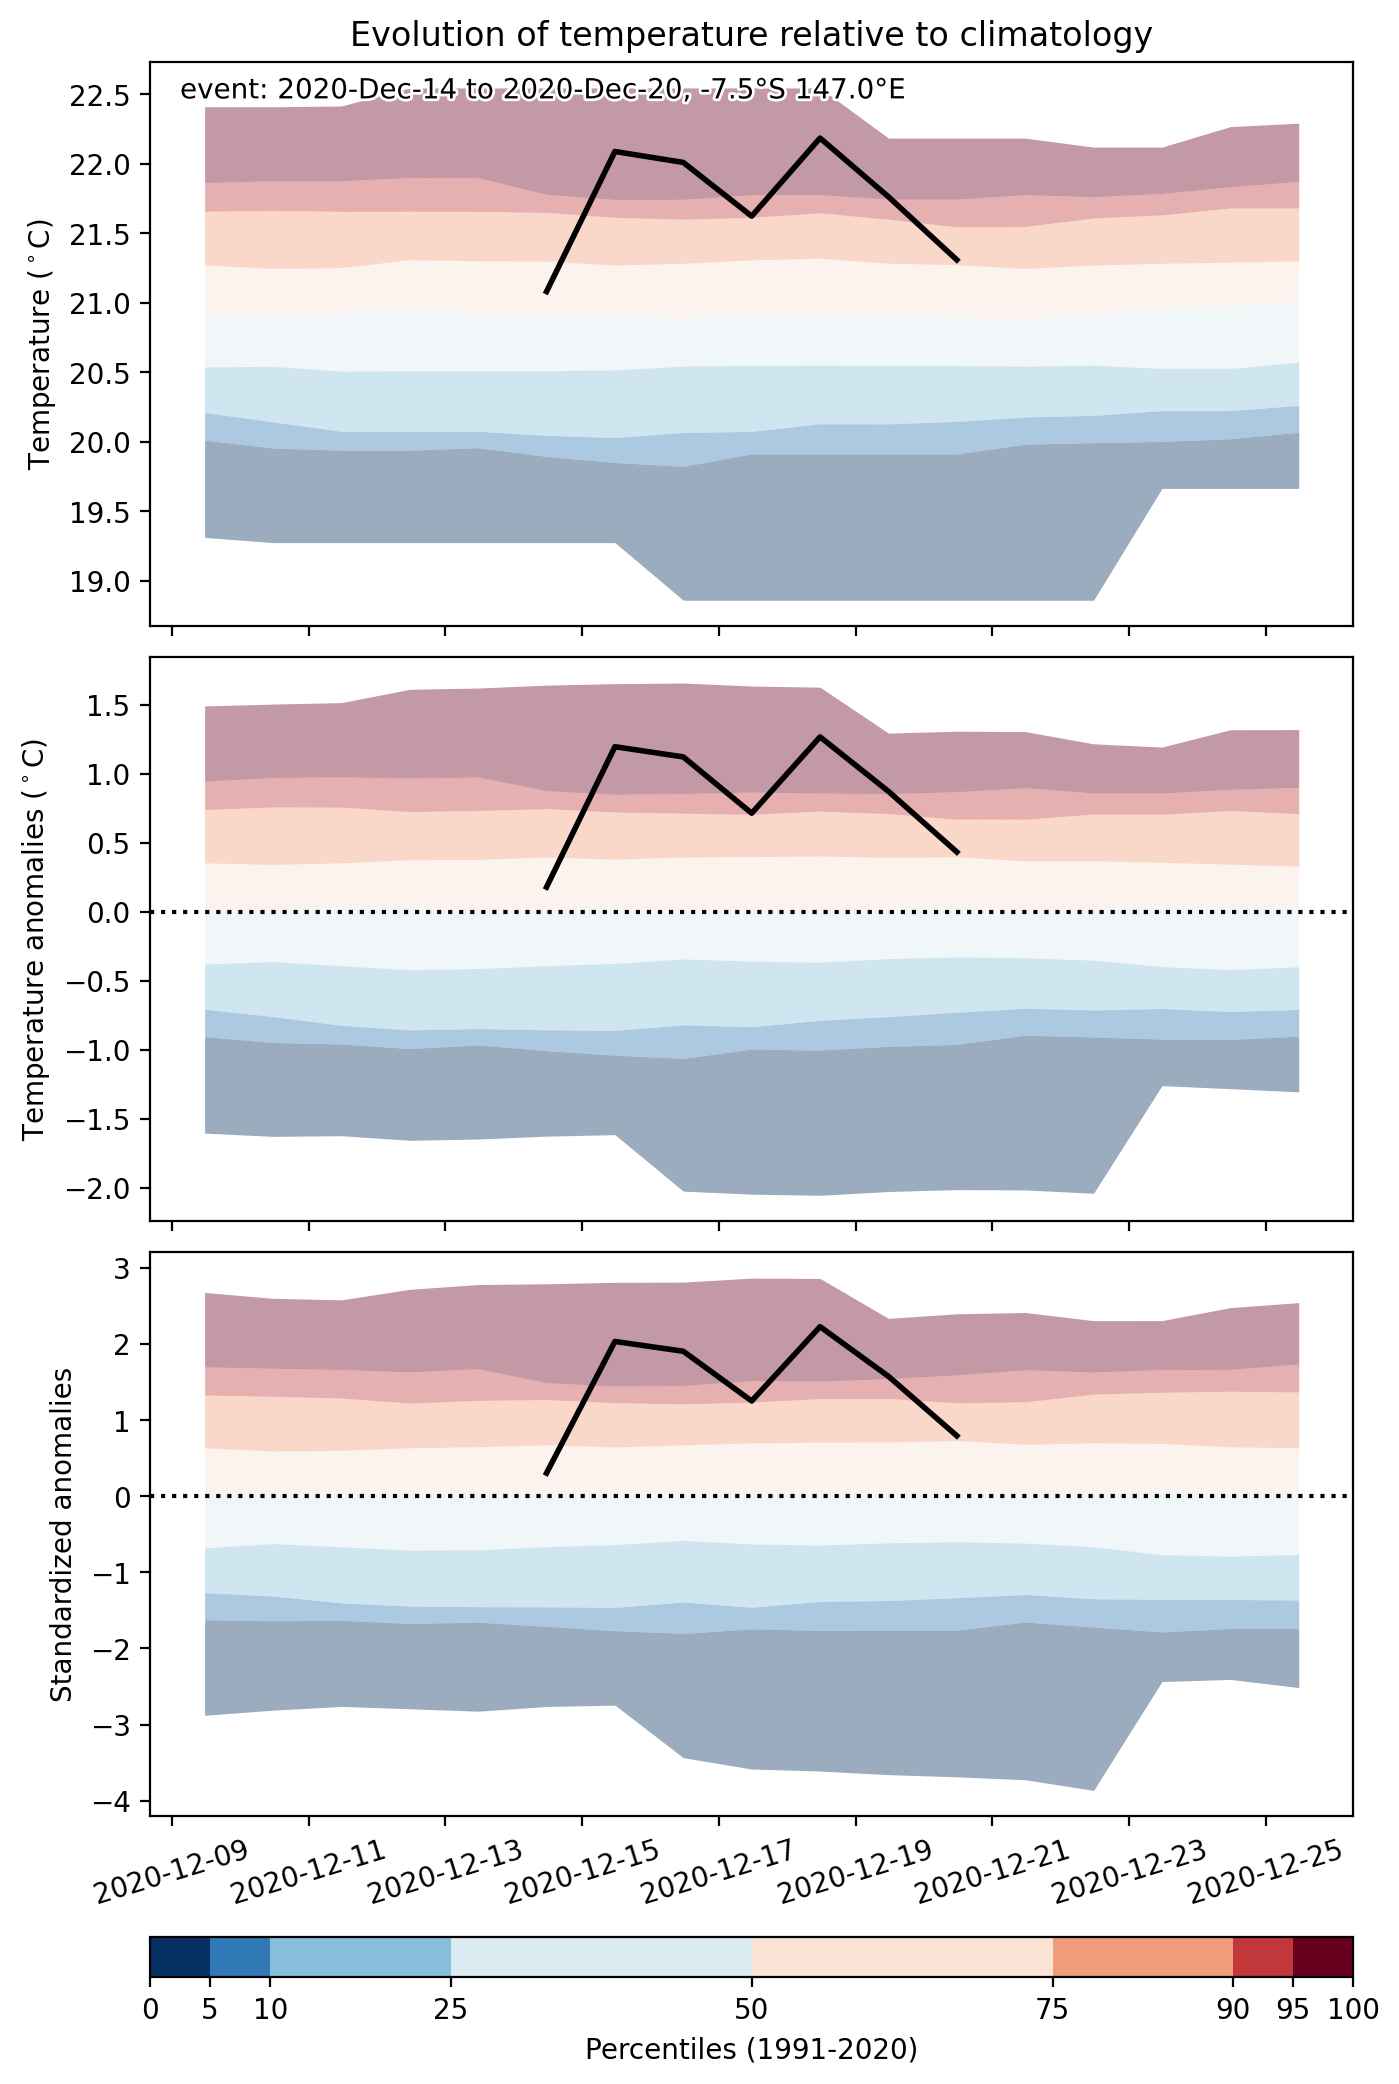
  • Mean temperature anomaly: 1.1 °C
  • Mean temperature: 26.3 °C
  • Maximum temperature anomaly: 2.1 °C
  • Maximum temperature: 29.1 °C

Event center: -7.5°S 147.0°E

Area affected: 109953 km$^2$


Fig. 1: Map of most extreme temperature anomalies (standardized) experienced during the event. The purple star indicates the center of the extreme event. Green hatching illustrates all areas under the effect of extremes at some time during the event.


Fig. 2: Evolution of temperature at the center of the event. The climatological percentile distribution is illustrated with color shadings.


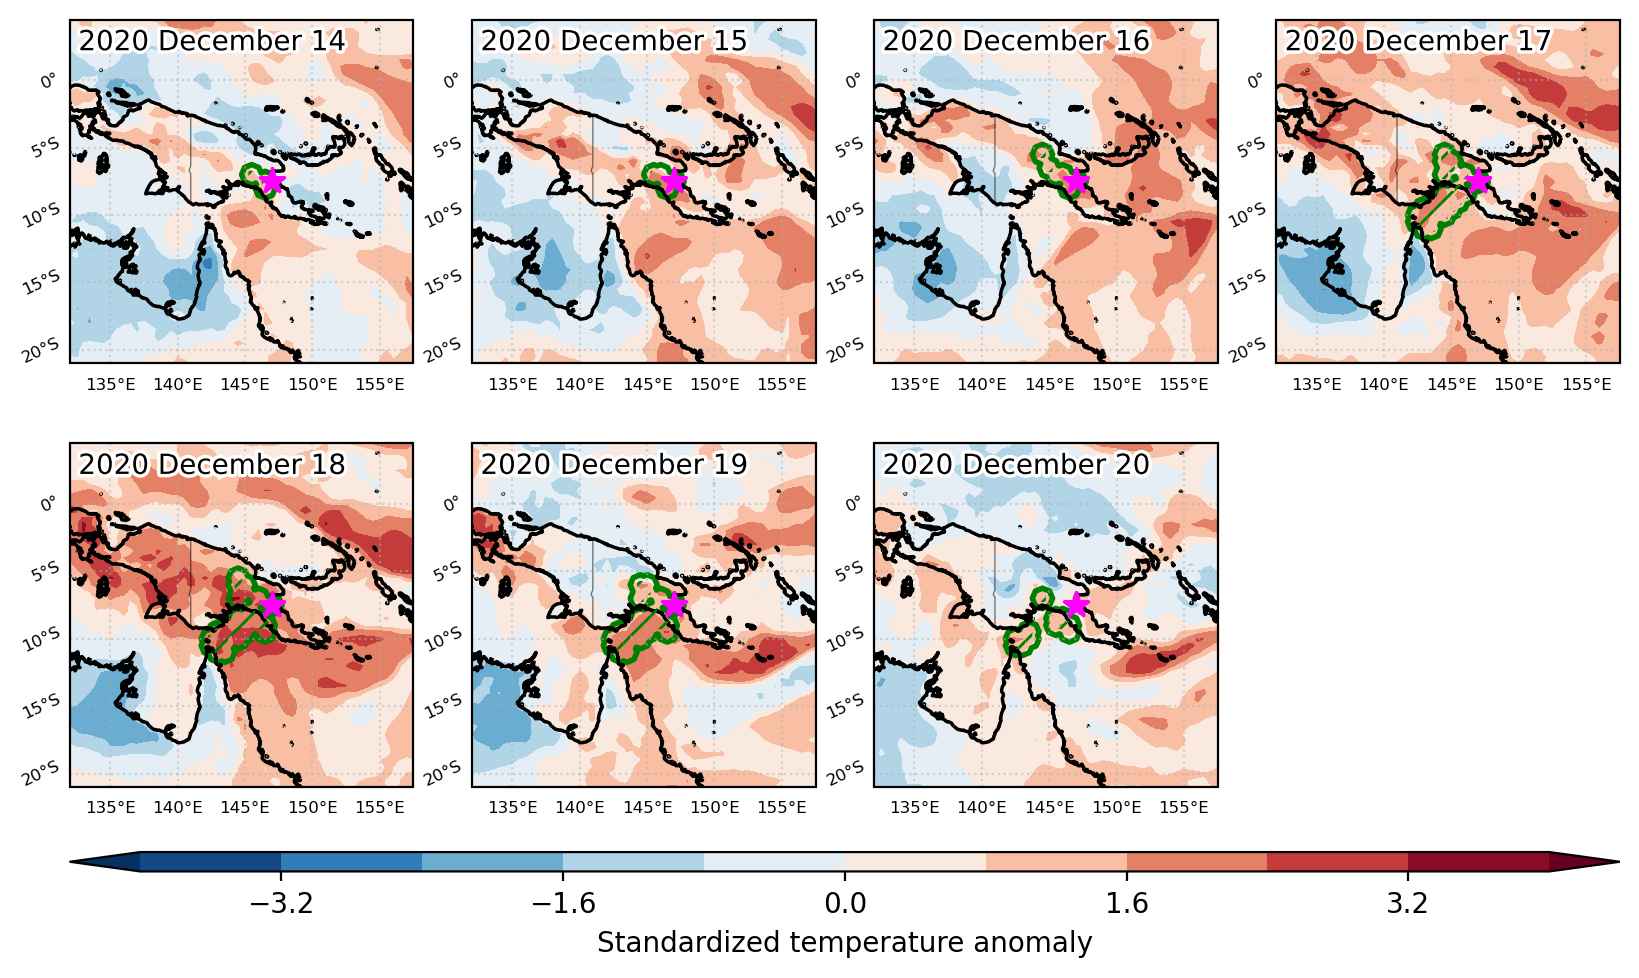
Fig. 3: Maps illustrating the evolution of standardized temperature anomalies during the event.

Event ID: Heat_wave_2020-Dec-14_to_2020-Dec-20_147.0_-7.5

Heat wave occuring from December 13 2020 to December 27 2020 at -11.5°S 153.5°E

Download data: JSON

Event type: Heat wave

Countries affected (identified with ArcGIS Online; provided only for geographical reference):

  • Australia
  • Papua New Guinea
  • Solomon Islands

Duration: 15 days

Time span: December 13 2020 to December 27 2020

Statistics over entire affected area:

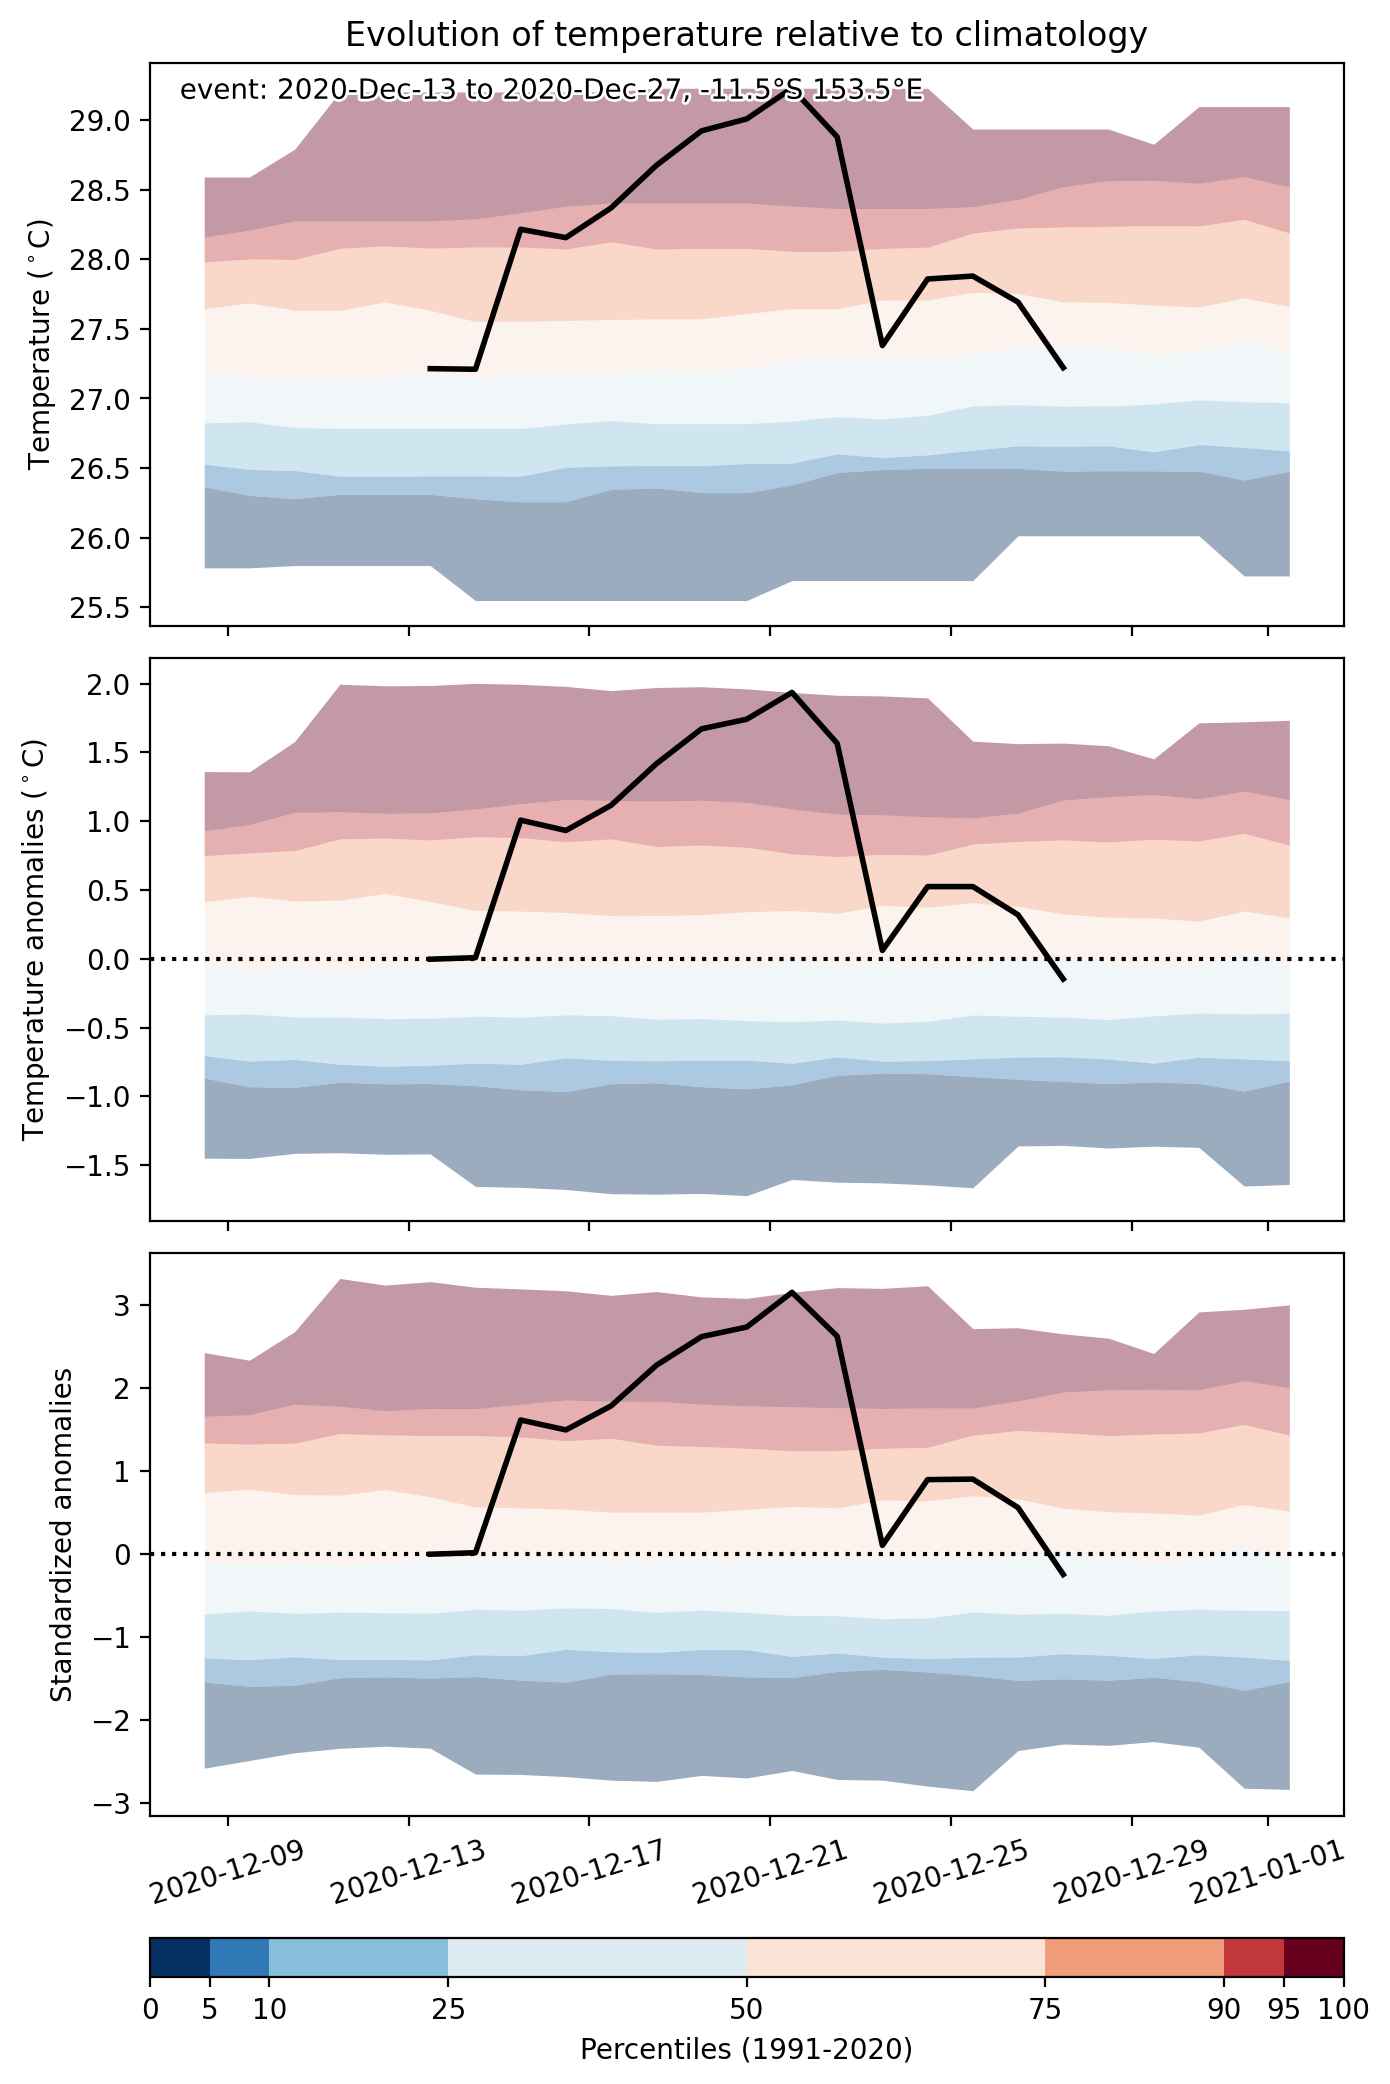
  • Mean temperature anomaly: 2.5 °C
  • Mean temperature: 30.4 °C
  • Maximum temperature anomaly: 6.8 °C
  • Maximum temperature: 38.4 °C

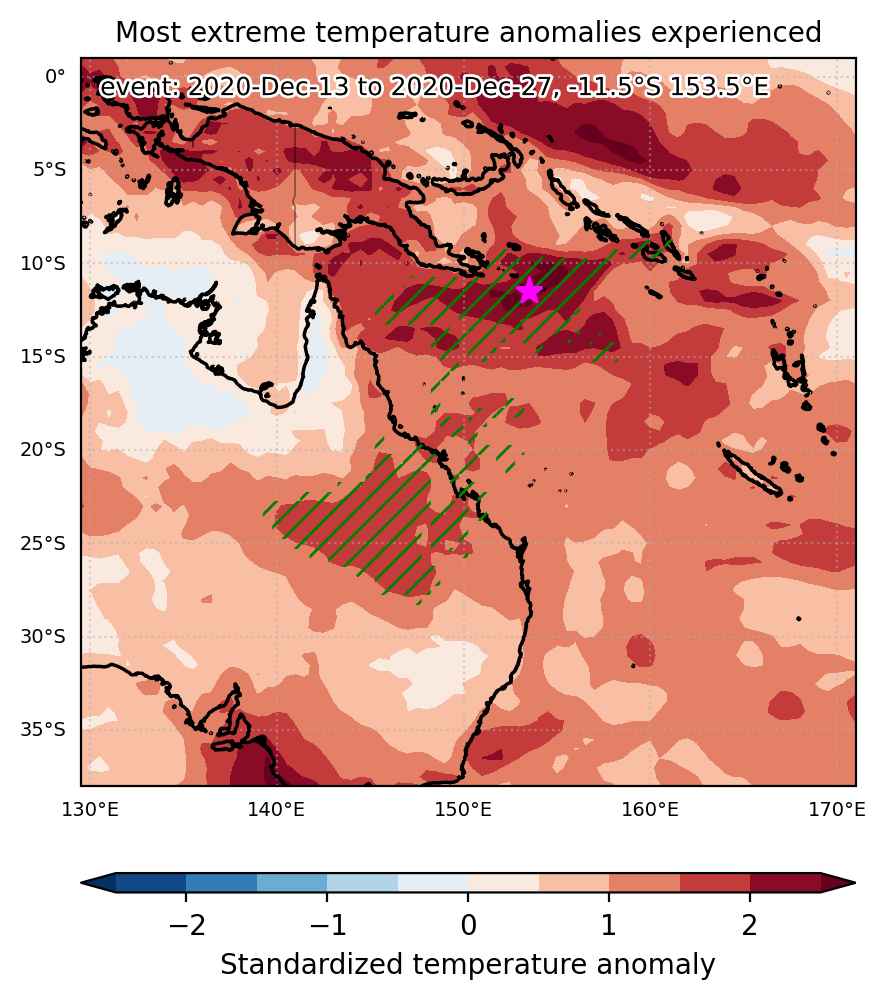
Event center: -11.5°S 153.5°E

Area affected: 1241389 km$^2$


Fig. 1: Map of most extreme temperature anomalies (standardized) experienced during the event. The purple star indicates the center of the extreme event. Green hatching illustrates all areas under the effect of extremes at some time during the event.


Fig. 2: Evolution of temperature at the center of the event. The climatological percentile distribution is illustrated with color shadings.


Fig. 3: Maps illustrating the evolution of standardized temperature anomalies during the event.

Event ID: Heat_wave_2020-Dec-13_to_2020-Dec-27_153.5_-11.5

Heat wave occuring from December 12 2020 to December 14 2020 at -38.0°S 140.5°E

Download data: JSON

Event type: Heat wave

Countries affected (identified with ArcGIS Online; provided only for geographical reference):

  • Australia

Duration: 3 days

Time span: December 12 2020 to December 14 2020

Statistics over entire affected area:

  • Mean temperature anomaly: 5.2 °C
  • Mean temperature: 21.4 °C
  • Maximum temperature anomaly: 10.8 °C
  • Maximum temperature: 29.9 °C

Event center: -38.0°S 140.5°E

Area affected: 131496 km$^2$


Fig. 1: Map of most extreme temperature anomalies (standardized) experienced during the event. The purple star indicates the center of the extreme event. Green hatching illustrates all areas under the effect of extremes at some time during the event.


Fig. 2: Evolution of temperature at the center of the event. The climatological percentile distribution is illustrated with color shadings.


Fig. 3: Maps illustrating the evolution of standardized temperature anomalies during the event.

Event ID: Heat_wave_2020-Dec-12_to_2020-Dec-14_140.5_-38.0

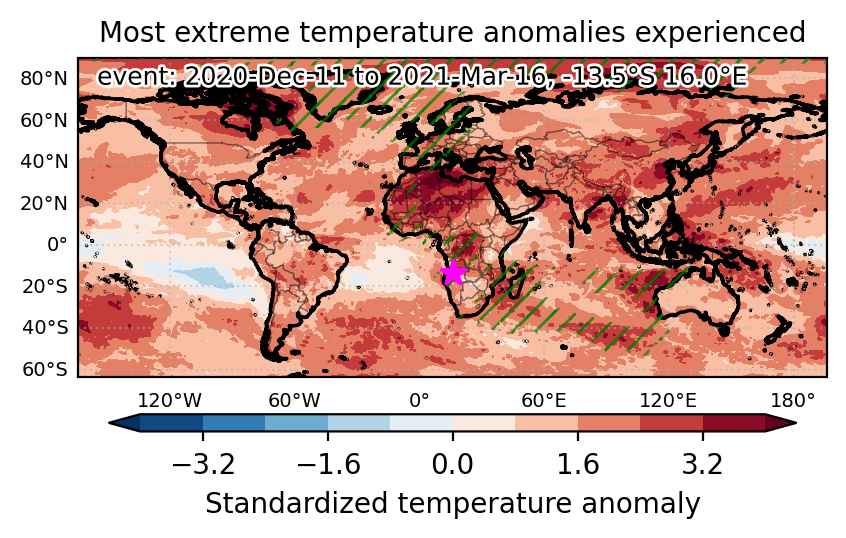
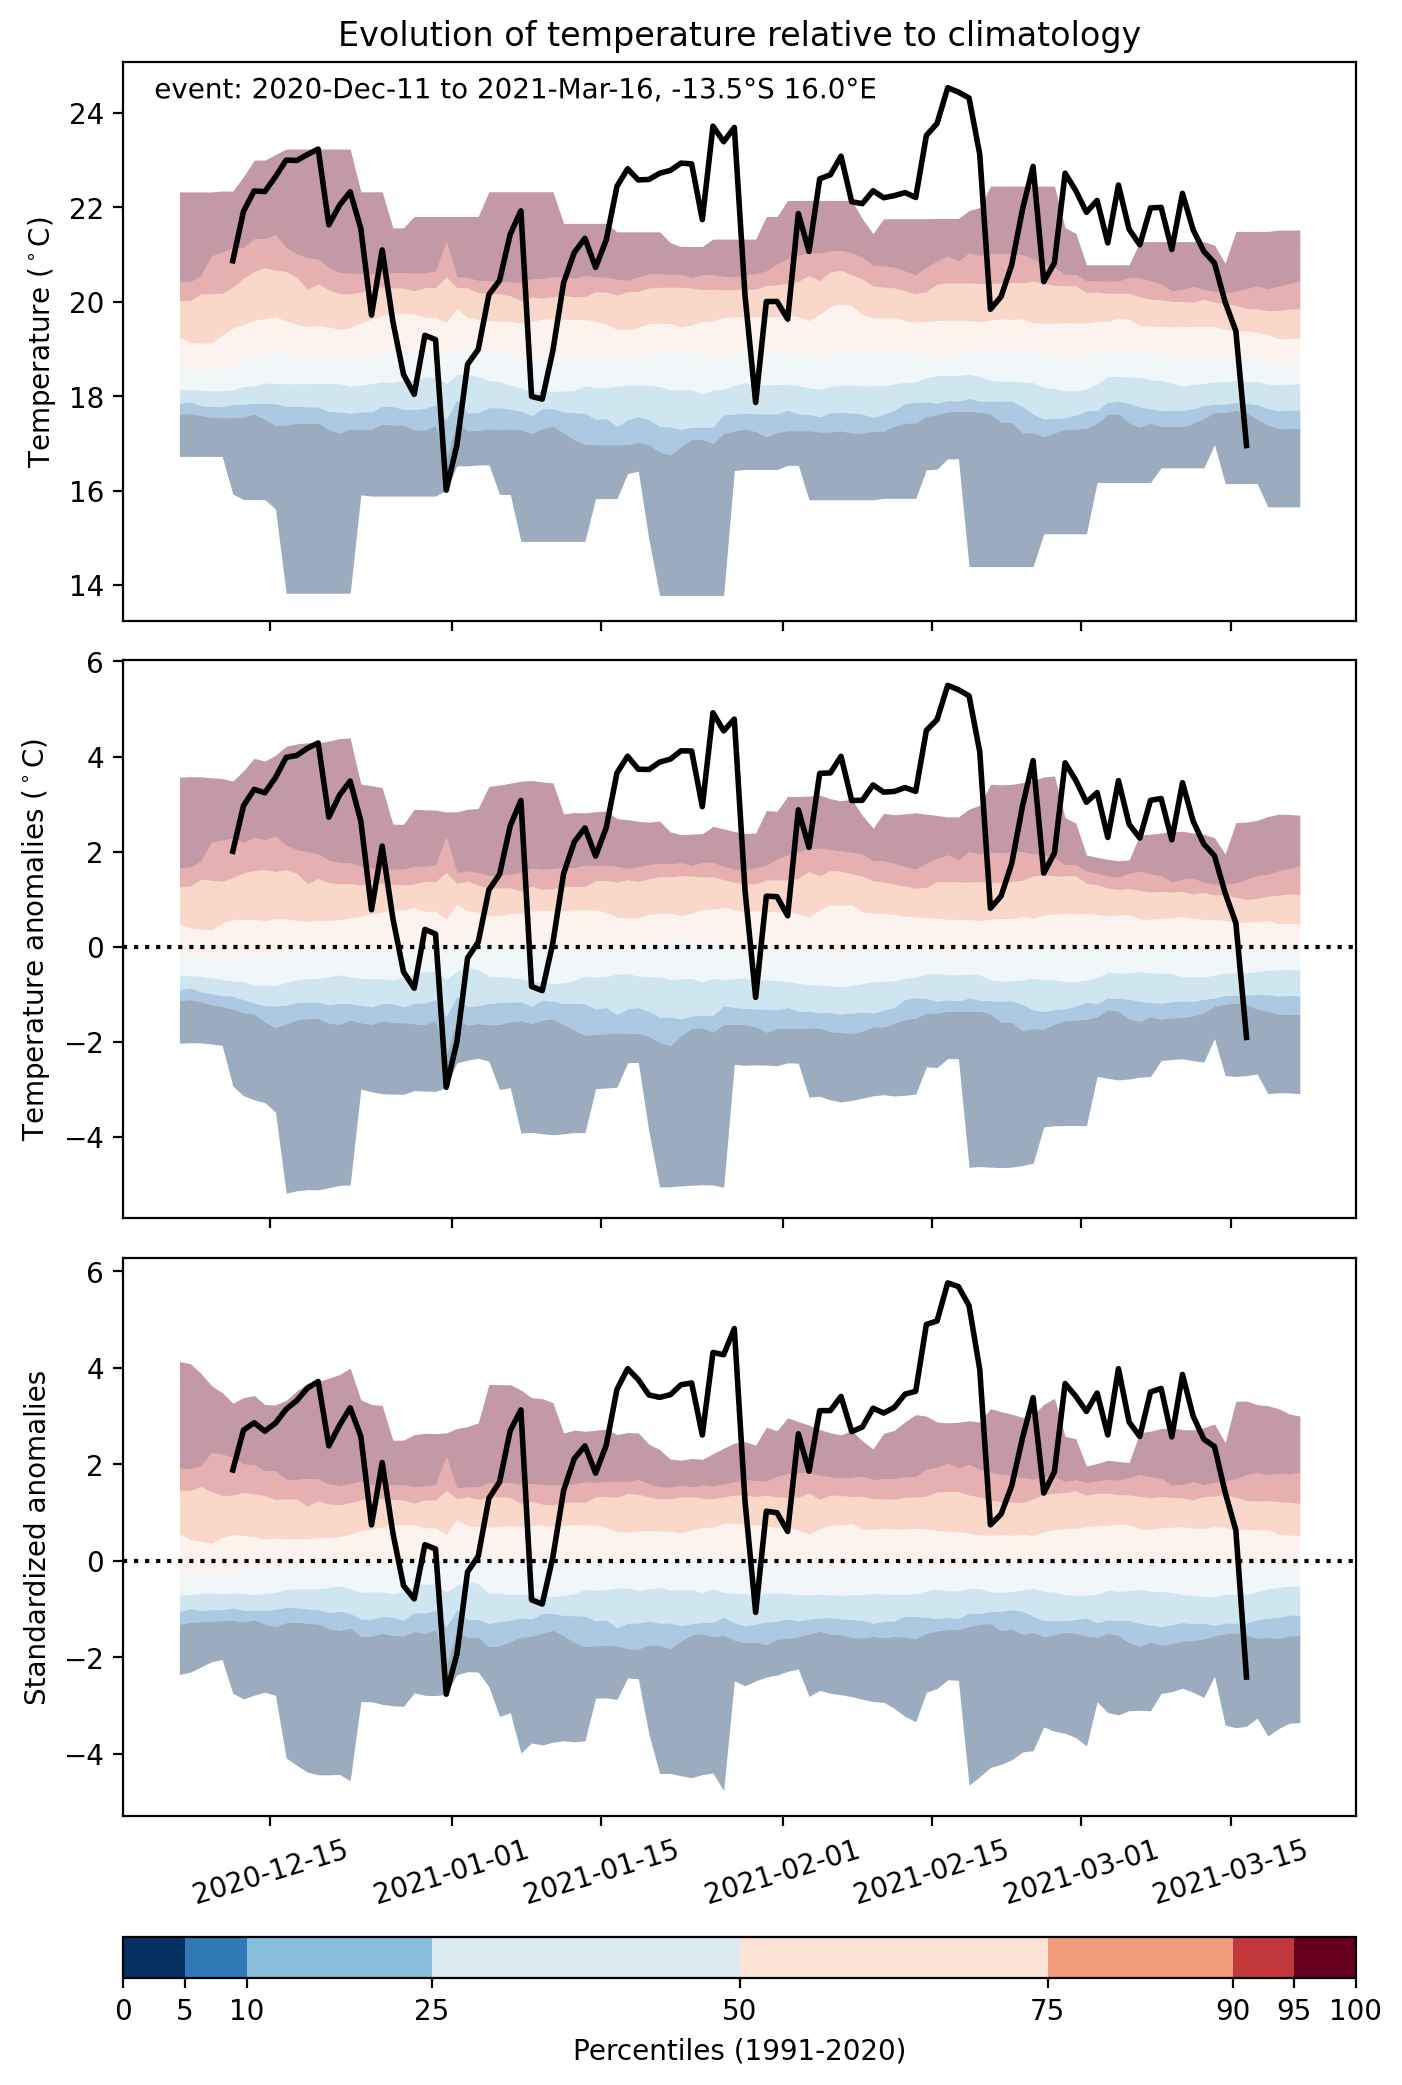
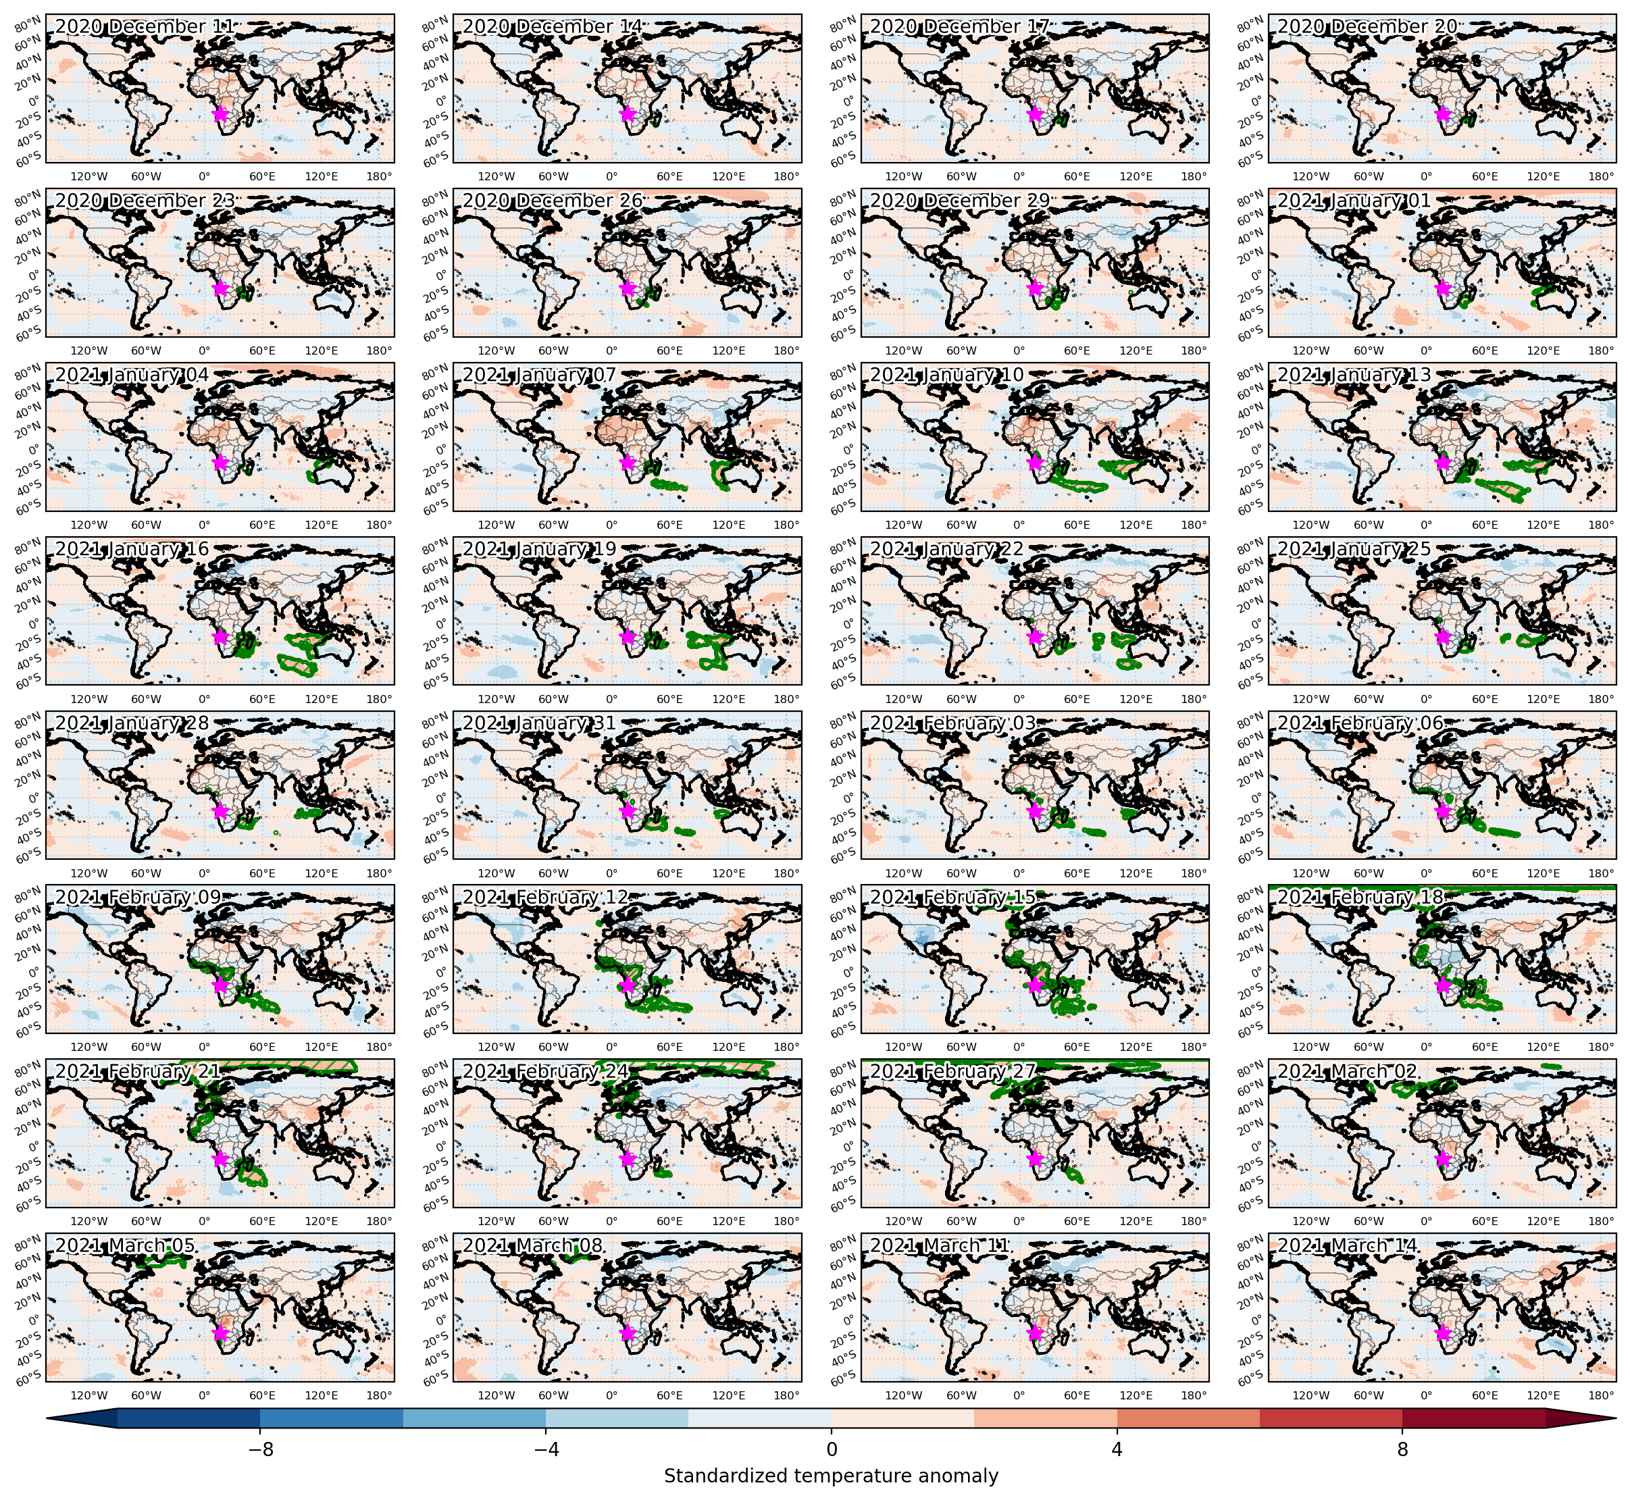
Heat wave occuring from December 11 2020 to March 16 2021 at -13.5°S 16.0°E

Download data: JSON

Event type: Heat wave

Countries affected (identified with ArcGIS Online; provided only for geographical reference):

  • Algeria
  • Angola
  • Australia
  • Austria
  • Belarus
  • Belgium
  • Benin
  • Bosnia and Herzegovina
  • Burkina Faso
  • Cameroon
  • Canada
  • Central African Republic
  • Congo
  • Congo, The Democratic Republic of the
  • Croatia
  • Czechia
  • Côte d’Ivoire
  • Denmark
  • Equatorial Guinea
  • Estonia
  • Eswatini
  • Finland
  • France
  • Gabon
  • Germany
  • Ghana
  • Greenland
  • Guinea
  • Guinea-Bissau
  • Hungary
  • Iceland
  • Italy
  • Latvia
  • Liberia
  • Lithuania
  • Luxembourg
  • Madagascar
  • Malawi
  • Mali
  • Mauritania
  • Montenegro
  • Mozambique
  • Namibia
  • Netherlands
  • Nigeria
  • Norway
  • Poland
  • Portugal
  • Russian Federation
  • Réunion
  • Senegal
  • Sierra Leone
  • Slovakia
  • Slovenia
  • South Africa
  • South Sudan
  • Spain
  • Svalbard and Jan Mayen
  • Sweden
  • Switzerland
  • Tanzania, United Republic of
  • Togo
  • Tunisia
  • Ukraine
  • United Kingdom
  • Zambia
  • Zimbabwe

Duration: 96 days

Time span: December 11 2020 to March 16 2021

Statistics over entire affected area:

  • Mean temperature anomaly: 6.6 °C
  • Mean temperature: 6.9 °C
  • Maximum temperature anomaly: 23.6 °C
  • Maximum temperature: 39.6 °C

Event center: -13.5°S 16.0°E

Area affected: 45189614 km$^2$


Fig. 1: Map of most extreme temperature anomalies (standardized) experienced during the event. The purple star indicates the center of the extreme event. Green hatching illustrates all areas under the effect of extremes at some time during the event.


Fig. 2: Evolution of temperature at the center of the event. The climatological percentile distribution is illustrated with color shadings.


Fig. 3: Maps illustrating the evolution of standardized temperature anomalies during the event.

Event ID: Heat_wave_2020-Dec-11_to_2021-Mar-16_16.0_-13.5

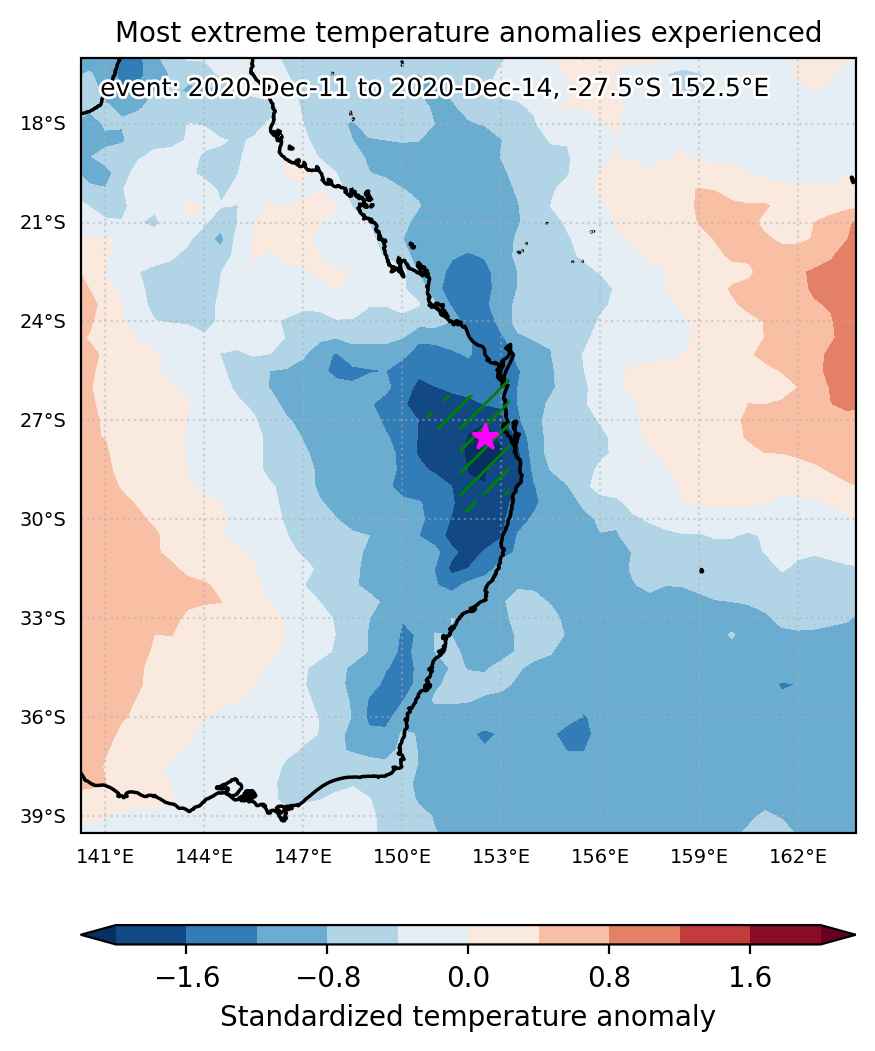
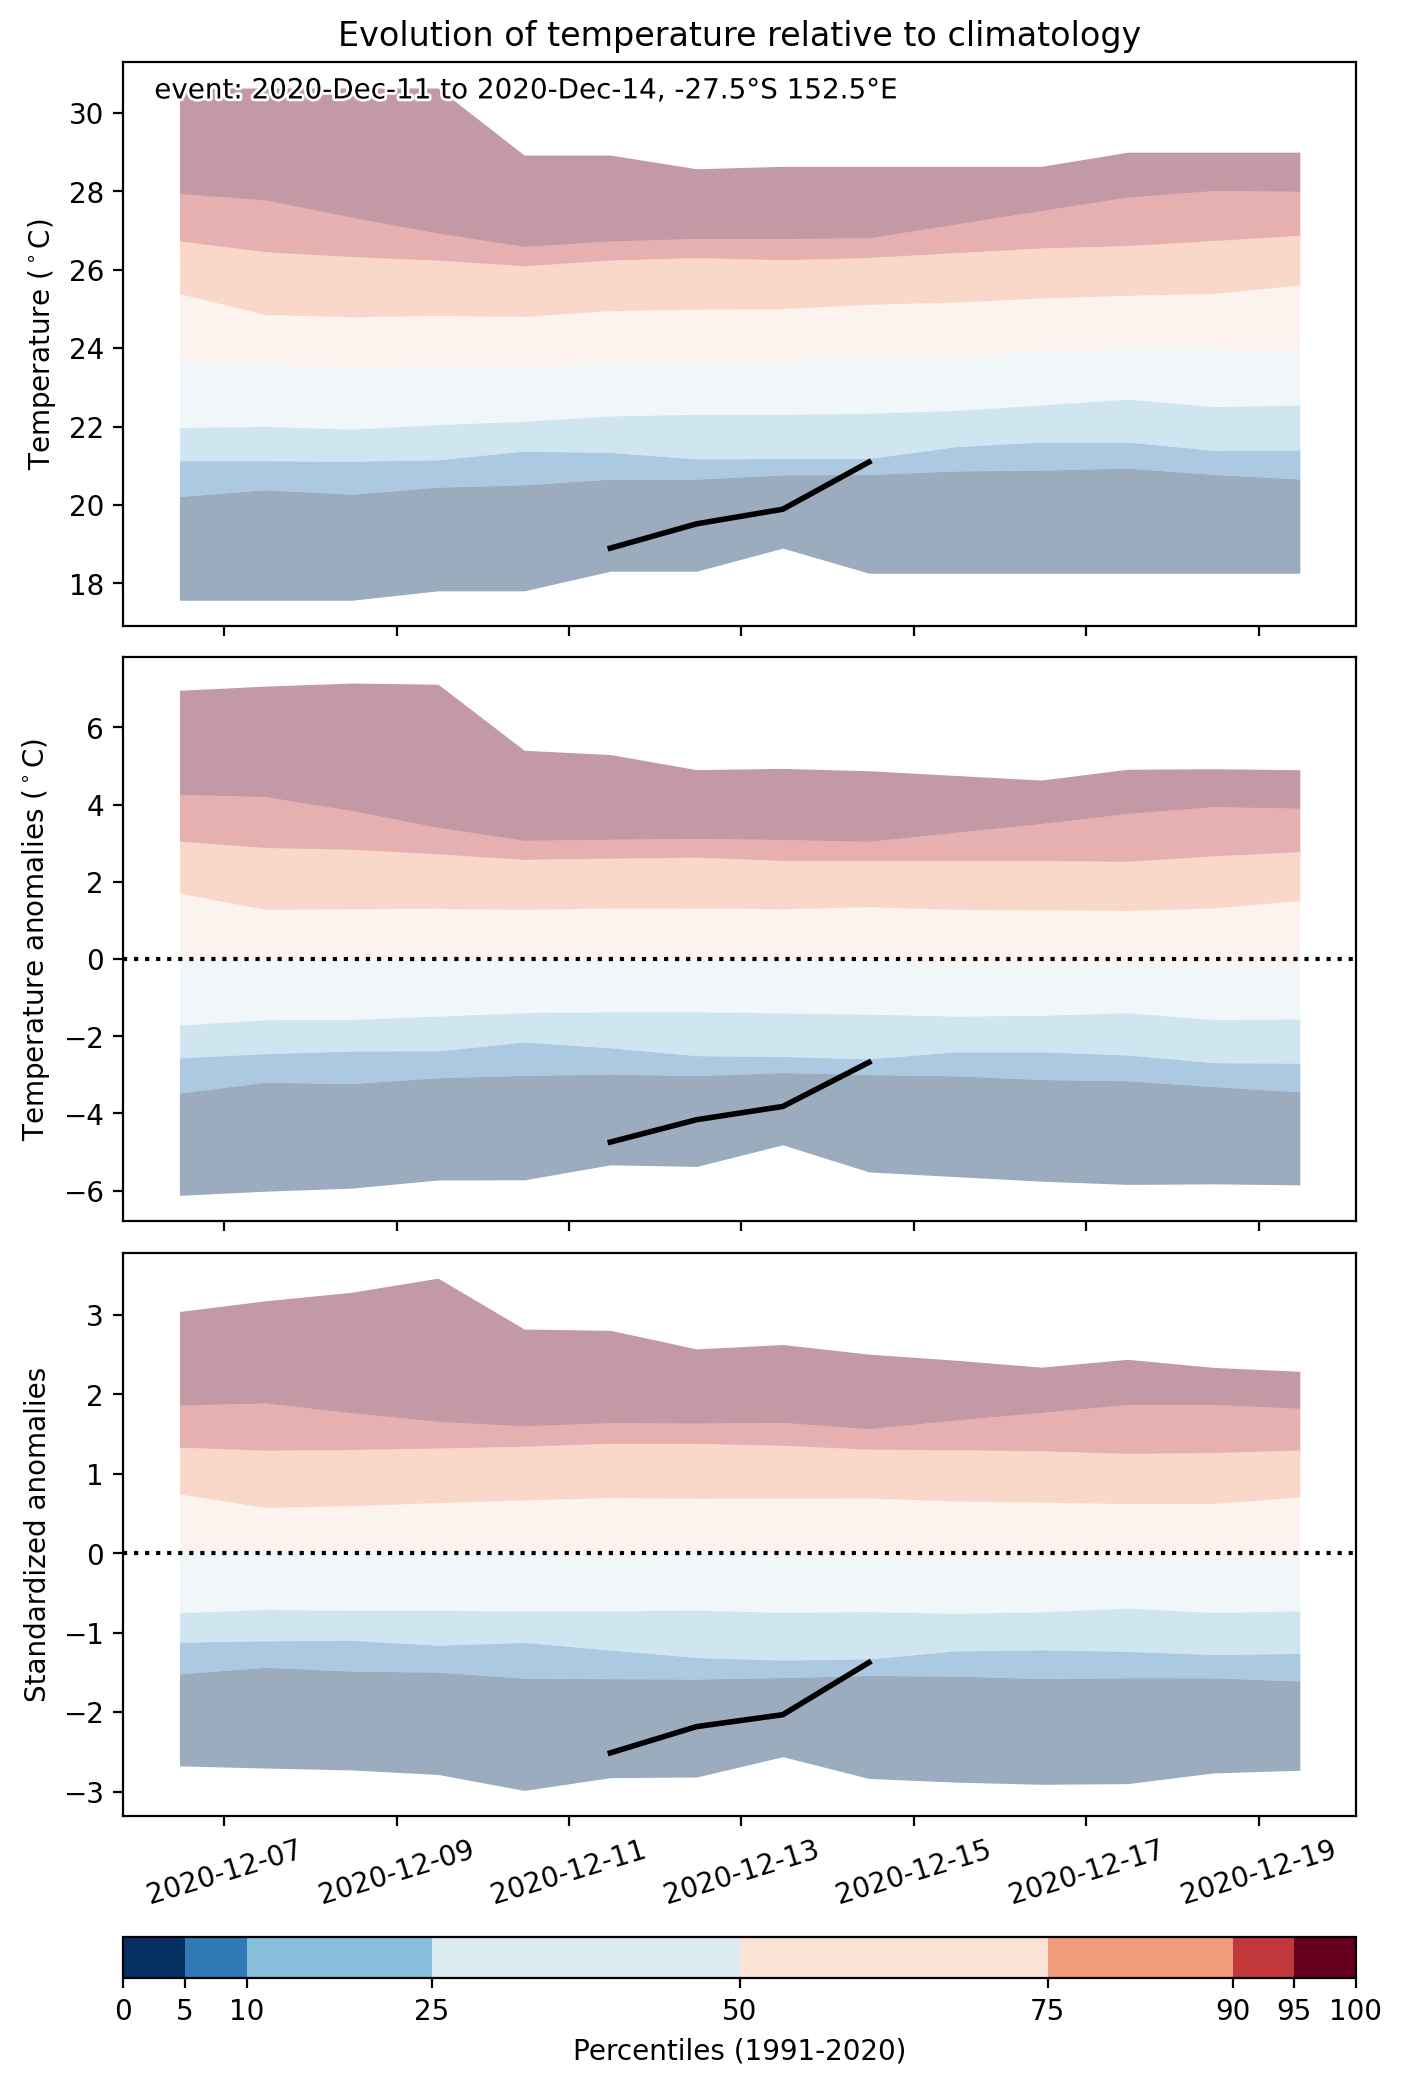
Cold spell occuring from December 11 2020 to December 14 2020 at -27.5°S 152.5°E

Download data: JSON

Event type: Cold spell

Countries affected (identified with ArcGIS Online; provided only for geographical reference):

  • Australia

Duration: 4 days

Time span: December 11 2020 to December 14 2020

Statistics over entire affected area:

  • Mean temperature anomaly: -4.0 °C
  • Mean temperature: 18.4 °C
  • Minimum temperature anomaly: -6.0 °C
  • Minimum temperature: 12.3 °C

Event center: -27.5°S 152.5°E

Area affected: 62977 km$^2$


Fig. 1: Map of most extreme temperature anomalies (standardized) experienced during the event. The purple star indicates the center of the extreme event. Green hatching illustrates all areas under the effect of extremes at some time during the event.


Fig. 2: Evolution of temperature at the center of the event. The climatological percentile distribution is illustrated with color shadings.


Fig. 3: Maps illustrating the evolution of standardized temperature anomalies during the event.

Event ID: Cold_spell_2020-Dec-11_to_2020-Dec-14_152.5_-27.5

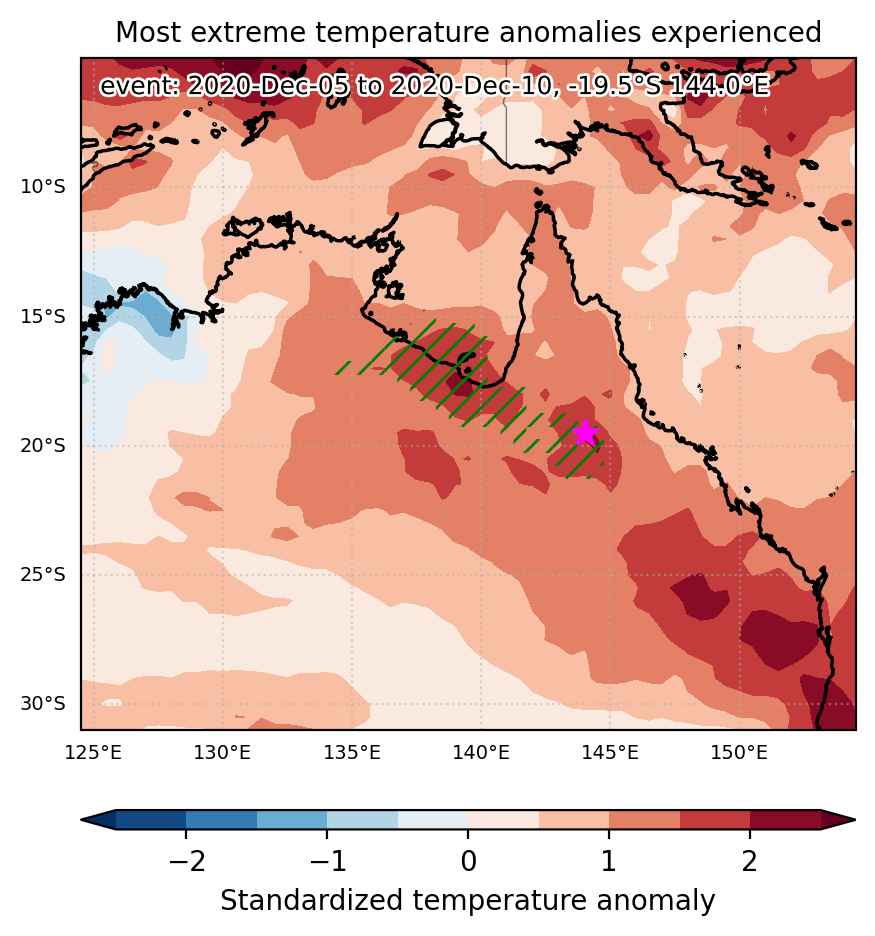
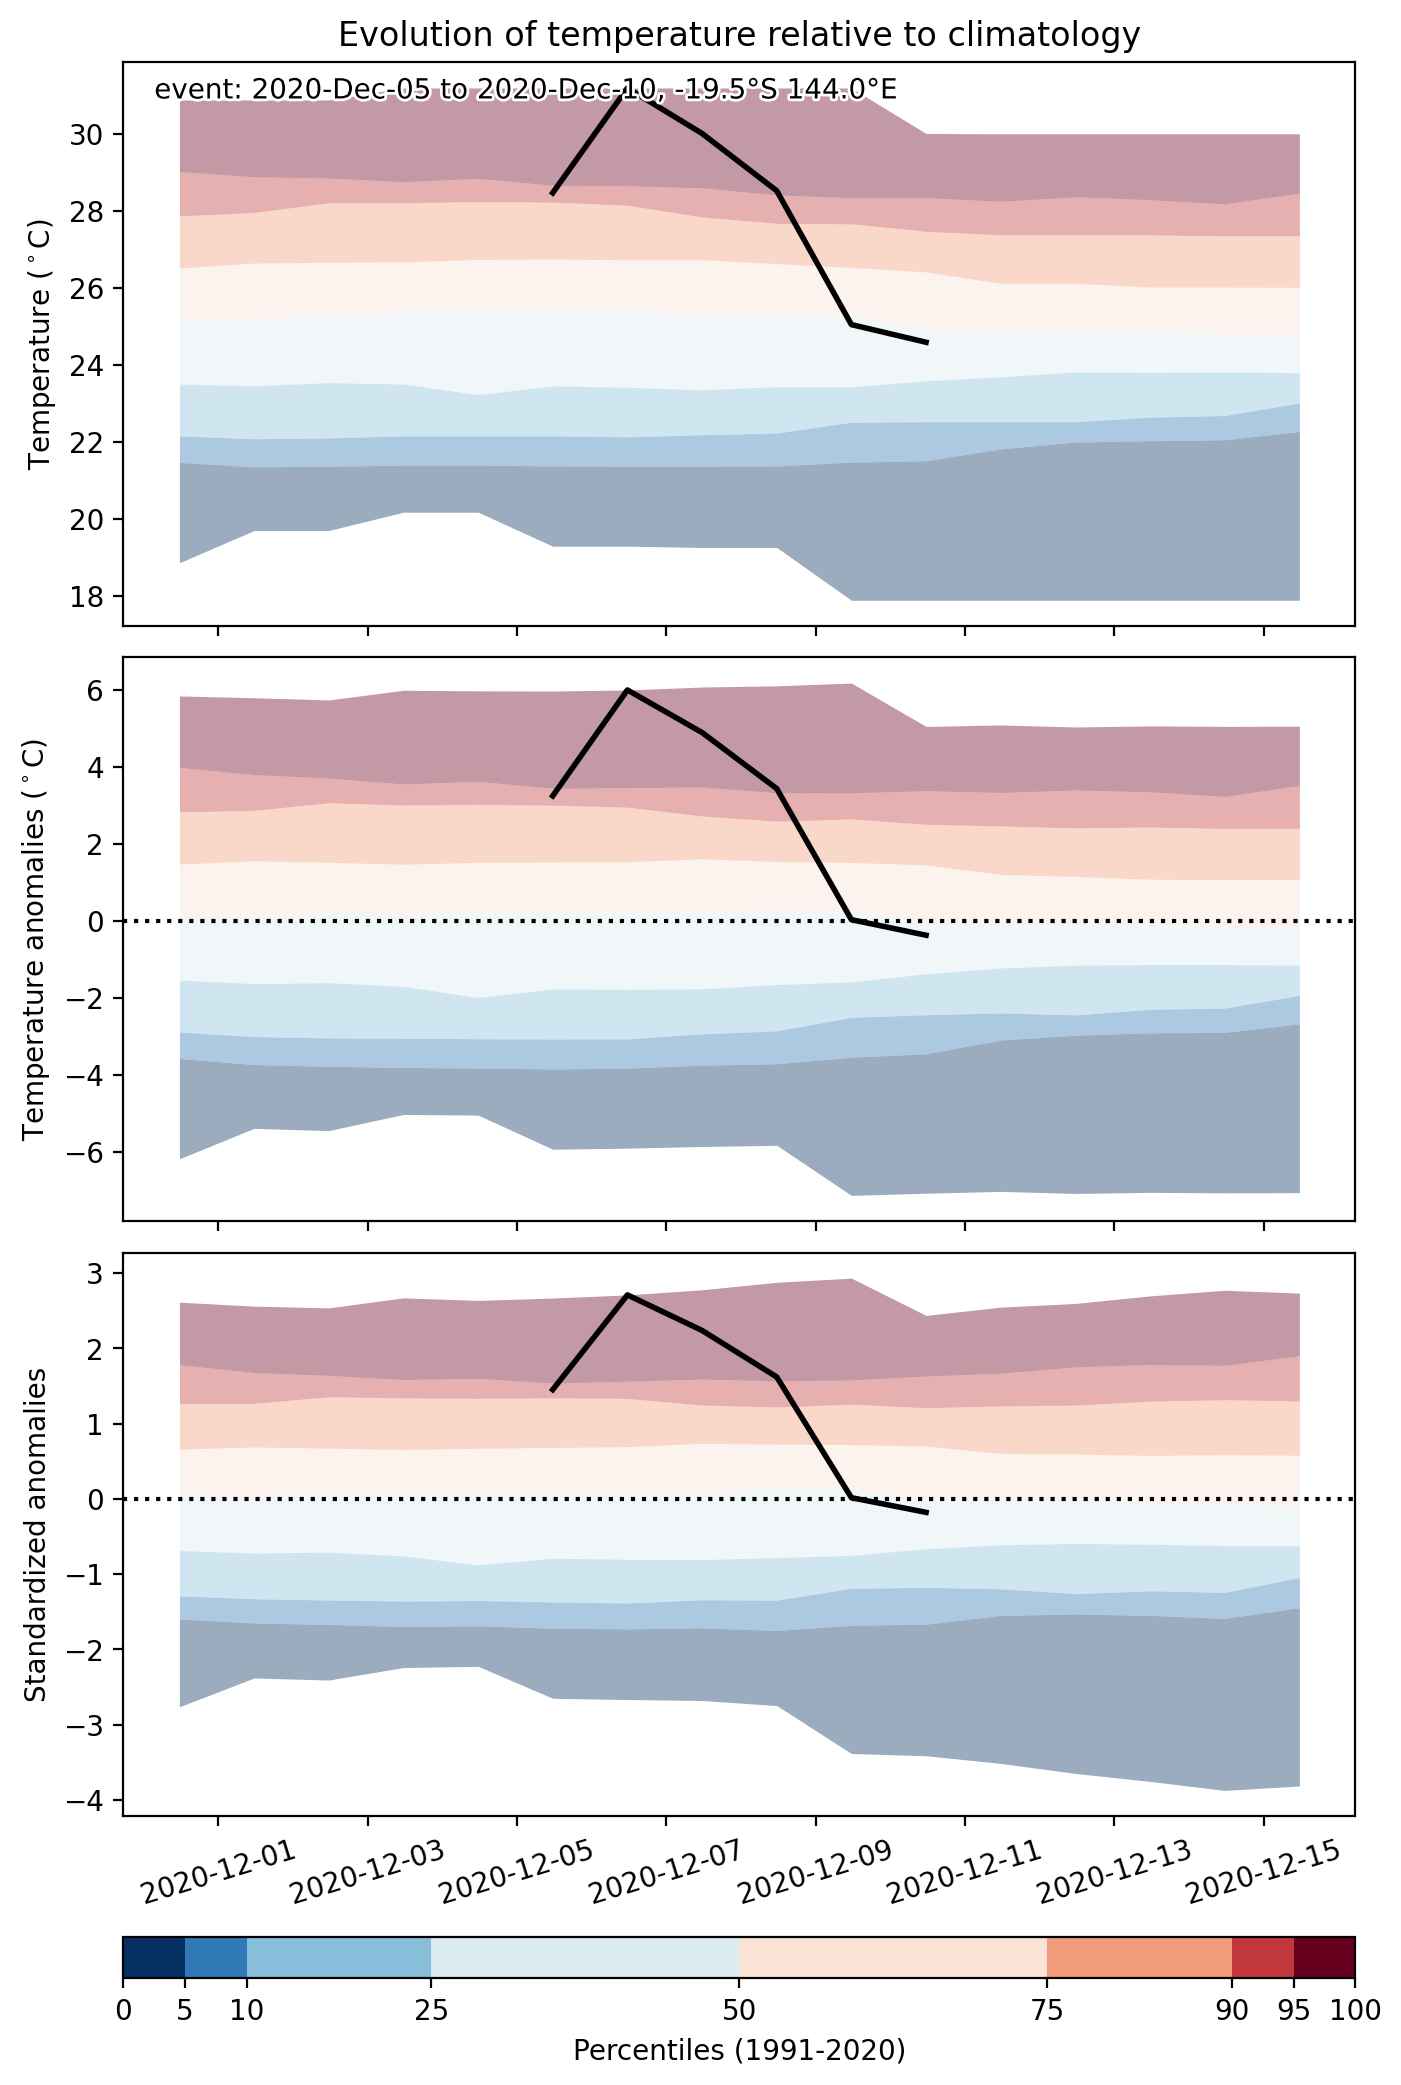
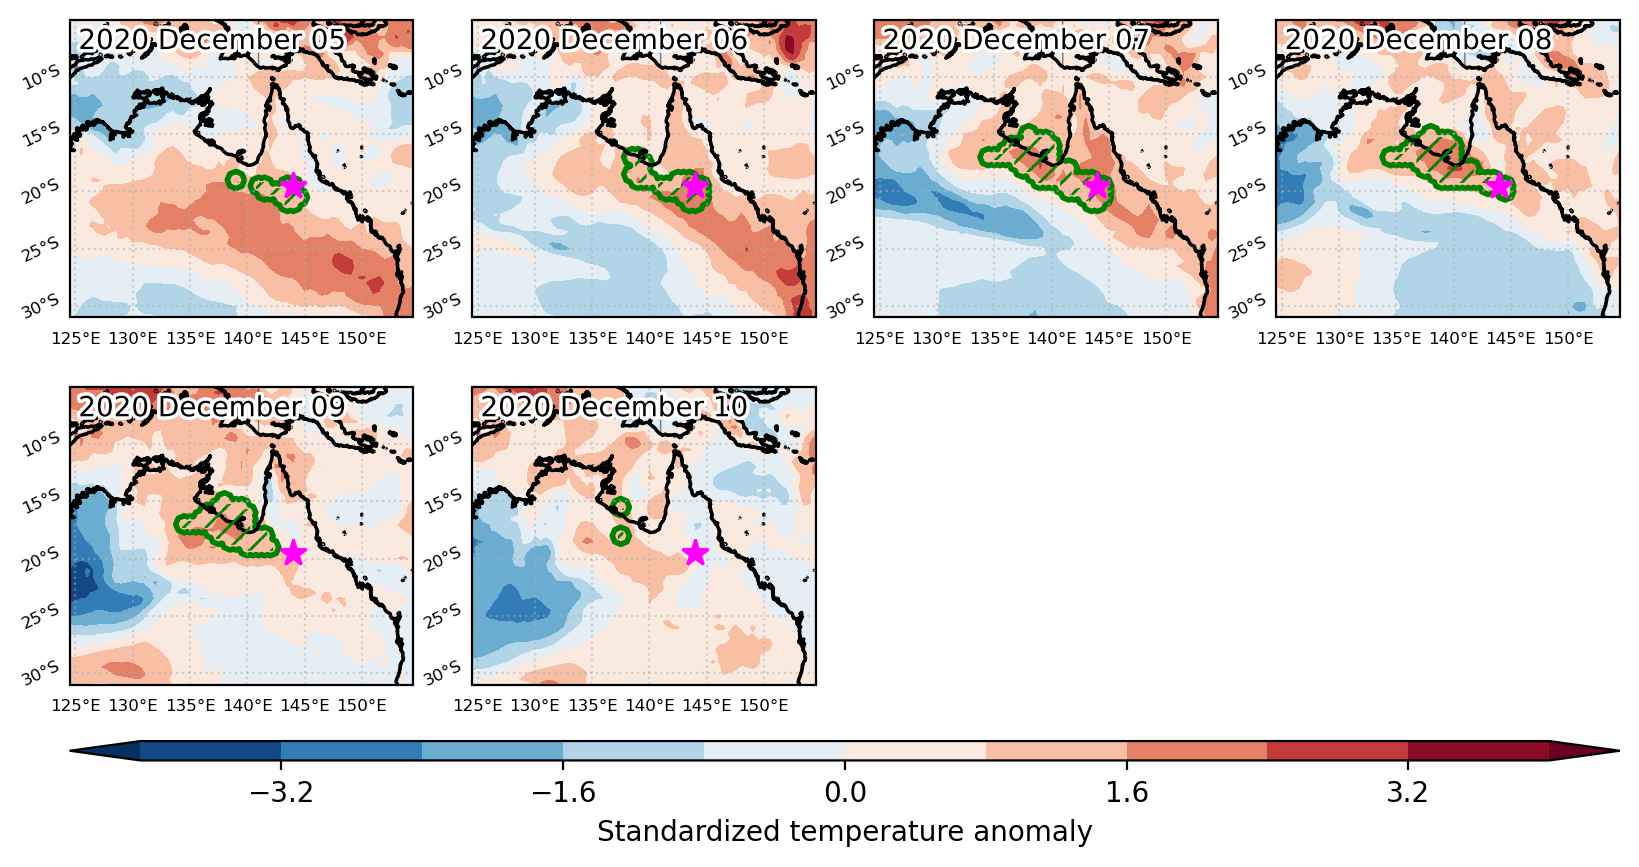
Heat wave occuring from December 05 2020 to December 10 2020 at -19.5°S 144.0°E

Download data: JSON

Event type: Heat wave

Countries affected (identified with ArcGIS Online; provided only for geographical reference):

  • Australia

Duration: 6 days

Time span: December 05 2020 to December 10 2020

Statistics over entire affected area:

  • Mean temperature anomaly: 2.9 °C
  • Mean temperature: 32.9 °C
  • Maximum temperature anomaly: 6.0 °C
  • Maximum temperature: 36.1 °C

Event center: -19.5°S 144.0°E

Area affected: 255804 km$^2$


Fig. 1: Map of most extreme temperature anomalies (standardized) experienced during the event. The purple star indicates the center of the extreme event. Green hatching illustrates all areas under the effect of extremes at some time during the event.


Fig. 2: Evolution of temperature at the center of the event. The climatological percentile distribution is illustrated with color shadings.


Fig. 3: Maps illustrating the evolution of standardized temperature anomalies during the event.

Event ID: Heat_wave_2020-Dec-05_to_2020-Dec-10_144.0_-19.5

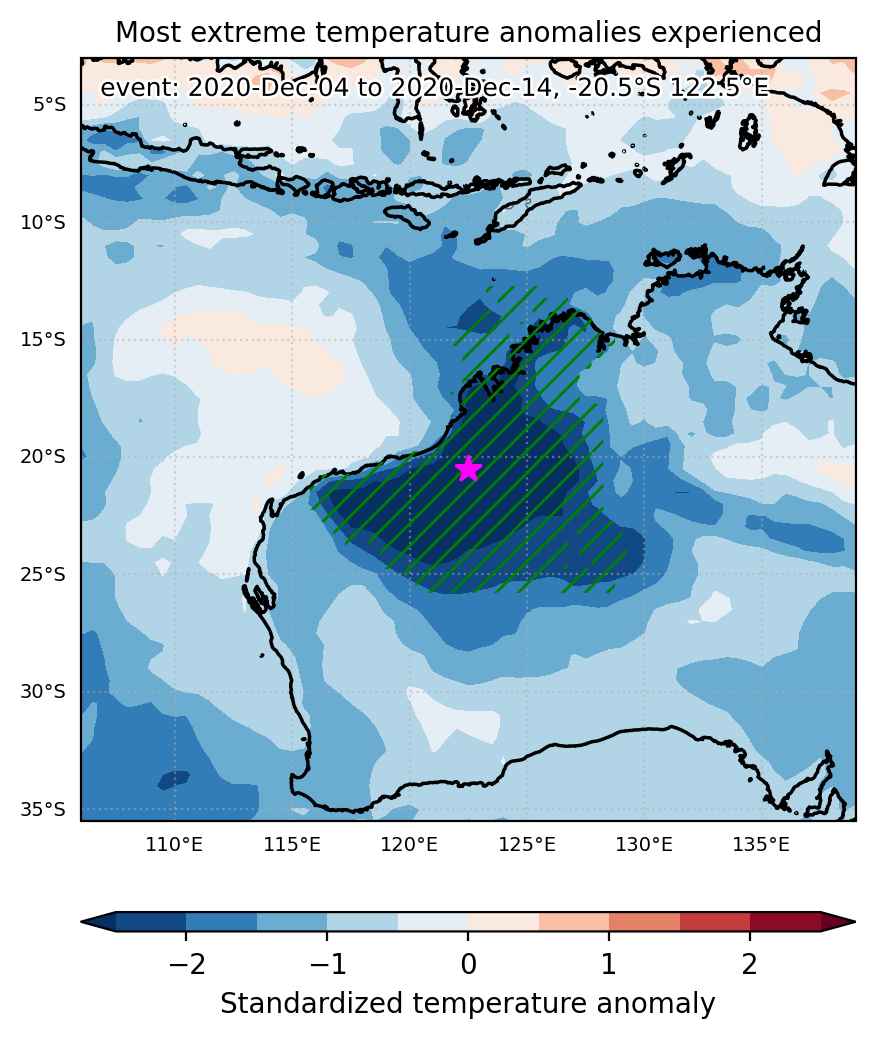
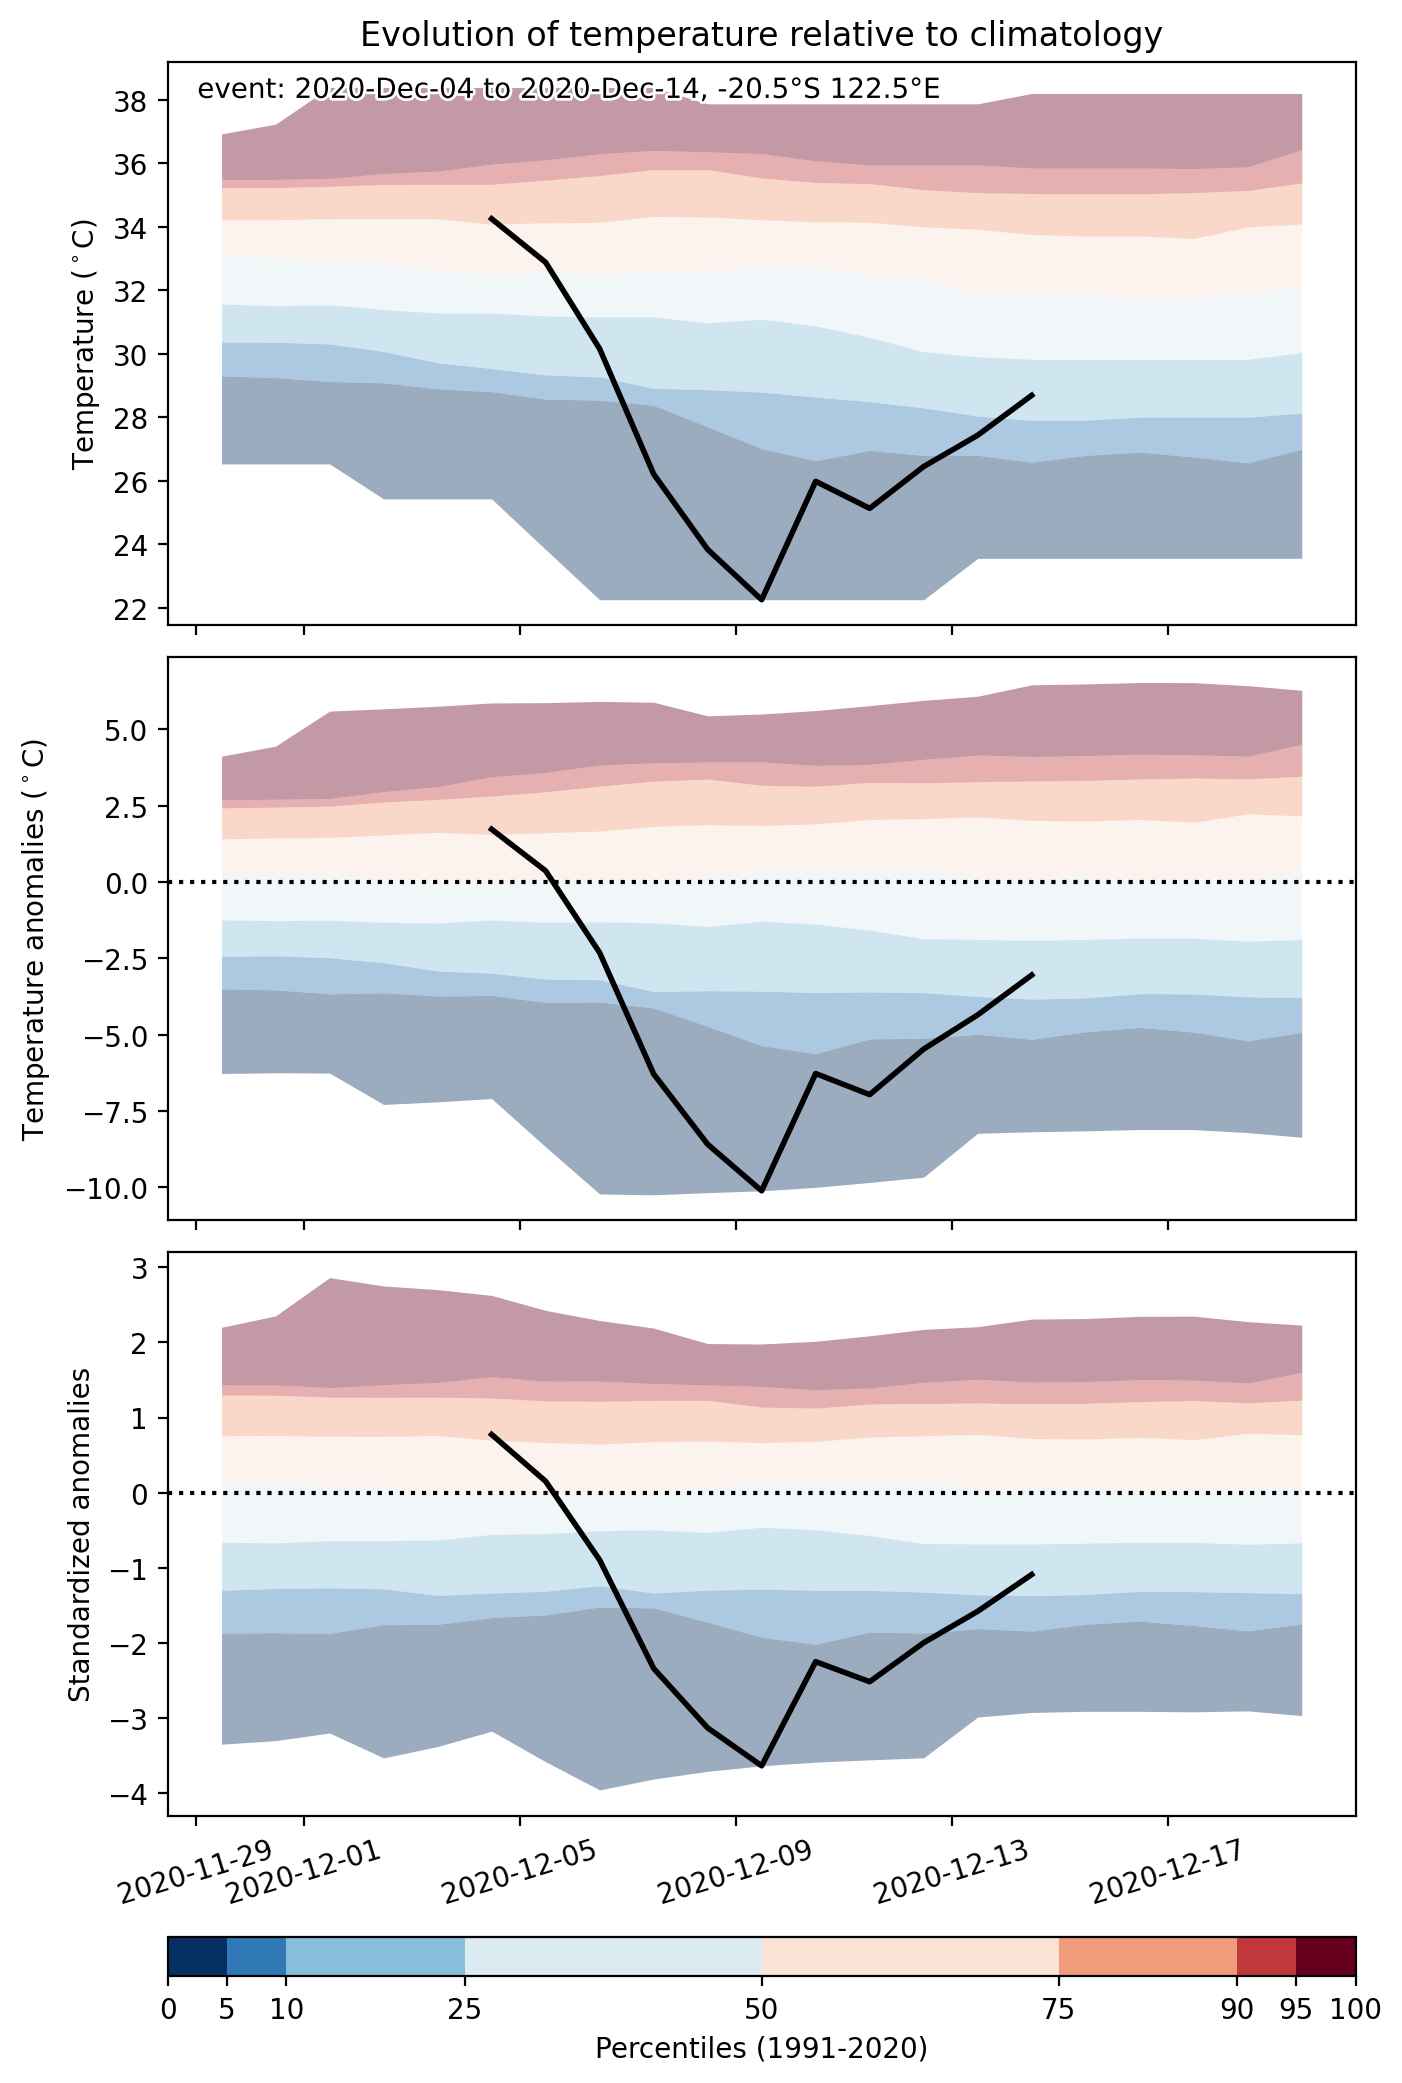
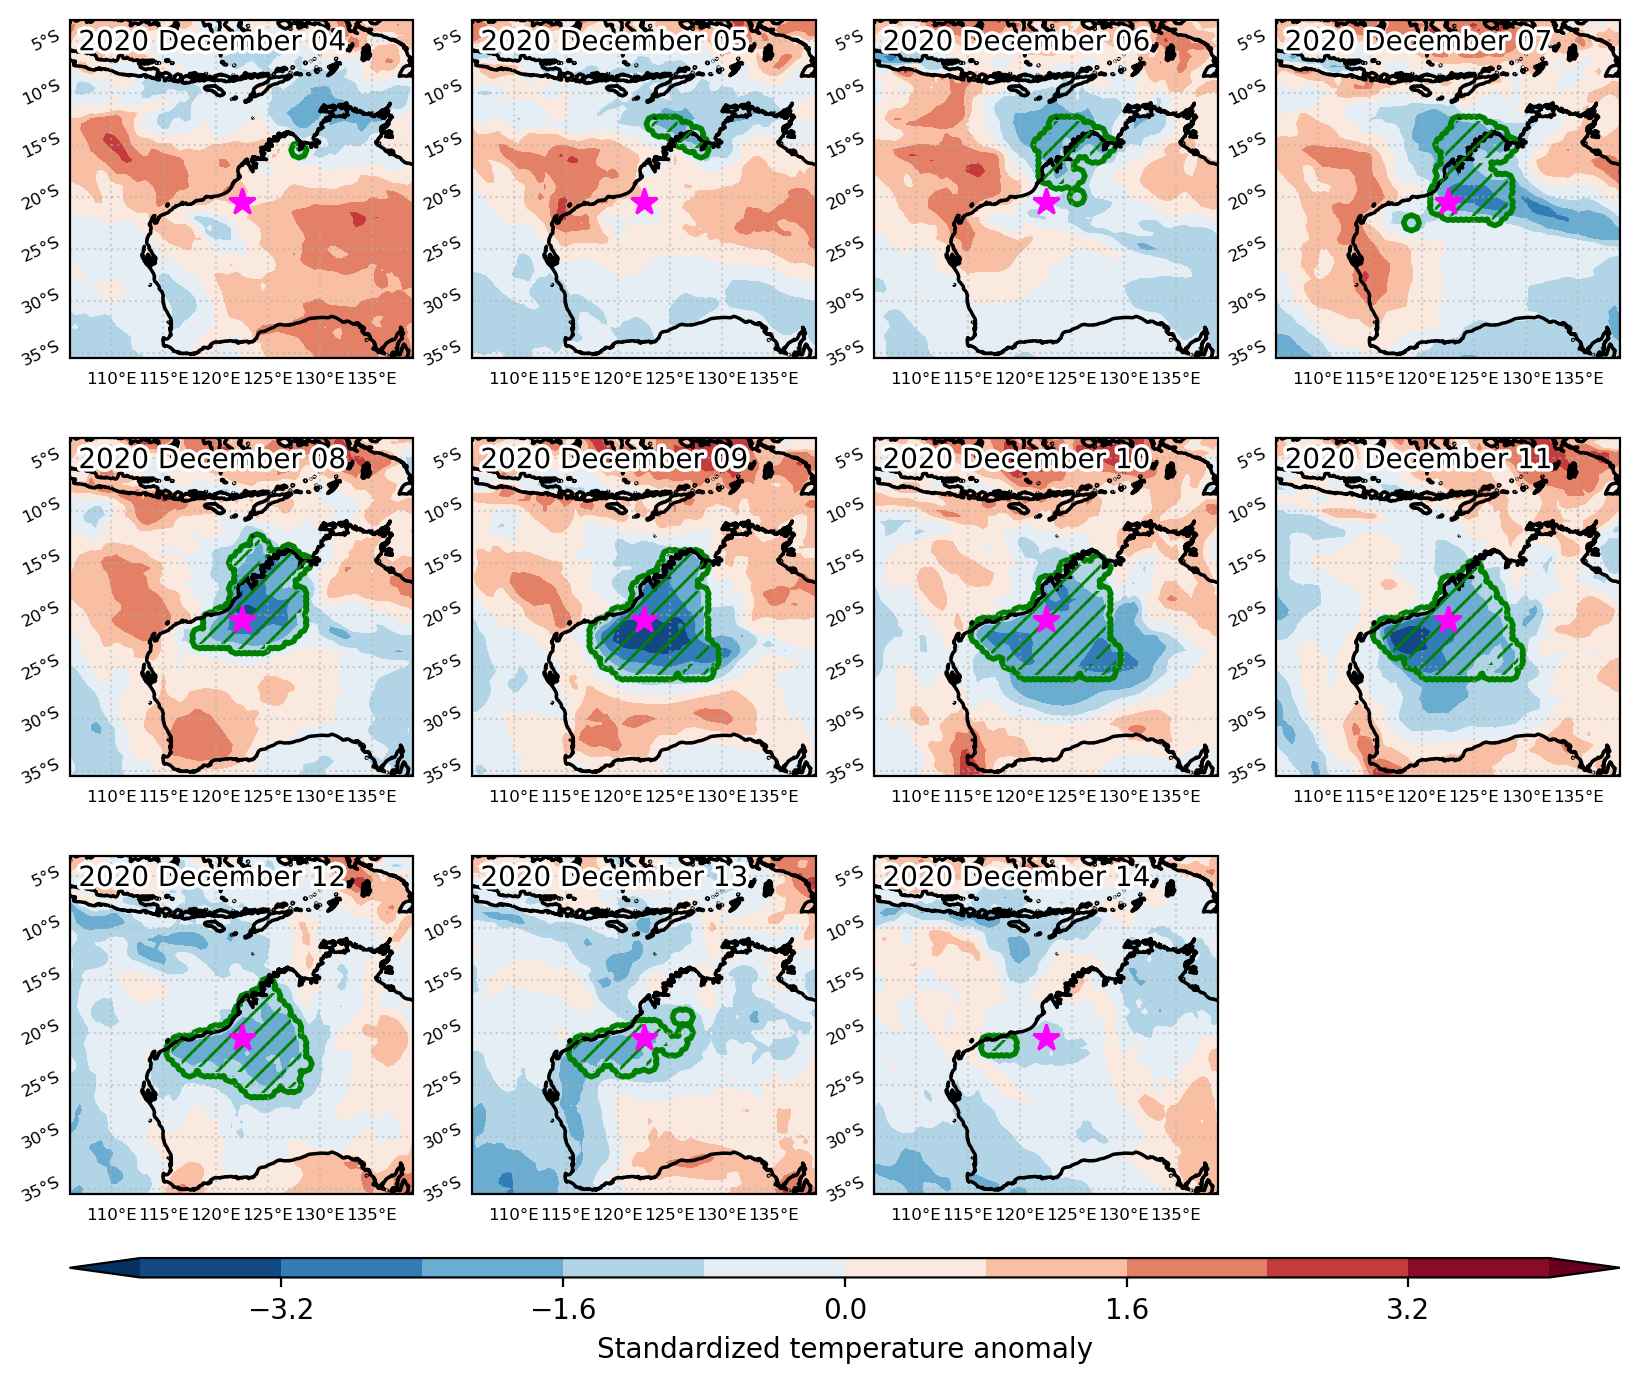
Cold spell occuring from December 04 2020 to December 14 2020 at -20.5°S 122.5°E

Download data: JSON

Event type: Cold spell

Countries affected (identified with ArcGIS Online; provided only for geographical reference):

  • Australia

Duration: 11 days

Time span: December 04 2020 to December 14 2020

Statistics over entire affected area:

  • Mean temperature anomaly: -5.8 °C
  • Mean temperature: 25.3 °C
  • Minimum temperature anomaly: -12.3 °C
  • Minimum temperature: 18.4 °C

Event center: -20.5°S 122.5°E

Area affected: 1151055 km$^2$


Fig. 1: Map of most extreme temperature anomalies (standardized) experienced during the event. The purple star indicates the center of the extreme event. Green hatching illustrates all areas under the effect of extremes at some time during the event.


Fig. 2: Evolution of temperature at the center of the event. The climatological percentile distribution is illustrated with color shadings.


Fig. 3: Maps illustrating the evolution of standardized temperature anomalies during the event.

Event ID: Cold_spell_2020-Dec-04_to_2020-Dec-14_122.5_-20.5

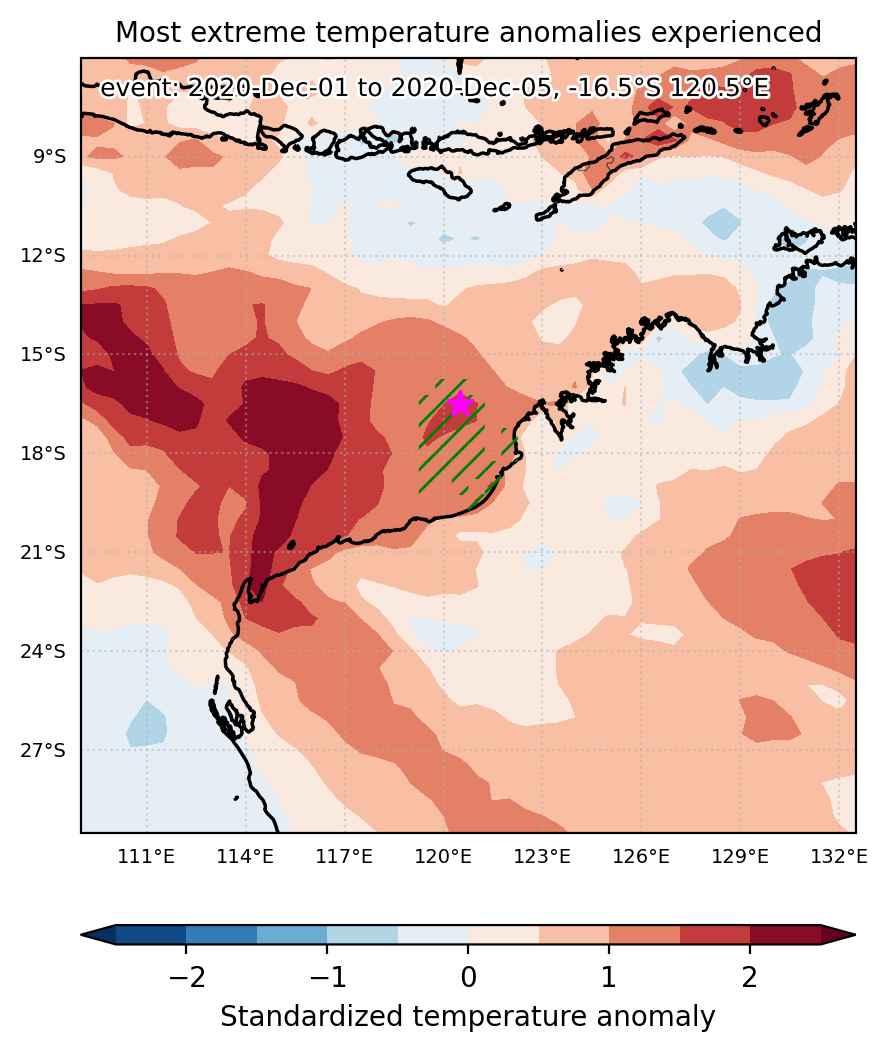
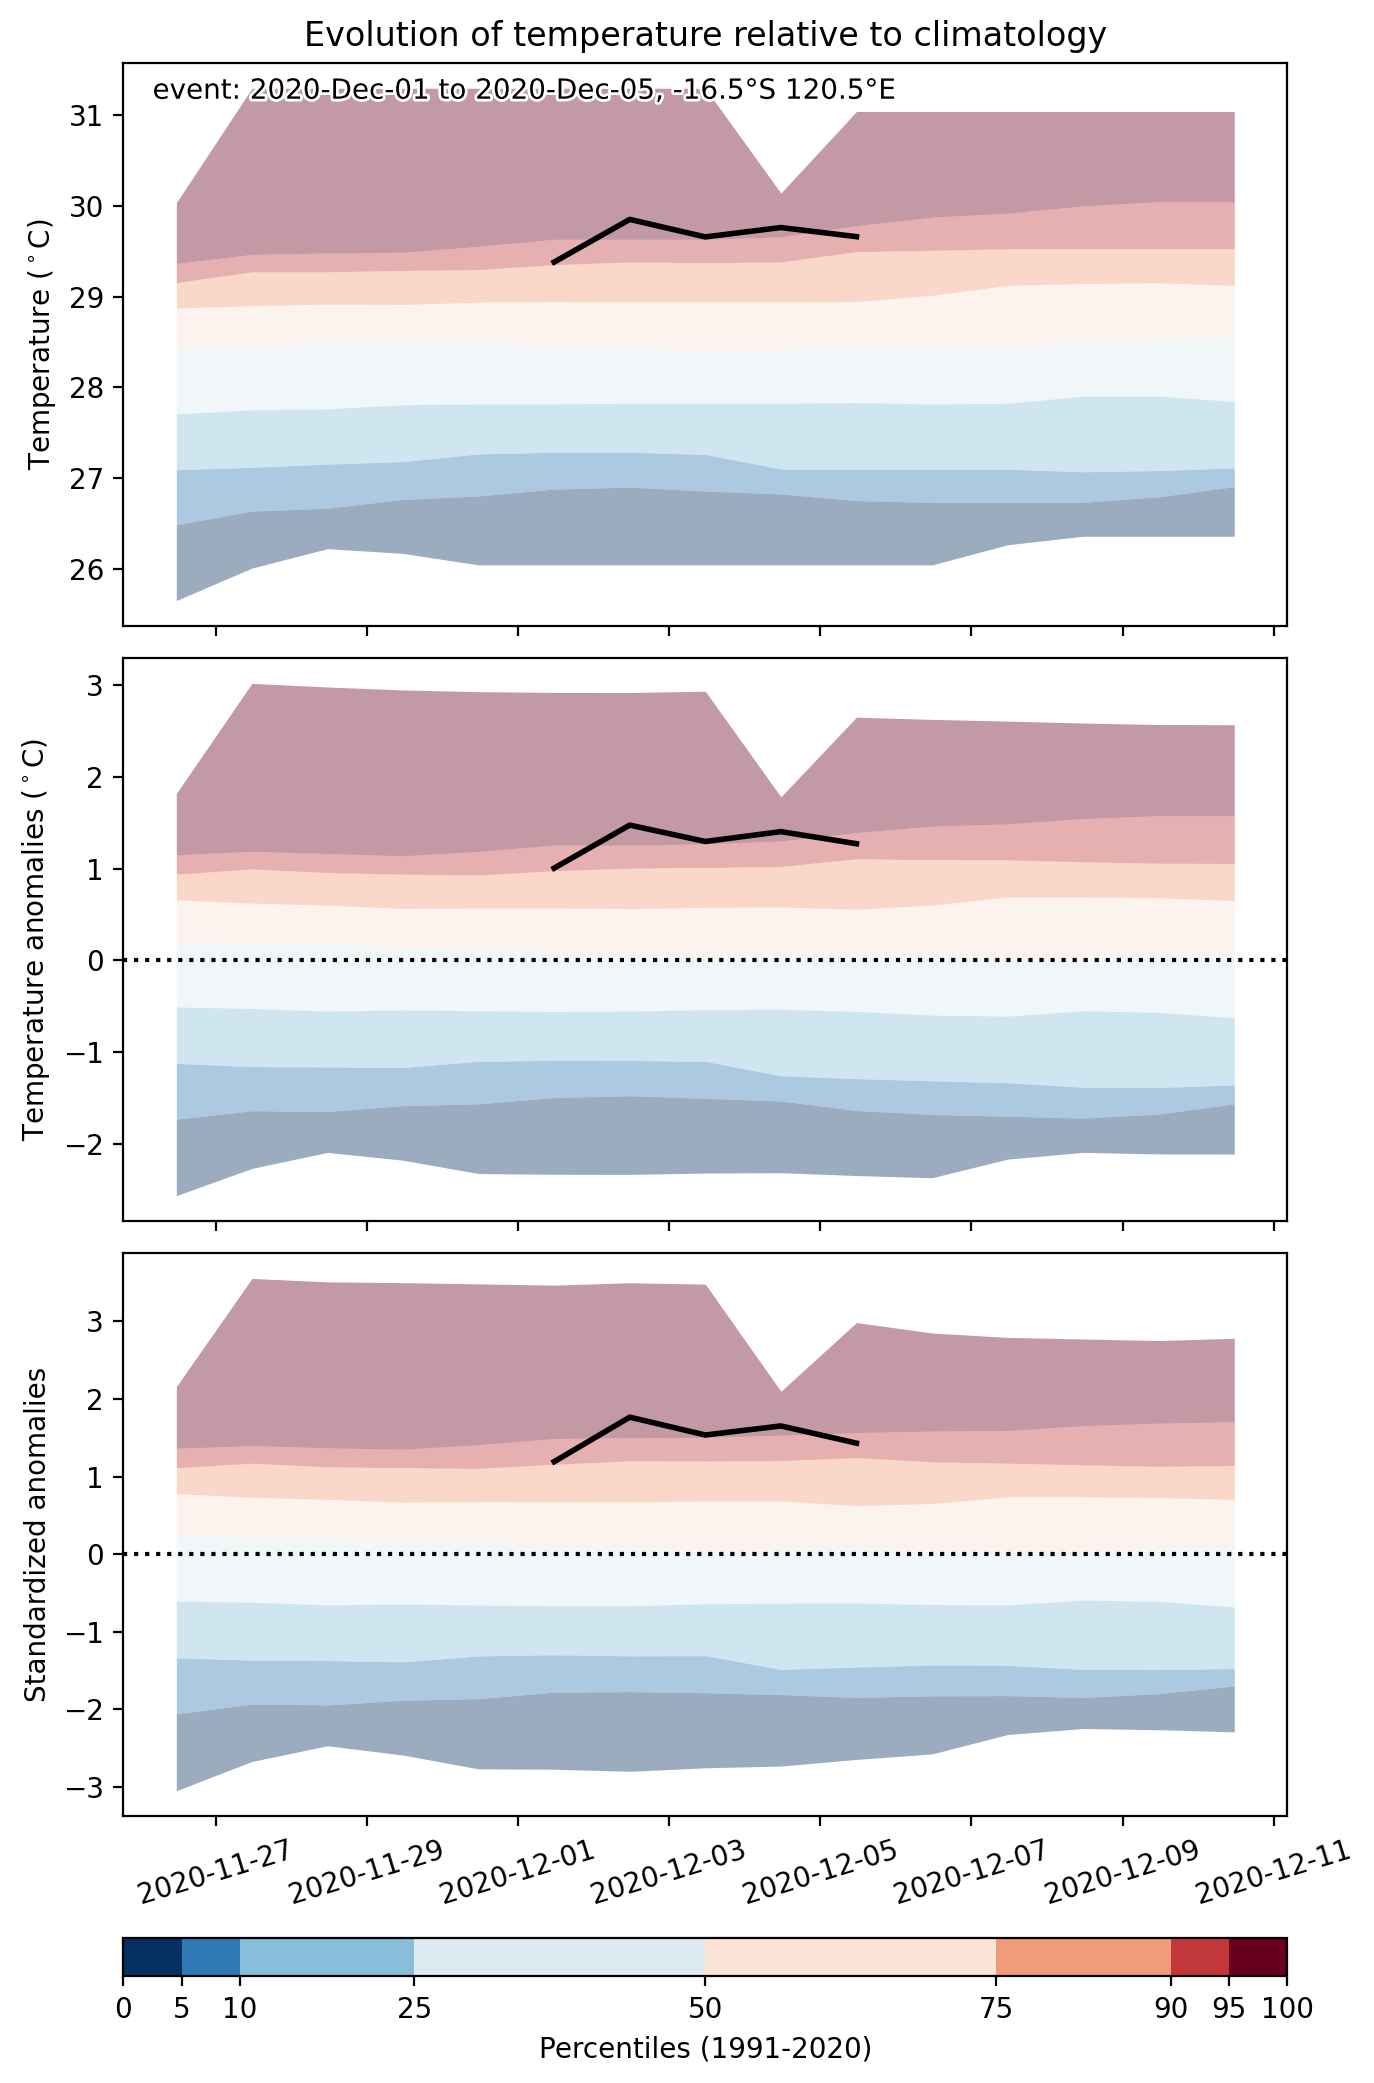
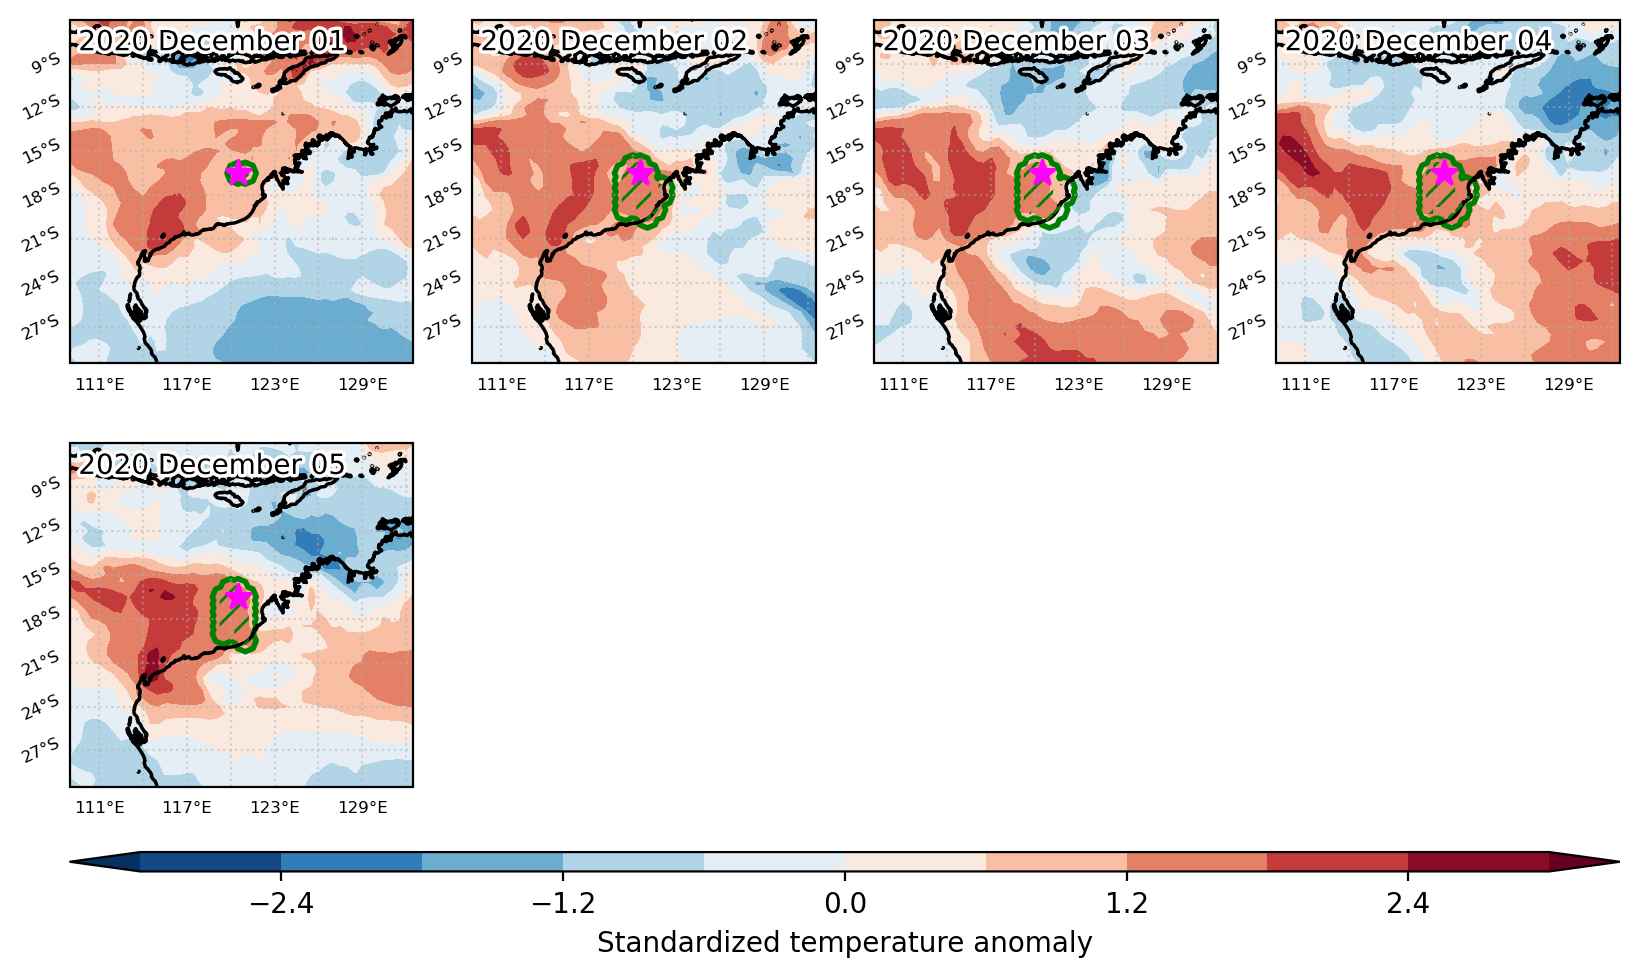
Heat wave occuring from December 01 2020 to December 05 2020 at -16.5°S 120.5°E

Download data: JSON

Event type: Heat wave

Countries affected (identified with ArcGIS Online; provided only for geographical reference):

  • Australia

Duration: 5 days

Time span: December 01 2020 to December 05 2020

Statistics over entire affected area:

  • Mean temperature anomaly: 1.4 °C
  • Mean temperature: 29.6 °C
  • Maximum temperature anomaly: 2.2 °C
  • Maximum temperature: 31.0 °C

Event center: -16.5°S 120.5°E

Area affected: 85399 km$^2$


Fig. 1: Map of most extreme temperature anomalies (standardized) experienced during the event. The purple star indicates the center of the extreme event. Green hatching illustrates all areas under the effect of extremes at some time during the event.


Fig. 2: Evolution of temperature at the center of the event. The climatological percentile distribution is illustrated with color shadings.


Fig. 3: Maps illustrating the evolution of standardized temperature anomalies during the event.

Event ID: Heat_wave_2020-Dec-01_to_2020-Dec-05_120.5_-16.5

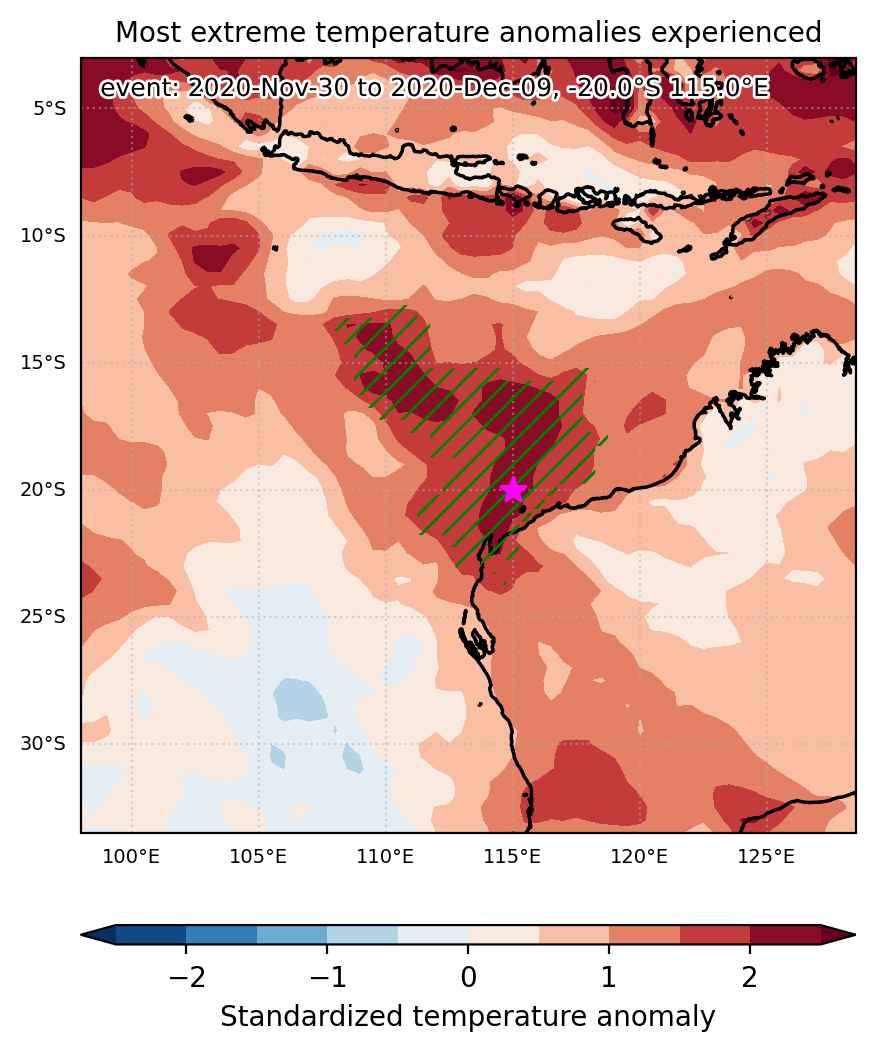
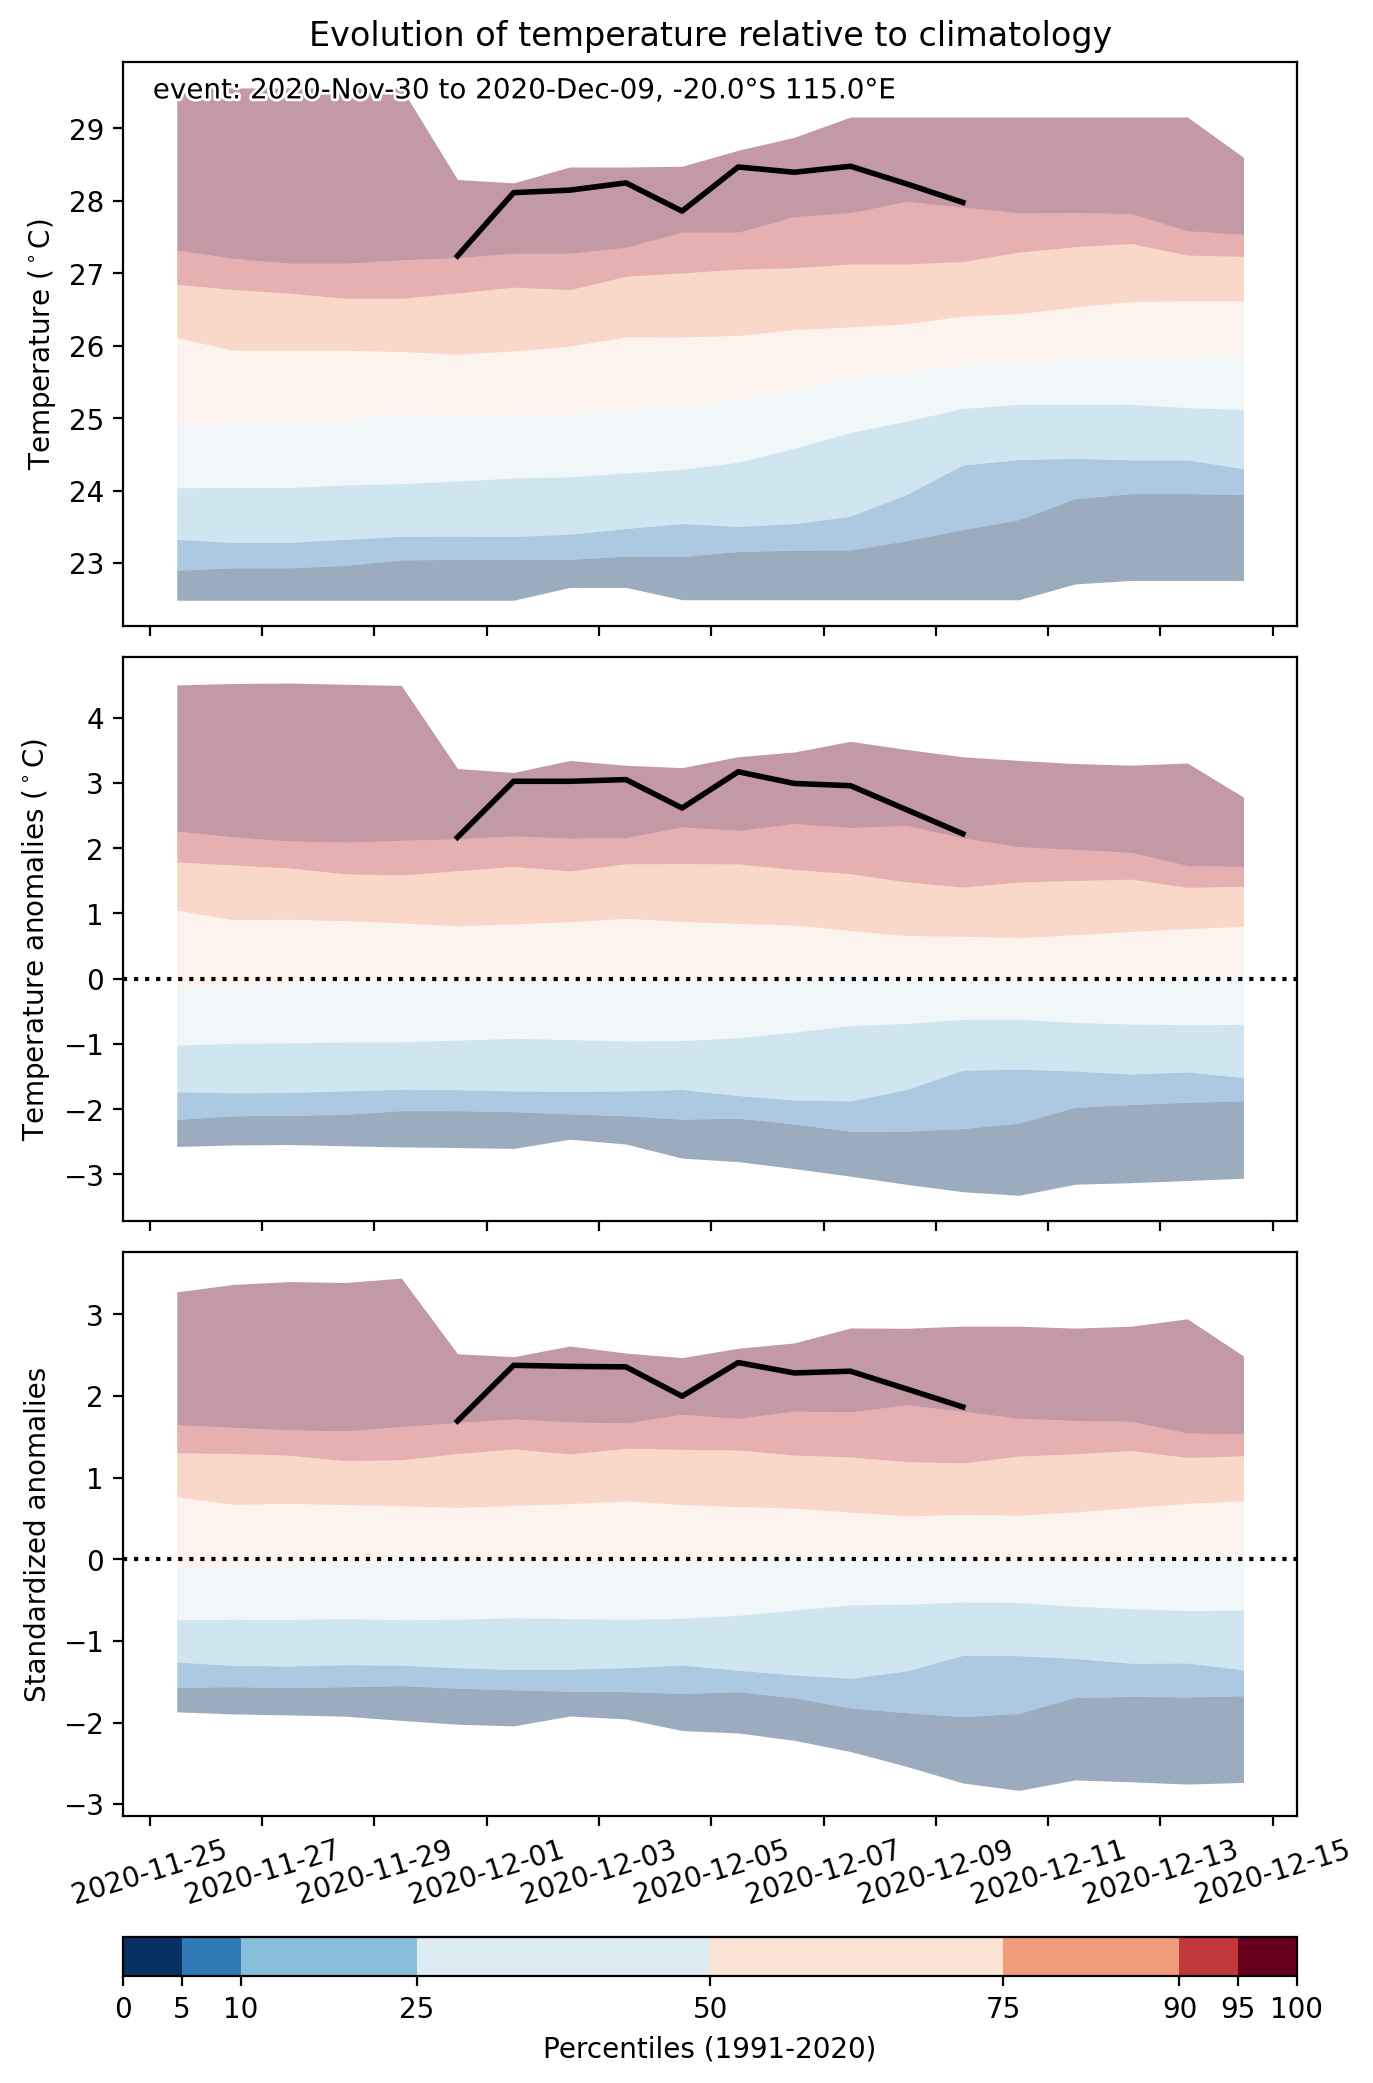
Heat wave occuring from November 30 2020 to December 09 2020 at -20.0°S 115.0°E

Download data: JSON

Event type: Heat wave

Countries affected (identified with ArcGIS Online; provided only for geographical reference):

  • Australia

Duration: 10 days

Time span: November 30 2020 to December 09 2020

Statistics over entire affected area:

  • Mean temperature anomaly: 2.0 °C
  • Mean temperature: 27.8 °C
  • Maximum temperature anomaly: 6.0 °C
  • Maximum temperature: 36.3 °C

Event center: -20.0°S 115.0°E

Area affected: 608660 km$^2$


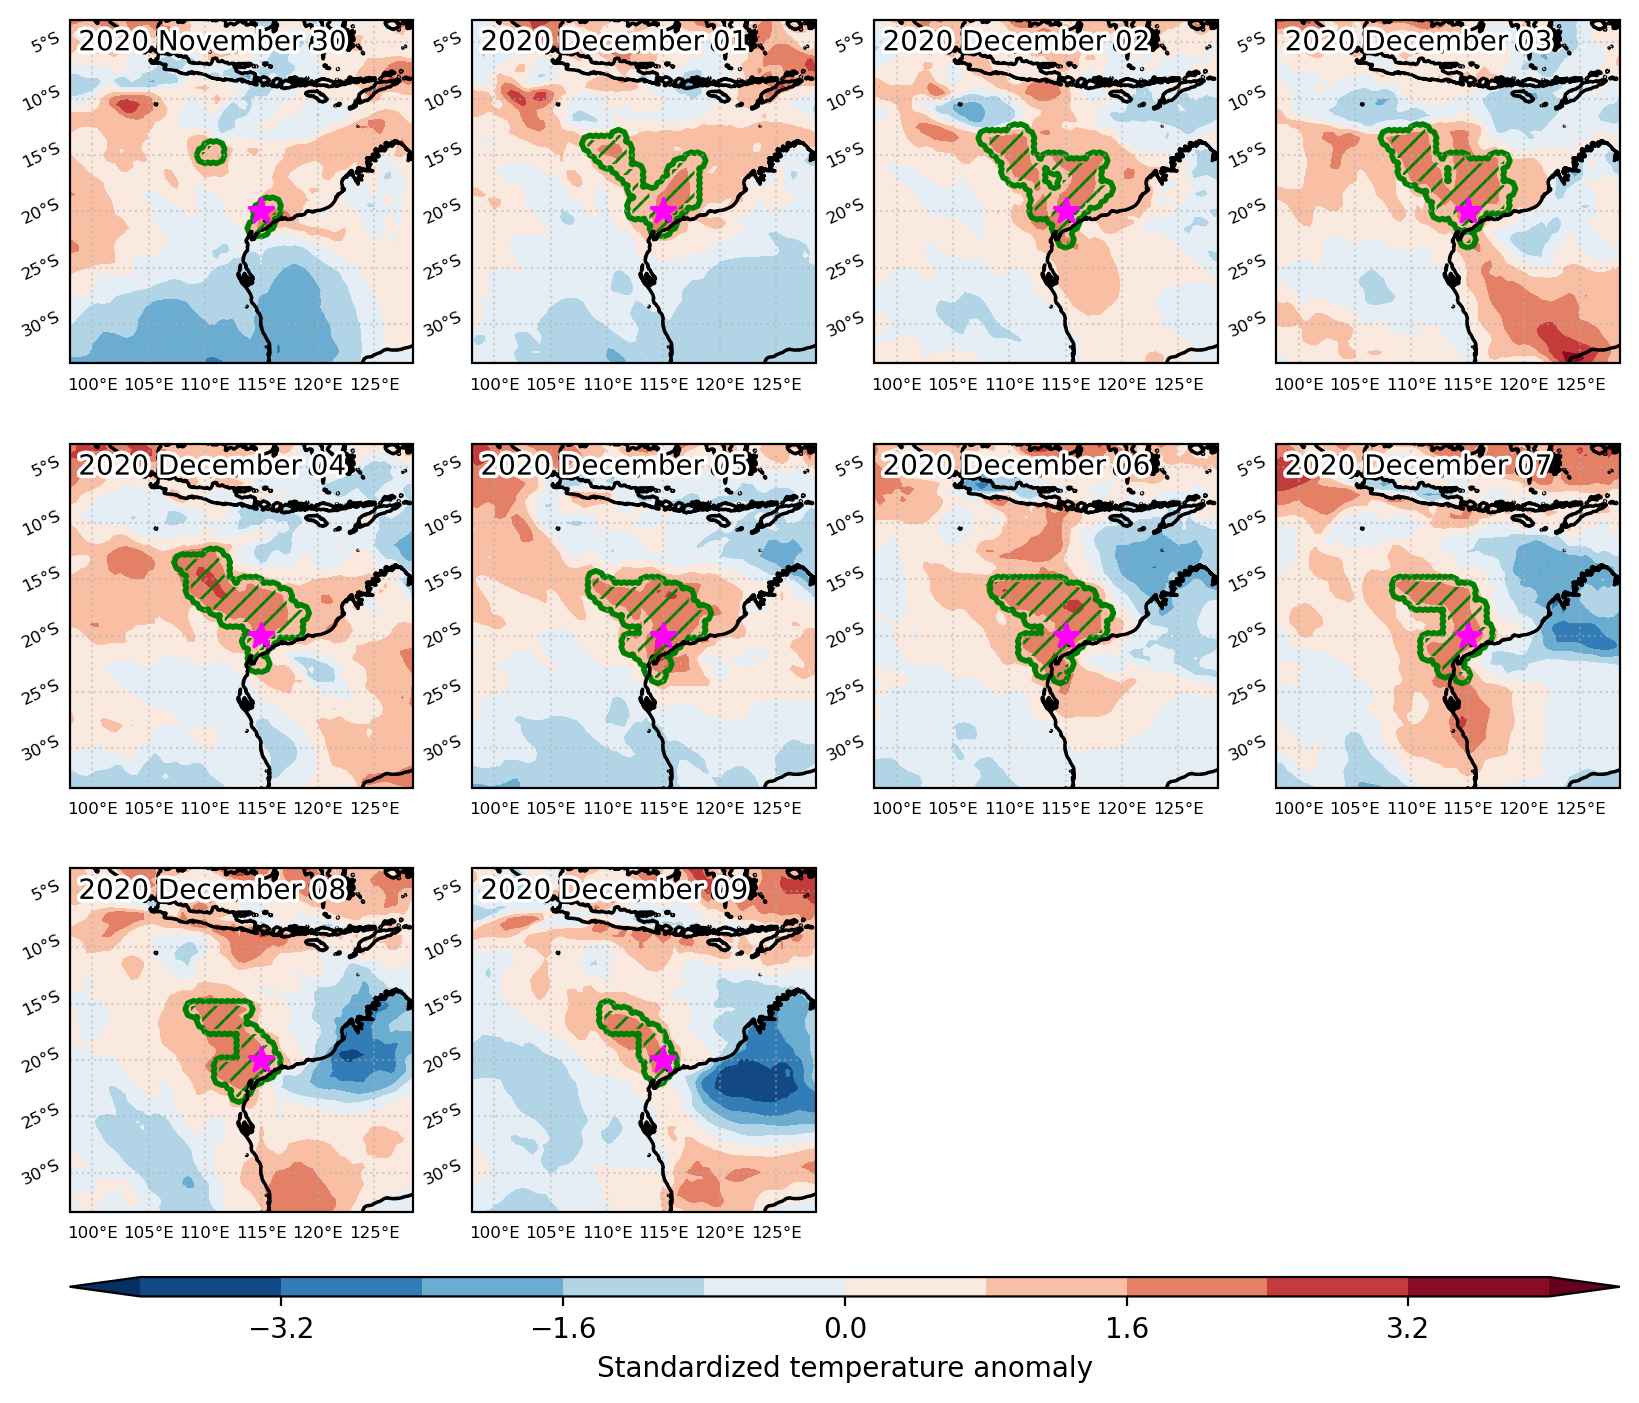
Fig. 1: Map of most extreme temperature anomalies (standardized) experienced during the event. The purple star indicates the center of the extreme event. Green hatching illustrates all areas under the effect of extremes at some time during the event.


Fig. 2: Evolution of temperature at the center of the event. The climatological percentile distribution is illustrated with color shadings.


Fig. 3: Maps illustrating the evolution of standardized temperature anomalies during the event.

Event ID: Heat_wave_2020-Nov-30_to_2020-Dec-09_115.0_-20.0