Download data: JSON
Event type: Heat wave
Countries affected (identified with ArcGIS Online; provided only for geographical reference):
- Afghanistan
- Albania
- Algeria
- Andorra
- Angola
- Argentina
- Armenia
- Australia
- Austria
- Azerbaijan
- Bahrain
- Bangladesh
- Belarus
- Belgium
- Benin
- Bhutan
- Bolivia, Plurinational State of
- Bonaire, Sint Eustatius and Saba
- Bosnia and Herzegovina
- Botswana
- Brazil
- Brunei Darussalam
- Bulgaria
- Burkina Faso
- Burundi
- Cabo Verde
- Cambodia
- Cameroon
- Canada
- Central African Republic
- Chad
- Chile
- China
- Christmas Island
- Colombia
- Congo
- Congo, The Democratic Republic of the
- Cook Islands
- Croatia
- Cyprus
- Czechia
- Côte d’Ivoire
- Denmark
- Djibouti
- Dominican Republic
- Ecuador
- Egypt
- Equatorial Guinea
- Eritrea
- Estonia
- Eswatini
- Ethiopia
- Fiji
- Finland
- France
- French Guiana
- French Polynesia
- French Southern Territories
- Gabon
- Gambia
- Georgia
- Germany
- Ghana
- Greece
- Greenland
- Guinea
- Guinea-Bissau
- Guyana
- Haiti
- Hong Kong
- Hungary
- Iceland
- India
- Indonesia
- Iran, Islamic Republic of
- Iraq
- Ireland
- Israel
- Italy
- Japan
- Jordan
- Kazakhstan
- Kenya
- Korea, Democratic People’s Republic of
- Korea, Republic of
- Kuwait
- Kyrgyzstan
- Lao People’s Democratic Republic
- Latvia
- Lebanon
- Lesotho
- Liberia
- Libya
- Lithuania
- Luxembourg
- Madagascar
- Malawi
- Malaysia
- Maldives
- Mali
- Martinique
- Mauritania
- Mauritius
- Mexico
- Moldova, Republic of
- Mongolia
- Montenegro
- Morocco
- Mozambique
- Myanmar
- Namibia
- Nepal
- Netherlands
- New Caledonia
- New Zealand
- Niger
- Nigeria
- Norfolk Island
- North Macedonia
- Northern Mariana Islands
- Norway
- Oman
- Pakistan
- Palau
- Papua New Guinea
- Paraguay
- Peru
- Philippines
- Poland
- Portugal
- Puerto Rico
- Qatar
- Romania
- Russian Federation
- Rwanda
- Saint Lucia
- Samoa
- Saudi Arabia
- Senegal
- Serbia
- Seychelles
- Sierra Leone
- Sint Maarten (Dutch part)
- Slovakia
- Slovenia
- Solomon Islands
- Somalia
- South Africa
- South Sudan
- Spain
- Sri Lanka
- Sudan
- Suriname
- Svalbard and Jan Mayen
- Sweden
- Switzerland
- Syrian Arab Republic
- Taiwan, Province of China
- Tajikistan
- Tanzania, United Republic of
- Thailand
- Timor-Leste
- Togo
- Tonga
- Tunisia
- Turkmenistan
- Türkiye
- Uganda
- Ukraine
- United Arab Emirates
- United Kingdom
- United States
- Uzbekistan
- Vanuatu
- Venezuela, Bolivarian Republic of
- Viet Nam
- Yemen
- Zambia
- Zimbabwe
Duration: 593 days
Time span: March 28 2021 to November 10 2022
Statistics over entire affected area:
- Mean temperature anomaly: 3.2 °C
- Mean temperature: 20.7 °C
- Maximum temperature anomaly: 35.1 °C
- Maximum temperature: 44.7 °C
Event center: 1.0°N 350.0°E
Area affected: 335408961 km$^2$
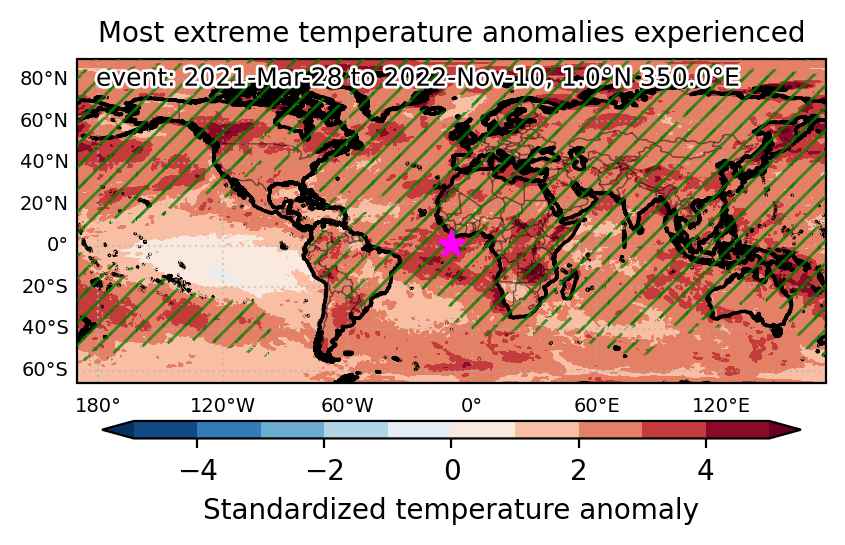
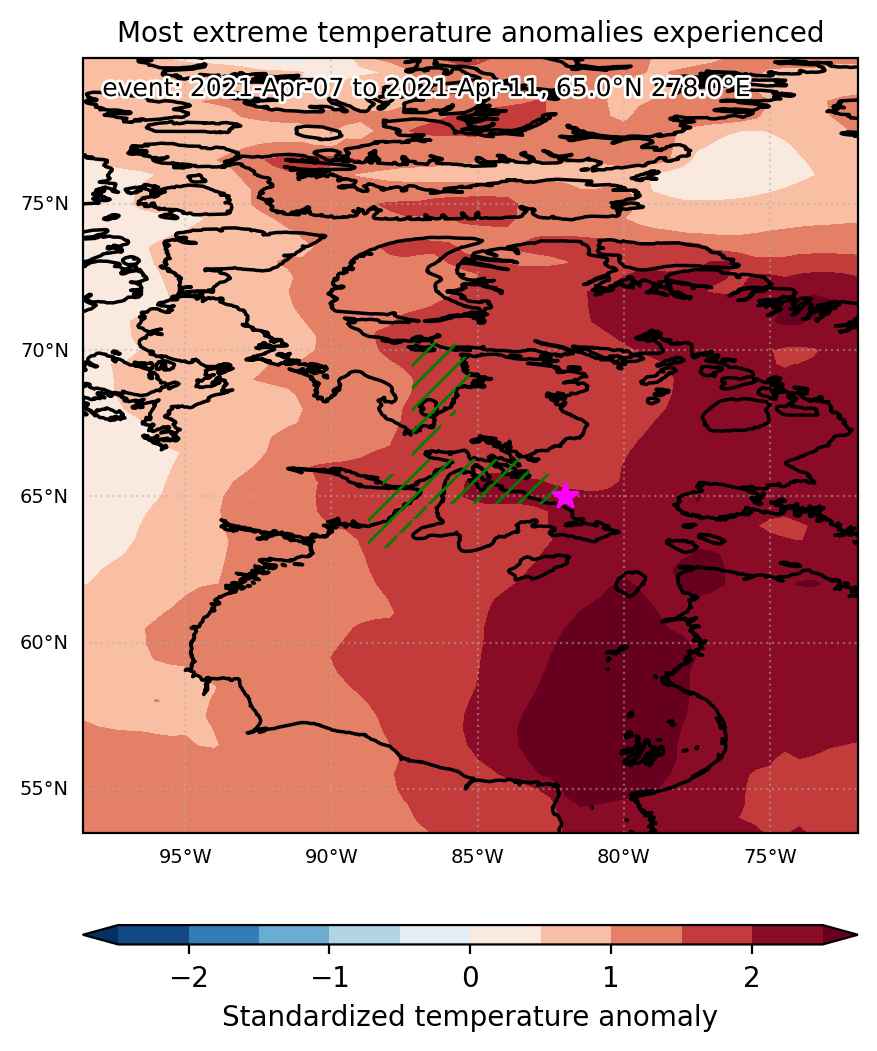
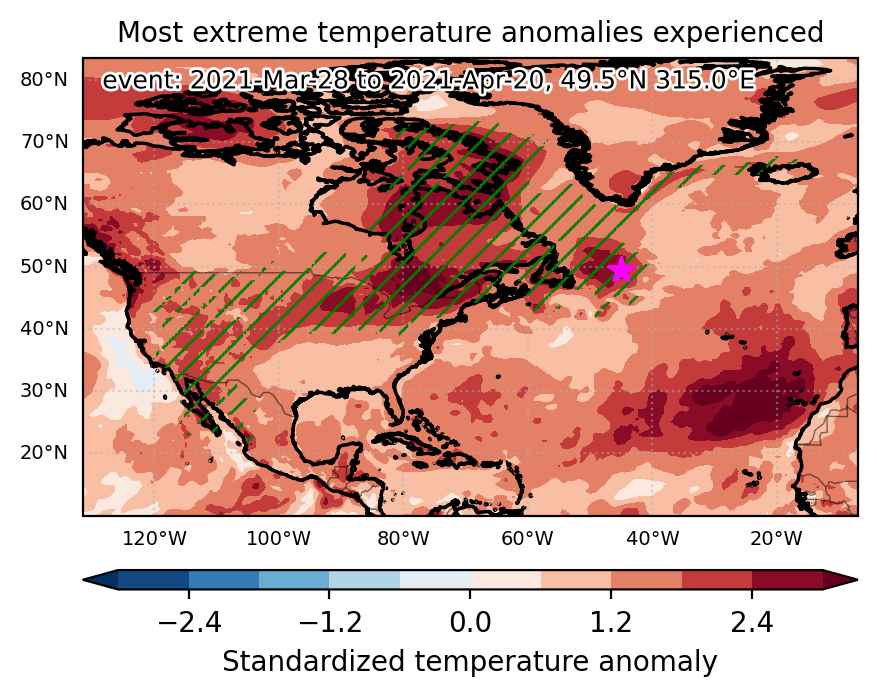
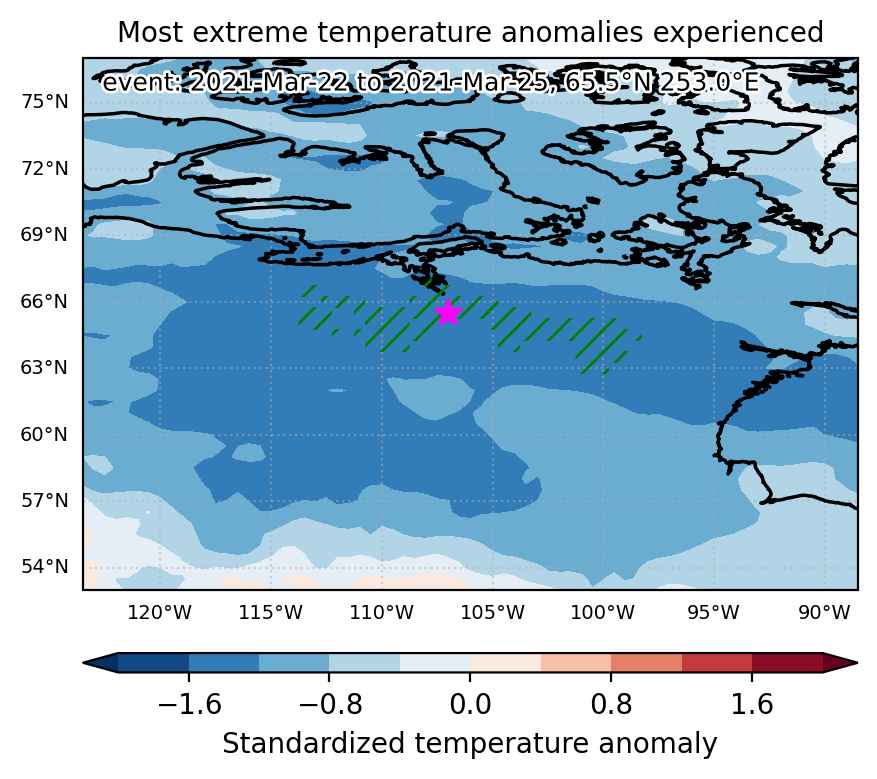
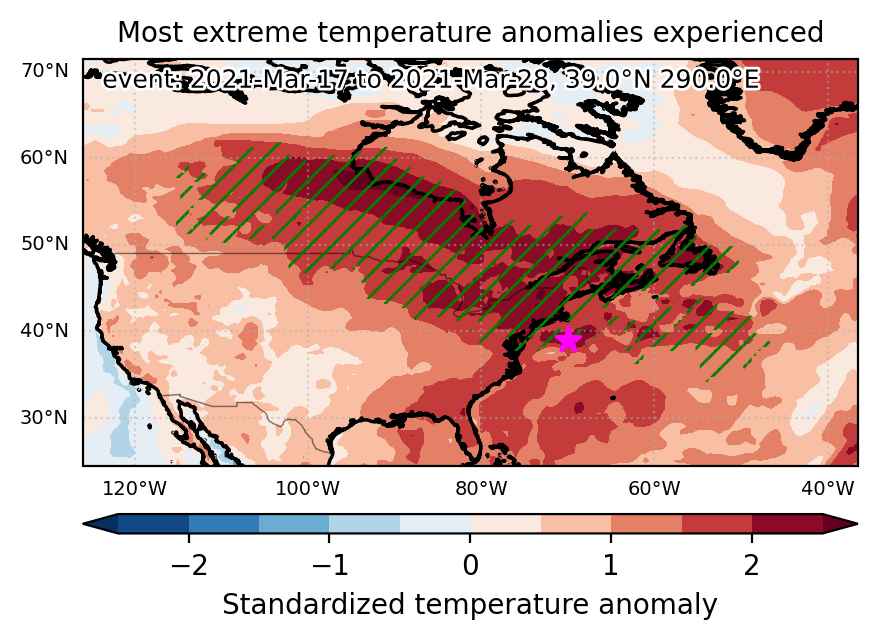
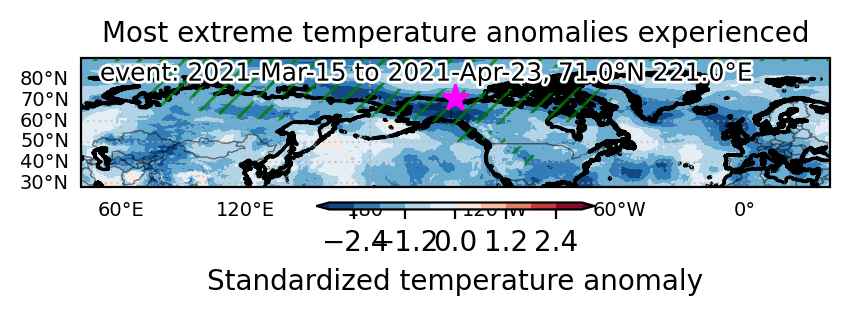
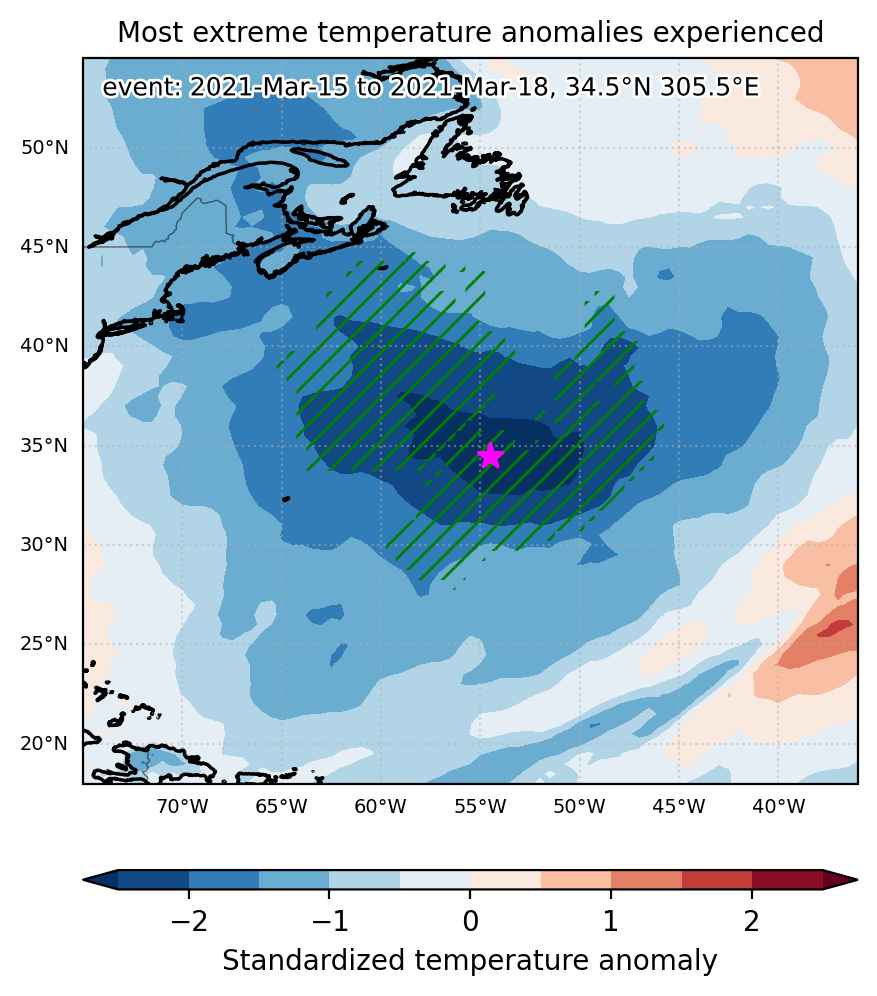
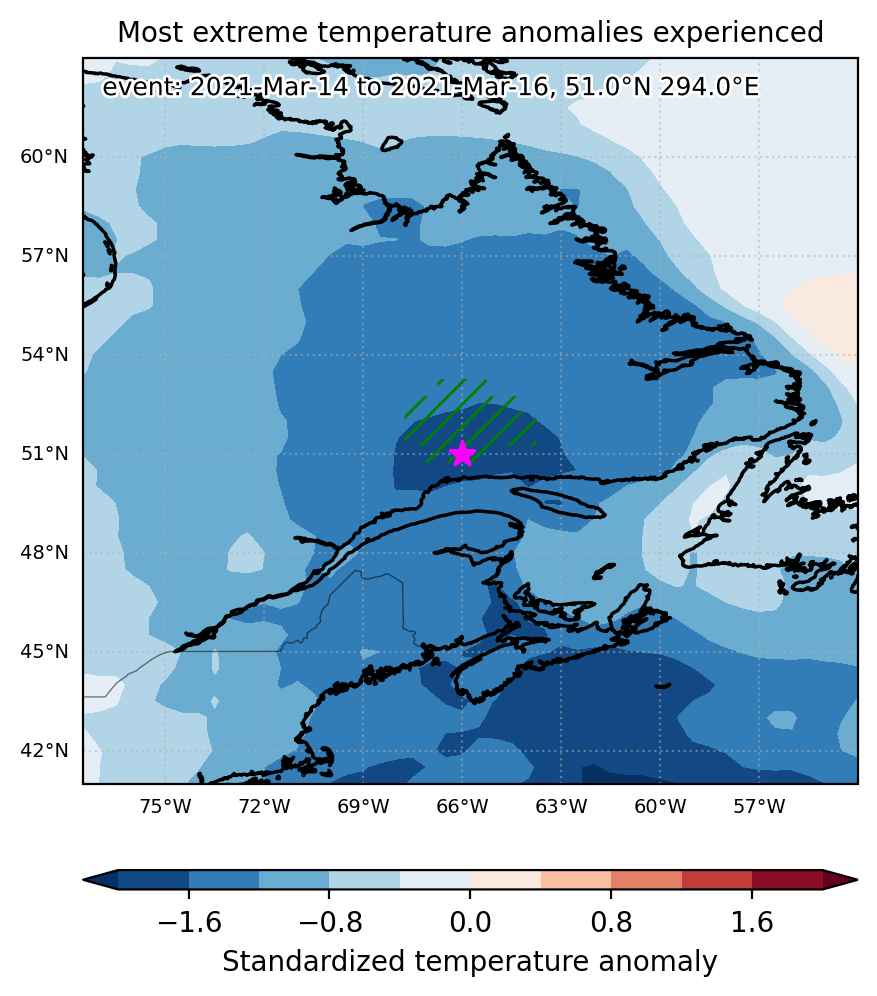
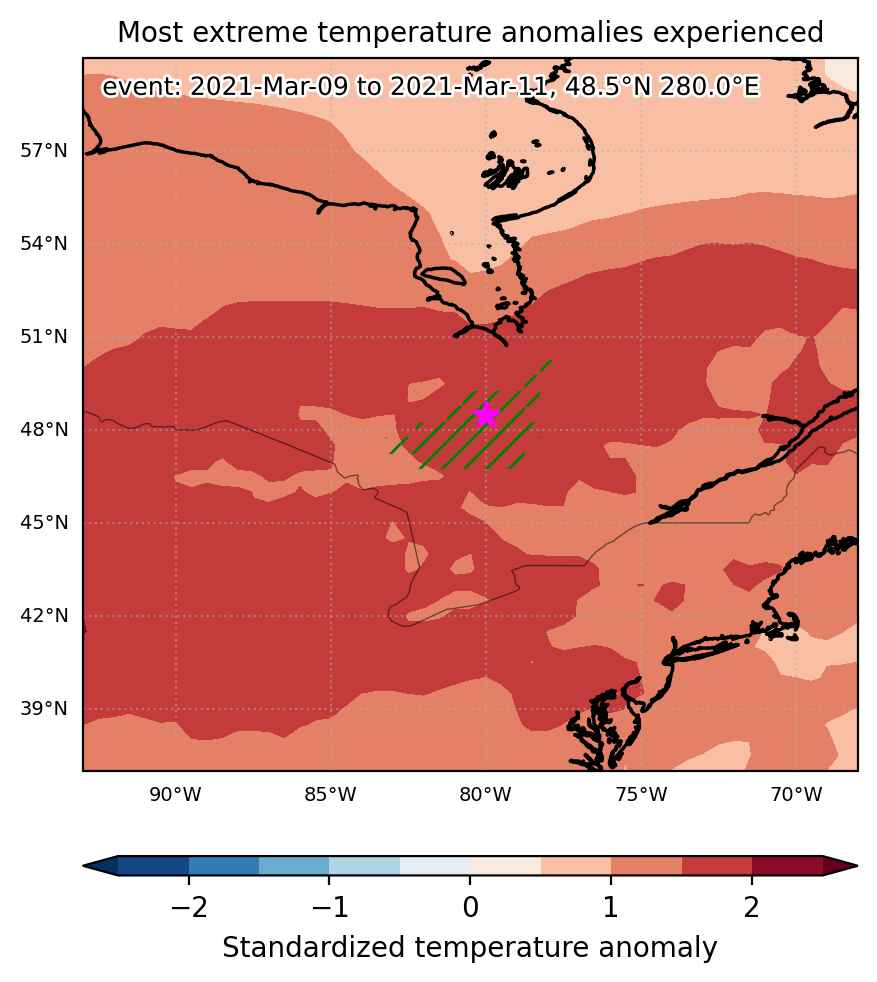
Fig. 1: Map of most extreme temperature anomalies (standardized) experienced during the event. The purple star indicates the center of the extreme event. Green hatching illustrates all areas under the effect of extremes at some time during the event.
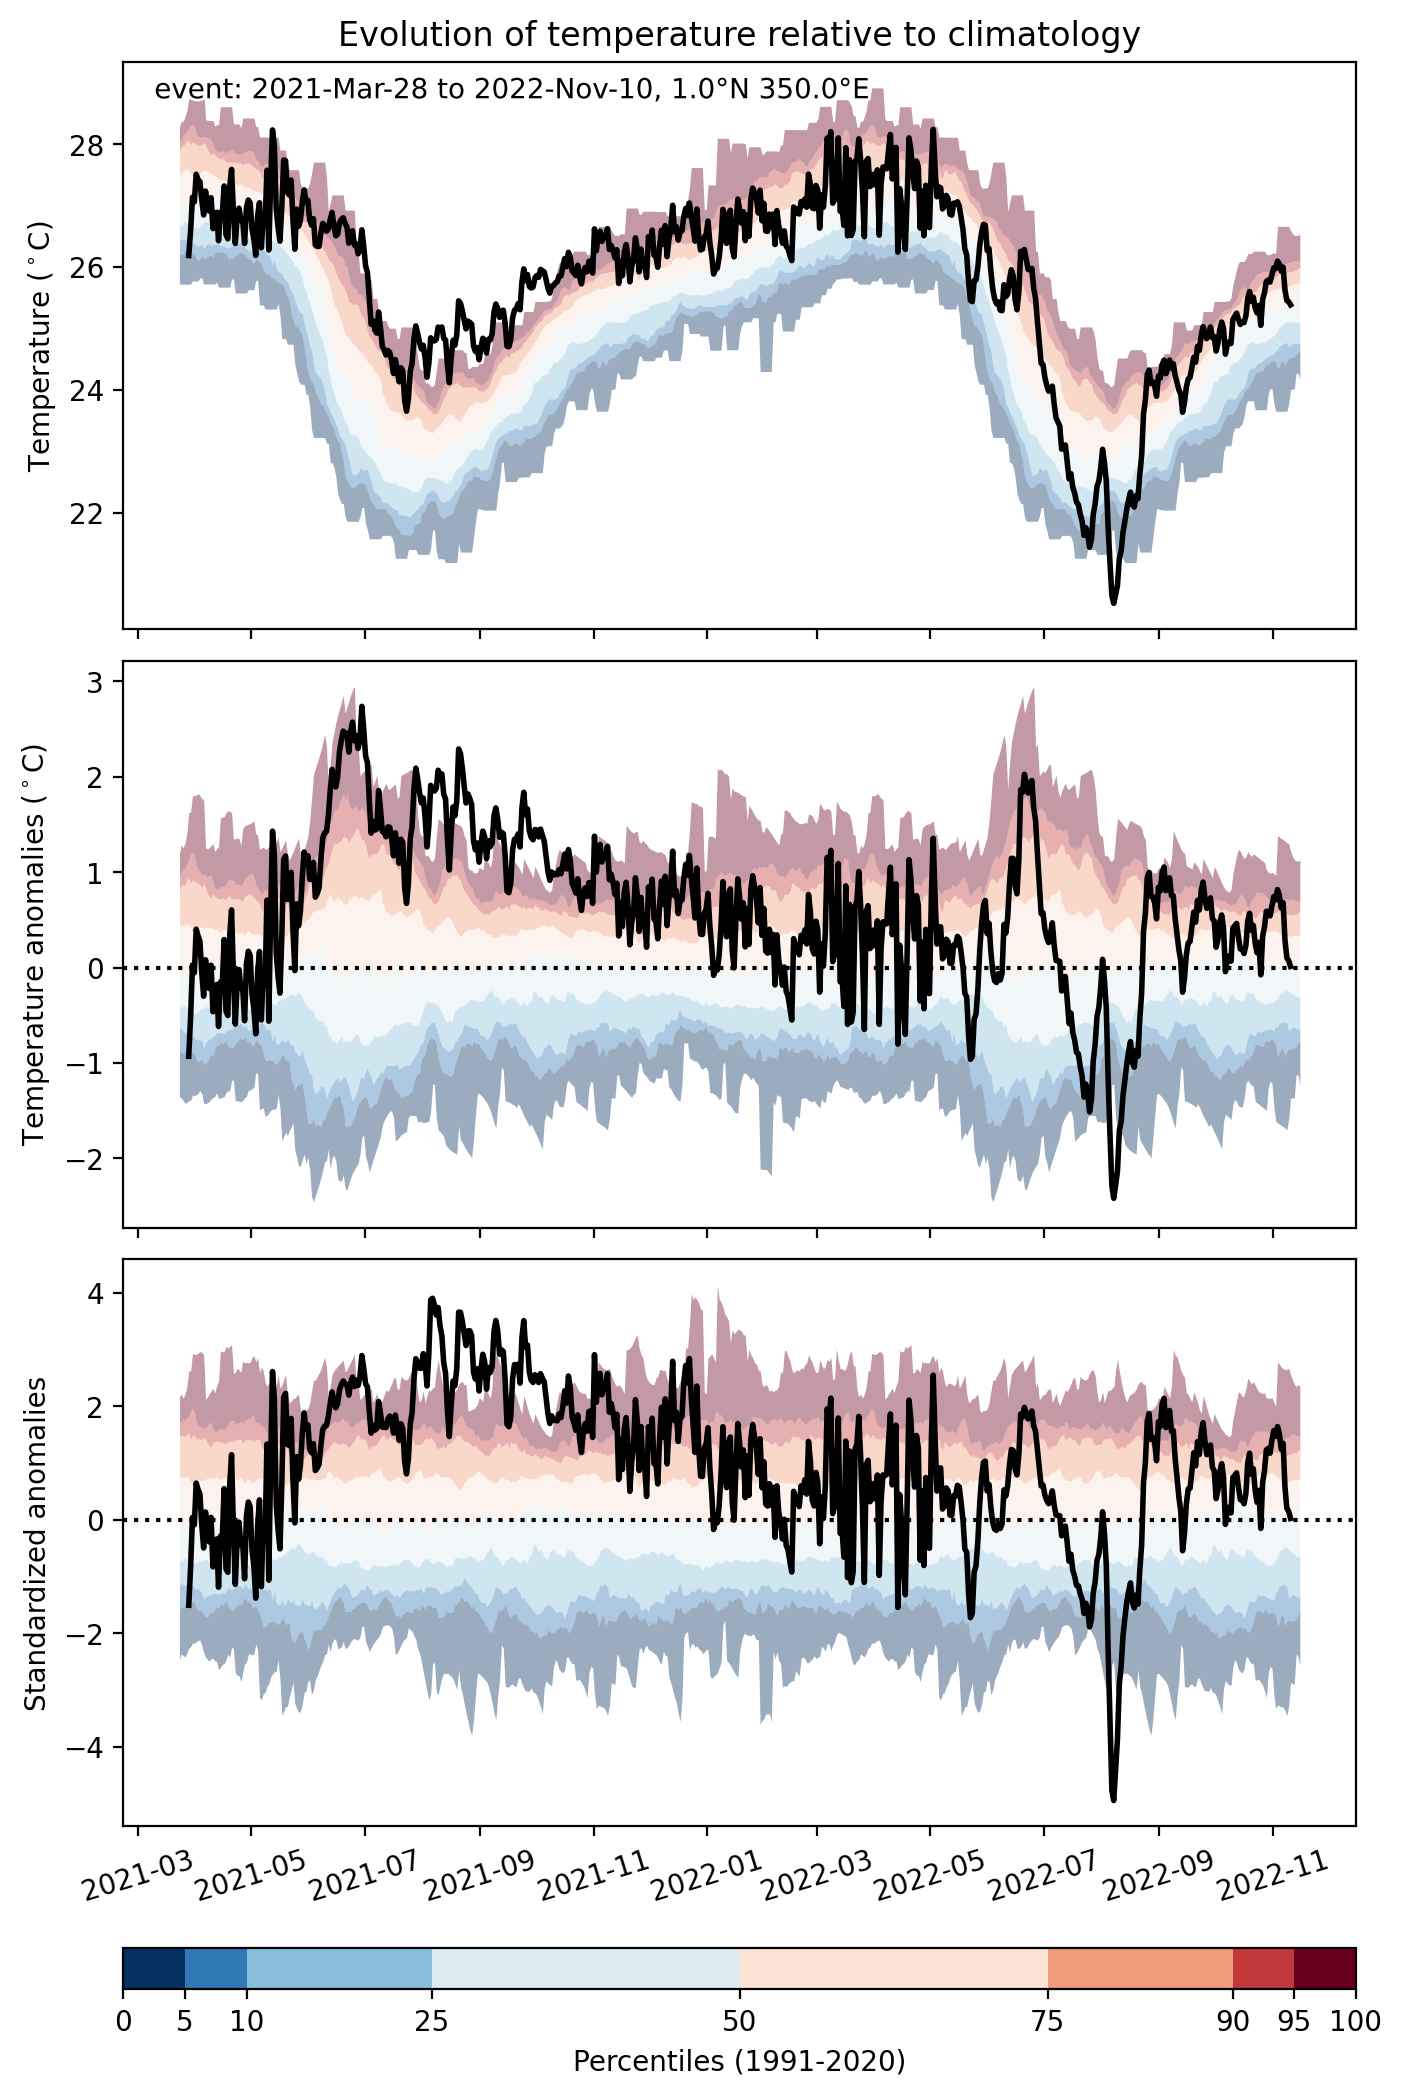
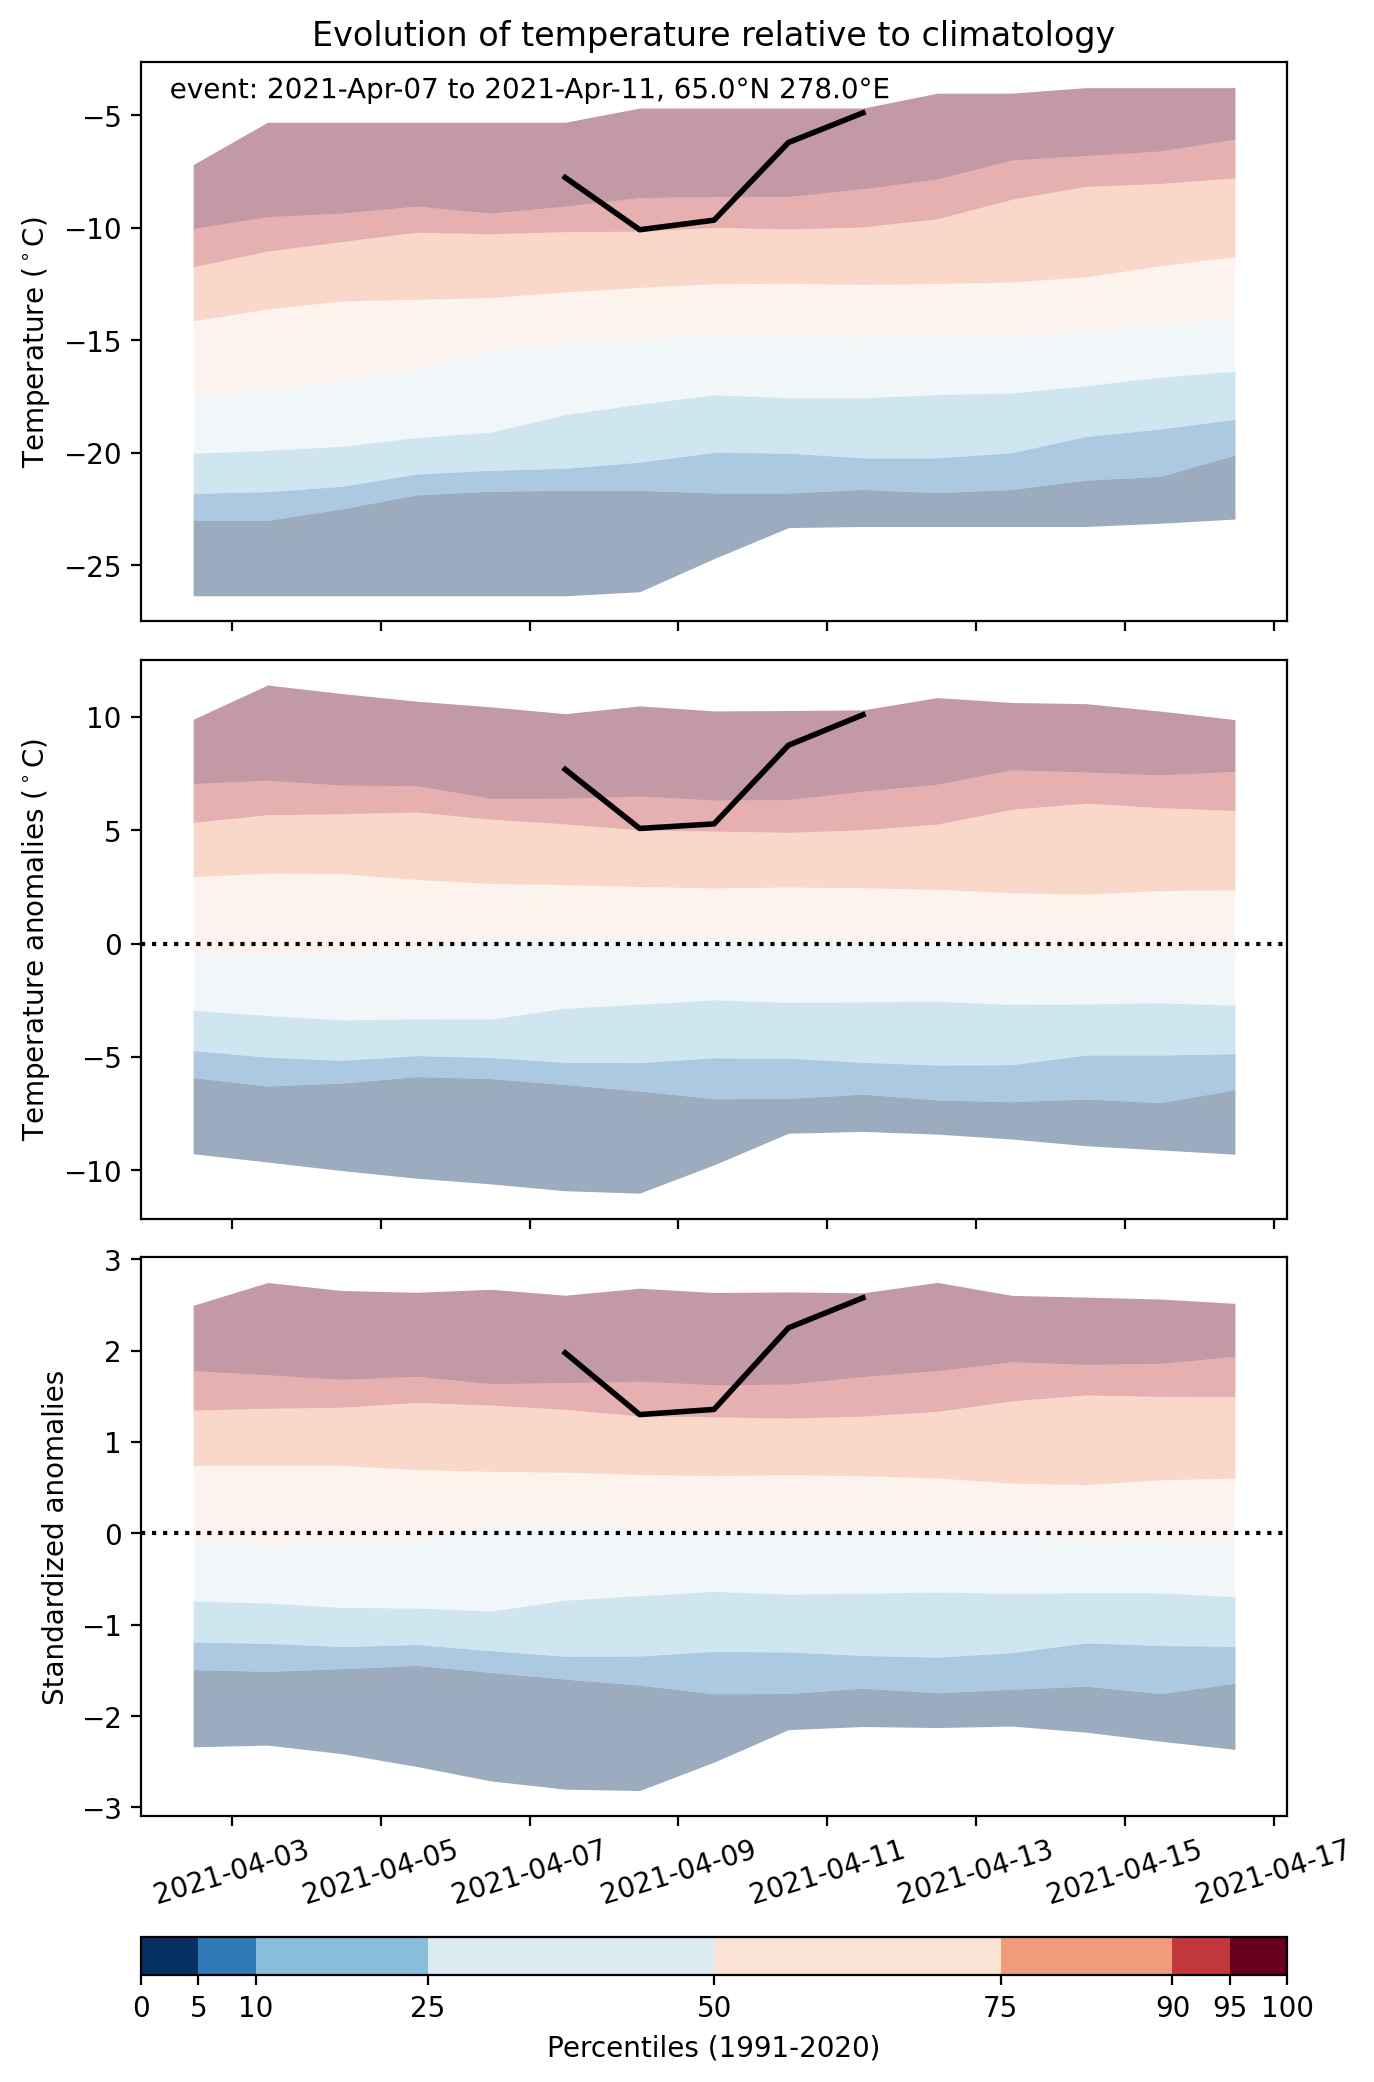
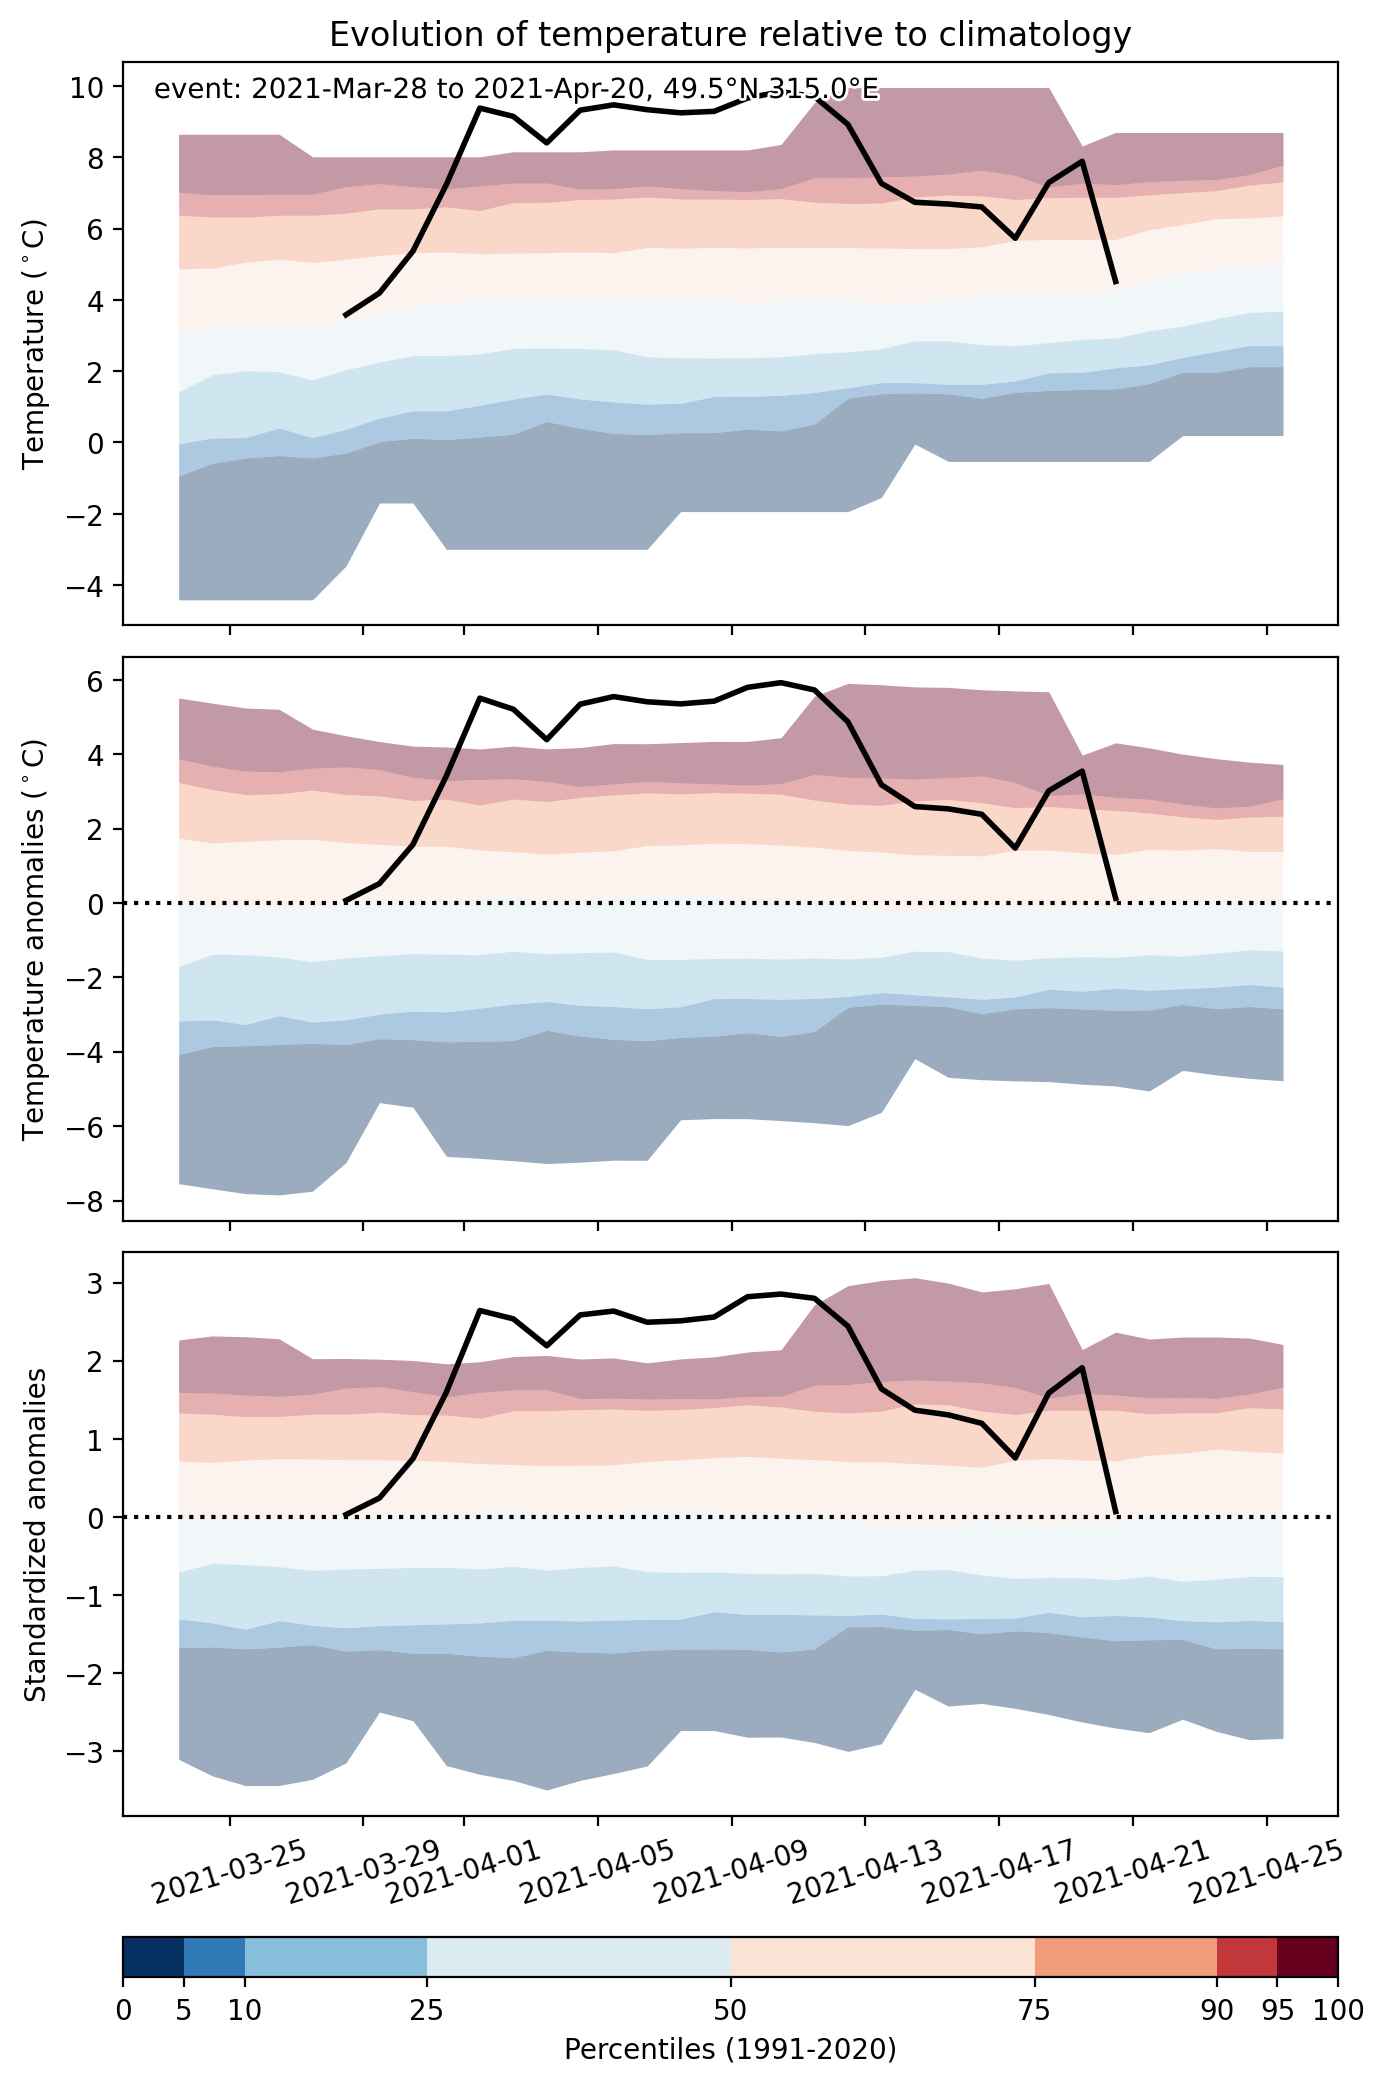
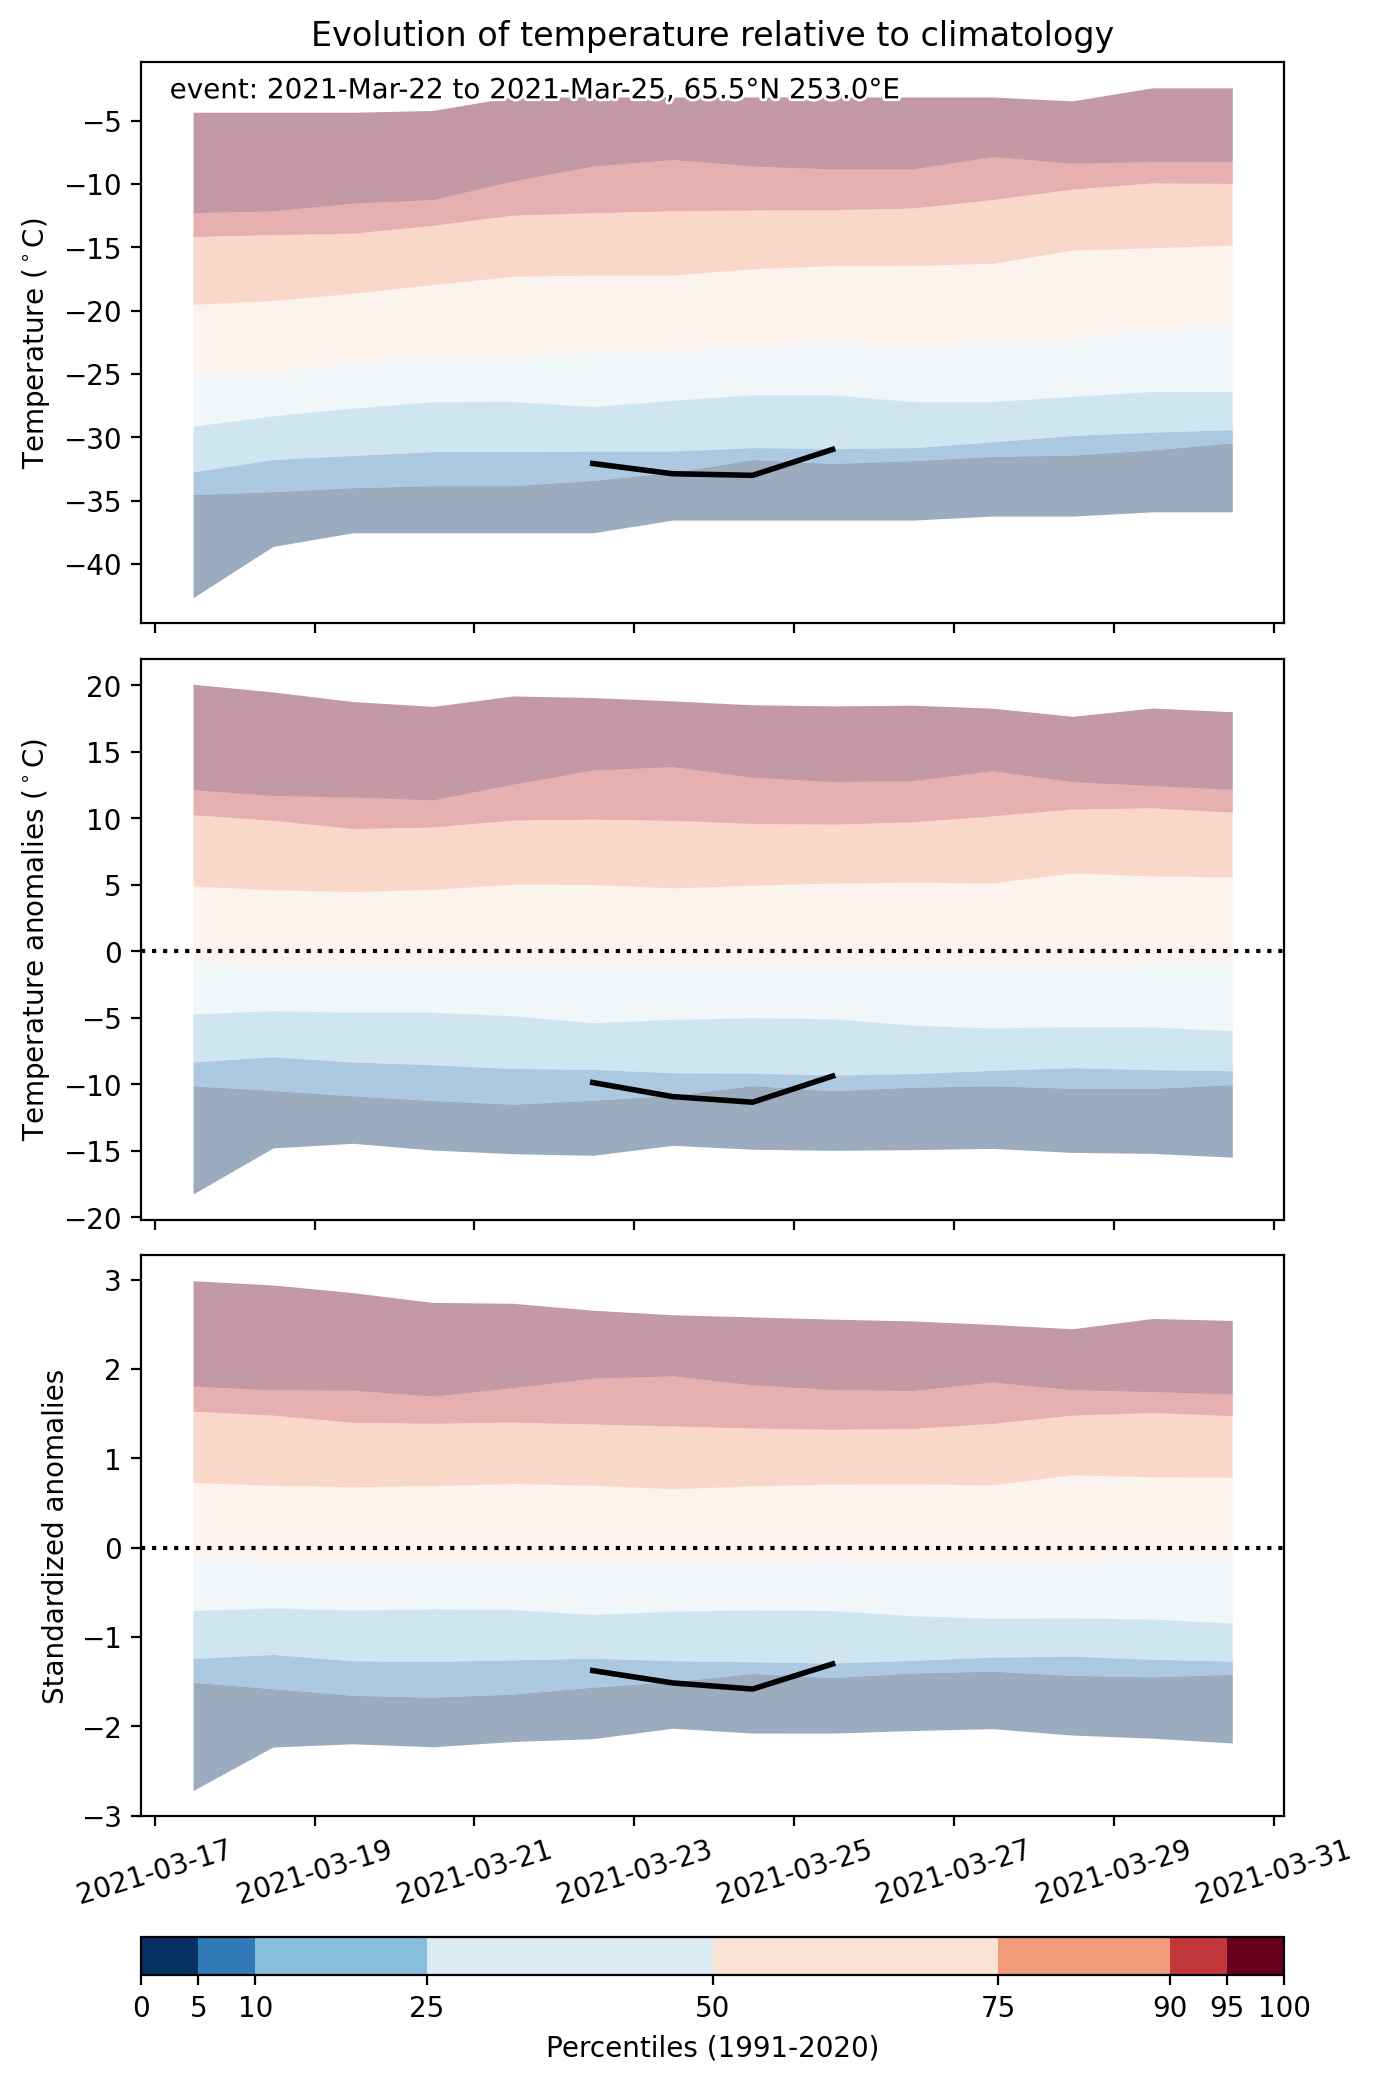
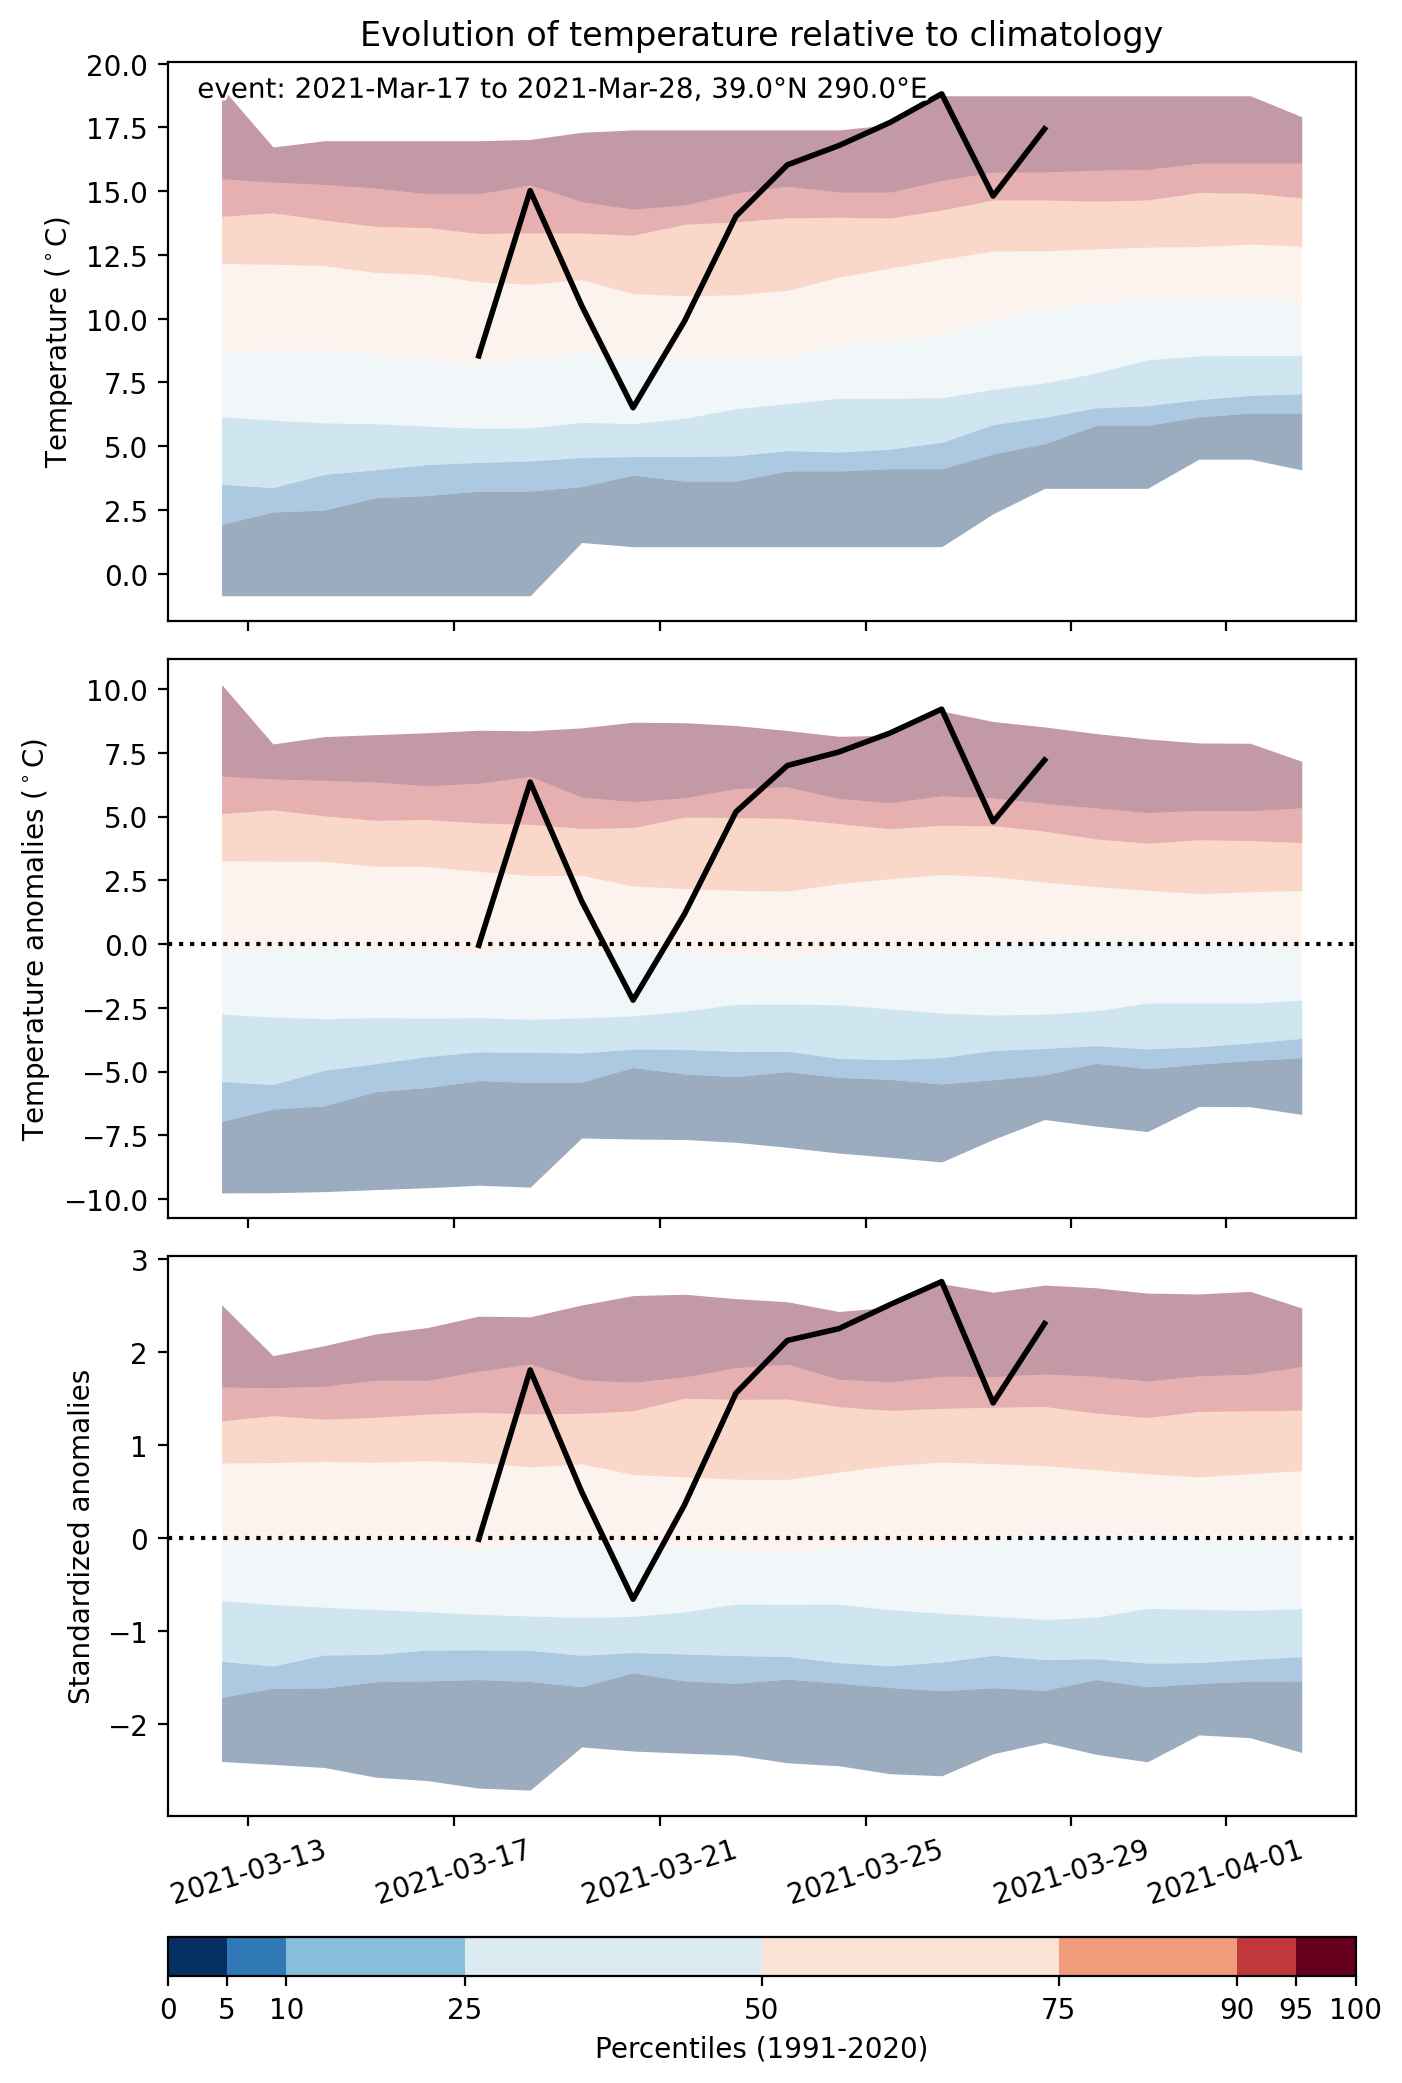
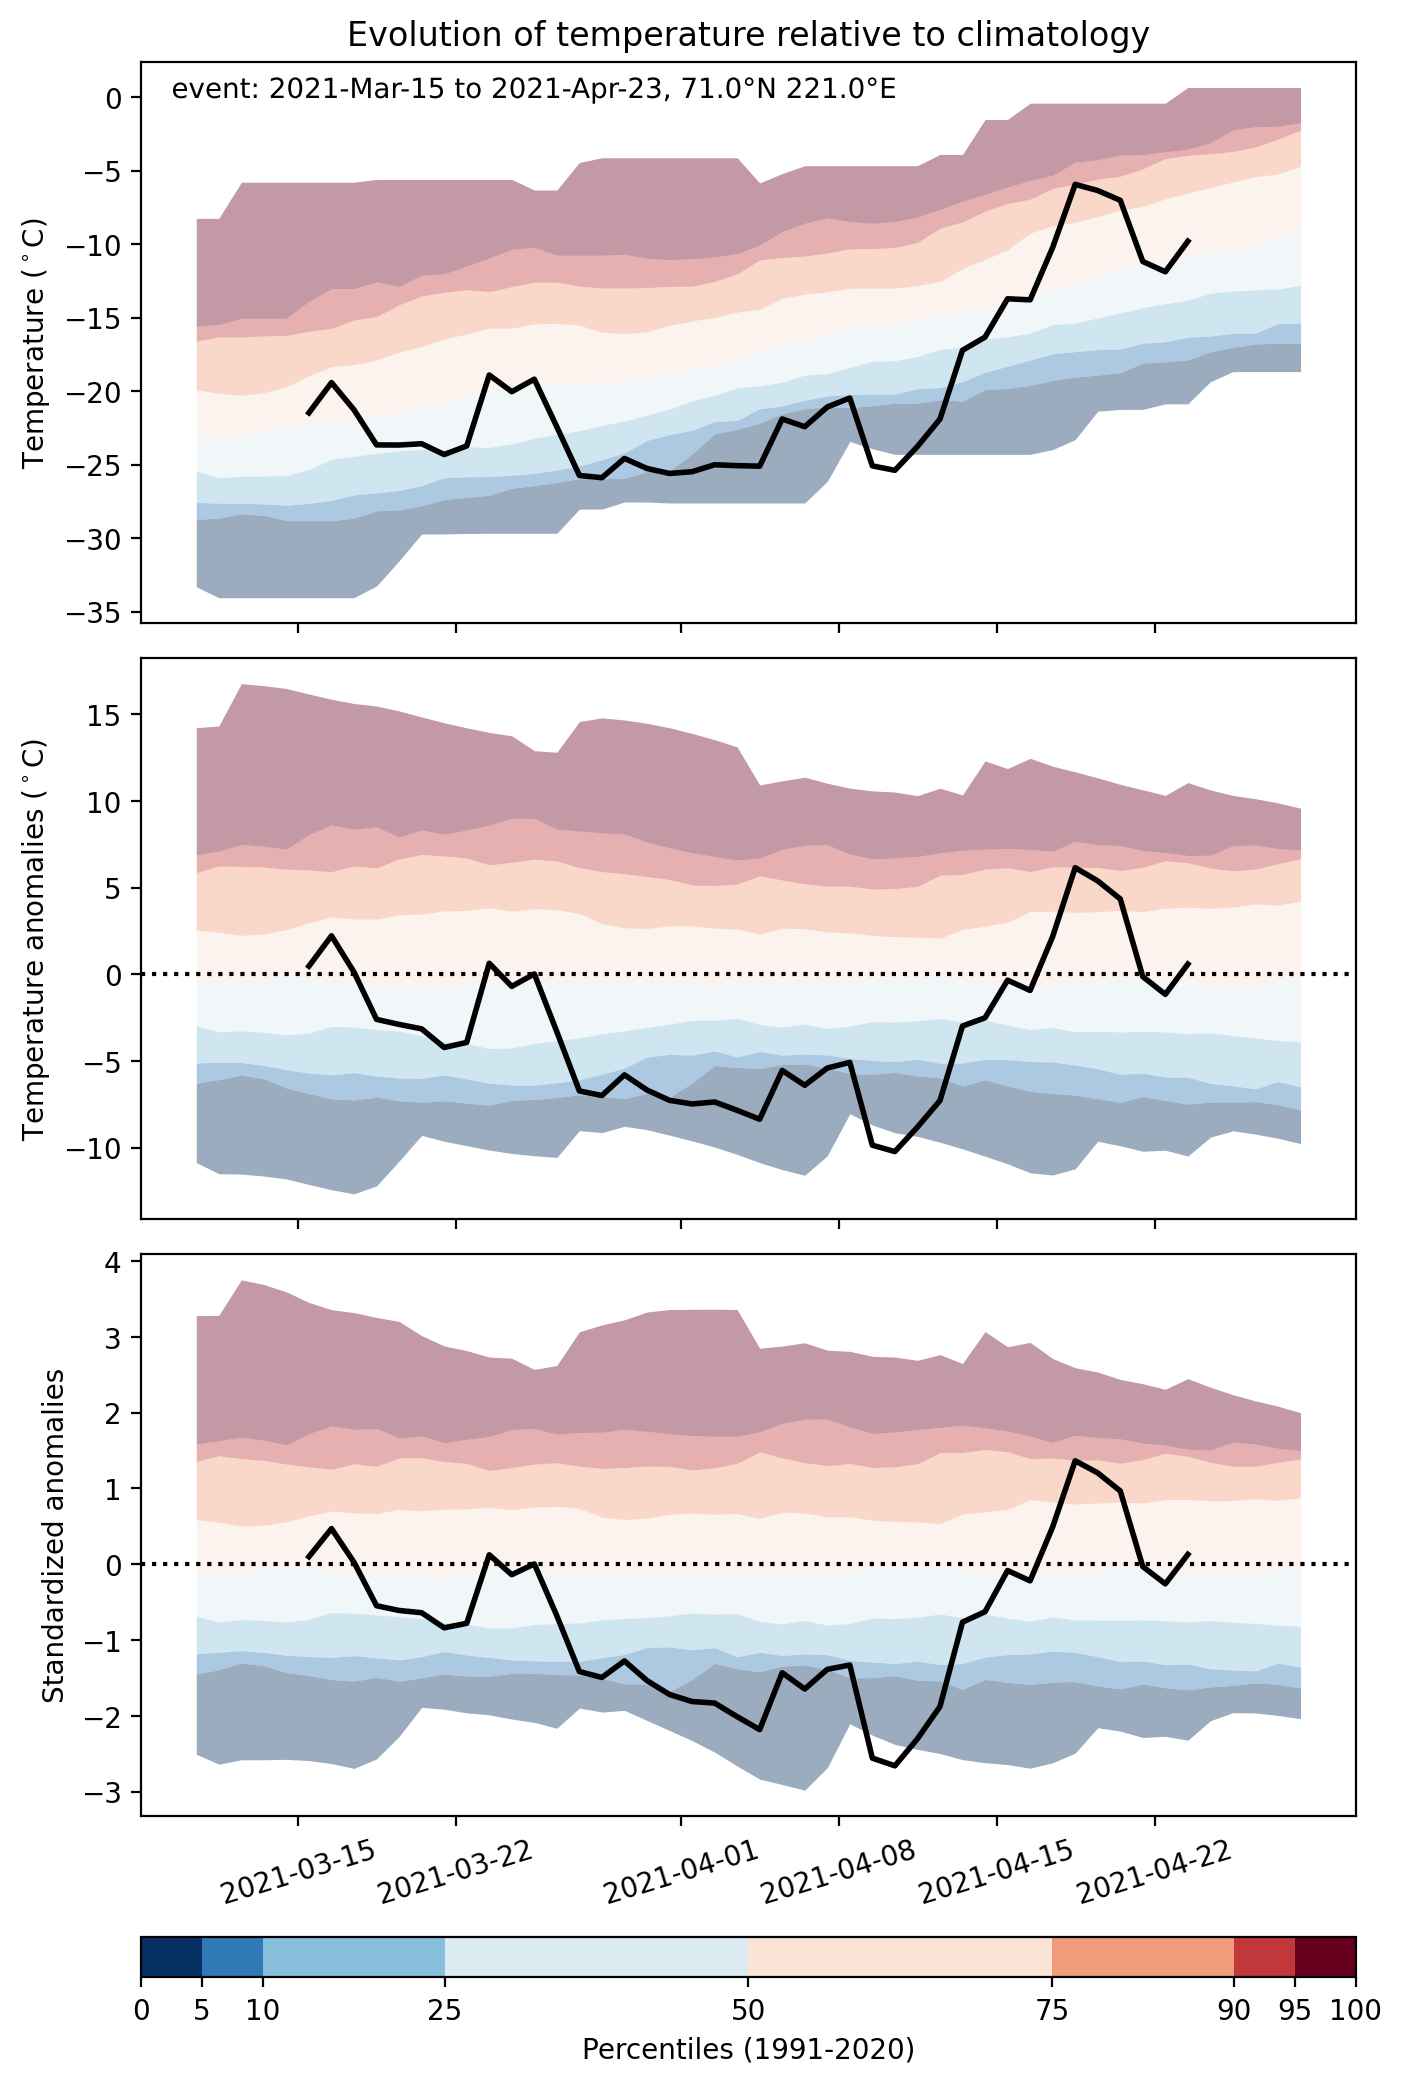
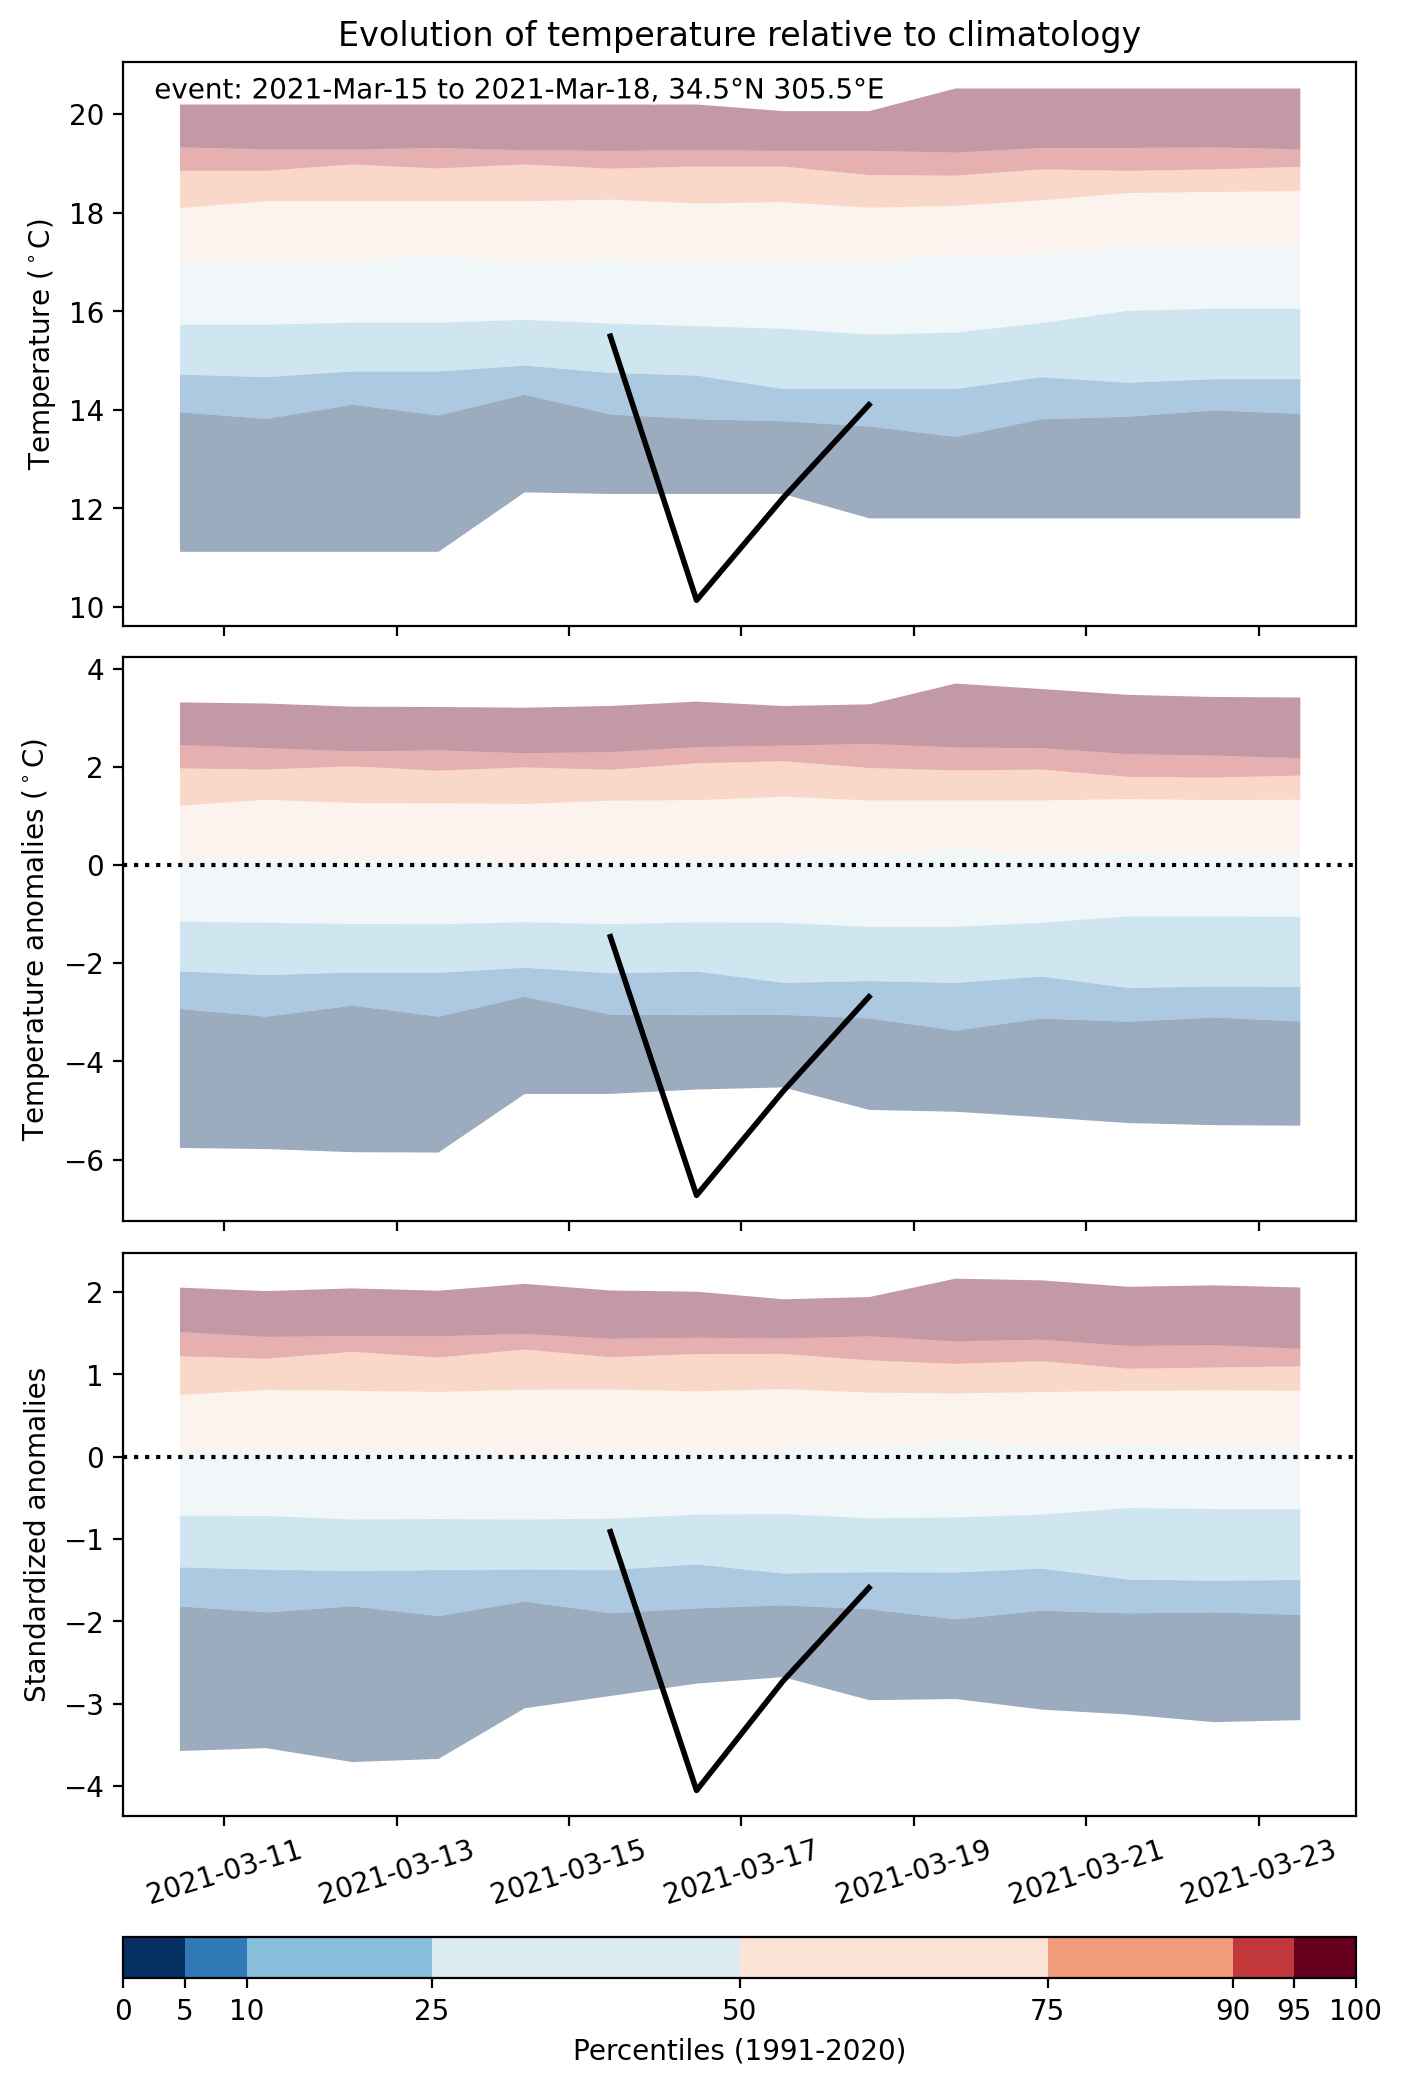
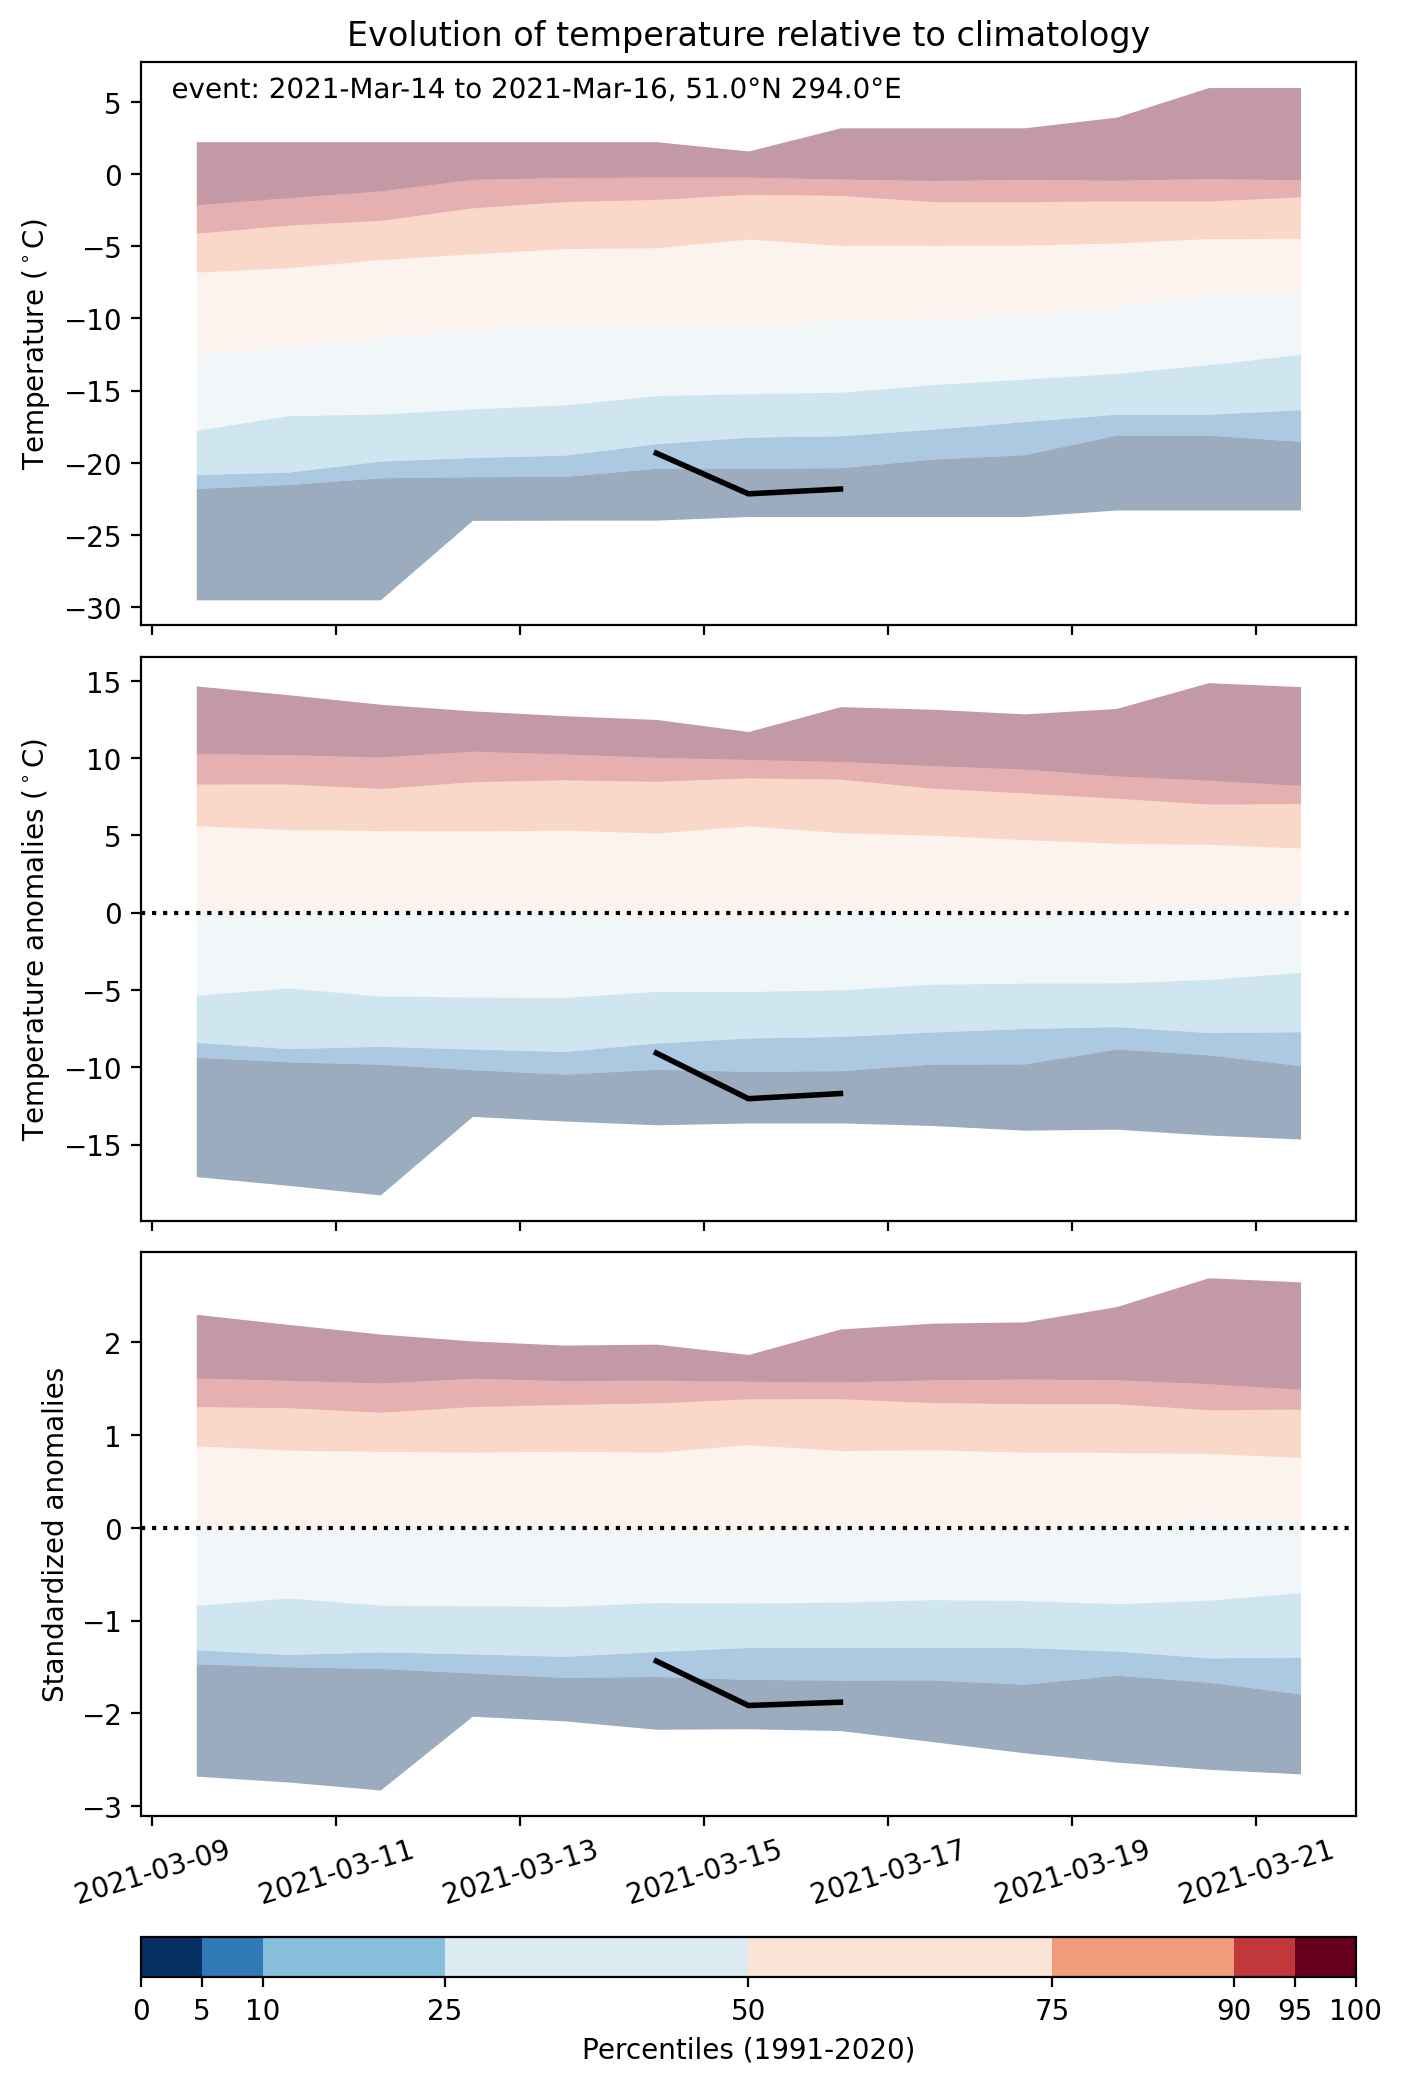
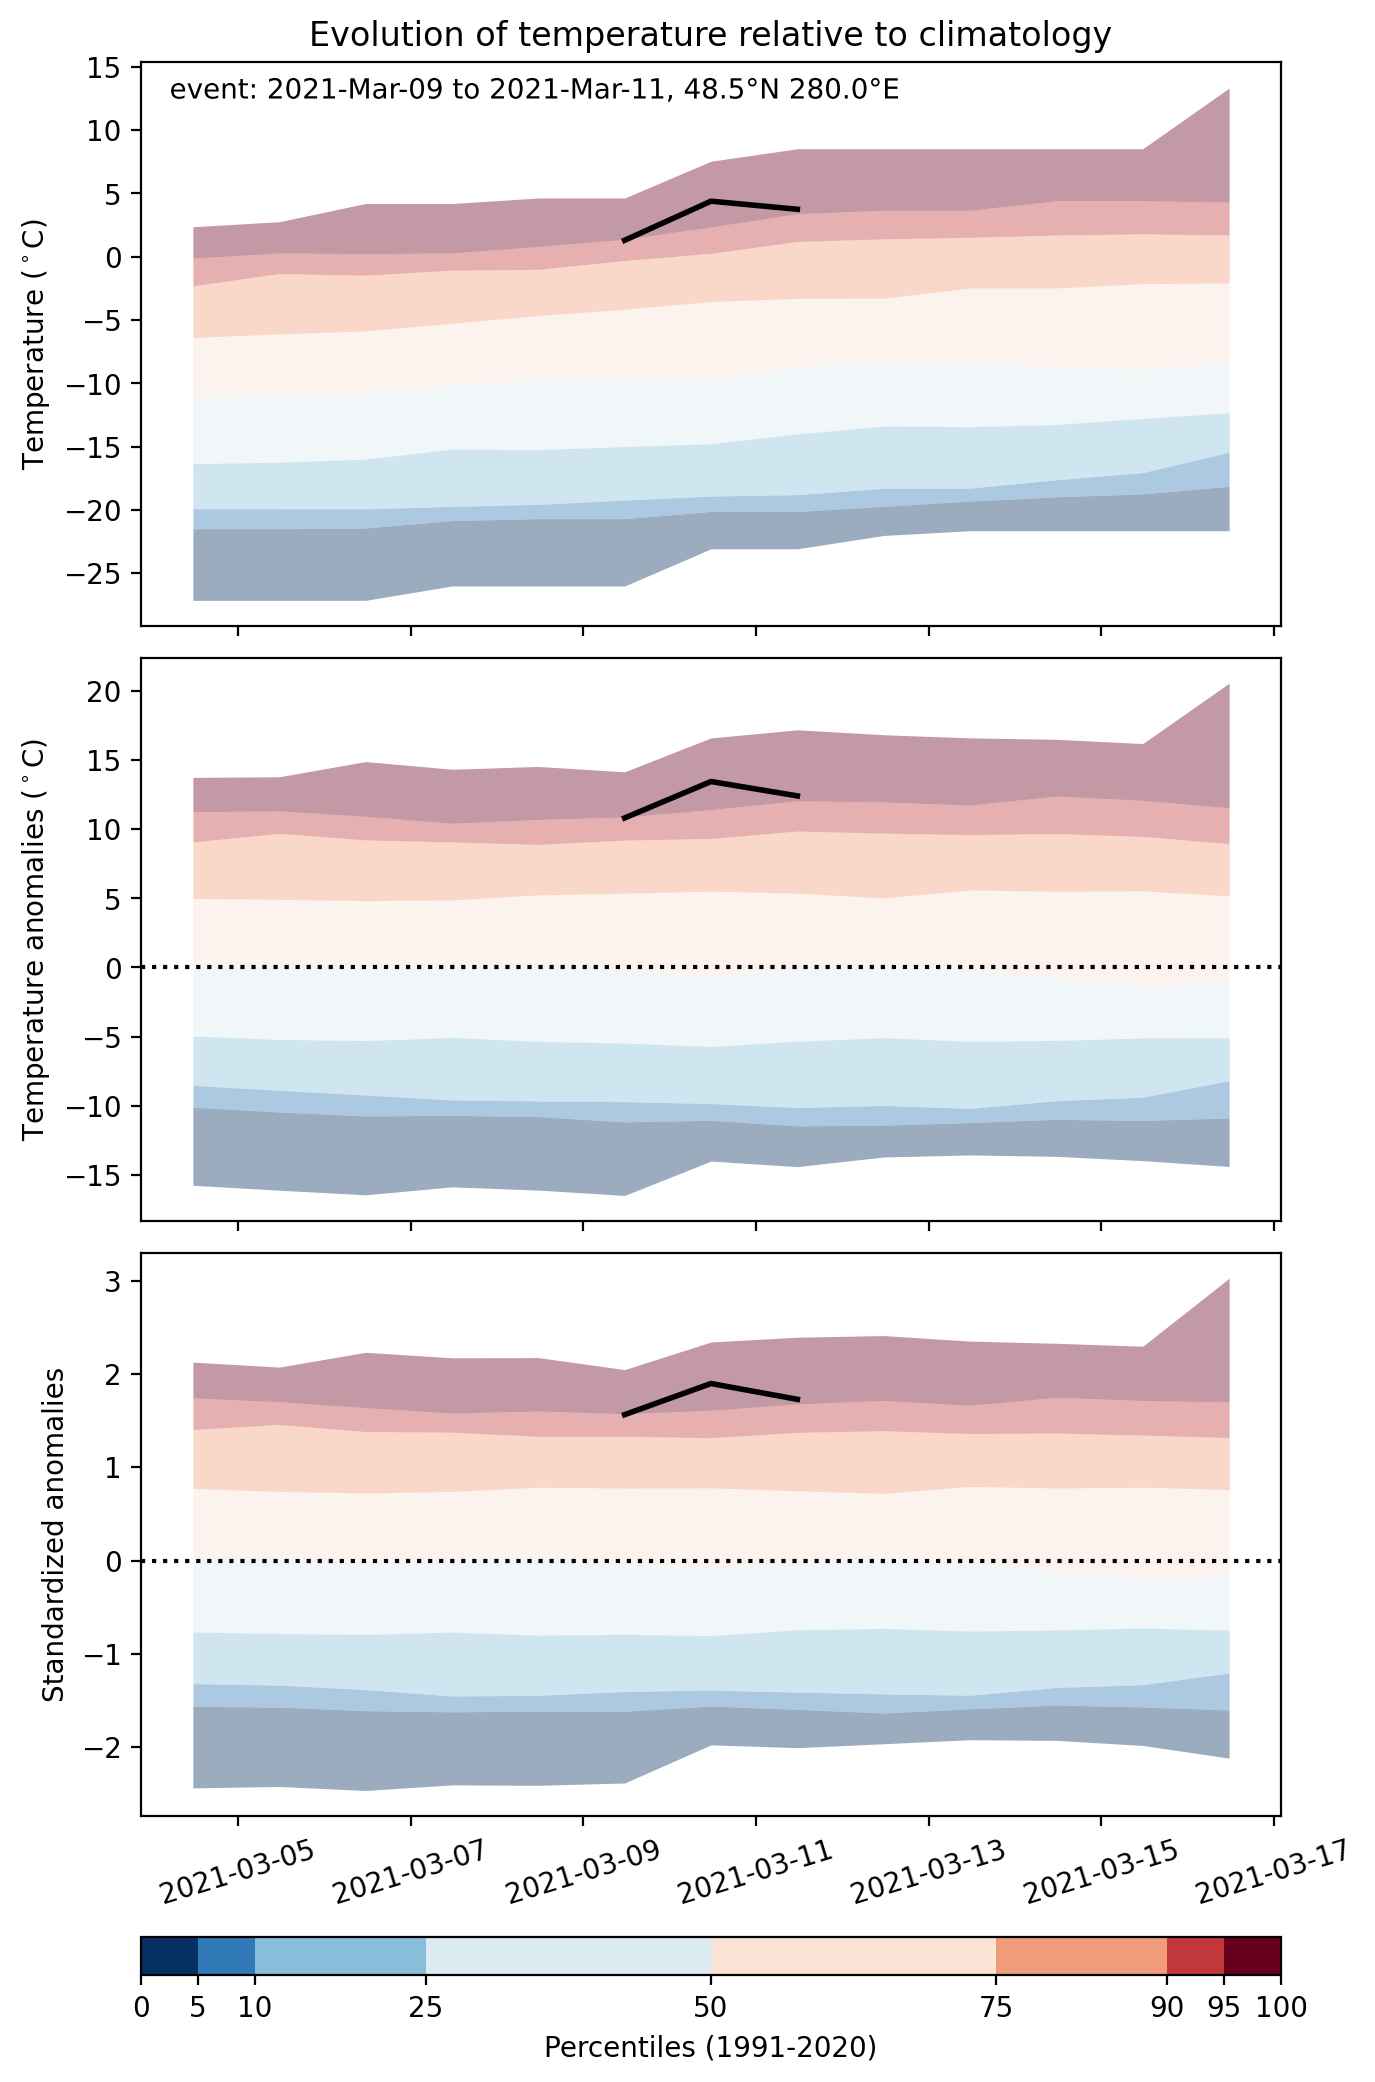
Fig. 2: Evolution of temperature at the center of the event. The climatological percentile distribution is illustrated with color shadings.
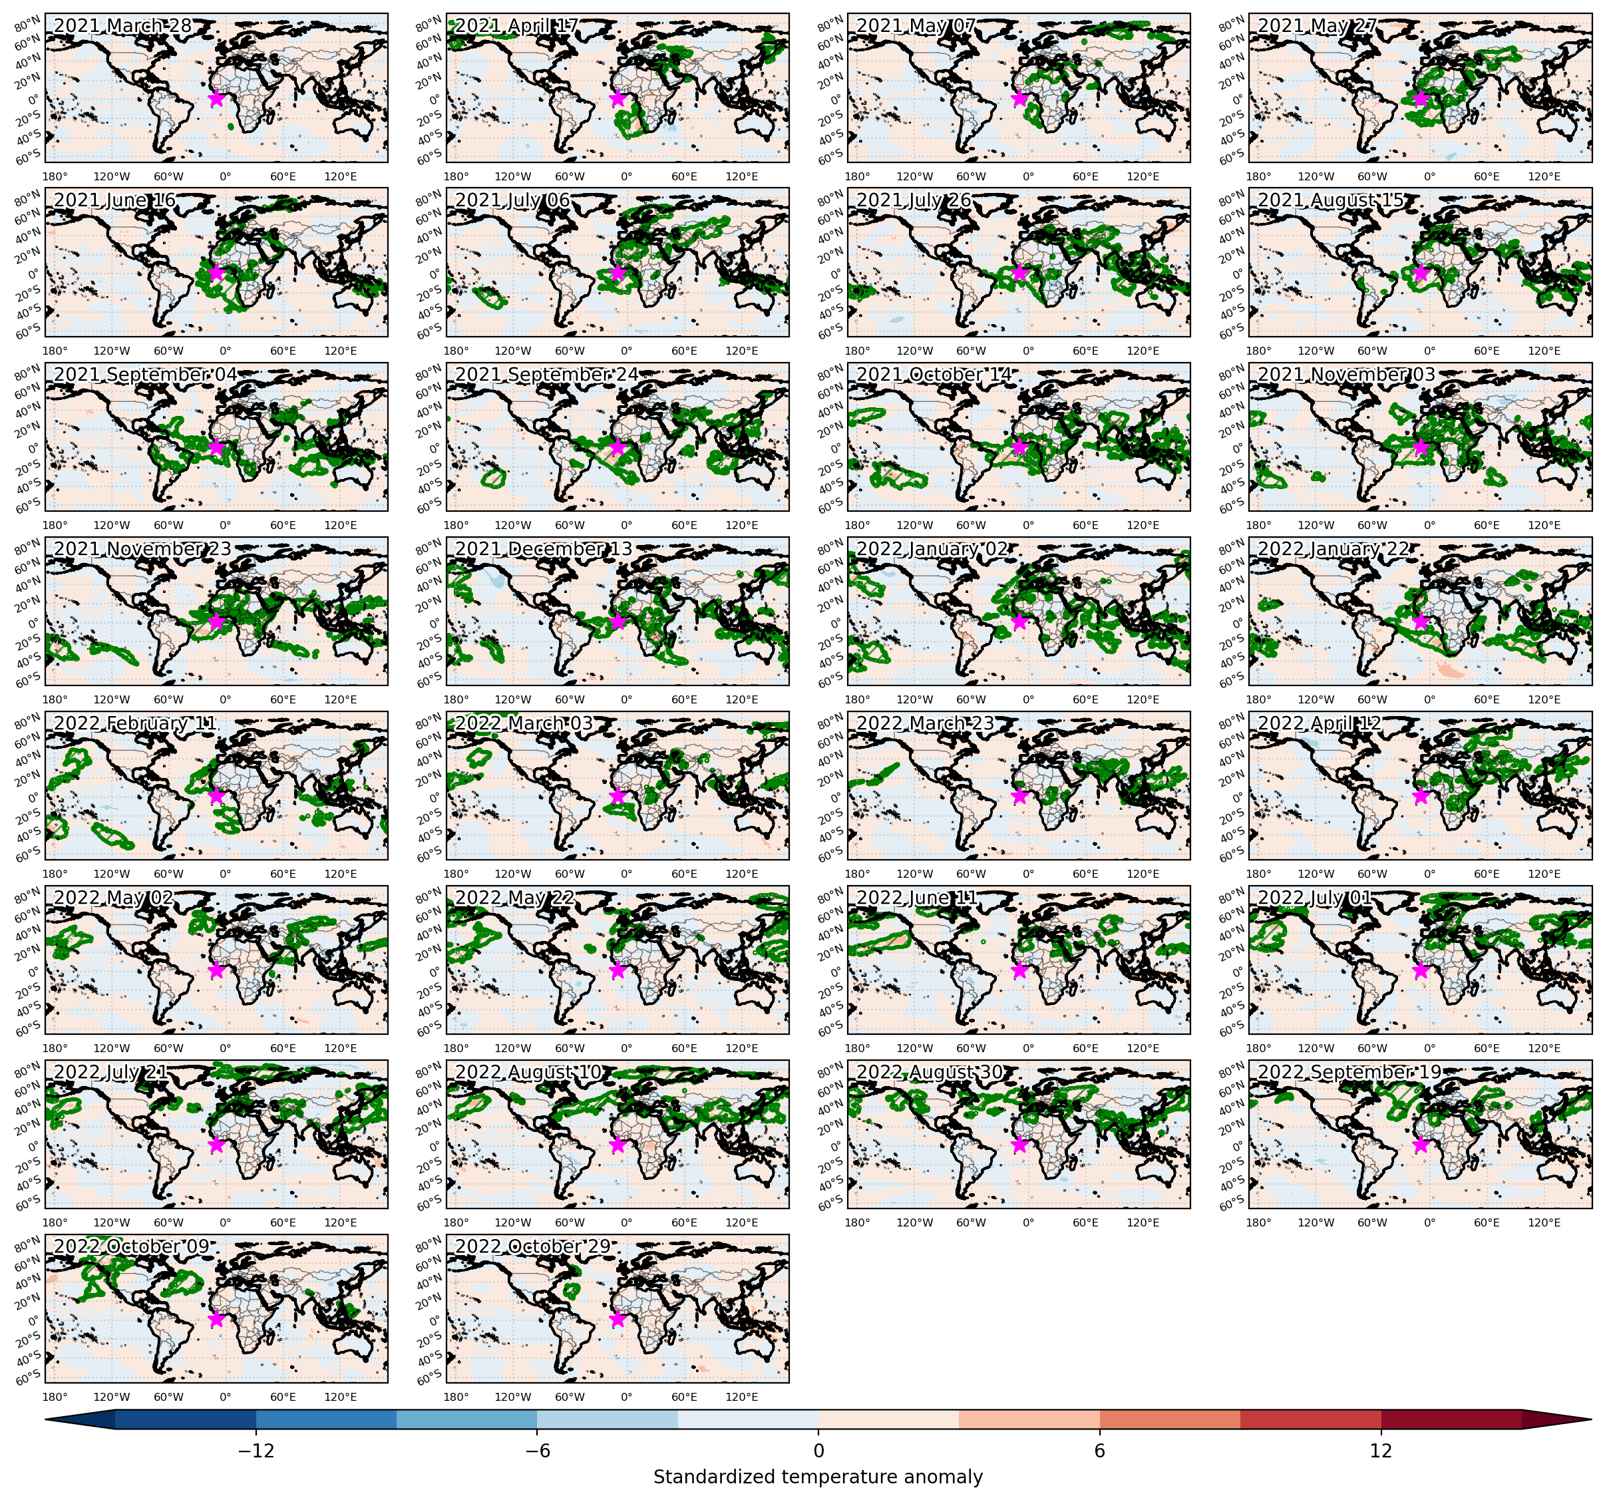
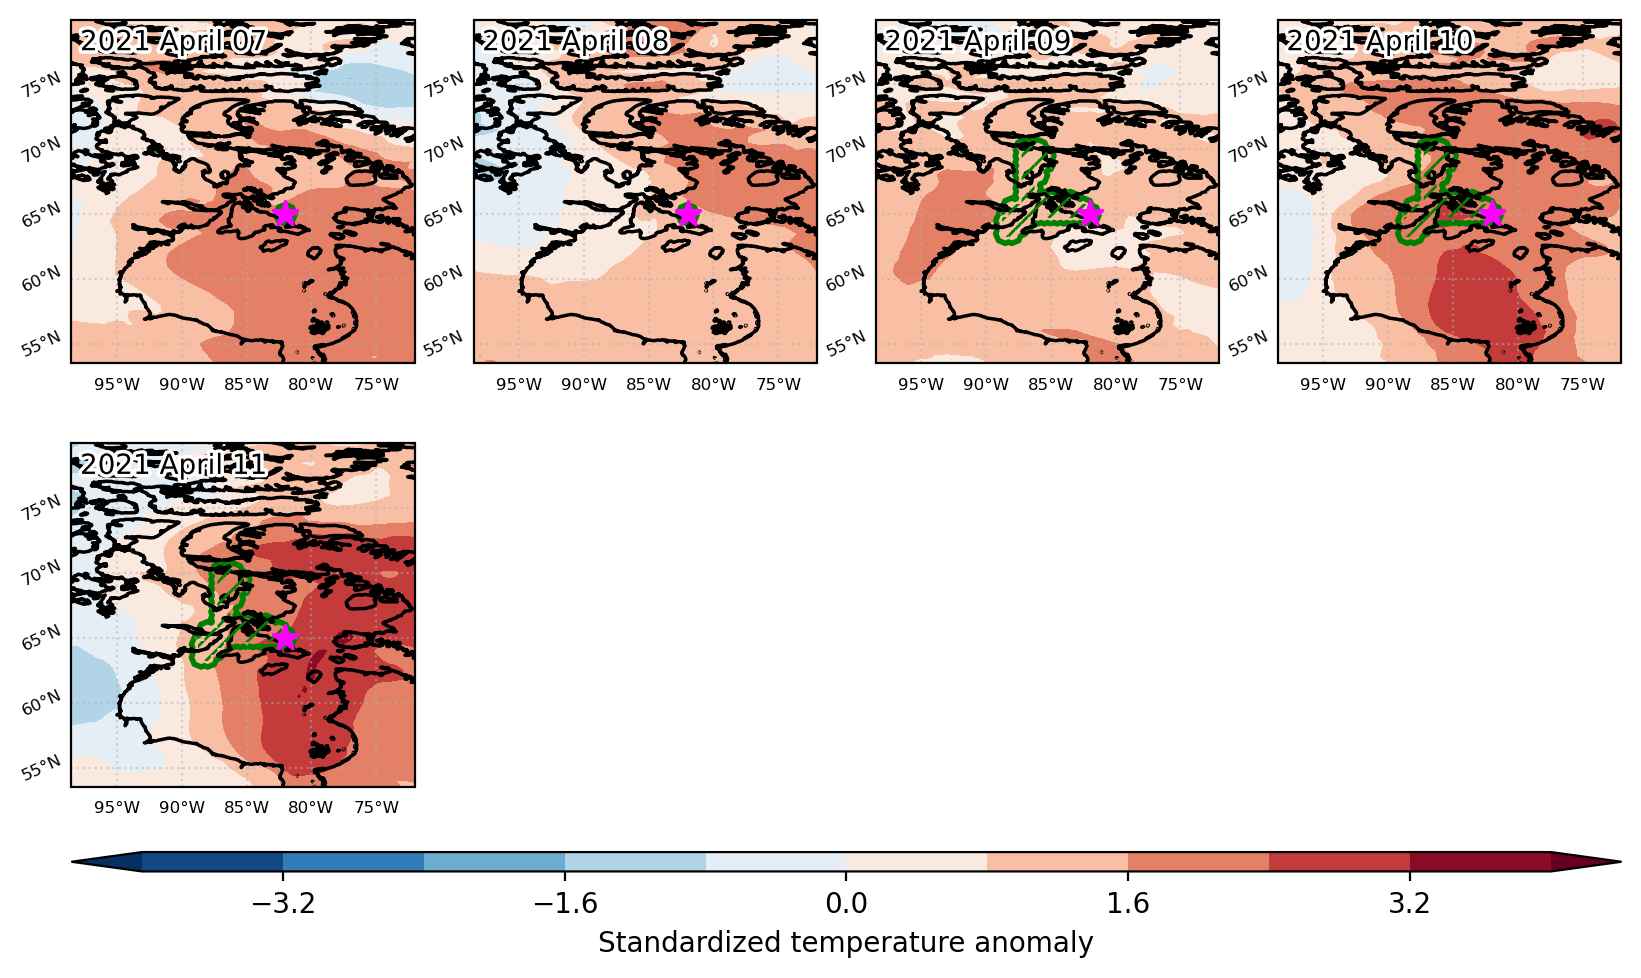
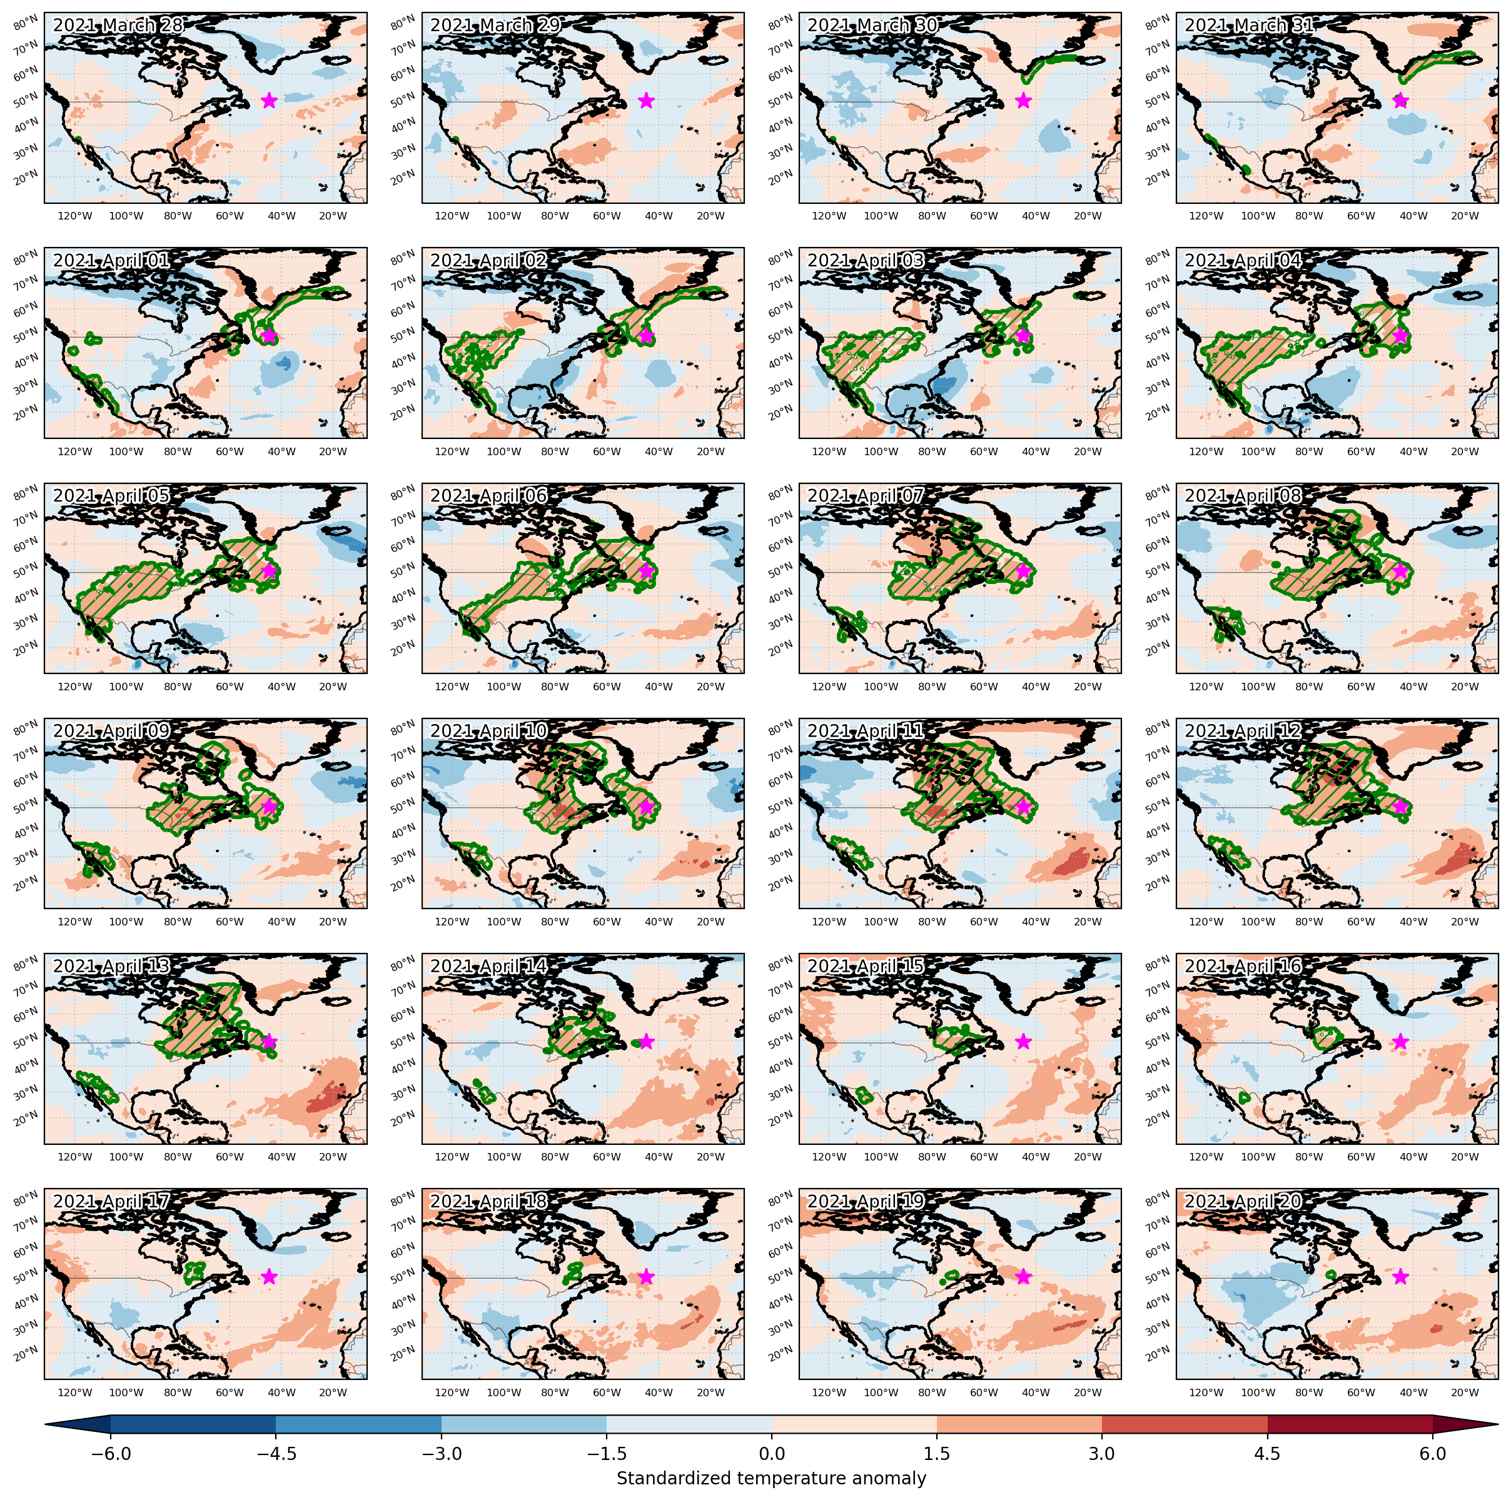
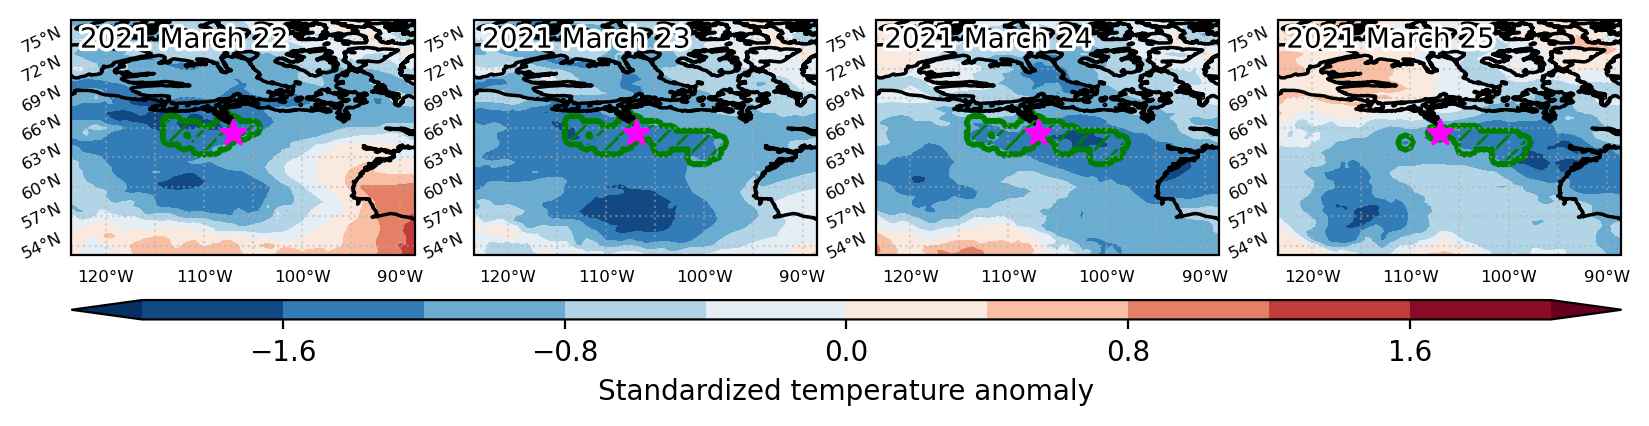
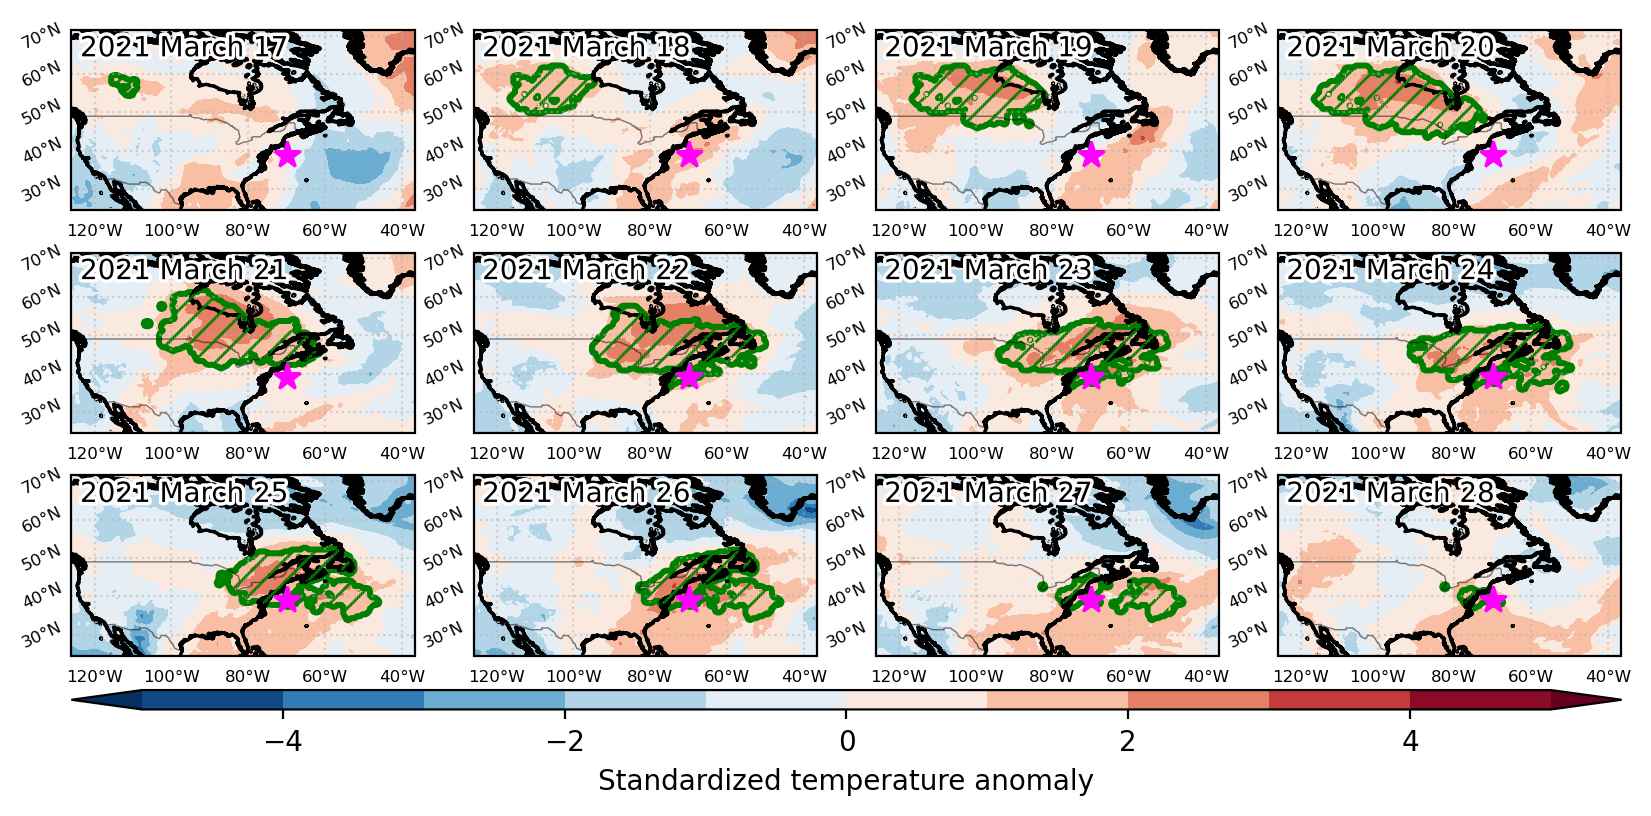
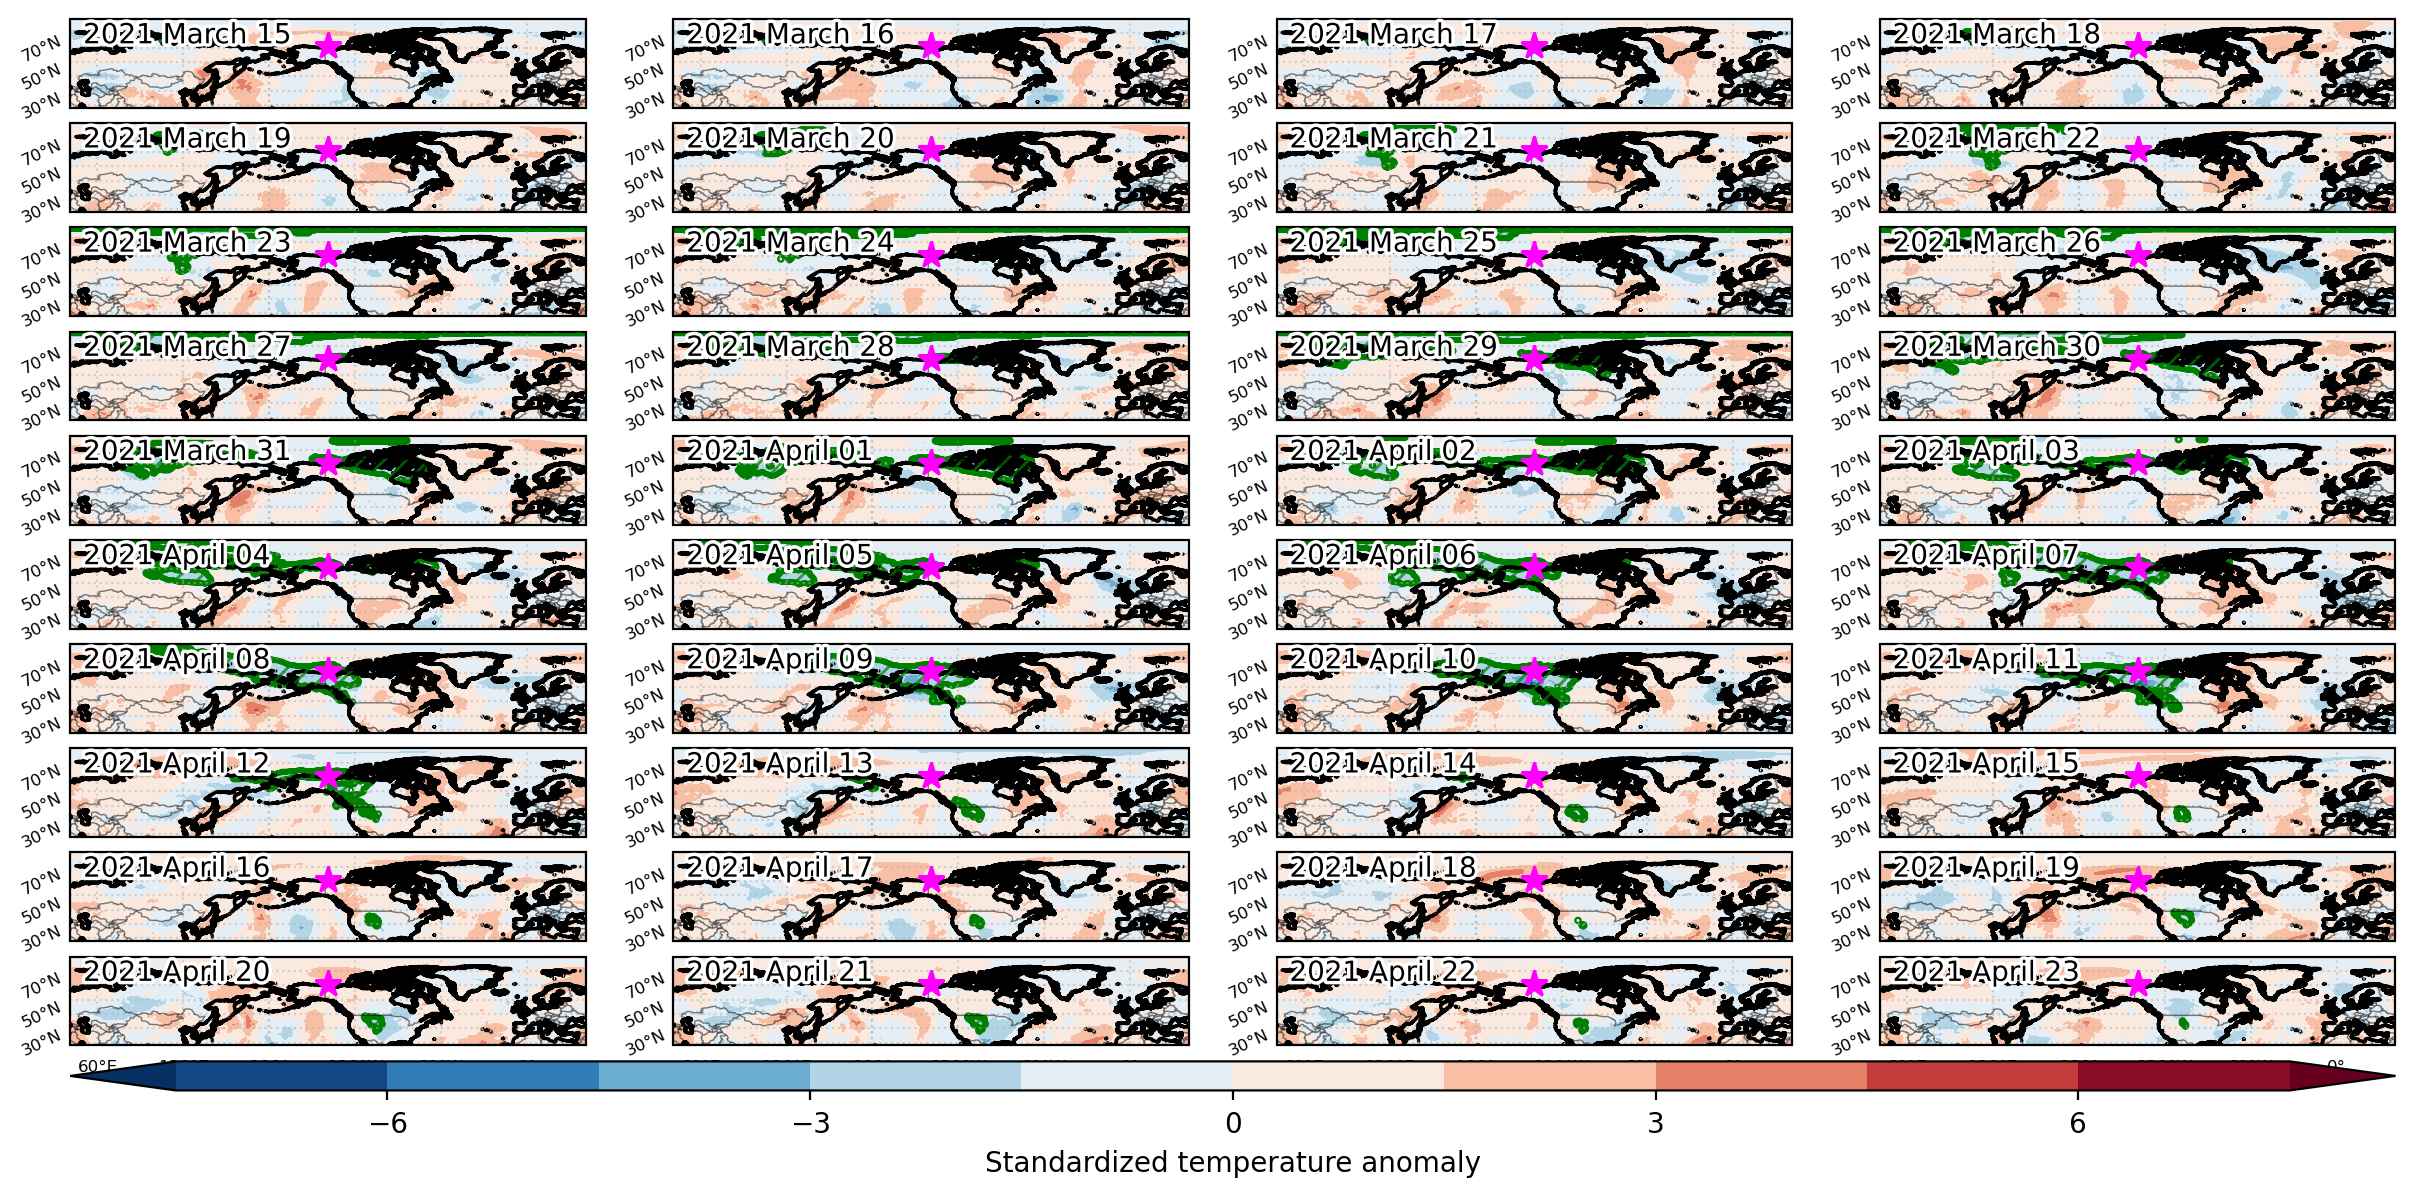
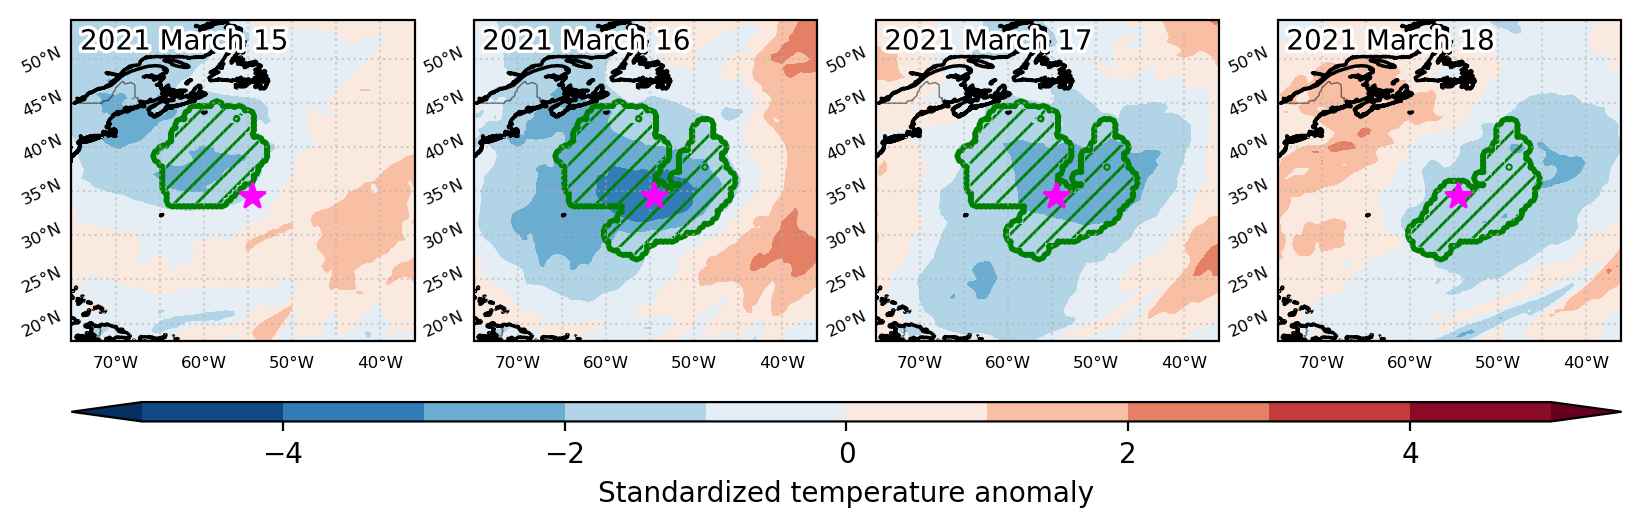
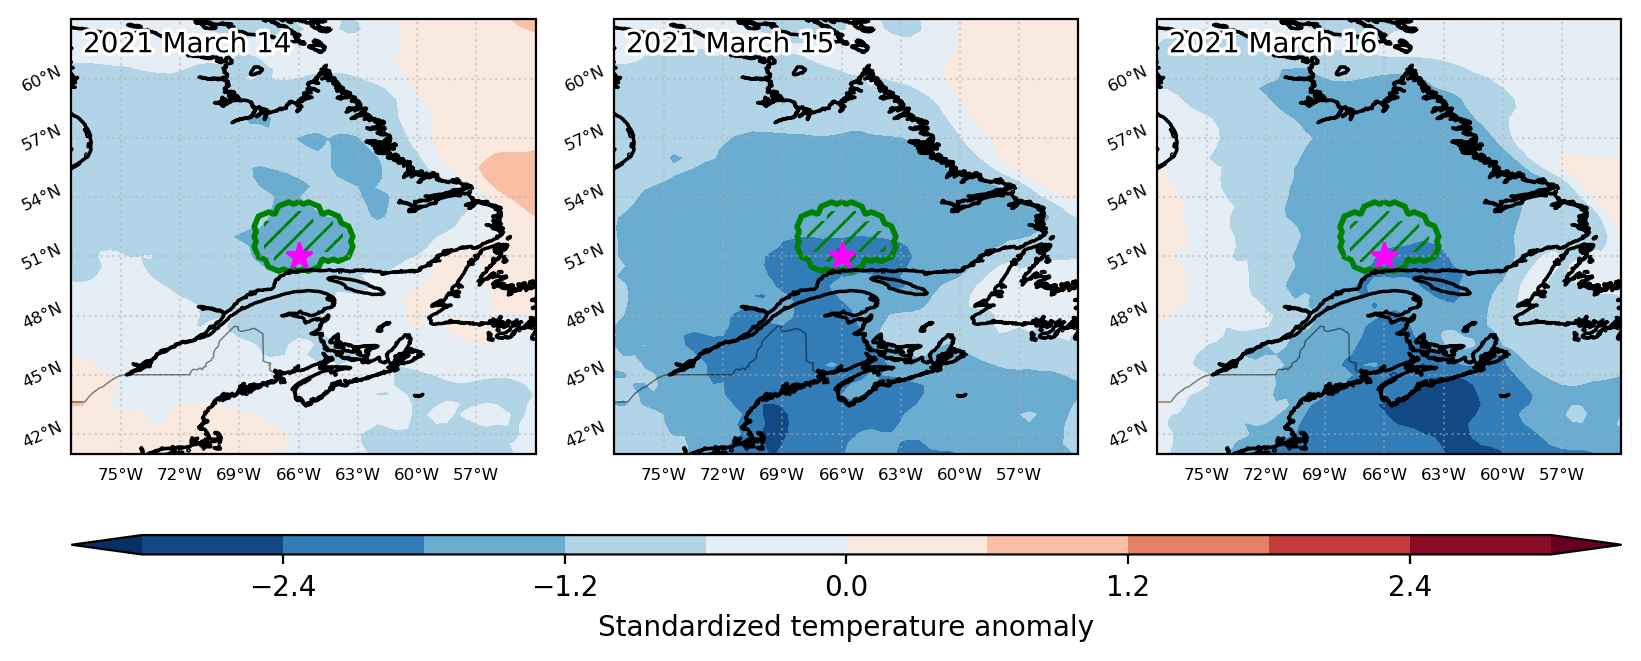
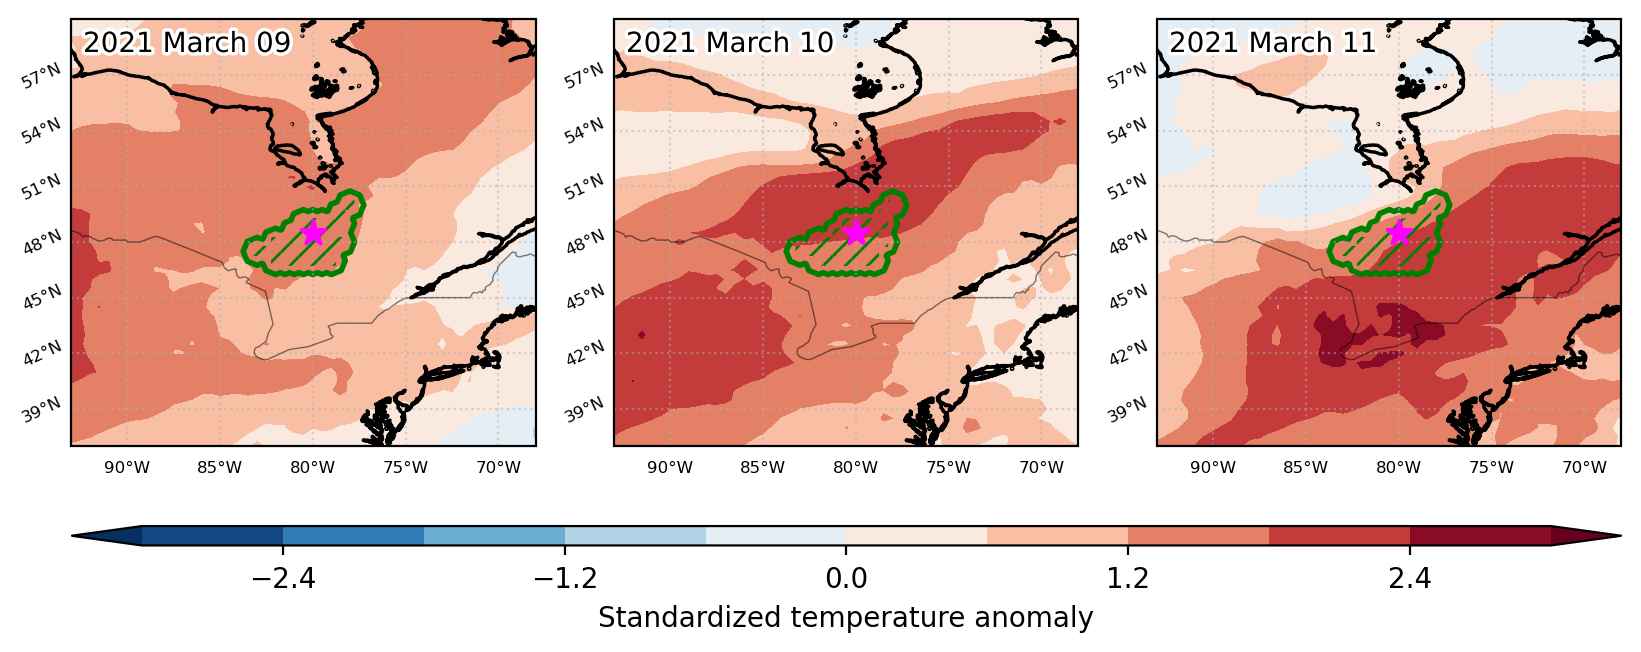
Fig. 3: Maps illustrating the evolution of standardized temperature anomalies during the event.
Event ID: Heat_wave_2021-Mar-28_to_2022-Nov-10_350.0_1.0