Cold spell occuring from June 18 2010 to June 23 2010 at 68.5°N 17.5°E

Download data: JSON

Event type: Cold spell

Countries affected (identified with ArcGIS Online; provided only for geographical reference):

  • Norway
  • Sweden

Duration: 6 days

Time span: June 18 2010 to June 23 2010

Statistics over entire affected area:

  • Mean temperature anomaly: -3.4 °C
  • Mean temperature: 5.8 °C
  • Minimum temperature anomaly: -7.2 °C
  • Minimum temperature: 0.3 °C

Event center: 68.5°N 17.5°E

Area affected: 245730 km$^2$
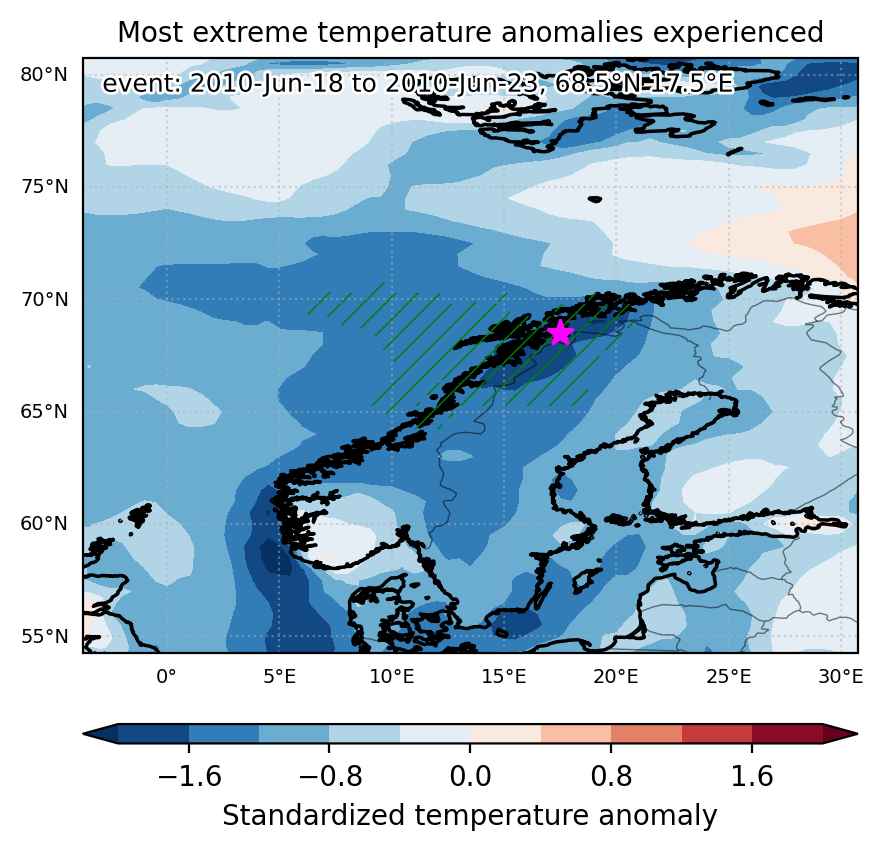

Fig. 1: Map of most extreme temperature anomalies (standardized) experienced during the event. The purple star indicates the center of the extreme event. Green hatching illustrates all areas under the effect of extremes at some time during the event.
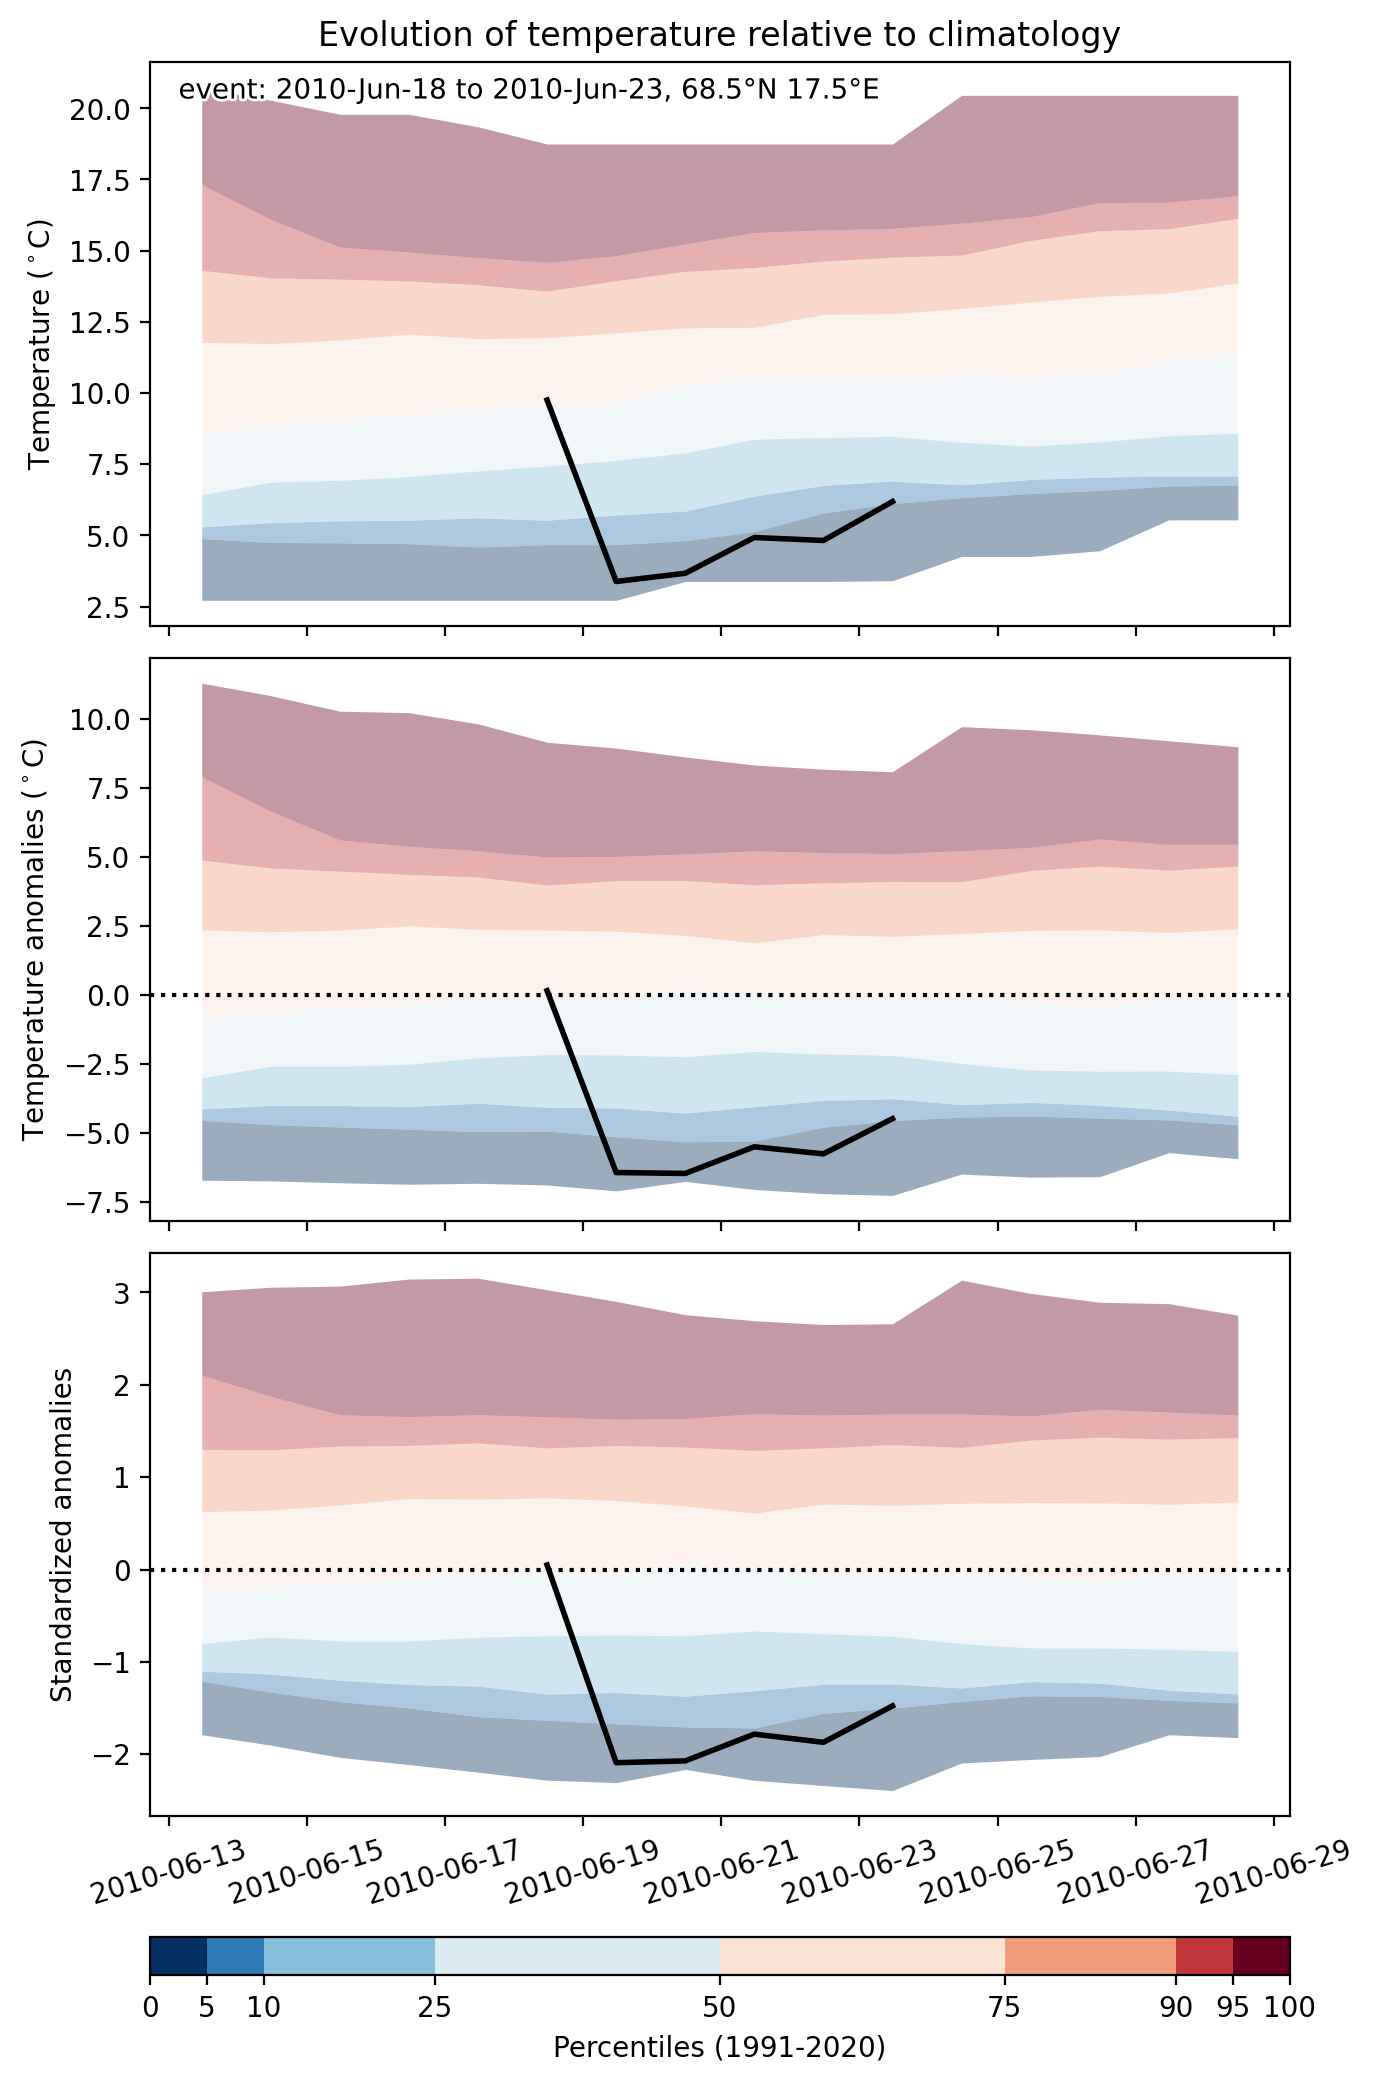


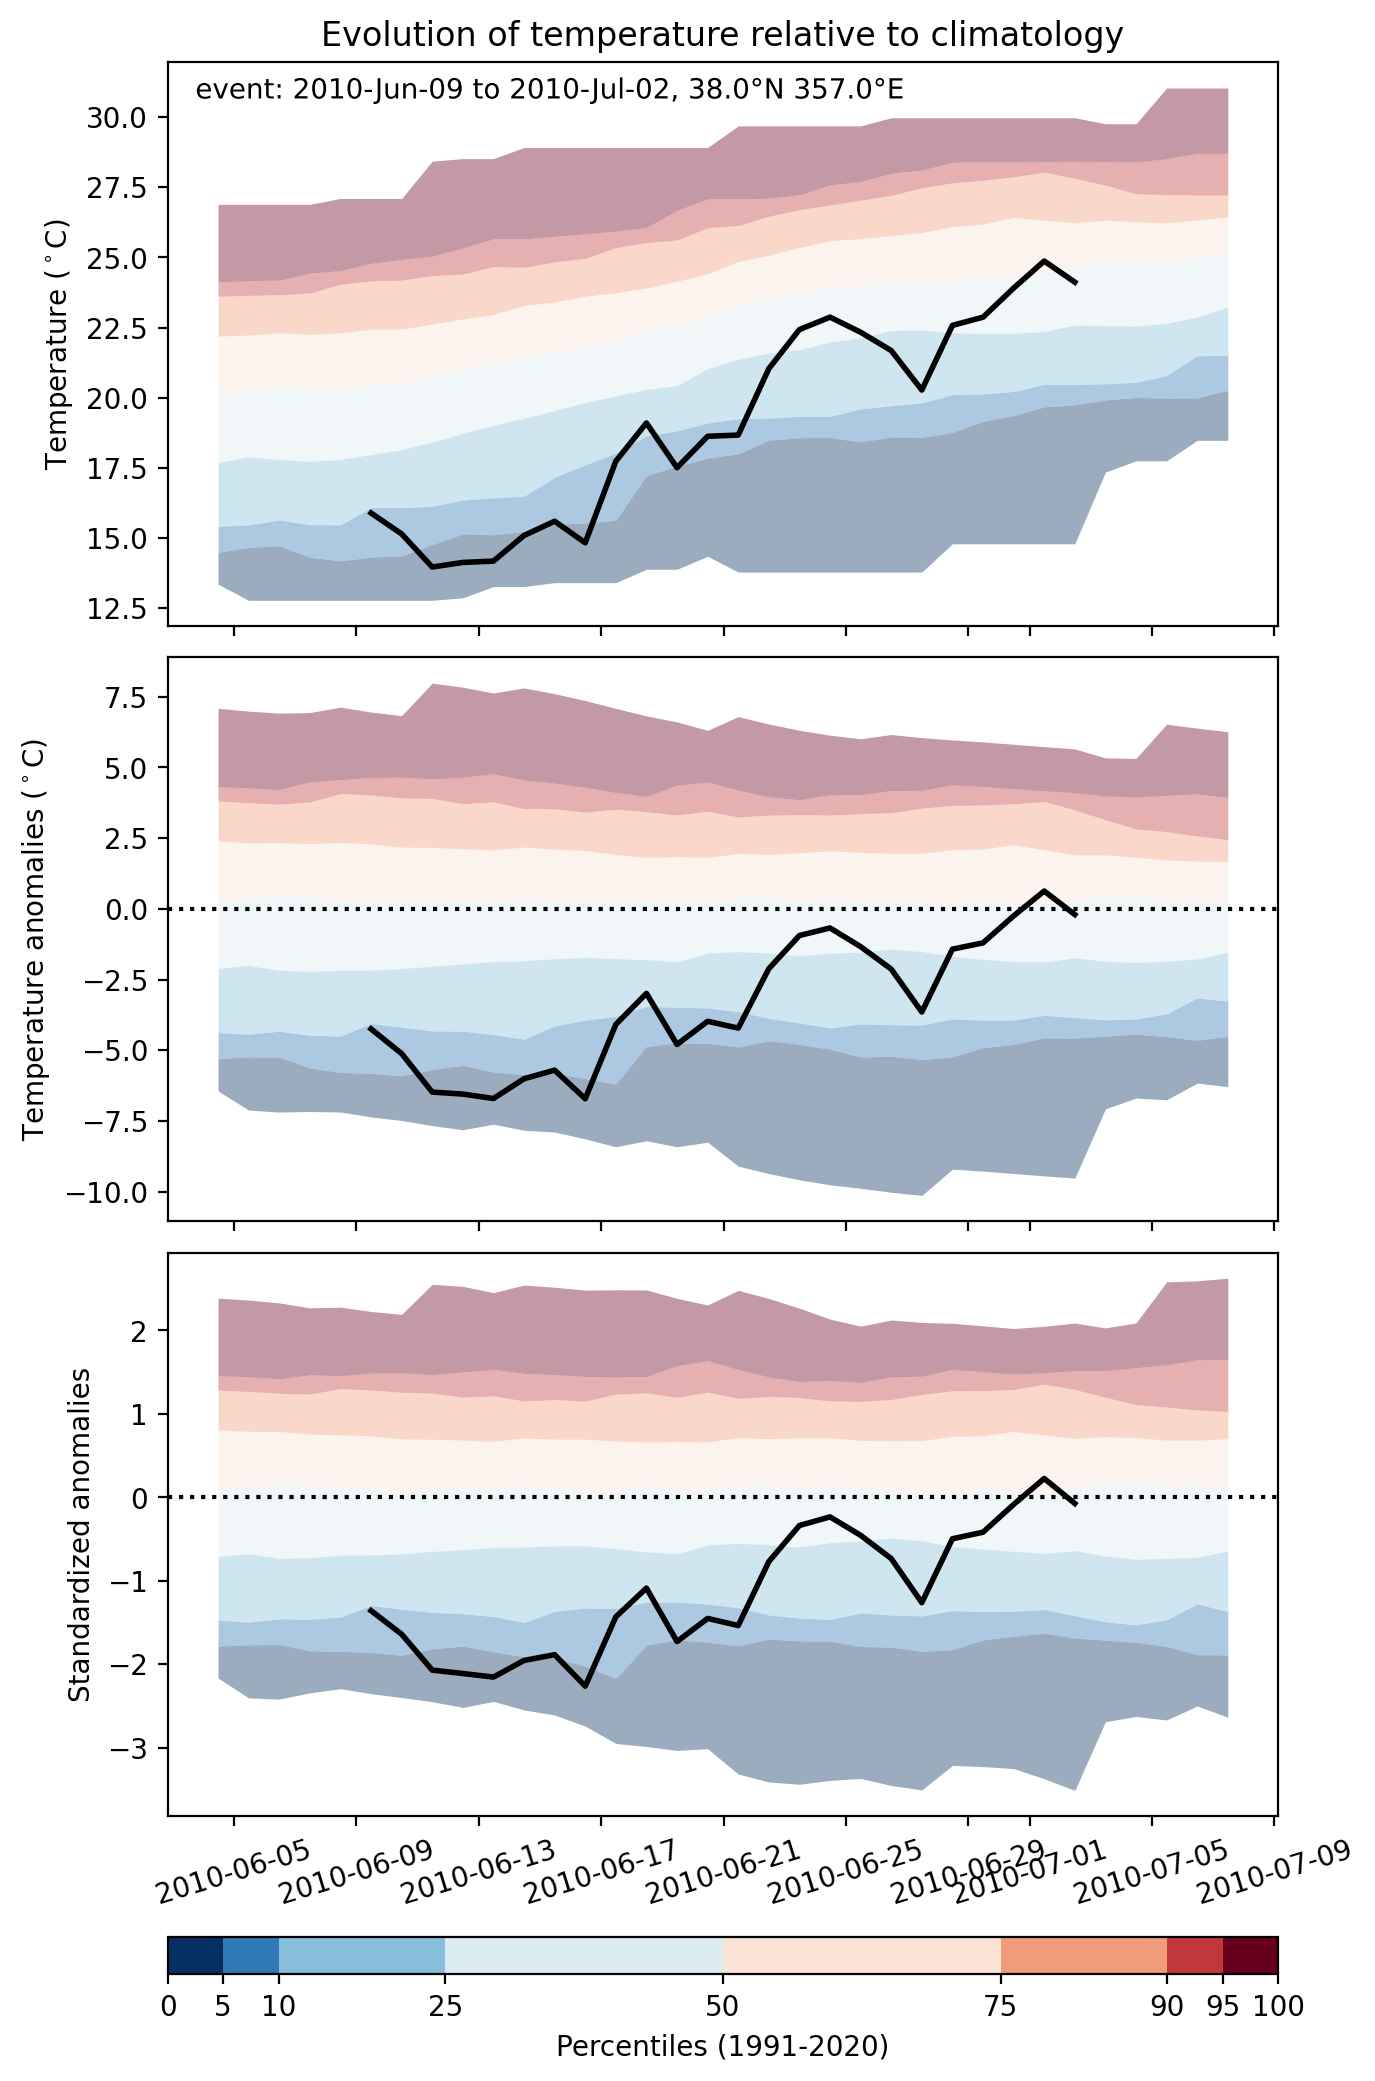
Fig. 2: Evolution of temperature at the center of the event. The climatological percentile distribution is illustrated with color shadings.
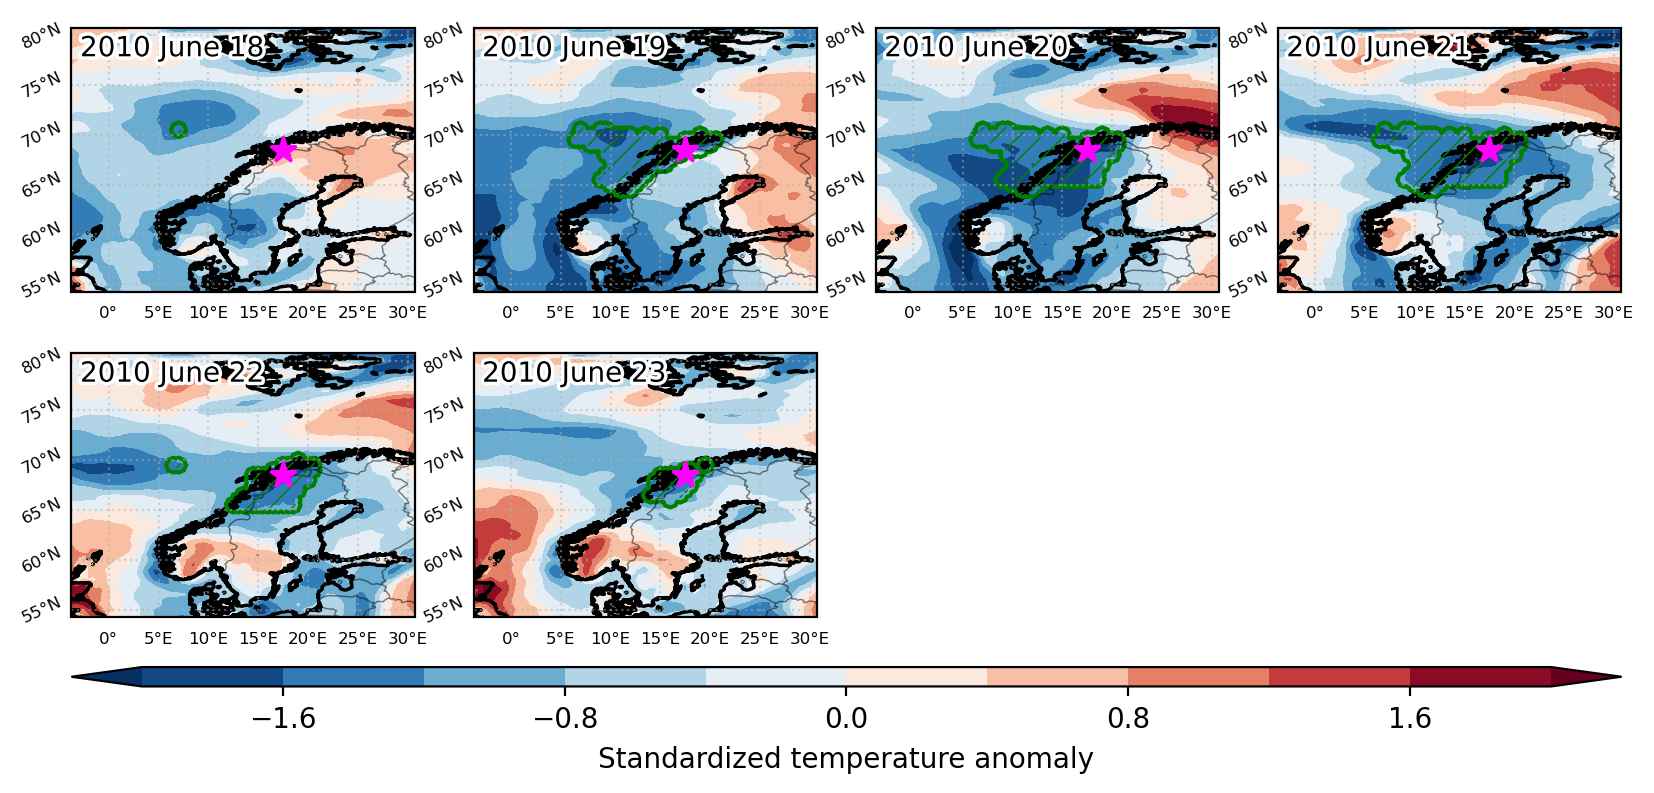


Fig. 3: Maps illustrating the evolution of standardized temperature anomalies during the event.

Event ID: Cold_spell_2010-Jun-18_to_2010-Jun-23_17.5_68.5
Cold spell occuring from June 09 2010 to July 02 2010 at 38.0°N 357.0°E

Download data: JSON

Event type: Cold spell

Countries affected (identified with ArcGIS Online; provided only for geographical reference):

  • Albania
  • Algeria
  • Andorra
  • Austria
  • Belgium
  • Bosnia and Herzegovina
  • Bulgaria
  • Croatia
  • Cyprus
  • Czech Republic
  • France
  • Germany
  • Greece
  • Iran
  • Iraq
  • Italy
  • Jordan
  • Kuwait
  • Lebanon
  • Libya
  • Luxembourg
  • Moldova
  • Montenegro
  • Netherlands
  • North Macedonia
  • Norway
  • Oman
  • Portugal
  • Qatar
  • Romania
  • Saudi Arabia
  • Serbia
  • Spain
  • Switzerland
  • Syria
  • Tunisia
  • Turkiye
  • Ukraine
  • United Arab Emirates
  • Yemen

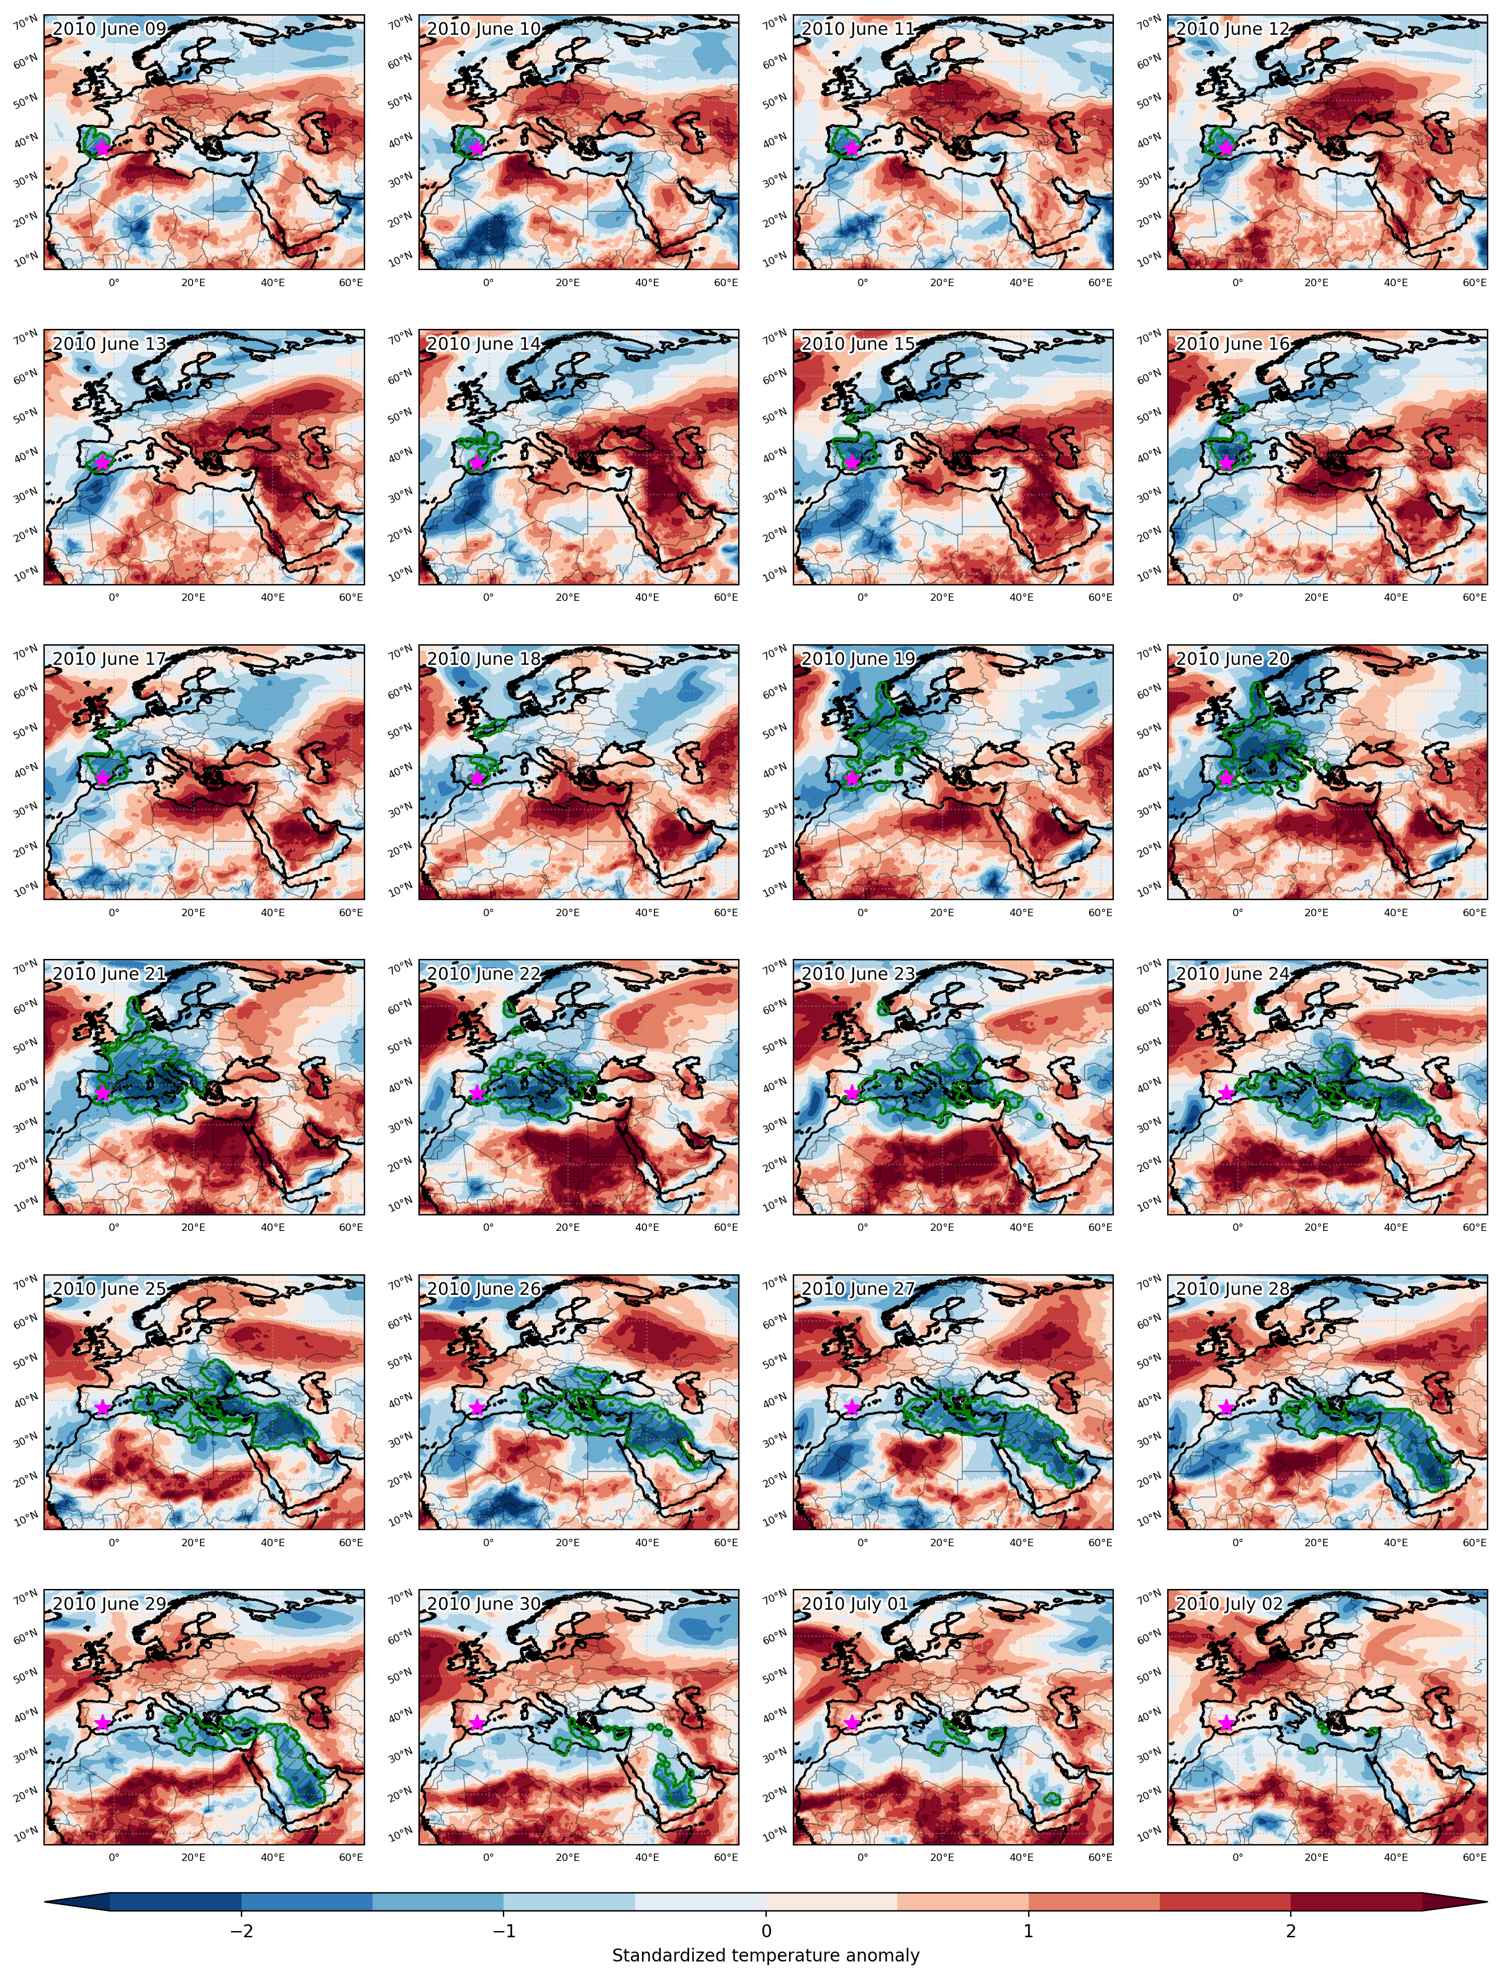
Duration: 24 days

Time span: June 09 2010 to July 02 2010

Statistics over entire affected area:

  • Mean temperature anomaly: -3.7 °C
  • Mean temperature: 20.9 °C
  • Minimum temperature anomaly: -9.8 °C
  • Minimum temperature: -0.5 °C

Event center: 38.0°N 3.0°W

Area affected: 6691109 km$^2$


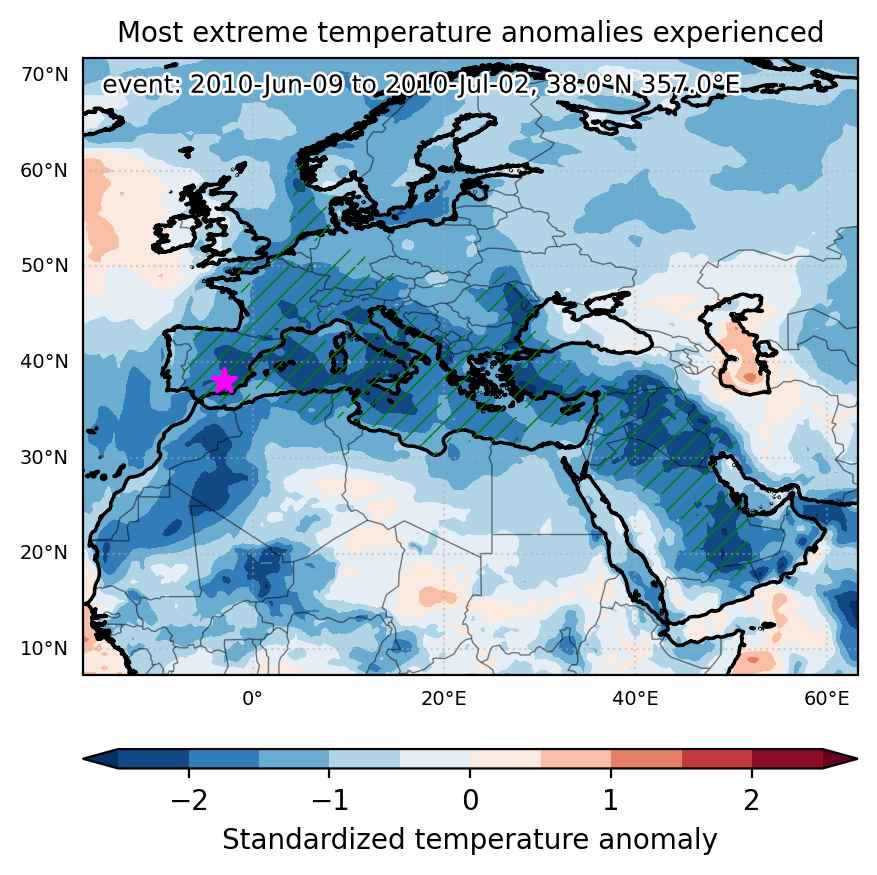
Fig. 1: Map of most extreme temperature anomalies (standardized) experienced during the event. The purple star indicates the center of the extreme event. Green hatching illustrates all areas under the effect of extremes at some time during the event.


Fig. 2: Evolution of temperature at the center of the event. The climatological percentile distribution is illustrated with color shadings.


Fig. 3: Maps illustrating the evolution of standardized temperature anomalies during the event.

Event ID: Cold_spell_2010-Jun-09_to_2010-Jul-02_357.0_38.0

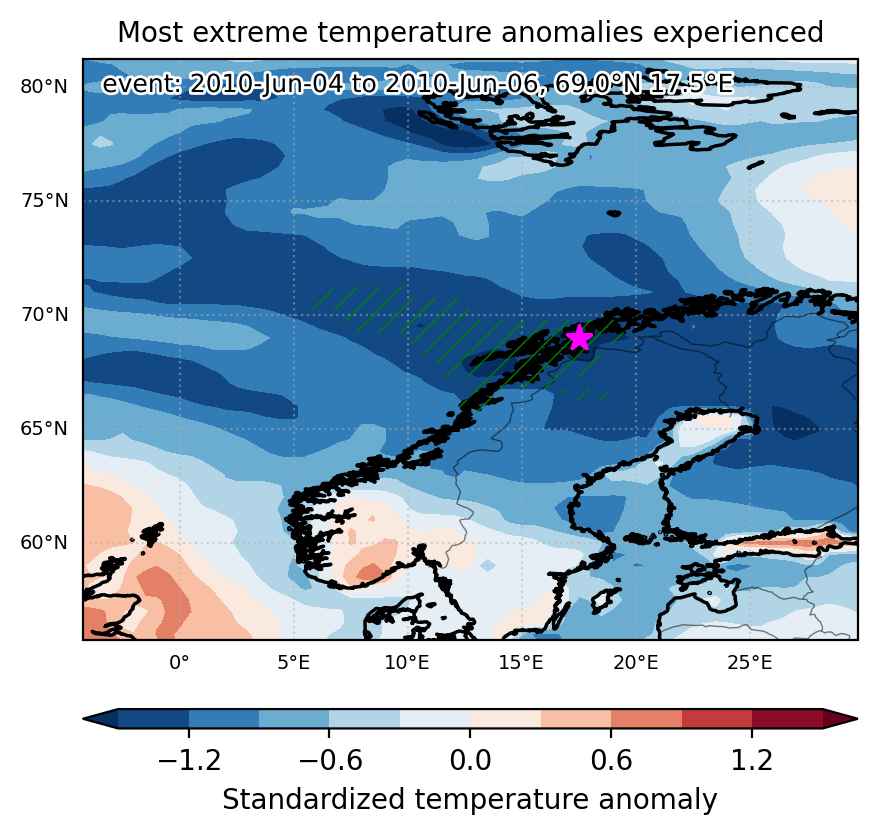
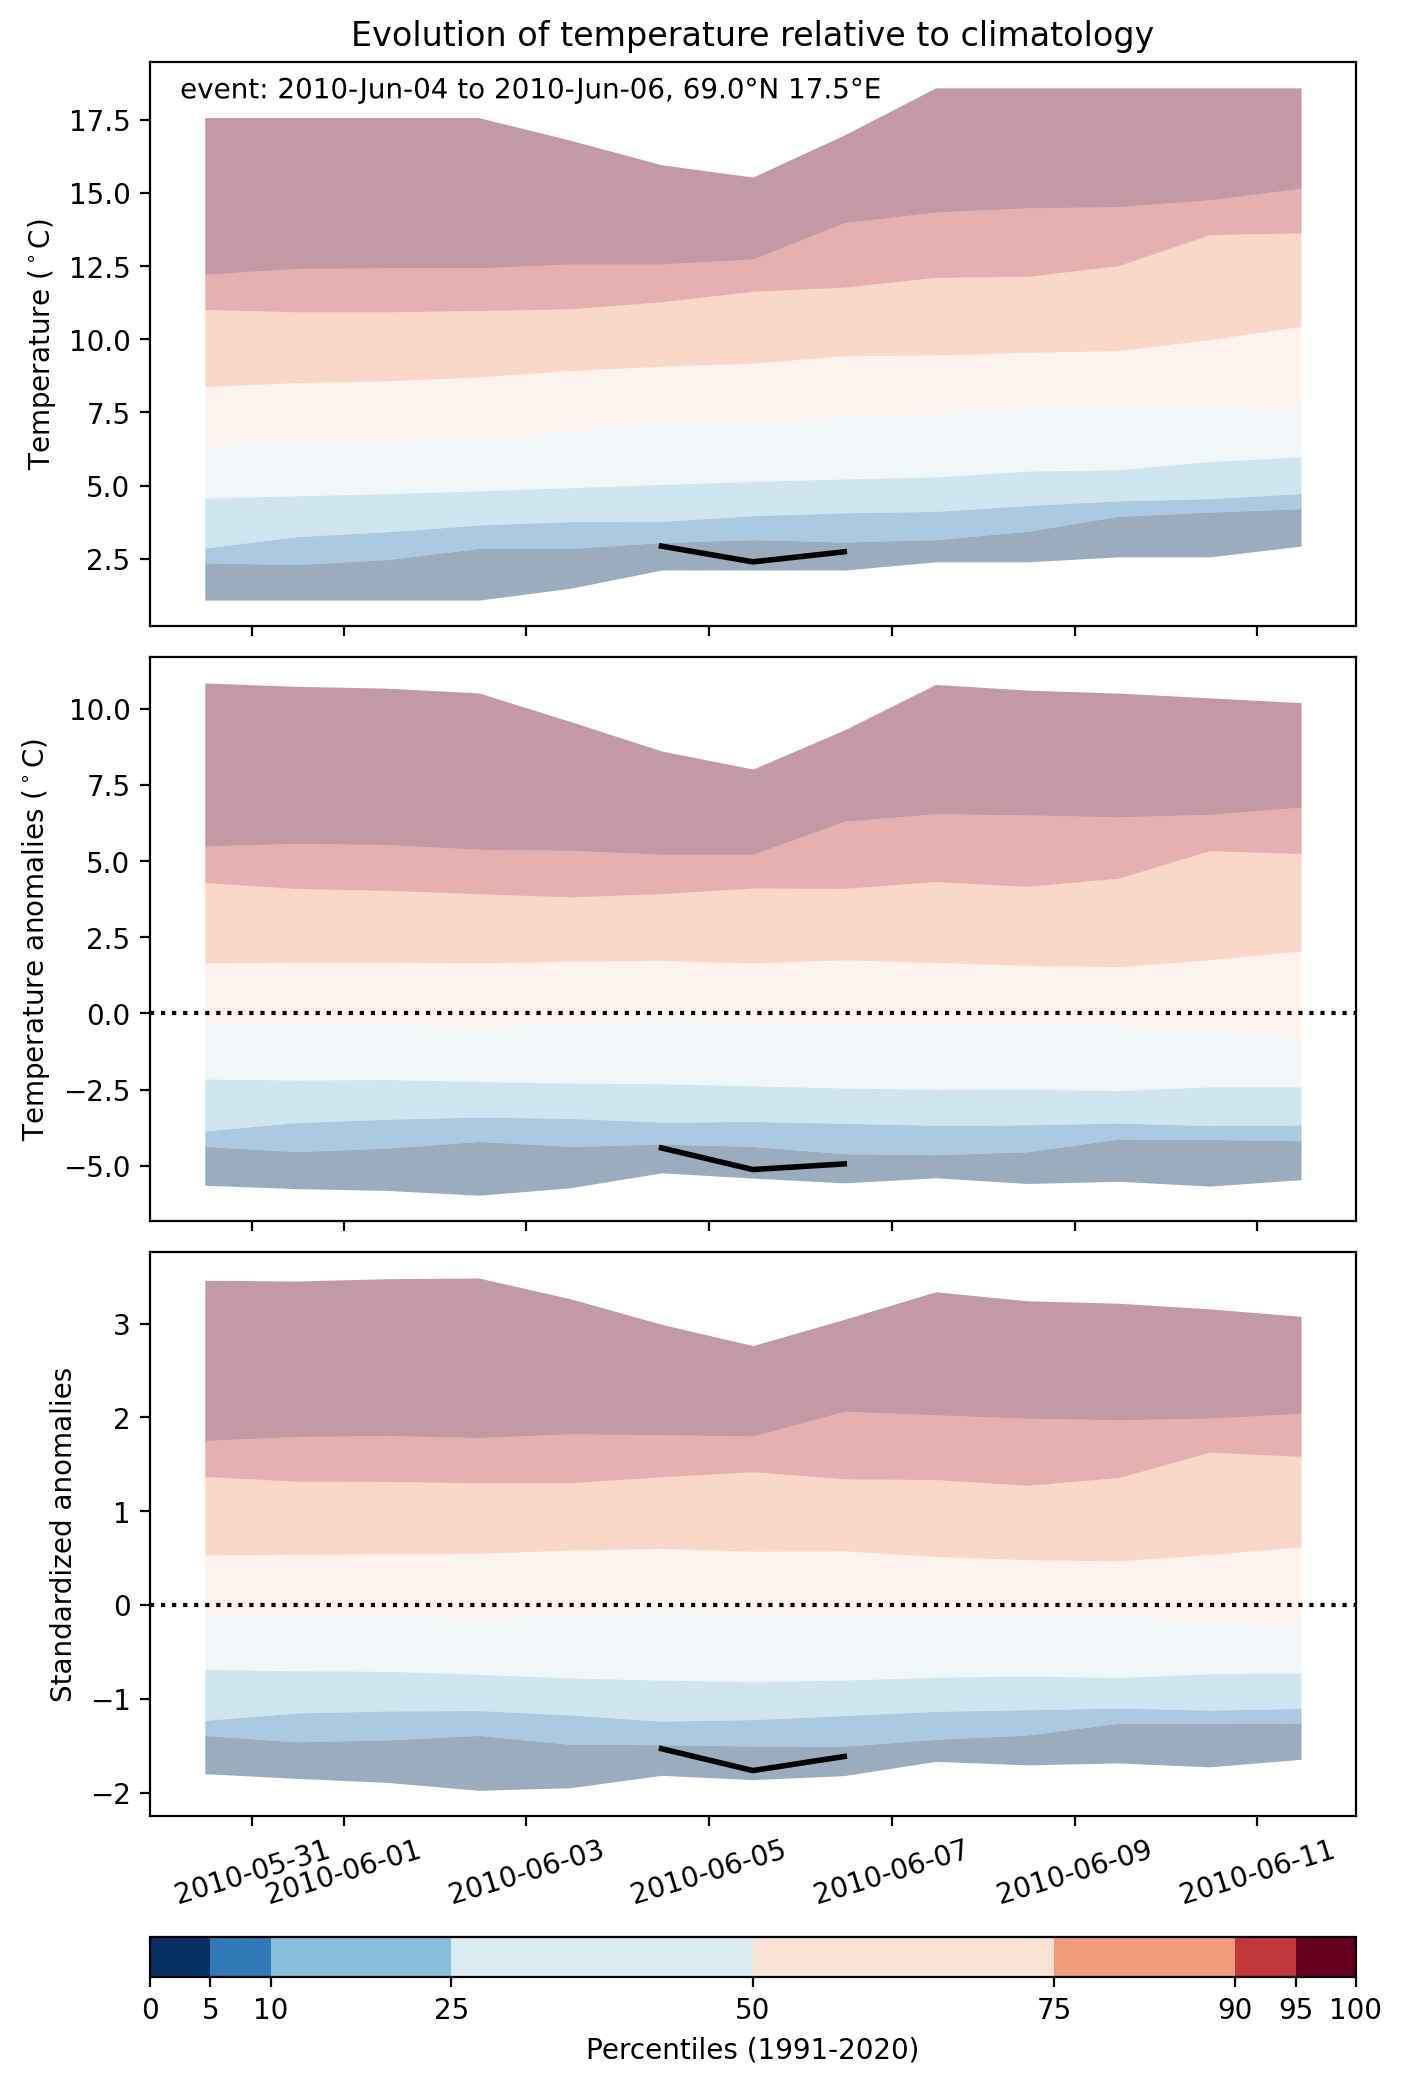
Cold spell occuring from June 04 2010 to June 06 2010 at 69.0°N 17.5°E

Download data: JSON

Event type: Cold spell

Countries affected (identified with ArcGIS Online; provided only for geographical reference):

  • Norway
  • Sweden

Duration: 3 days

Time span: June 04 2010 to June 06 2010

Statistics over entire affected area:

  • Mean temperature anomaly: -3.2 °C
  • Mean temperature: 3.9 °C
  • Minimum temperature anomaly: -6.8 °C
  • Minimum temperature: -2.9 °C

Event center: 69.0°N 17.5°E

Area affected: 155273 km$^2$


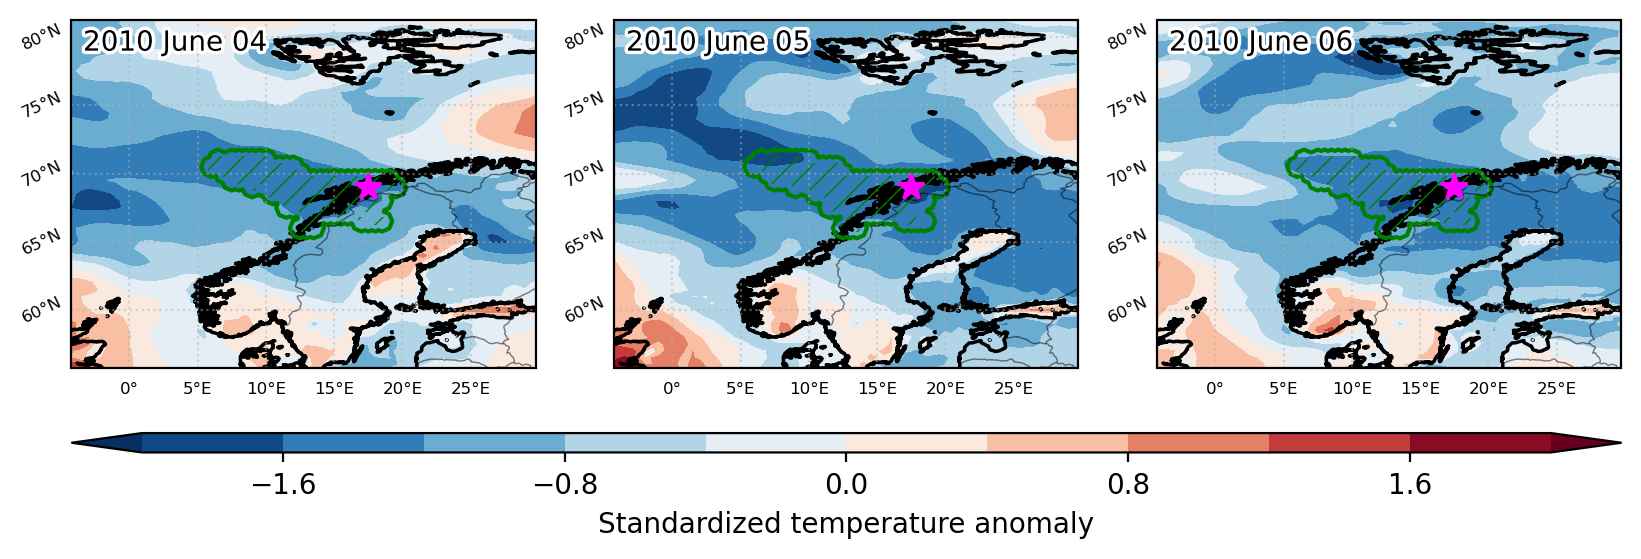
Fig. 1: Map of most extreme temperature anomalies (standardized) experienced during the event. The purple star indicates the center of the extreme event. Green hatching illustrates all areas under the effect of extremes at some time during the event.


Fig. 2: Evolution of temperature at the center of the event. The climatological percentile distribution is illustrated with color shadings.


Fig. 3: Maps illustrating the evolution of standardized temperature anomalies during the event.

Event ID: Cold_spell_2010-Jun-04_to_2010-Jun-06_17.5_69.0

Cold spell occuring from May 24 2010 to May 29 2010 at 58.0°N 7.0°E

Download data: JSON

Event type: Cold spell

Countries affected (identified with ArcGIS Online; provided only for geographical reference):

  • Denmark
  • Norway

Duration: 6 days

Time span: May 24 2010 to May 29 2010

Statistics over entire affected area:

  • Mean temperature anomaly: -2.9 °C
  • Mean temperature: 8.5 °C
  • Minimum temperature anomaly: -4.5 °C
  • Minimum temperature: 5.3 °C

Event center: 58.0°N 7.0°E

Area affected: 116297 km$^2$


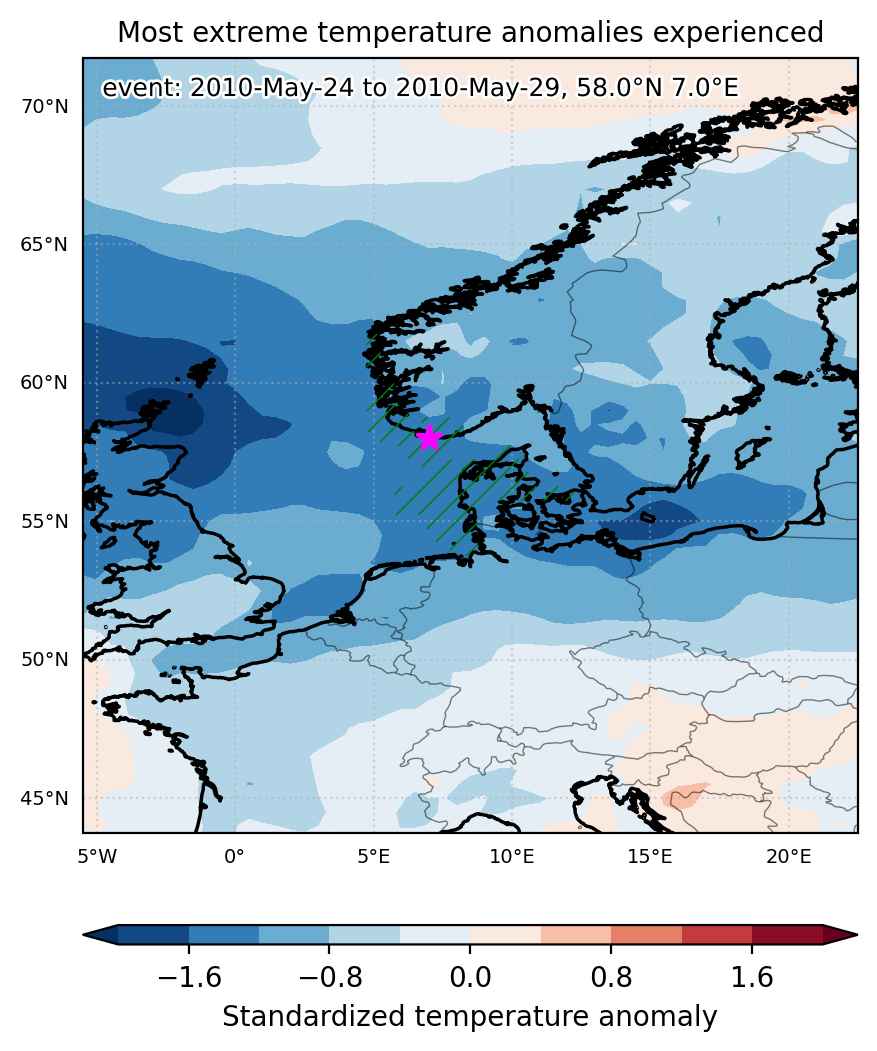
Fig. 1: Map of most extreme temperature anomalies (standardized) experienced during the event. The purple star indicates the center of the extreme event. Green hatching illustrates all areas under the effect of extremes at some time during the event.


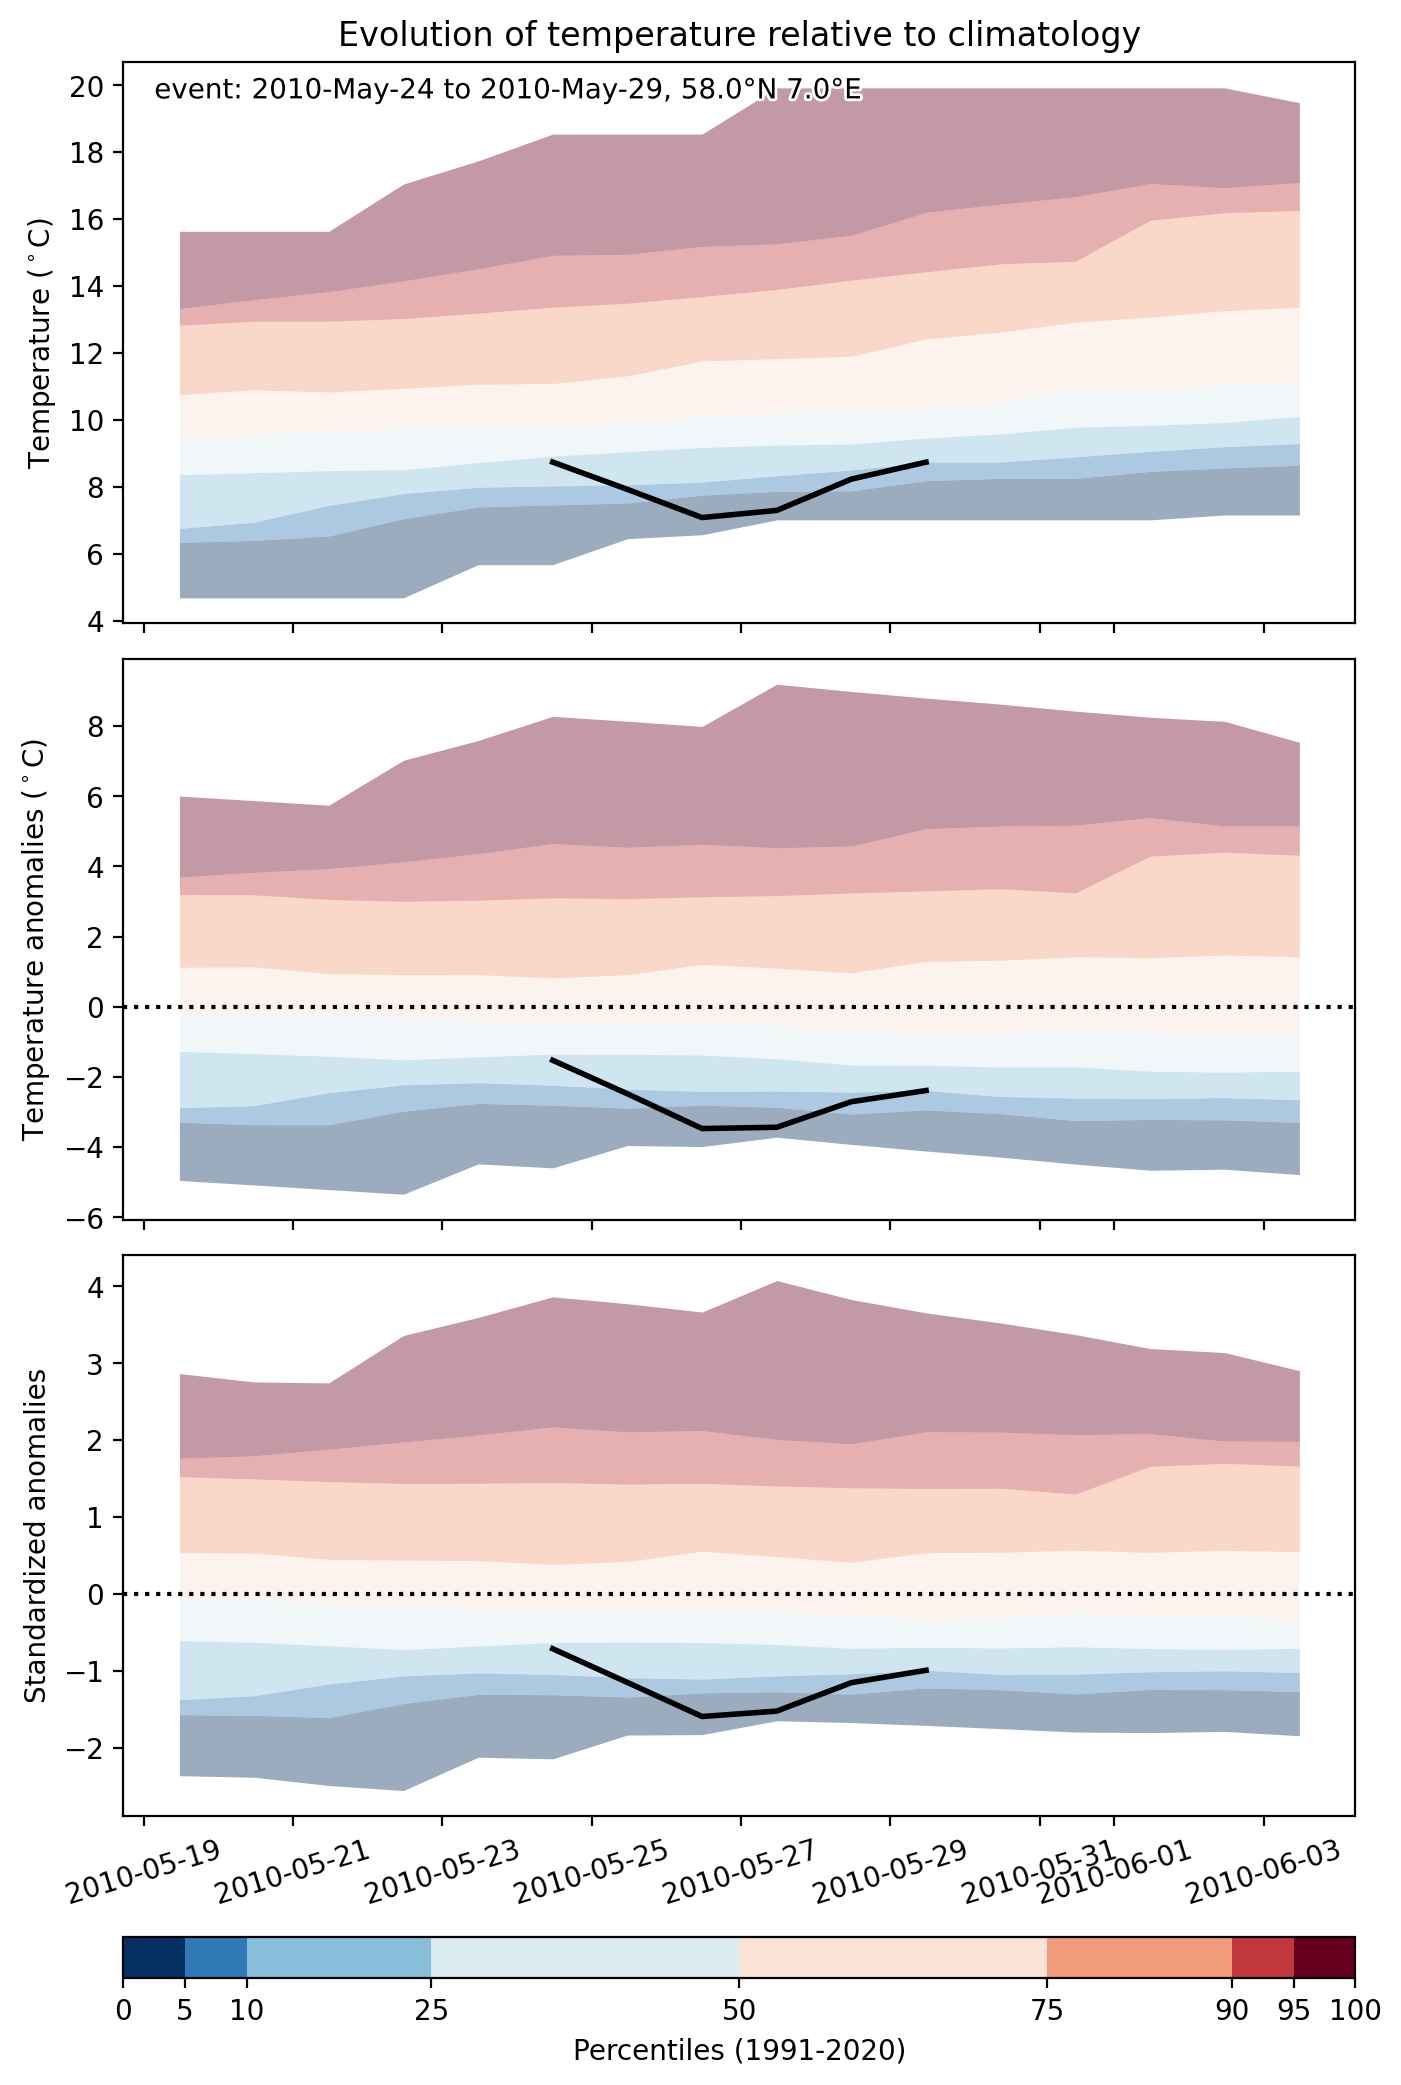
Fig. 2: Evolution of temperature at the center of the event. The climatological percentile distribution is illustrated with color shadings.


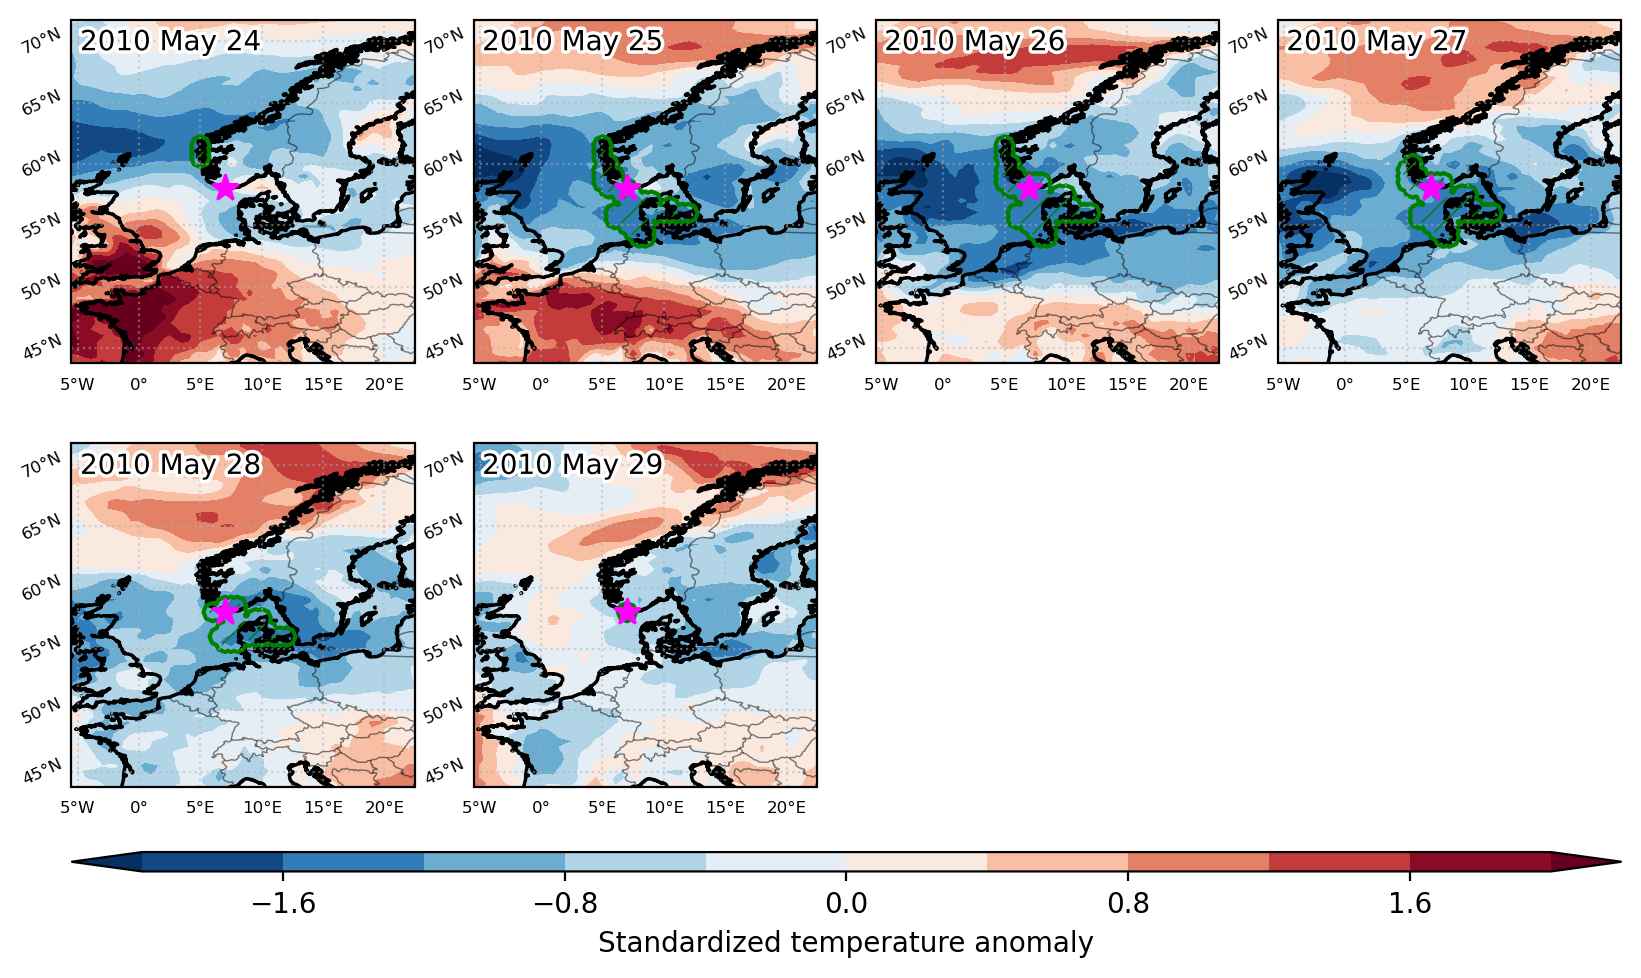
Fig. 3: Maps illustrating the evolution of standardized temperature anomalies during the event.

Event ID: Cold_spell_2010-May-24_to_2010-May-29_7.0_58.0

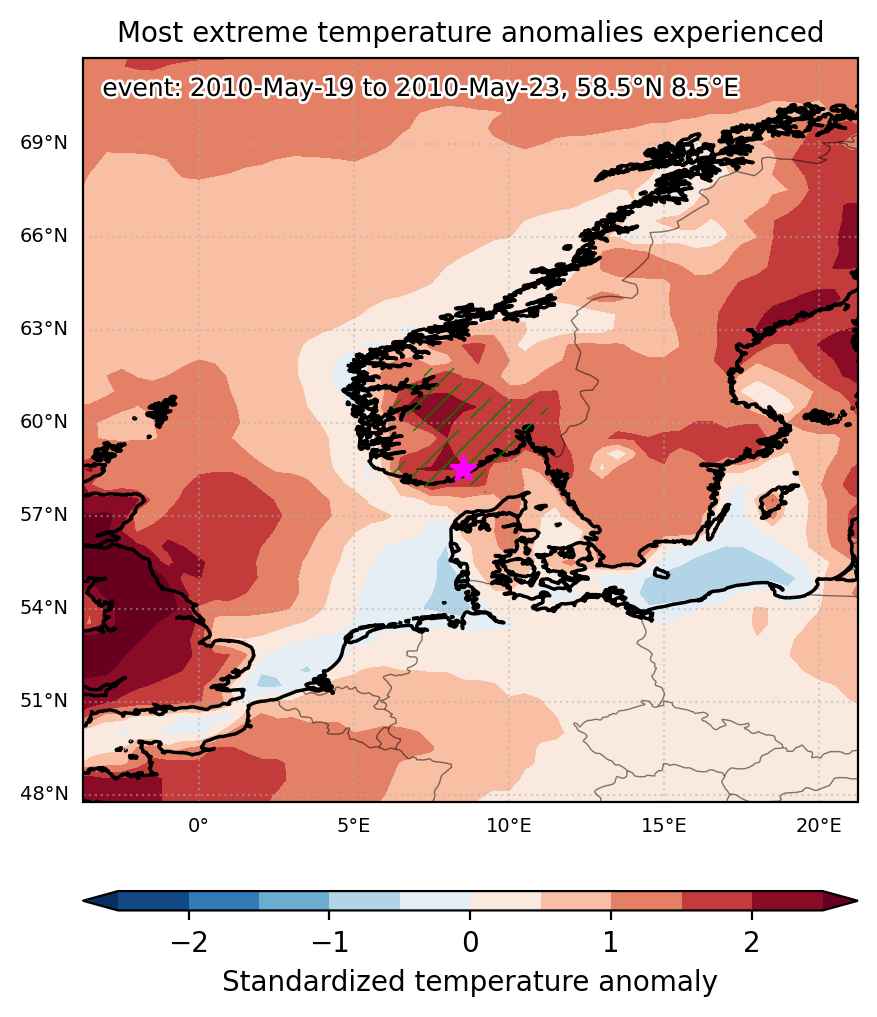
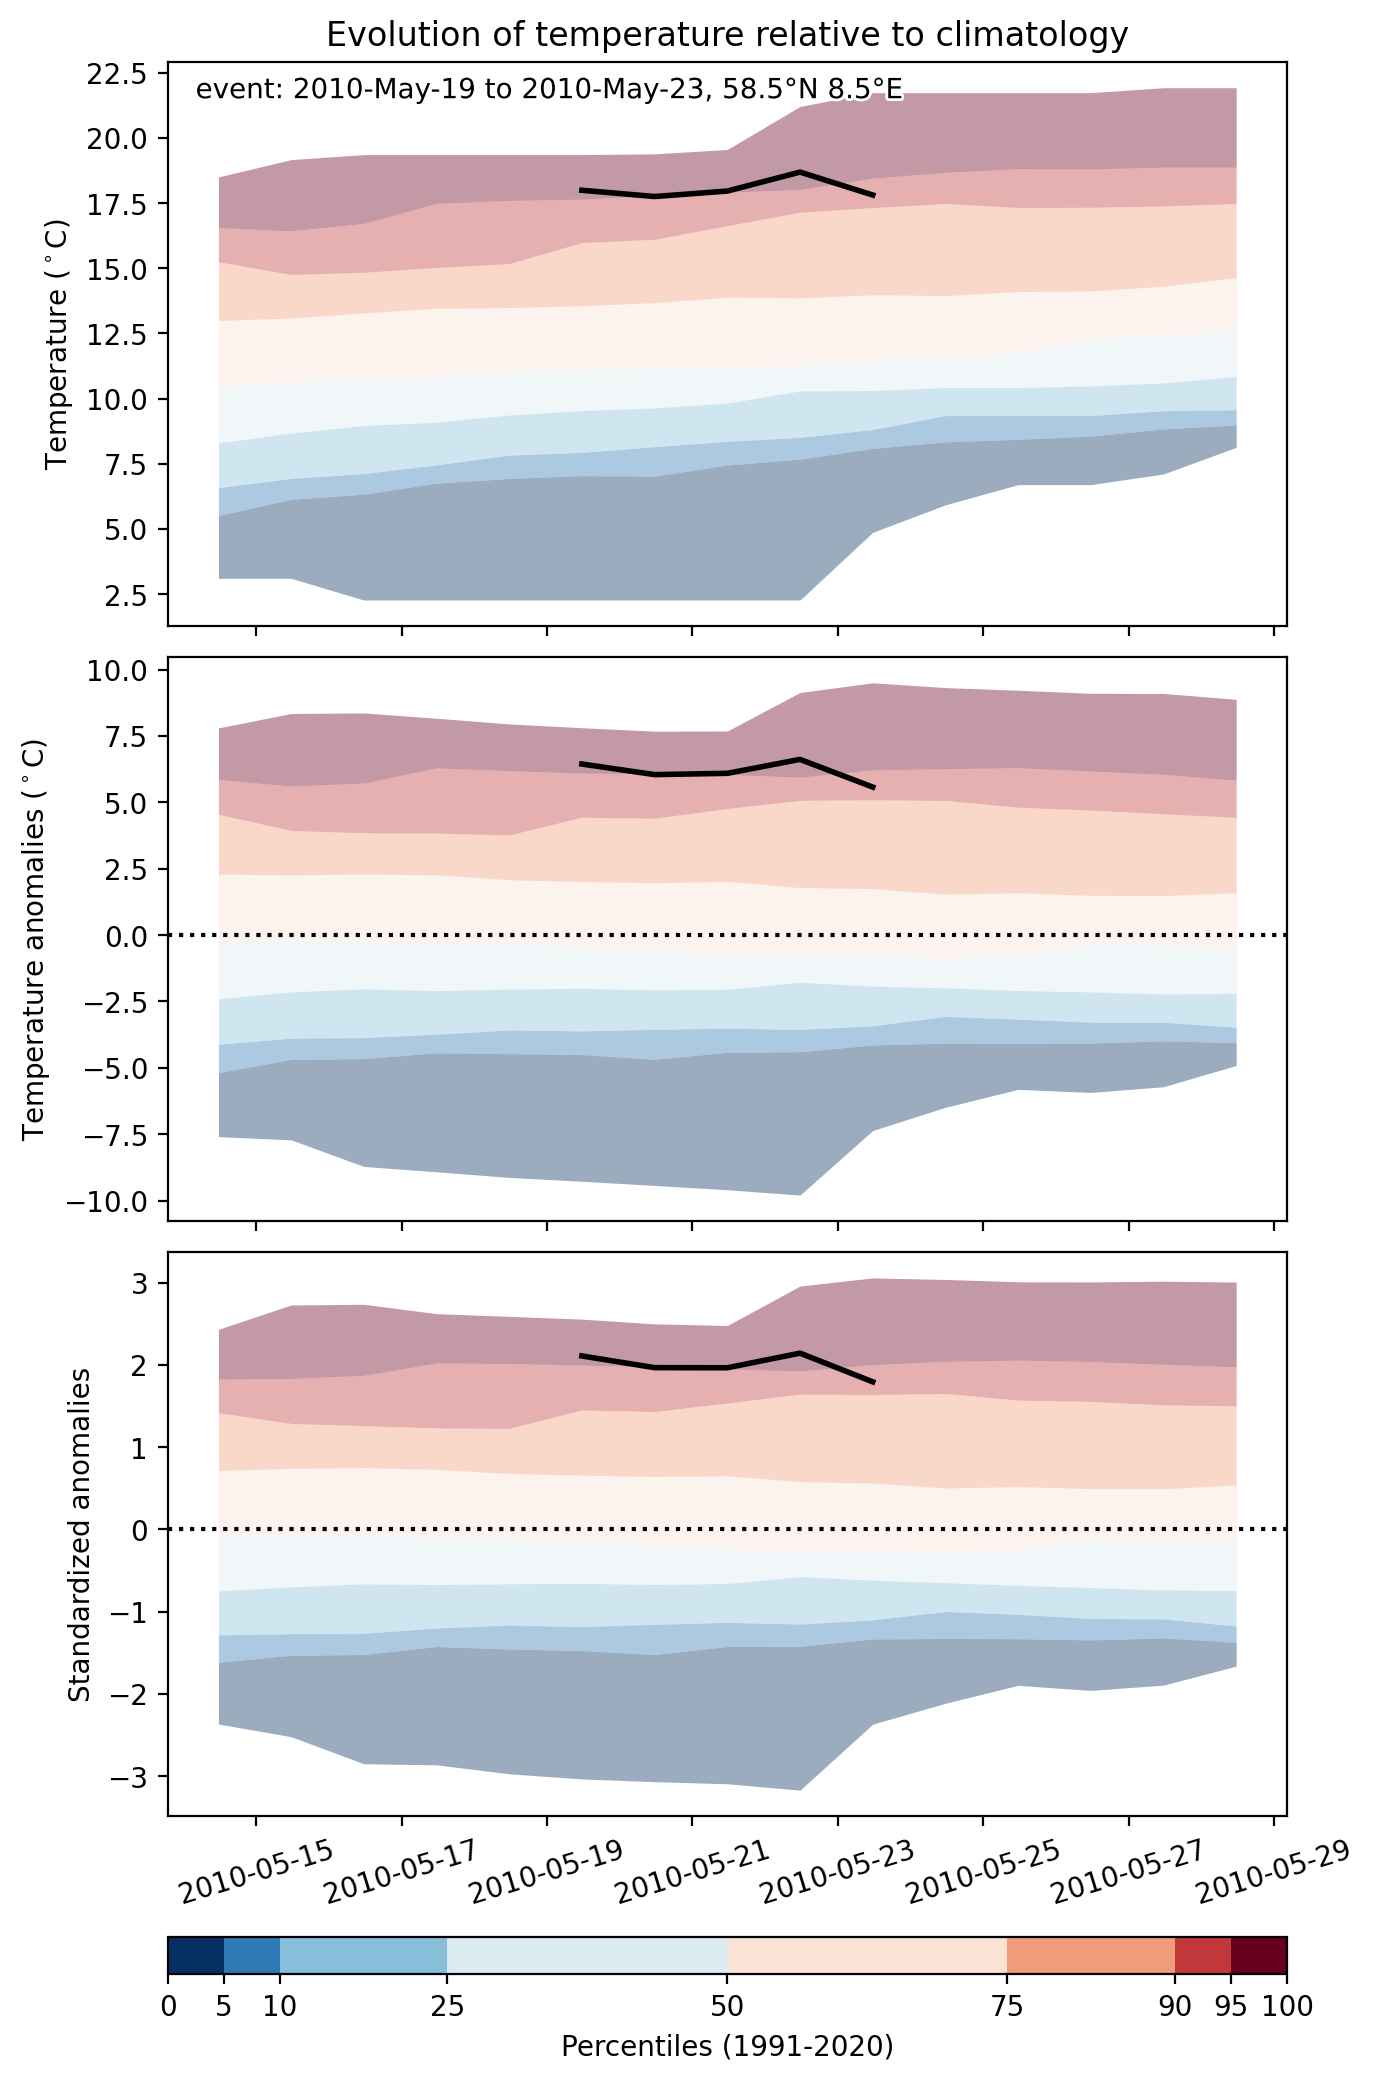
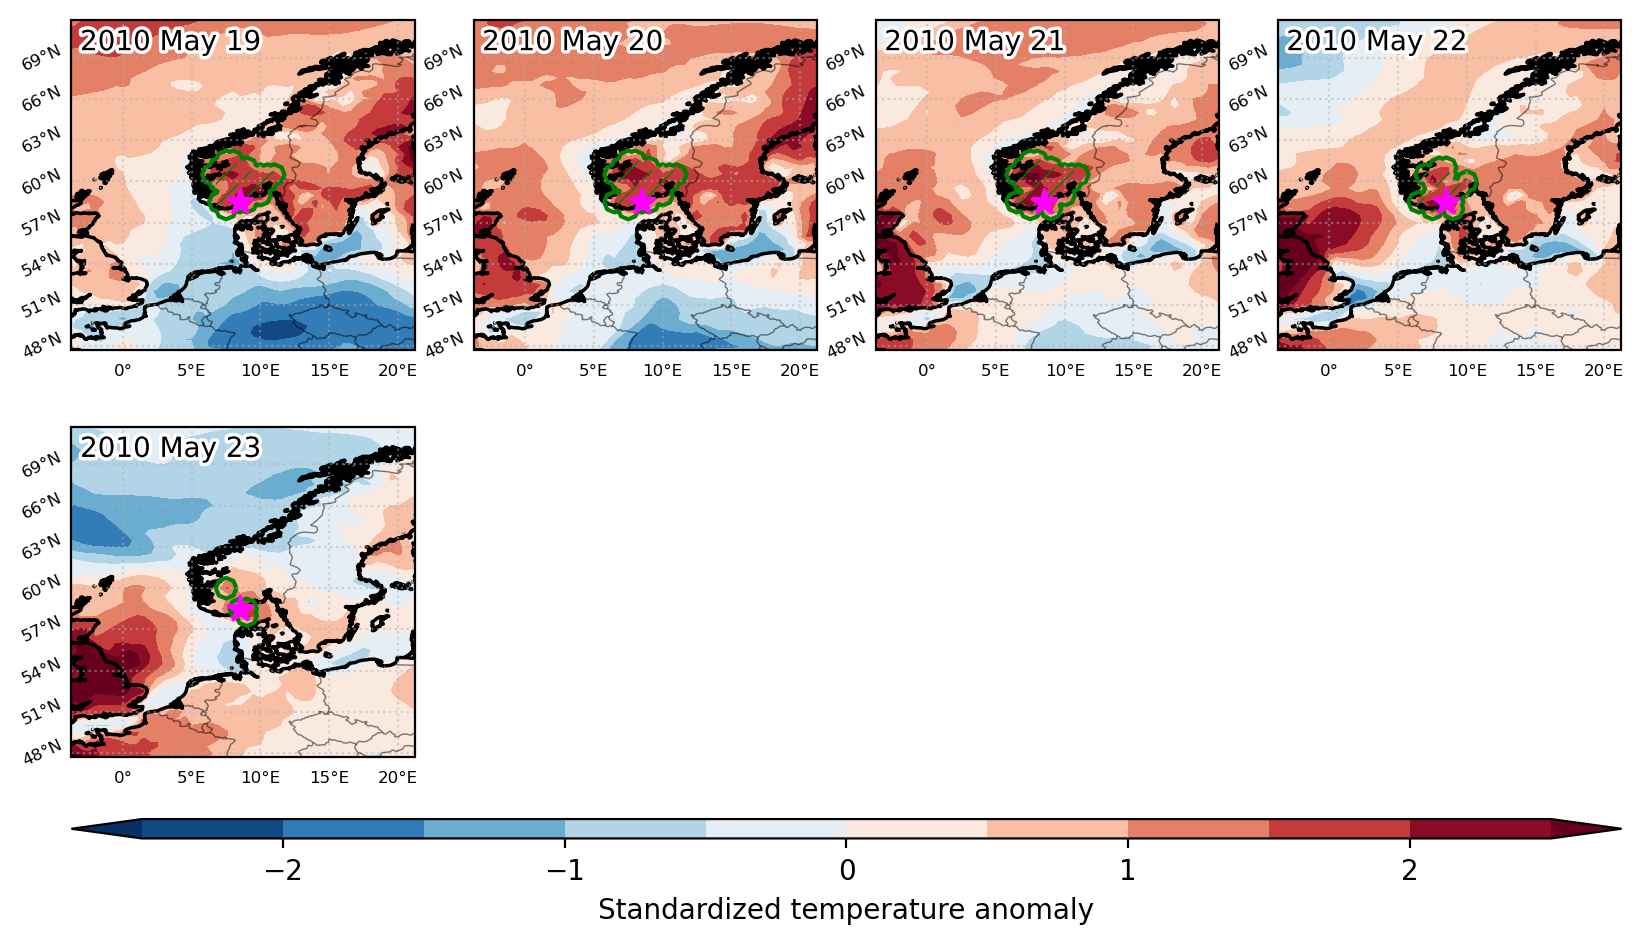
Heat wave occuring from May 19 2010 to May 23 2010 at 58.5°N 8.5°E

Download data: JSON

Event type: Heat wave

Countries affected (identified with ArcGIS Online; provided only for geographical reference):

  • Norway

Duration: 5 days

Time span: May 19 2010 to May 23 2010

Statistics over entire affected area:

  • Mean temperature anomaly: 5.8 °C
  • Mean temperature: 13.6 °C
  • Maximum temperature anomaly: 8.3 °C
  • Maximum temperature: 18.7 °C

Event center: 58.5°N 8.5°E

Area affected: 66845 km$^2$


Fig. 1: Map of most extreme temperature anomalies (standardized) experienced during the event. The purple star indicates the center of the extreme event. Green hatching illustrates all areas under the effect of extremes at some time during the event.


Fig. 2: Evolution of temperature at the center of the event. The climatological percentile distribution is illustrated with color shadings.


Fig. 3: Maps illustrating the evolution of standardized temperature anomalies during the event.

Event ID: Heat_wave_2010-May-19_to_2010-May-23_8.5_58.5

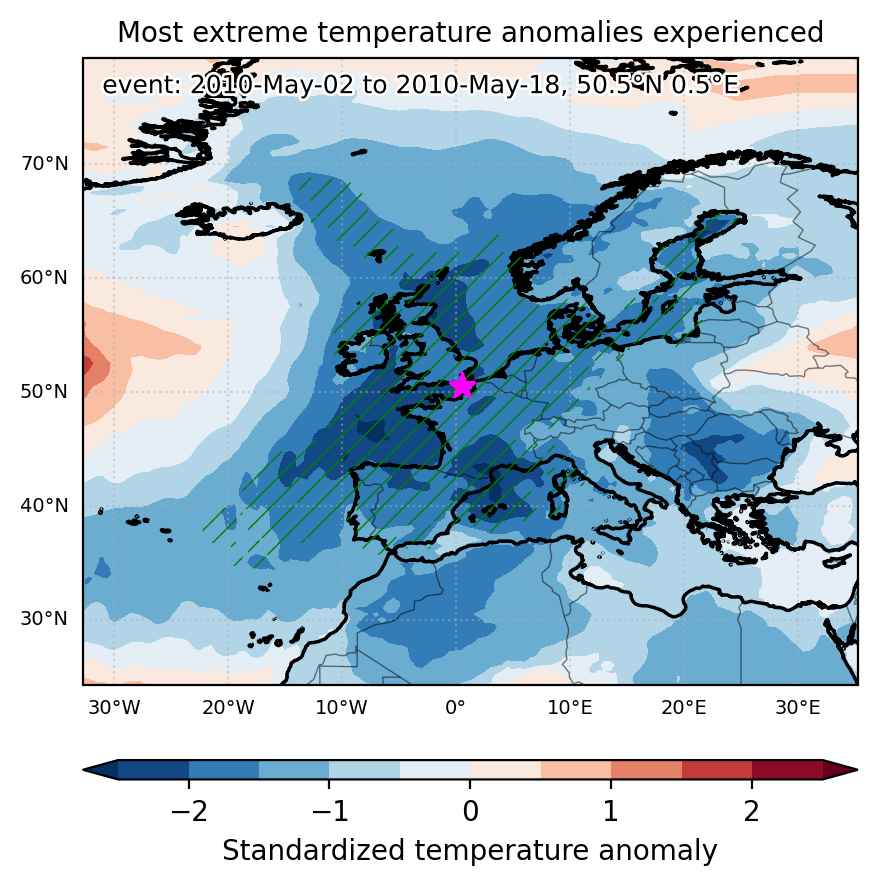
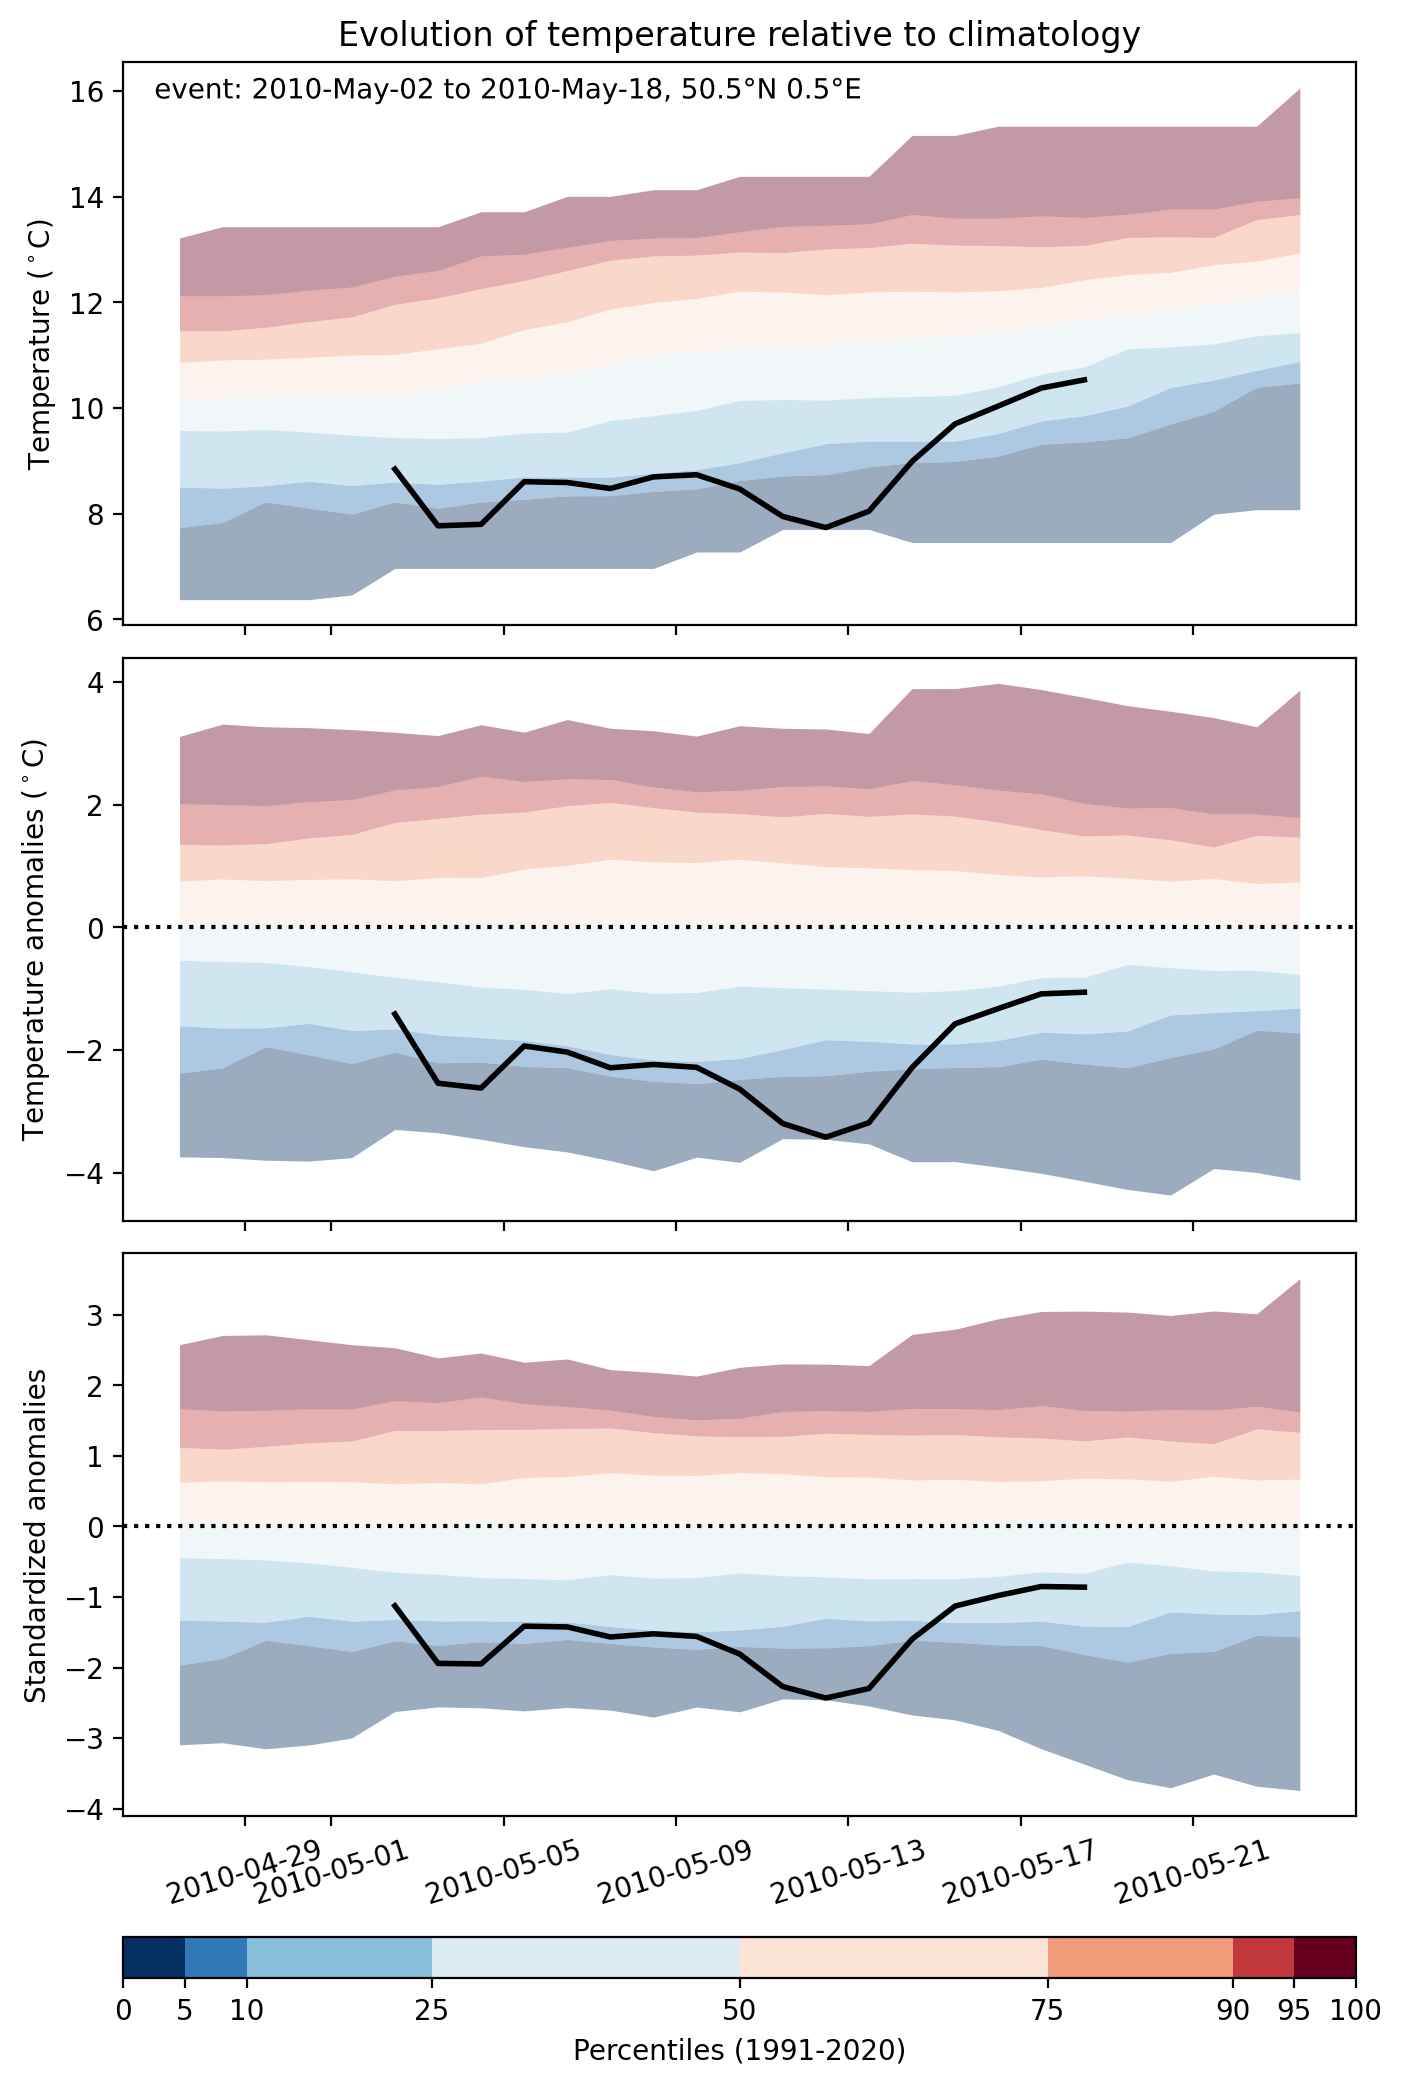
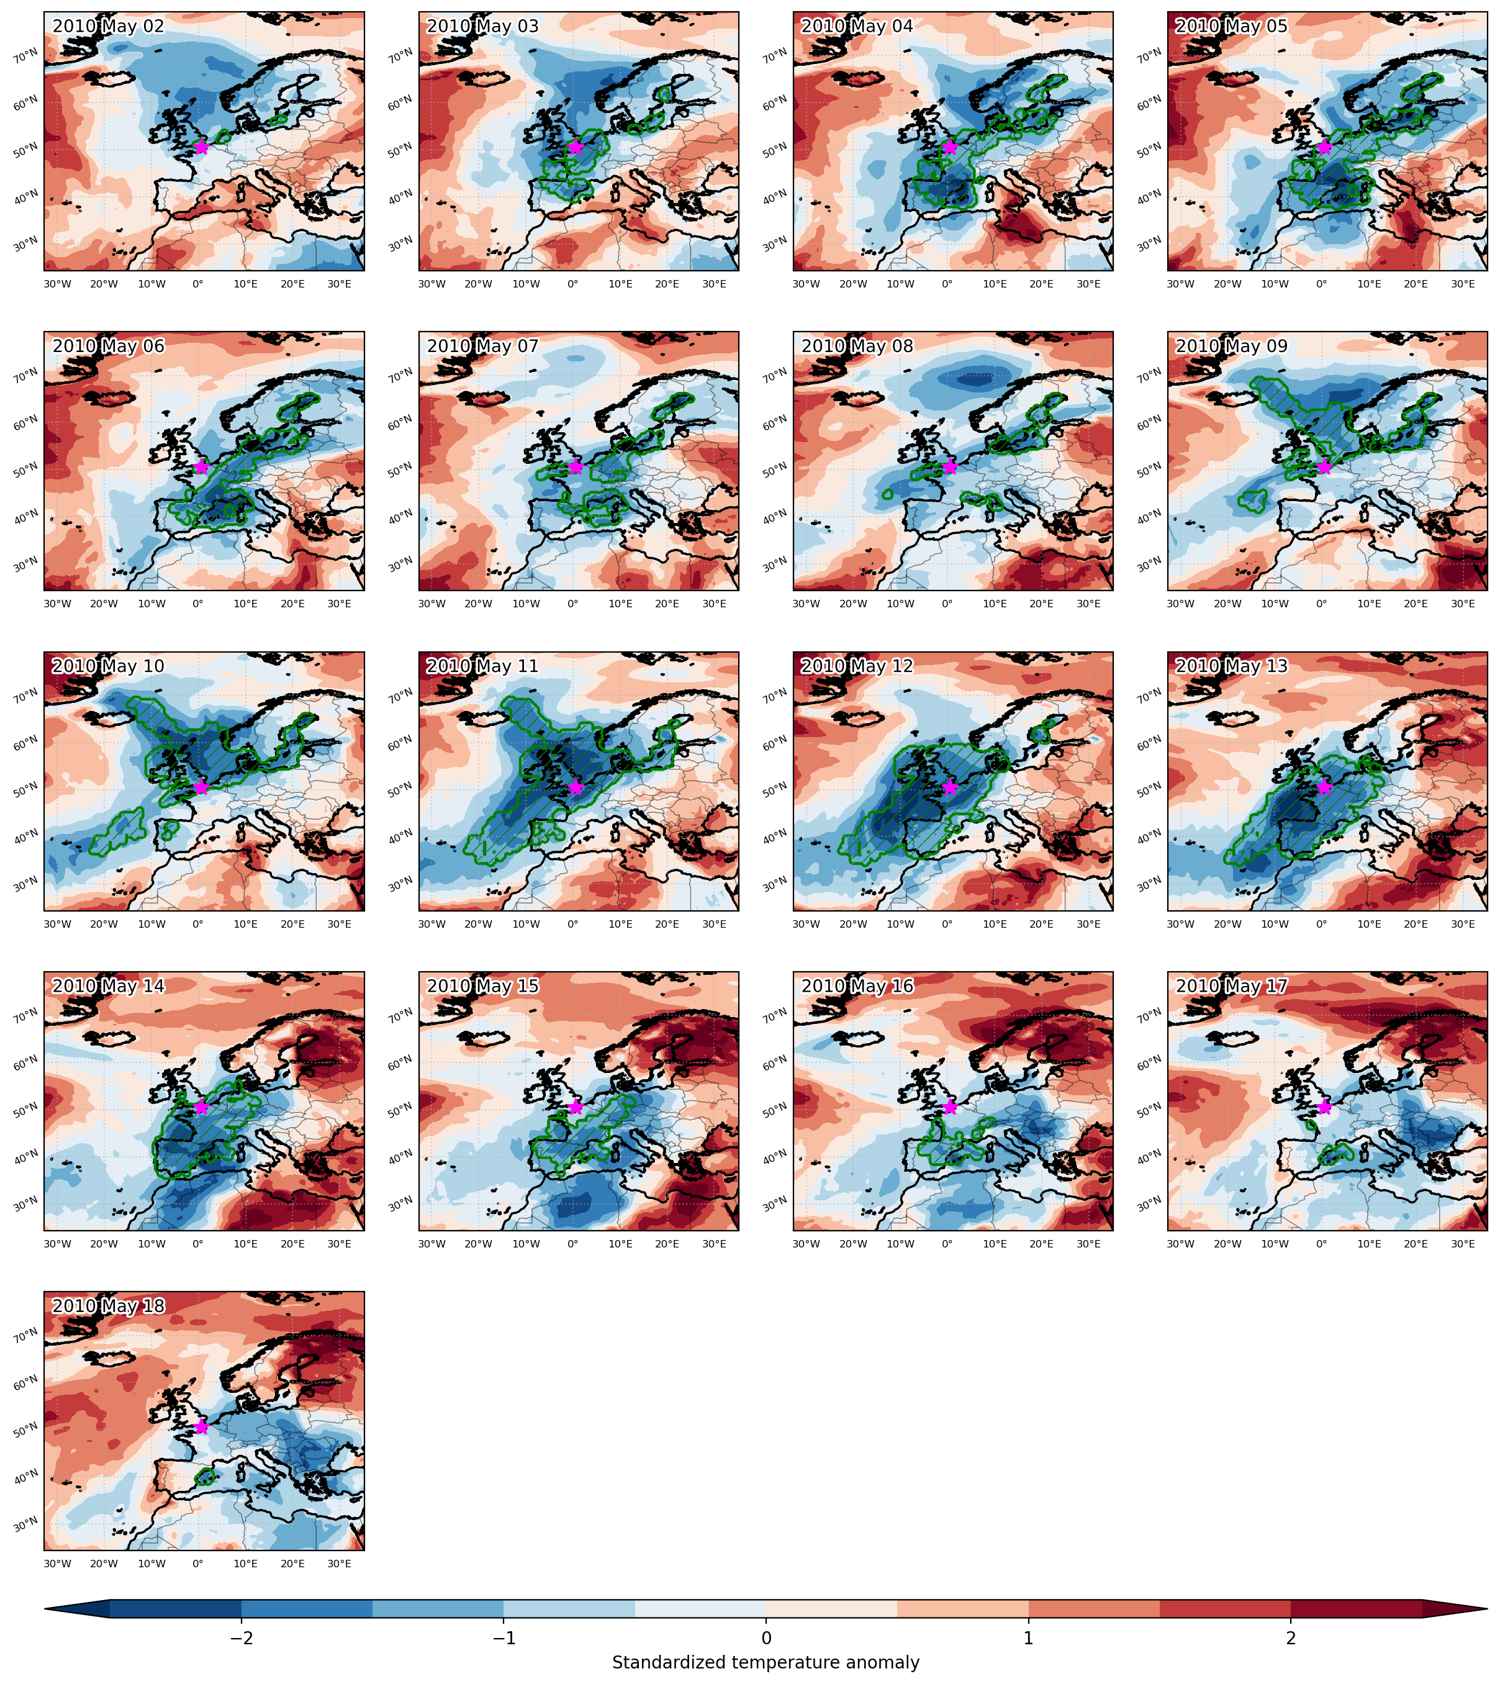
Cold spell occuring from May 02 2010 to May 18 2010 at 50.5°N 0.5°E

Download data: JSON

Event type: Cold spell

Countries affected (identified with ArcGIS Online; provided only for geographical reference):

  • Andorra
  • Belgium
  • Denmark
  • Faroe Islands
  • Finland
  • France
  • Germany
  • Ireland
  • Italy
  • Latvia
  • Lithuania
  • Luxembourg
  • Netherlands
  • Norway
  • Poland
  • Portugal
  • Russian Federation
  • Spain
  • Sweden
  • Switzerland
  • United Kingdom

Duration: 17 days

Time span: May 02 2010 to May 18 2010

Statistics over entire affected area:

  • Mean temperature anomaly: -3.7 °C
  • Mean temperature: 7.9 °C
  • Minimum temperature anomaly: -9.9 °C
  • Minimum temperature: -3.5 °C

Event center: 50.5°N 0.5°E

Area affected: 4780592 km$^2$


Fig. 1: Map of most extreme temperature anomalies (standardized) experienced during the event. The purple star indicates the center of the extreme event. Green hatching illustrates all areas under the effect of extremes at some time during the event.


Fig. 2: Evolution of temperature at the center of the event. The climatological percentile distribution is illustrated with color shadings.


Fig. 3: Maps illustrating the evolution of standardized temperature anomalies during the event.

Event ID: Cold_spell_2010-May-02_to_2010-May-18_0.5_50.5

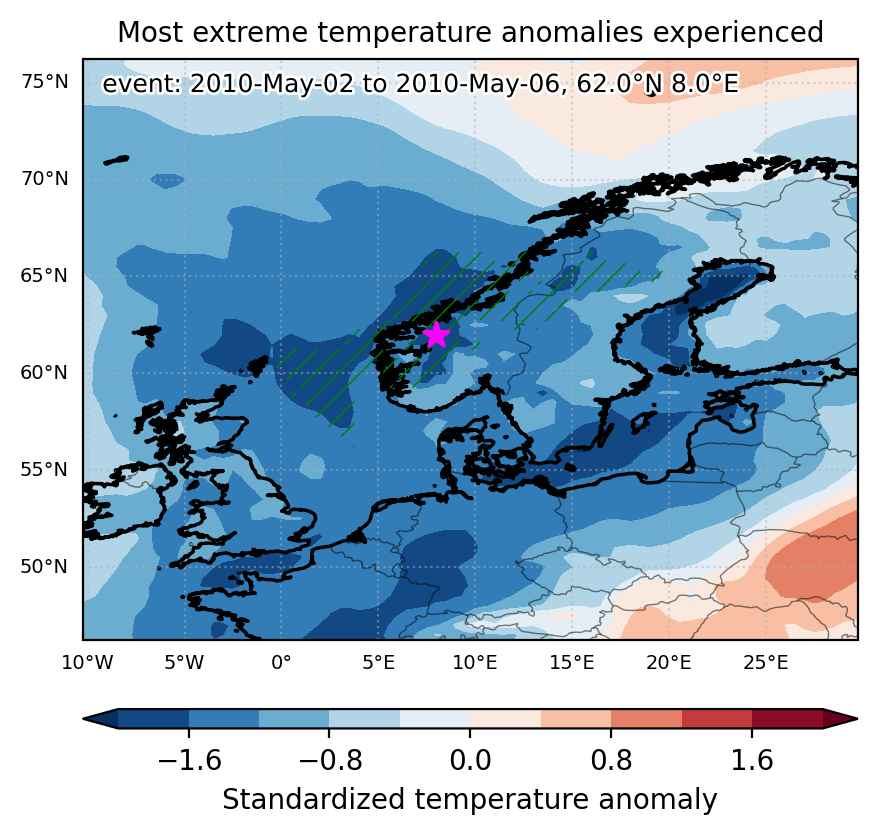
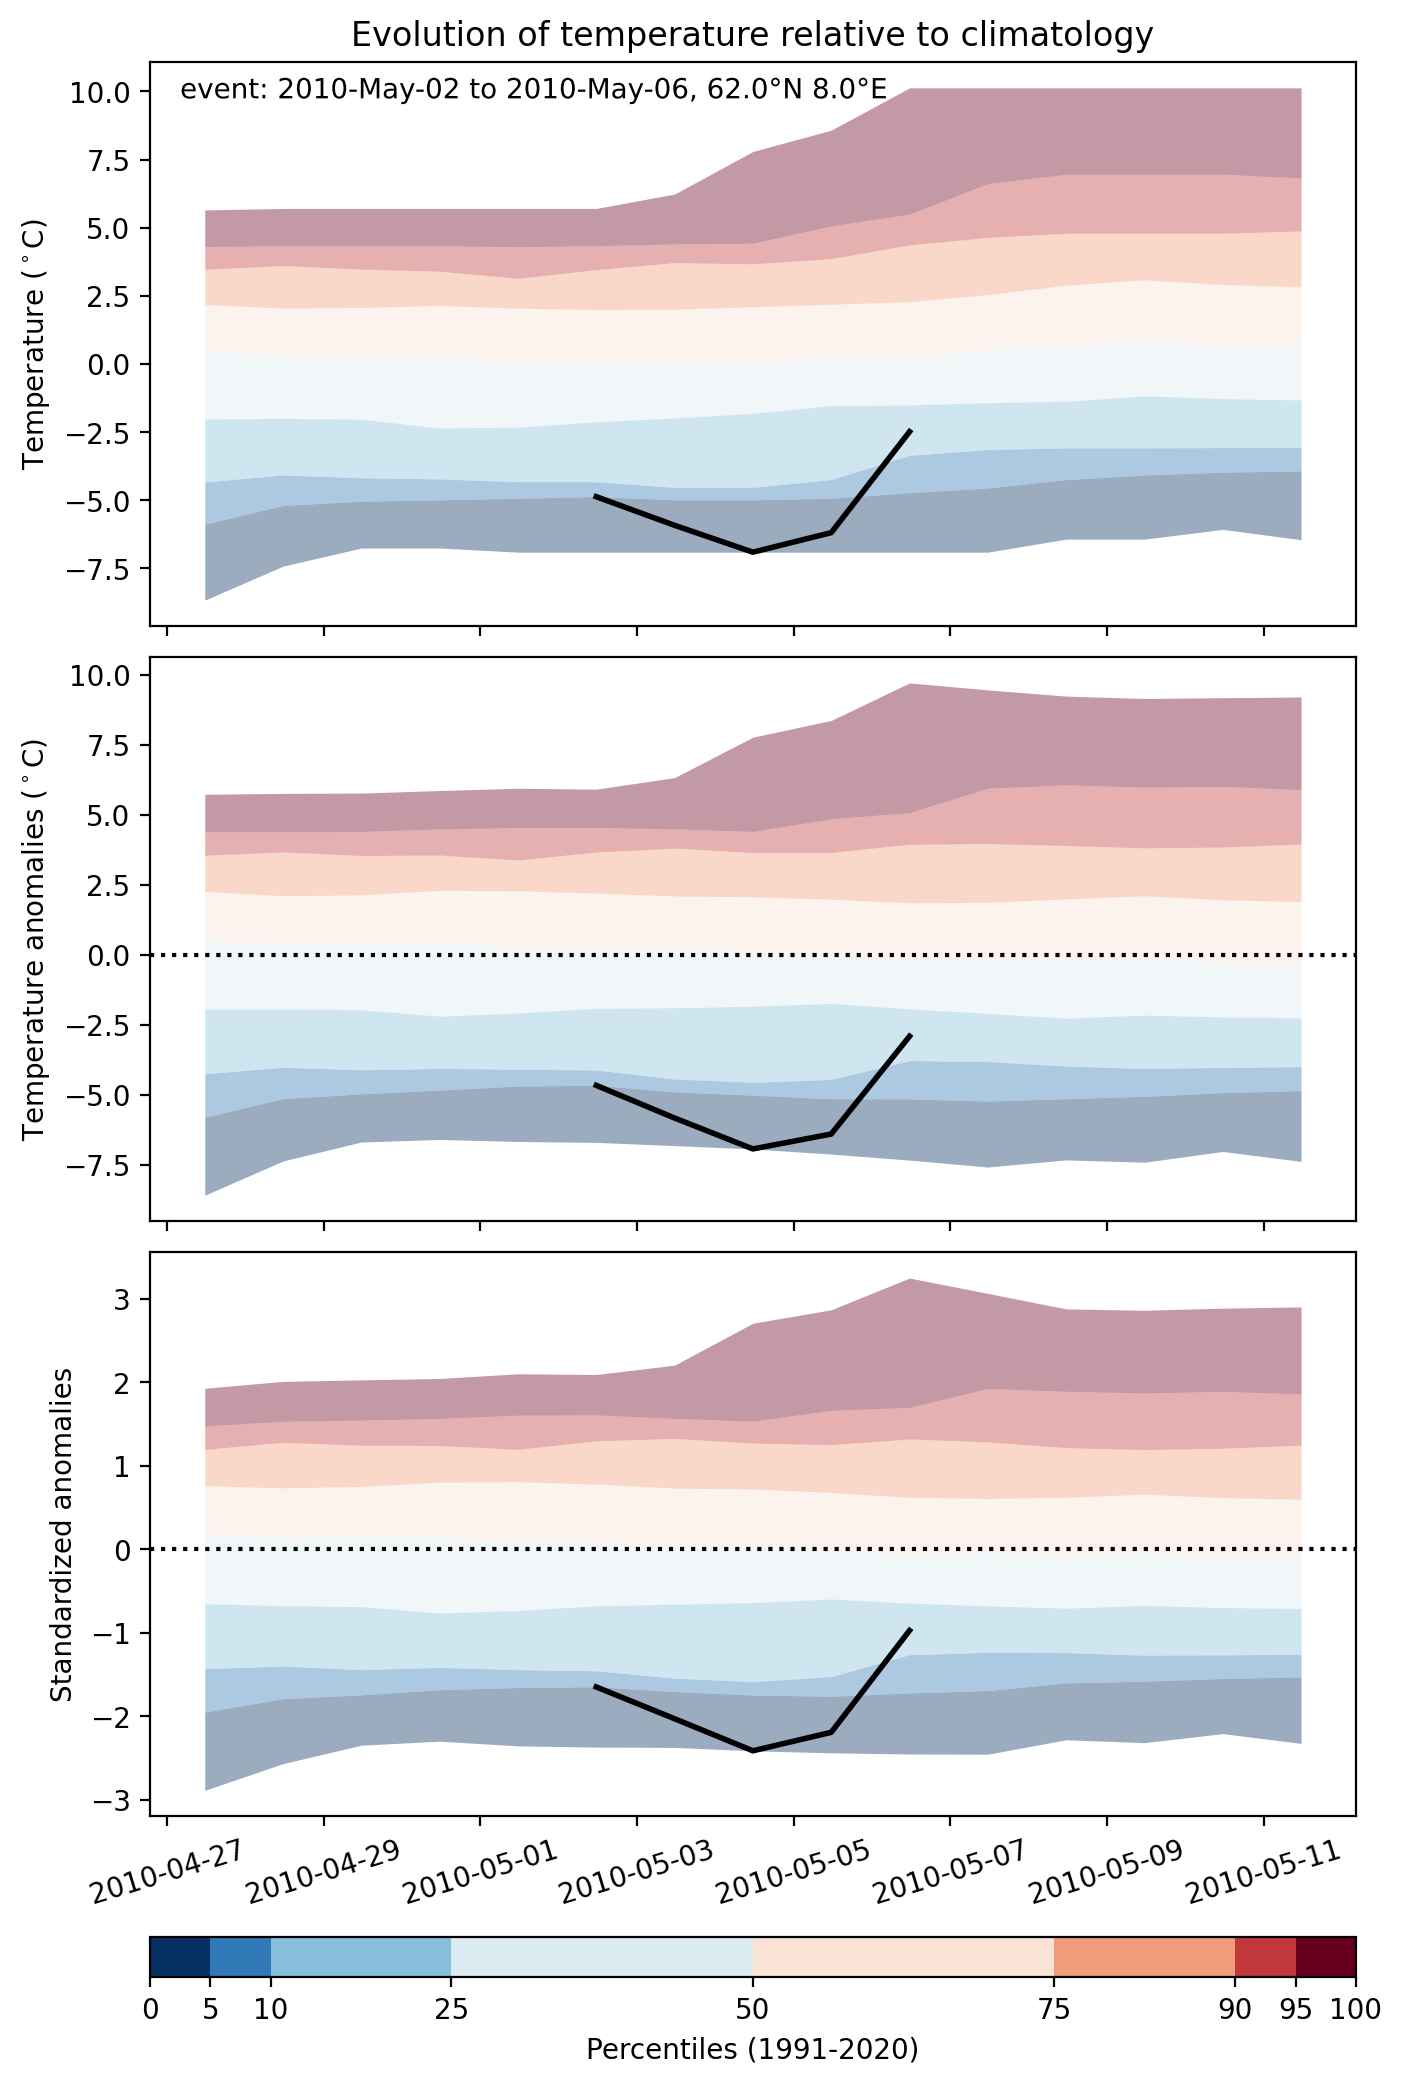
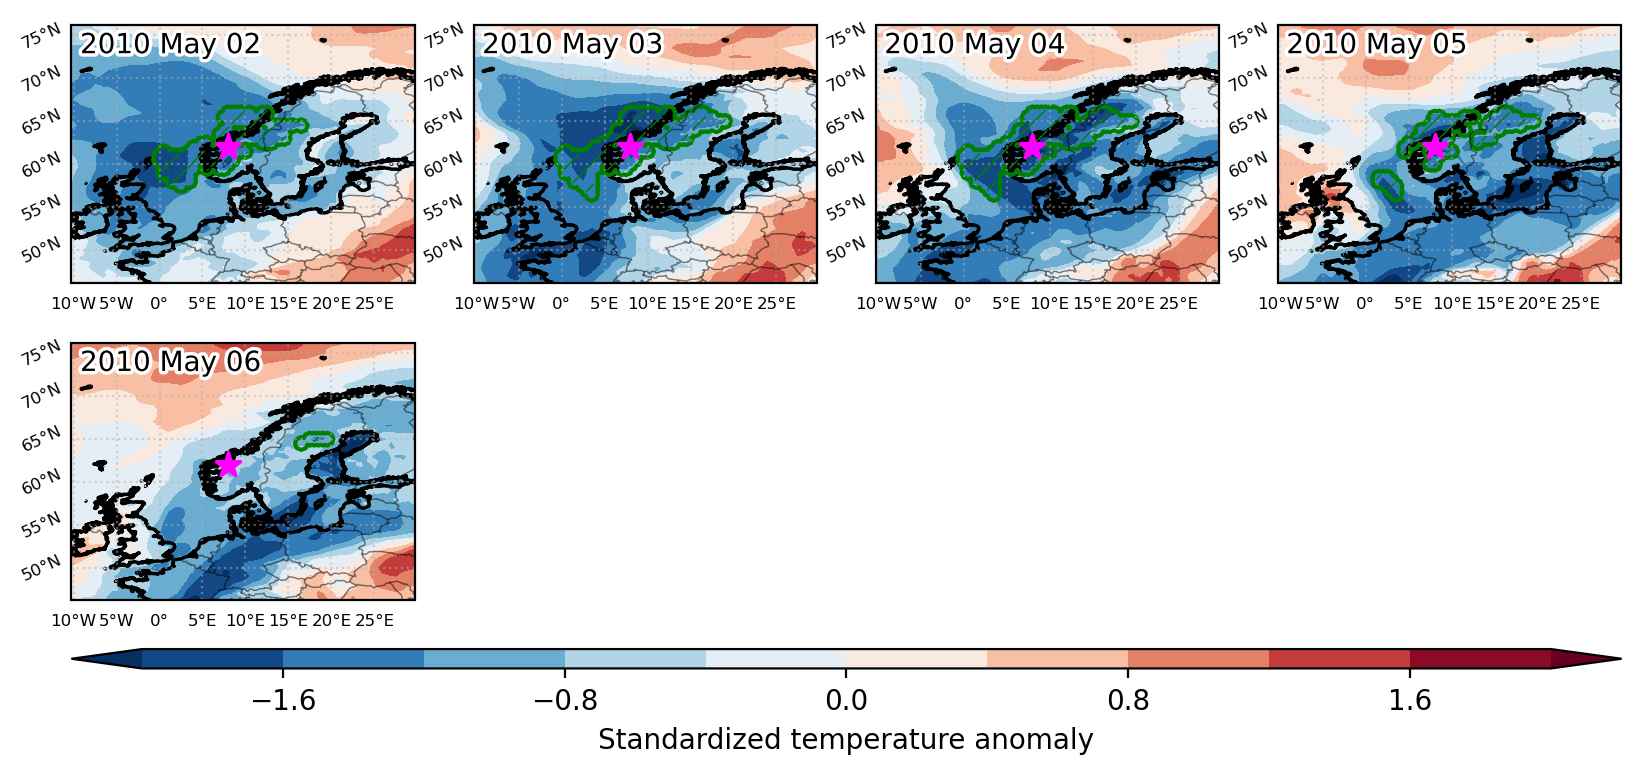
Cold spell occuring from May 02 2010 to May 06 2010 at 62.0°N 8.0°E

Download data: JSON

Event type: Cold spell

Countries affected (identified with ArcGIS Online; provided only for geographical reference):

  • Norway
  • Sweden

Duration: 5 days

Time span: May 02 2010 to May 06 2010

Statistics over entire affected area:

  • Mean temperature anomaly: -3.4 °C
  • Mean temperature: 1.8 °C
  • Minimum temperature anomaly: -6.9 °C
  • Minimum temperature: -7.1 °C

Event center: 62.0°N 8.0°E

Area affected: 309031 km$^2$


Fig. 1: Map of most extreme temperature anomalies (standardized) experienced during the event. The purple star indicates the center of the extreme event. Green hatching illustrates all areas under the effect of extremes at some time during the event.


Fig. 2: Evolution of temperature at the center of the event. The climatological percentile distribution is illustrated with color shadings.


Fig. 3: Maps illustrating the evolution of standardized temperature anomalies during the event.

Event ID: Cold_spell_2010-May-02_to_2010-May-06_8.0_62.0

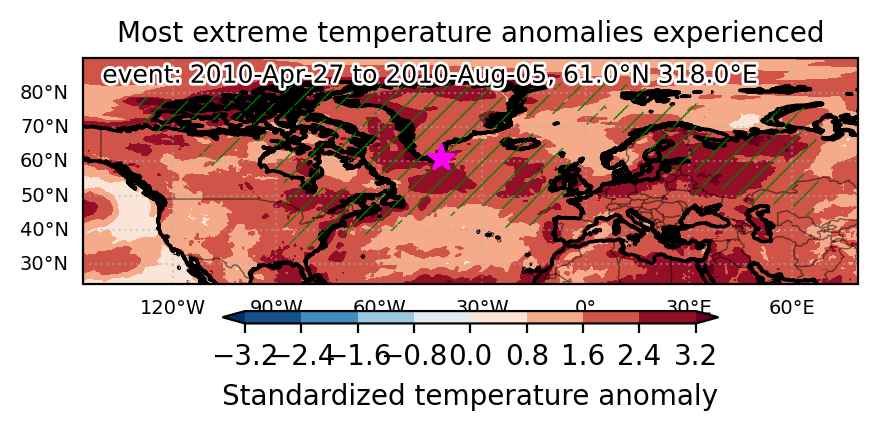
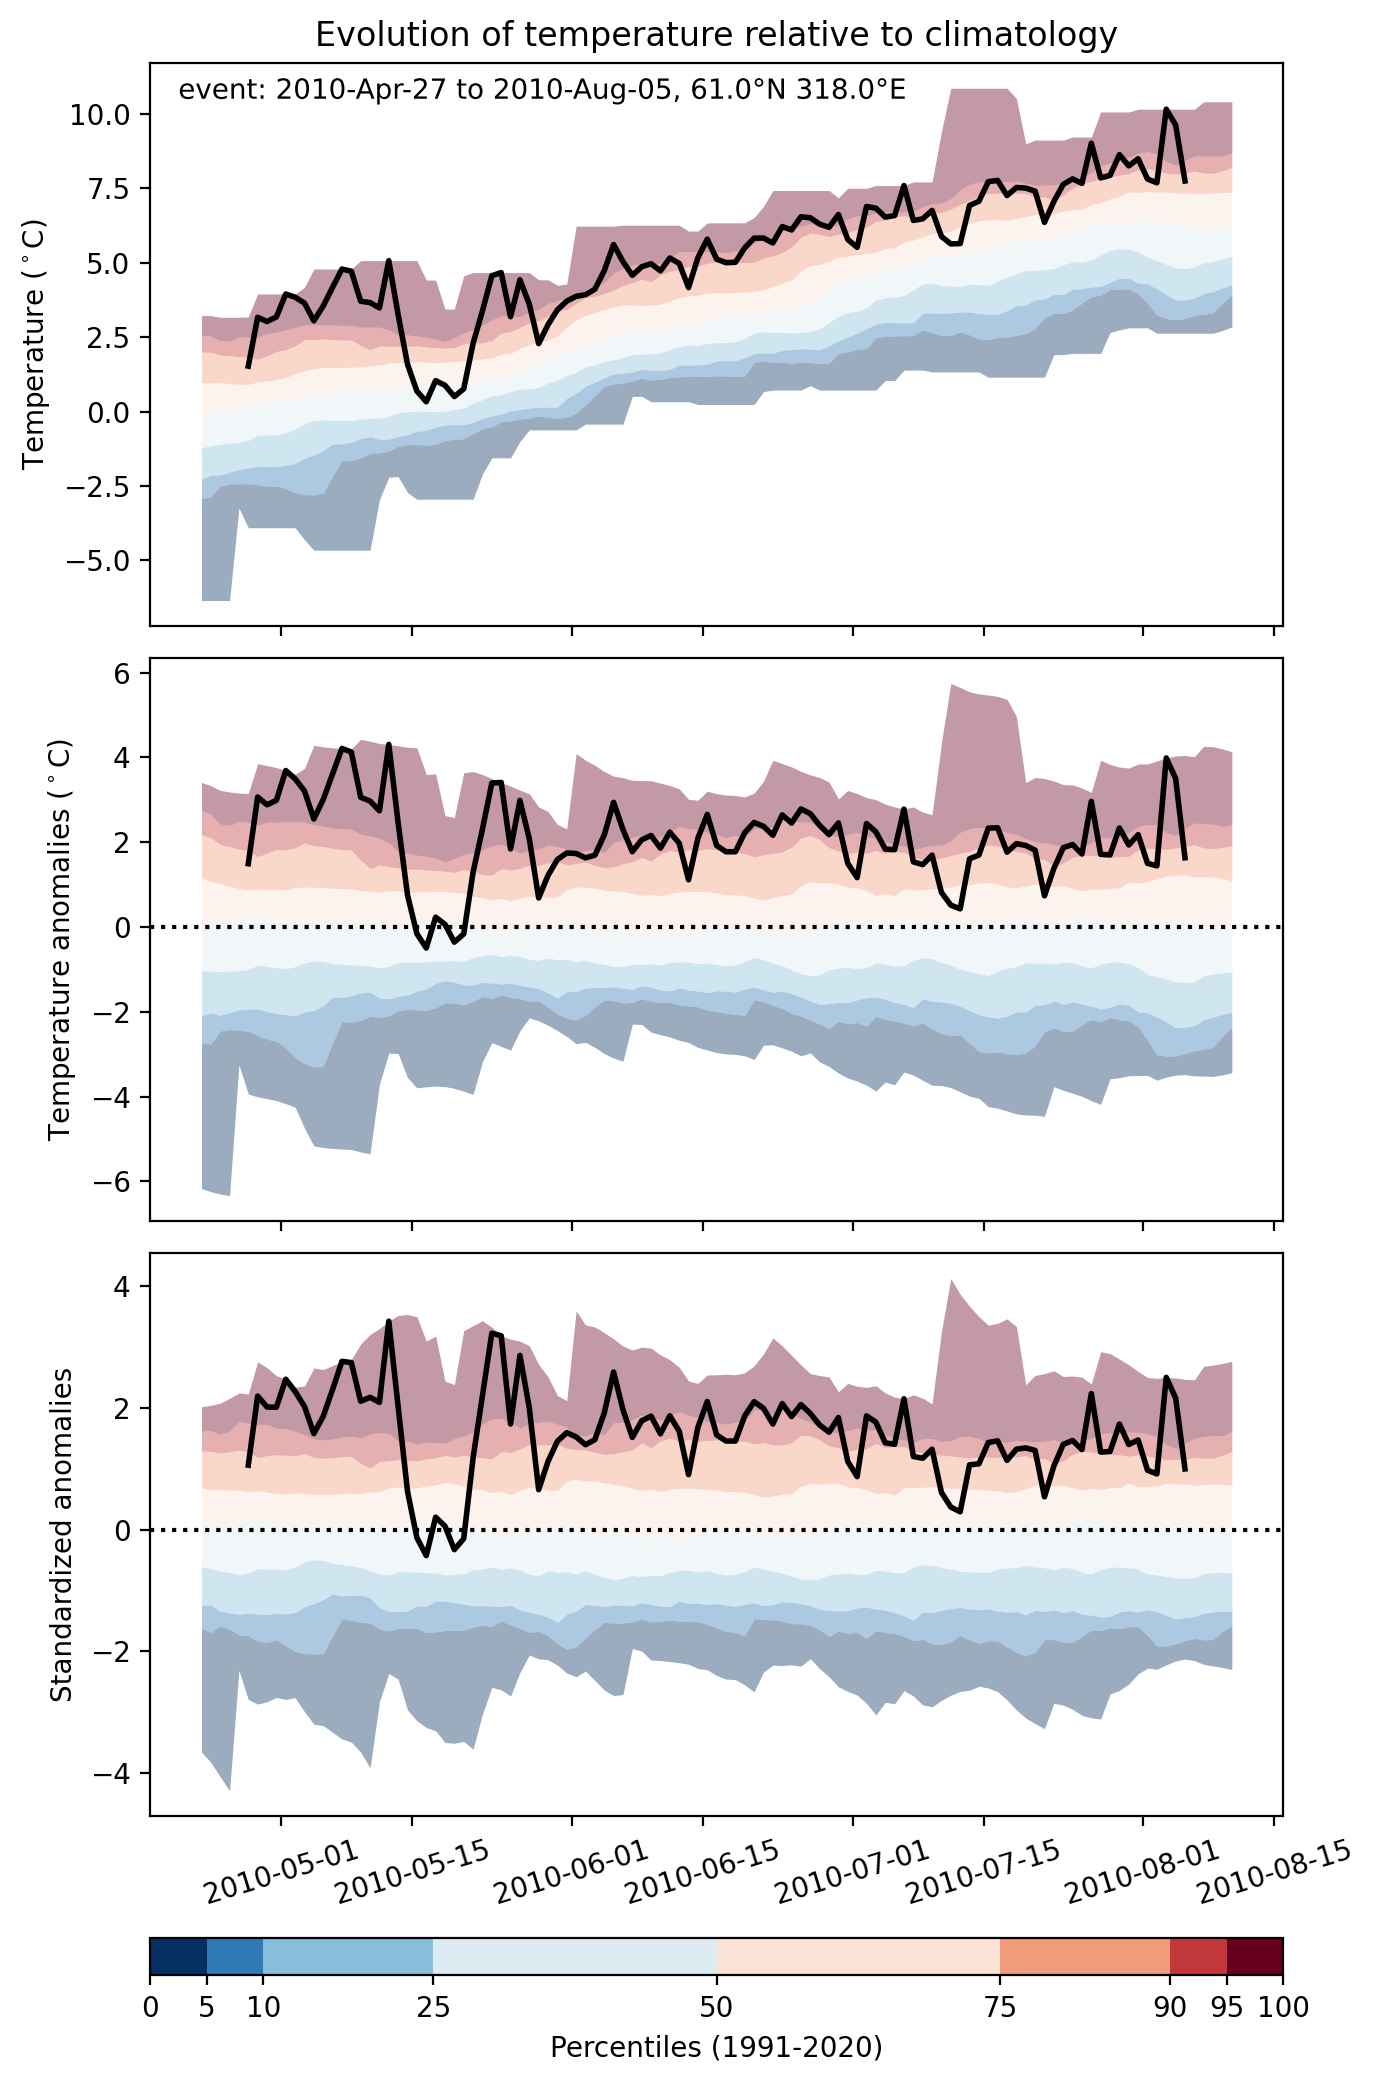
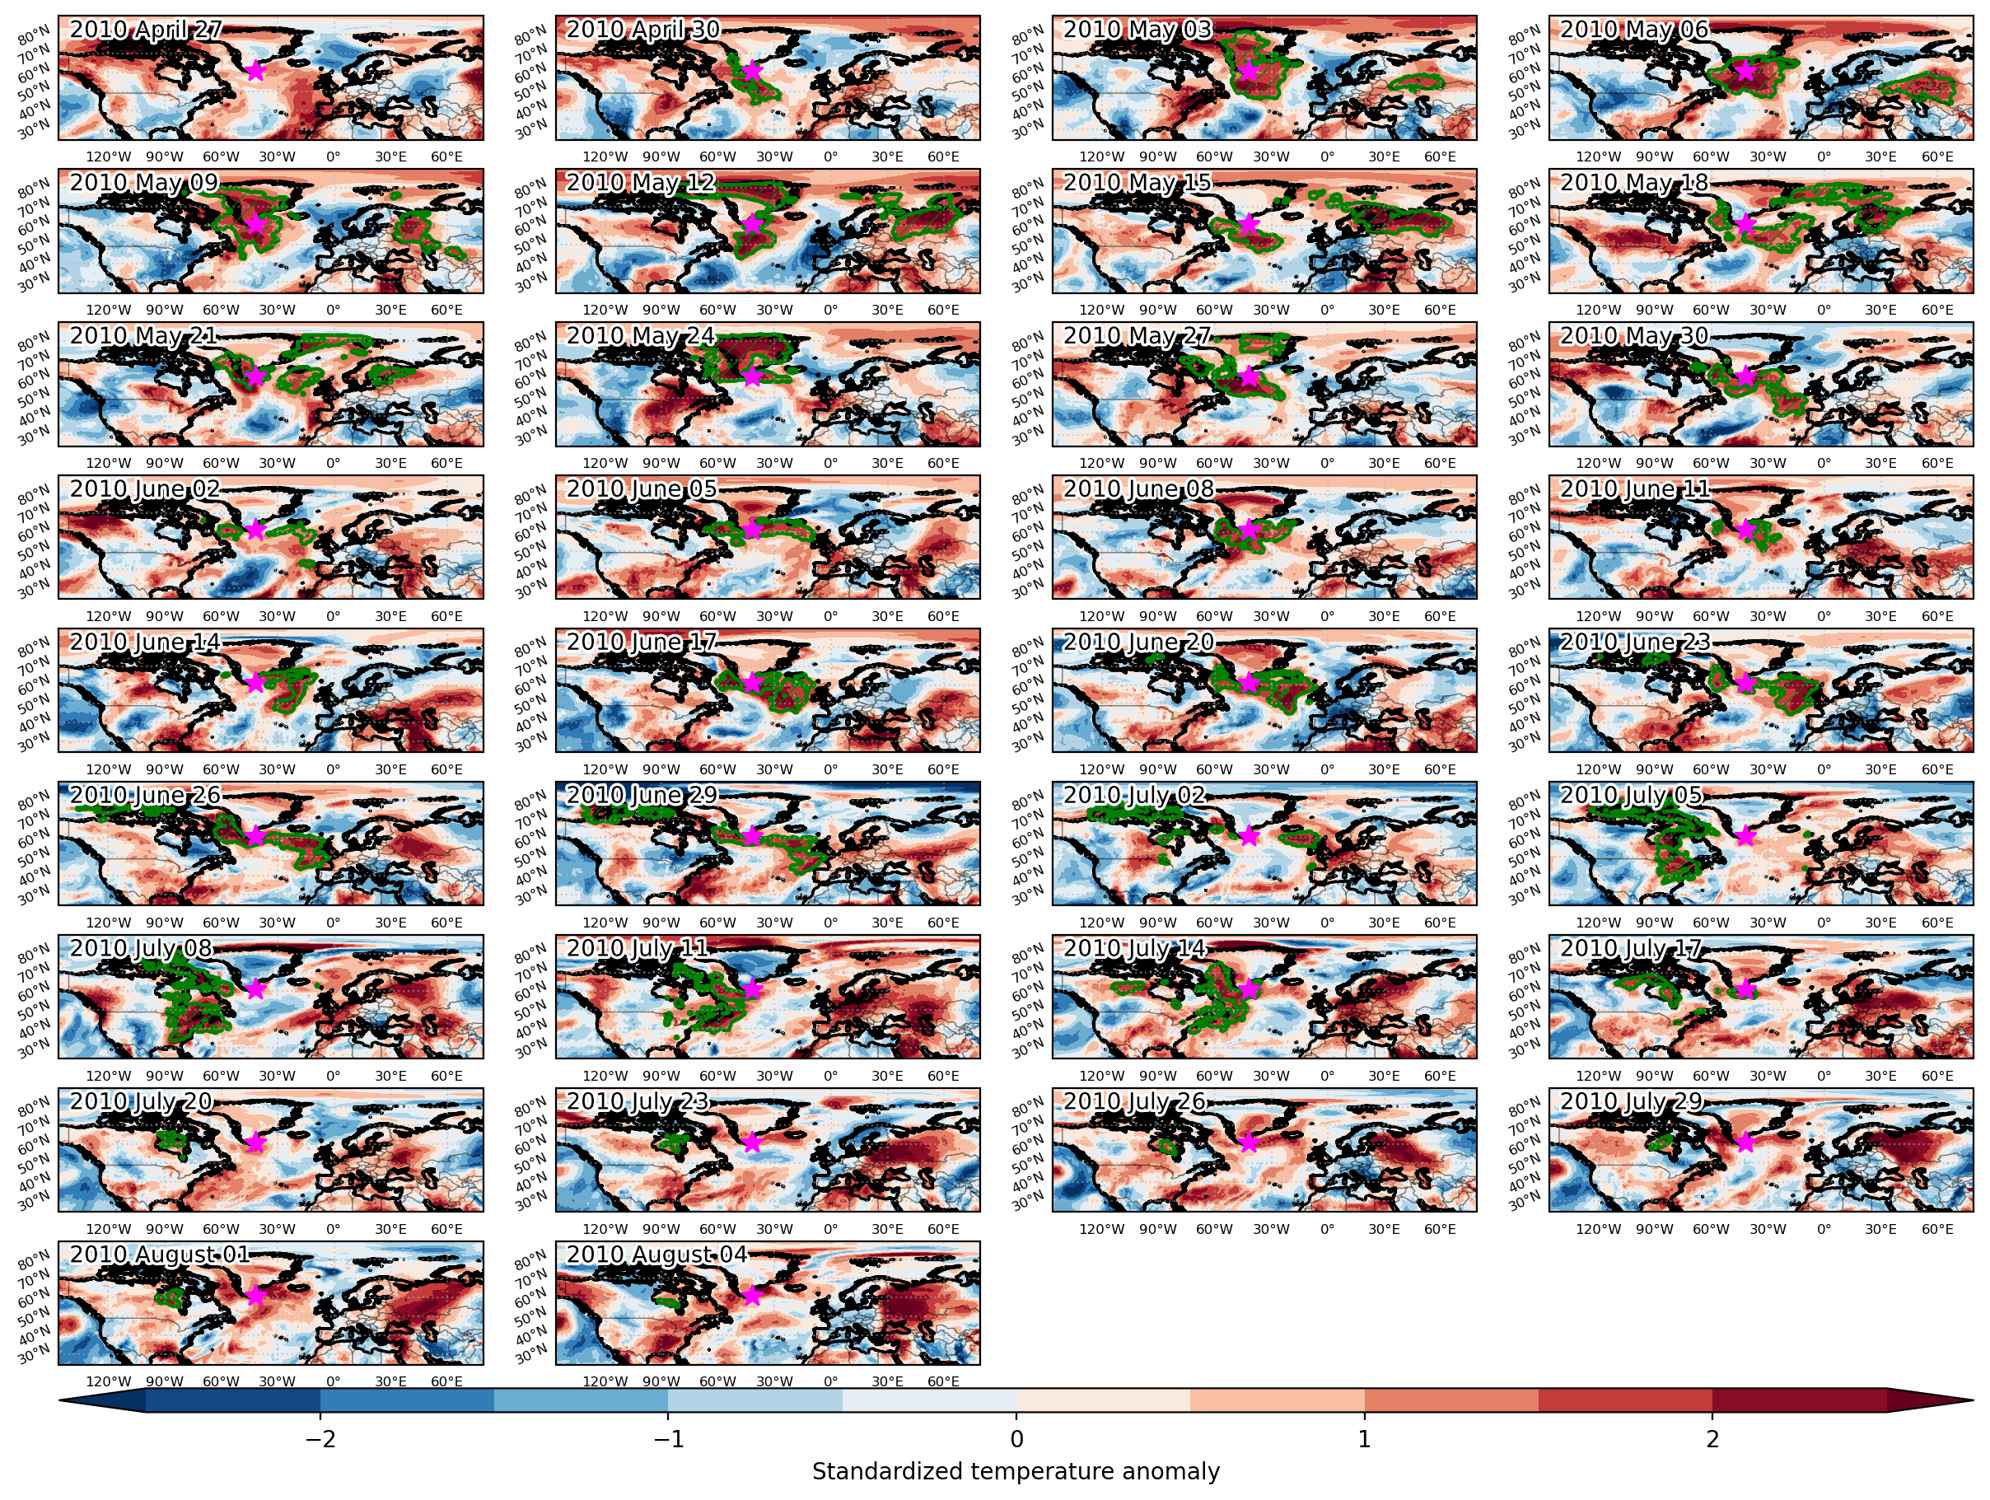
Heat wave occuring from April 27 2010 to August 05 2010 at 61.0°N 318.0°E

Download data: JSON

Event type: Heat wave

Countries affected (identified with ArcGIS Online; provided only for geographical reference):

  • Belarus
  • Canada
  • Estonia
  • Finland
  • Greenland
  • Iceland
  • Kazakhstan
  • Latvia
  • Norway
  • Russian Federation
  • Sweden
  • Ukraine
  • United States
  • Uzbekistan

Duration: 101 days

Time span: April 27 2010 to August 05 2010

Statistics over entire affected area:

  • Mean temperature anomaly: 4.7 °C
  • Mean temperature: 8.7 °C
  • Maximum temperature anomaly: 19.6 °C
  • Maximum temperature: 33.0 °C

Event center: 61.0°N 318.0°E

Area affected: 23412526 km$^2$


Fig. 1: Map of most extreme temperature anomalies (standardized) experienced during the event. The purple star indicates the center of the extreme event. Green hatching illustrates all areas under the effect of extremes at some time during the event.


Fig. 2: Evolution of temperature at the center of the event. The climatological percentile distribution is illustrated with color shadings.


Fig. 3: Maps illustrating the evolution of standardized temperature anomalies during the event.

Event ID: Heat_wave_2010-Apr-27_to_2010-Aug-05_318.0_61.0

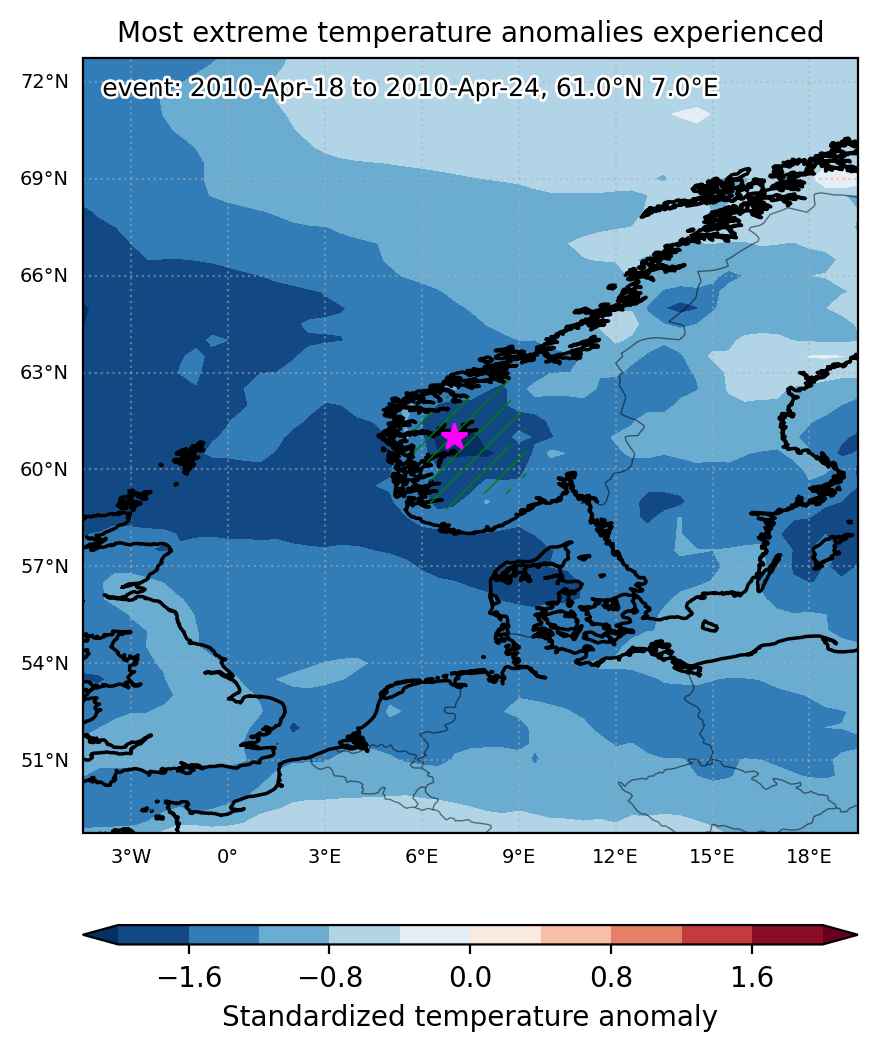
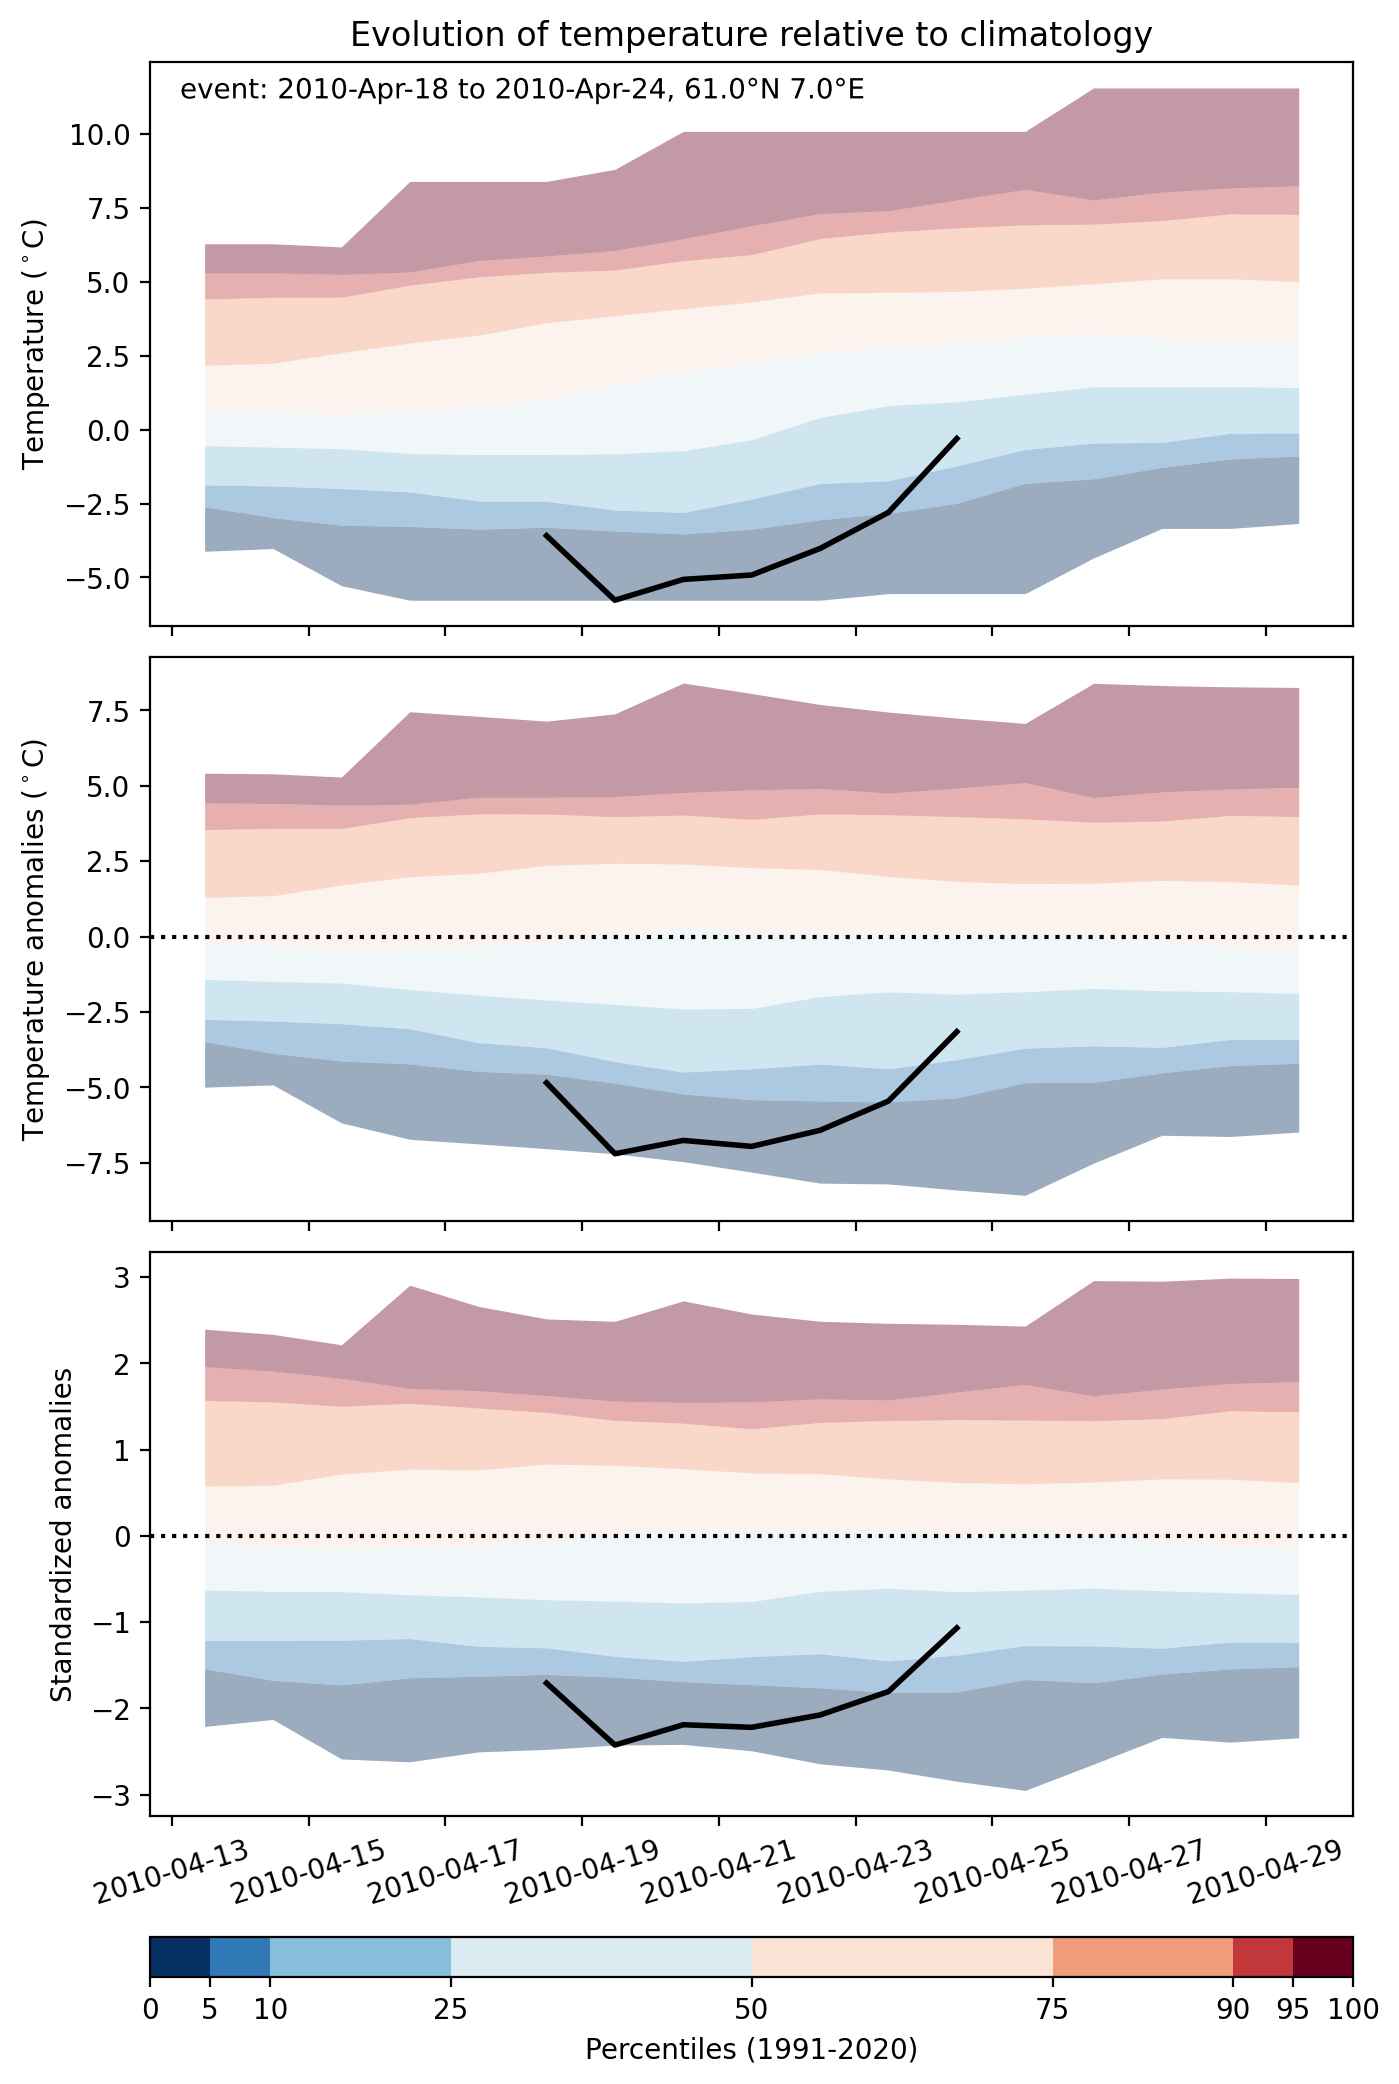
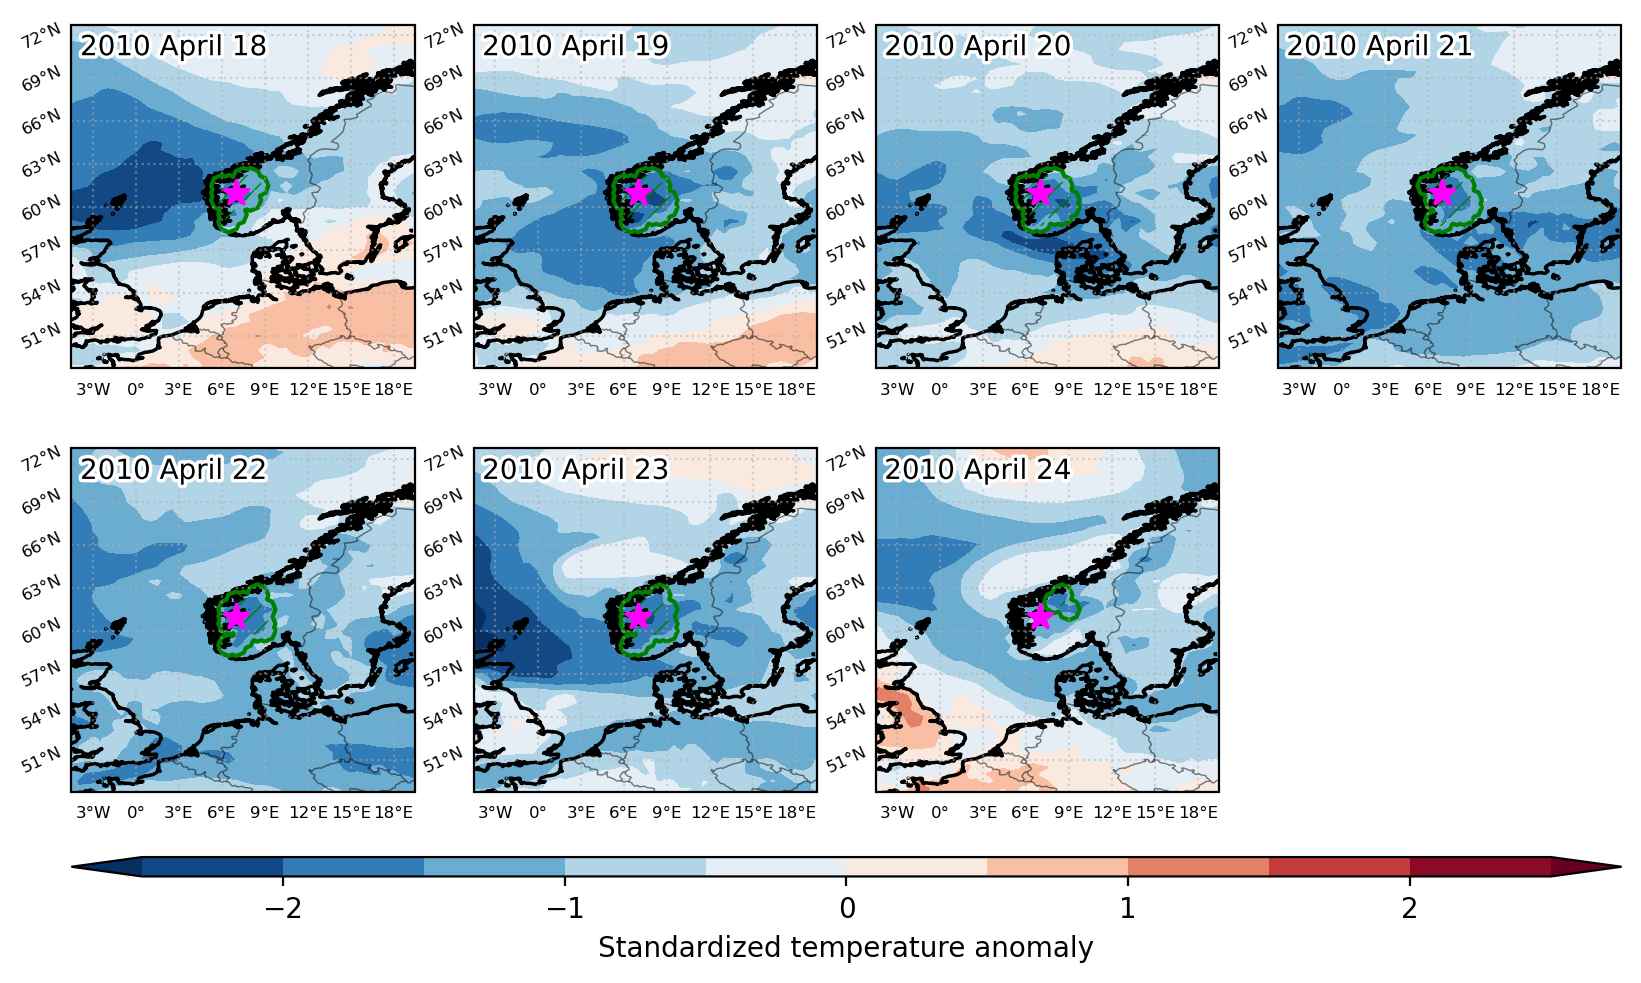
Cold spell occuring from April 18 2010 to April 24 2010 at 61.0°N 7.0°E

Download data: JSON

Event type: Cold spell

Countries affected (identified with ArcGIS Online; provided only for geographical reference):

  • Norway

Duration: 7 days

Time span: April 18 2010 to April 24 2010

Statistics over entire affected area:

  • Mean temperature anomaly: -5.4 °C
  • Mean temperature: -4.8 °C
  • Minimum temperature anomaly: -7.4 °C
  • Minimum temperature: -9.0 °C

Event center: 61.0°N 7.0°E

Area affected: 57504 km$^2$


Fig. 1: Map of most extreme temperature anomalies (standardized) experienced during the event. The purple star indicates the center of the extreme event. Green hatching illustrates all areas under the effect of extremes at some time during the event.


Fig. 2: Evolution of temperature at the center of the event. The climatological percentile distribution is illustrated with color shadings.


Fig. 3: Maps illustrating the evolution of standardized temperature anomalies during the event.

Event ID: Cold_spell_2010-Apr-18_to_2010-Apr-24_7.0_61.0

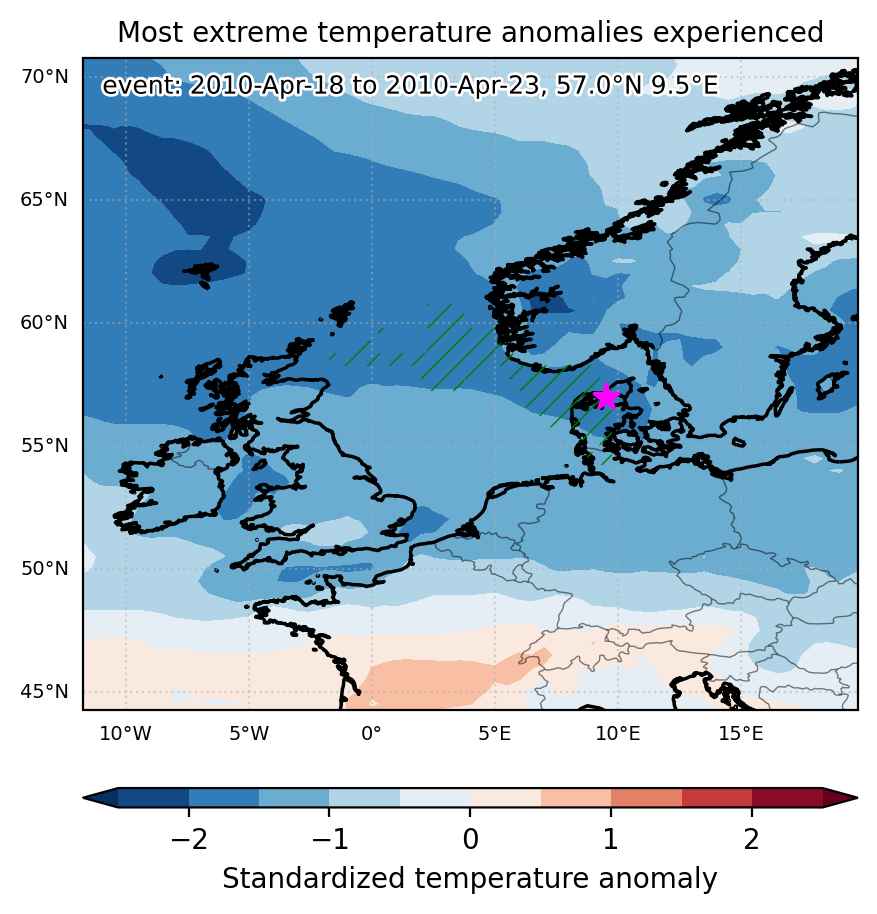
Cold spell occuring from April 18 2010 to April 23 2010 at 57.0°N 9.5°E

Download data: JSON

Event type: Cold spell

Countries affected (identified with ArcGIS Online; provided only for geographical reference):

  • Denmark
  • Germany
  • Norway

Duration: 6 days

Time span: April 18 2010 to April 23 2010

Statistics over entire affected area:

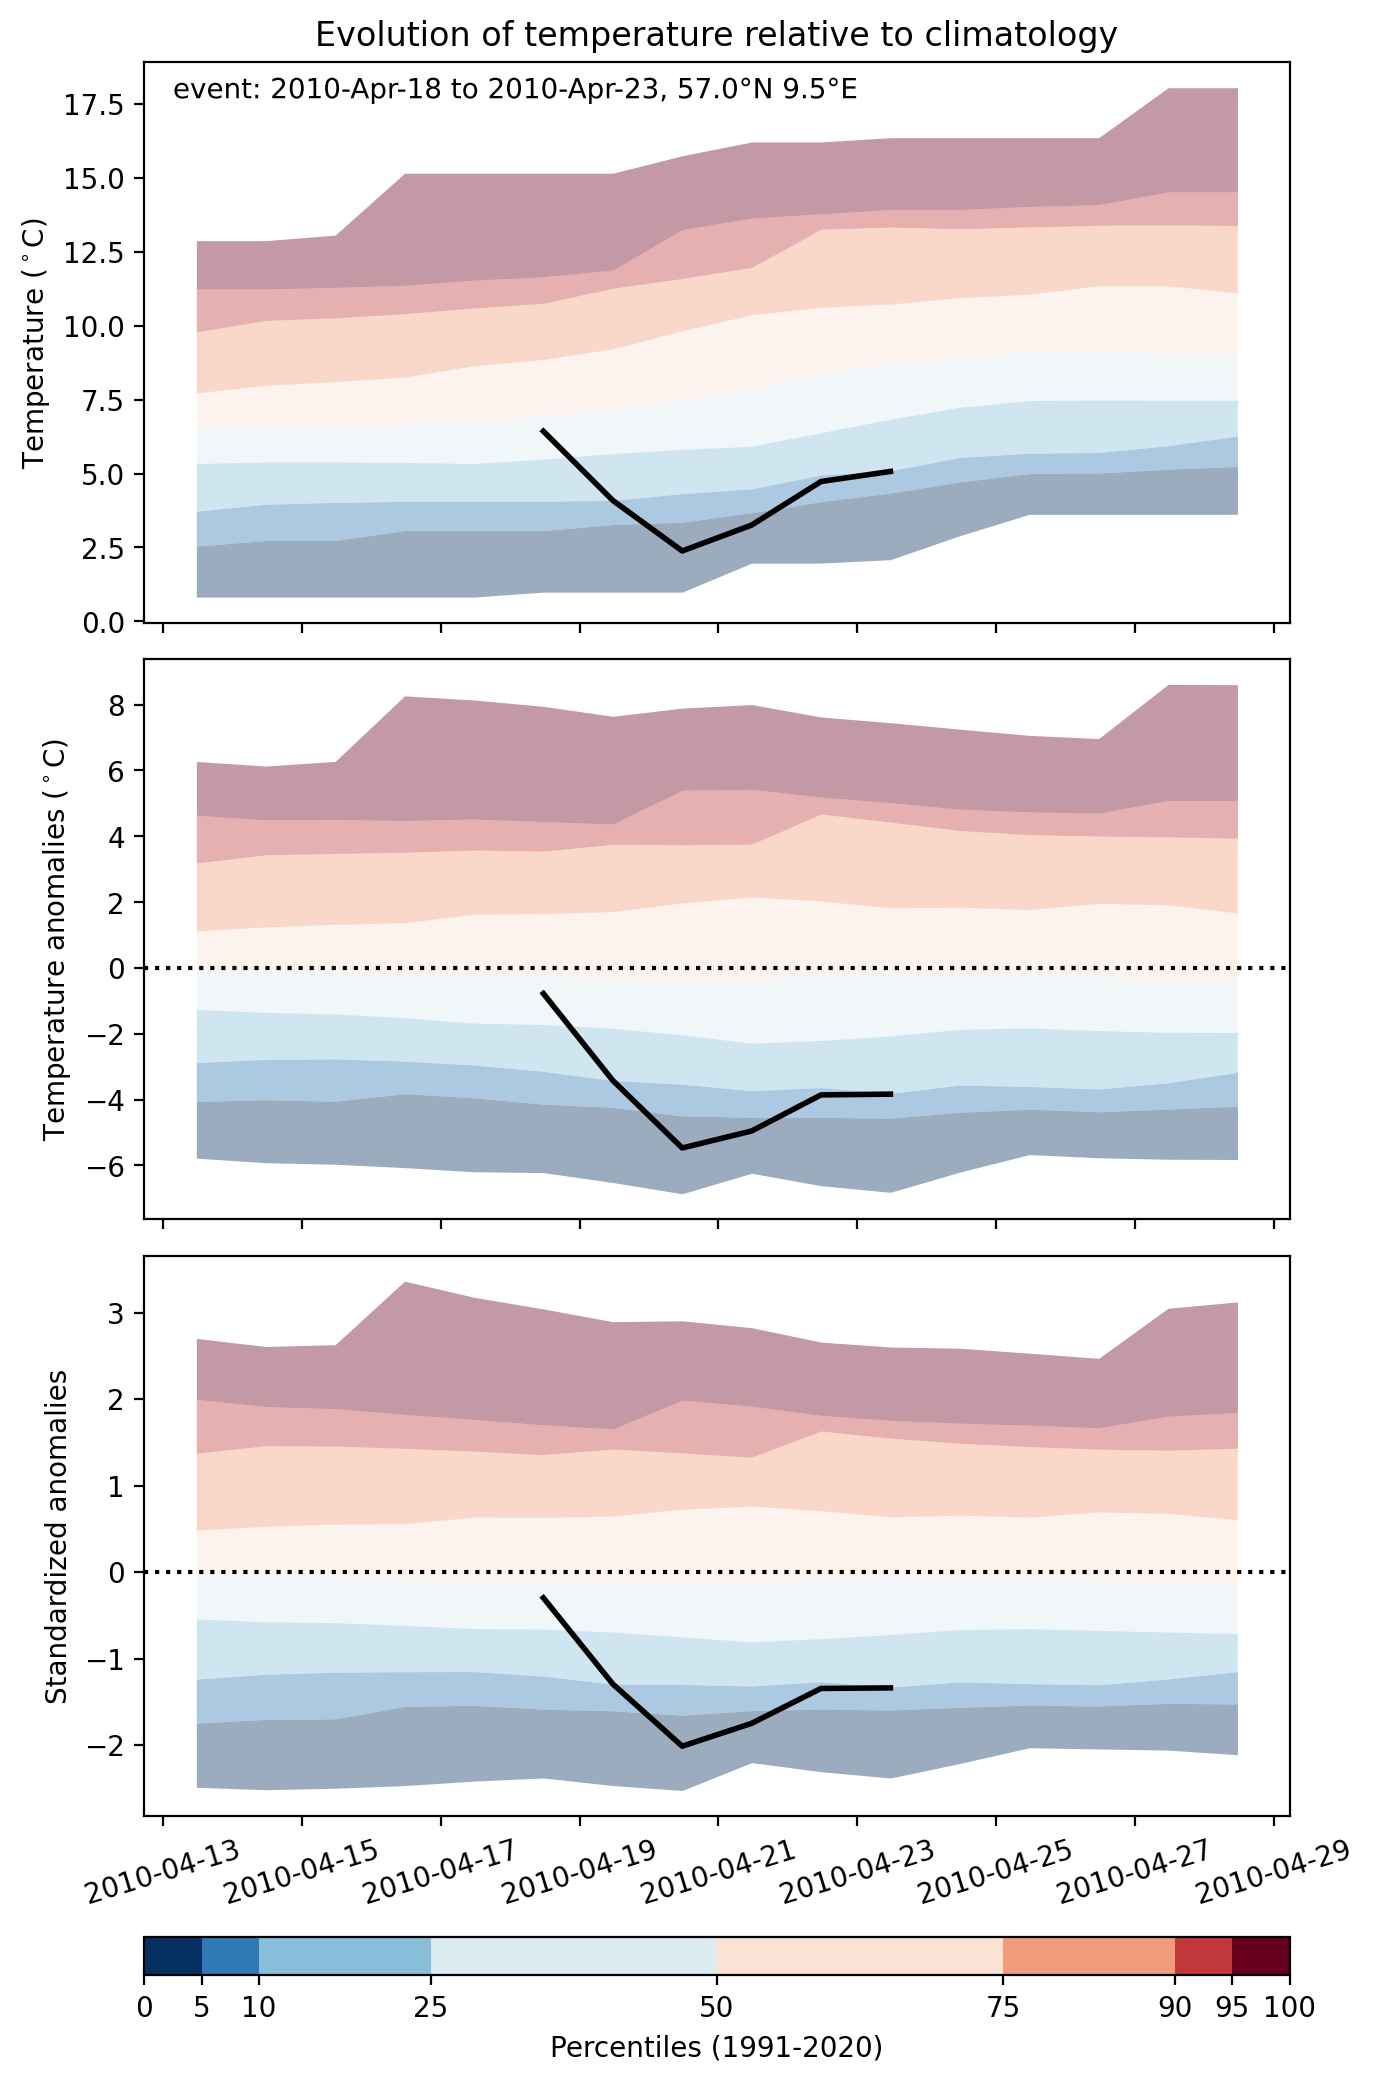
  • Mean temperature anomaly: -2.7 °C
  • Mean temperature: 4.1 °C
  • Minimum temperature anomaly: -5.9 °C
  • Minimum temperature: 1.8 °C

Event center: 57.0°N 9.5°E

Area affected: 141333 km$^2$


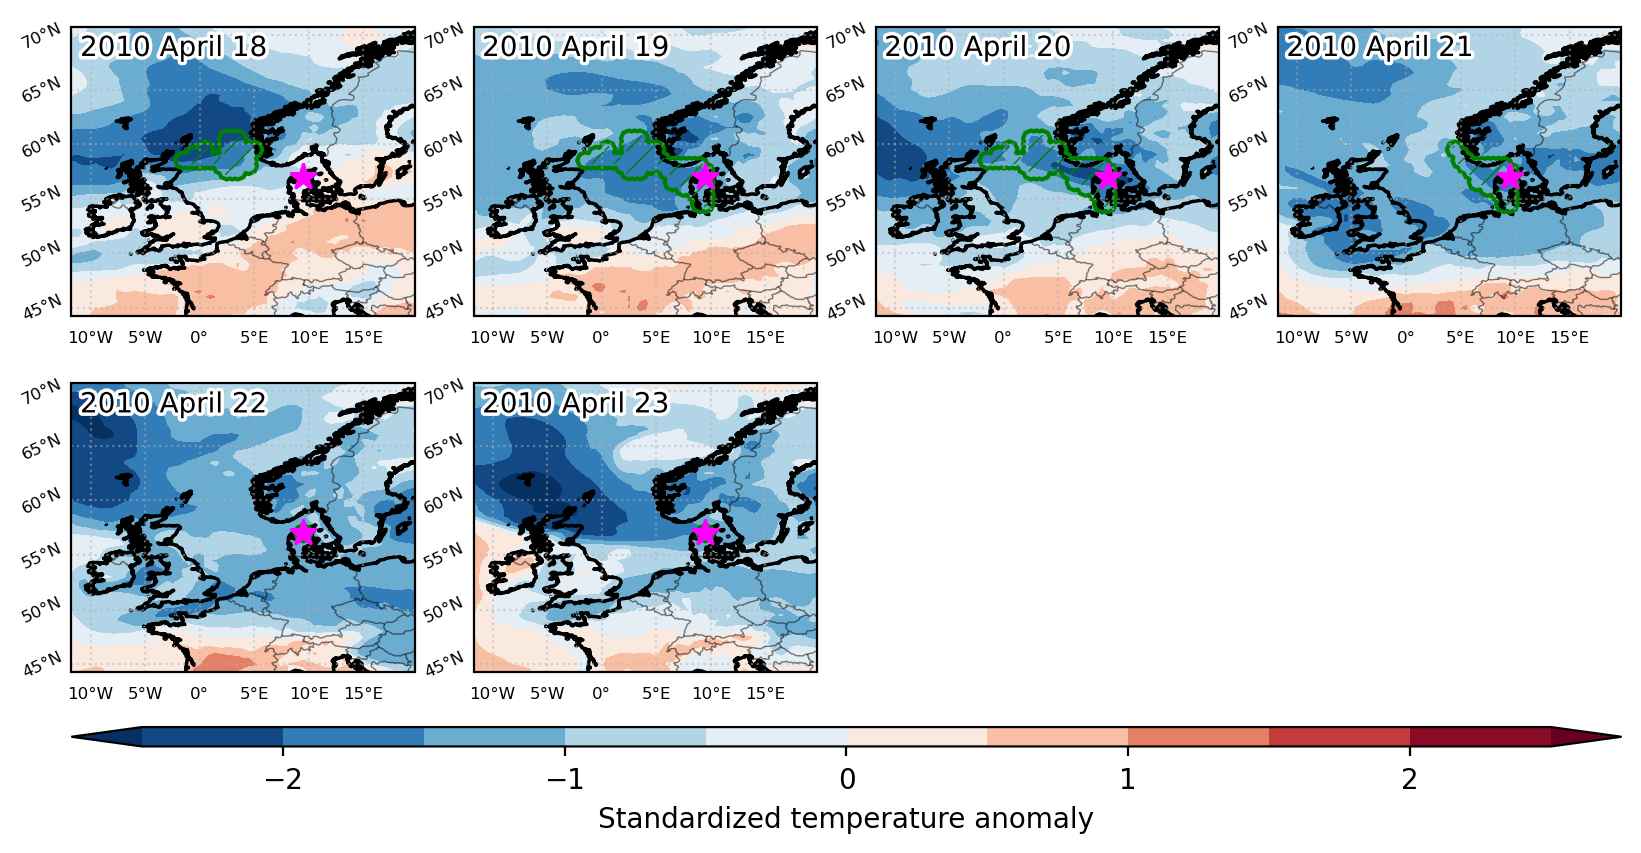
Fig. 1: Map of most extreme temperature anomalies (standardized) experienced during the event. The purple star indicates the center of the extreme event. Green hatching illustrates all areas under the effect of extremes at some time during the event.


Fig. 2: Evolution of temperature at the center of the event. The climatological percentile distribution is illustrated with color shadings.


Fig. 3: Maps illustrating the evolution of standardized temperature anomalies during the event.

Event ID: Cold_spell_2010-Apr-18_to_2010-Apr-23_9.5_57.0