Cold spell occuring from January 02 2018 to January 08 2018 at 15.0°N 265.5°E

Download data: JSON

Event type: Cold spell

Countries affected (identified with ArcGIS Online; provided only for geographical reference):

  • Mexico

Duration: 7 days

Time span: January 02 2018 to January 08 2018

Statistics over entire affected area:

  • Mean temperature anomaly: -2.6 °C
  • Mean temperature: 21.7 °C
  • Minimum temperature anomaly: -5.0 °C
  • Minimum temperature: 13.8 °C

Event center: 15.0°N 265.5°E

Area affected: 65510 km$^2$
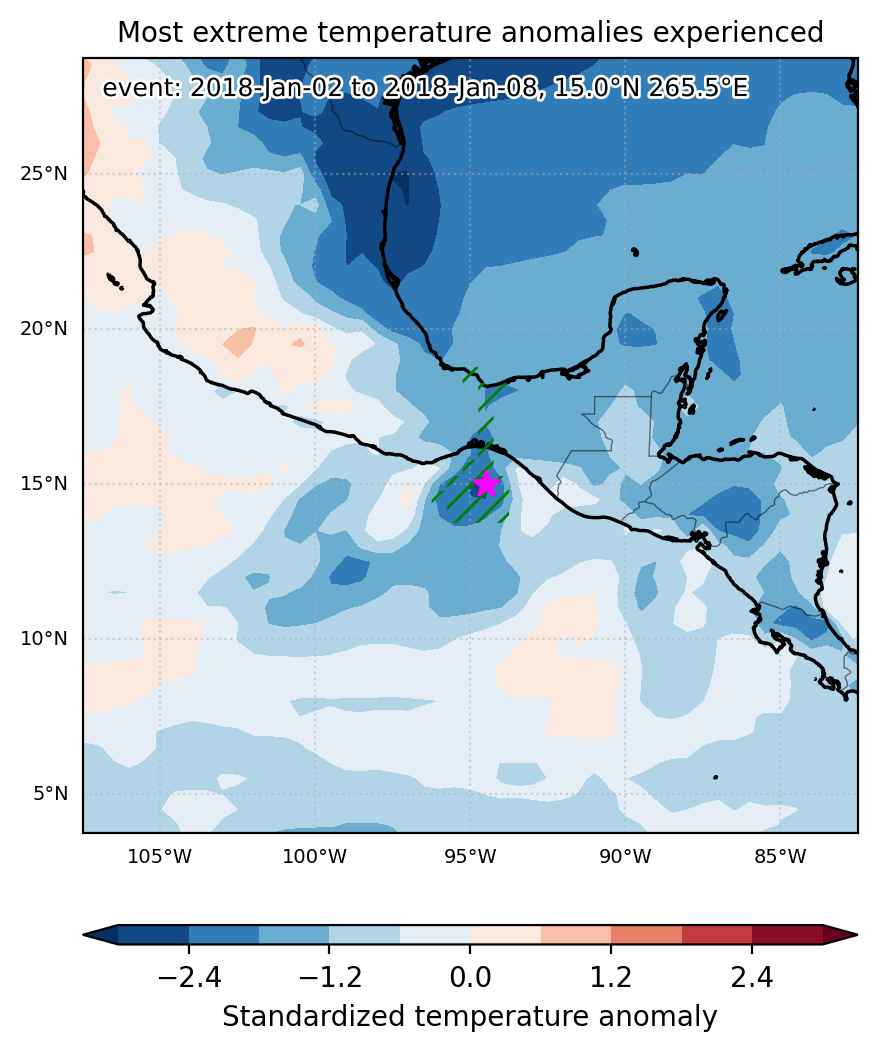

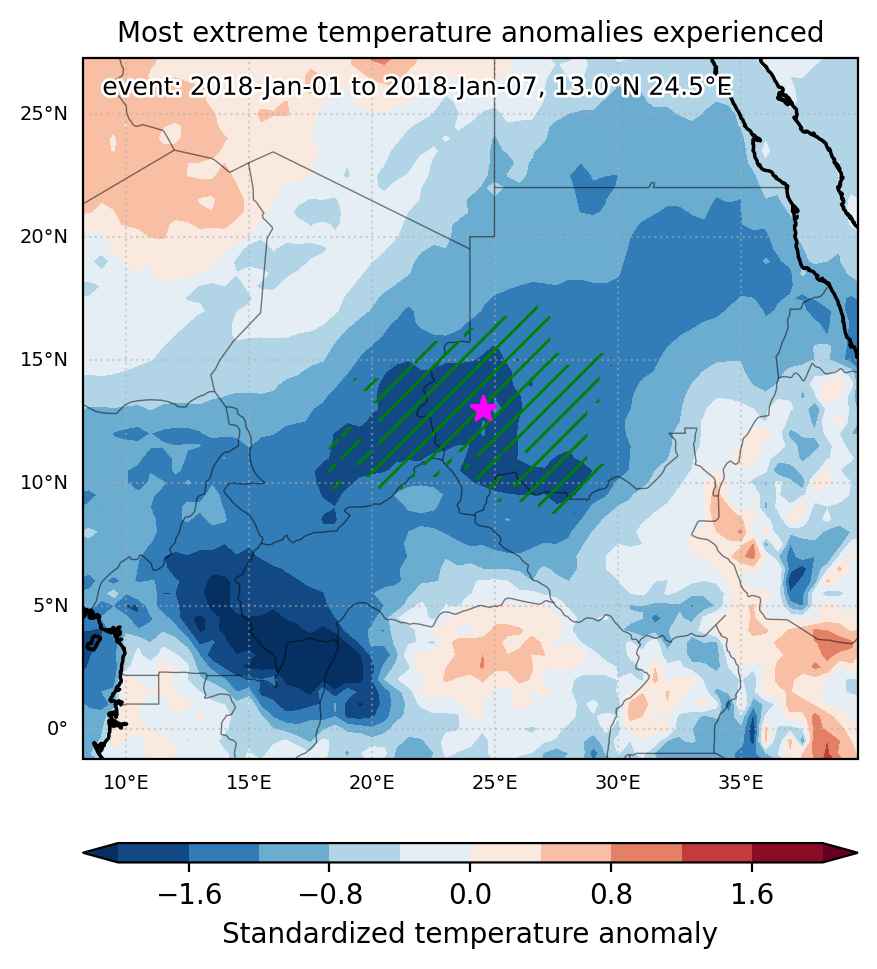
Fig. 1: Map of most extreme temperature anomalies (standardized) experienced during the event. The purple star indicates the center of the extreme event. Green hatching illustrates all areas under the effect of extremes at some time during the event.
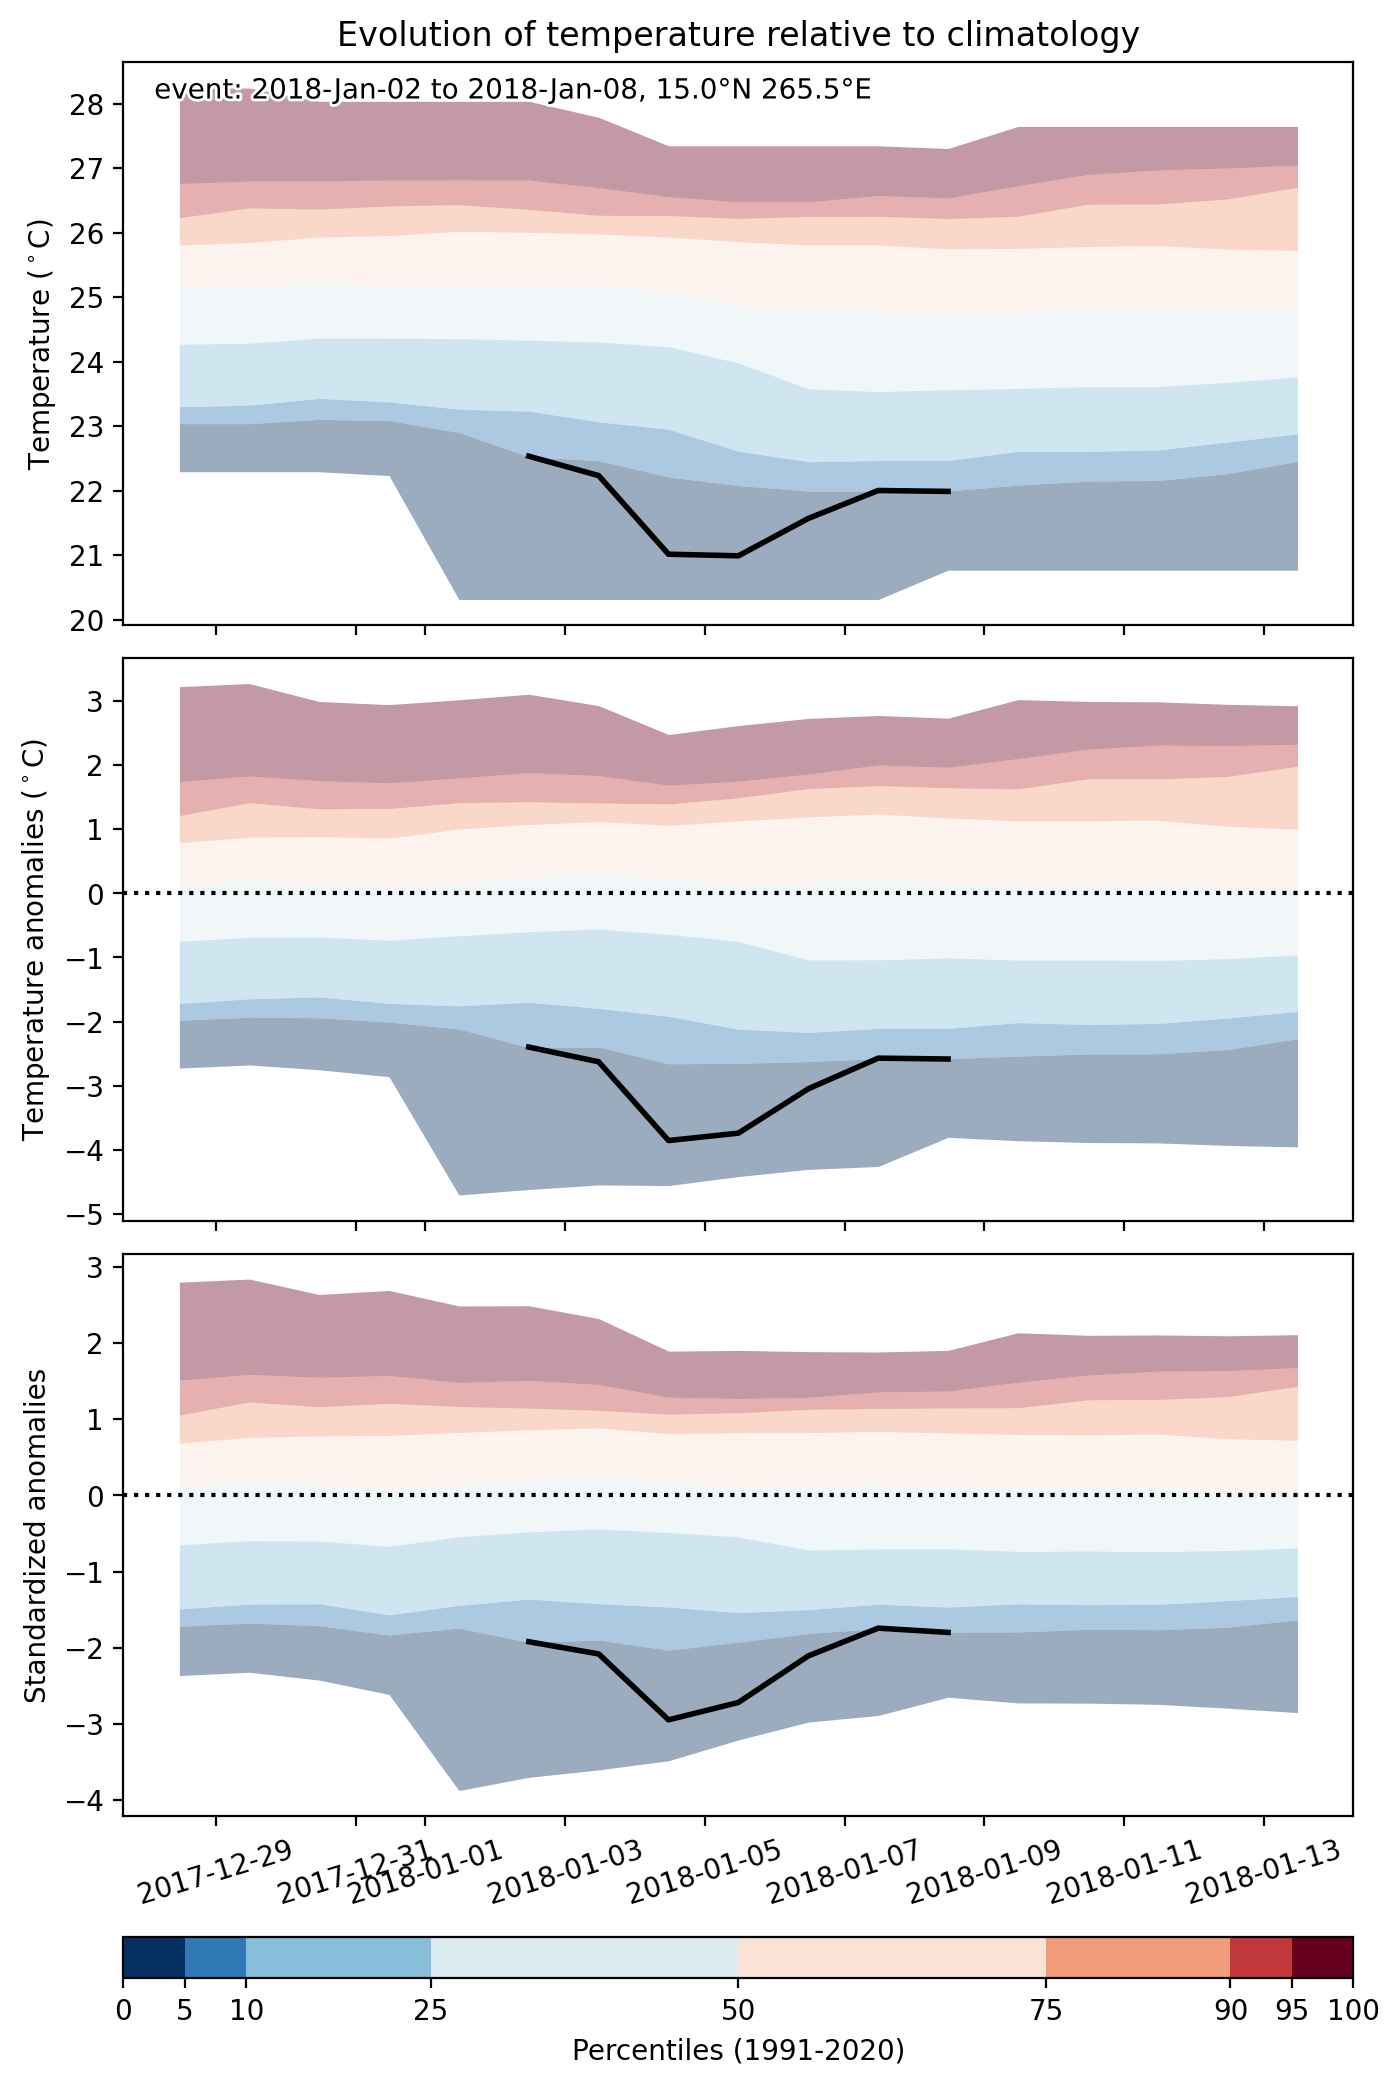


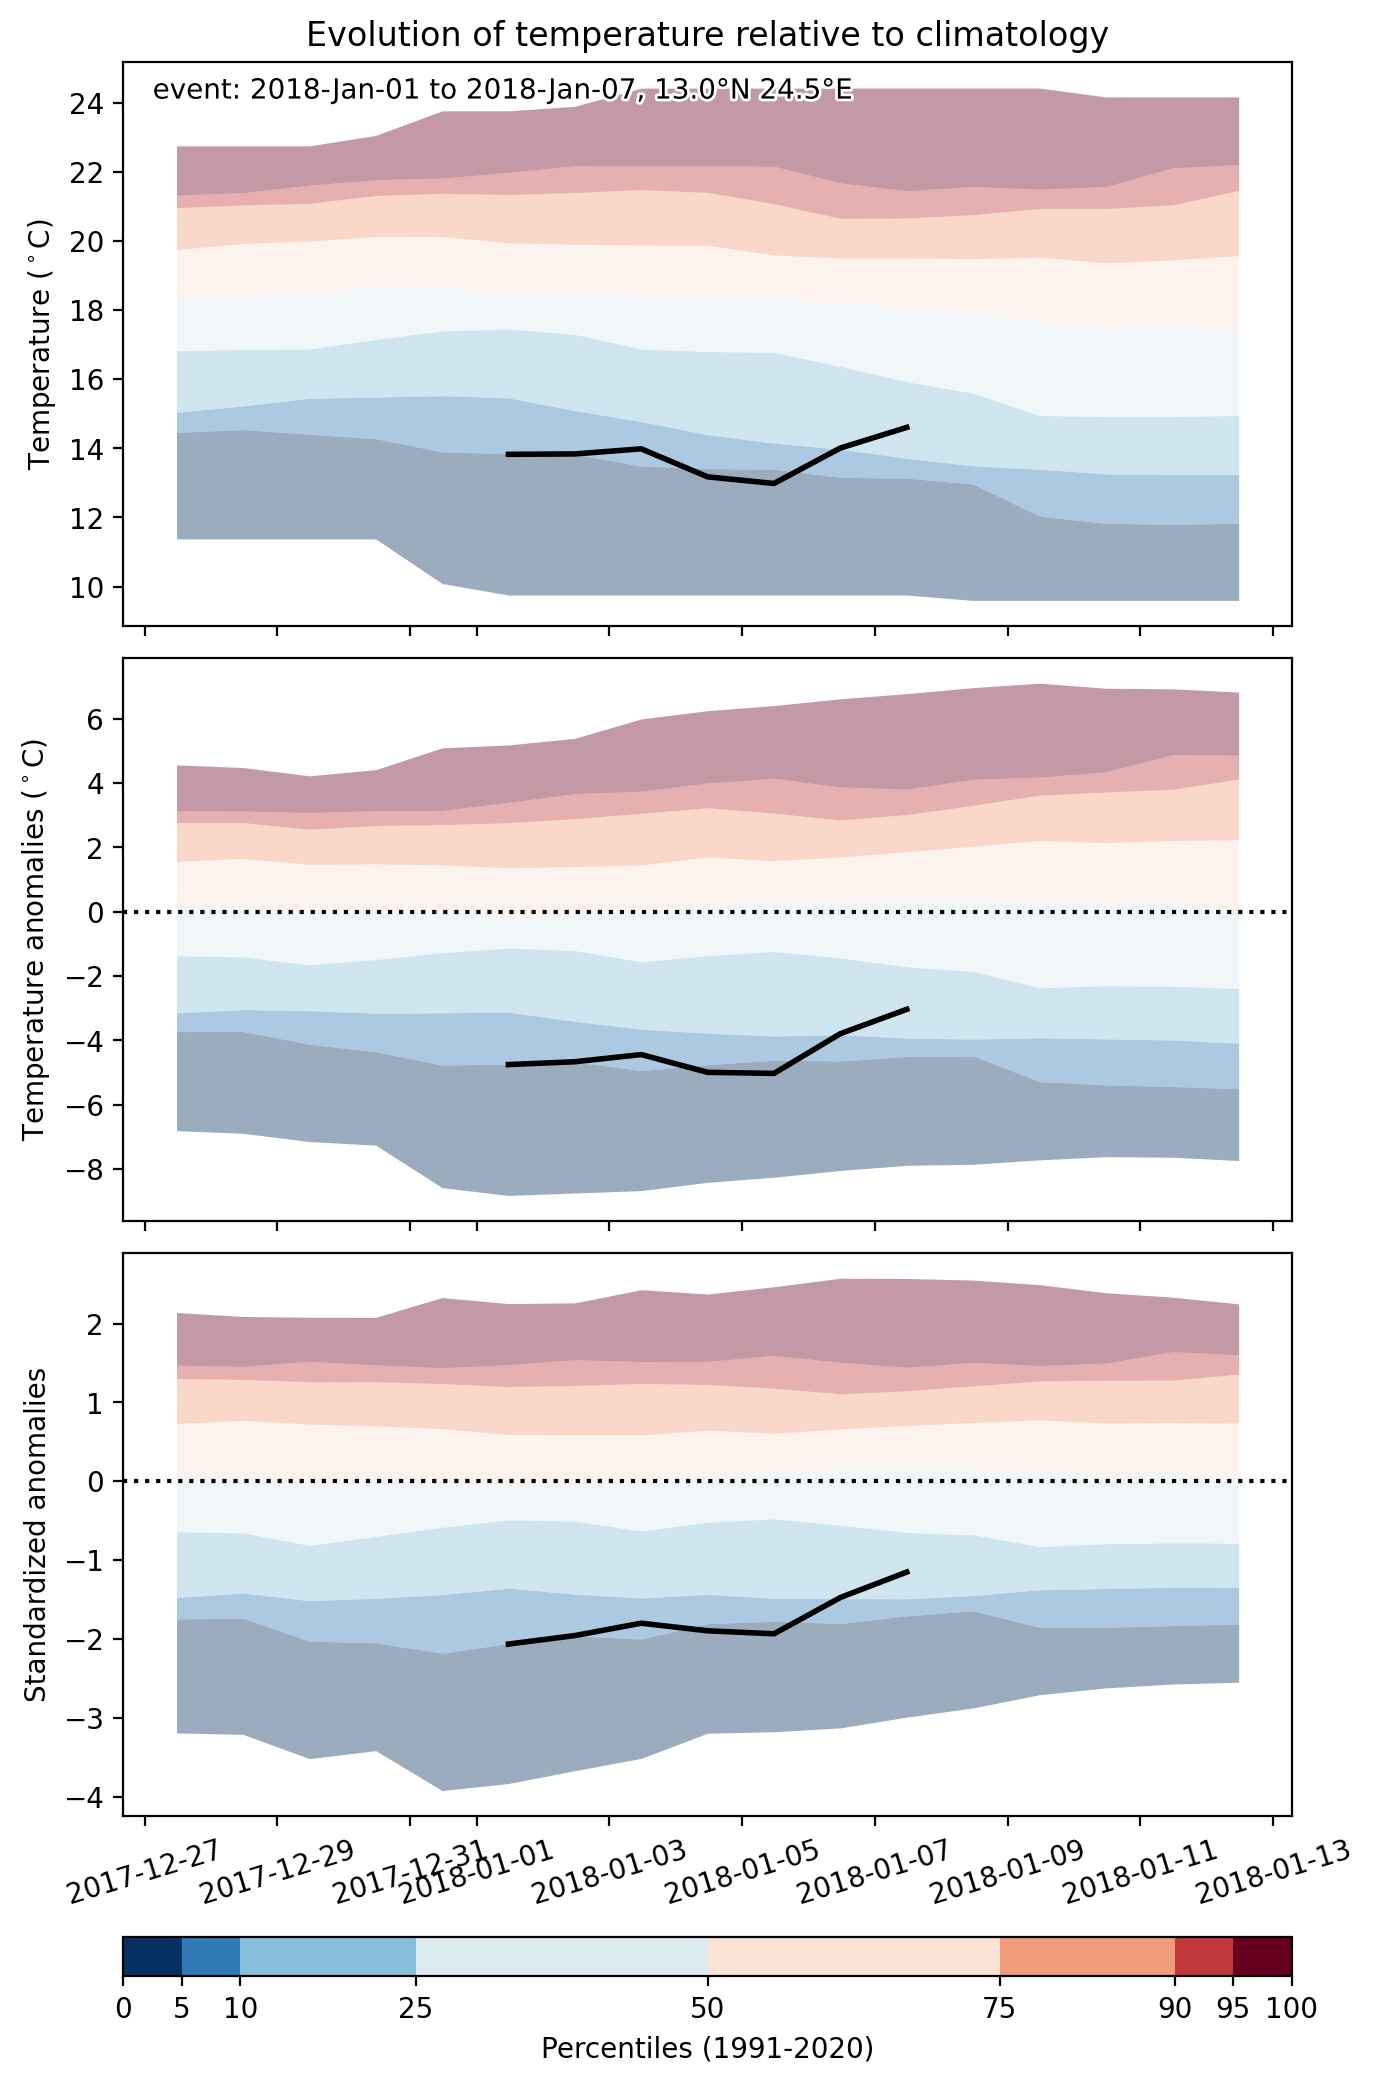
Fig. 2: Evolution of temperature at the center of the event. The climatological percentile distribution is illustrated with color shadings.
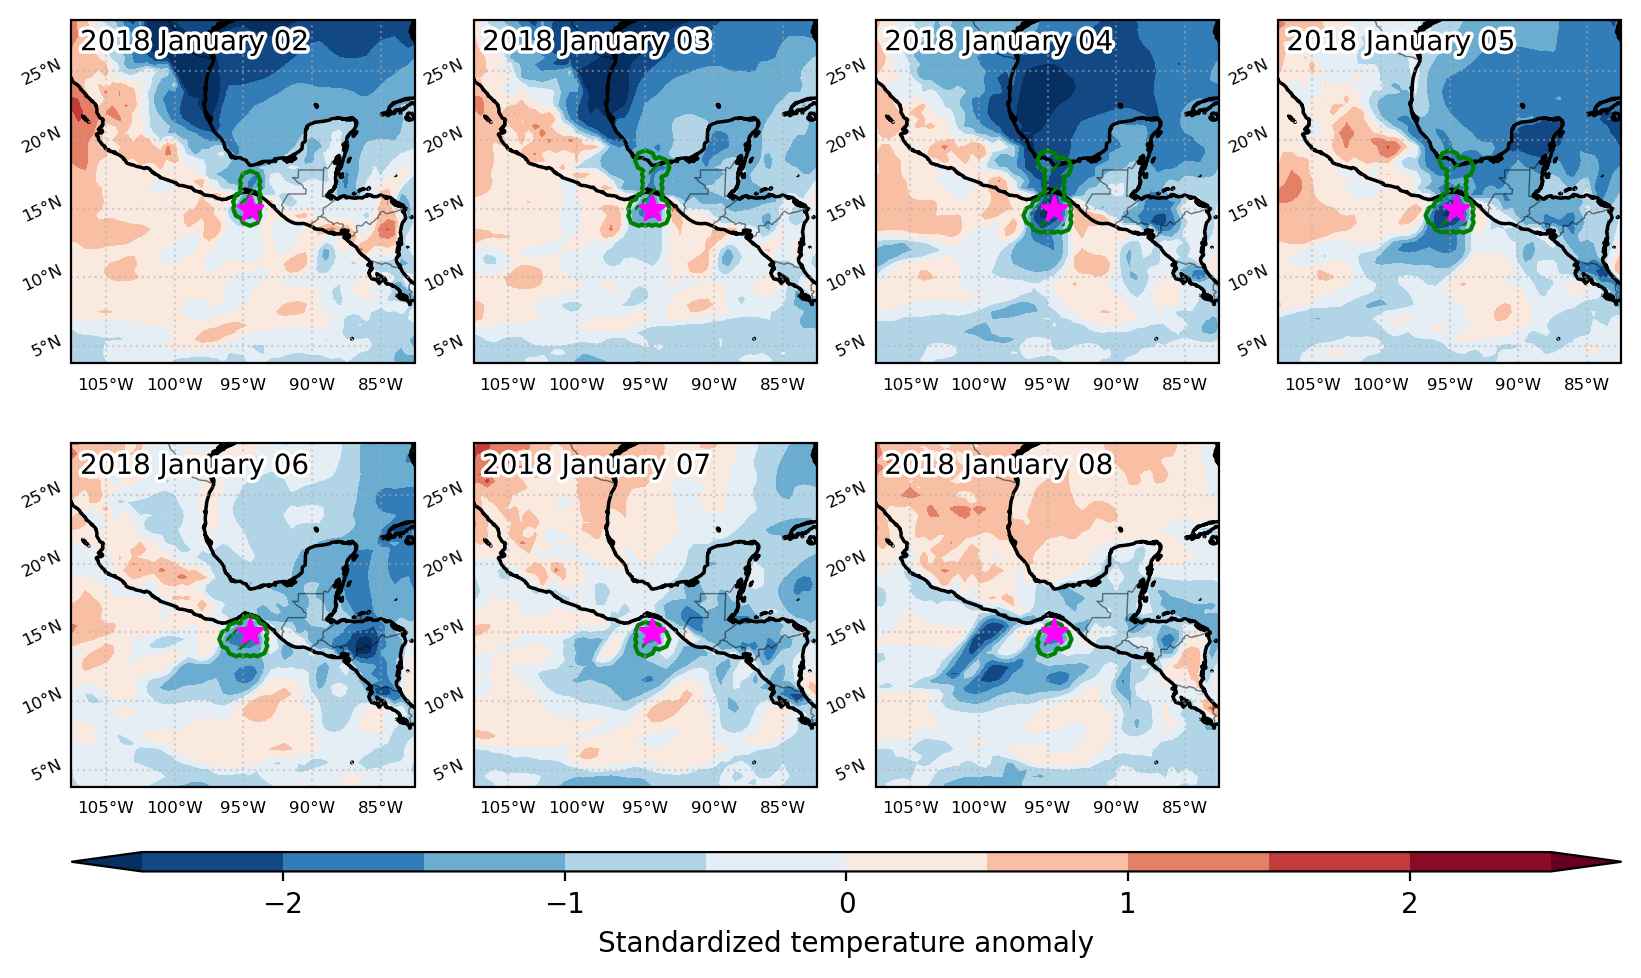


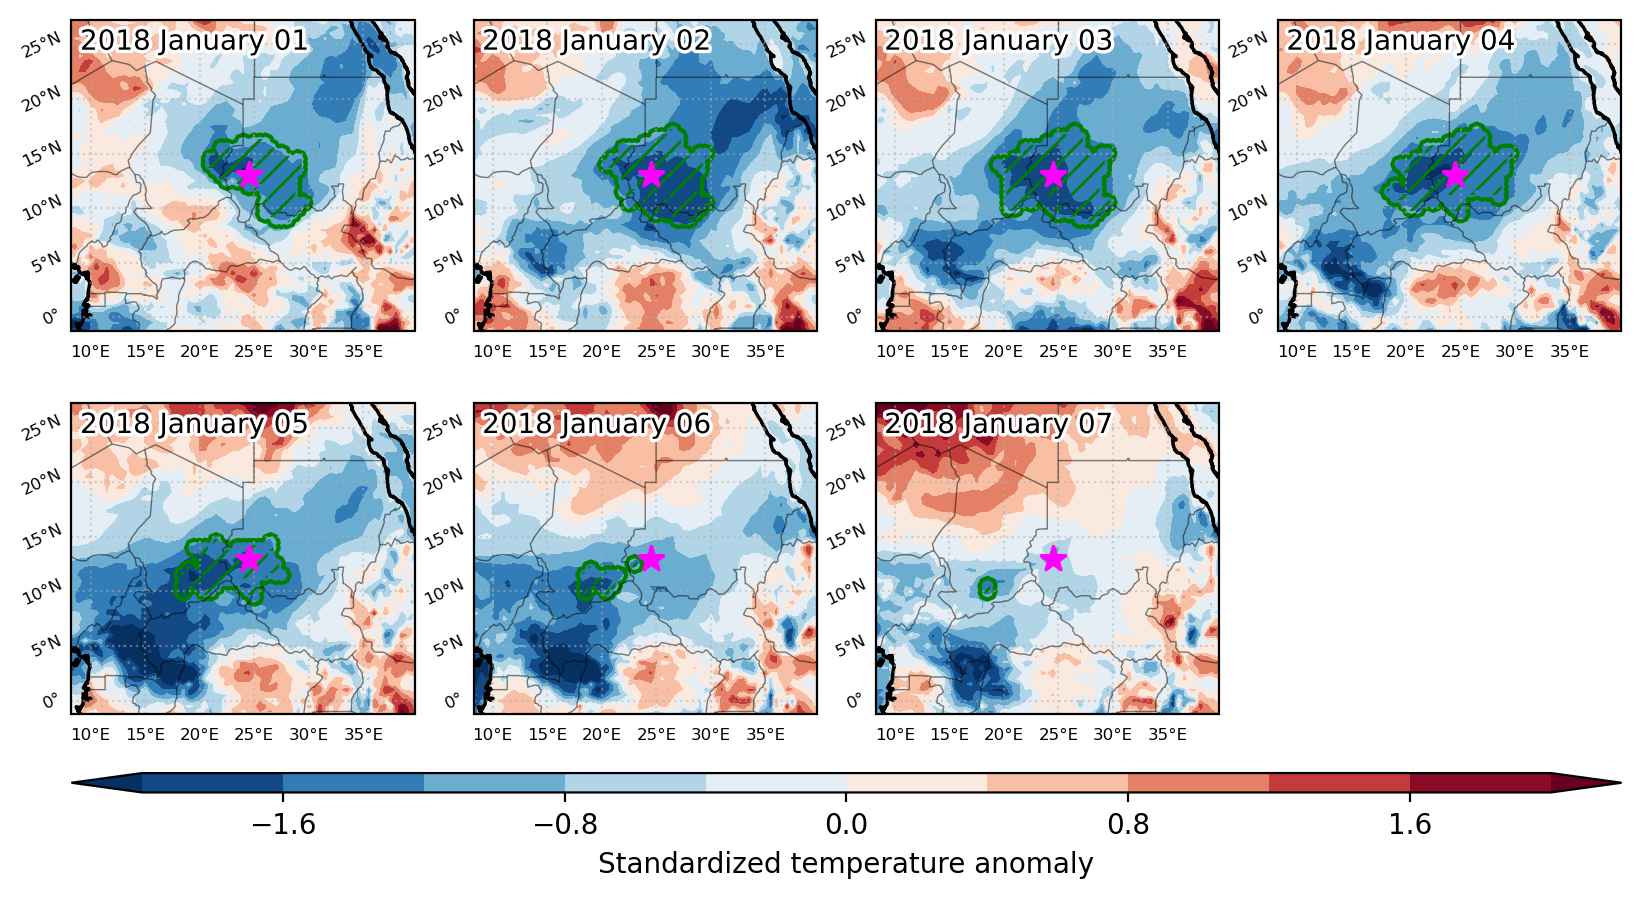
Fig. 3: Maps illustrating the evolution of standardized temperature anomalies during the event.

Event ID: Cold_spell_2018-Jan-02_to_2018-Jan-08_265.5_15.0
Cold spell occuring from January 02 2018 to January 11 2018 at 35.5°N 103.5°E

Download data: JSON

Event type: Cold spell

Countries affected (identified with ArcGIS Online; provided only for geographical reference):

  • China
  • Mongolia

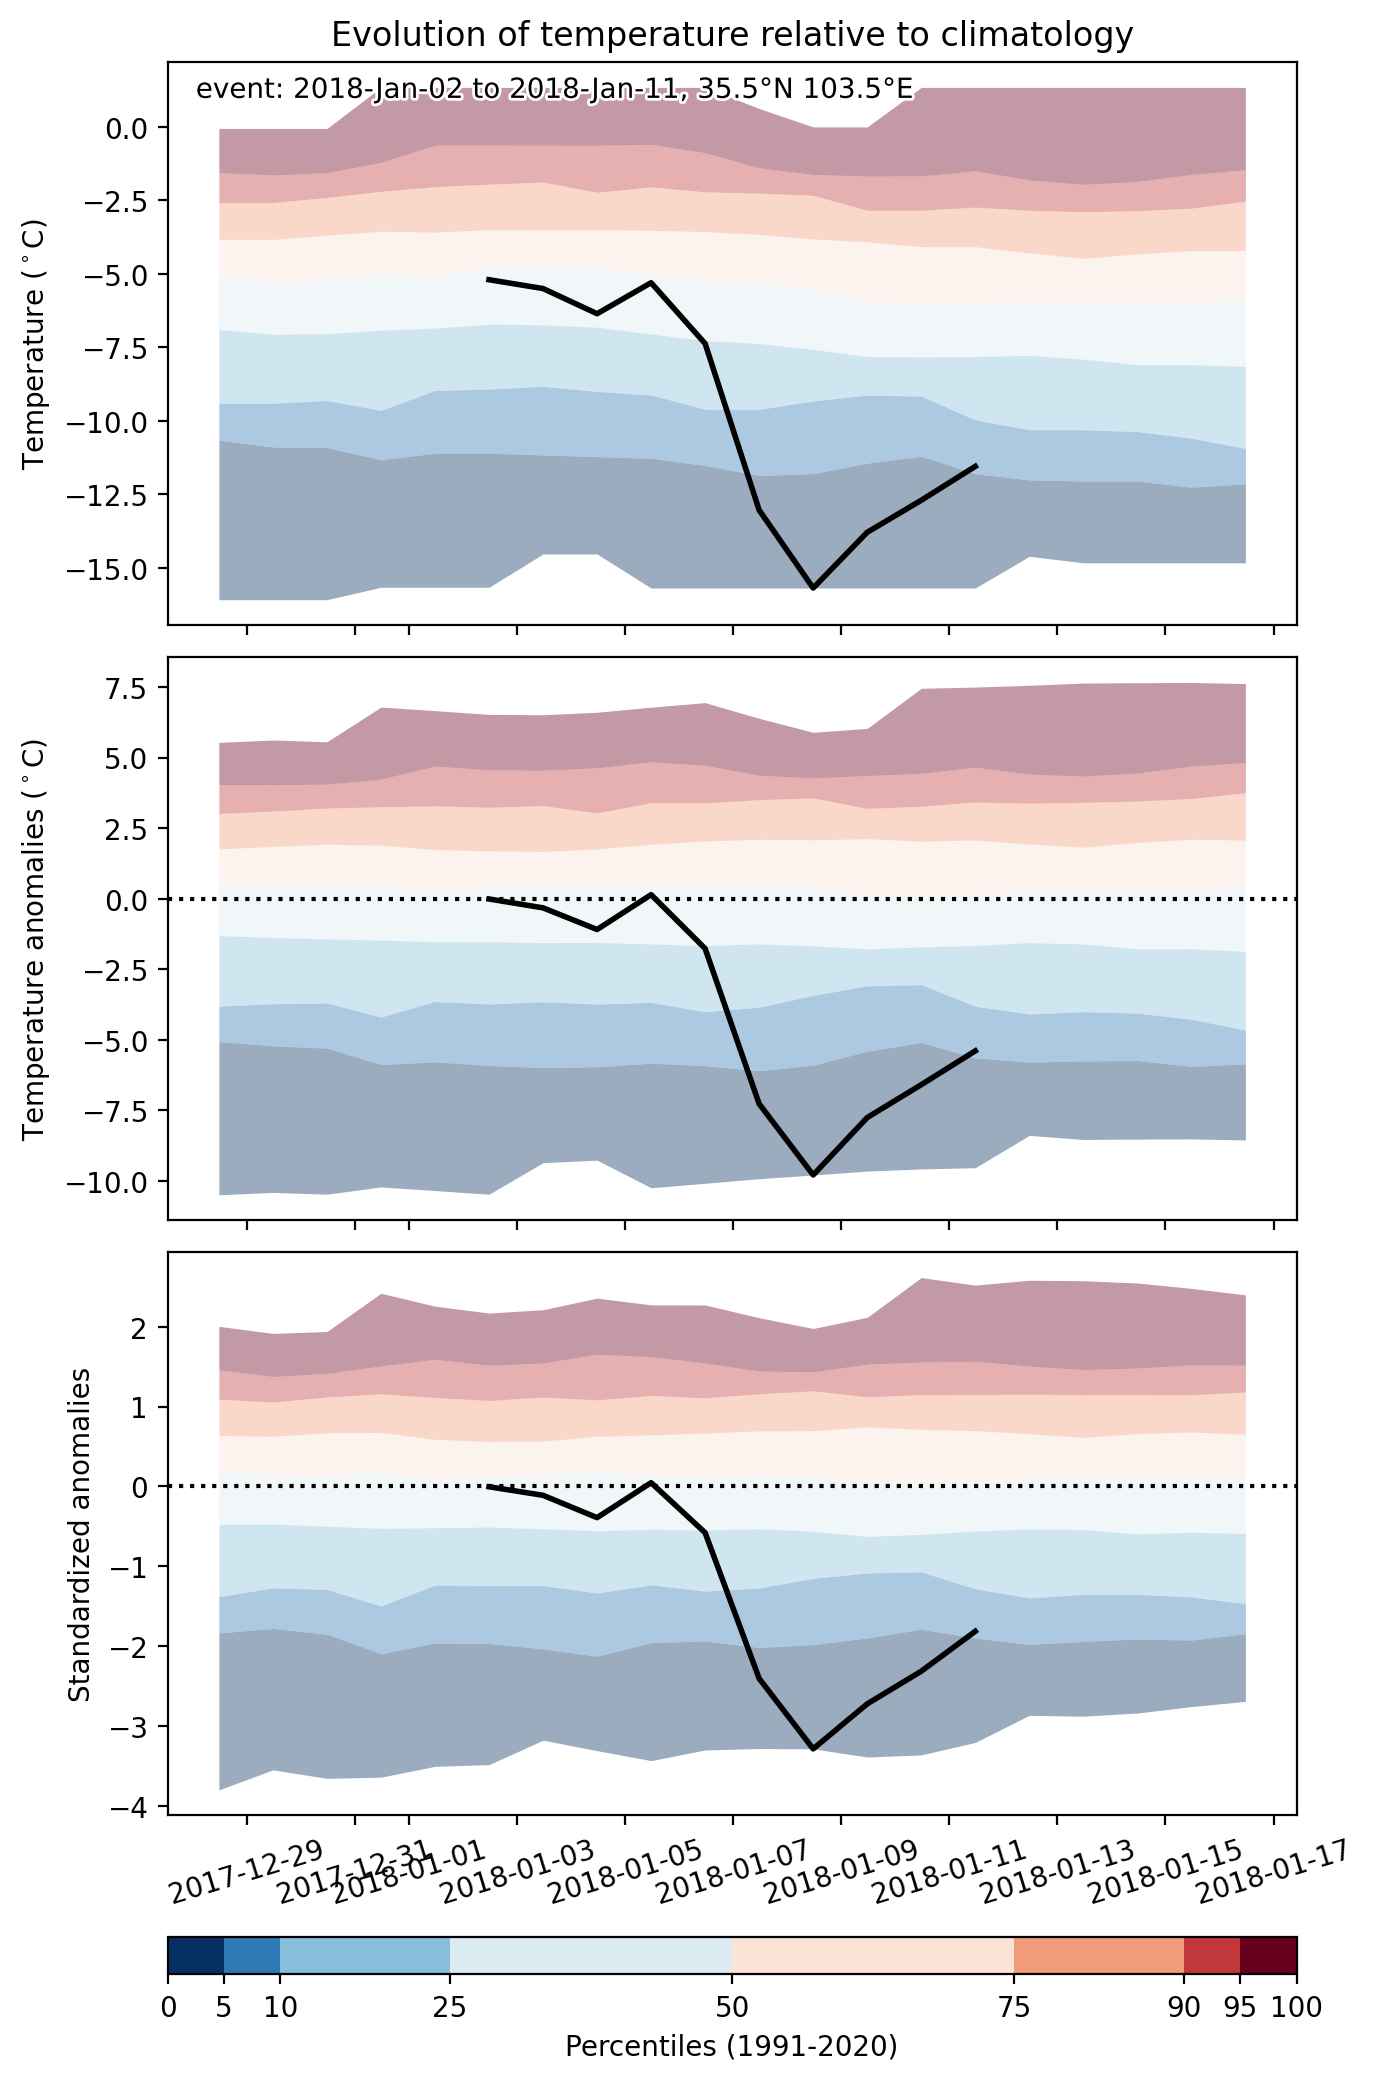
Duration: 10 days

Time span: January 02 2018 to January 11 2018

Statistics over entire affected area:

  • Mean temperature anomaly: -5.6 °C
  • Mean temperature: -17.5 °C
  • Minimum temperature anomaly: -10.4 °C
  • Minimum temperature: -30.4 °C

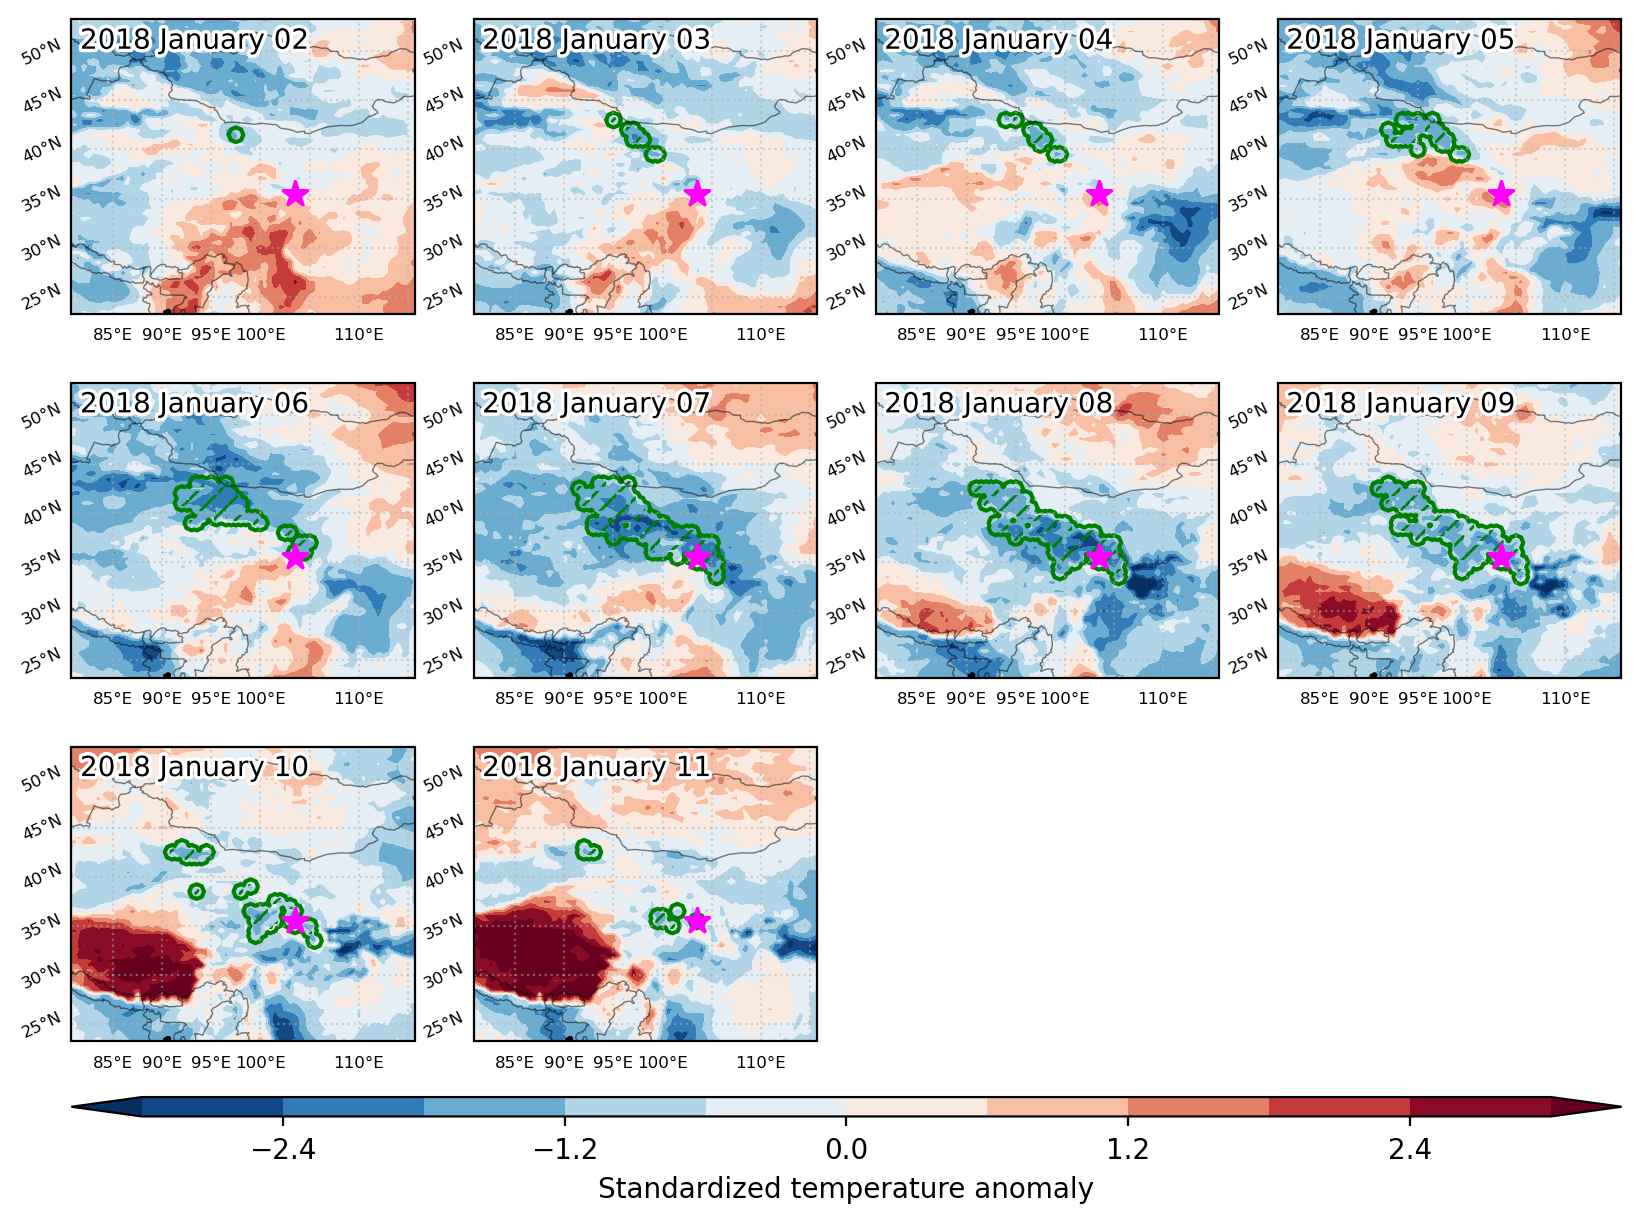
Event center: 35.5°N 103.5°E

Area affected: 378300 km$^2$


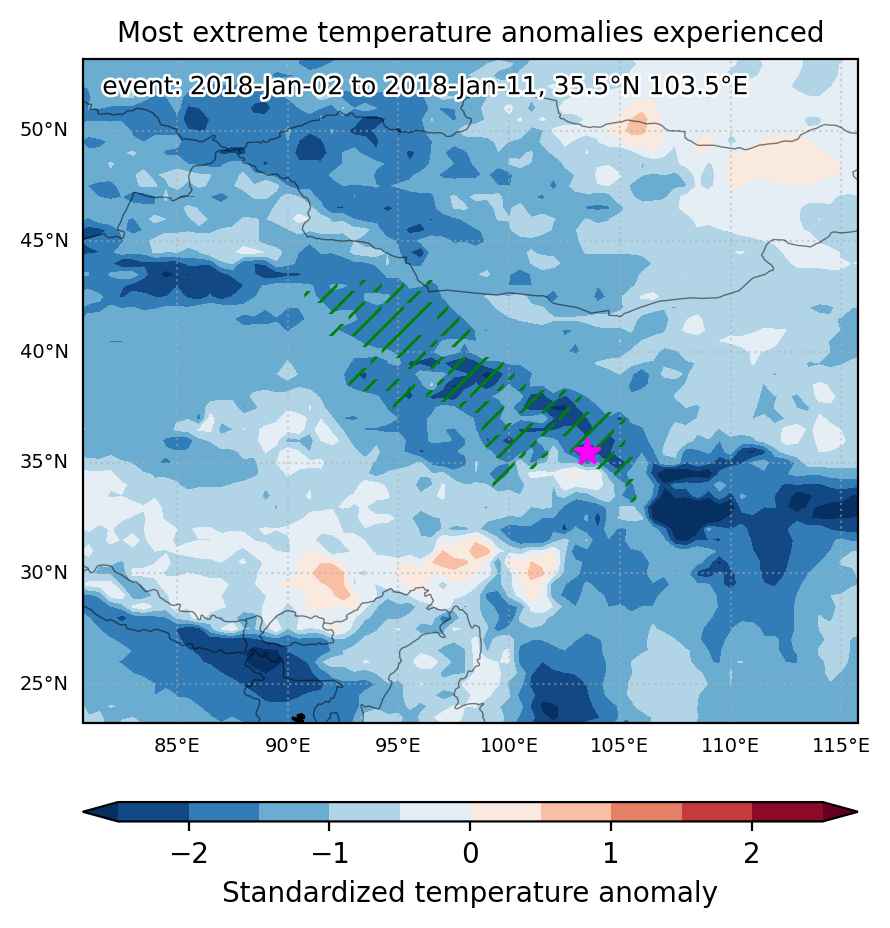
Fig. 1: Map of most extreme temperature anomalies (standardized) experienced during the event. The purple star indicates the center of the extreme event. Green hatching illustrates all areas under the effect of extremes at some time during the event.


Fig. 2: Evolution of temperature at the center of the event. The climatological percentile distribution is illustrated with color shadings.


Fig. 3: Maps illustrating the evolution of standardized temperature anomalies during the event.

Event ID: Cold_spell_2018-Jan-02_to_2018-Jan-11_103.5_35.5

Cold spell occuring from January 02 2018 to January 09 2018 at 4.0°N 16.0°E

Download data: JSON

Event type: Cold spell

Countries affected (identified with ArcGIS Online; provided only for geographical reference):

  • Cameroon
  • Central African Republic
  • Congo
  • Congo DRC

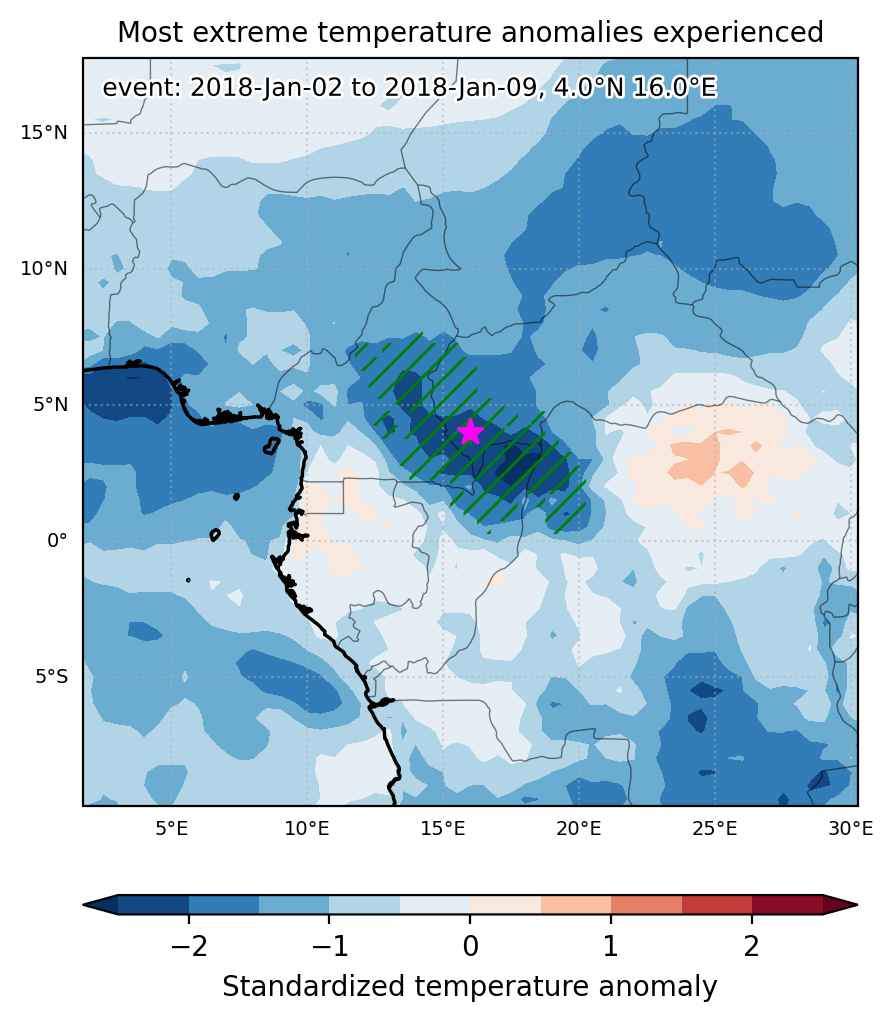
Duration: 8 days

Time span: January 02 2018 to January 09 2018

Statistics over entire affected area:

  • Mean temperature anomaly: -2.2 °C
  • Mean temperature: 22.4 °C
  • Minimum temperature anomaly: -3.9 °C
  • Minimum temperature: 18.4 °C

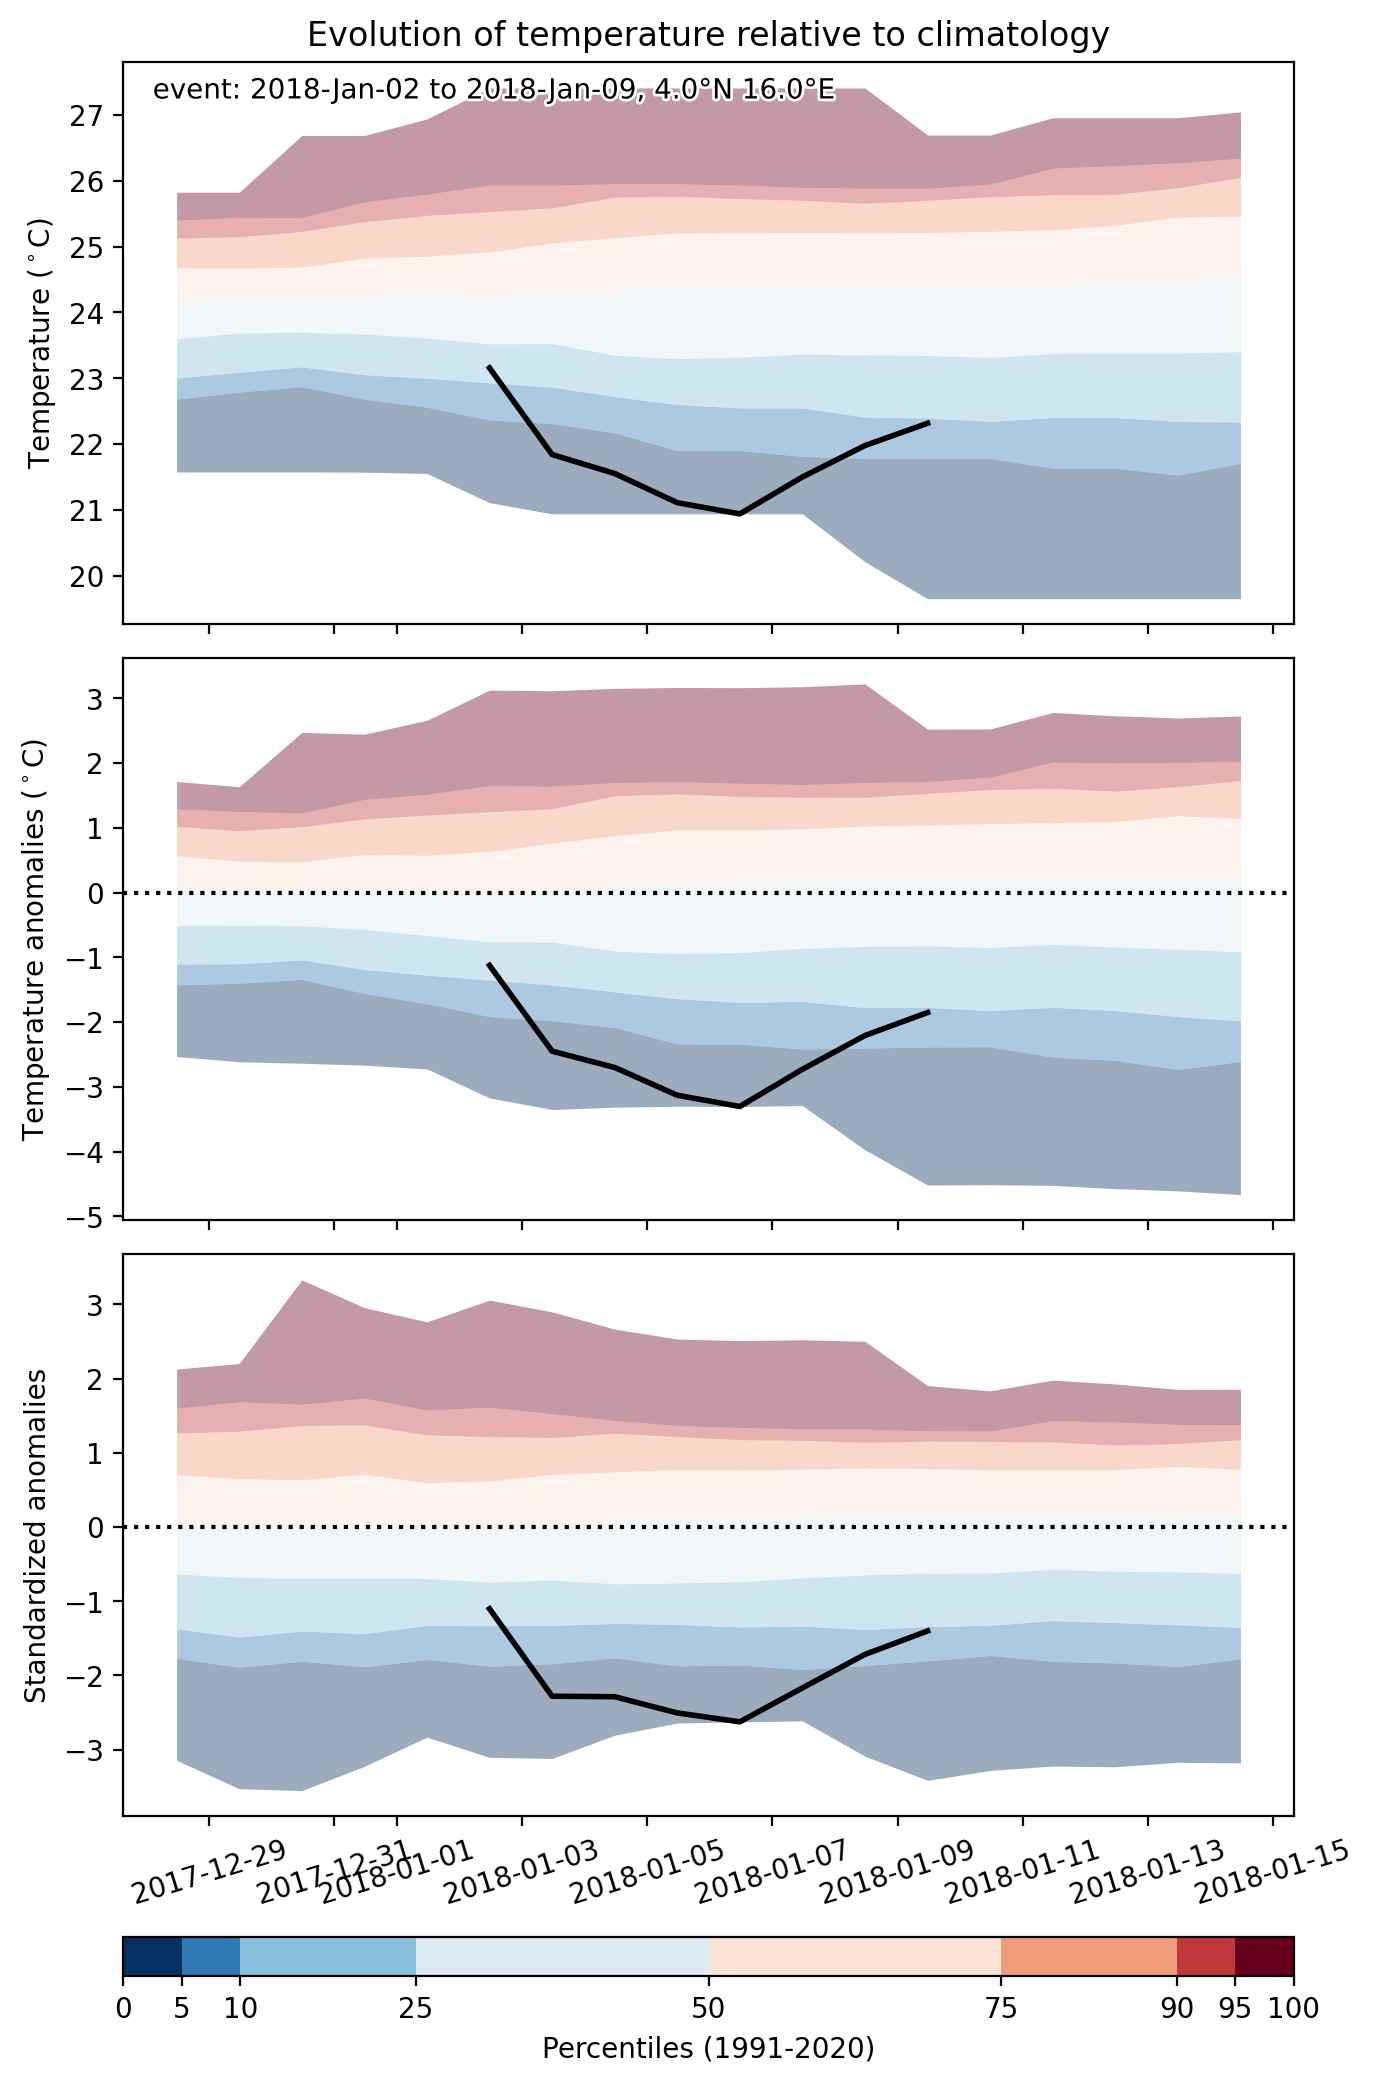
Event center: 4.0°N 16.0°E

Area affected: 391483 km$^2$


Fig. 1: Map of most extreme temperature anomalies (standardized) experienced during the event. The purple star indicates the center of the extreme event. Green hatching illustrates all areas under the effect of extremes at some time during the event.


Fig. 2: Evolution of temperature at the center of the event. The climatological percentile distribution is illustrated with color shadings.


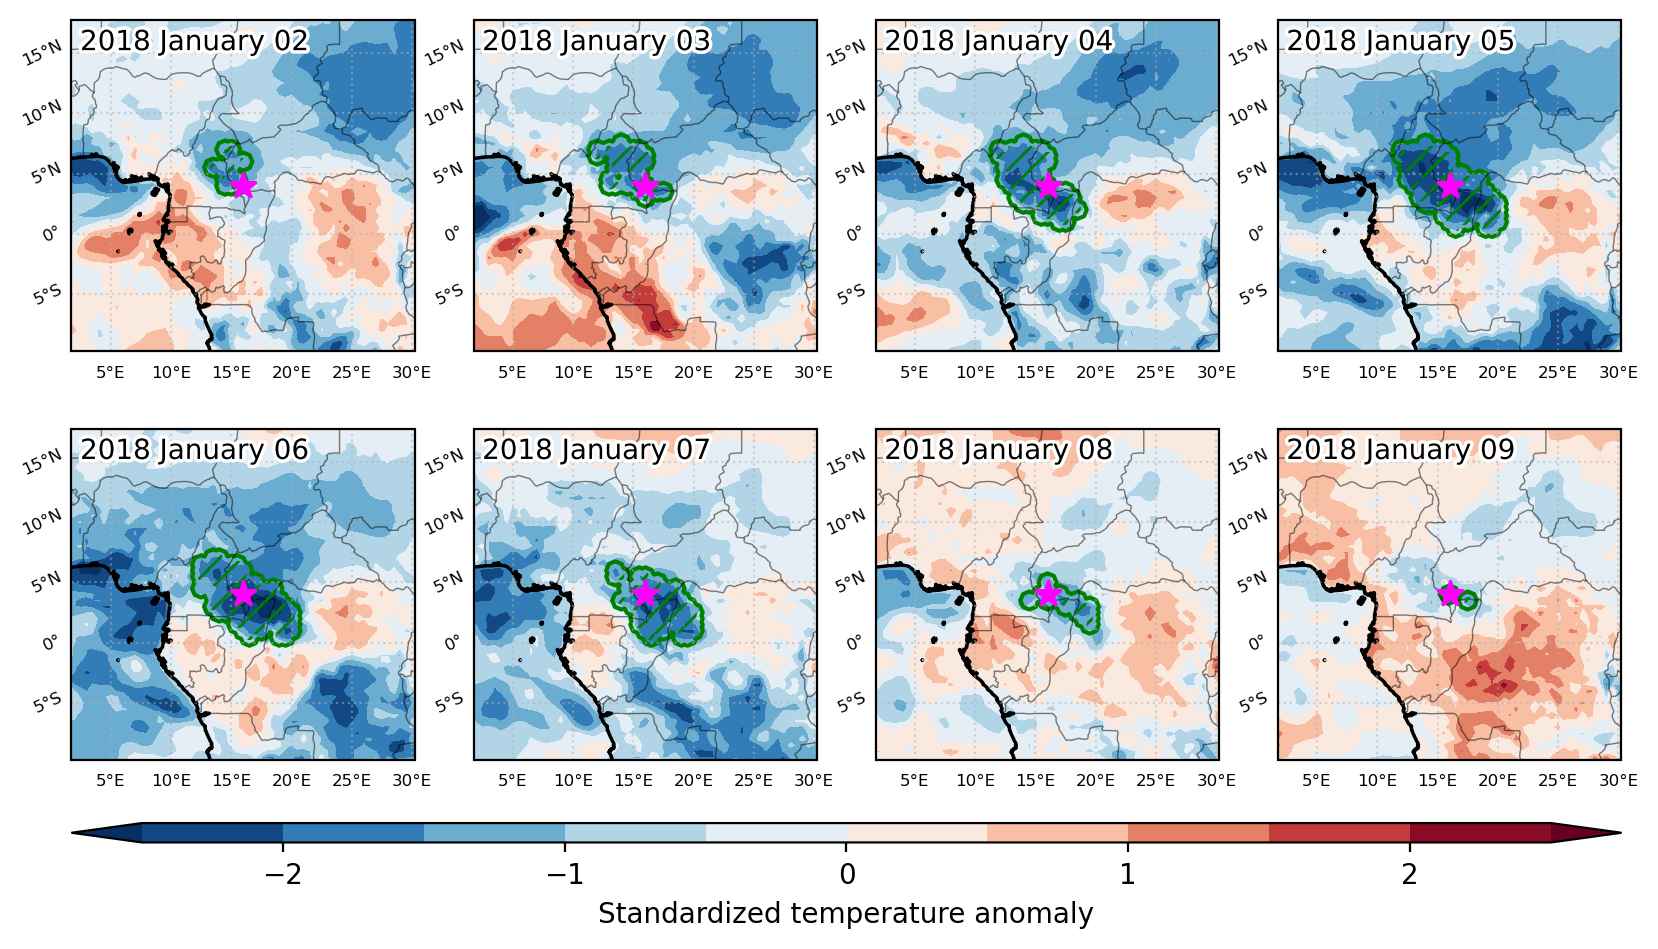
Fig. 3: Maps illustrating the evolution of standardized temperature anomalies during the event.

Event ID: Cold_spell_2018-Jan-02_to_2018-Jan-09_16.0_4.0

Cold spell occuring from January 02 2018 to January 05 2018 at -27.0°S 34.5°E

Download data: JSON

Event type: Cold spell

Countries affected (identified with ArcGIS Online; provided only for geographical reference):

  • Eswatini
  • Mozambique
  • South Africa
  • Zimbabwe

Duration: 4 days

Time span: January 02 2018 to January 05 2018

Statistics over entire affected area:

  • Mean temperature anomaly: -2.4 °C
  • Mean temperature: 22.9 °C
  • Minimum temperature anomaly: -5.7 °C
  • Minimum temperature: 13.3 °C

Event center: -27.0°S 34.5°E

Area affected: 618202 km$^2$


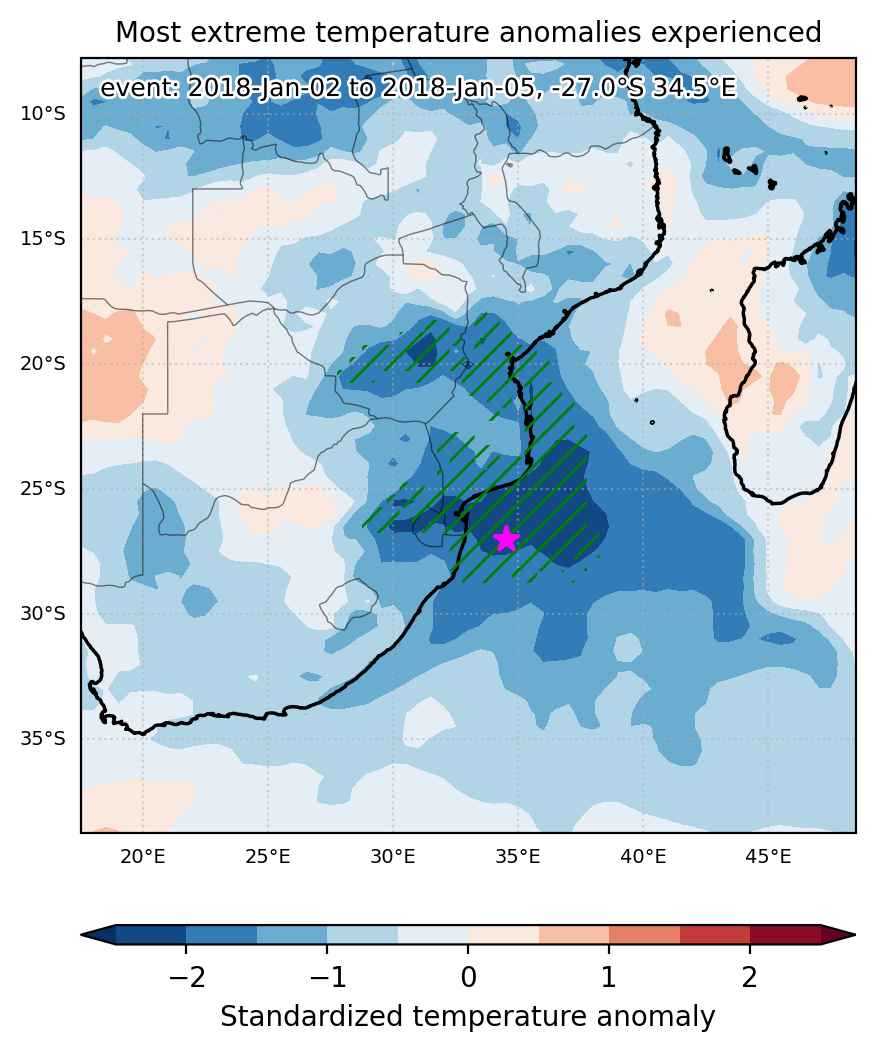
Fig. 1: Map of most extreme temperature anomalies (standardized) experienced during the event. The purple star indicates the center of the extreme event. Green hatching illustrates all areas under the effect of extremes at some time during the event.


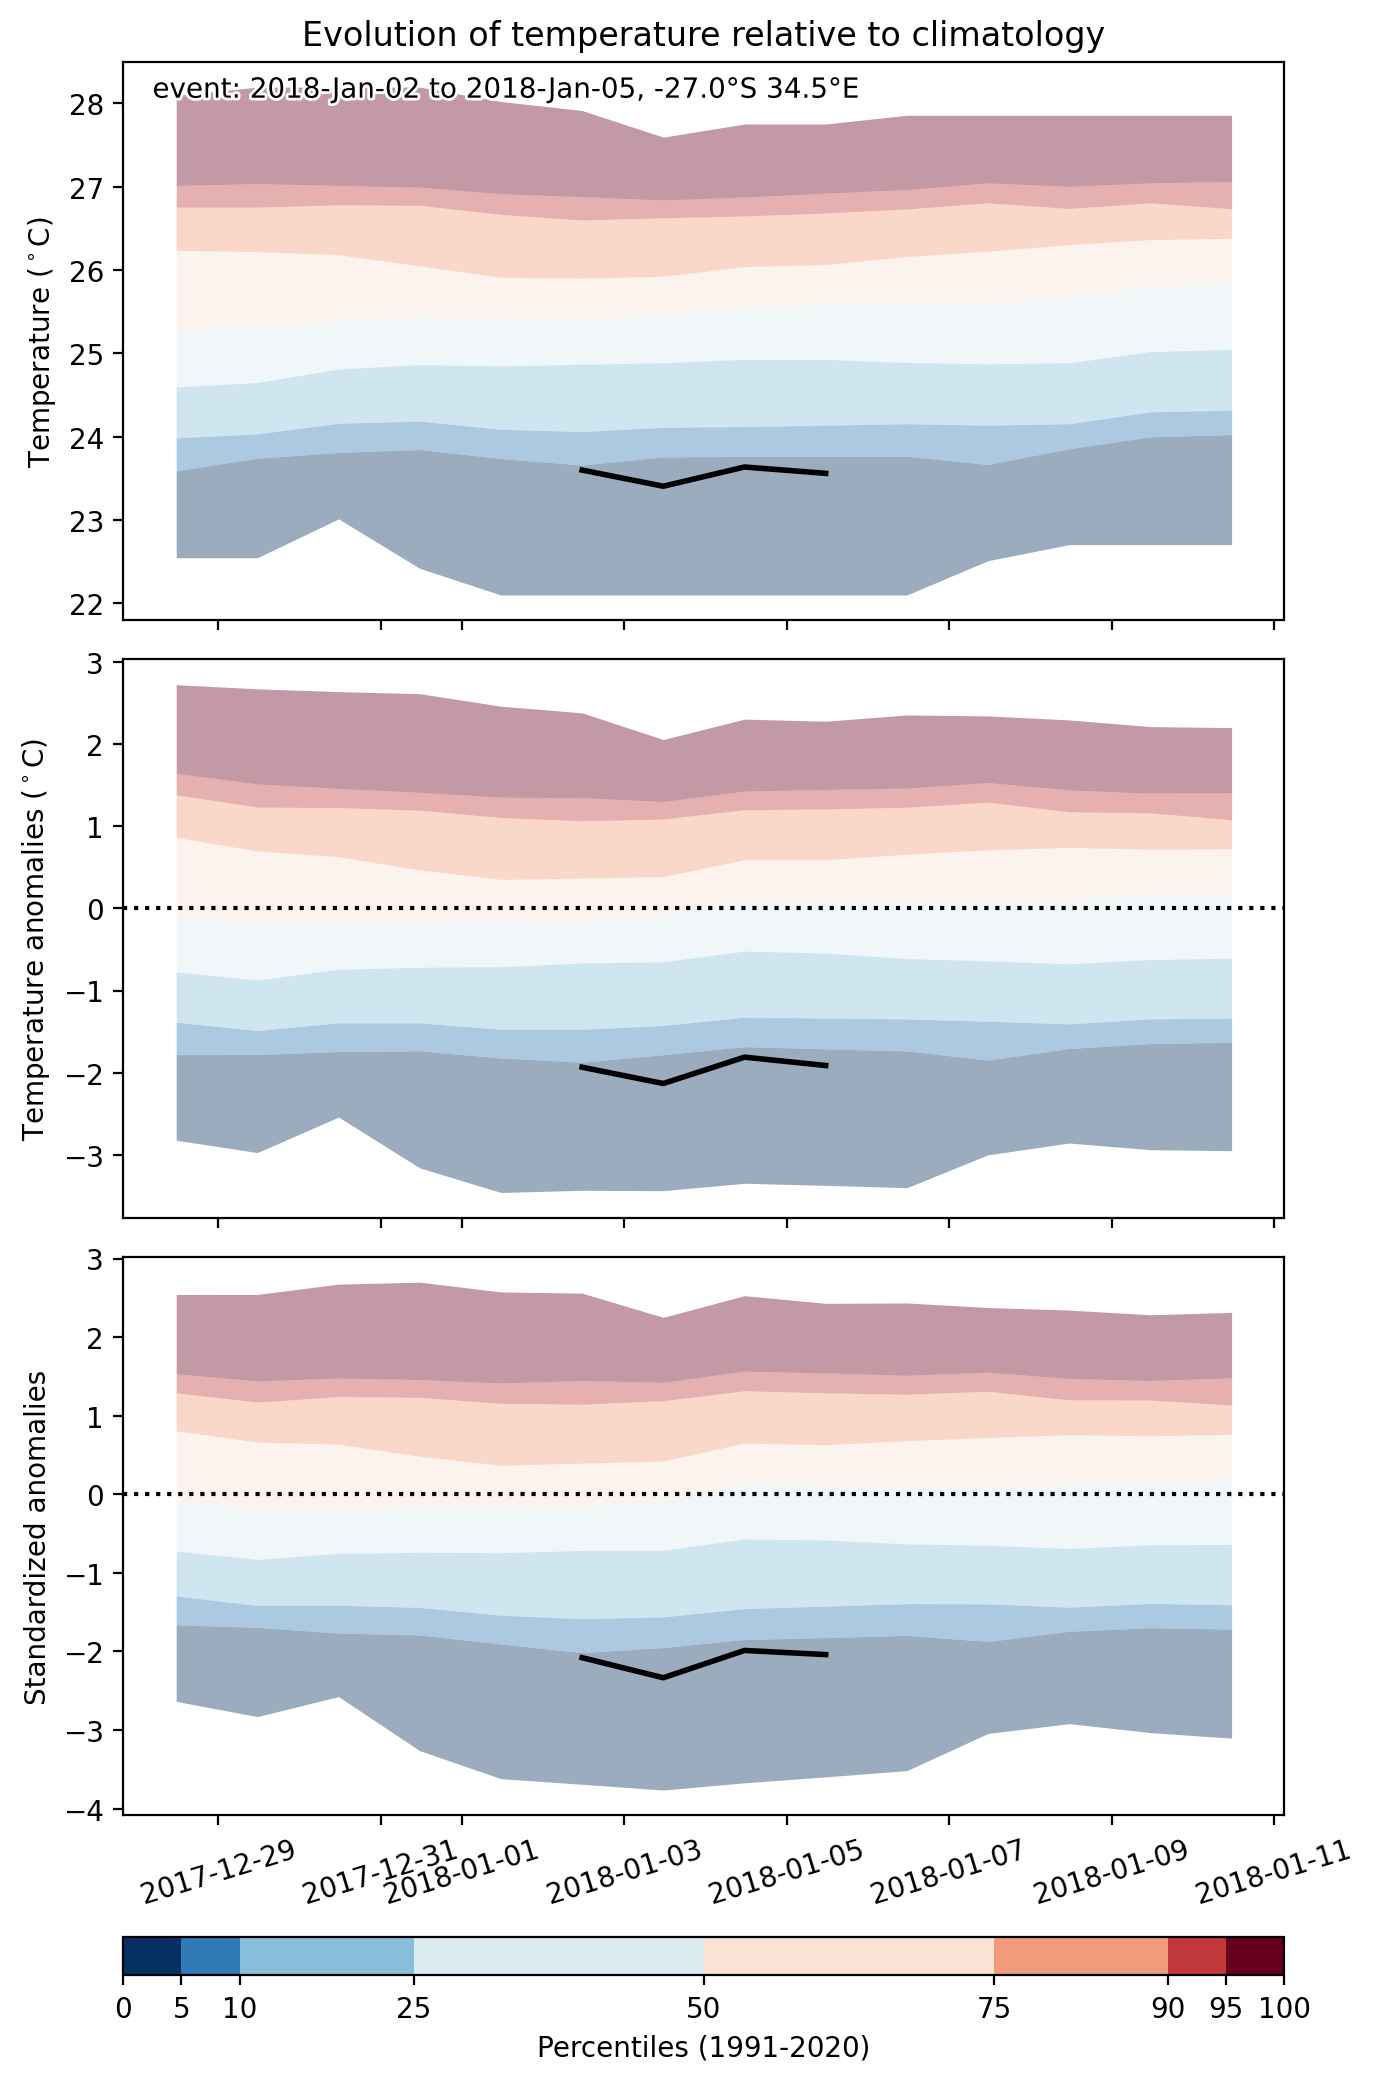
Fig. 2: Evolution of temperature at the center of the event. The climatological percentile distribution is illustrated with color shadings.


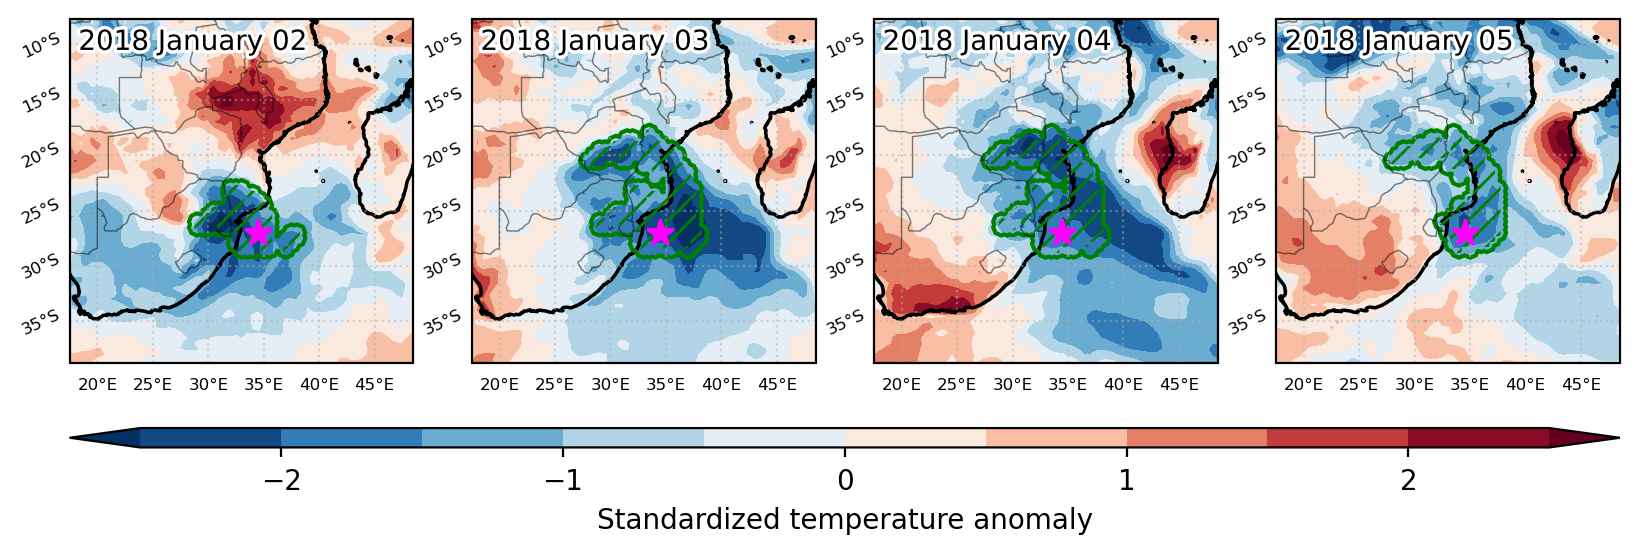
Fig. 3: Maps illustrating the evolution of standardized temperature anomalies during the event.

Event ID: Cold_spell_2018-Jan-02_to_2018-Jan-05_34.5_-27.0

Heat wave occuring from January 01 2018 to February 03 2018 at 12.0°N 287.0°E

Download data: JSON

Event type: Heat wave

Countries affected (identified with ArcGIS Online; provided only for geographical reference):

  • Aruba
  • Colombia
  • Cuba
  • Dominican Republic
  • Jamaica
  • Panama
  • Puerto Rico
  • Venezuela

Duration: 34 days

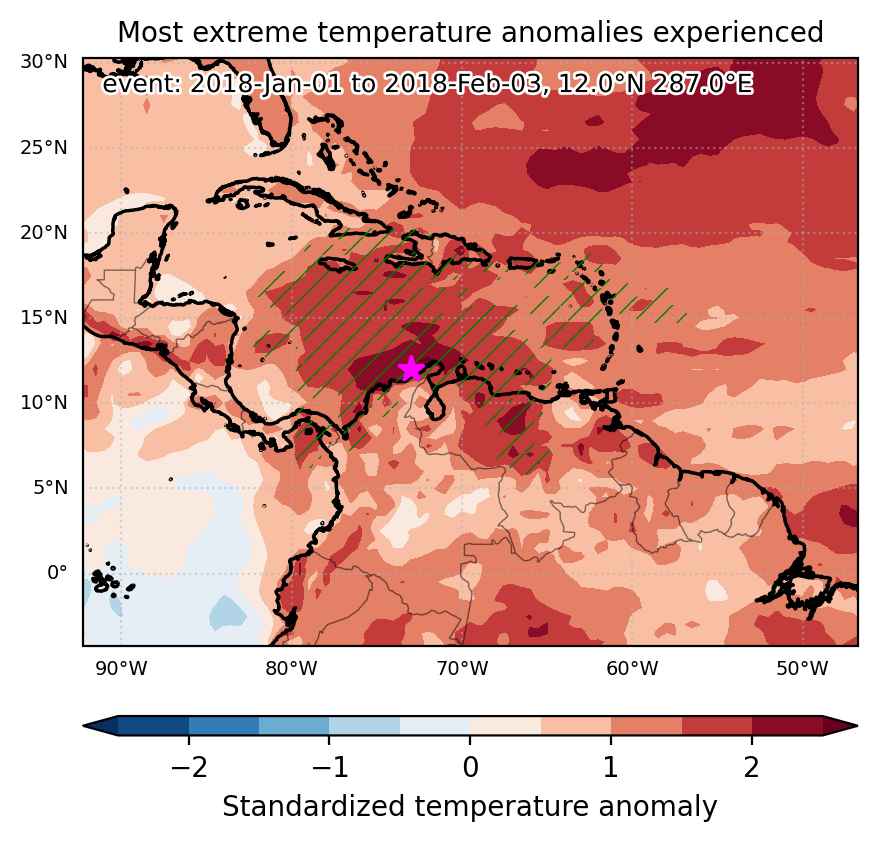
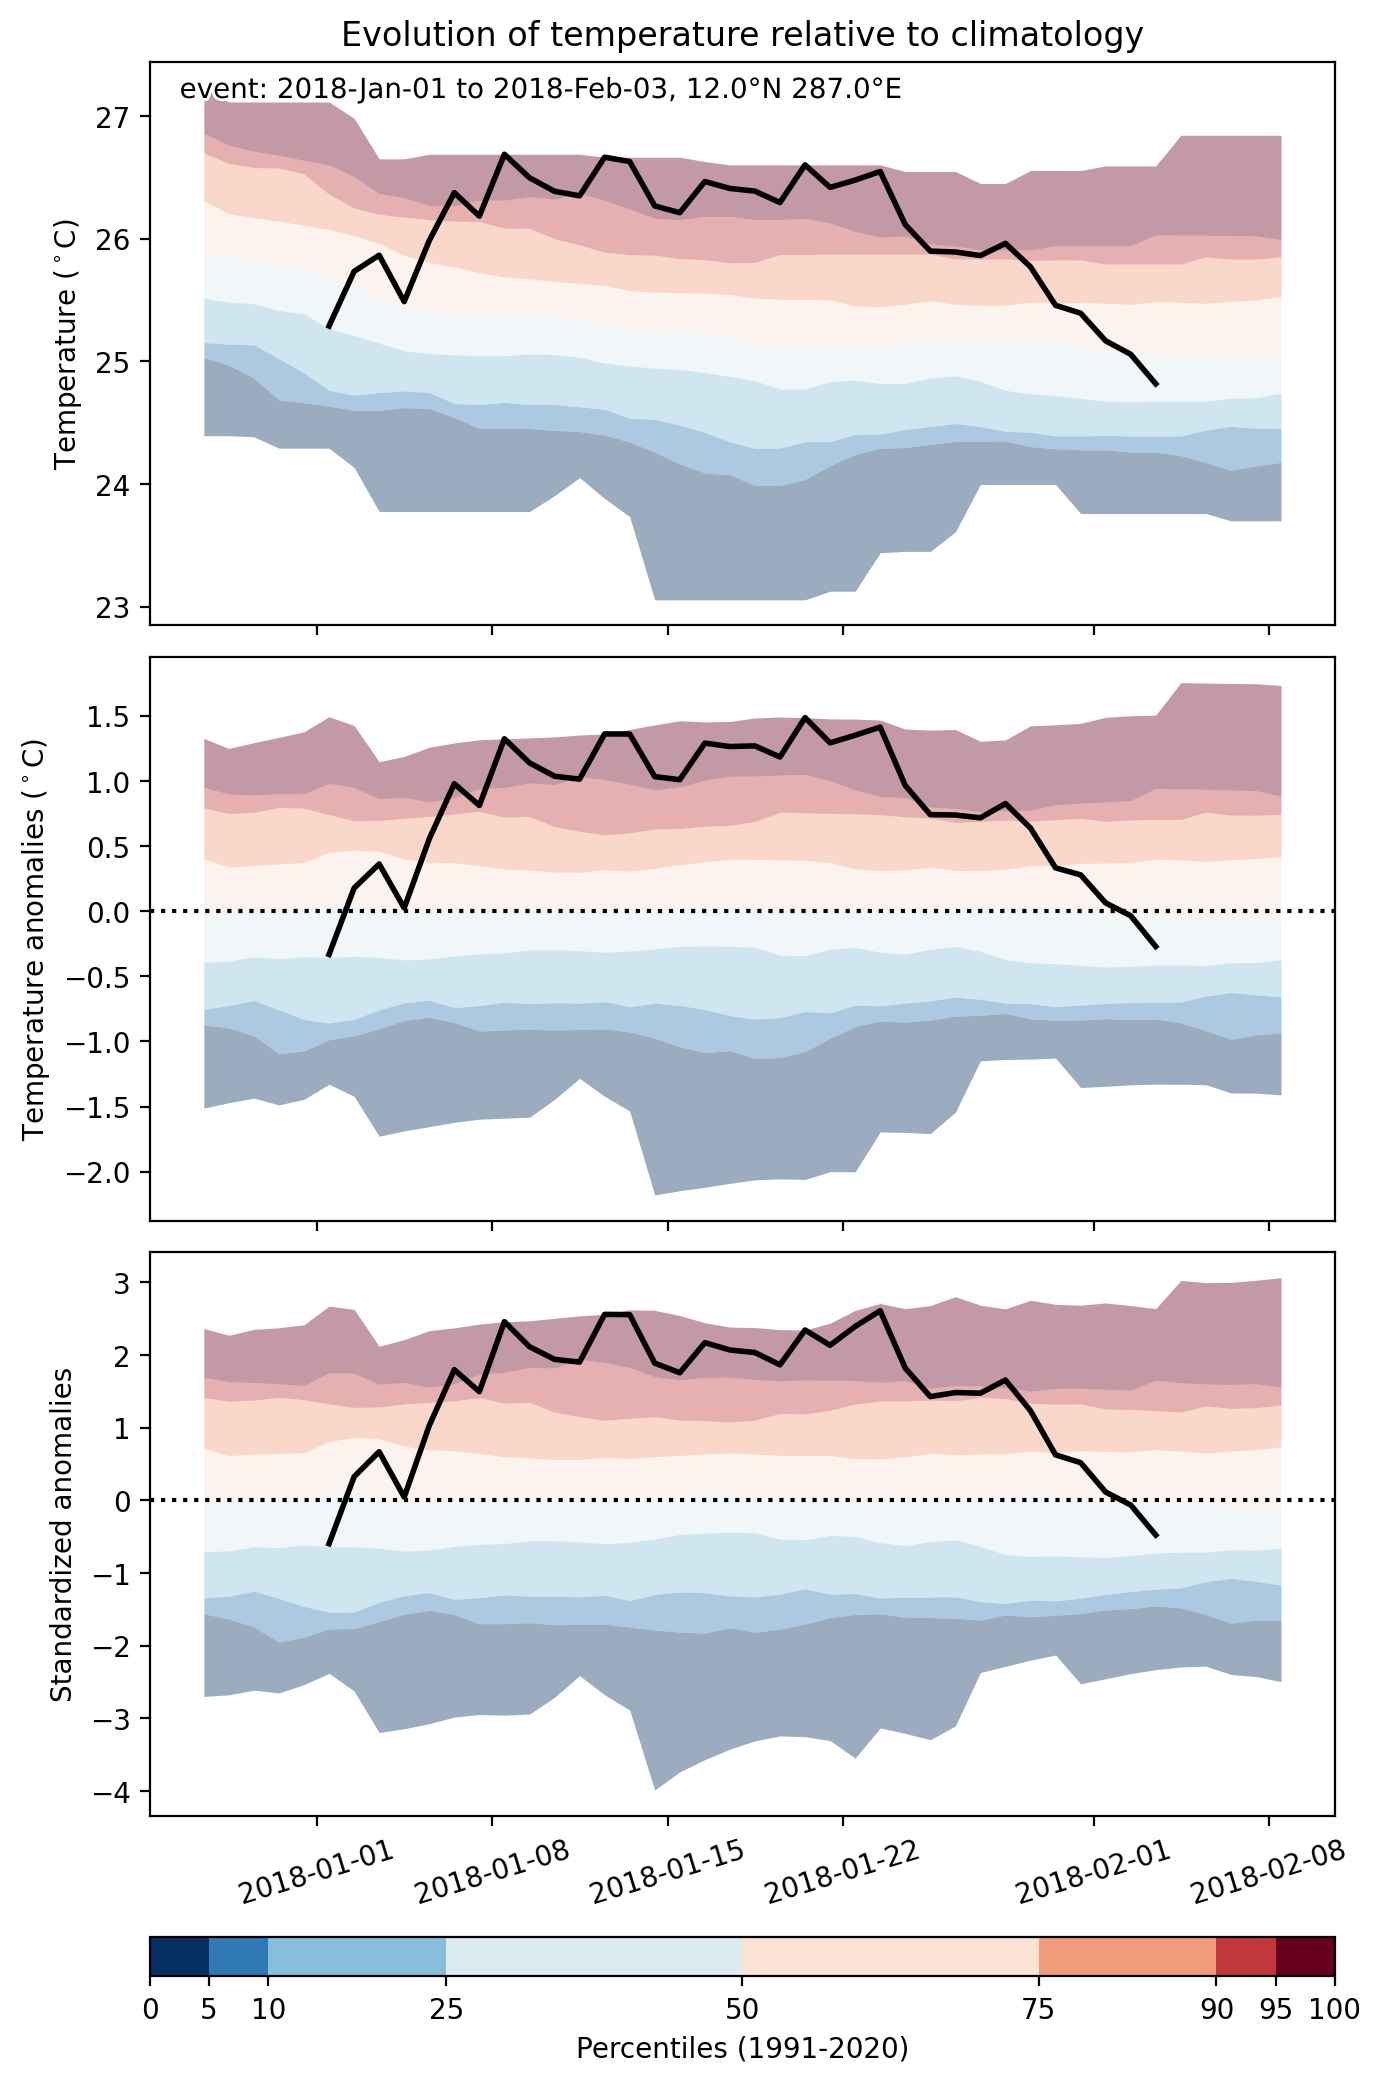
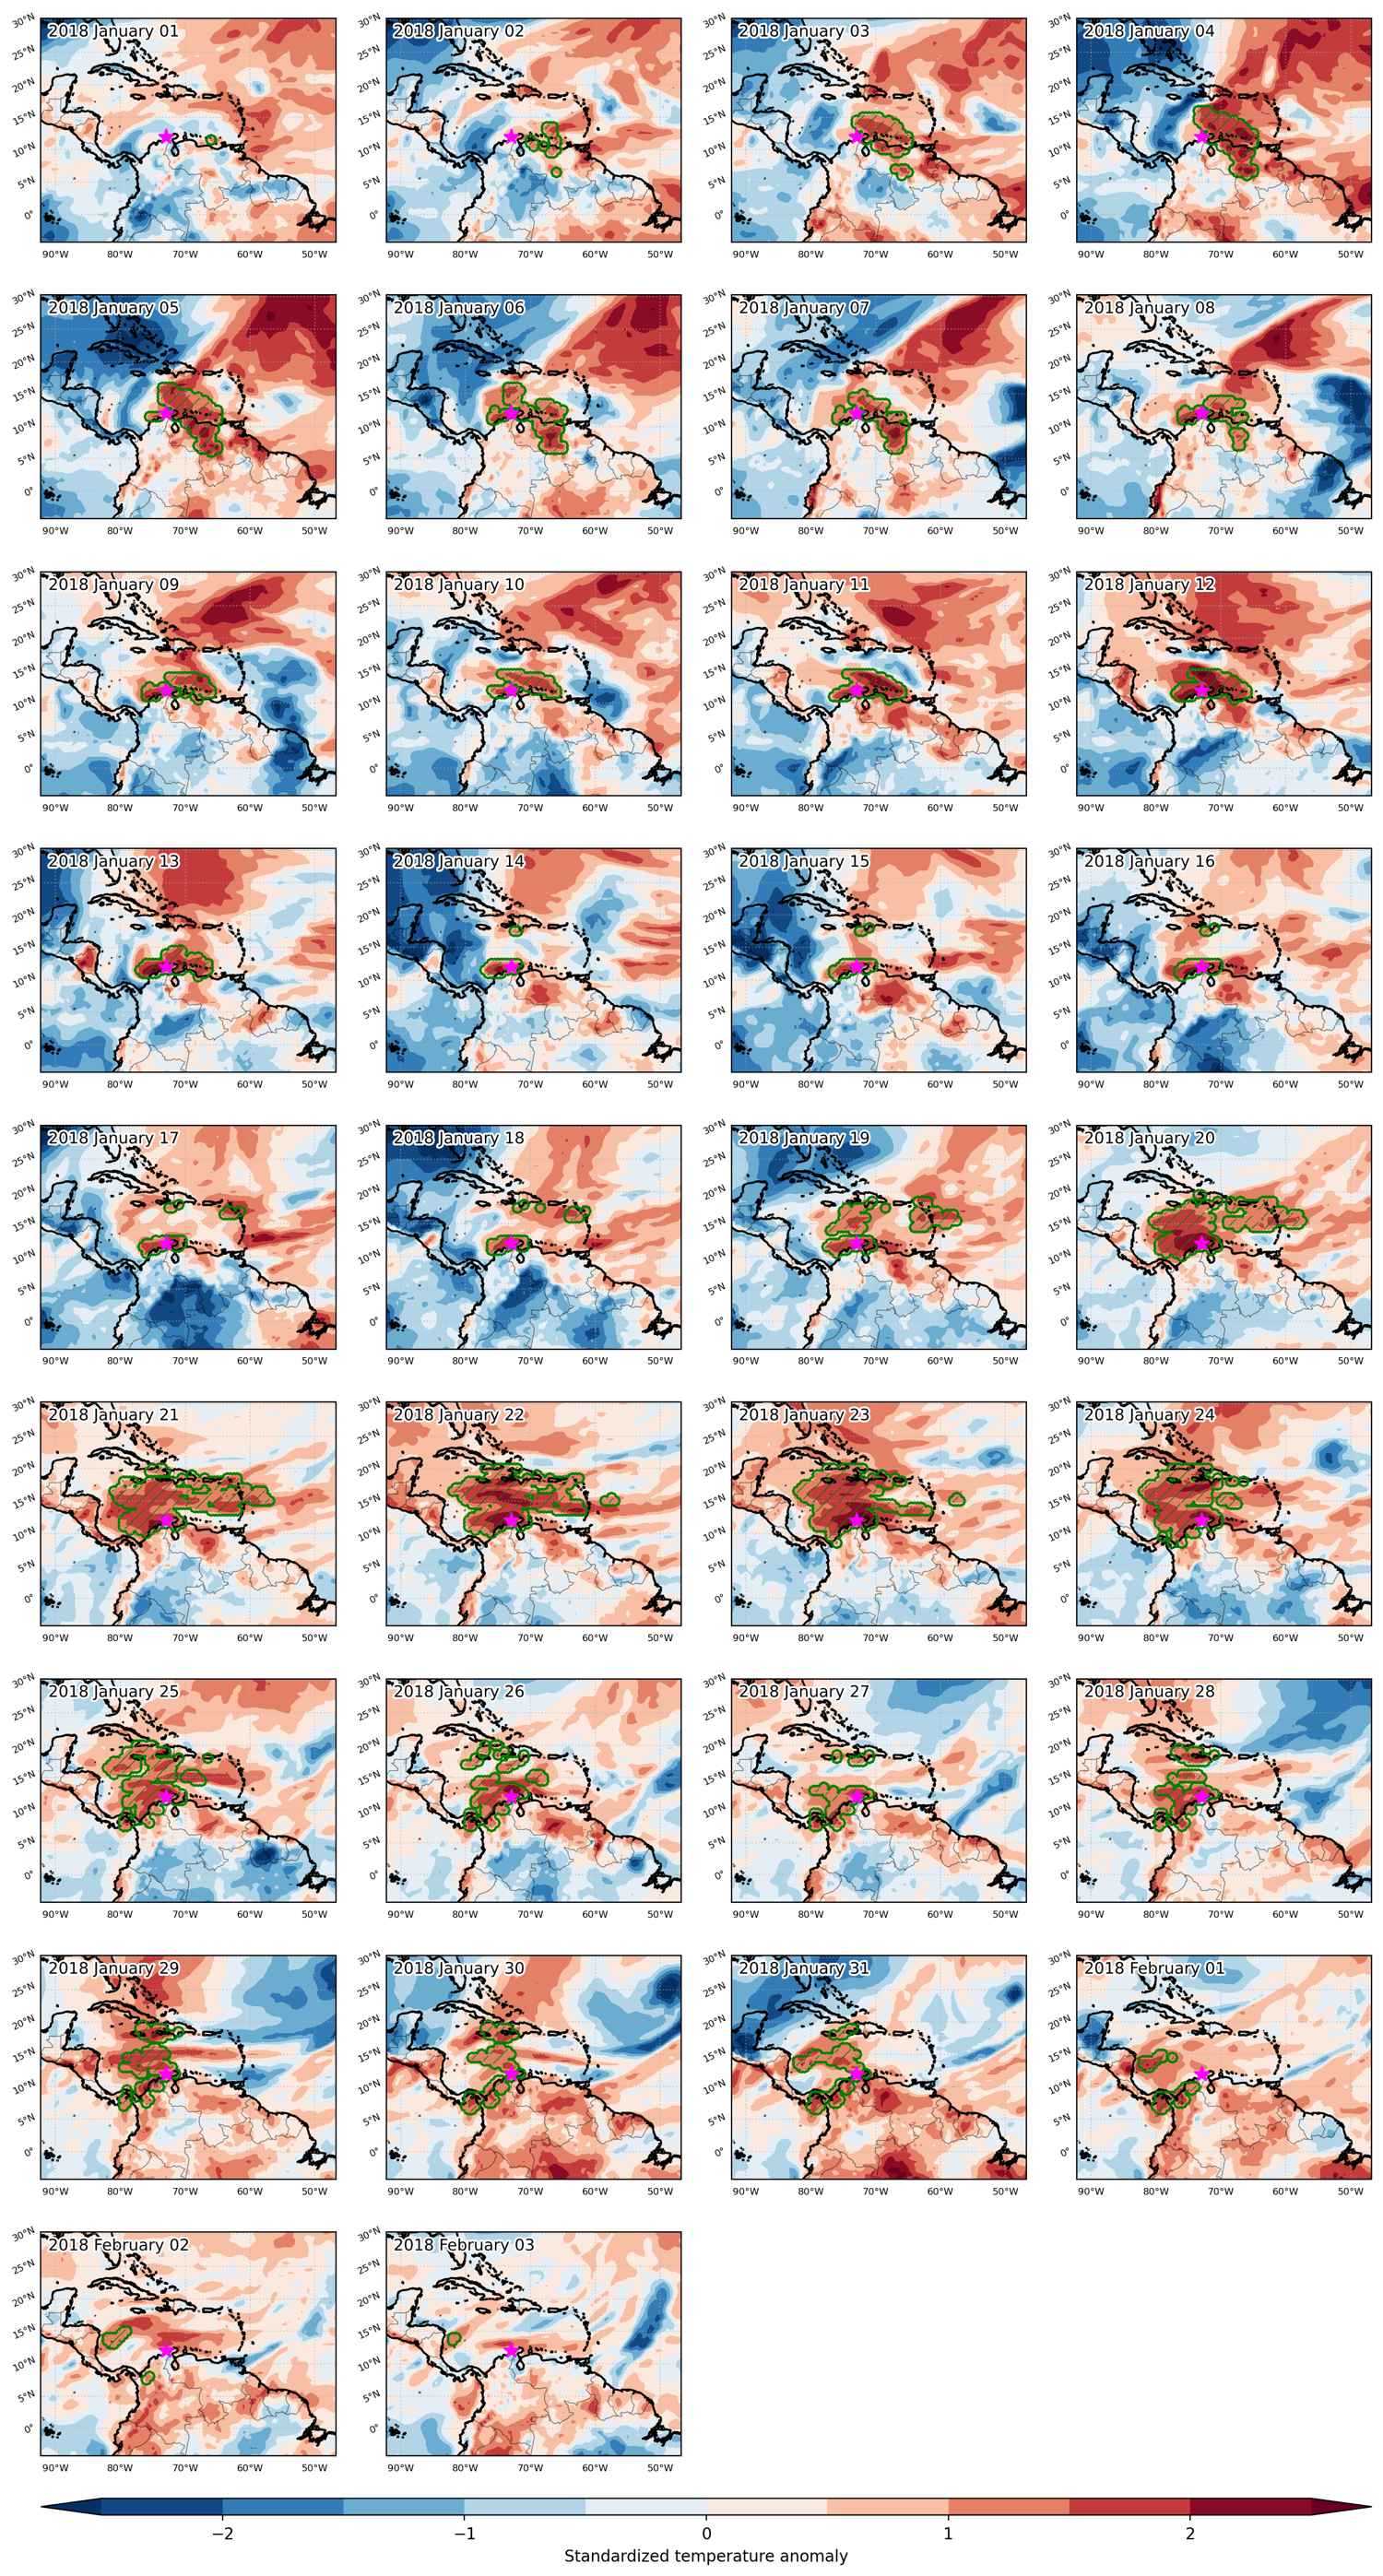
Time span: January 01 2018 to February 03 2018

Statistics over entire affected area:

  • Mean temperature anomaly: 0.9 °C
  • Mean temperature: 26.7 °C
  • Maximum temperature anomaly: 3.1 °C
  • Maximum temperature: 32.4 °C

Event center: 12.0°N 287.0°E

Area affected: 1898335 km$^2$


Fig. 1: Map of most extreme temperature anomalies (standardized) experienced during the event. The purple star indicates the center of the extreme event. Green hatching illustrates all areas under the effect of extremes at some time during the event.


Fig. 2: Evolution of temperature at the center of the event. The climatological percentile distribution is illustrated with color shadings.


Fig. 3: Maps illustrating the evolution of standardized temperature anomalies during the event.

Event ID: Heat_wave_2018-Jan-01_to_2018-Feb-03_287.0_12.0

Heat wave occuring from January 01 2018 to January 06 2018 at 7.5°N 297.0°E

Download data: JSON

Event type: Heat wave

Countries affected (identified with ArcGIS Online; provided only for geographical reference):

  • Guyana
  • Venezuela

Duration: 6 days

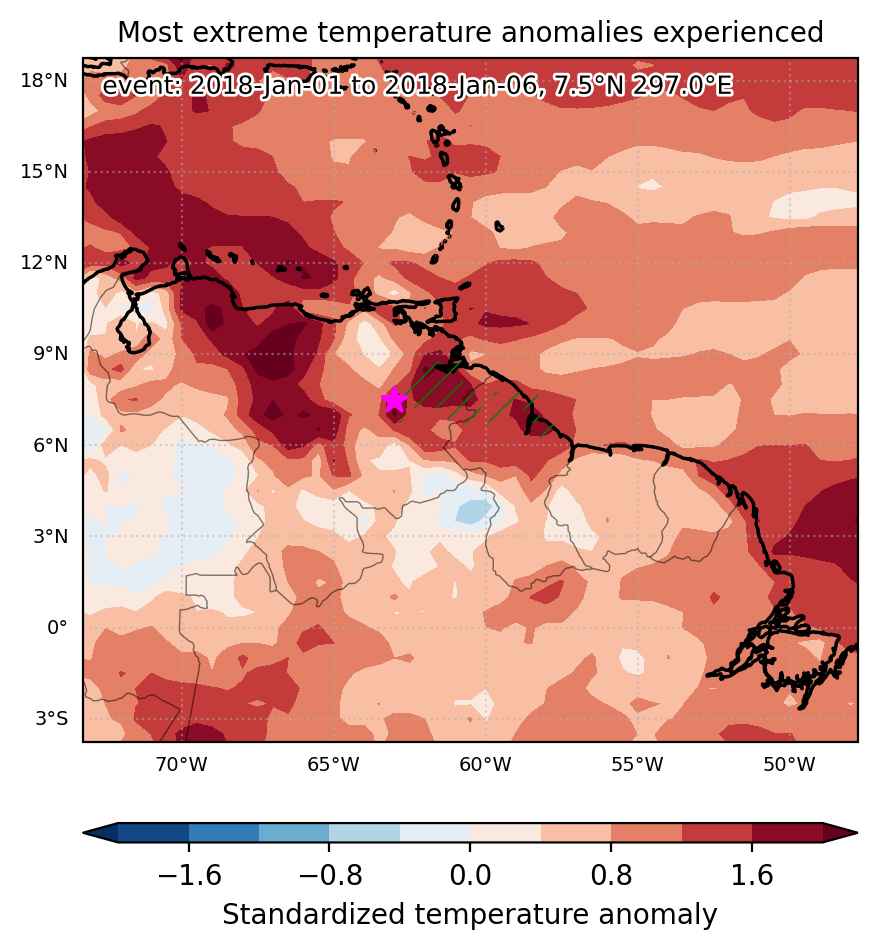
Time span: January 01 2018 to January 06 2018

Statistics over entire affected area:

  • Mean temperature anomaly: 1.0 °C
  • Mean temperature: 25.6 °C
  • Maximum temperature anomaly: 1.4 °C
  • Maximum temperature: 27.1 °C

Event center: 7.5°N 297.0°E

Area affected: 70476 km$^2$


Fig. 1: Map of most extreme temperature anomalies (standardized) experienced during the event. The purple star indicates the center of the extreme event. Green hatching illustrates all areas under the effect of extremes at some time during the event.


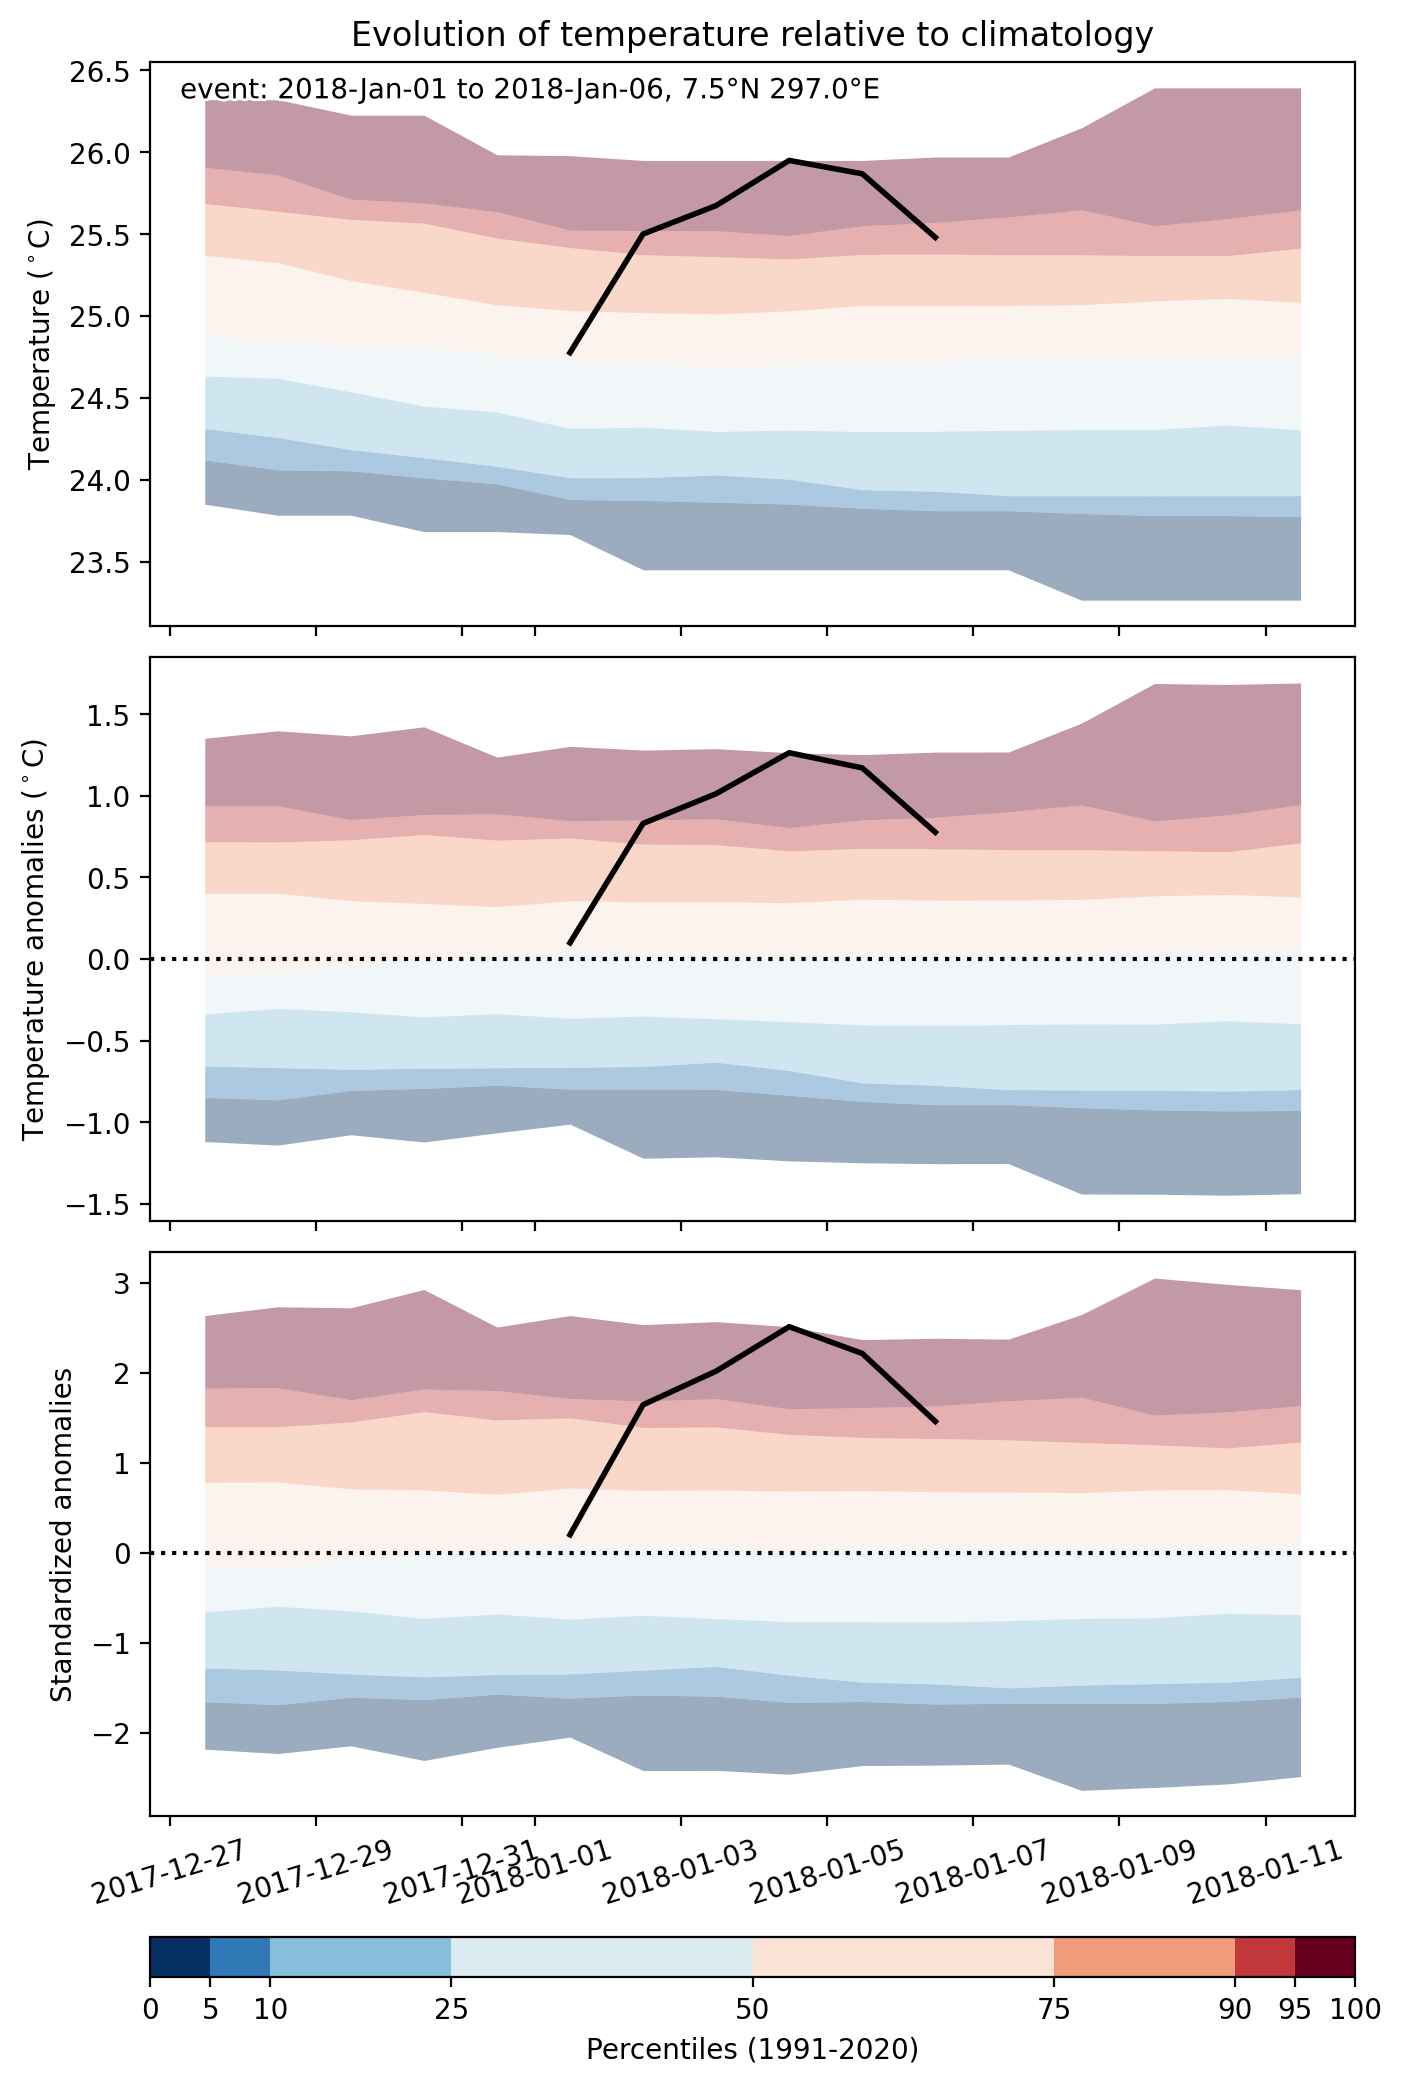
Fig. 2: Evolution of temperature at the center of the event. The climatological percentile distribution is illustrated with color shadings.


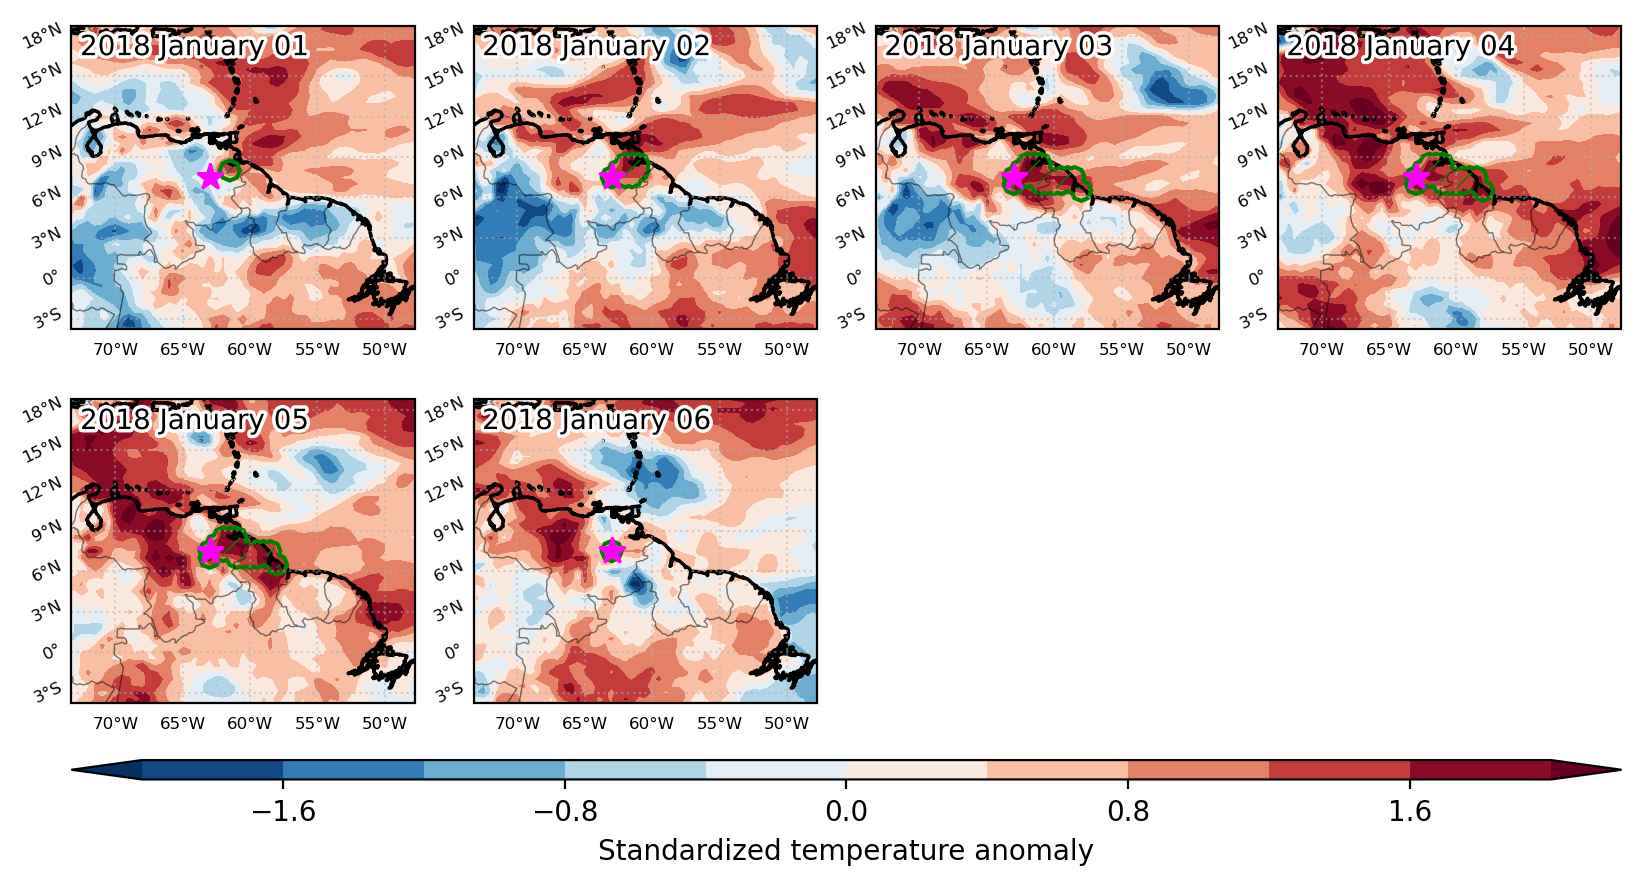
Fig. 3: Maps illustrating the evolution of standardized temperature anomalies during the event.

Event ID: Heat_wave_2018-Jan-01_to_2018-Jan-06_297.0_7.5

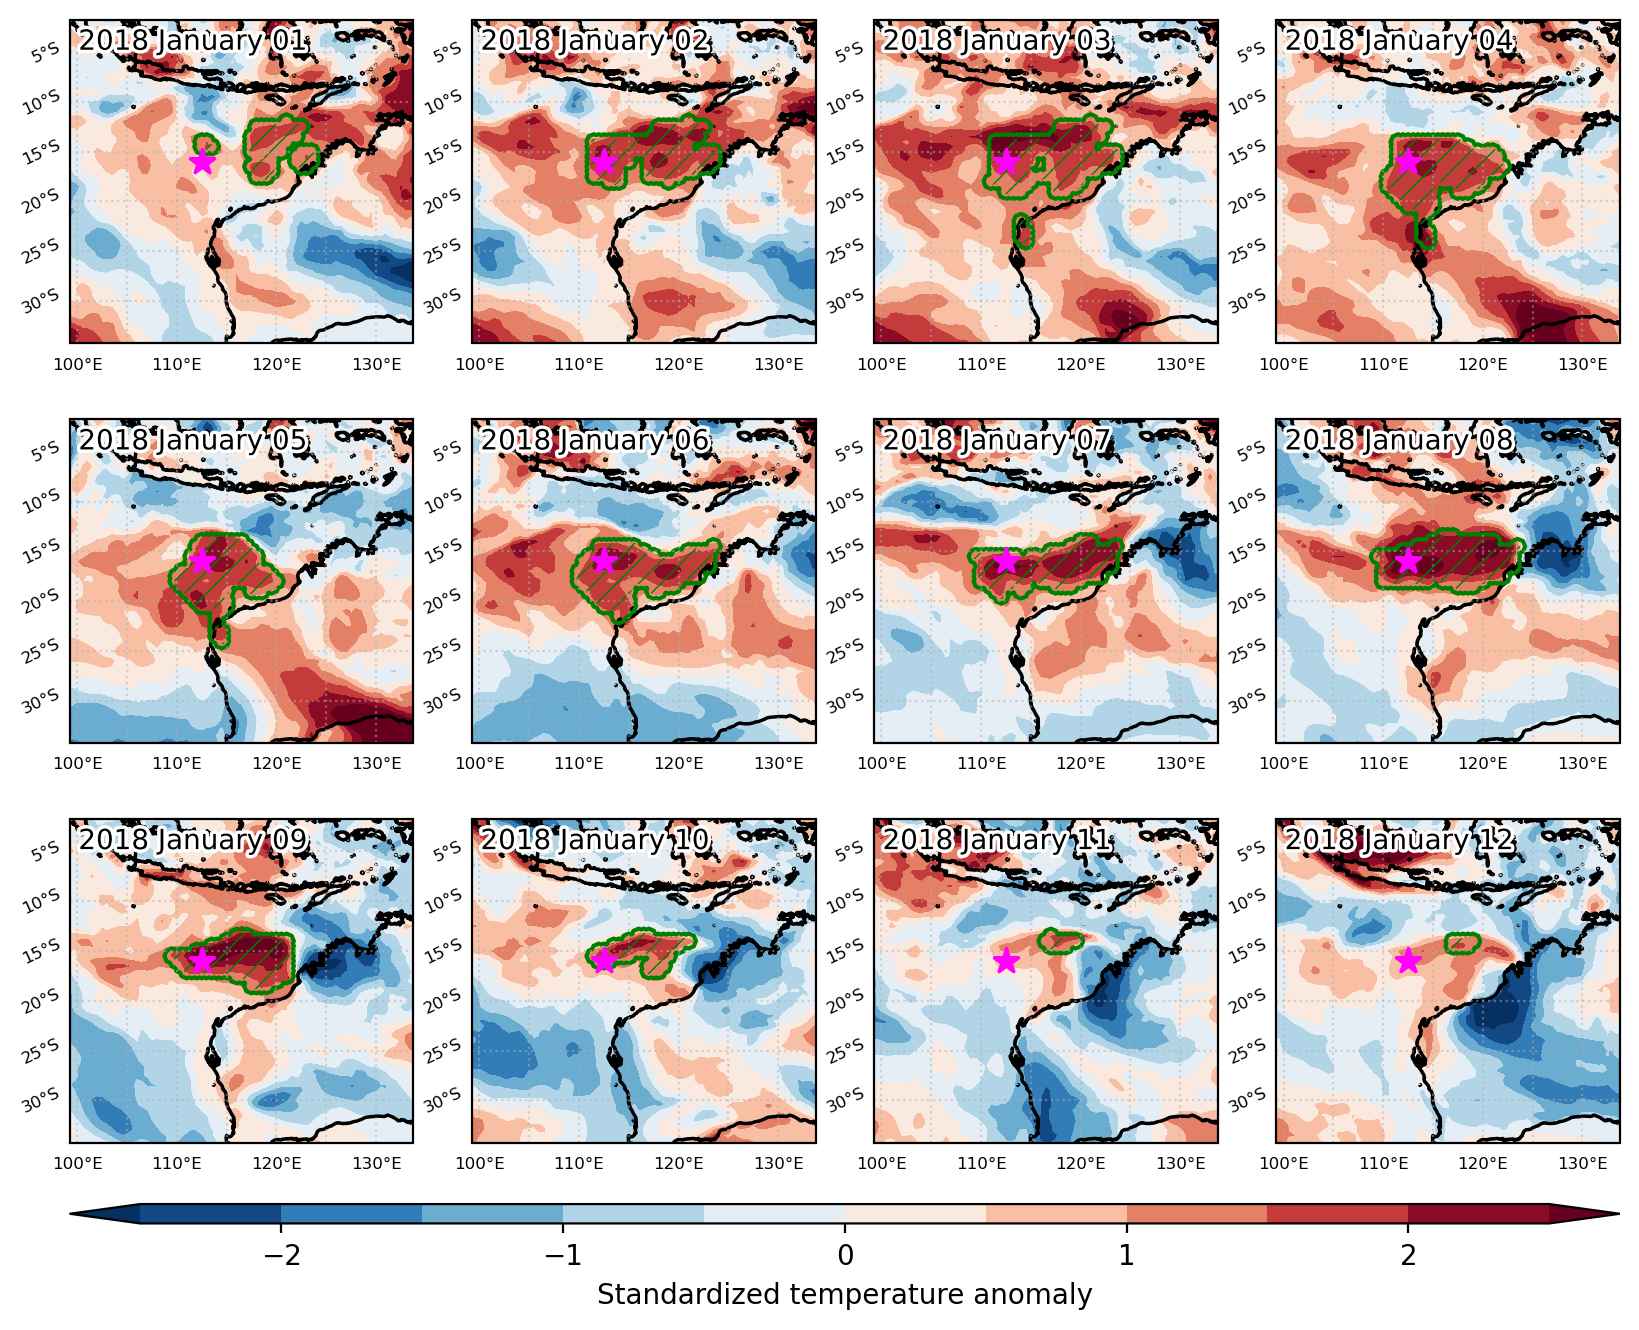
Heat wave occuring from January 01 2018 to January 12 2018 at -16.0°S 112.5°E

Download data: JSON

Event type: Heat wave

Countries affected (identified with ArcGIS Online; provided only for geographical reference):

  • Australia

Duration: 12 days

Time span: January 01 2018 to January 12 2018

Statistics over entire affected area:

  • Mean temperature anomaly: 1.5 °C
  • Mean temperature: 29.0 °C
  • Maximum temperature anomaly: 7.0 °C
  • Maximum temperature: 37.9 °C

Event center: -16.0°S 112.5°E

Area affected: 912573 km$^2$


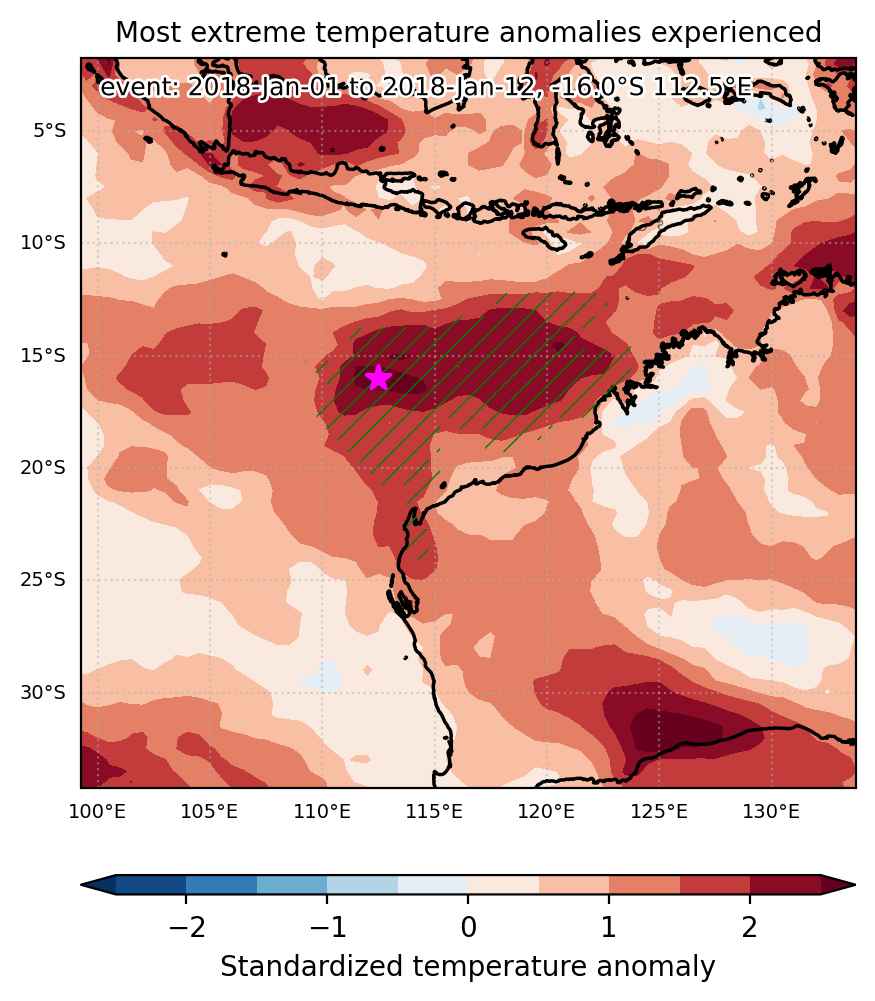
Fig. 1: Map of most extreme temperature anomalies (standardized) experienced during the event. The purple star indicates the center of the extreme event. Green hatching illustrates all areas under the effect of extremes at some time during the event.


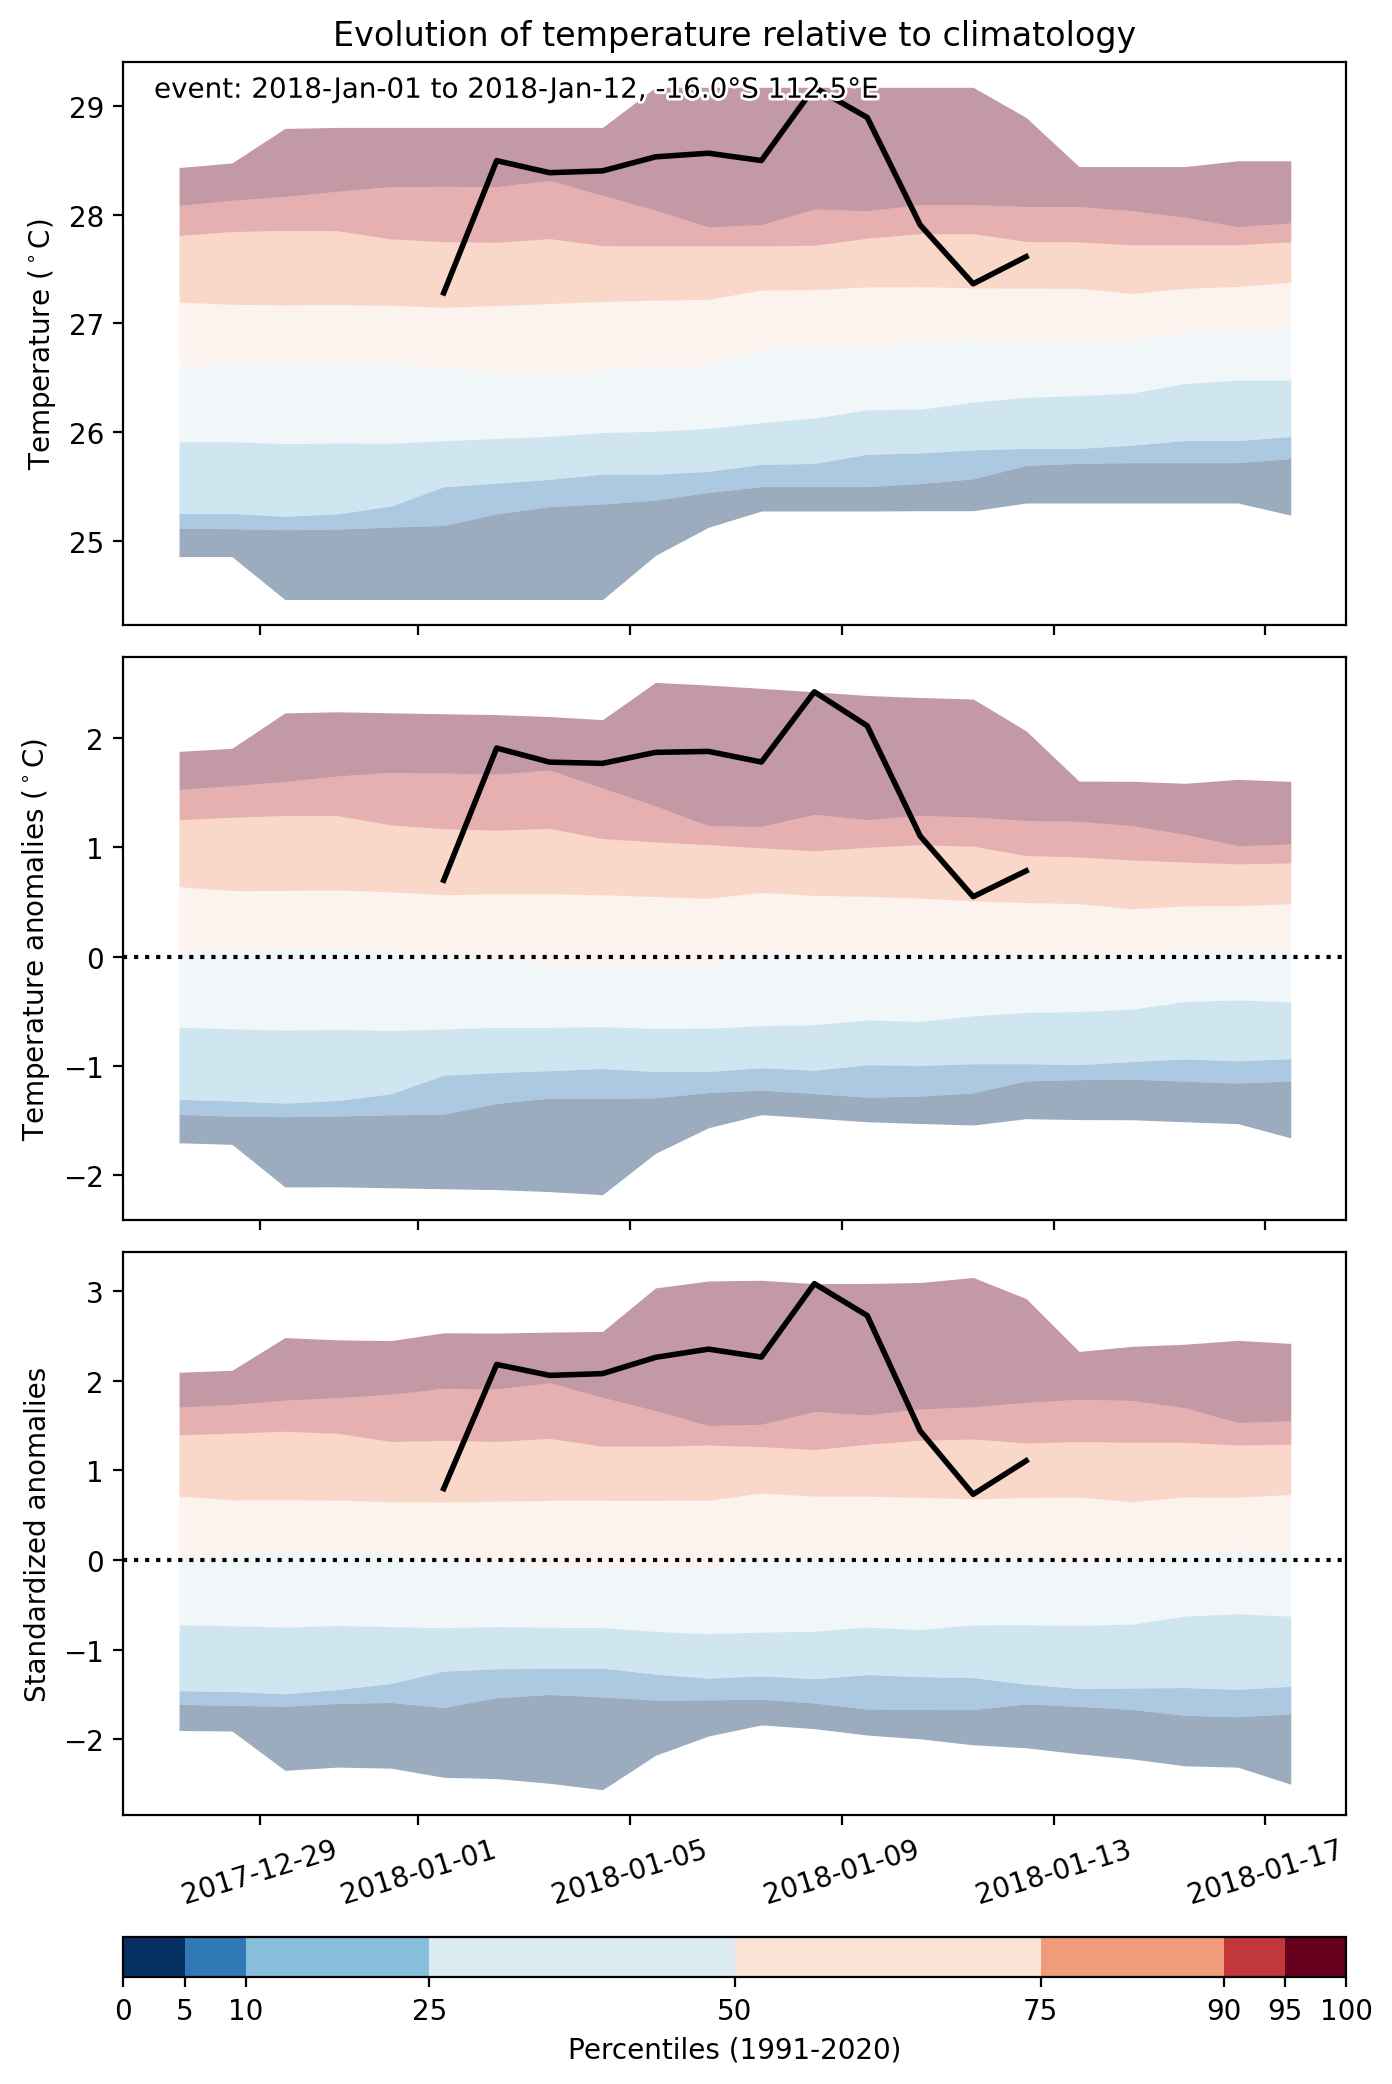
Fig. 2: Evolution of temperature at the center of the event. The climatological percentile distribution is illustrated with color shadings.


Fig. 3: Maps illustrating the evolution of standardized temperature anomalies during the event.

Event ID: Heat_wave_2018-Jan-01_to_2018-Jan-12_112.5_-16.0

Cold spell occuring from January 01 2018 to January 08 2018 at 49.0°N 87.0°E

Download data: JSON

Event type: Cold spell

Countries affected (identified with ArcGIS Online; provided only for geographical reference):

  • China
  • Kazakhstan
  • Mongolia
  • Russian Federation

Duration: 8 days

Time span: January 01 2018 to January 08 2018

Statistics over entire affected area:

  • Mean temperature anomaly: -9.0 °C
  • Mean temperature: -30.5 °C
  • Minimum temperature anomaly: -16.5 °C
  • Minimum temperature: -39.2 °C

Event center: 49.0°N 87.0°E

Area affected: 467381 km$^2$


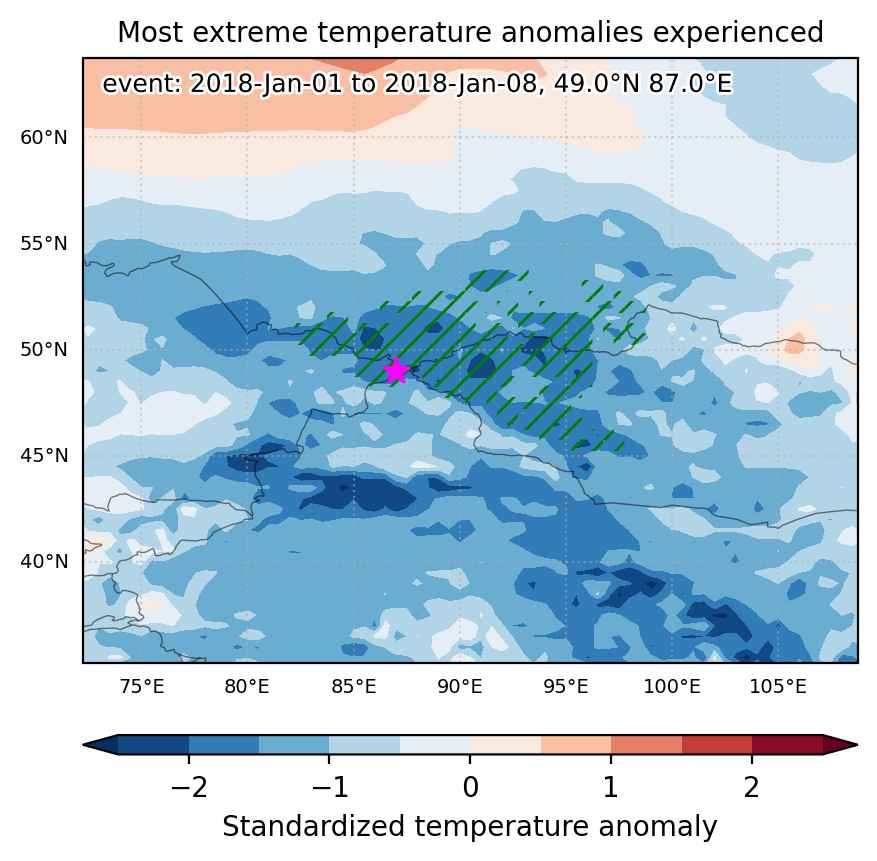
Fig. 1: Map of most extreme temperature anomalies (standardized) experienced during the event. The purple star indicates the center of the extreme event. Green hatching illustrates all areas under the effect of extremes at some time during the event.


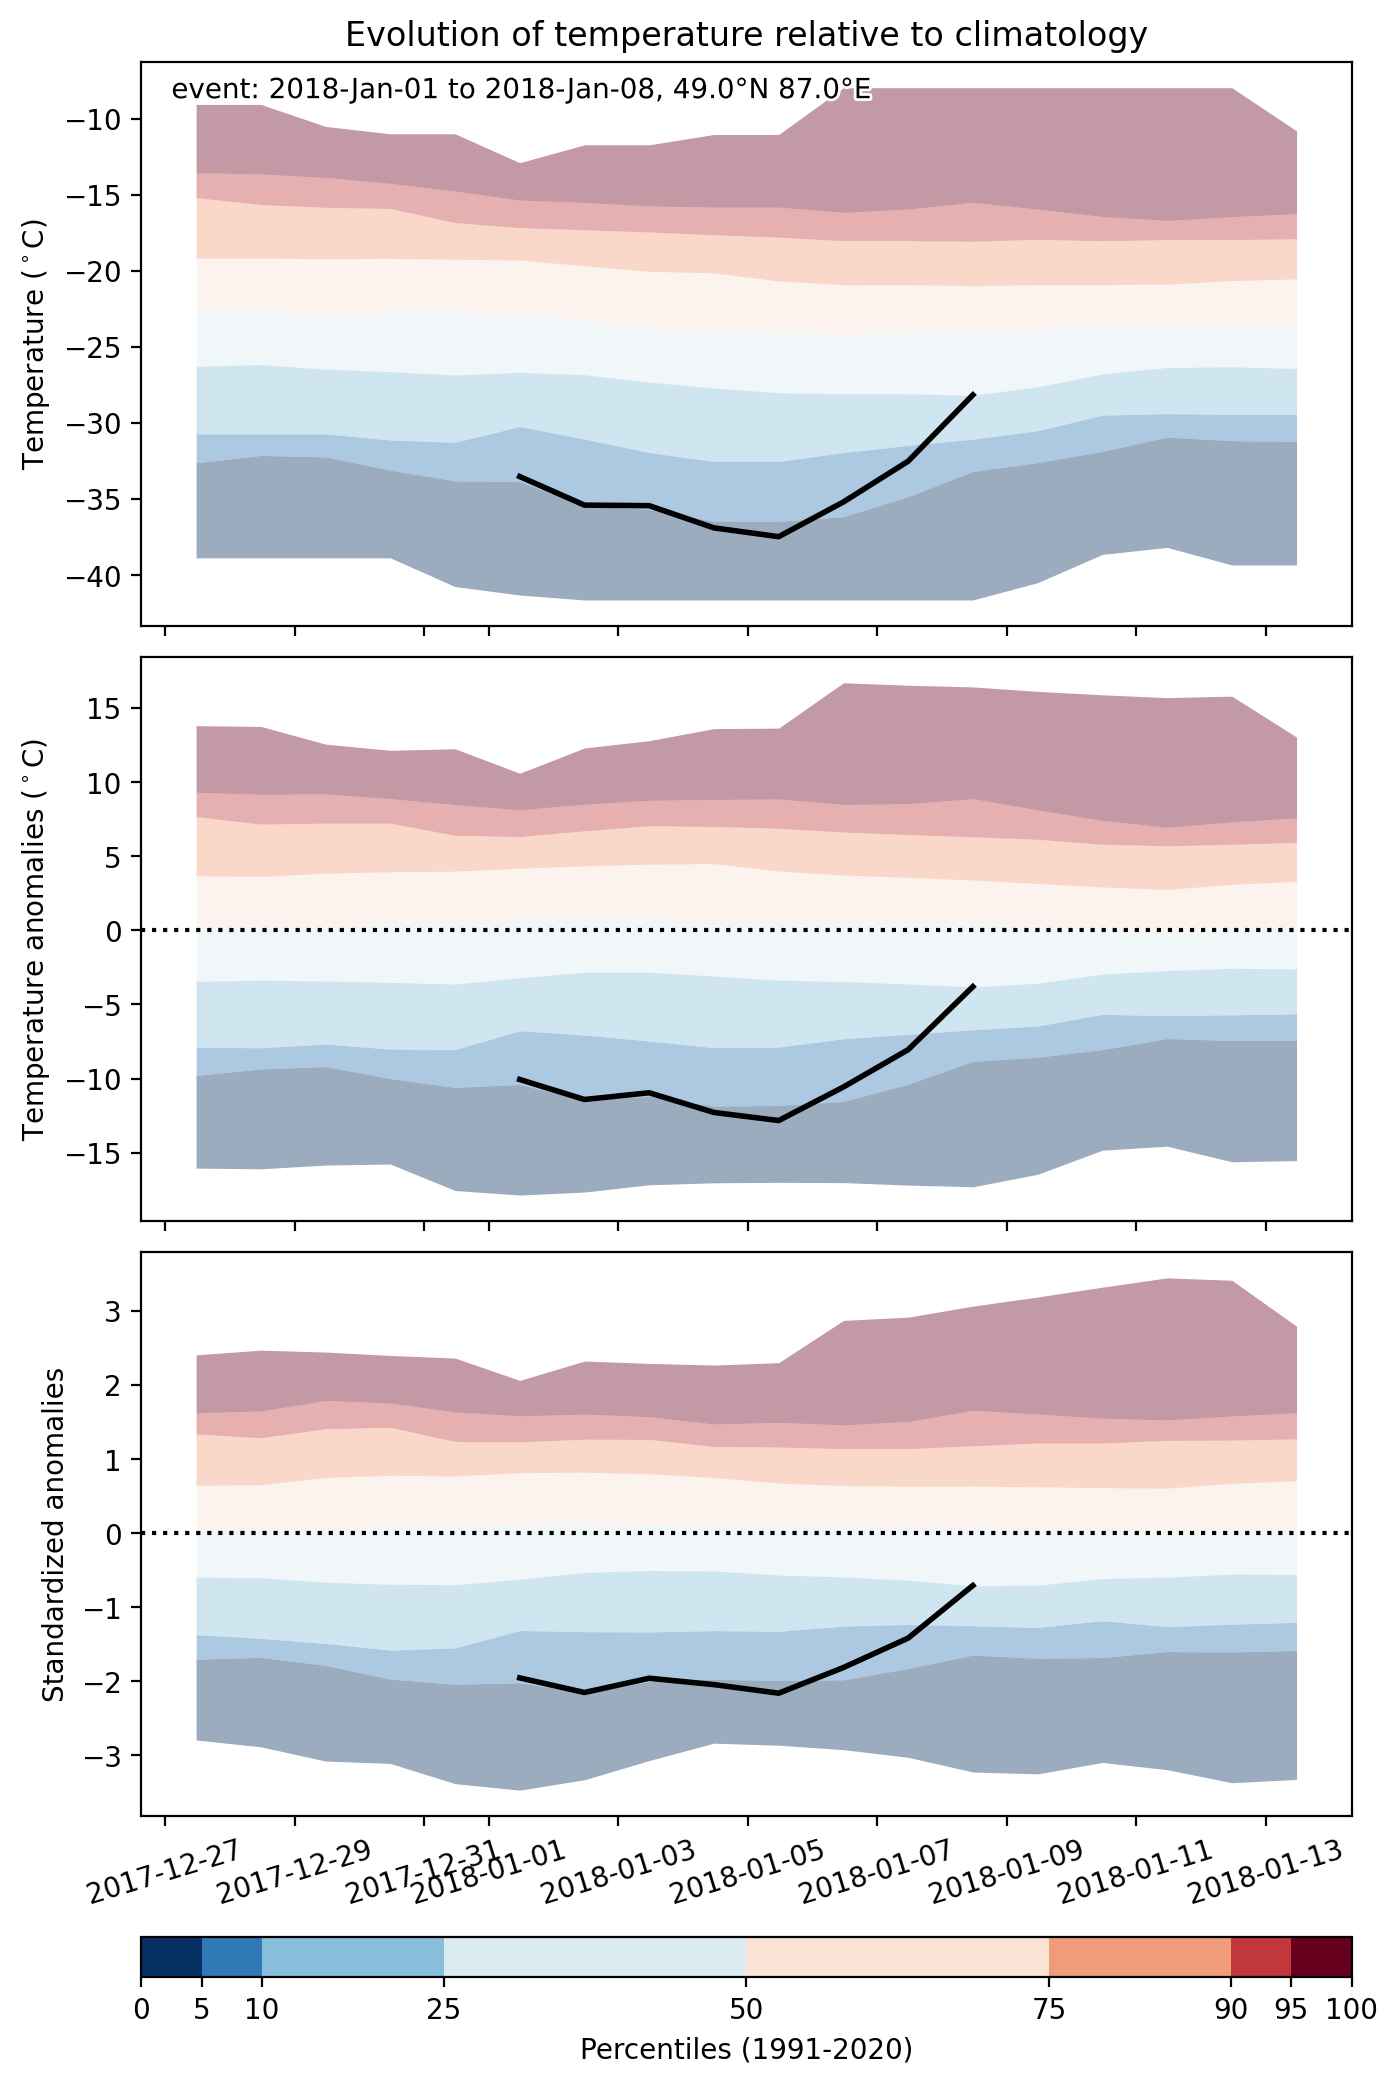
Fig. 2: Evolution of temperature at the center of the event. The climatological percentile distribution is illustrated with color shadings.


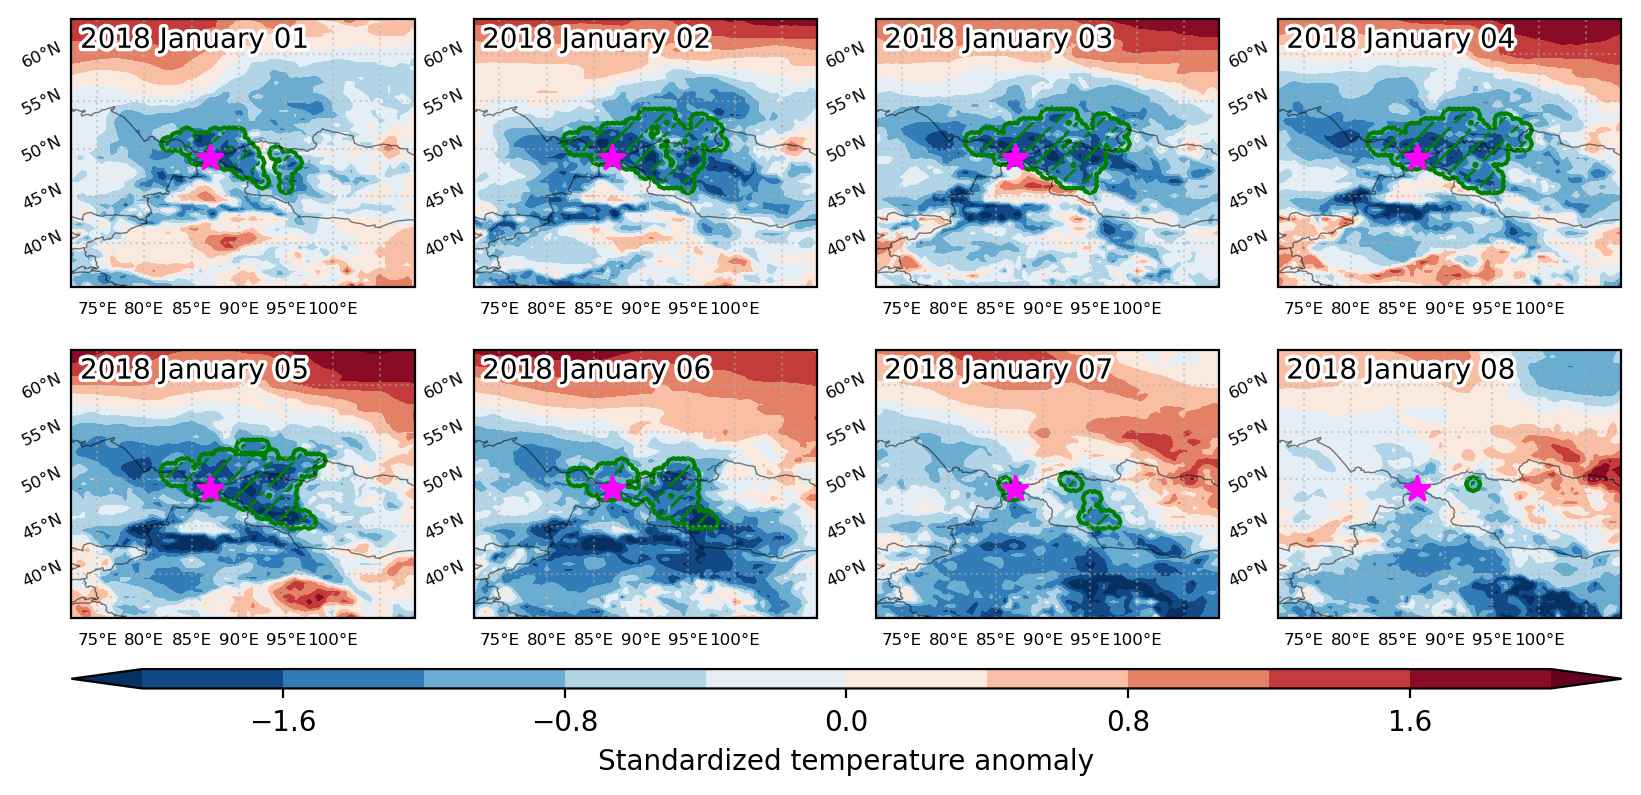
Fig. 3: Maps illustrating the evolution of standardized temperature anomalies during the event.

Event ID: Cold_spell_2018-Jan-01_to_2018-Jan-08_87.0_49.0

Cold spell occuring from January 01 2018 to January 07 2018 at 13.0°N 24.5°E

Download data: JSON

Event type: Cold spell

Countries affected (identified with ArcGIS Online; provided only for geographical reference):

  • Central African Republic
  • Chad
  • South Sudan
  • Sudan

Duration: 7 days

Time span: January 01 2018 to January 07 2018

Statistics over entire affected area:

  • Mean temperature anomaly: -4.1 °C
  • Mean temperature: 17.5 °C
  • Minimum temperature anomaly: -6.2 °C
  • Minimum temperature: 9.1 °C

Event center: 13.0°N 24.5°E

Area affected: 665862 km$^2$


Fig. 1: Map of most extreme temperature anomalies (standardized) experienced during the event. The purple star indicates the center of the extreme event. Green hatching illustrates all areas under the effect of extremes at some time during the event.


Fig. 2: Evolution of temperature at the center of the event. The climatological percentile distribution is illustrated with color shadings.


Fig. 3: Maps illustrating the evolution of standardized temperature anomalies during the event.

Event ID: Cold_spell_2018-Jan-01_to_2018-Jan-07_24.5_13.0

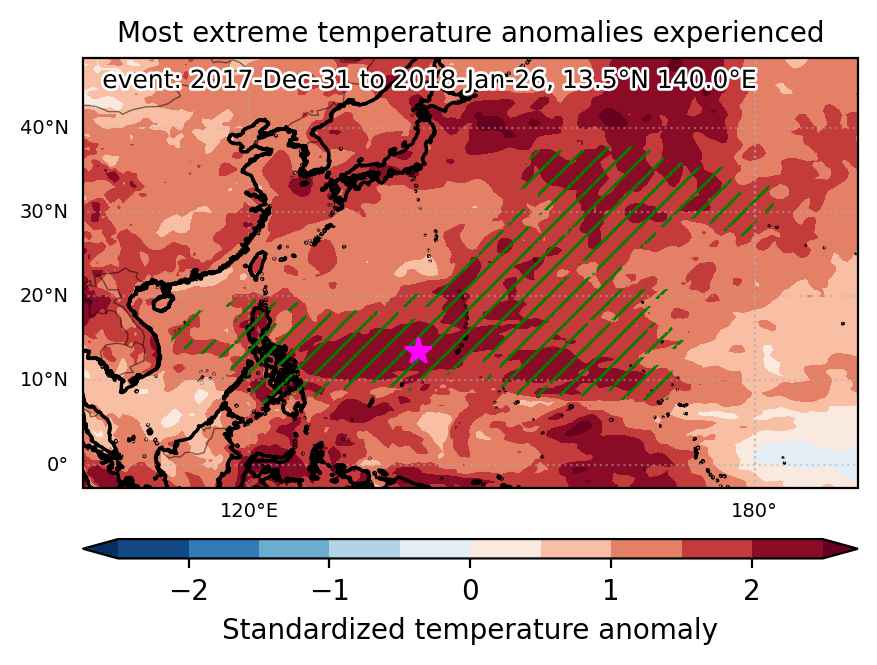
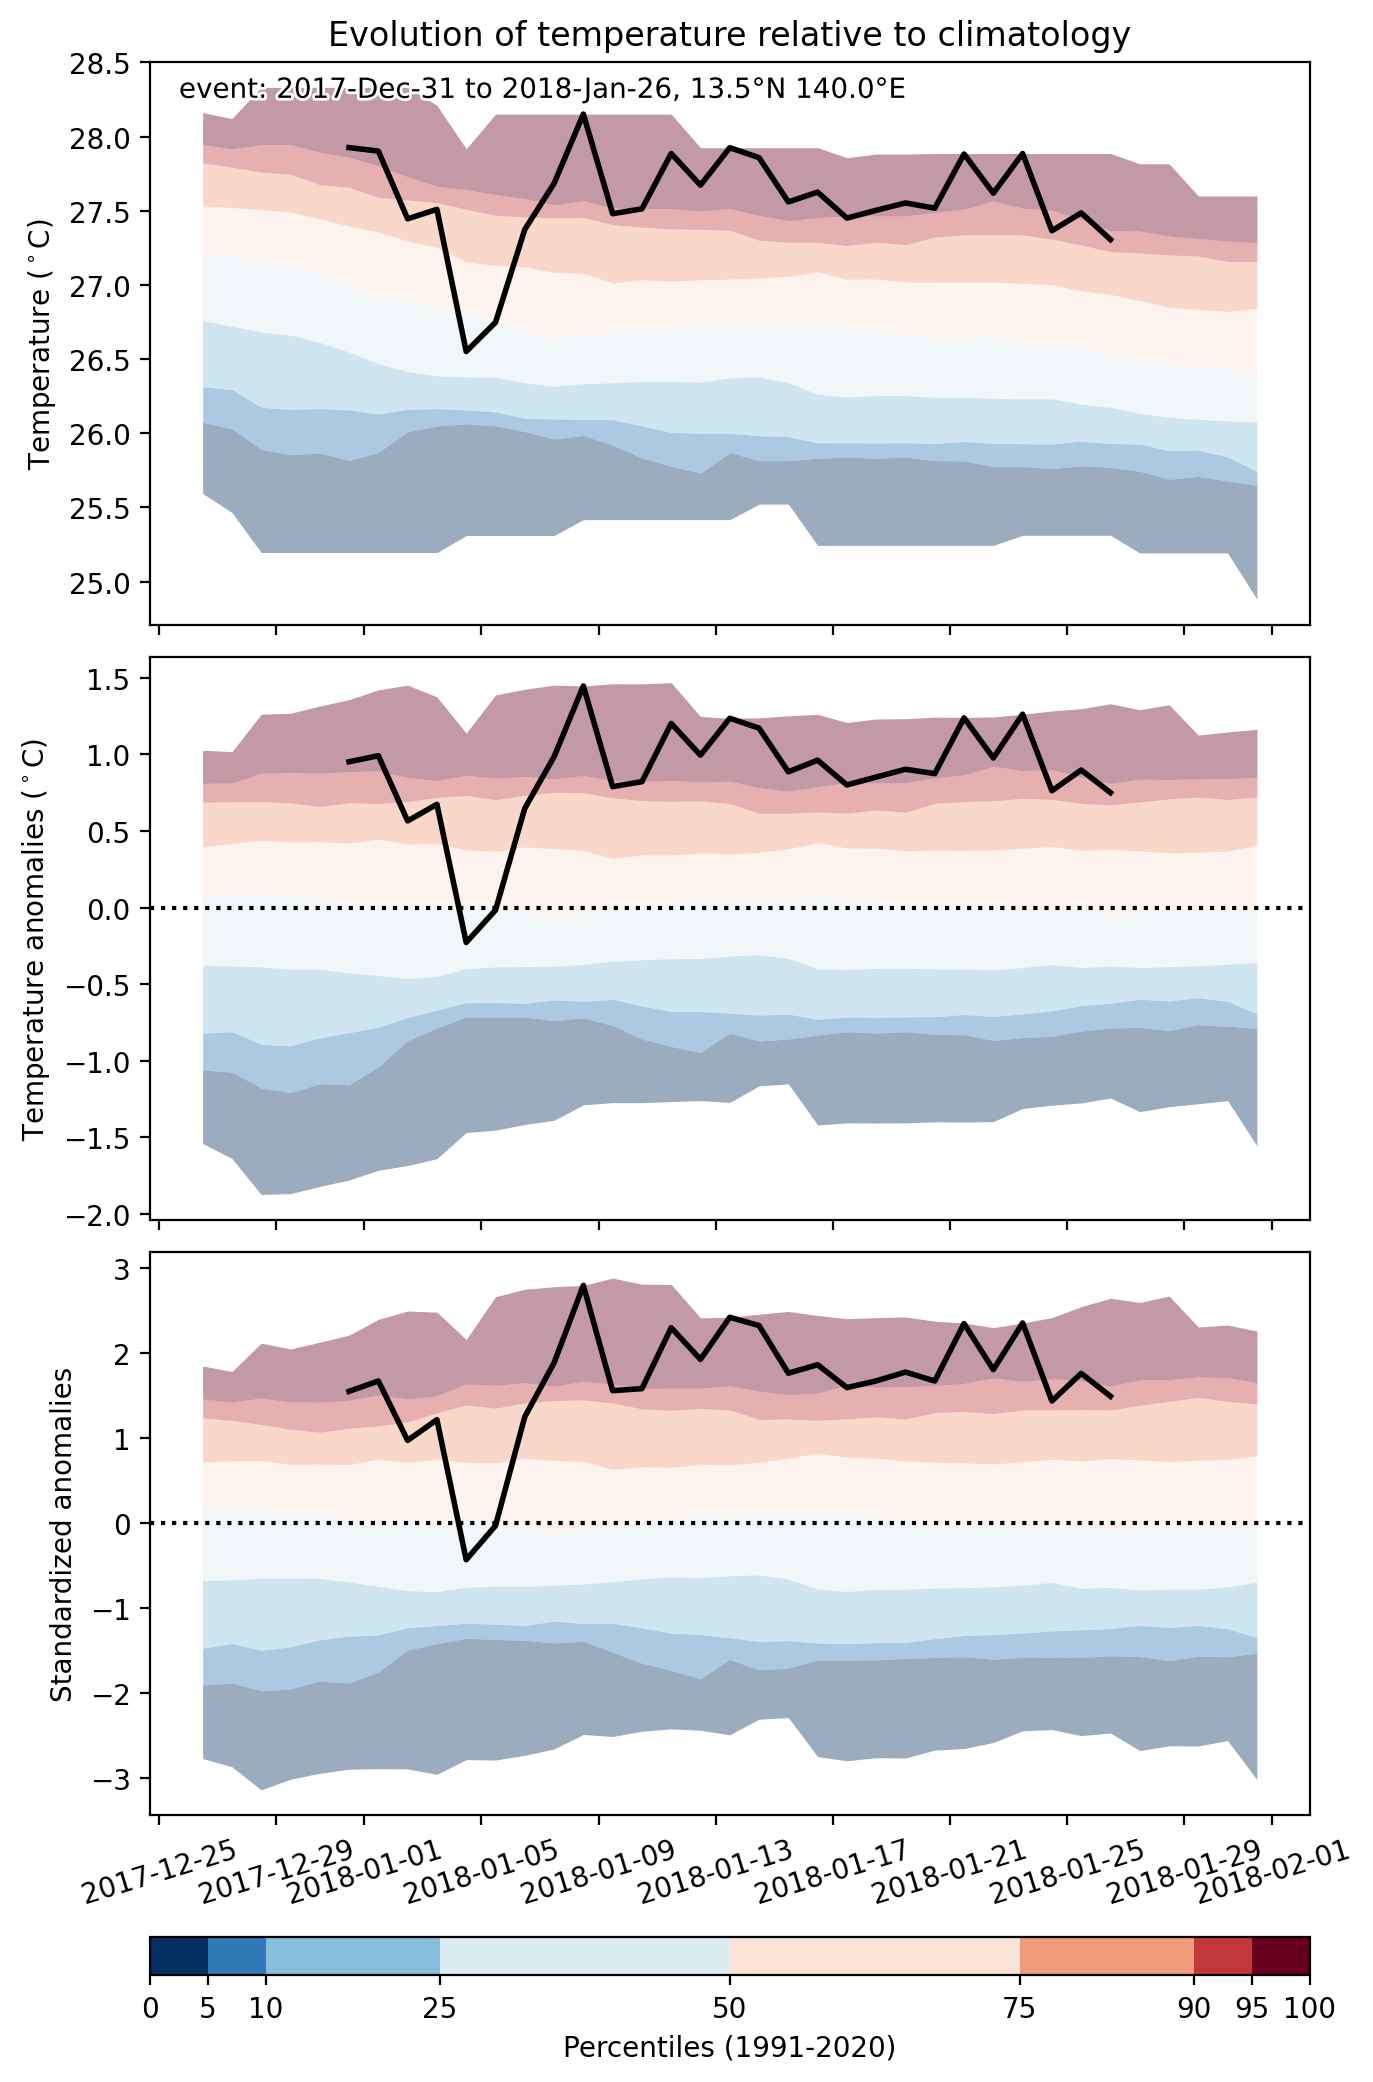
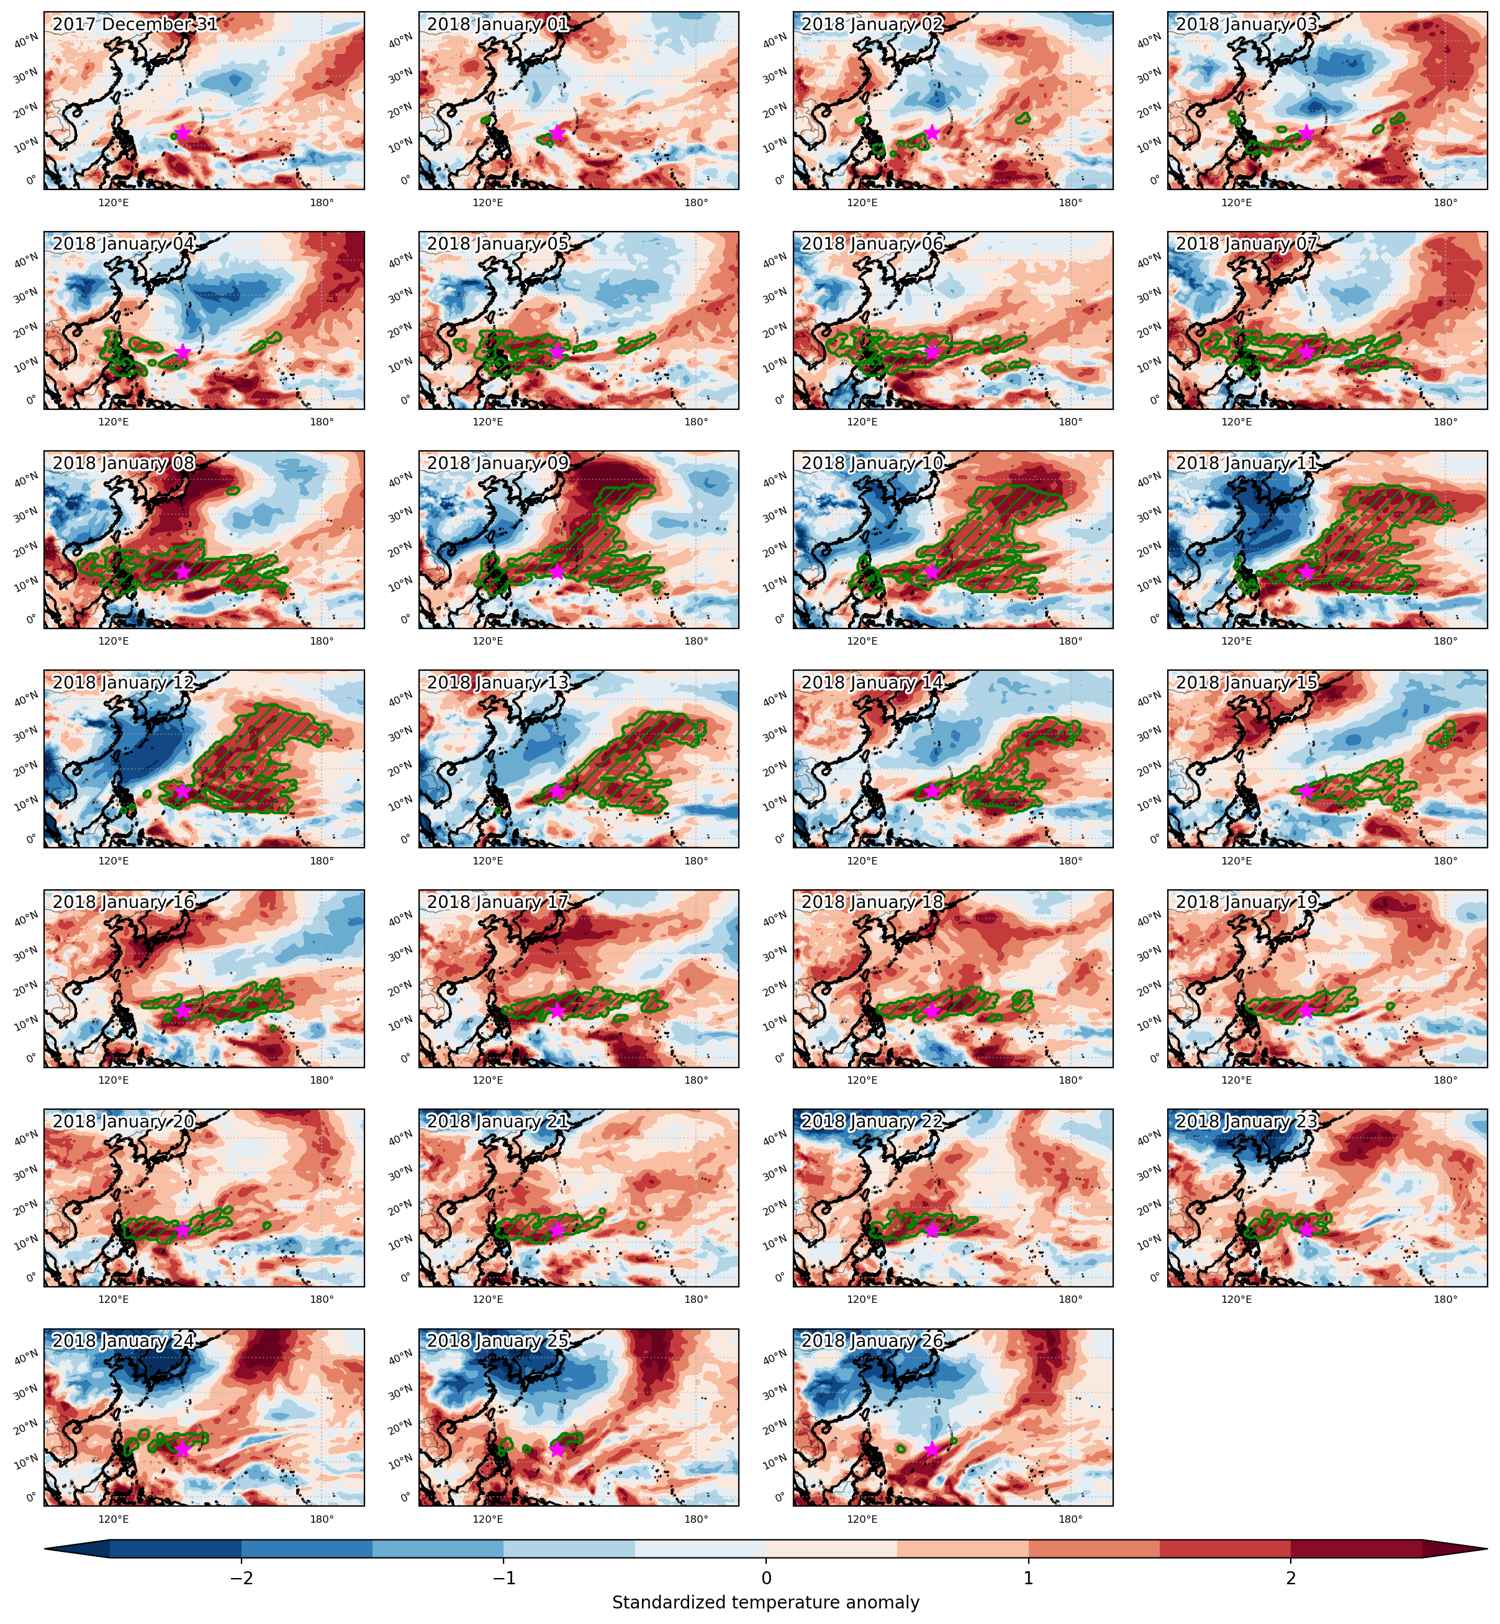
Heat wave occuring from December 31 2017 to January 26 2018 at 13.5°N 140.0°E

Download data: JSON

Event type: Heat wave

Countries affected (identified with ArcGIS Online; provided only for geographical reference):

  • Philippines

Duration: 27 days

Time span: December 31 2017 to January 26 2018

Statistics over entire affected area:

  • Mean temperature anomaly: 1.6 °C
  • Mean temperature: 25.5 °C
  • Maximum temperature anomaly: 7.0 °C
  • Maximum temperature: 28.6 °C

Event center: 13.5°N 140.0°E

Area affected: 10239570 km$^2$


Fig. 1: Map of most extreme temperature anomalies (standardized) experienced during the event. The purple star indicates the center of the extreme event. Green hatching illustrates all areas under the effect of extremes at some time during the event.


Fig. 2: Evolution of temperature at the center of the event. The climatological percentile distribution is illustrated with color shadings.


Fig. 3: Maps illustrating the evolution of standardized temperature anomalies during the event.

Event ID: Heat_wave_2017-Dec-31_to_2018-Jan-26_140.0_13.5