Heat wave occuring from March 26 2018 to March 31 2018 at -66.0°S 110.5°E

Download data: JSON

Event type: Heat wave

Countries affected (identified with ArcGIS Online; provided only for geographical reference):

  • Antarctica

Duration: 6 days

Time span: March 26 2018 to March 31 2018

Statistics over entire affected area:

  • Mean temperature anomaly: 7.8 °C
  • Mean temperature: -8.5 °C
  • Maximum temperature anomaly: 13.2 °C
  • Maximum temperature: 0.1 °C

Event center: -66.0°S 110.5°E

Area affected: 450968 km$^2$
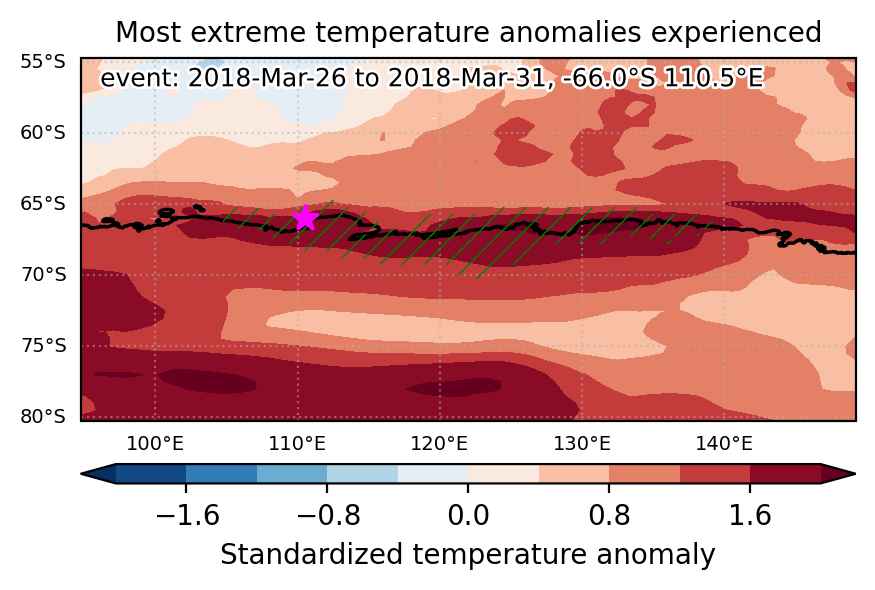

Fig. 1: Map of most extreme temperature anomalies (standardized) experienced during the event. The purple star indicates the center of the extreme event. Green hatching illustrates all areas under the effect of extremes at some time during the event.
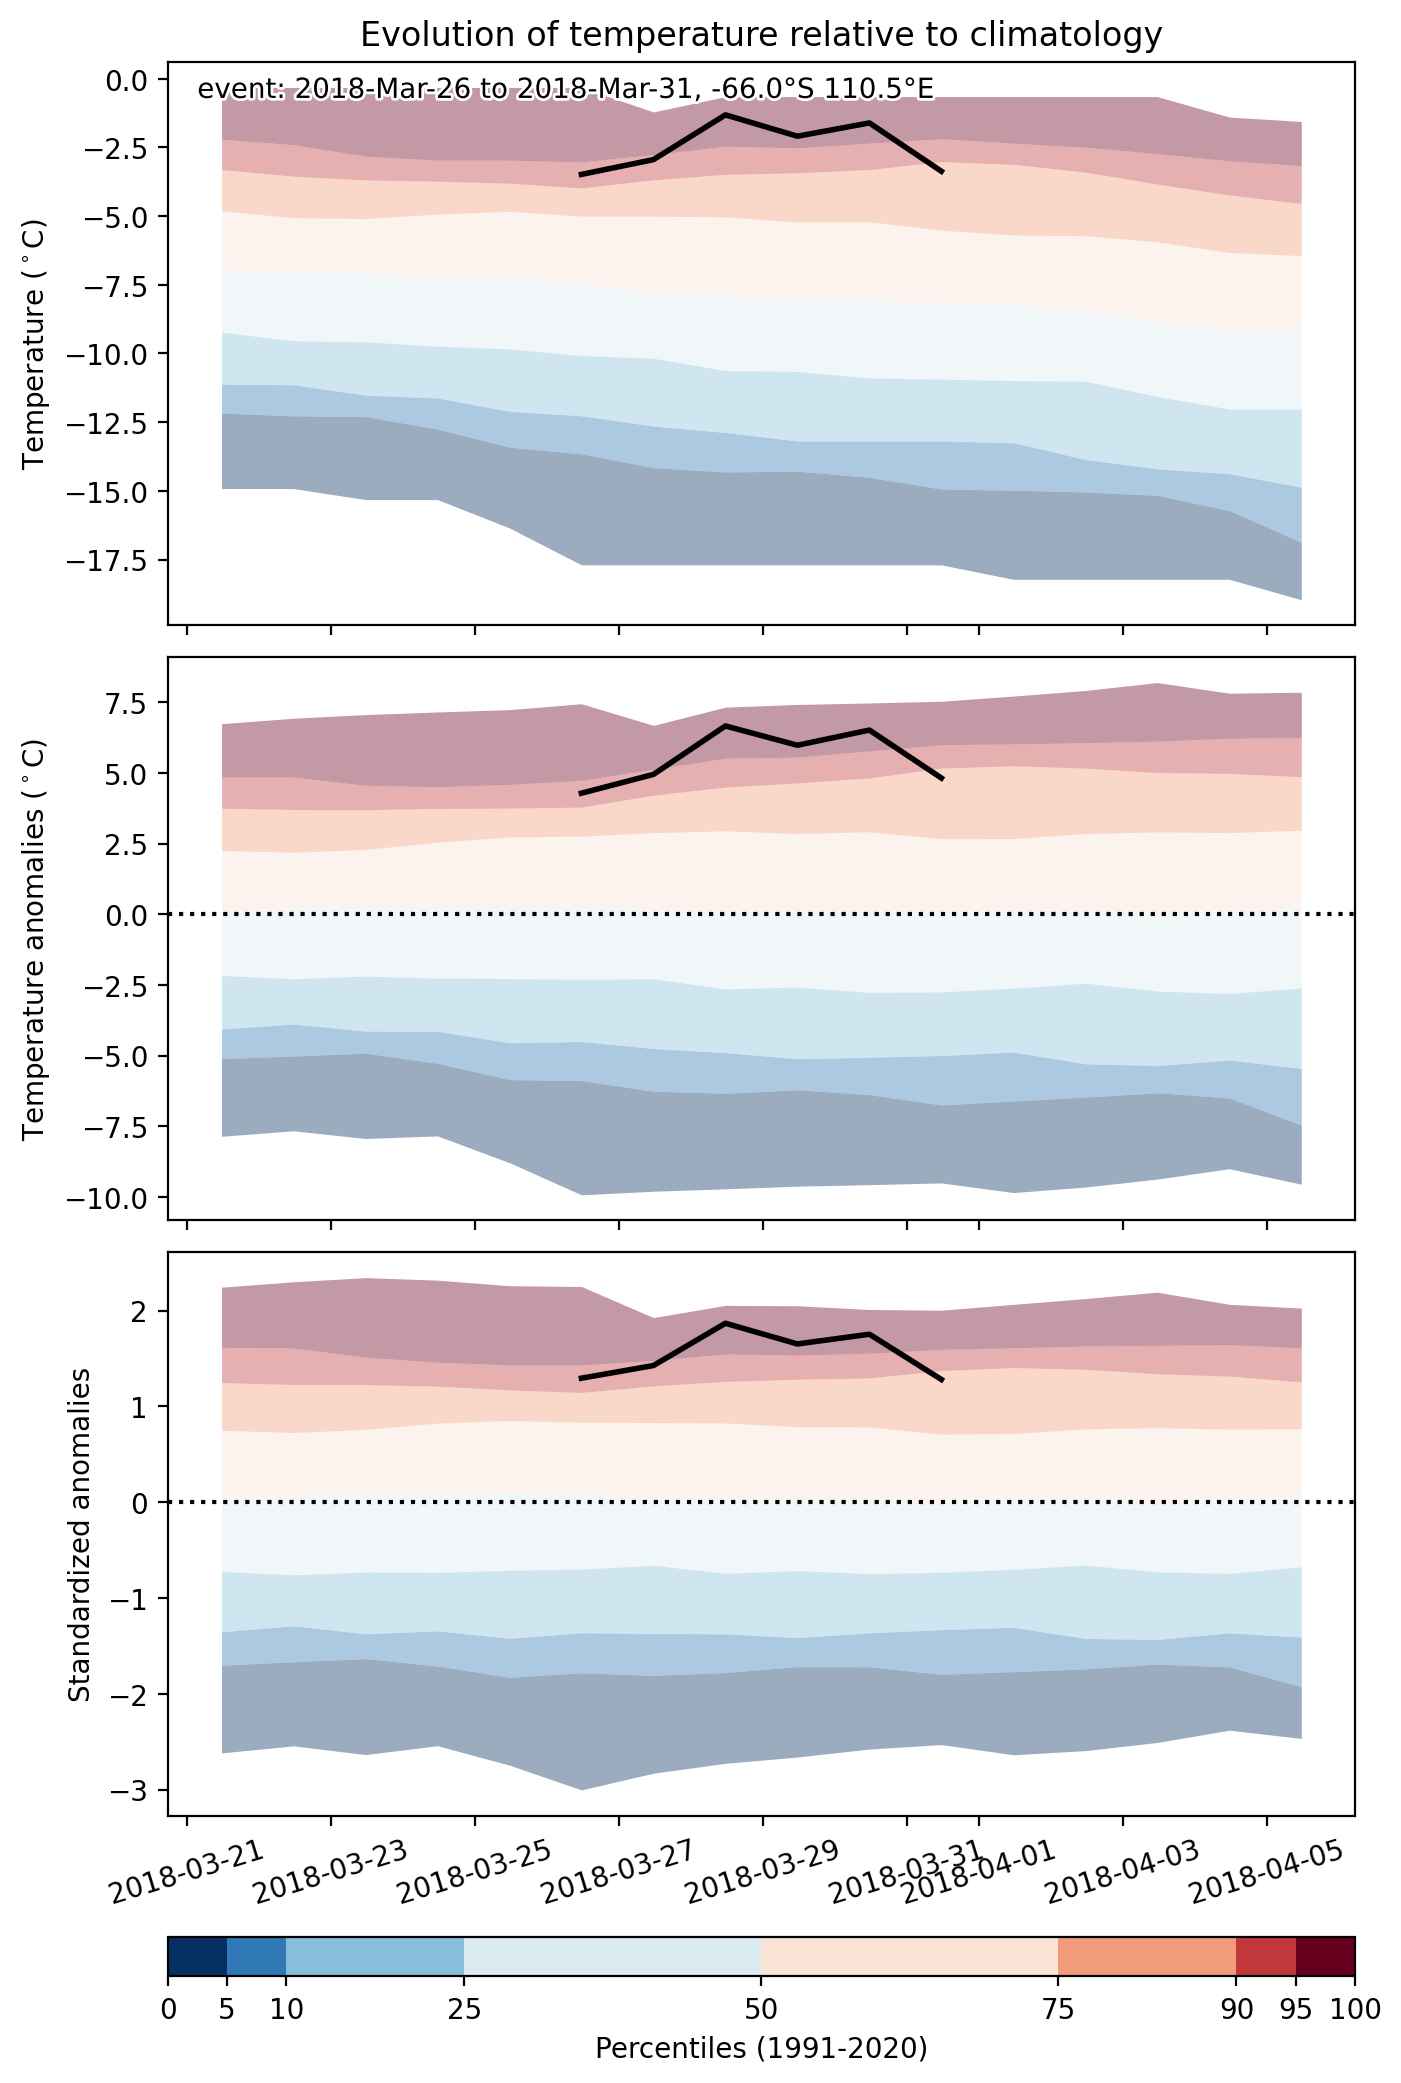


Fig. 2: Evolution of temperature at the center of the event. The climatological percentile distribution is illustrated with color shadings.
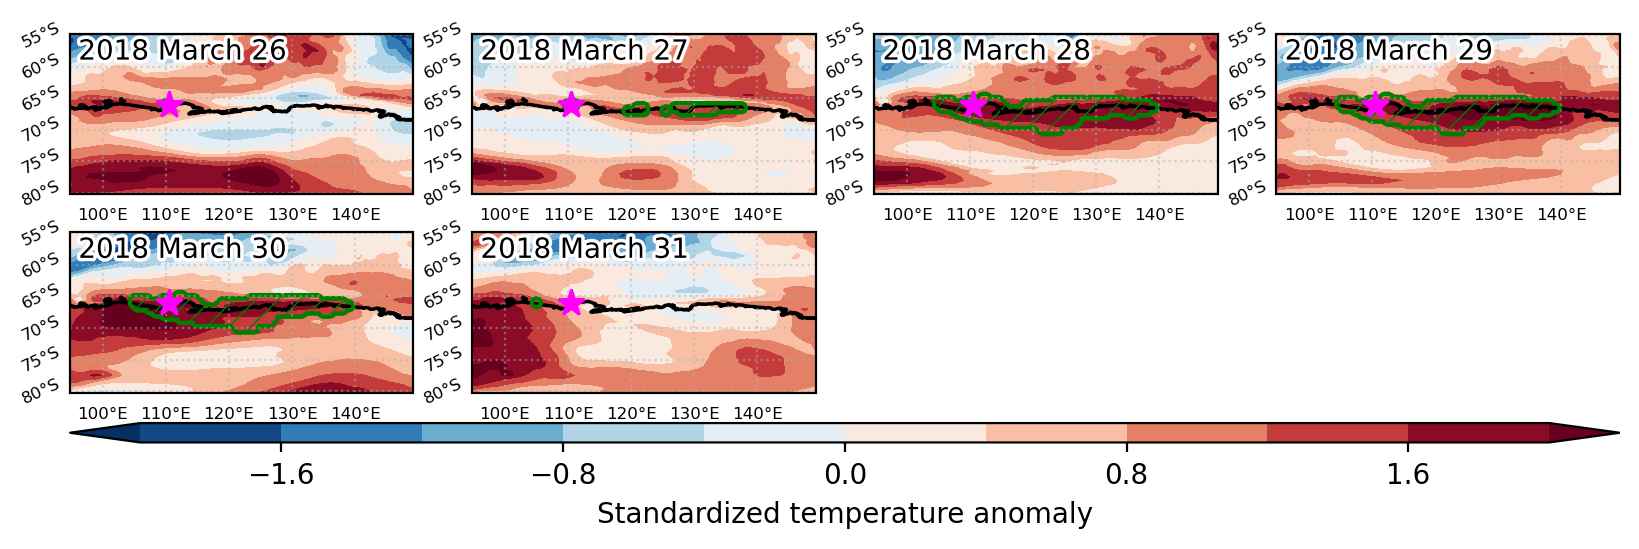


Fig. 3: Maps illustrating the evolution of standardized temperature anomalies during the event.

Event ID: Heat_wave_2018-Mar-26_to_2018-Mar-31_110.5_-66.0
Cold spell occuring from March 26 2018 to April 05 2018 at 60.0°N 12.0°E

Download data: JSON

Event type: Cold spell

Countries affected (identified with ArcGIS Online; provided only for geographical reference):

  • Denmark
  • Estonia
  • Faroe Islands
  • Germany
  • Ireland
  • Norway
  • Sweden
  • United Kingdom

Duration: 11 days

Time span: March 26 2018 to April 05 2018

Statistics over entire affected area:

  • Mean temperature anomaly: -4.4 °C
  • Mean temperature: -0.8 °C
  • Minimum temperature anomaly: -12.8 °C
  • Minimum temperature: -16.4 °C

Event center: 60.0°N 12.0°E

Area affected: 1987947 km$^2$


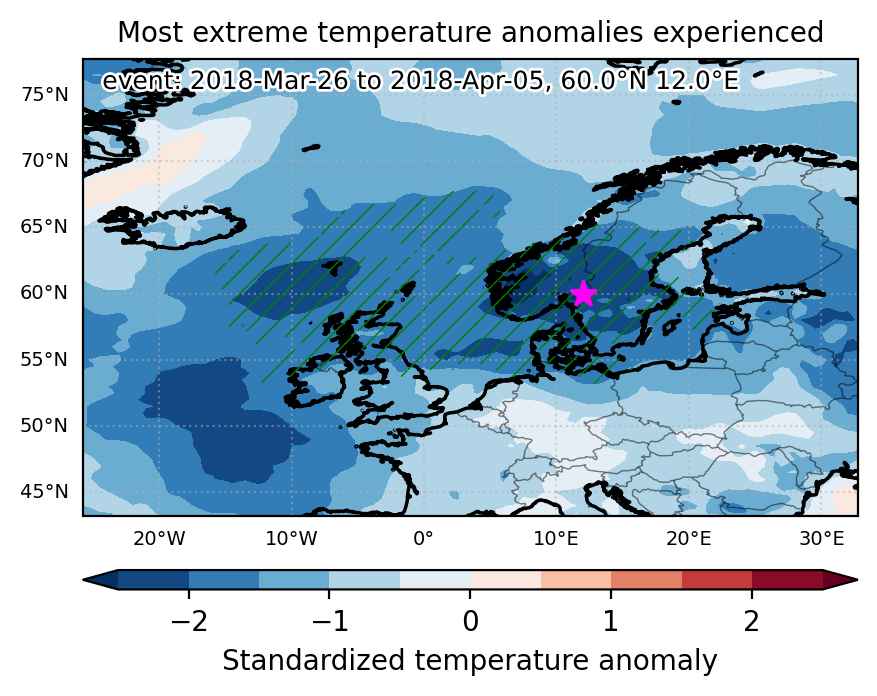
Fig. 1: Map of most extreme temperature anomalies (standardized) experienced during the event. The purple star indicates the center of the extreme event. Green hatching illustrates all areas under the effect of extremes at some time during the event.


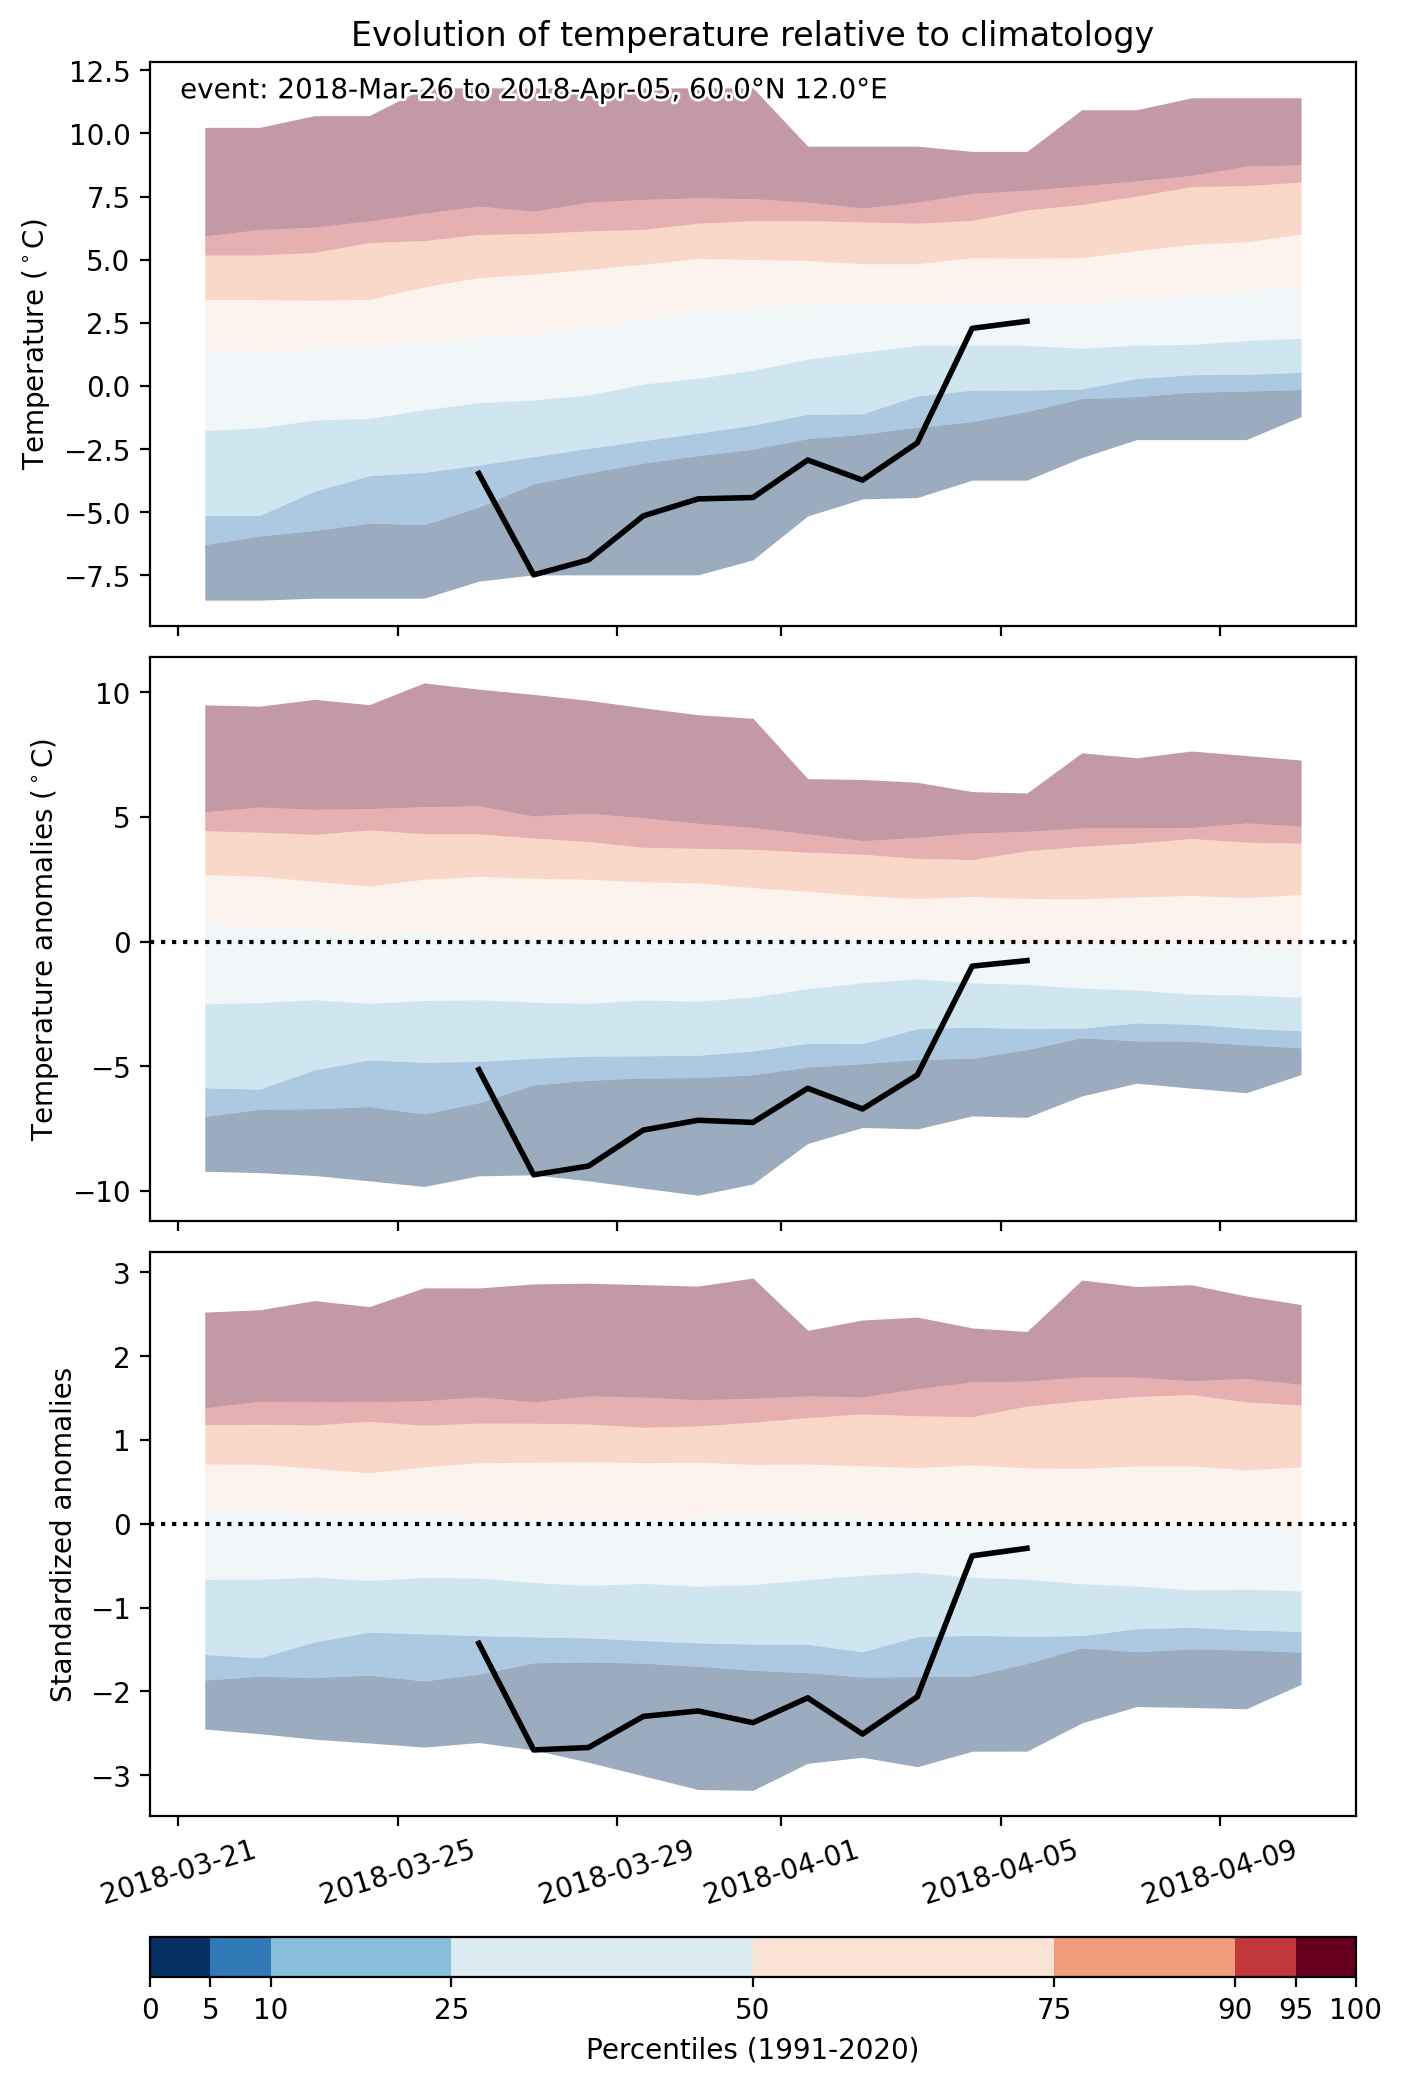
Fig. 2: Evolution of temperature at the center of the event. The climatological percentile distribution is illustrated with color shadings.


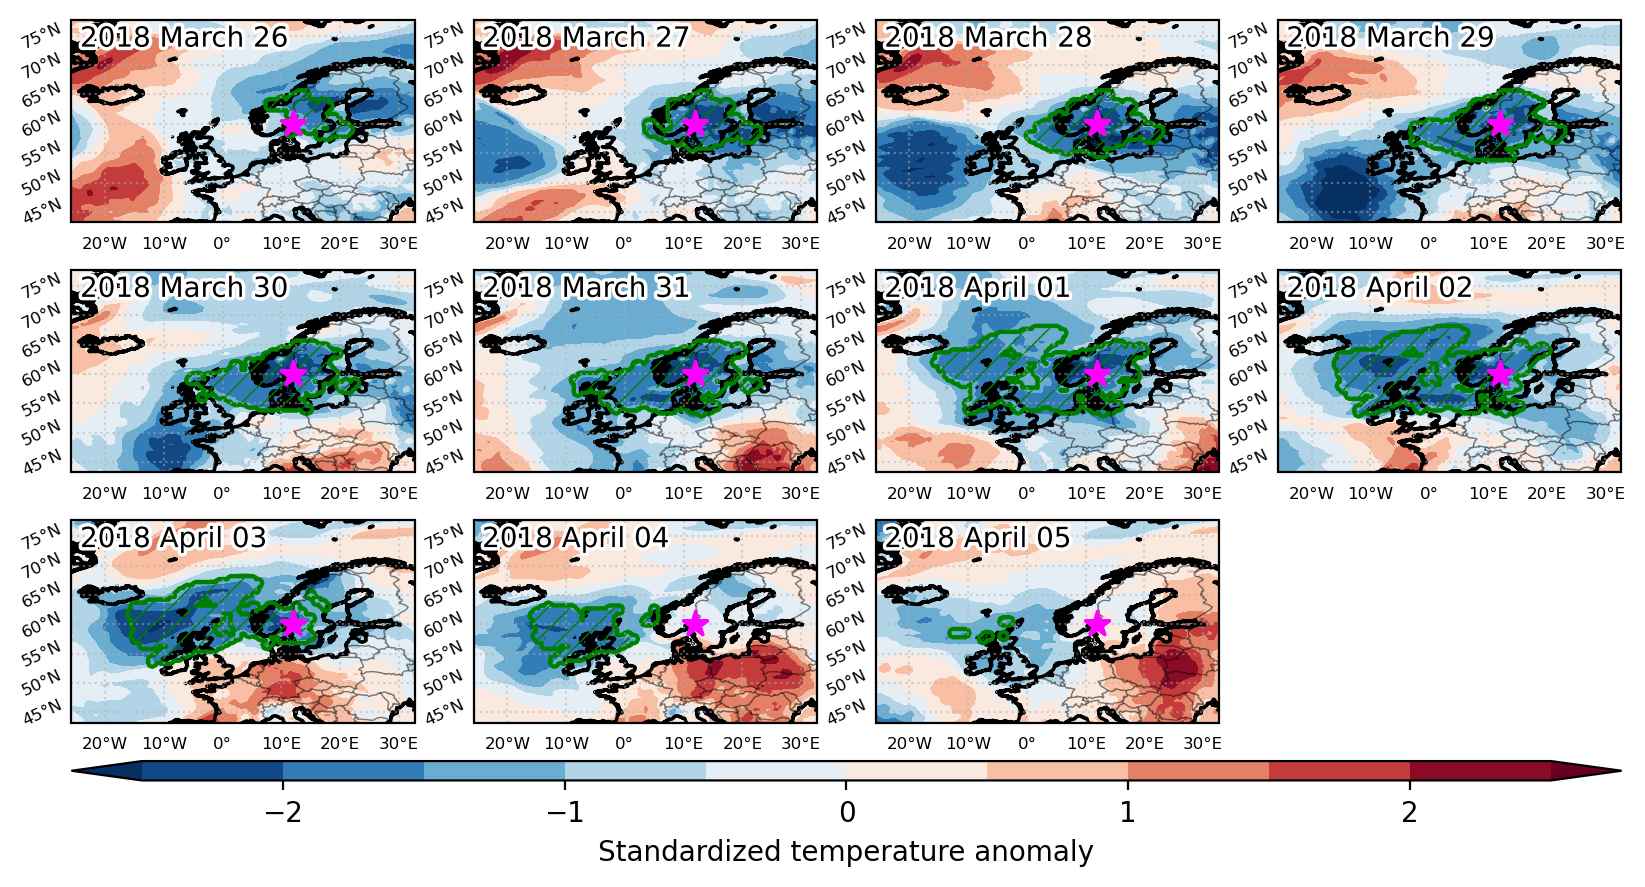
Fig. 3: Maps illustrating the evolution of standardized temperature anomalies during the event.

Event ID: Cold_spell_2018-Mar-26_to_2018-Apr-05_12.0_60.0

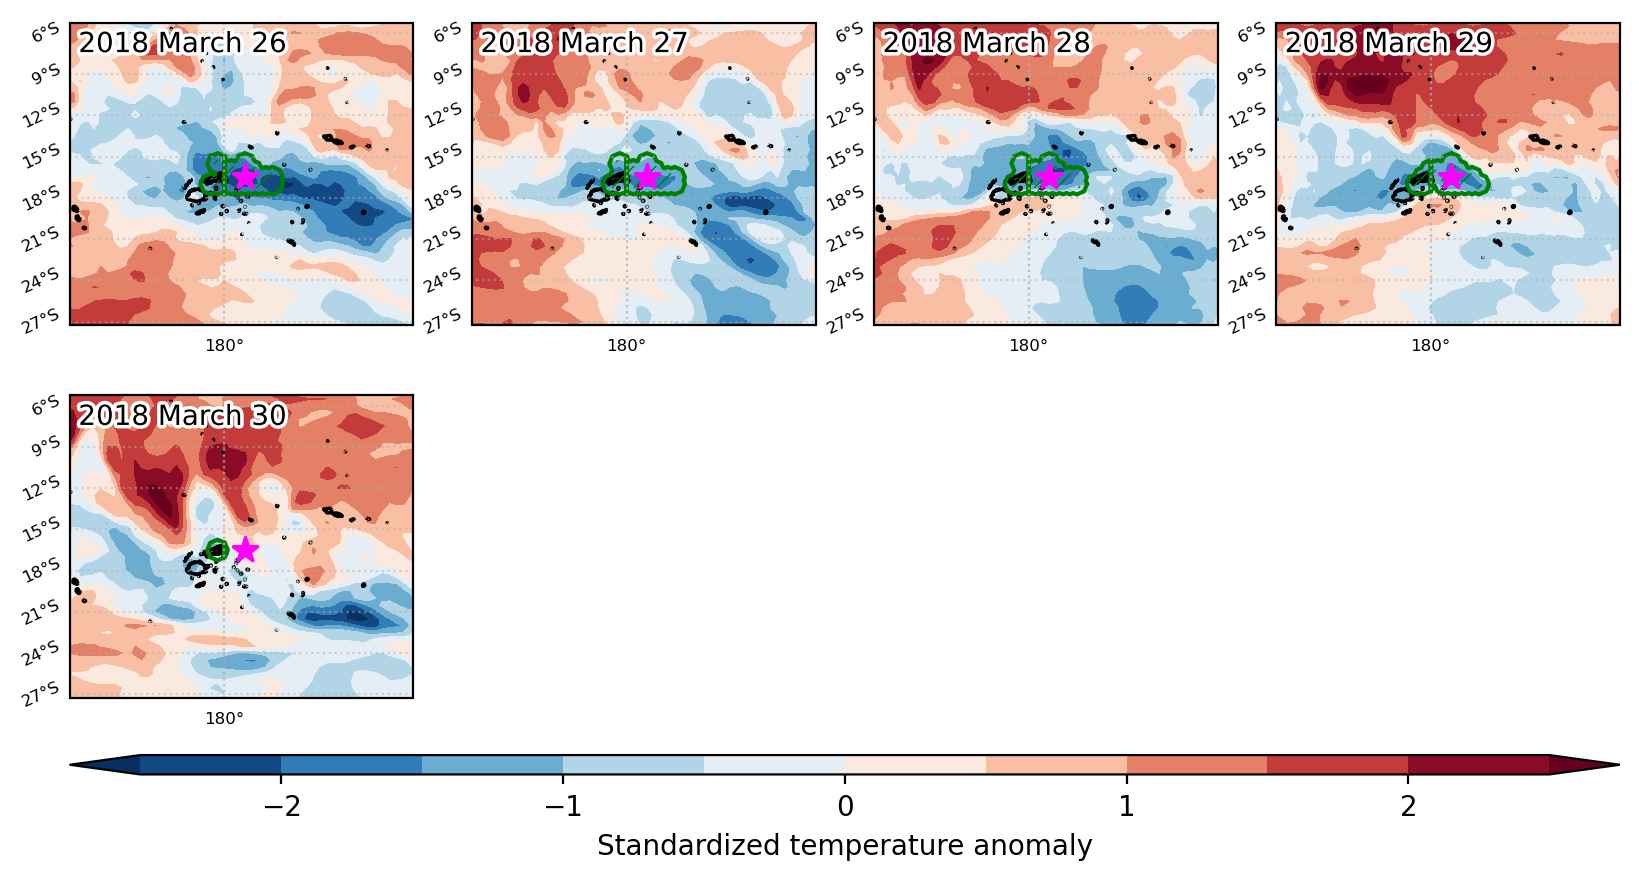
Cold spell occuring from March 26 2018 to March 30 2018 at -16.5°S 181.5°E

Download data: JSON

Event type: Cold spell

Countries affected (identified with ArcGIS Online; provided only for geographical reference):

  • Fiji

Duration: 5 days

Time span: March 26 2018 to March 30 2018

Statistics over entire affected area:

  • Mean temperature anomaly: -1.0 °C
  • Mean temperature: 26.0 °C
  • Minimum temperature anomaly: -1.4 °C
  • Minimum temperature: 24.5 °C

Event center: -16.5°S 181.5°E

Area affected: 77048 km$^2$


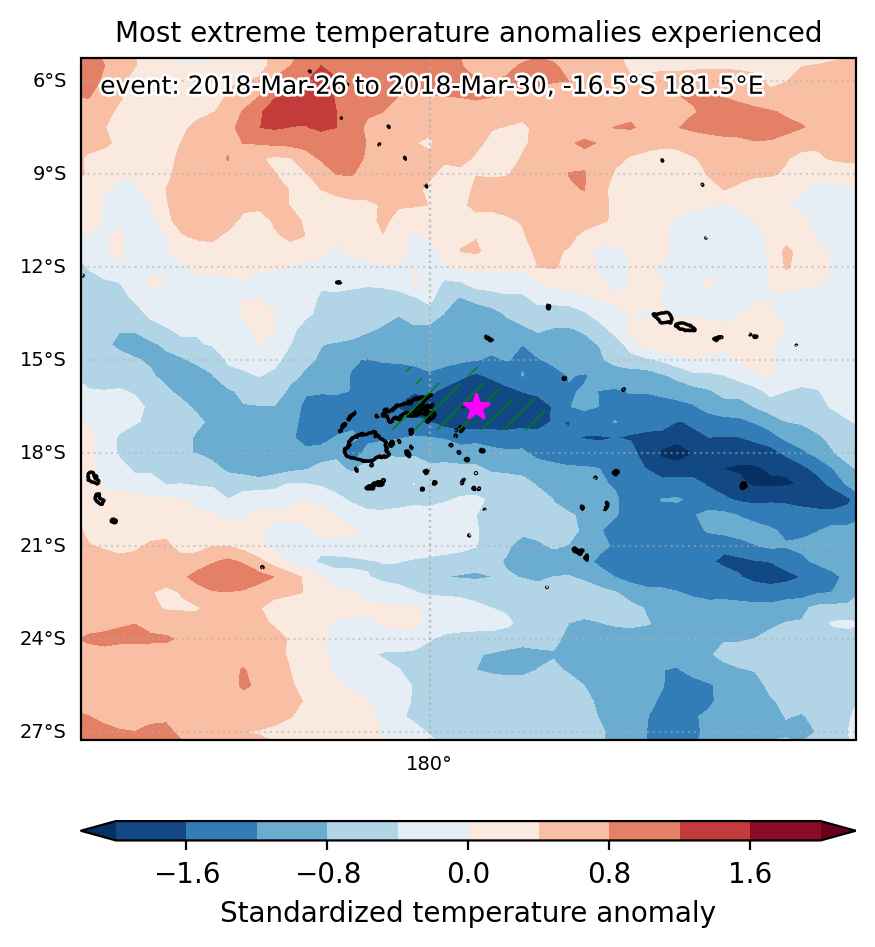
Fig. 1: Map of most extreme temperature anomalies (standardized) experienced during the event. The purple star indicates the center of the extreme event. Green hatching illustrates all areas under the effect of extremes at some time during the event.


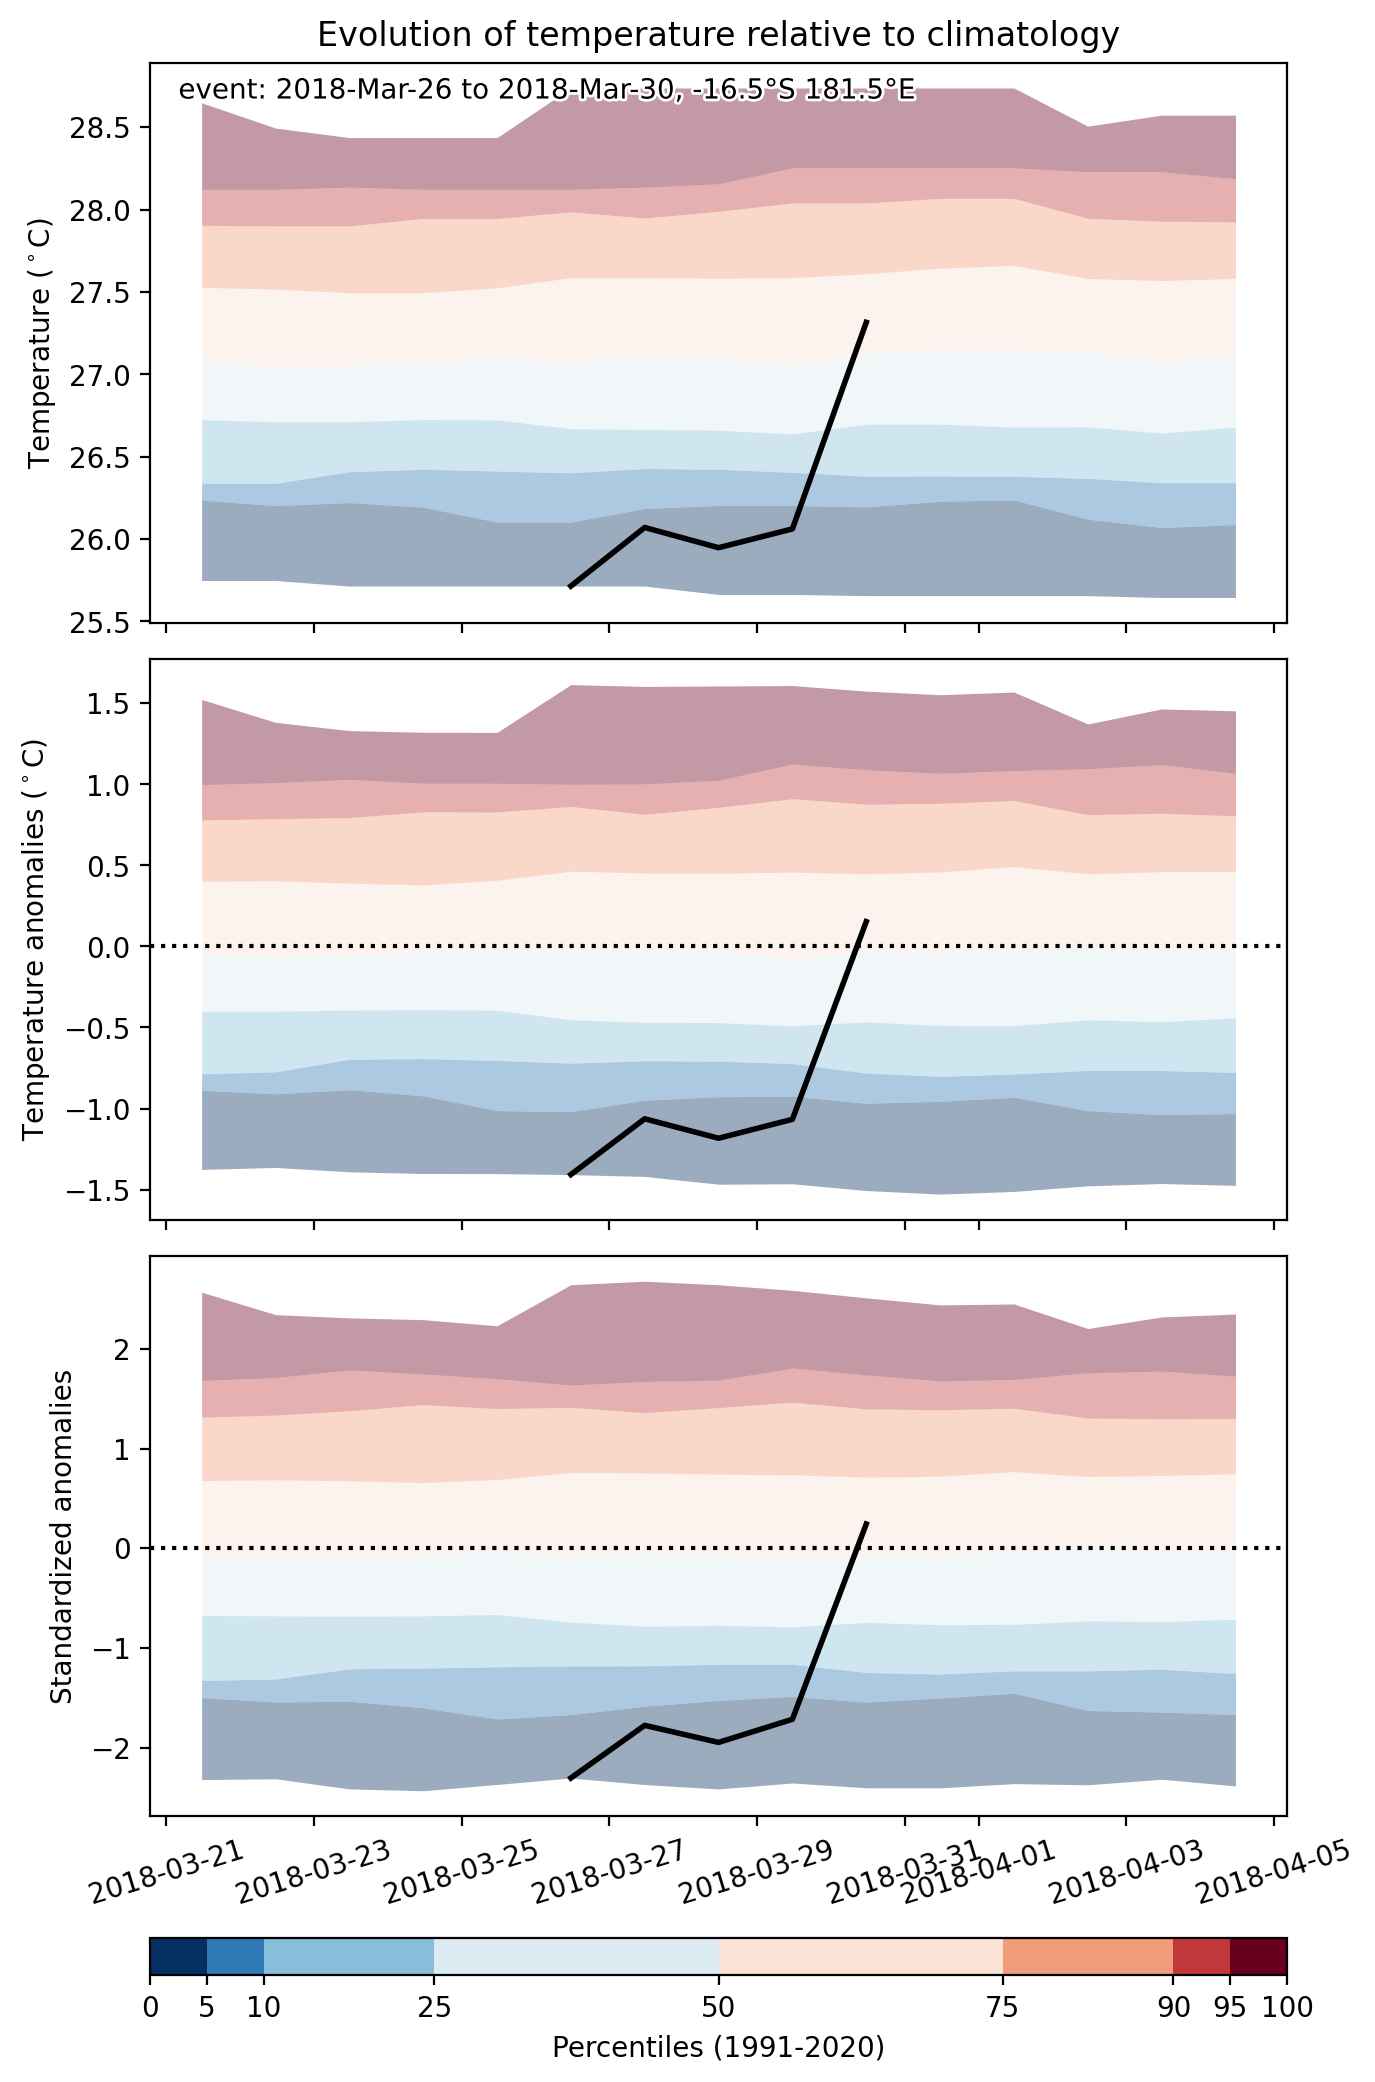
Fig. 2: Evolution of temperature at the center of the event. The climatological percentile distribution is illustrated with color shadings.


Fig. 3: Maps illustrating the evolution of standardized temperature anomalies during the event.

Event ID: Cold_spell_2018-Mar-26_to_2018-Mar-30_181.5_-16.5

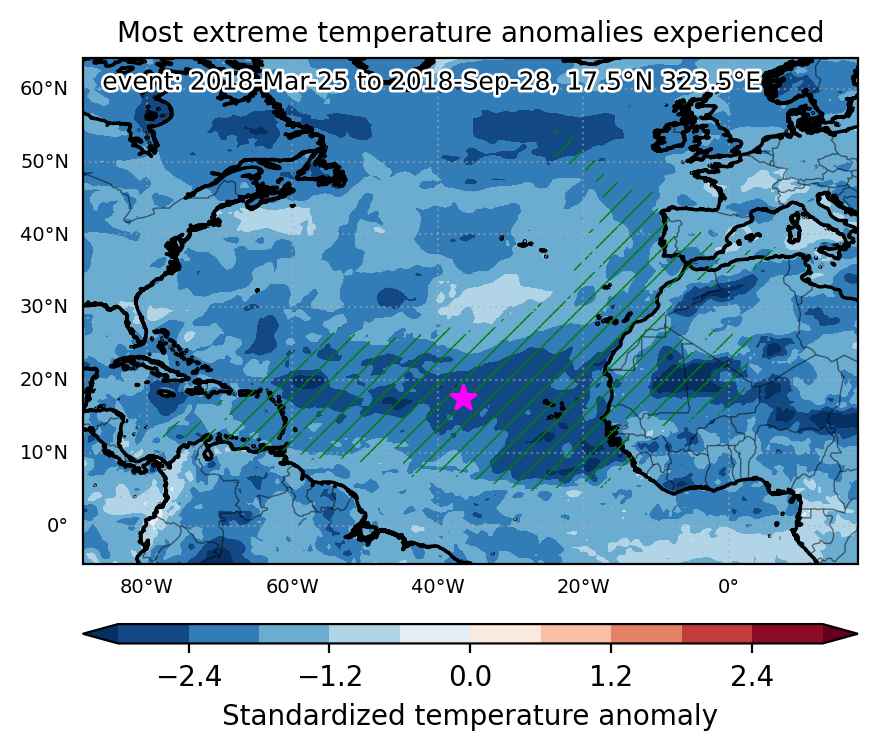
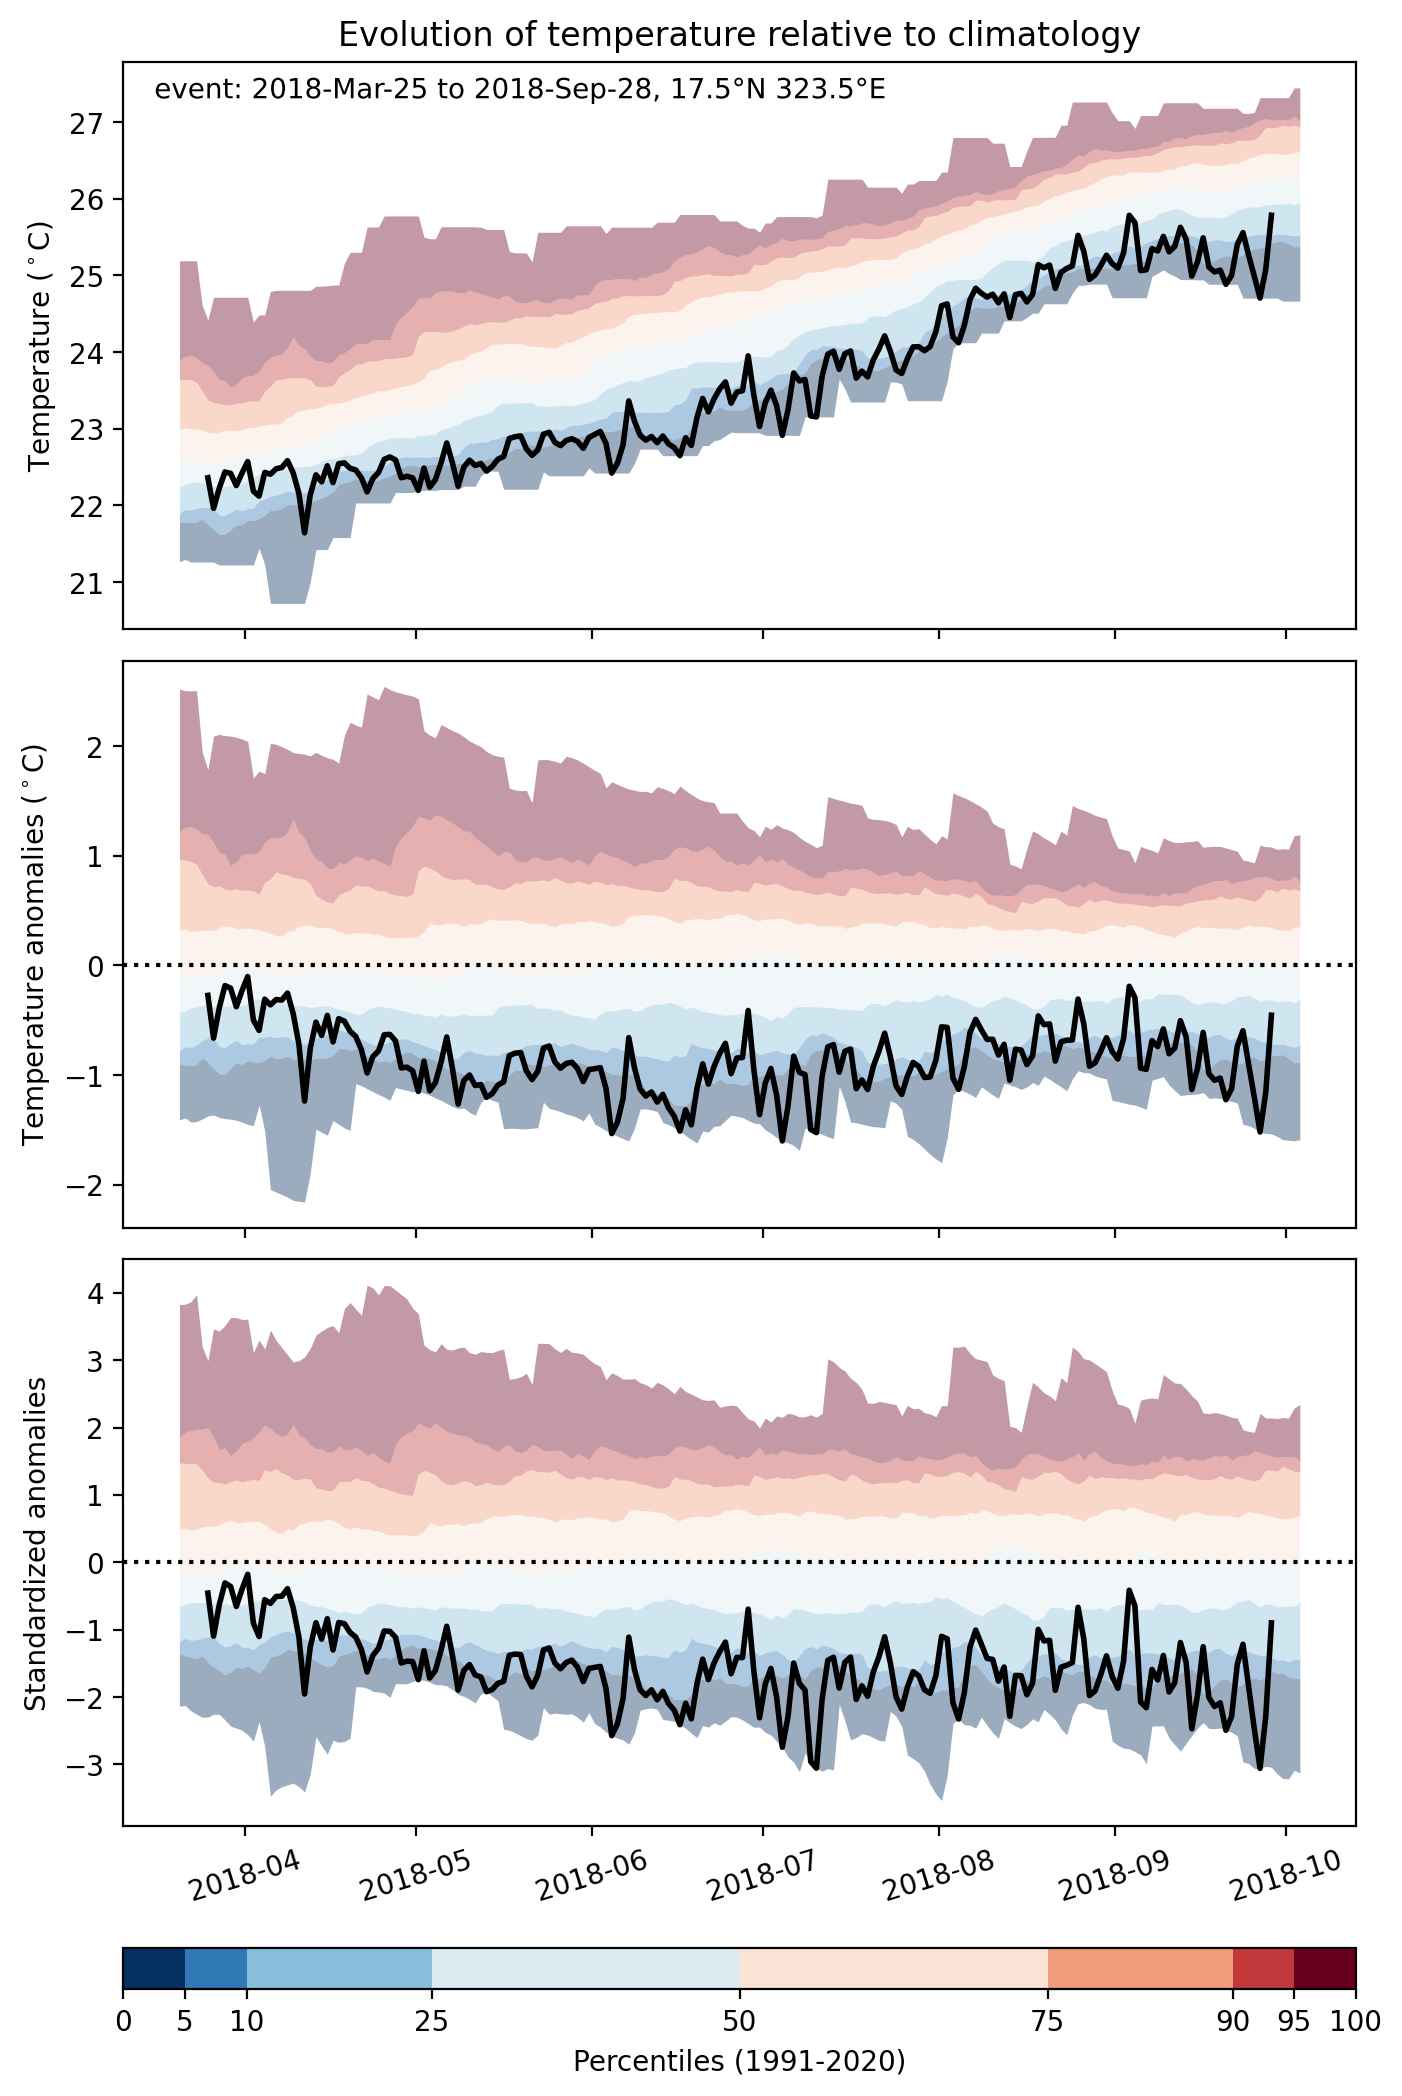
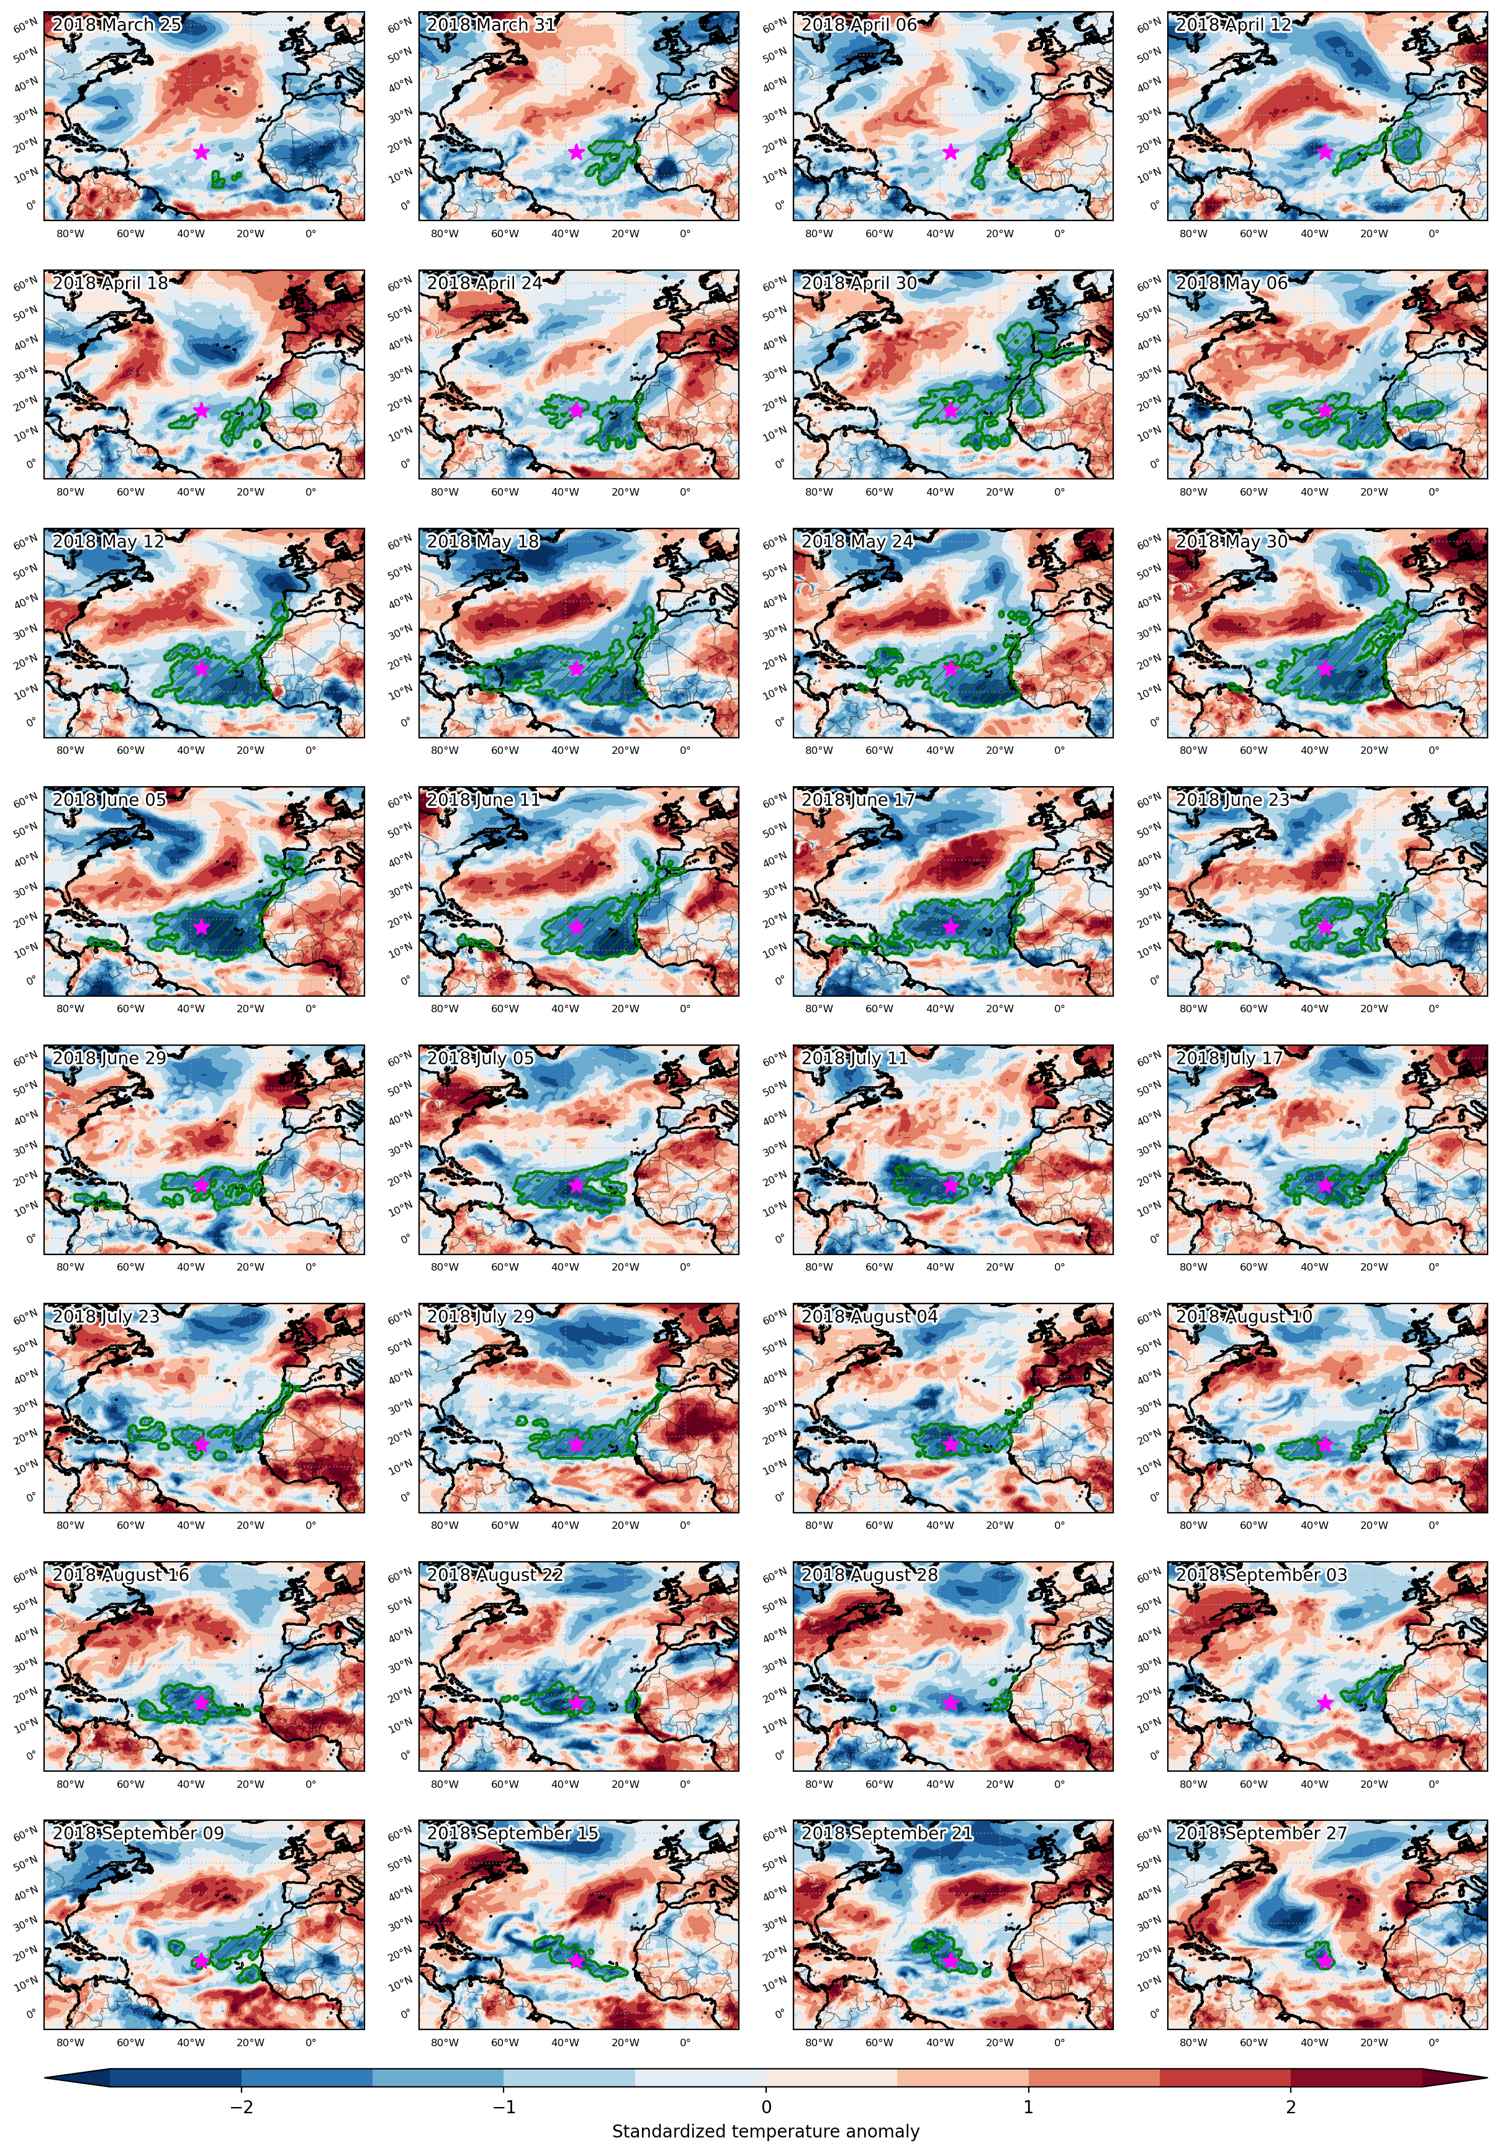
Cold spell occuring from March 25 2018 to September 28 2018 at 17.5°N 323.5°E

Download data: JSON

Event type: Cold spell

Countries affected (identified with ArcGIS Online; provided only for geographical reference):

  • Algeria
  • Aruba
  • Cabo Verde
  • Canarias
  • Colombia
  • Dominican Republic
  • Gambia
  • Guinea
  • Guinea-Bissau
  • Madeira
  • Mali
  • Martinique
  • Mauritania
  • Morocco
  • Portugal
  • Puerto Rico
  • Saint Eustatius
  • Saint Lucia
  • Senegal
  • Spain
  • Venezuela

Duration: 188 days

Time span: March 25 2018 to September 28 2018

Statistics over entire affected area:

  • Mean temperature anomaly: -1.3 °C
  • Mean temperature: 22.8 °C
  • Minimum temperature anomaly: -9.6 °C
  • Minimum temperature: 3.1 °C

Event center: 17.5°N 323.5°E

Area affected: 16841060 km$^2$


Fig. 1: Map of most extreme temperature anomalies (standardized) experienced during the event. The purple star indicates the center of the extreme event. Green hatching illustrates all areas under the effect of extremes at some time during the event.


Fig. 2: Evolution of temperature at the center of the event. The climatological percentile distribution is illustrated with color shadings.


Fig. 3: Maps illustrating the evolution of standardized temperature anomalies during the event.

Event ID: Cold_spell_2018-Mar-25_to_2018-Sep-28_323.5_17.5

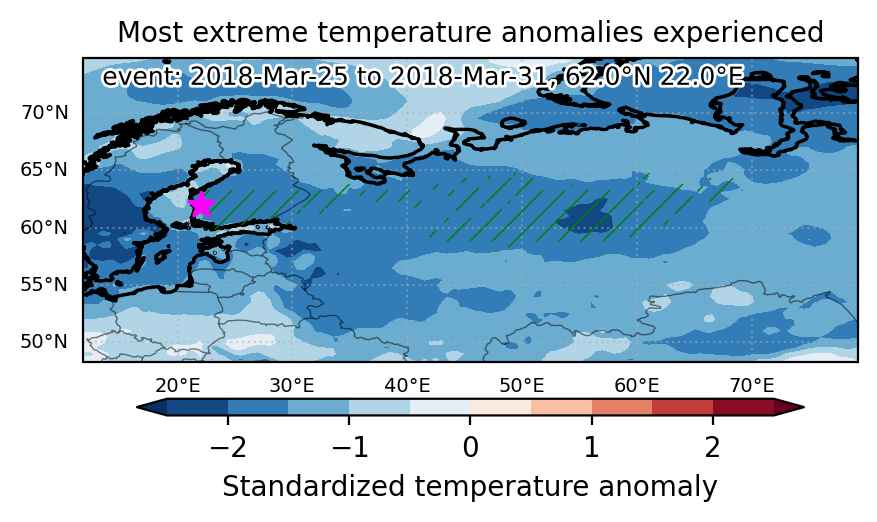
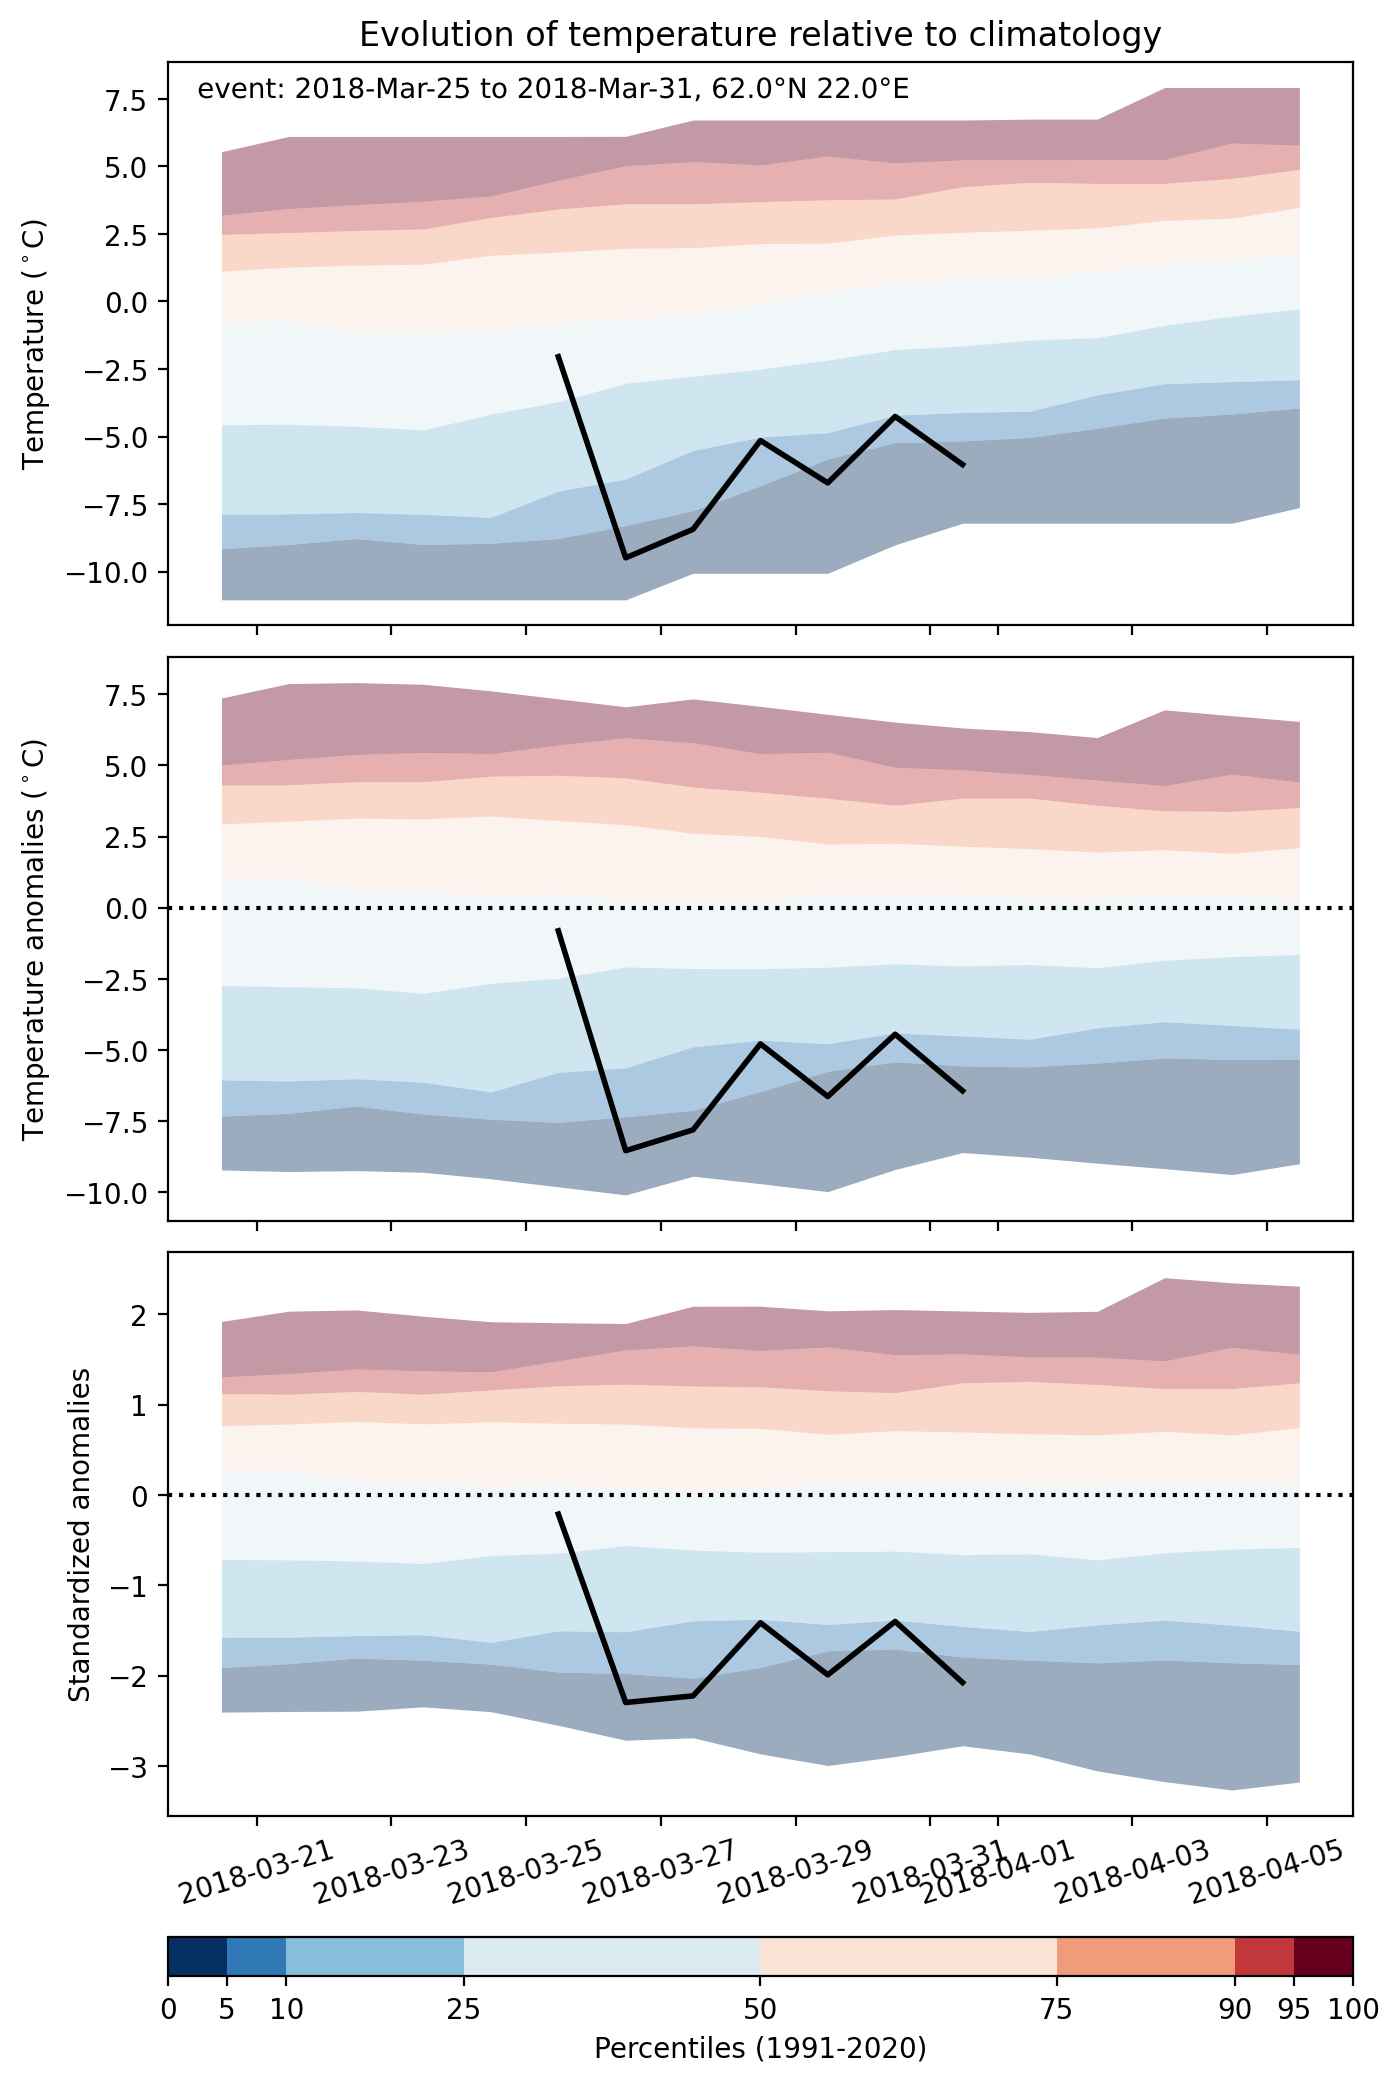
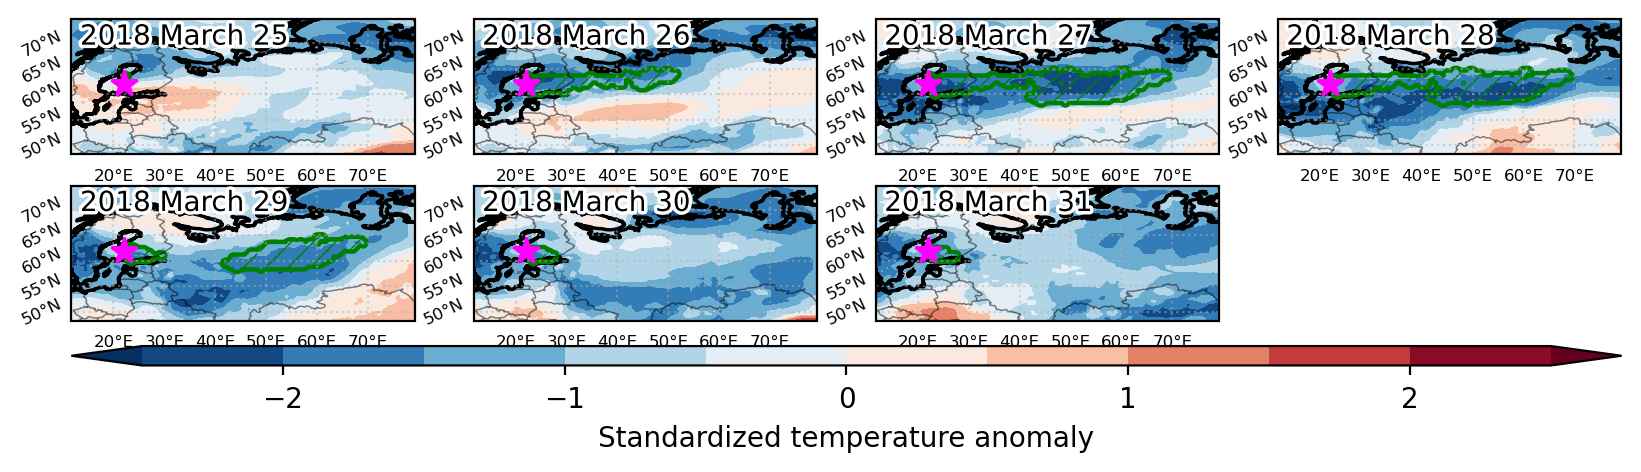
Cold spell occuring from March 25 2018 to March 31 2018 at 62.0°N 22.0°E

Download data: JSON

Event type: Cold spell

Countries affected (identified with ArcGIS Online; provided only for geographical reference):

  • Finland
  • Russian Federation

Duration: 7 days

Time span: March 25 2018 to March 31 2018

Statistics over entire affected area:

  • Mean temperature anomaly: -8.2 °C
  • Mean temperature: -11.6 °C
  • Minimum temperature anomaly: -13.0 °C
  • Minimum temperature: -23.3 °C

Event center: 62.0°N 22.0°E

Area affected: 799726 km$^2$


Fig. 1: Map of most extreme temperature anomalies (standardized) experienced during the event. The purple star indicates the center of the extreme event. Green hatching illustrates all areas under the effect of extremes at some time during the event.


Fig. 2: Evolution of temperature at the center of the event. The climatological percentile distribution is illustrated with color shadings.


Fig. 3: Maps illustrating the evolution of standardized temperature anomalies during the event.

Event ID: Cold_spell_2018-Mar-25_to_2018-Mar-31_22.0_62.0

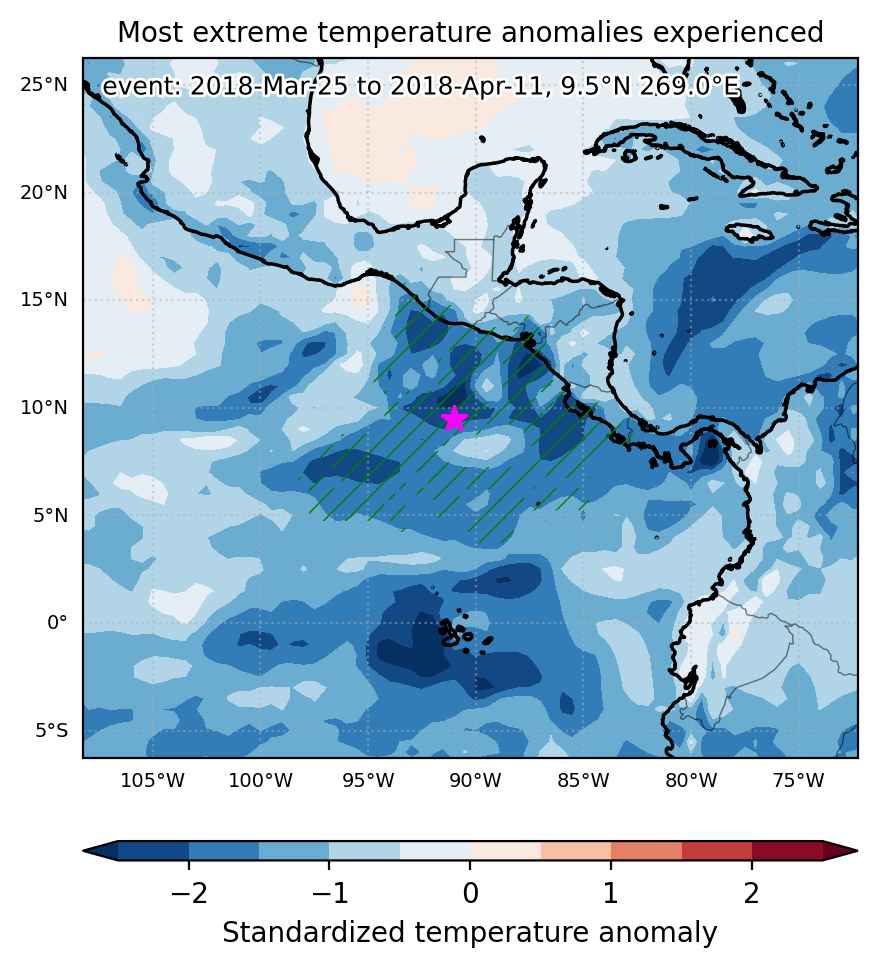
Cold spell occuring from March 25 2018 to April 11 2018 at 9.5°N 269.0°E

Download data: JSON

Event type: Cold spell

Countries affected (identified with ArcGIS Online; provided only for geographical reference):

  • Costa Rica
  • El Salvador
  • Guatemala
  • Honduras
  • Mexico
  • Nicaragua
  • Panama

Duration: 18 days

Time span: March 25 2018 to April 11 2018

Statistics over entire affected area:

  • Mean temperature anomaly: -1.2 °C
  • Mean temperature: 26.1 °C
  • Minimum temperature anomaly: -2.7 °C
  • Minimum temperature: 17.7 °C

Event center: 9.5°N 269.0°E

Area affected: 954603 km$^2$


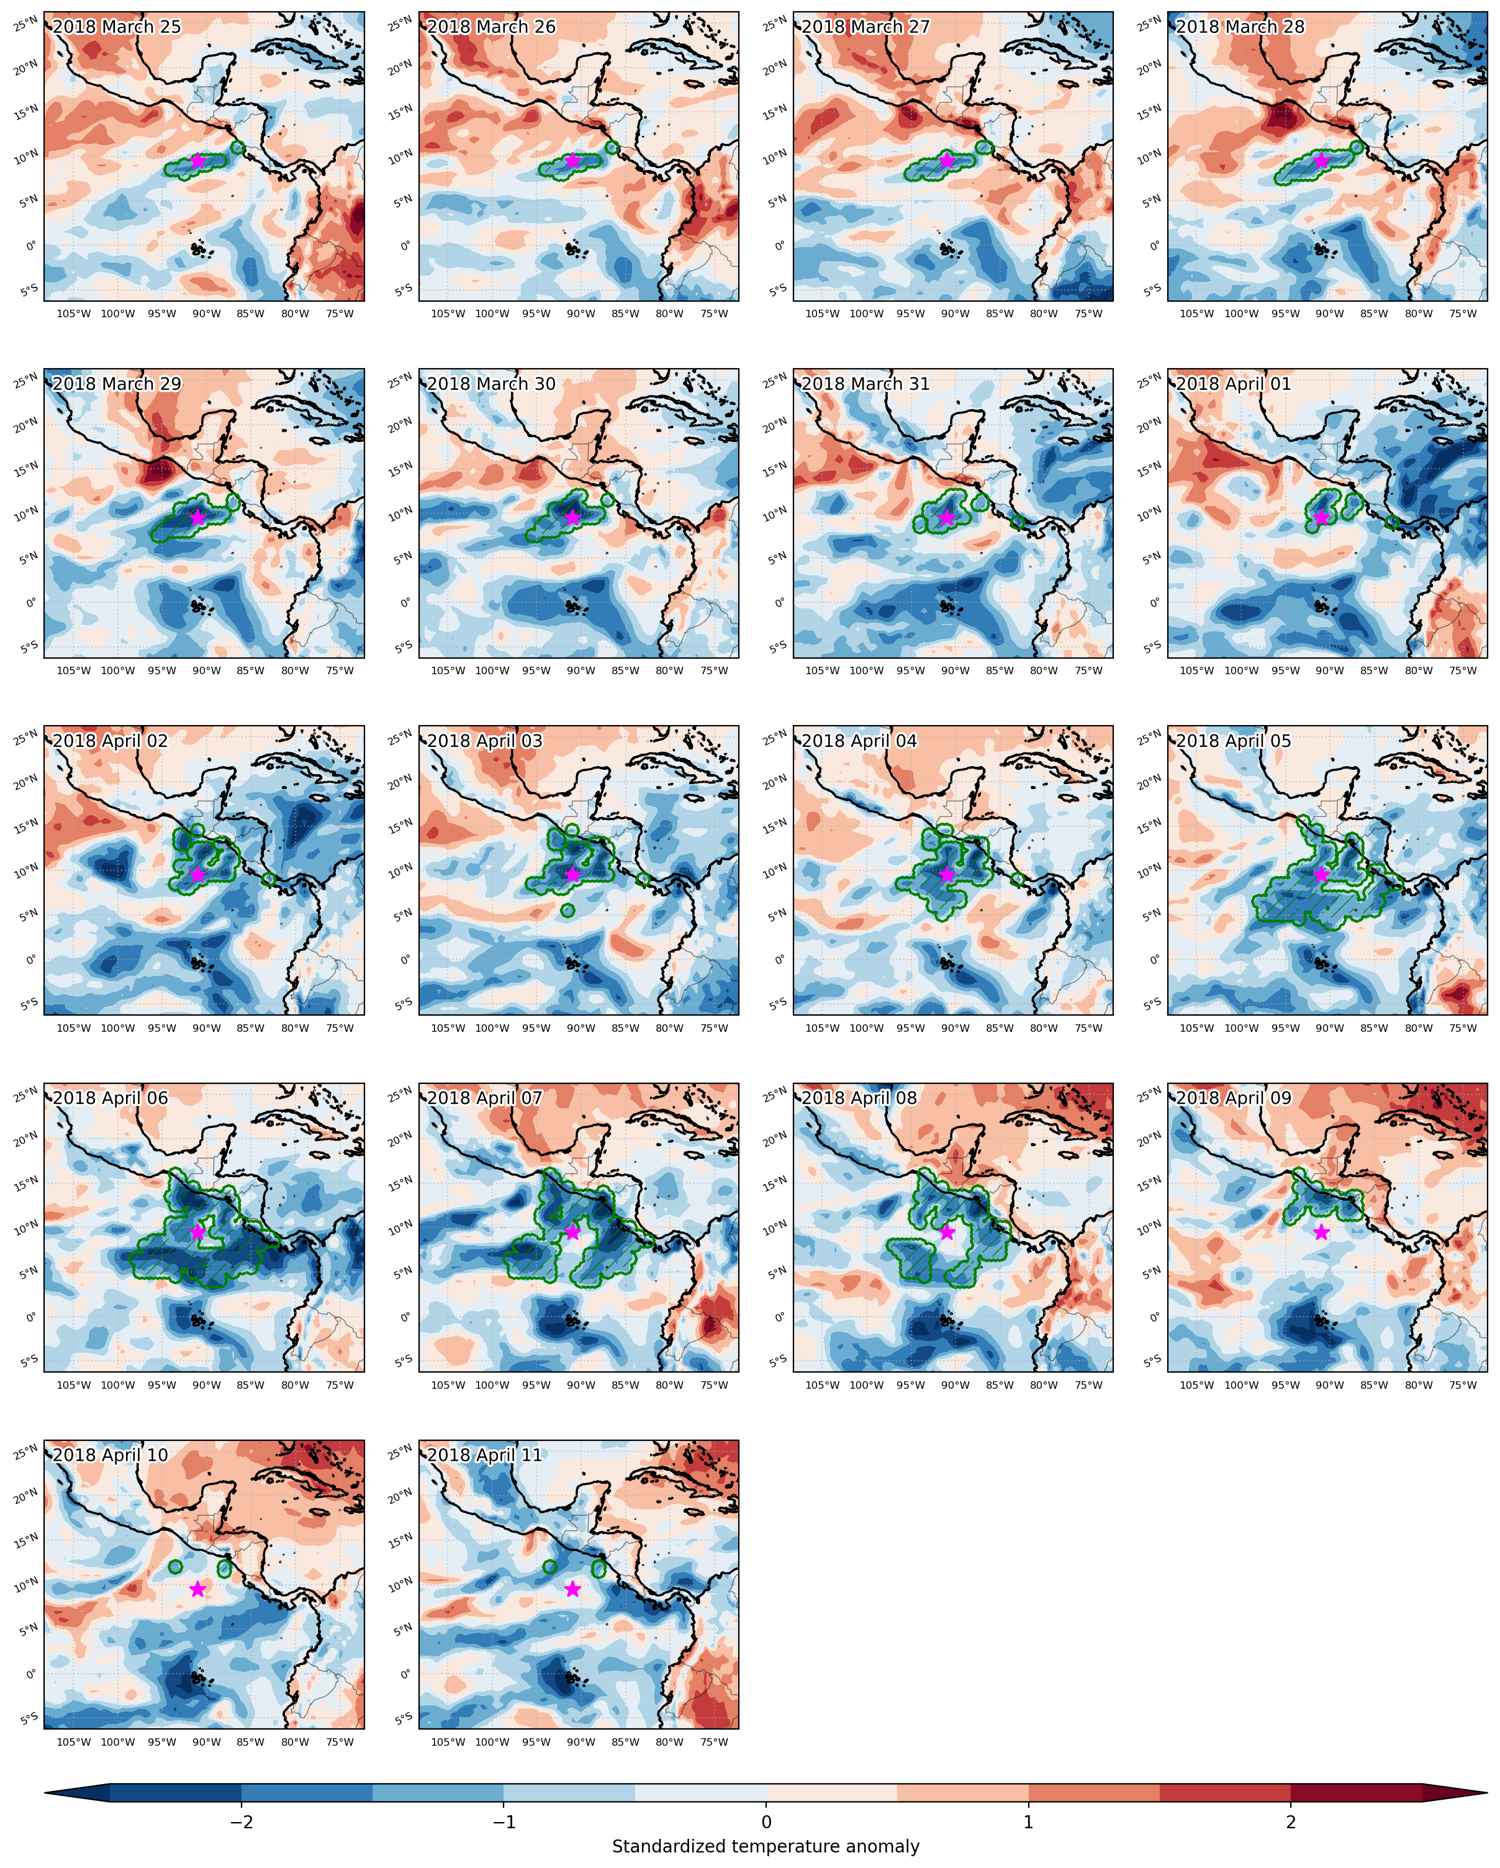
Fig. 1: Map of most extreme temperature anomalies (standardized) experienced during the event. The purple star indicates the center of the extreme event. Green hatching illustrates all areas under the effect of extremes at some time during the event.


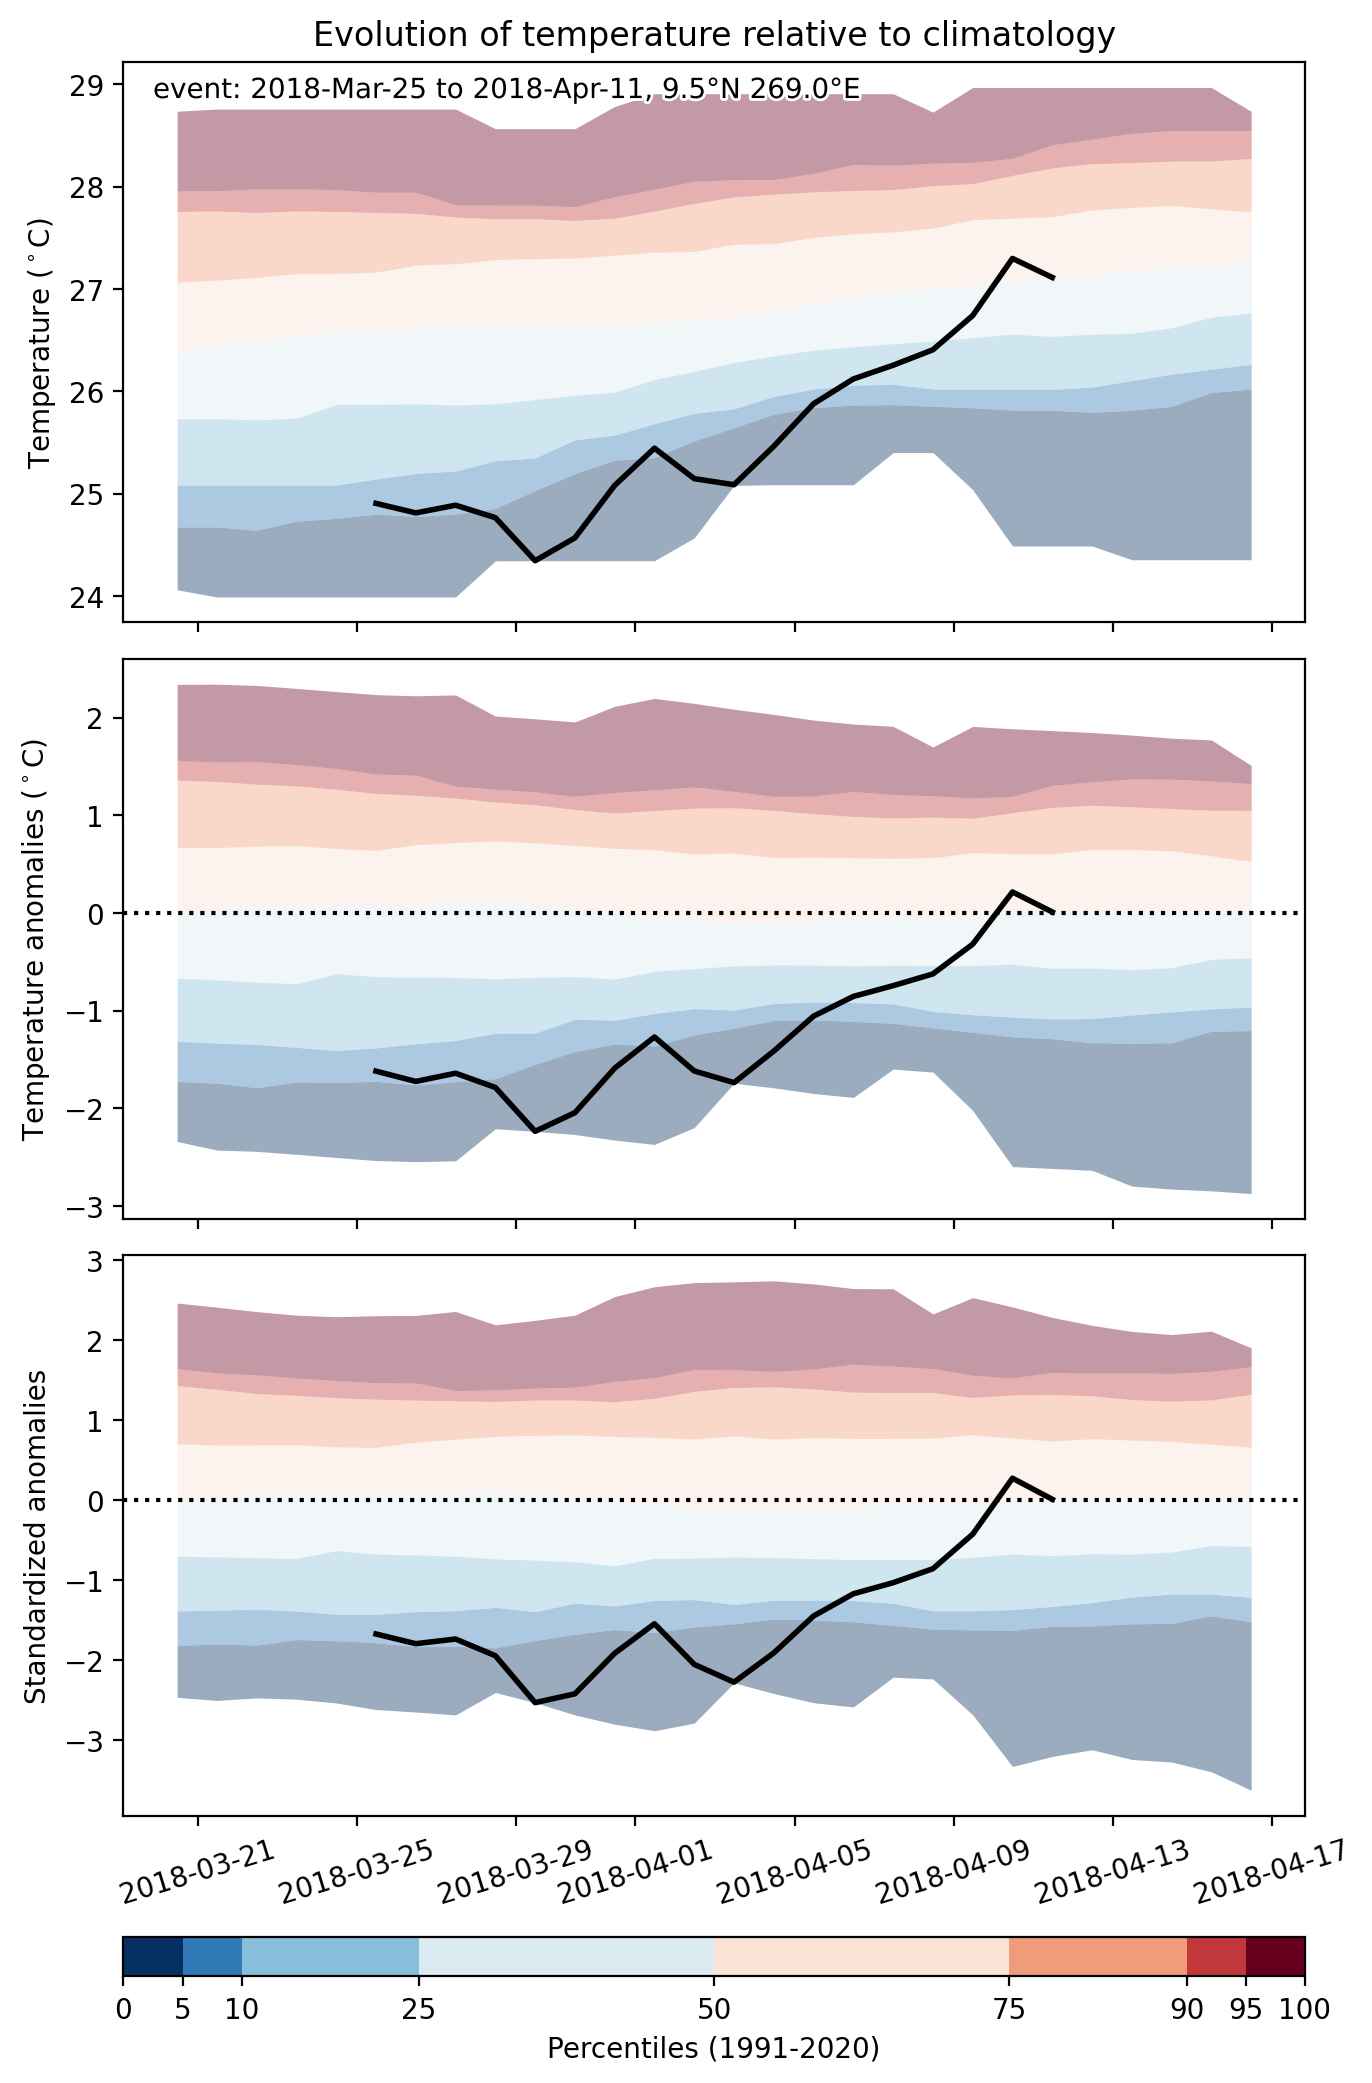
Fig. 2: Evolution of temperature at the center of the event. The climatological percentile distribution is illustrated with color shadings.


Fig. 3: Maps illustrating the evolution of standardized temperature anomalies during the event.

Event ID: Cold_spell_2018-Mar-25_to_2018-Apr-11_269.0_9.5

Cold spell occuring from March 25 2018 to March 27 2018 at 61.5°N 169.0°E

Download data: JSON

Event type: Cold spell

Countries affected (identified with ArcGIS Online; provided only for geographical reference):

  • Russian Federation

Duration: 3 days

Time span: March 25 2018 to March 27 2018

Statistics over entire affected area:

  • Mean temperature anomaly: -10.1 °C
  • Mean temperature: -24.5 °C
  • Minimum temperature anomaly: -13.1 °C
  • Minimum temperature: -26.8 °C

Event center: 61.5°N 169.0°E

Area affected: 53618 km$^2$


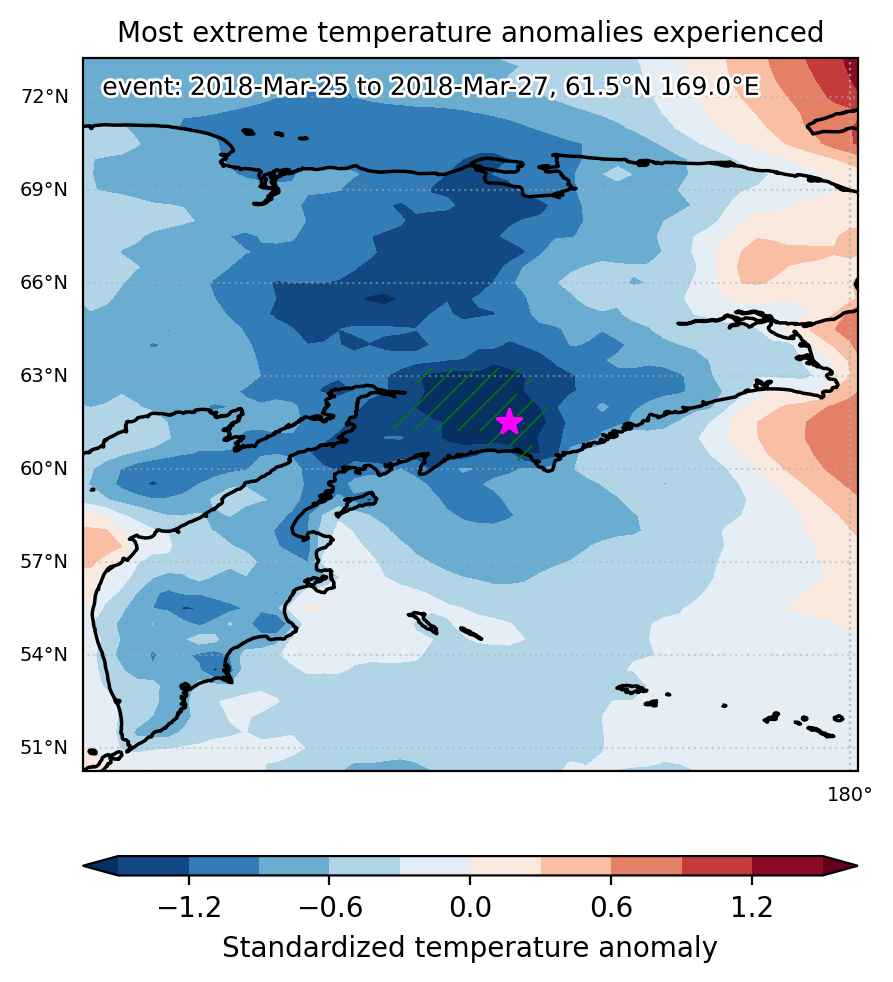
Fig. 1: Map of most extreme temperature anomalies (standardized) experienced during the event. The purple star indicates the center of the extreme event. Green hatching illustrates all areas under the effect of extremes at some time during the event.


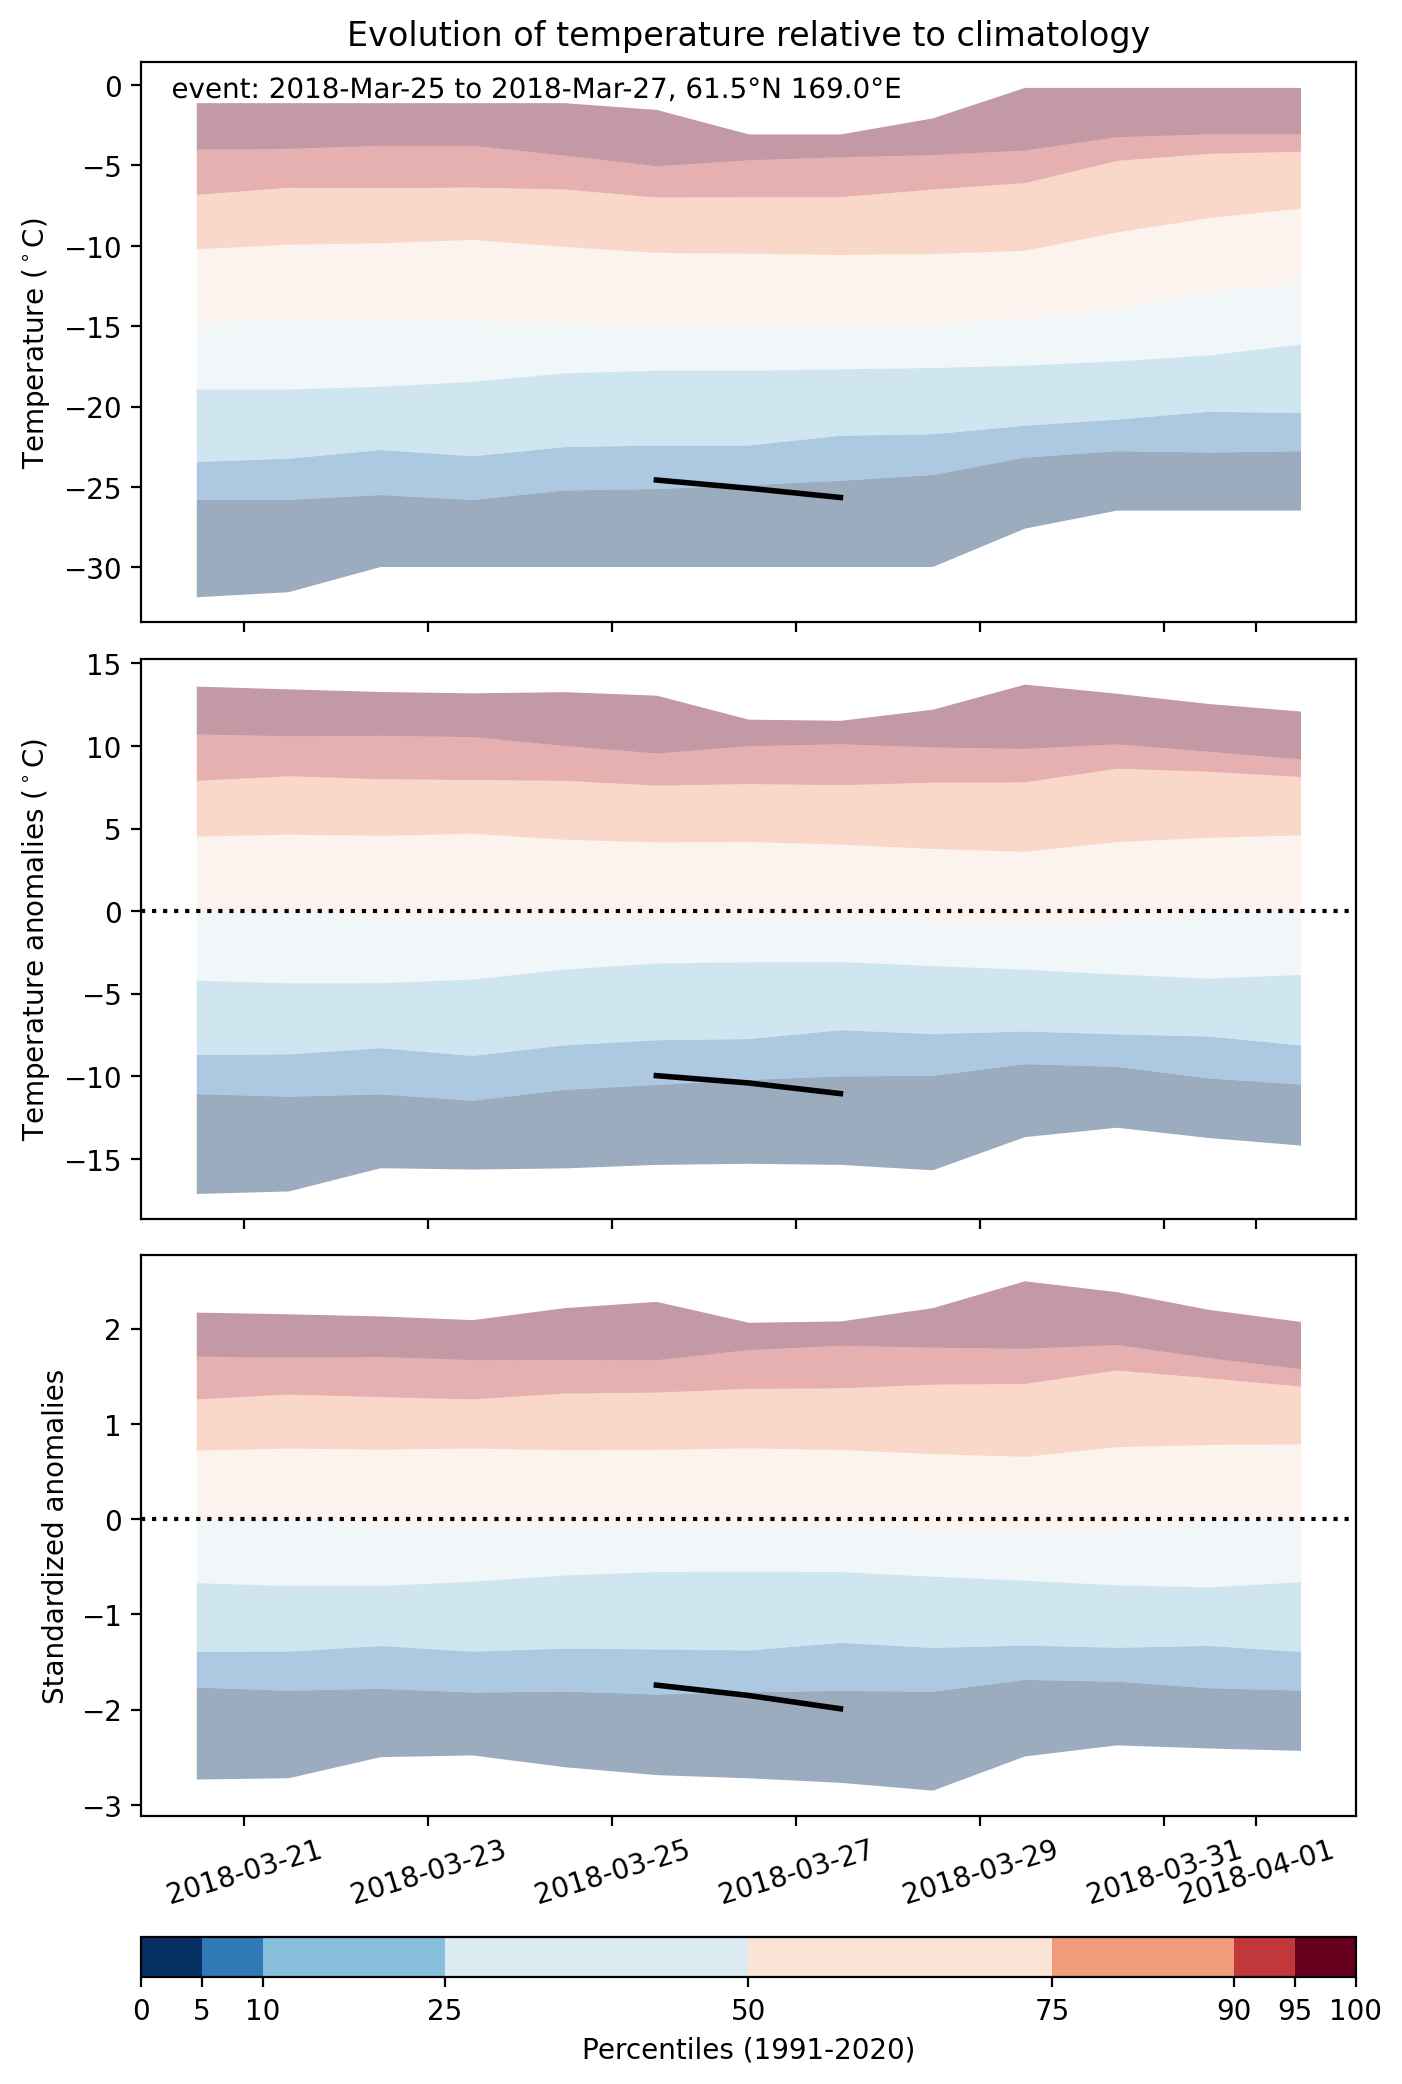
Fig. 2: Evolution of temperature at the center of the event. The climatological percentile distribution is illustrated with color shadings.


Fig. 3: Maps illustrating the evolution of standardized temperature anomalies during the event.

Event ID: Cold_spell_2018-Mar-25_to_2018-Mar-27_169.0_61.5

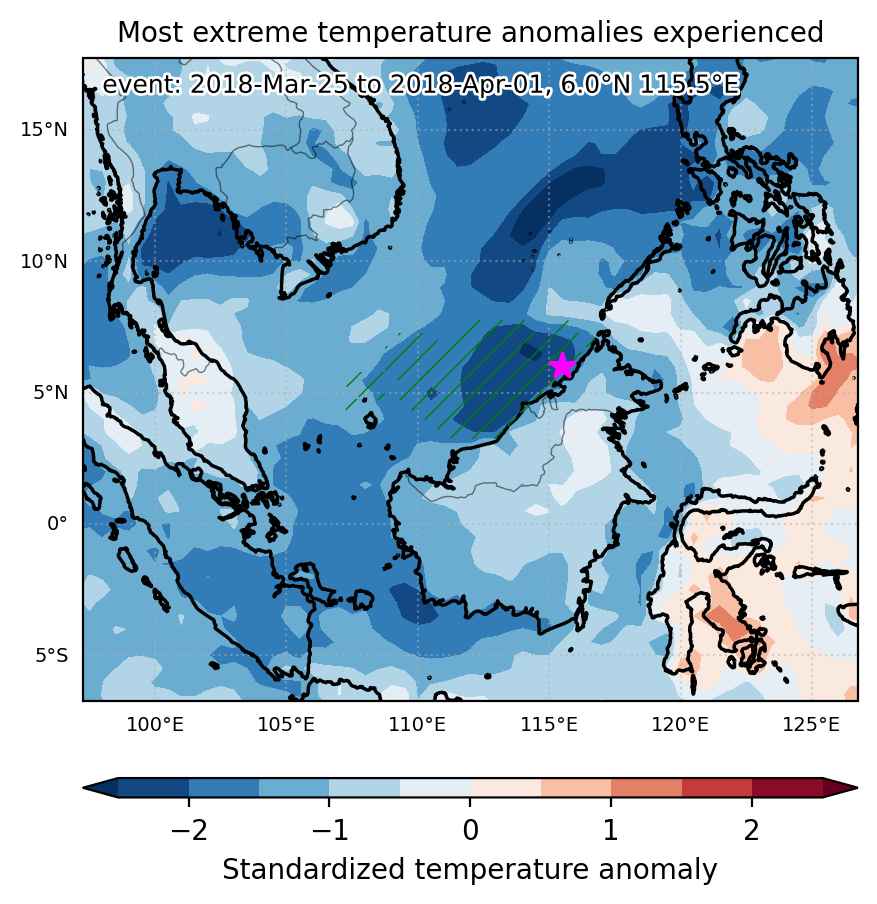
Cold spell occuring from March 25 2018 to April 01 2018 at 6.0°N 115.5°E

Download data: JSON

Event type: Cold spell

Countries affected (identified with ArcGIS Online; provided only for geographical reference):

  • Malaysia

Duration: 8 days

Time span: March 25 2018 to April 01 2018

Statistics over entire affected area:

  • Mean temperature anomaly: -1.1 °C
  • Mean temperature: 26.1 °C
  • Minimum temperature anomaly: -1.6 °C
  • Minimum temperature: 25.4 °C

Event center: 6.0°N 115.5°E

Area affected: 307531 km$^2$


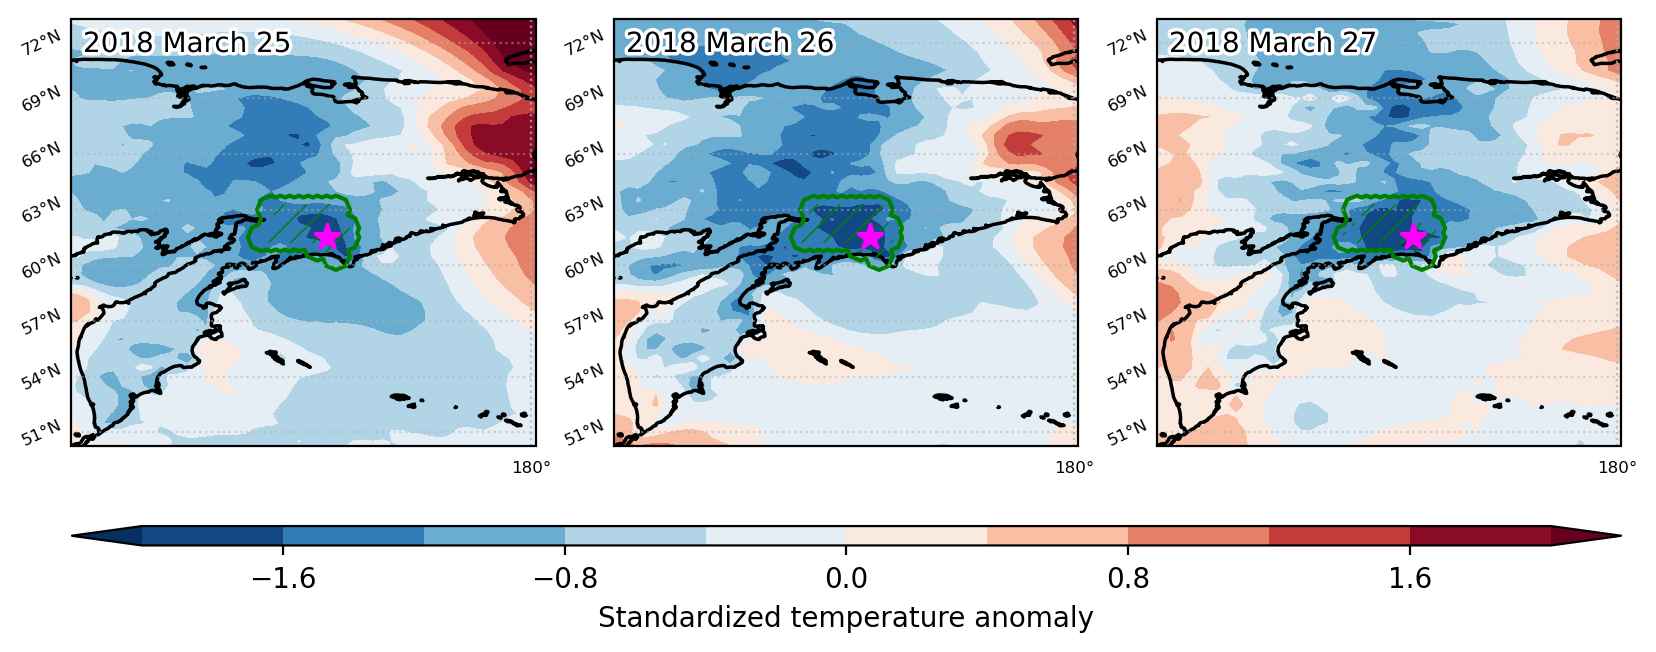
Fig. 1: Map of most extreme temperature anomalies (standardized) experienced during the event. The purple star indicates the center of the extreme event. Green hatching illustrates all areas under the effect of extremes at some time during the event.


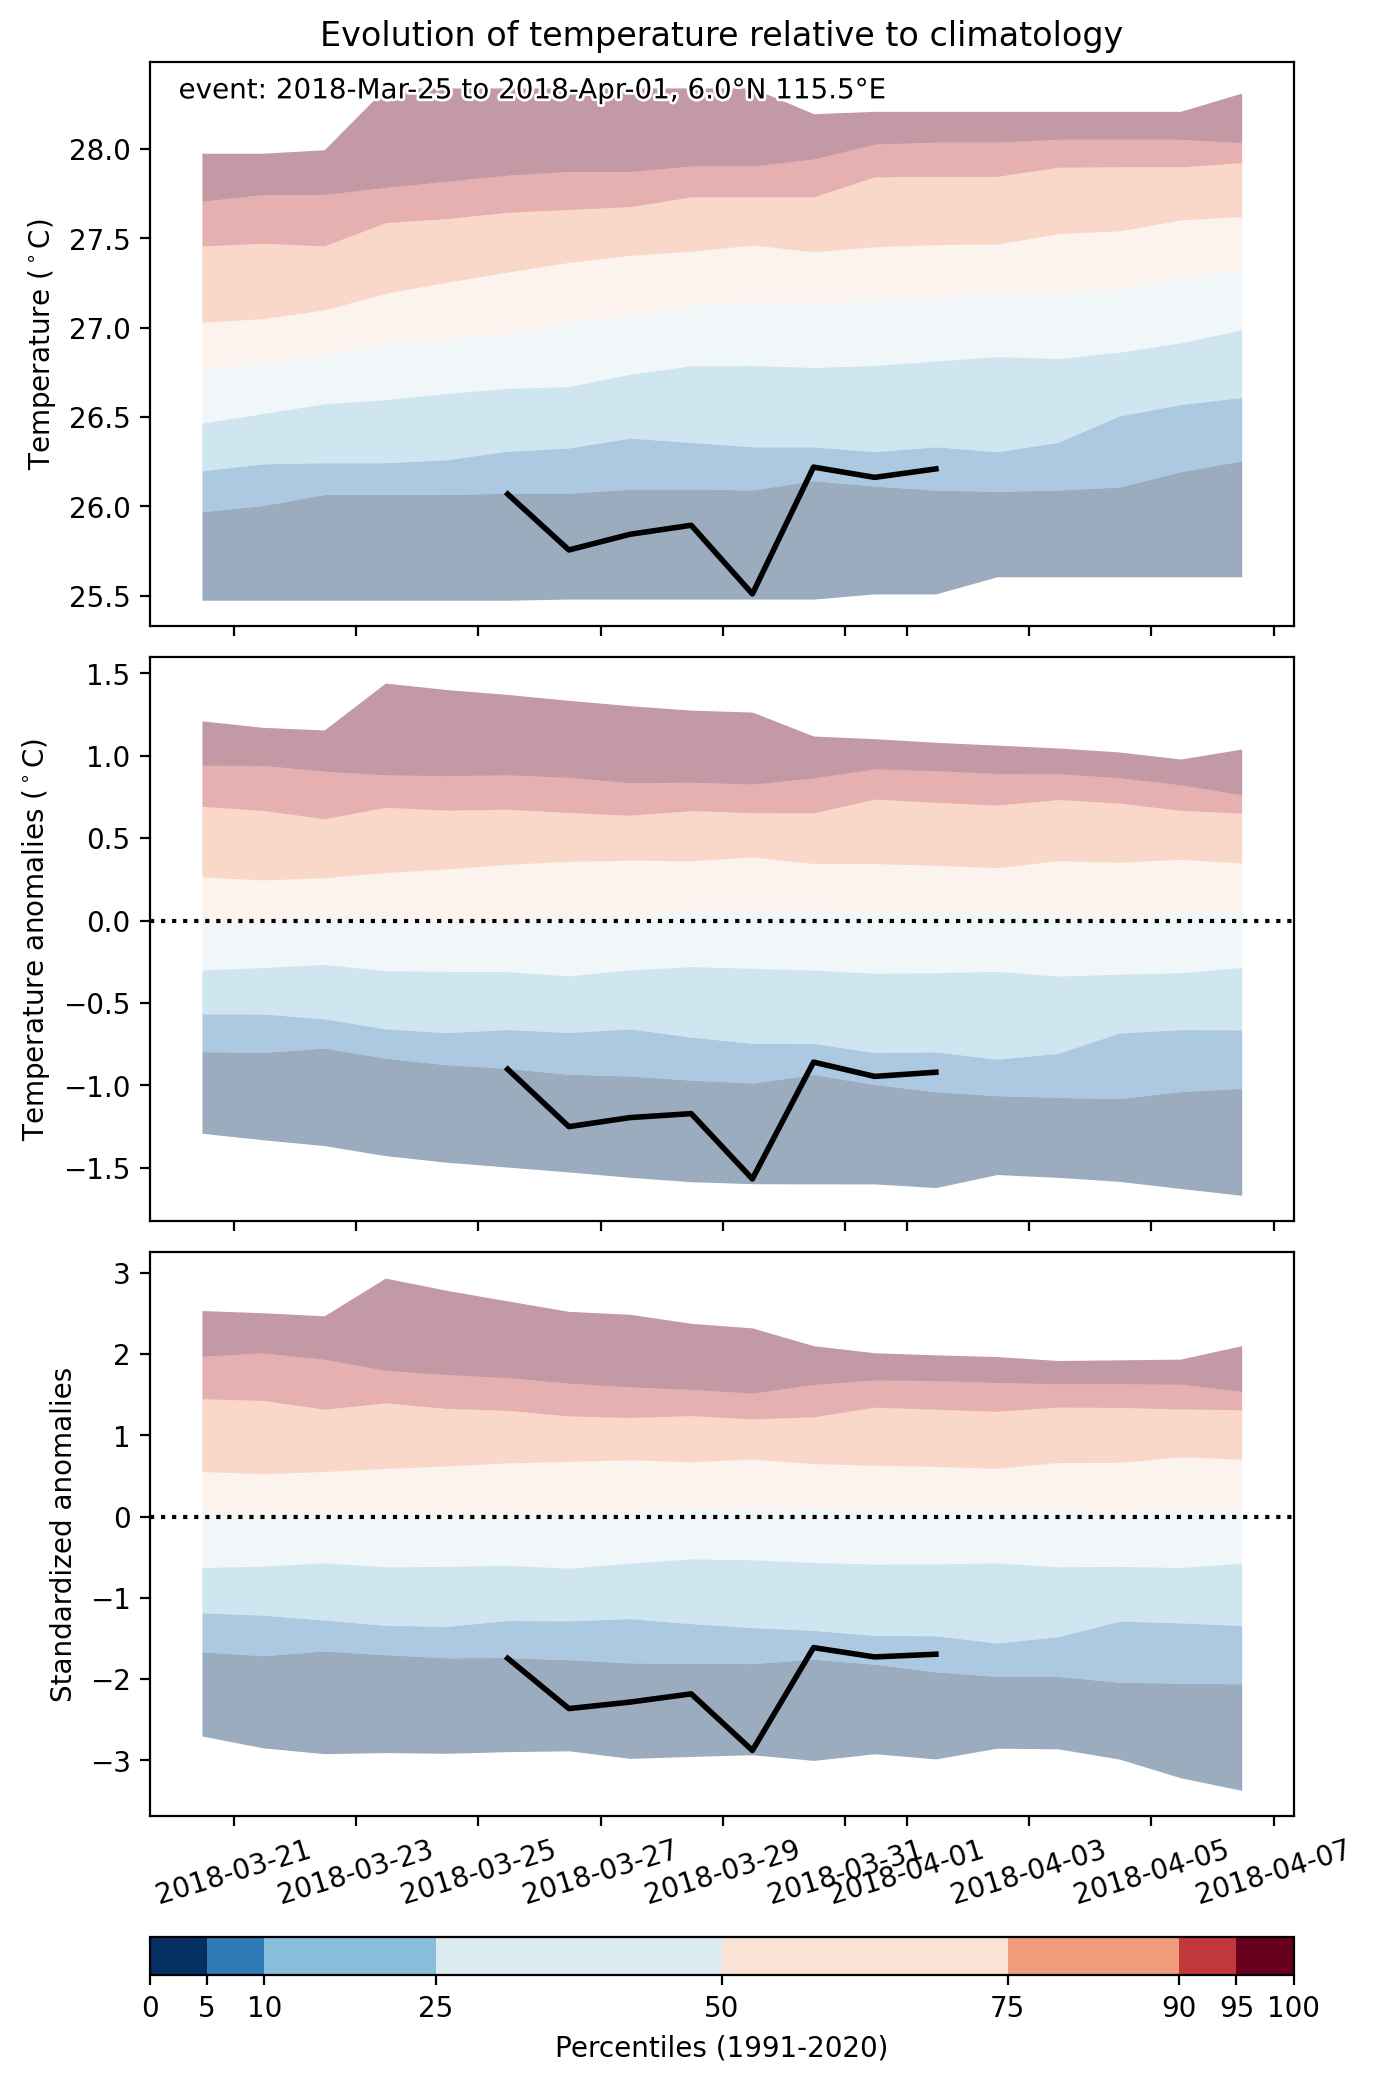
Fig. 2: Evolution of temperature at the center of the event. The climatological percentile distribution is illustrated with color shadings.


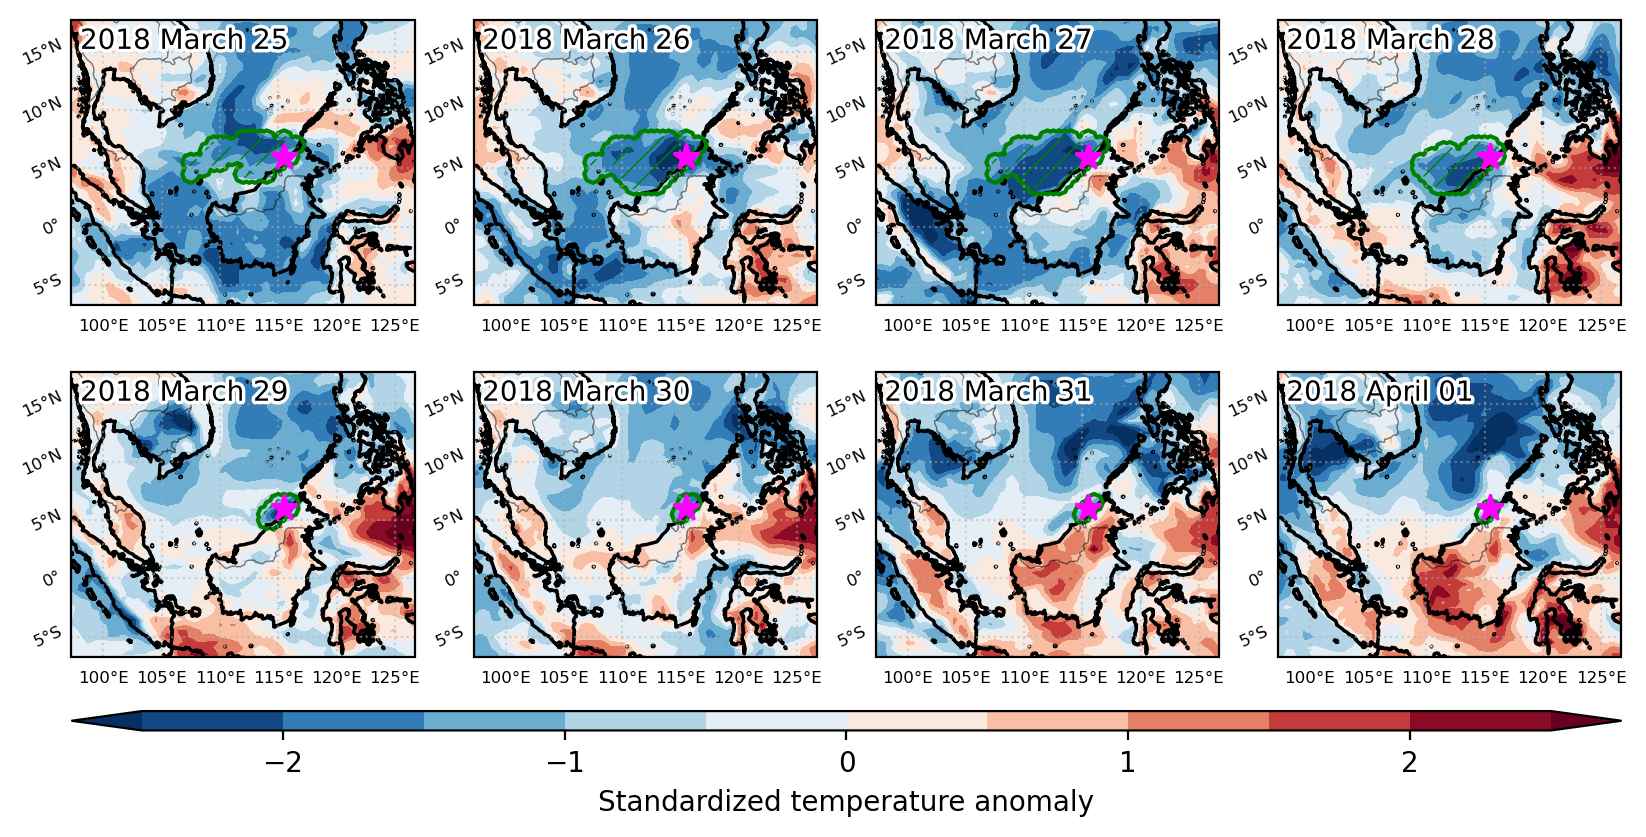
Fig. 3: Maps illustrating the evolution of standardized temperature anomalies during the event.

Event ID: Cold_spell_2018-Mar-25_to_2018-Apr-01_115.5_6.0

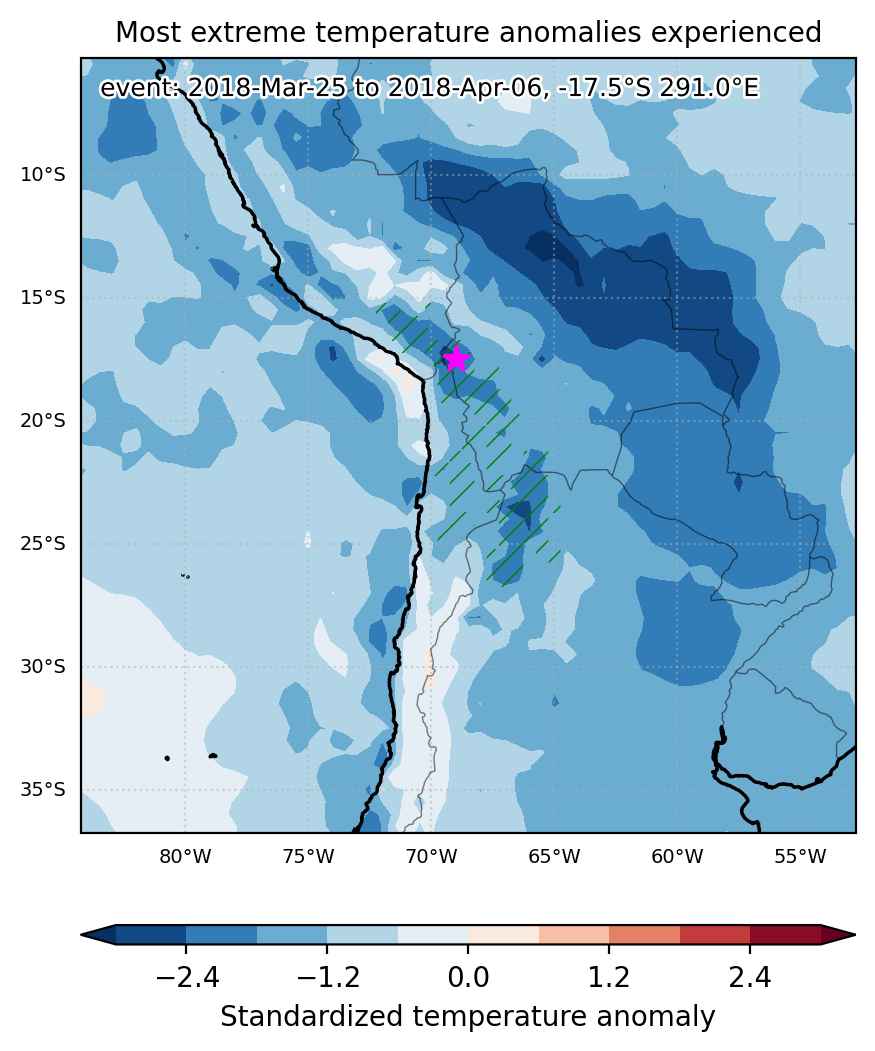
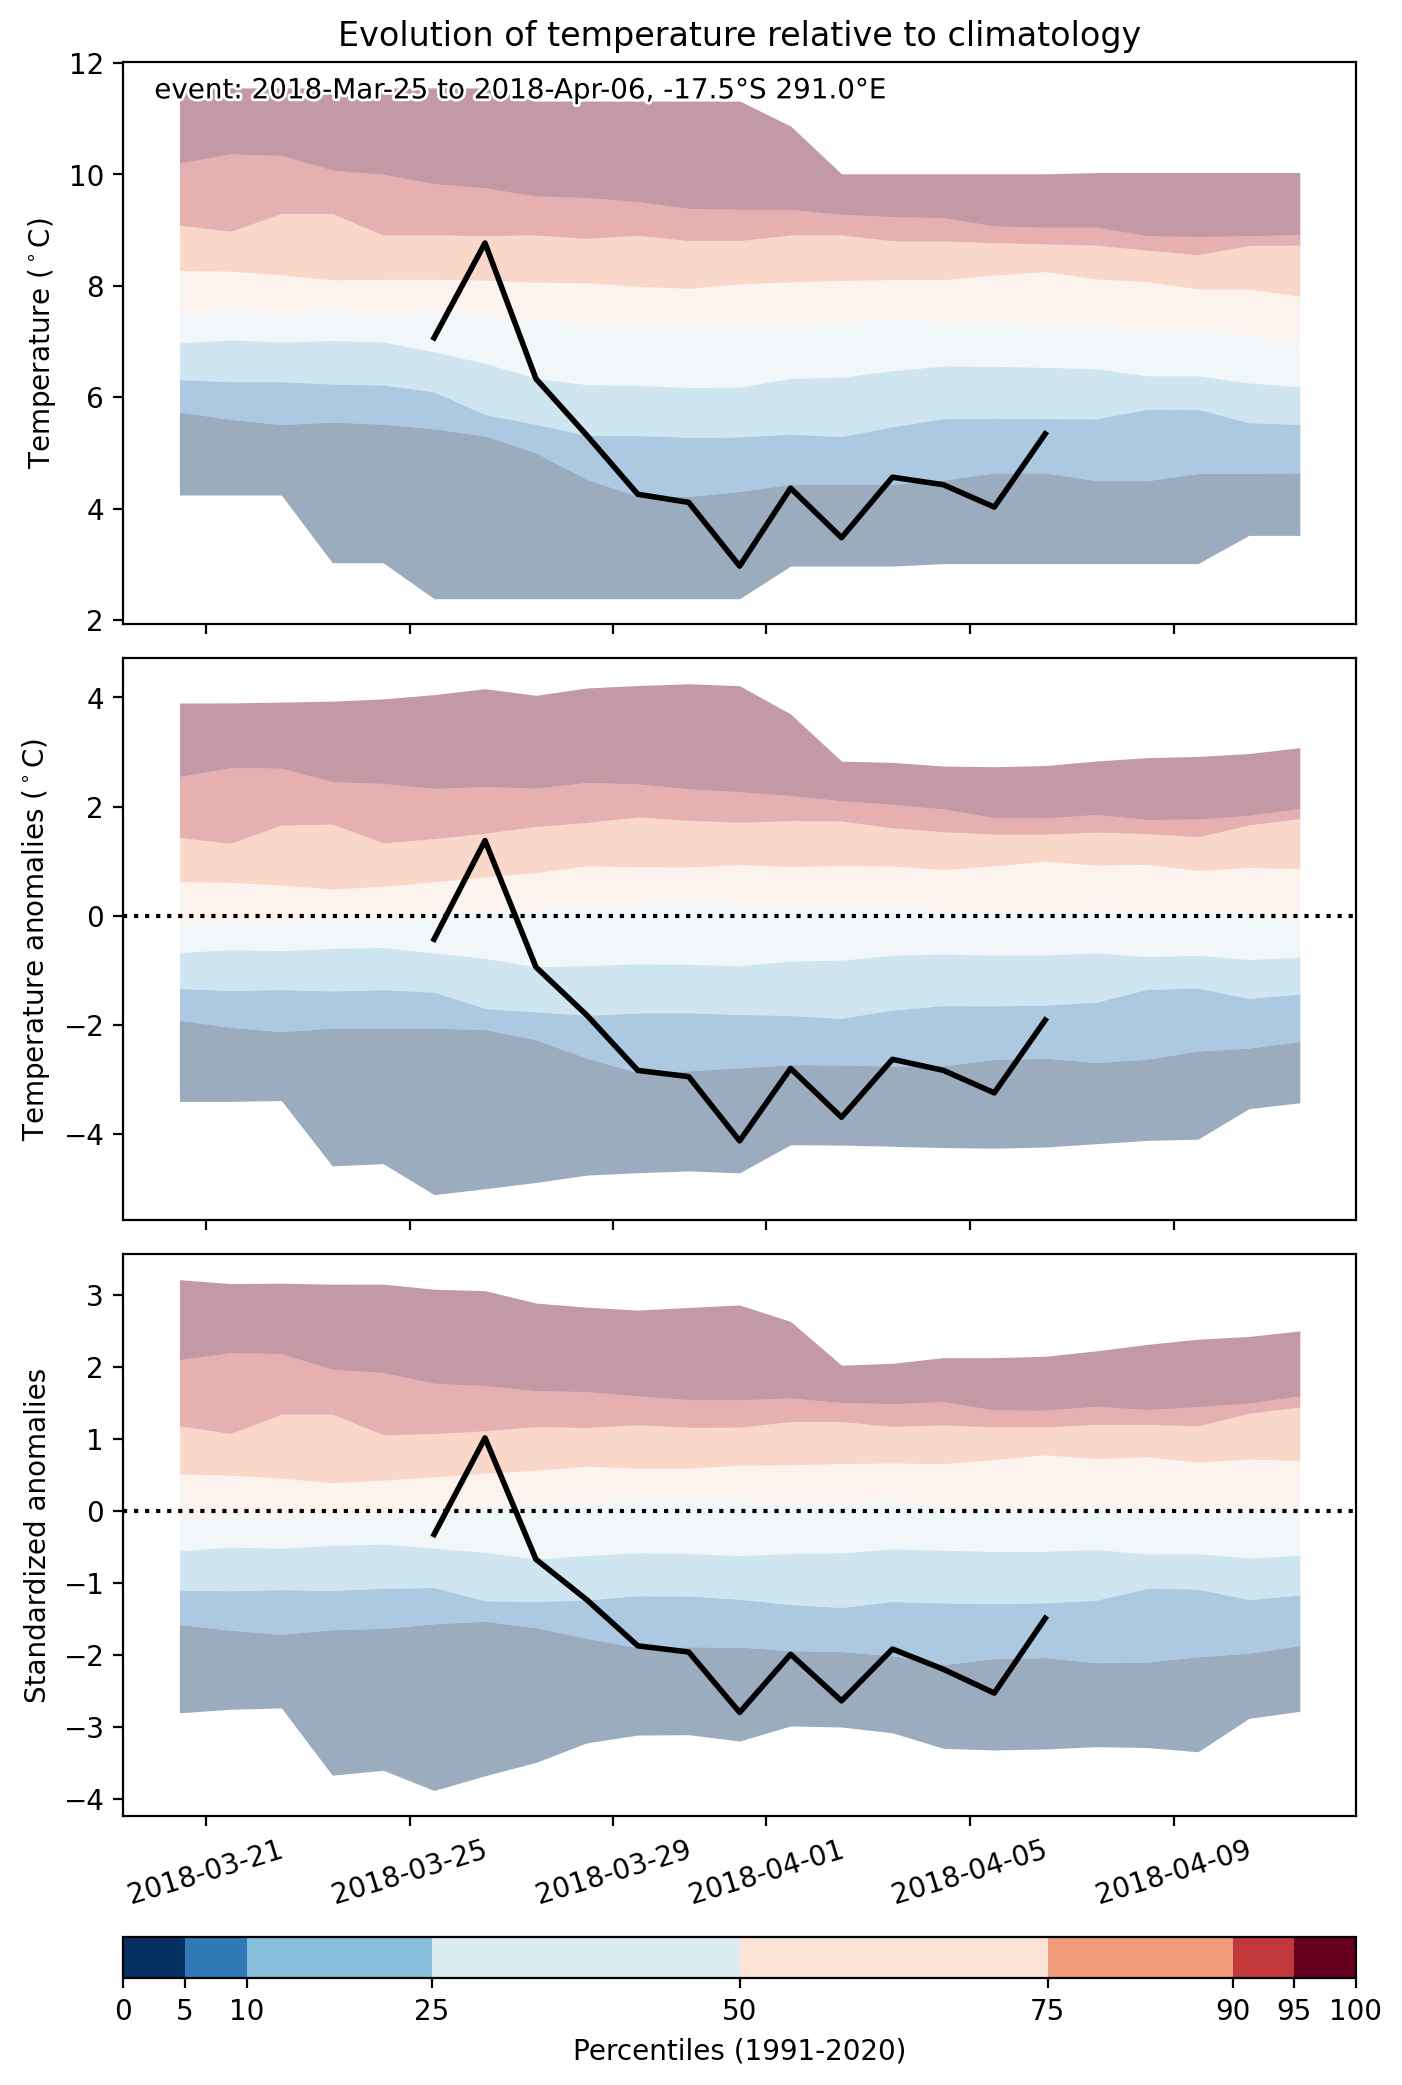
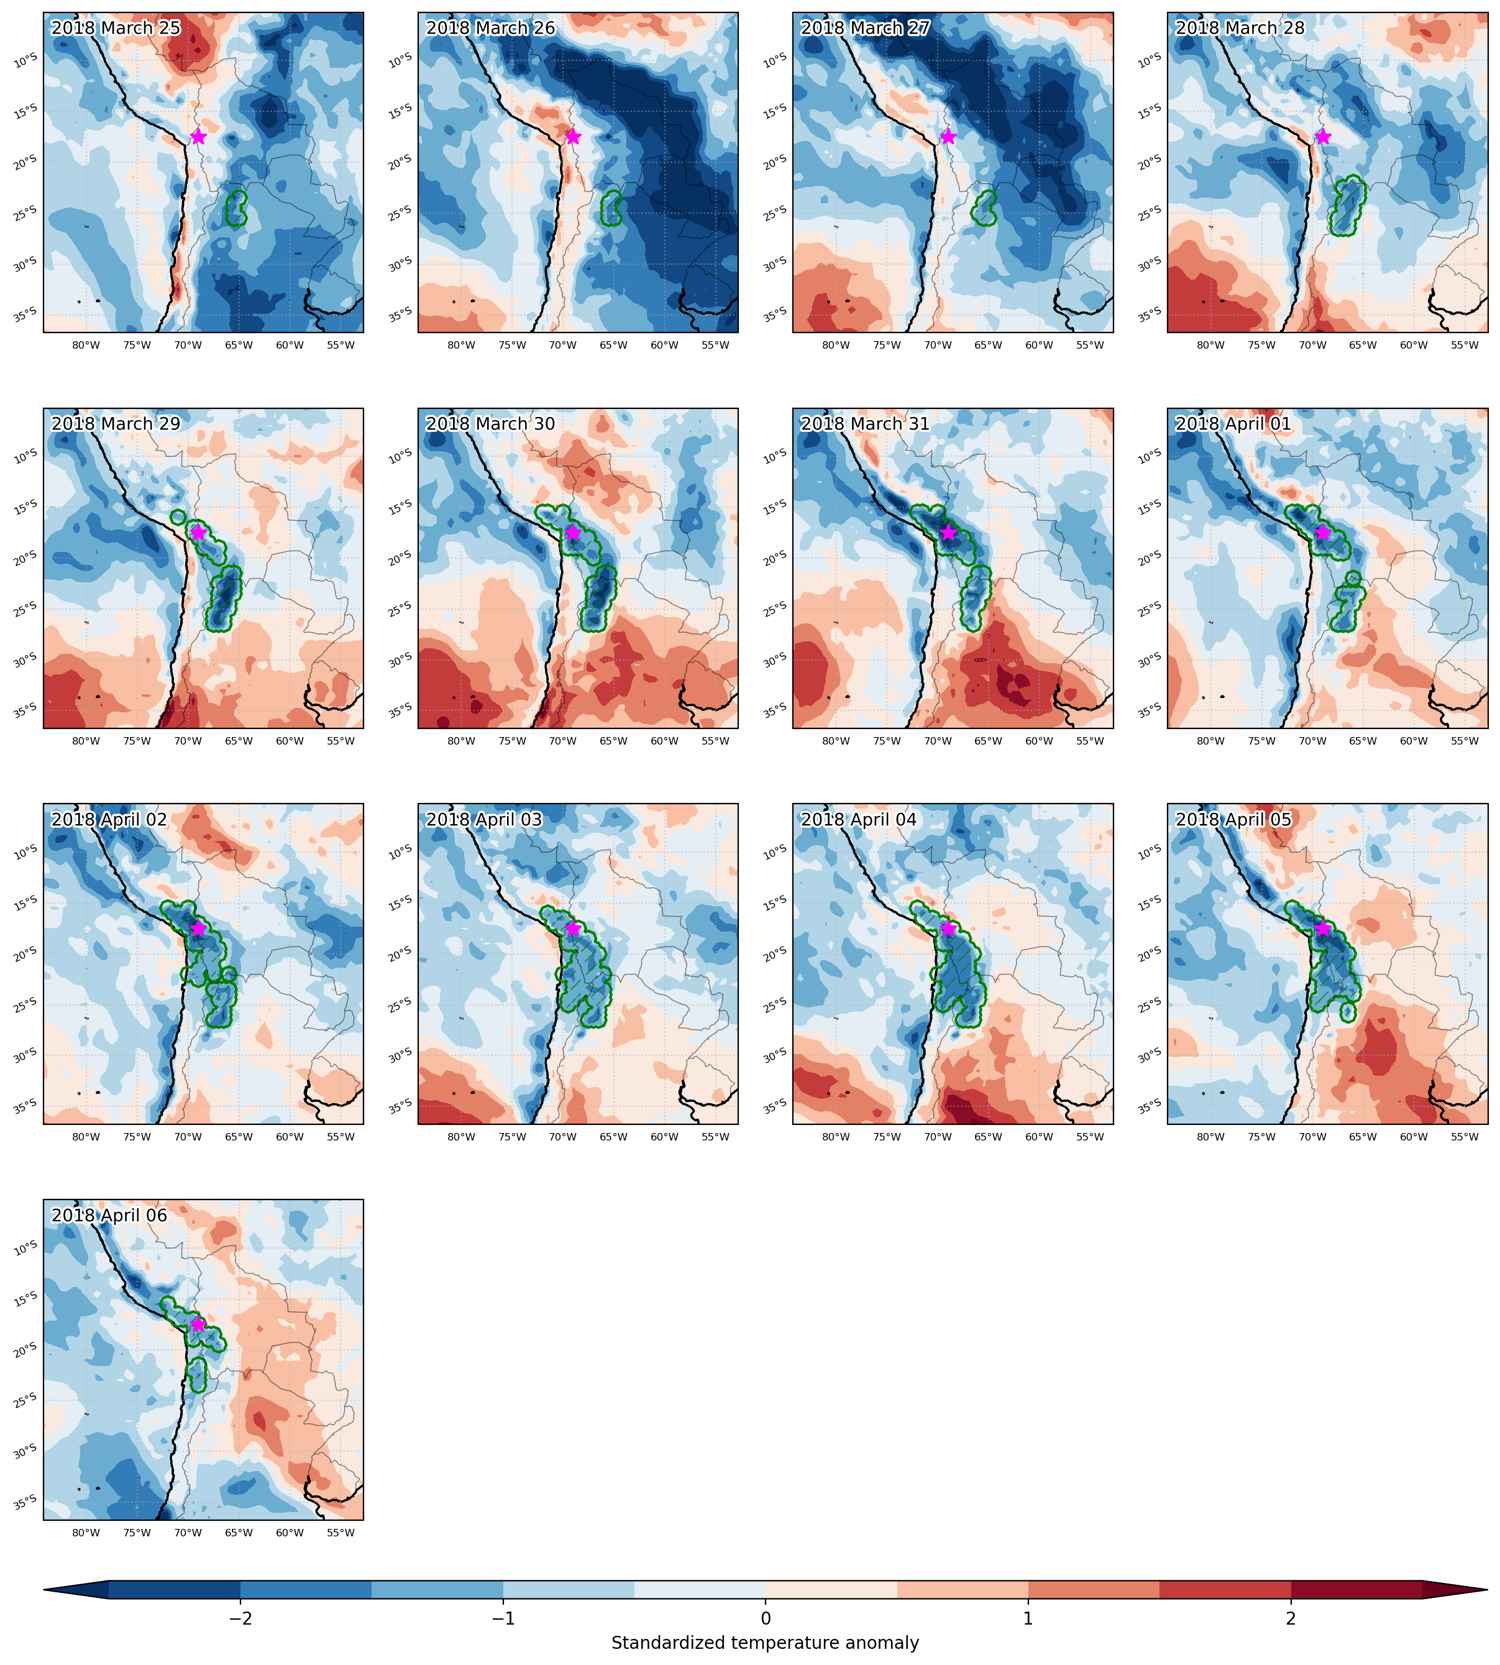
Cold spell occuring from March 25 2018 to April 06 2018 at -17.5°S 291.0°E

Download data: JSON

Event type: Cold spell

Countries affected (identified with ArcGIS Online; provided only for geographical reference):

  • Argentina
  • Bolivia
  • Chile
  • Peru

Duration: 13 days

Time span: March 25 2018 to April 06 2018

Statistics over entire affected area:

  • Mean temperature anomaly: -3.0 °C
  • Mean temperature: 5.7 °C
  • Minimum temperature anomaly: -6.4 °C
  • Minimum temperature: -2.2 °C

Event center: -17.5°S 291.0°E

Area affected: 304814 km$^2$


Fig. 1: Map of most extreme temperature anomalies (standardized) experienced during the event. The purple star indicates the center of the extreme event. Green hatching illustrates all areas under the effect of extremes at some time during the event.


Fig. 2: Evolution of temperature at the center of the event. The climatological percentile distribution is illustrated with color shadings.


Fig. 3: Maps illustrating the evolution of standardized temperature anomalies during the event.

Event ID: Cold_spell_2018-Mar-25_to_2018-Apr-06_291.0_-17.5

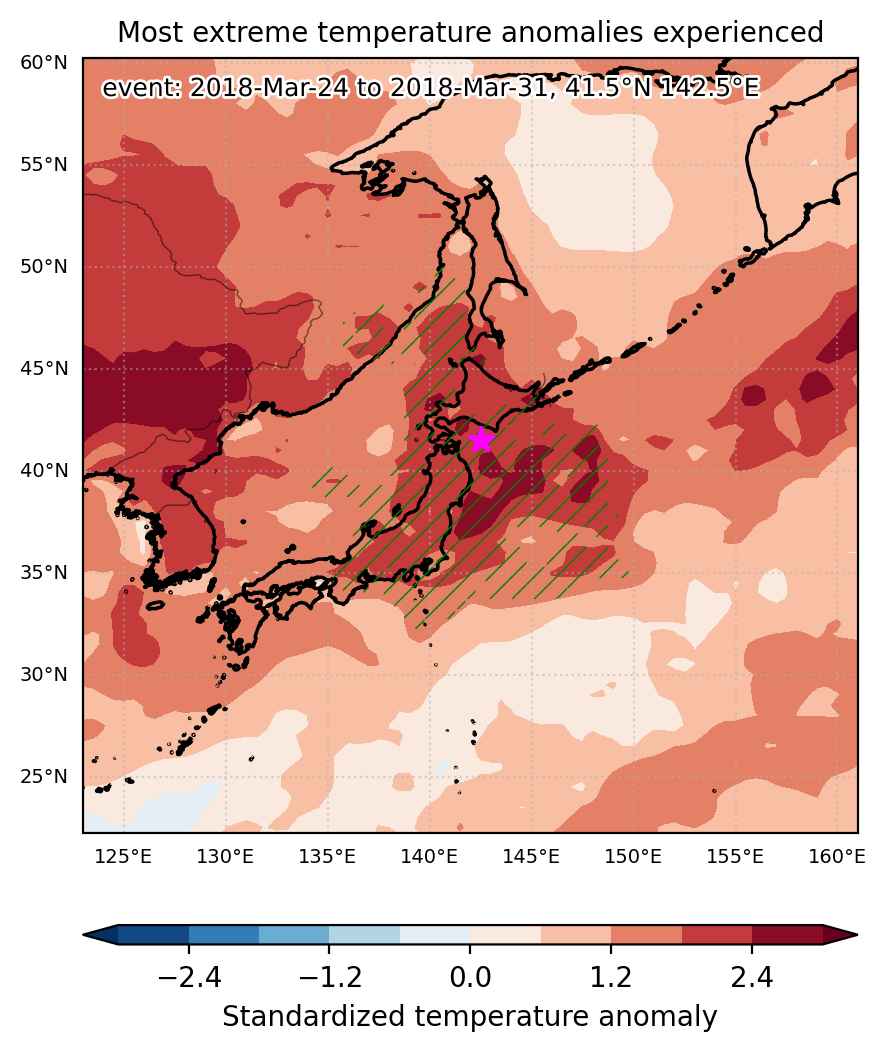
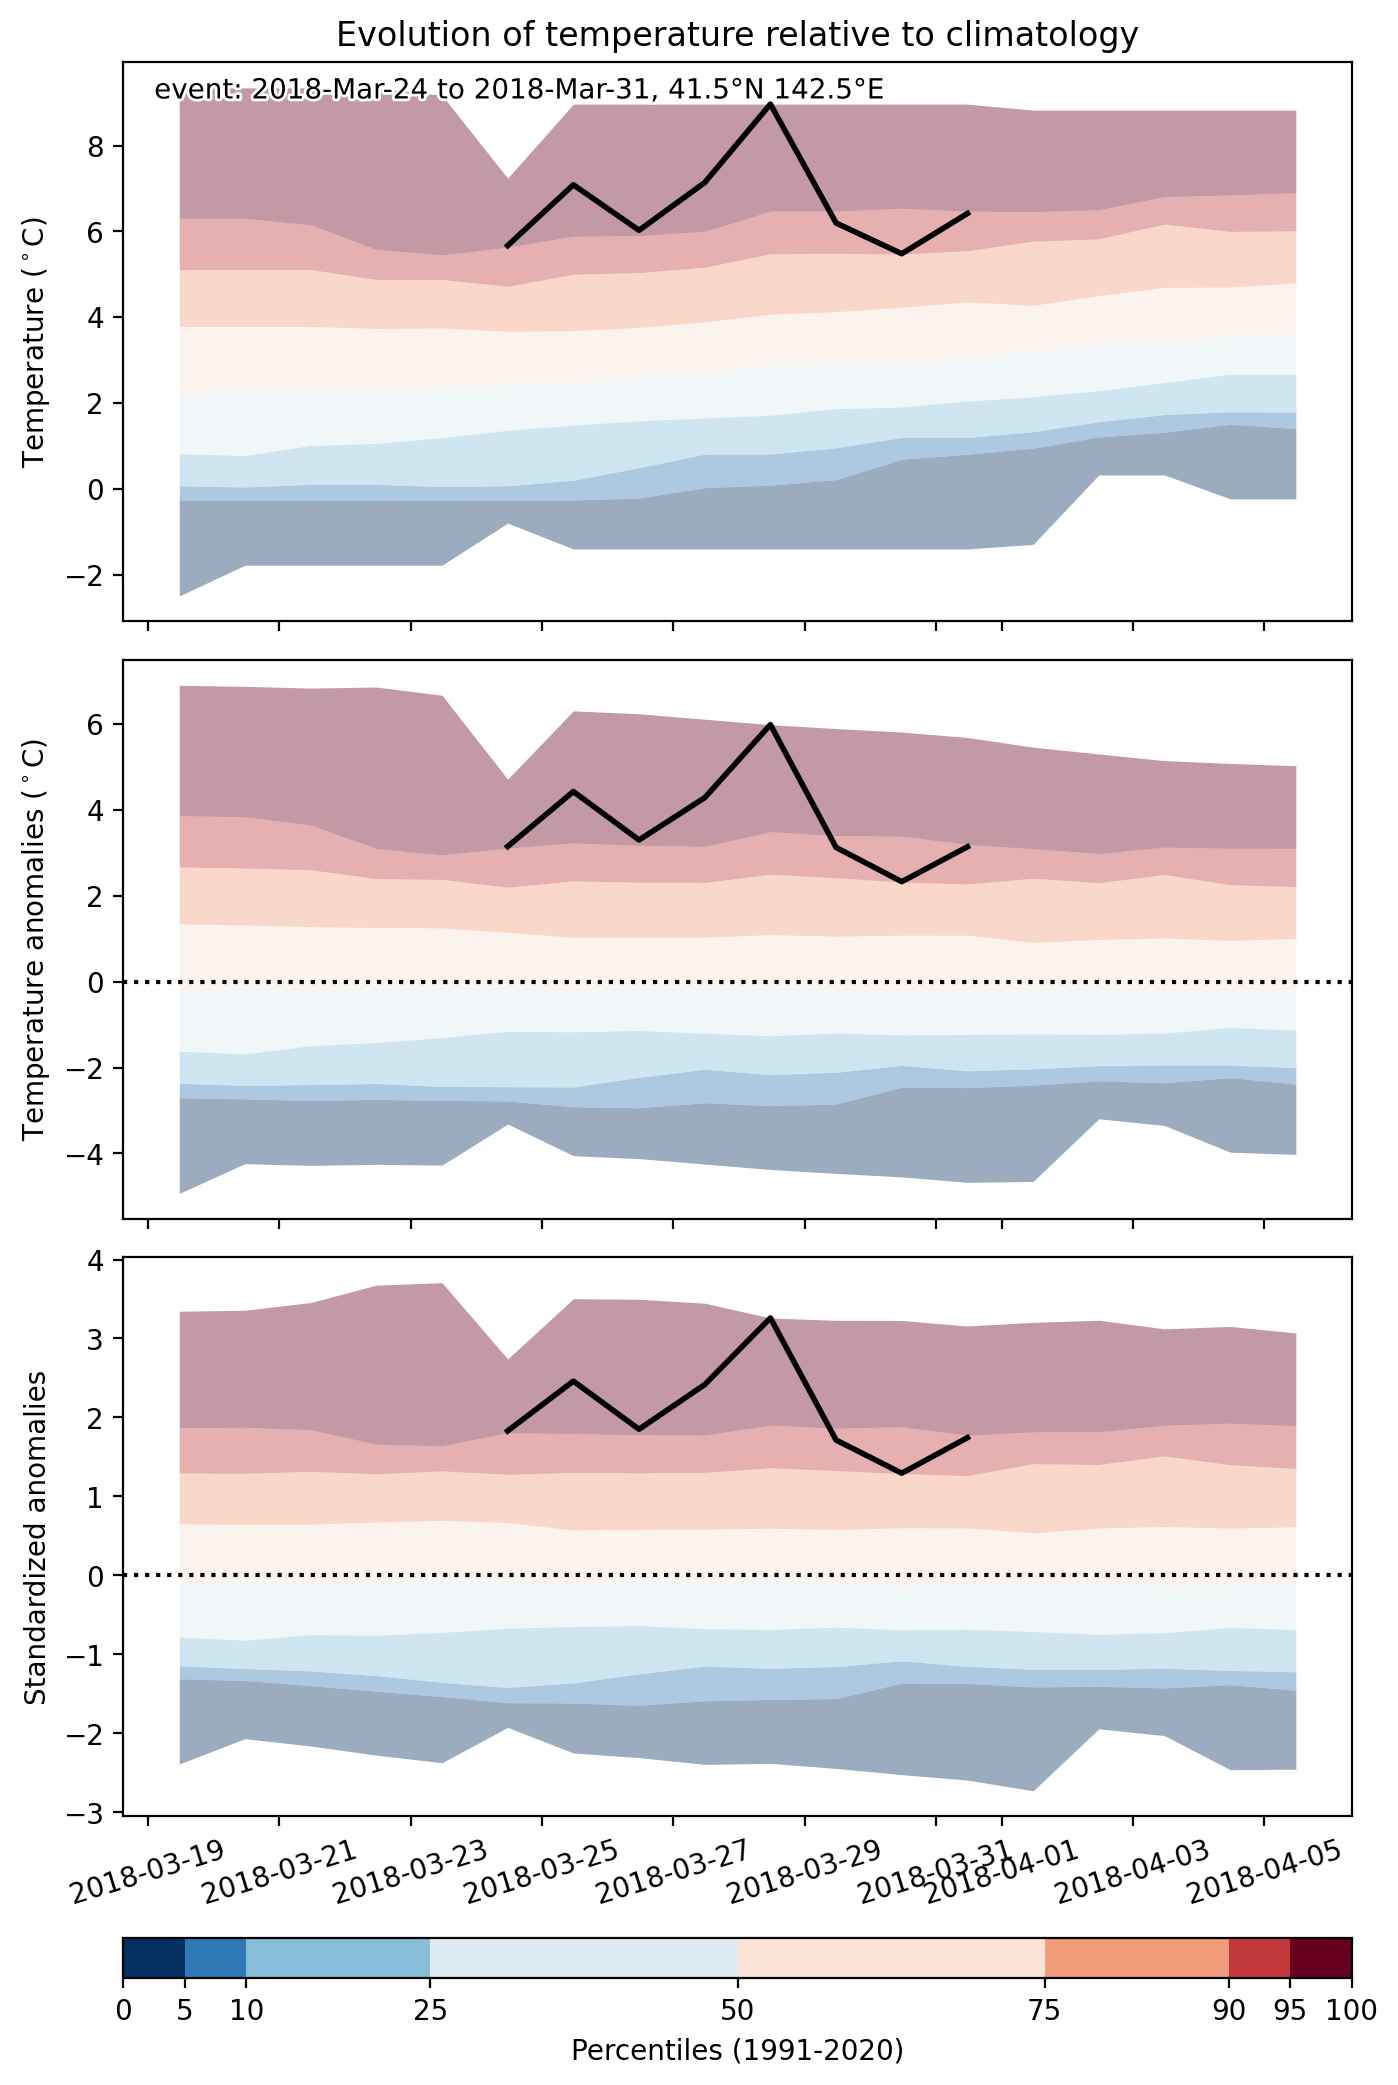
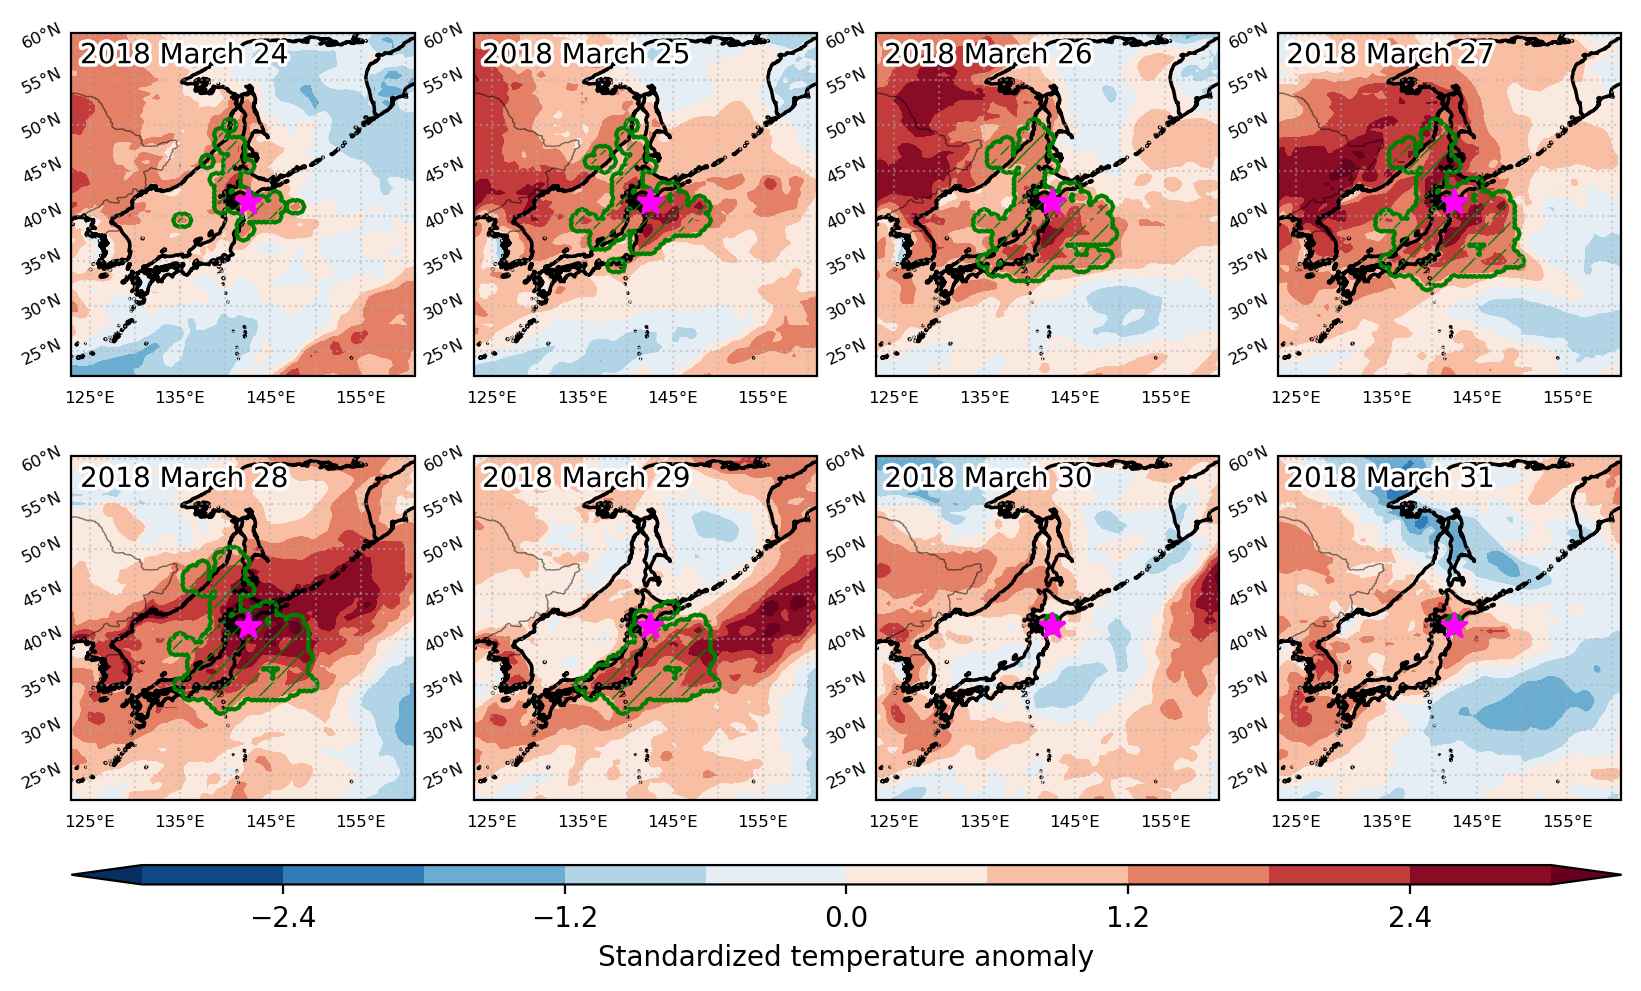
Heat wave occuring from March 24 2018 to March 31 2018 at 41.5°N 142.5°E

Download data: JSON

Event type: Heat wave

Countries affected (identified with ArcGIS Online; provided only for geographical reference):

  • Japan
  • Russian Federation

Duration: 8 days

Time span: March 24 2018 to March 31 2018

Statistics over entire affected area:

  • Mean temperature anomaly: 4.6 °C
  • Mean temperature: 10.8 °C
  • Maximum temperature anomaly: 12.8 °C
  • Maximum temperature: 19.3 °C

Event center: 41.5°N 142.5°E

Area affected: 1130627 km$^2$


Fig. 1: Map of most extreme temperature anomalies (standardized) experienced during the event. The purple star indicates the center of the extreme event. Green hatching illustrates all areas under the effect of extremes at some time during the event.


Fig. 2: Evolution of temperature at the center of the event. The climatological percentile distribution is illustrated with color shadings.


Fig. 3: Maps illustrating the evolution of standardized temperature anomalies during the event.

Event ID: Heat_wave_2018-Mar-24_to_2018-Mar-31_142.5_41.5