Download data: JSON
Event type: Heat wave
Countries affected (identified with ArcGIS Online; provided only for geographical reference):
- Afghanistan
- Albania
- Algeria
- Andorra
- Angola
- Armenia
- Australia
- Austria
- Azerbaijan
- Bahrain
- Bangladesh
- Belarus
- Belgium
- Benin
- Bhutan
- Bosnia and Herzegovina
- Botswana
- Brunei Darussalam
- Bulgaria
- Burkina Faso
- Burundi
- Cabo Verde
- Cambodia
- Cameroon
- Canada
- Canarias
- Central African Republic
- Chad
- China
- Congo
- Congo DRC
- Croatia
- Cyprus
- Czech Republic
- Côte d’Ivoire
- Djibouti
- Egypt
- Equatorial Guinea
- Eritrea
- Eswatini
- Ethiopia
- Faroe Islands
- France
- Gabon
- Georgia
- Germany
- Ghana
- Greece
- Hungary
- India
- Indonesia
- Iran
- Iraq
- Ireland
- Israel
- Italy
- Japan
- Jordan
- Kazakhstan
- Kenya
- Kuwait
- Kyrgyzstan
- Laos
- Lebanon
- Lesotho
- Libya
- Luxembourg
- Madagascar
- Malawi
- Malaysia
- Mali
- Mauritania
- Mauritius
- Mexico
- Moldova
- Mongolia
- Montenegro
- Morocco
- Mozambique
- Myanmar
- Namibia
- Nepal
- Netherlands
- New Caledonia
- New Zealand
- Niger
- Nigeria
- North Korea
- North Macedonia
- Norway
- Oman
- Pakistan
- Palau
- Palestinian Territory
- Papua New Guinea
- Philippines
- Poland
- Portugal
- Qatar
- Romania
- Russian Federation
- Rwanda
- Réunion
- Saudi Arabia
- Serbia
- Slovakia
- Slovenia
- Solomon Islands
- Somalia
- South Africa
- South Korea
- South Sudan
- Spain
- Sri Lanka
- Sudan
- Switzerland
- Syria
- Tajikistan
- Tanzania
- Thailand
- Timor-Leste
- Togo
- Tunisia
- Turkiye
- Turkmenistan
- Uganda
- Ukraine
- United Arab Emirates
- United Kingdom
- United States
- Uzbekistan
- Vietnam
- Yemen
- Zambia
- Zimbabwe
Duration: 234 days
Time span: May 05 2017 to December 24 2017
Statistics over entire affected area:
- Mean temperature anomaly: 2.6 °C
- Mean temperature: 25.3 °C
- Maximum temperature anomaly: 14.7 °C
- Maximum temperature: 44.8 °C
Event center: -3.0°S 32.5°E
Area affected: 159797368 km$^2$
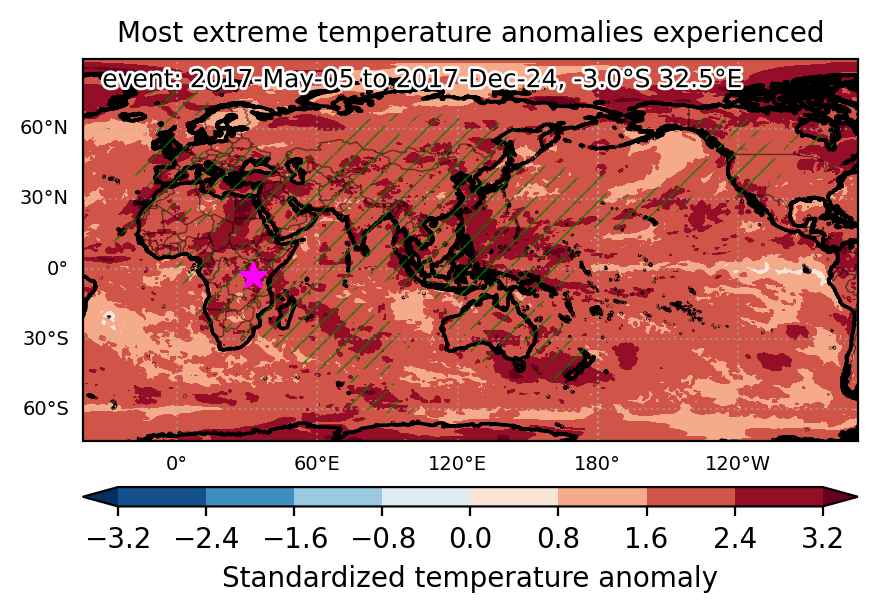
Fig. 1: Map of most extreme temperature anomalies (standardized) experienced during the event. The purple star indicates the center of the extreme event. Green hatching illustrates all areas under the effect of extremes at some time during the event.
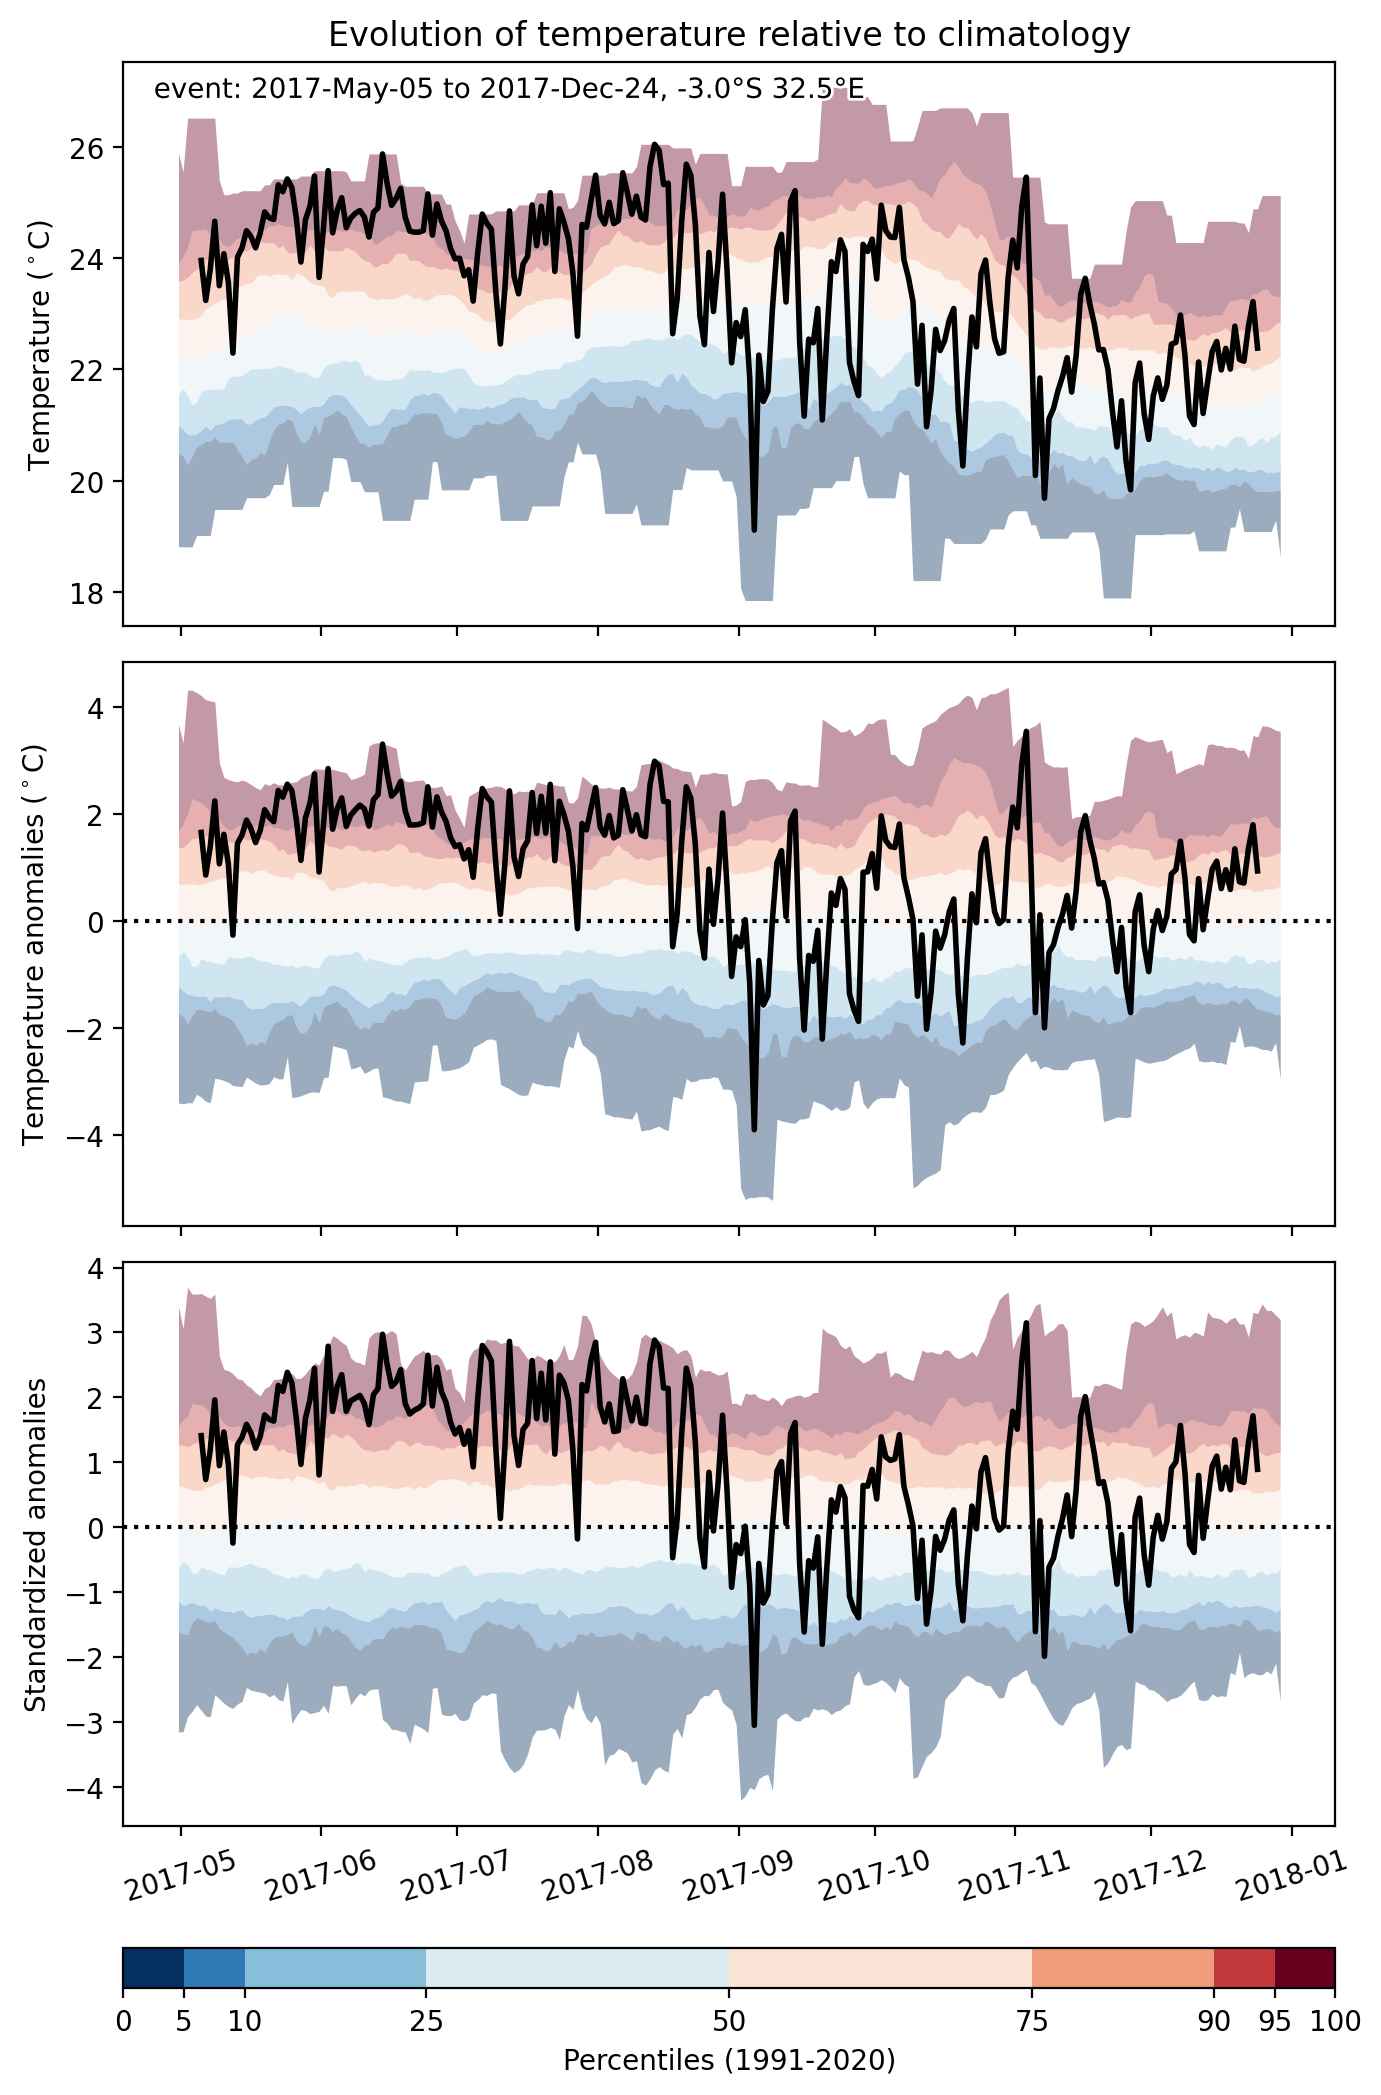
Fig. 2: Evolution of temperature at the center of the event. The climatological percentile distribution is illustrated with color shadings.
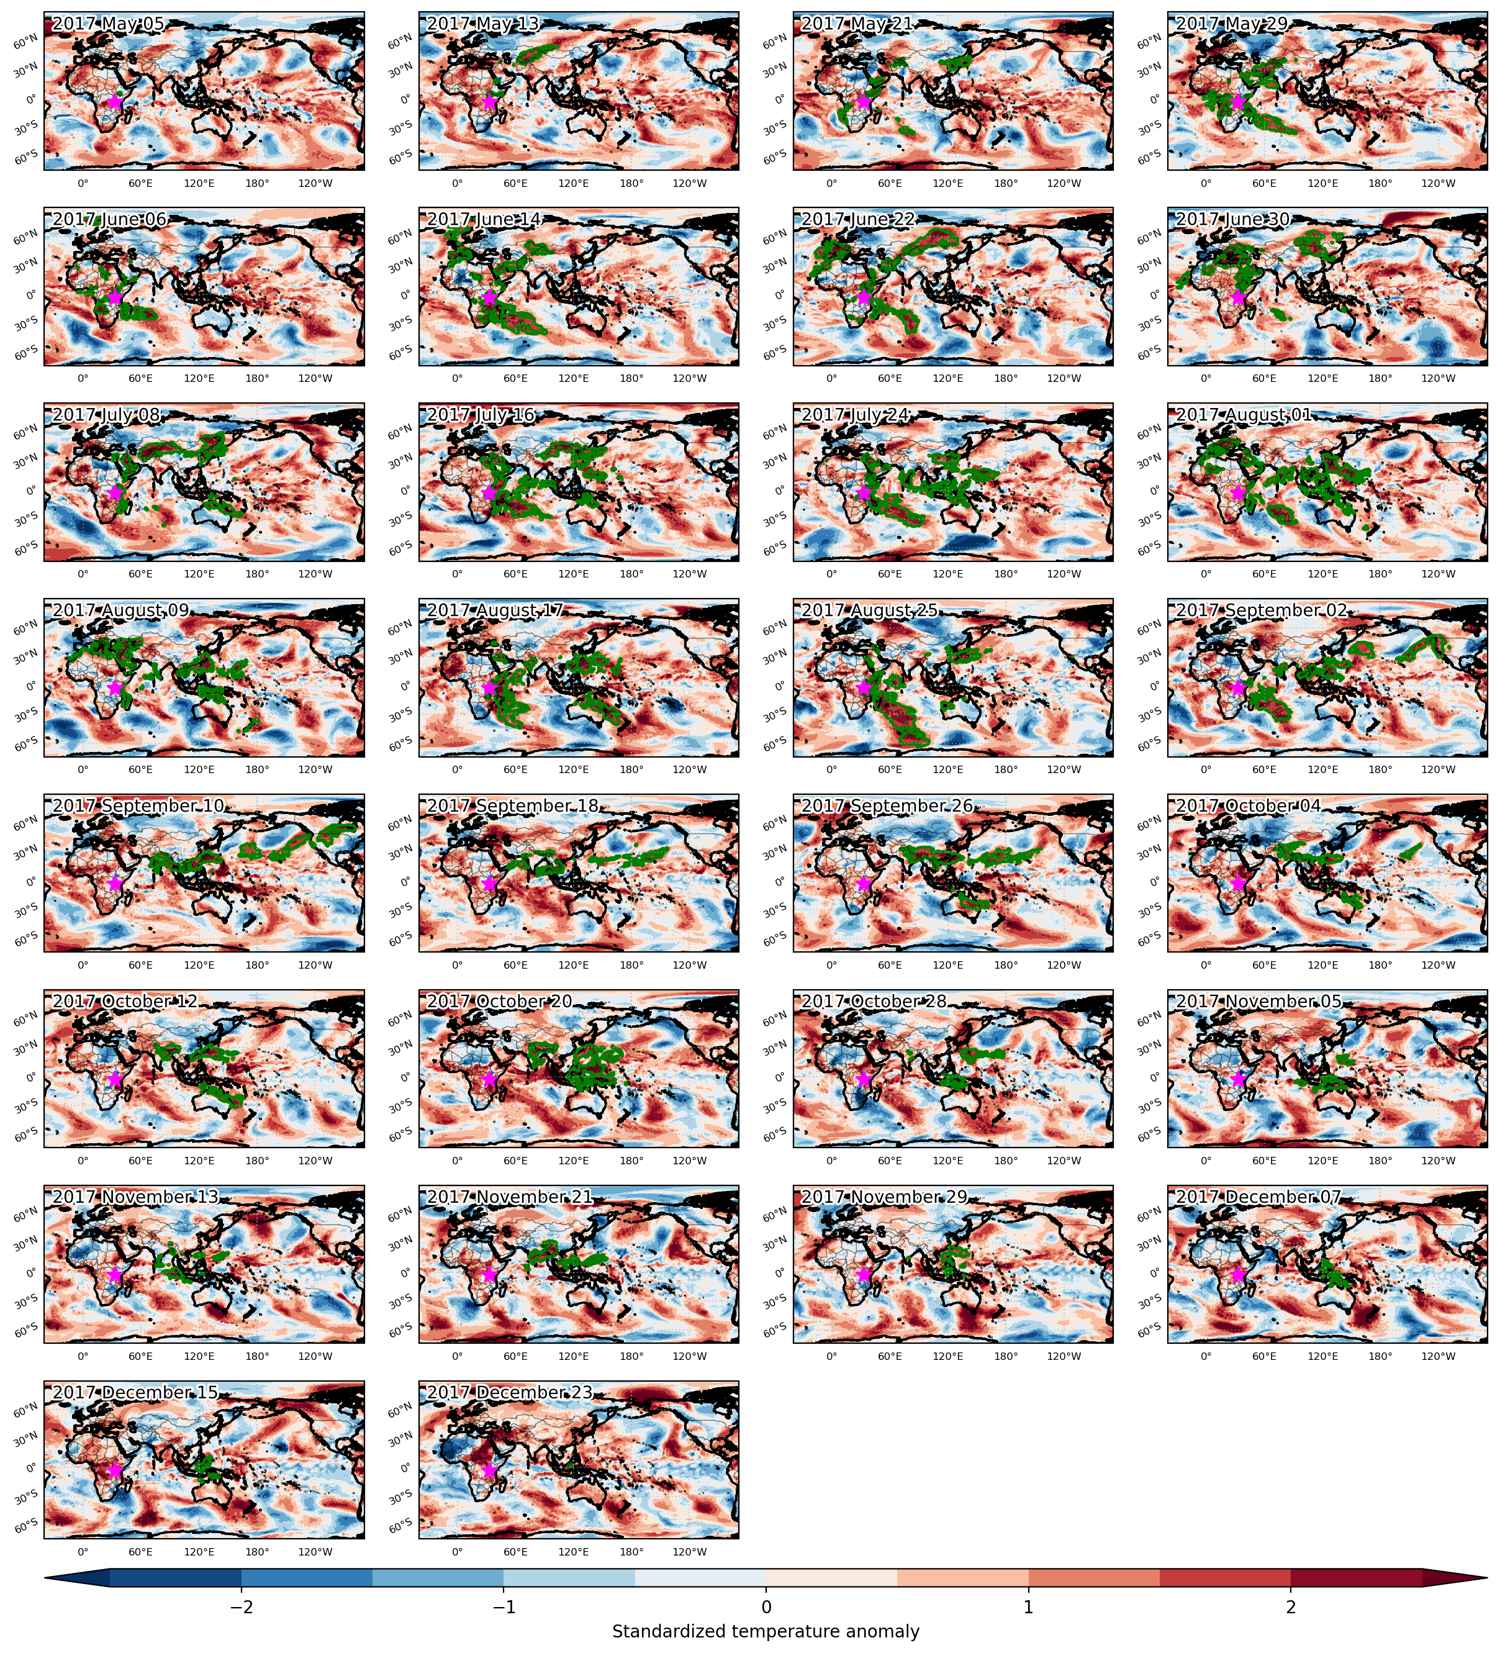
Fig. 3: Maps illustrating the evolution of standardized temperature anomalies during the event.
Event ID: Heat_wave_2017-May-05_to_2017-Dec-24_32.5_-3.0